the Creative Commons Attribution 4.0 License.
the Creative Commons Attribution 4.0 License.
 | 26 Aug 2022
Impacts of combined microphysical and land-surface uncertainties on convective clouds and precipitation in different weather regimes
Christian Barthlott
Amirmahdi Zarboo
Takumi Matsunobu
Christian Keil
To reduce the underdispersion of precipitation in convective-scale ensemble prediction systems, we investigate the relevance of microphysical and land-surface uncertainties for convective-scale predictability. We use three different initial soil moisture fields and study the response of convective precipitation to varying cloud condensation nuclei (CCN) concentrations and different shape parameters of the cloud droplet size distribution (CDSD) by applying a novel combined-perturbation strategy. Using the new ICOsahedral Non-hydrostatic (ICON) model, we construct a 60-member ensemble for cases with summertime convection under weak and strong synoptic-scale forcing over central Europe. We find a systematic positive soil moisture–precipitation feedback for all cases, regardless of the type of synoptic forcing, and a stronger response of precipitation to different CCN concentrations and shape parameters for weak forcing than for strong forcing. While the days with weak forcing show a systematic decrease in precipitation with increasing aerosol loading, days with strong forcing also show nonsystematic responses for some values of the shape parameters. The large magnitudes of precipitation deviations compared to a reference simulation ranging between −23 % and +18 % demonstrate that the uncertainties investigated here and, in particular, their collective effect are highly relevant for quantitative precipitation forecasting of summertime convection in central Europe. A rainwater budget analysis is used to identify the dominating source and sink terms and their response to the uncertainties applied in this study. Results also show a dominating cold-rain process for all cases and a strong but mostly nonsystematic impact on the release of latent heat, which is considered to be the prime mechanism for the upscale growth of small errors affecting the predictability of convective systems. The combined ensemble spread when accounting for all three uncertainties lies in the same range as the ones from an operational convective-scale ensemble prediction system with 20 members determined in previous studies. This indicates that the combination of different perturbations used in our study may be suitable for ensemble forecasting and that this method should be evaluated against other sources of uncertainty.
- Article
(8898 KB) - Full-text XML
- BibTeX
- EndNote


Forecasting convective precipitation remains one of the key challenges in numerical weather prediction (NWP). Many aspects influence the predictability of convective precipitation, e.g., uncertainties in the synoptic-scale flow, inaccuracies in the state of the atmosphere and the underlying land surface, and approximations in the representation of key physical processes in numerical models. Although the processes triggering convection are broadly known, the ability to predict, in particular, severe convective showers is still poor (Jorgensen and Weckwerth, 2003; Bennett et al., 2006; Barthlott and Hoose, 2015). Nowadays, most operational forecasting centers make use of convection-resolving ensemble modeling systems in which uncertainties in the initial and lateral boundary conditions as well as uncertainties in the representation of physical processes are accounted for (e.g., Clark et al., 2016; Barthlott and Barrett, 2020, and references therein). However, these ensemble modeling systems are often underdispersive (e.g., Bouttier et al., 2012; Raynaud and Bouttier, 2017), and the methodology for constructing such ensembles that effectively represent the numerous sources of uncertainty acting in nature remains an active field of research (Keil et al., 2019). To reduce the underdispersion of convective precipitation in convective-scale weather models, other sources of uncertainty need to be assessed. One candidate is the soil moisture content as it controls the partitioning of the available energy at the ground into sensible and latent heat. Land–atmosphere interactions are assumed to be decisive for cloud formation, and subsequent convective precipitation and land-surface properties (e.g., land cover, terrain, and soil texture) are highly heterogeneous across a wide range of spatiotemporal scales. Therefore, it is difficult to establish potential relationships between land-surface variables and atmospheric variables such as temperature and precipitation (e.g., Seneviratne et al., 2010; Schneider et al., 2018; Liu et al., 2022). Many studies have documented the importance of soil moisture for convective precipitation and the complexity of the soil moisture–precipitation feedback, which may vary spatially and temporally (e.g., Pan et al., 1996; Findell and Eltahir, 2003; Hohenegger et al., 2009; Richard et al., 2011; Baur et al., 2018). As was documented by Hauck et al. (2011), soil moisture in models often shows a bias with respect to observations. The initial soil moisture content, however, is of great importance for precipitation forecasting: for drier soils, a systematic positive soil moisture–precipitation feedback was found by Barthlott and Kalthoff (2011), whereas for already relatively wet soils, the influence of increasing soil moisture is much weaker and not systematic anymore. In addition, horizontal land-surface wetness gradients can induce mesoscale circulations leading to convection initiation over dry soils (Taylor et al., 2012; Baur et al., 2018).
Besides the unclear role of the soil moisture–precipitation feedback, there are also large uncertainties arising from the microphysics of mixed-phase clouds. In current NWP models, aerosol–cloud interactions are considered one of the most uncertain processes (e.g., Tao et al., 2012; Altaratz et al., 2014; Fan et al., 2016; Barthlott and Hoose, 2018). In polluted environments, the activation of aerosol particles (serving as cloud condensation nuclei – CCN) into cloud droplets results in more numerous and smaller cloud droplets. Known as the “lifetime effect”, the onset of precipitation can be suppressed due to a weaker collision–coalescence process, which can result in a longer cloud lifetime (Albrecht, 1989). However, the effects of aerosols on convective precipitation have been shown to vary depending on cloud type, aerosol regime, and environmental conditions (e.g., Seifert and Beheng, 2006b; Khain et al., 2008; van den Heever et al., 2011; Tao et al., 2012; Barthlott et al., 2017). Moreover, there are large uncertainties in the aerosol number concentration because there exist only a few in situ observations or routine measurements of aerosols in three-dimensional space (Thompson et al., 2021).
The cloud droplet size distribution (CDSD) is another source of uncertainty in convective precipitation simulations. The form of the underlying generalized Gamma distribution is controlled by the shape parameter ν, which determines the width of the size distribution and also the location of its maximum. Example size distributions illustrating the effect of different shape parameters will be given later in Sect. 2.1. A higher shape parameter suppresses the autoconversion process of cloud droplets into raindrops, resulting in higher droplet number concentrations (e.g., Seifert and Beheng, 2001). The CDSD is also important for the effective radius of cloud droplets, which is the relevant parameter for the radiative properties of clouds. However, the width of the cloud droplet size distribution is not well-constrained by measurements, and a wide range of values (between 0 and 14) based on cloud type and environmental conditions were reported (e.g., Levin, 1958; Gossard, 1994; Miles et al., 2000; Martins and Silva Dias, 2009). There are only a few modeling studies on the effects of the shape parameter available, most based on idealized simulations. For example, Igel and van den Heever (2017) showed with large-eddy simulations of non-precipitating shallow cumulus clouds that changes were on the same order of magnitude as those due to a factor of 16 increase or decrease in aerosol concentration. In a recent work by Barthlott et al. (2022), the relative impact of varying CCN concentrations and different shape parameters of the CDSD were assessed for several convective cases over central Europe. They found a large systematic increase in total cloud water content with increasing CCN concentrations and narrower CDSDs together with a reduction in the total rainwater content as a result of a less efficient collision–coalescence process. The precipitation response was generally larger for weakly forced cases and averages of Germany, and the timing of convection was not sensitive to different CCN concentrations or shape parameters. Moreover, an increase in the shape parameter can produce almost as large a variation in precipitation as a CCN increase from maritime to polluted conditions. They also found that increasing CCN concentrations reduced the effective radius of cloud droplets more than larger shape parameters, but cloud optical depth had a similar increase with larger shape parameters to the change in aerosol loading from maritime to polluted. However, the impact of the shape parameter was assessed for one reference CCN concentration only, and the need to determine the impacts of the shape parameter by combined sensitivity analyses was considered to be necessary. Furthermore, the shape parameter is one of the stochastically perturbed parameters in the widely used Thompson–Eidhammer cloud microphysics scheme, and recent model results indicate the suitability of this parameter for generating ensembles at the convective scale (Griffin et al., 2020; Thompson et al., 2021).
While the individual perturbations of parameters or processes have been conducted extensively in recent years, only a few have investigated their combined effects. Imamovic et al. (2017) conducted convection-resolving simulations with a simplified land surface to dissect the isolated and combined impacts of soil moisture and orography on deep-convective precipitation for an initial profile corresponding to typical European summer climate conditions. They found a consistently positive soil moisture–precipitation feedback for horizontally uniform perturbations, irrespective of the presence of low orography. However, a negative feedback emerged with localized perturbations. Other studies with multiple-factor analyses exist mostly for idealized setups, e.g., for investigating the impact of environmental conditions and microphysics on the forecast uncertainty of deep-convective clouds and hail using an emulator approach by Wellmann et al. (2020), for investigating aerosol–cloud–land-surface interaction within tropical sea breeze convection (Grant and van den Heever, 2014) or investigating the relative sensitivity of a tropical deep-convective storm to changes in environmental and cloud microphysical parameters (Posselt et al., 2019). Using the Morris one-at-a-time (MOAT) method for simultaneous perturbations of numerous parameters, Morales et al. (2019) explored the sensitivity of orographic precipitation within the environment of an atmospheric river. Schneider et al. (2019) investigated the relative impact of soil moisture and aerosols combined with orographic effects. They performed simulations with the COSMO (COnsortium for Small-scale MOdeling) model with 500 m grid length for six real-case events over Germany with systematic changes in the initial soil moisture fields and different assumptions about the ambient aerosol concentration. The model produced a positive soil moisture–precipitation feedback for most of the cases, with the soil moisture amount having a stronger effect on precipitation than on its spatial distribution. The precipitation response to changes in the CCN concentration was found to be more complex and case-dependent. However, both aerosols and soil moisture uncertainties were of similar importance for quantitative precipitation forecasting. Baur et al. (2022) studied the combined impact of soil moisture and microphysical perturbations with the COSMO model for a single case study of locally forced convection in central Europe. They found a large sensitivity of 12 h precipitation deviations ranging between −23 % and +10 % compared to a reference run.
In this study, we expand this line of investigation by perturbing the soil moisture, the CCN concentration, and the shape parameter simultaneously using a state-of-the-art operational numerical model. We choose these uncertainties because (i) their individual impact was documented in many recent studies and (ii) all have an impact on the life cycle of convection at different stages from its initiation to the decay. We will investigate the role of different aerosol amounts ranging from low CCN concentrations (representing maritime conditions) to very high CCN concentrations (representing continental polluted conditions), with different values of the shape parameter combined with a wet and dry soil moisture bias. By comparing the effect of ambient aerosol amount to changes in the shape parameter, we can quantify their relative impact on predicting convective precipitation under different soil moisture regimes. We further want to quantify the individual and collective effects of land-surface and microphysical uncertainties on convective-scale predictability for different weather regimes. The combination of different sensitivities will help answer the question of whether and how different processes compensate for or enhance each other and how large the spread of different process pathways is. We can further answer the question of whether and how aerosol effects on clouds are modulated by soil moisture uncertainties (e.g., drier or wetter soils). The unique aspect of this work is that it is the first to systematically evaluate the collective effects of CCN concentrations and uncertainties in the CDSD for multiple cases with different synoptic controls and different initial soil moisture contents using a state-of-the-art operational numerical model.
2.1 Model description and simulation overview
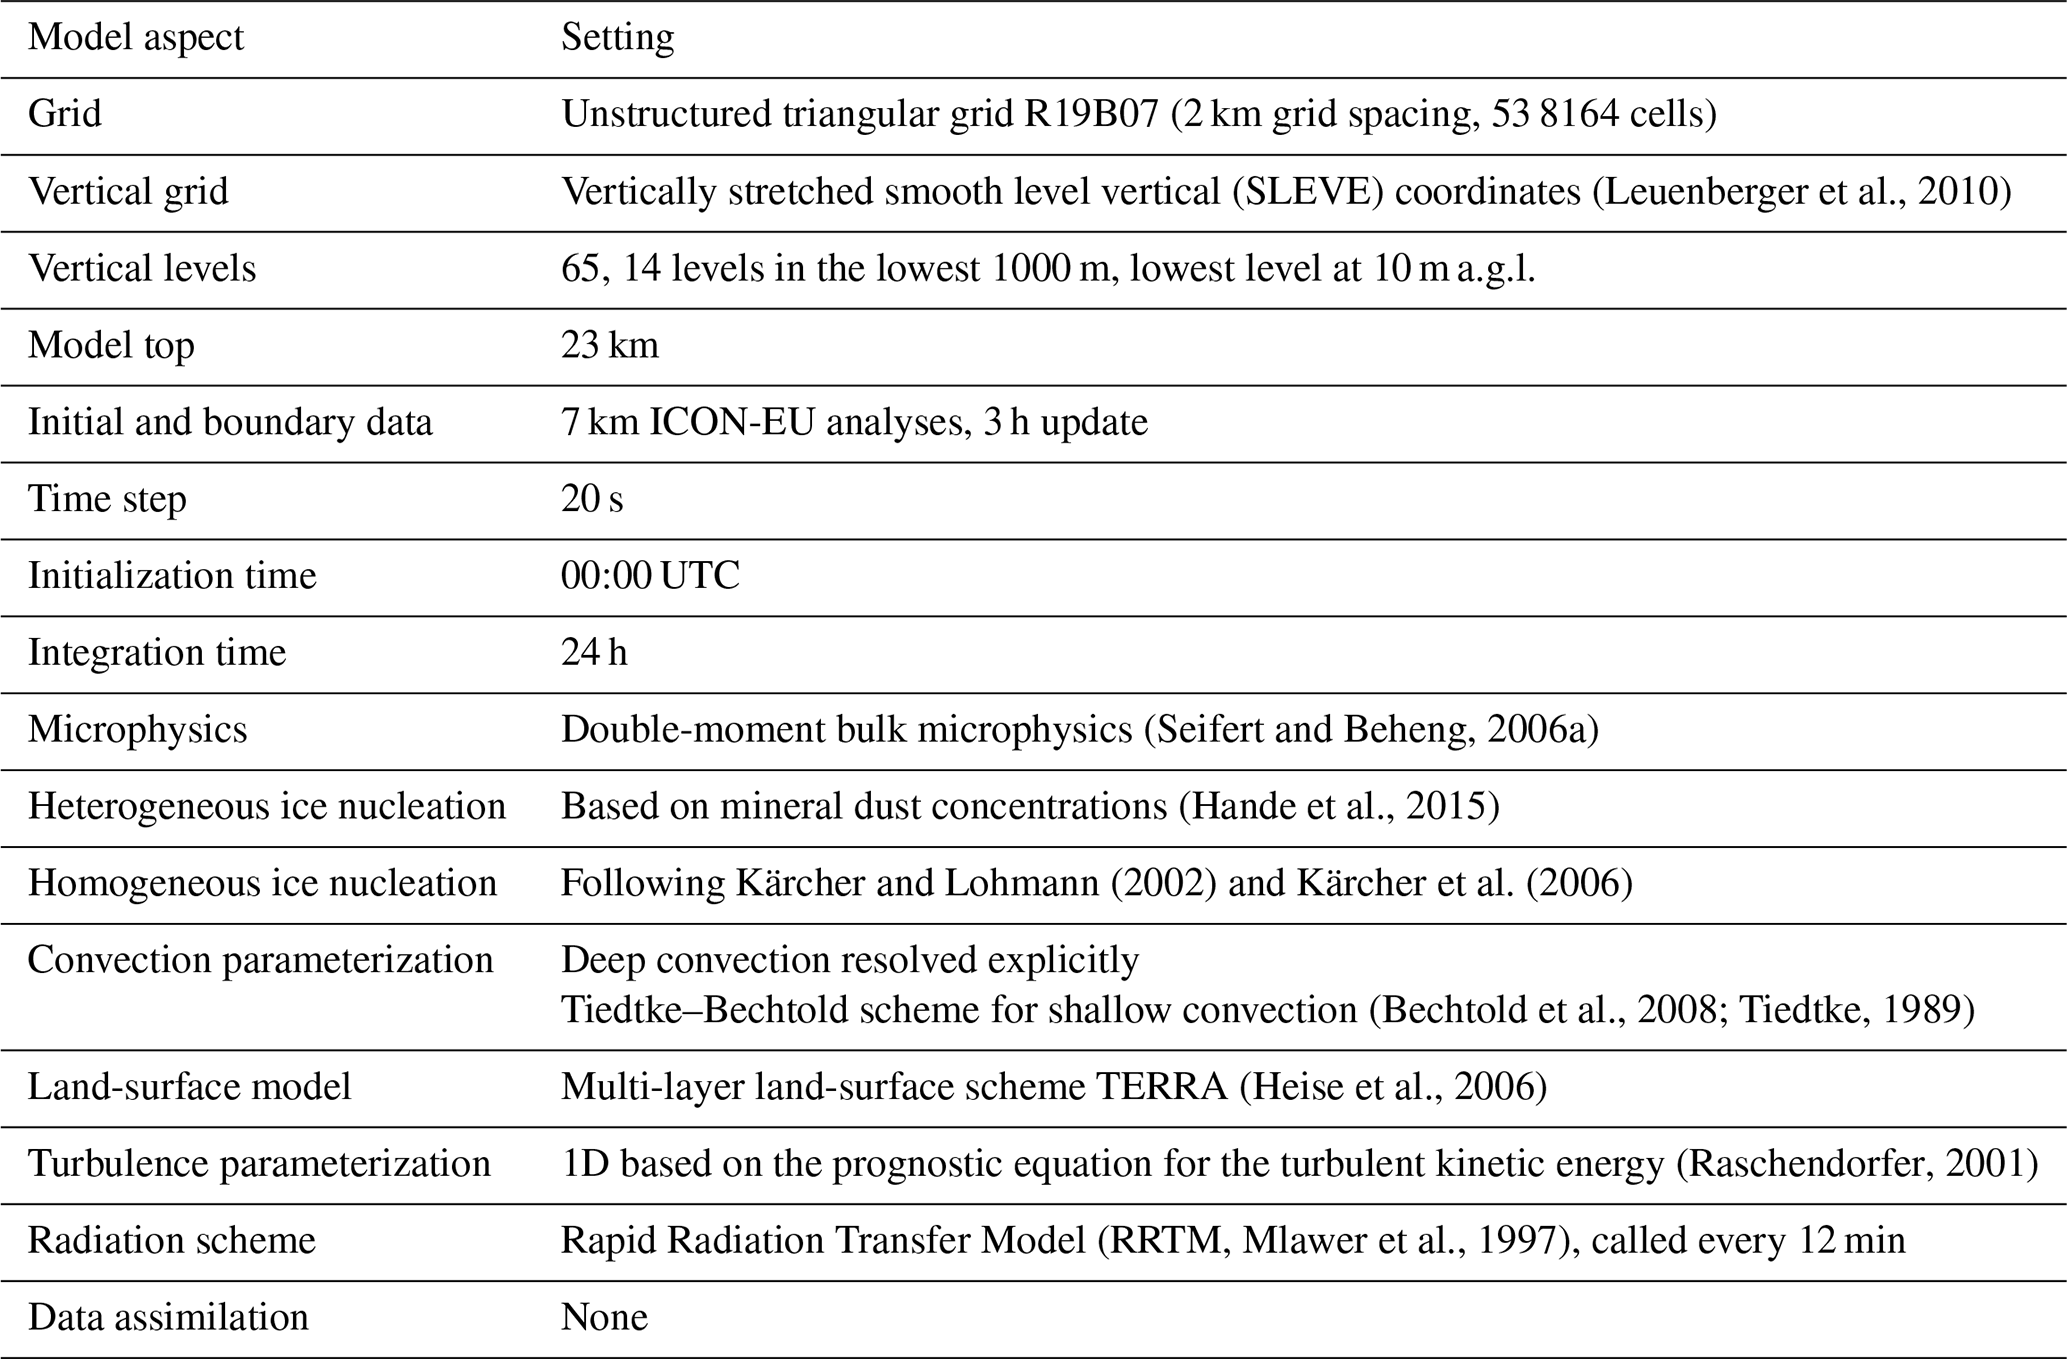
The model setup is generally similar to that used in Barthlott et al. (2022) but is described here for reference. We use version 2.6.2.2 of the ICOsahedral Non-hydrostatic (ICON) model. ICON is a fully compressible model using an unstructured triangular grid with C-type staggering based on a successive refinement of a spherical icosahedron (Zängl, 2012; Zängl et al., 2015). It can be run in global and limited-area modes with grid-nesting capability. The convection-permitting configuration ICON-D2 at 2 km horizontal grid spacing has been used at the German Weather Service (DWD) for operational forecasts over central Europe since February 2021. Model domain (Fig. 1) and horizontal and vertical resolution used in this study correspond to the operational ICON-D2 configuration. Further model settings are presented in Table 1.

Figure 1ICON simulation domain and model orography in meters above sea level. The black rectangle depicts the evaluation domain covering most of Germany and parts of neighboring countries.
2.1.1 CCN uncertainty
In contrast to the operational setup at the DWD, we use the double-moment microphysics scheme of Seifert and Beheng (2006a) to represent aerosol effects on the microphysics of mixed-phase clouds. This scheme predicts the mass and number concentration of cloud water, rainwater, ice, snow, graupel, and hail and has been extensively used to study aerosol–cloud interactions in recent years with the ICON model (e.g., Heinze et al., 2017; Costa-Surós et al., 2020; Barthlott et al., 2022) and its predecessor, the COSMO model (e.g., Seifert et al., 2012; Barthlott et al., 2017; Barthlott and Hoose, 2018; Keil et al., 2019; Marinescu et al., 2021). Pre-calculated activation ratios stored in look-up tables (Segal and Khain, 2006) are used to compute the activation of CCN from aerosol particles. The condensation nuclei are all assumed to be soluble and follow a bi-model size distribution (Seifert et al., 2012). Using the Segal and Khain (2006) activation, four different values of the number density of CCN (NCCN) are available, representing maritime (NCCN = 100 cm−3), intermediate (NCCN = 500 cm−3), continental (NCCN = 1700 cm−3), and continental polluted conditions (NCCN = 3200 cm−3). Typical conditions of central Europe are represented by the continental aerosol assumption (Hande et al., 2016).
2.1.2 CDSD uncertainty
The second perturbation consists of different widths of the CDSD. The size distribution is based on a so-called generalized Gamma distribution as follows,
and depends on the shape parameter ν and dispersion parameter μ as a function of the particle mass x. With the predicted mass and number densities, both coefficients A and λ can be calculated (Seifert and Beheng, 2006a). A number of microphysical processes depend directly on the shape parameter (e.g., autoconversion, self-collection) or indirectly (e.g., melting, evaporation, accretion, riming, sedimentation), leading to a potentially large impact of the CDSD on the simulated precipitation totals (Barthlott et al., 2022). In this study, we perturb the shape parameter from 0 to 8. These values lie in the observational range and were shown to have a large impact on convective precipitation forecasts in recent studies (Barthlott et al., 2022; Baur et al., 2022; Matsunobu et al., 2022). The dispersion parameter is kept constant in all simulations (). To illustrate the impact of the shape parameter on the width of the CDSD, Fig. 2 shows example size distributions as a function of particle diameter D at fixed cloud water content (QC) and cloud droplet number concentration (QNC) for different shape parameters. We refer to Khain et al. (2015) or Barthlott et al. (2022) for the conversion of Eq. (1) from particle mass x to diameter D. It can be seen that larger shape parameters narrow the size distribution and also shift the maximum to larger droplet sizes. An important feature is that, with high shape parameters, the CDSD has fewer smaller droplets but also fewer large droplets, leading to a smaller effective radius, which impacts the optical properties of the clouds.
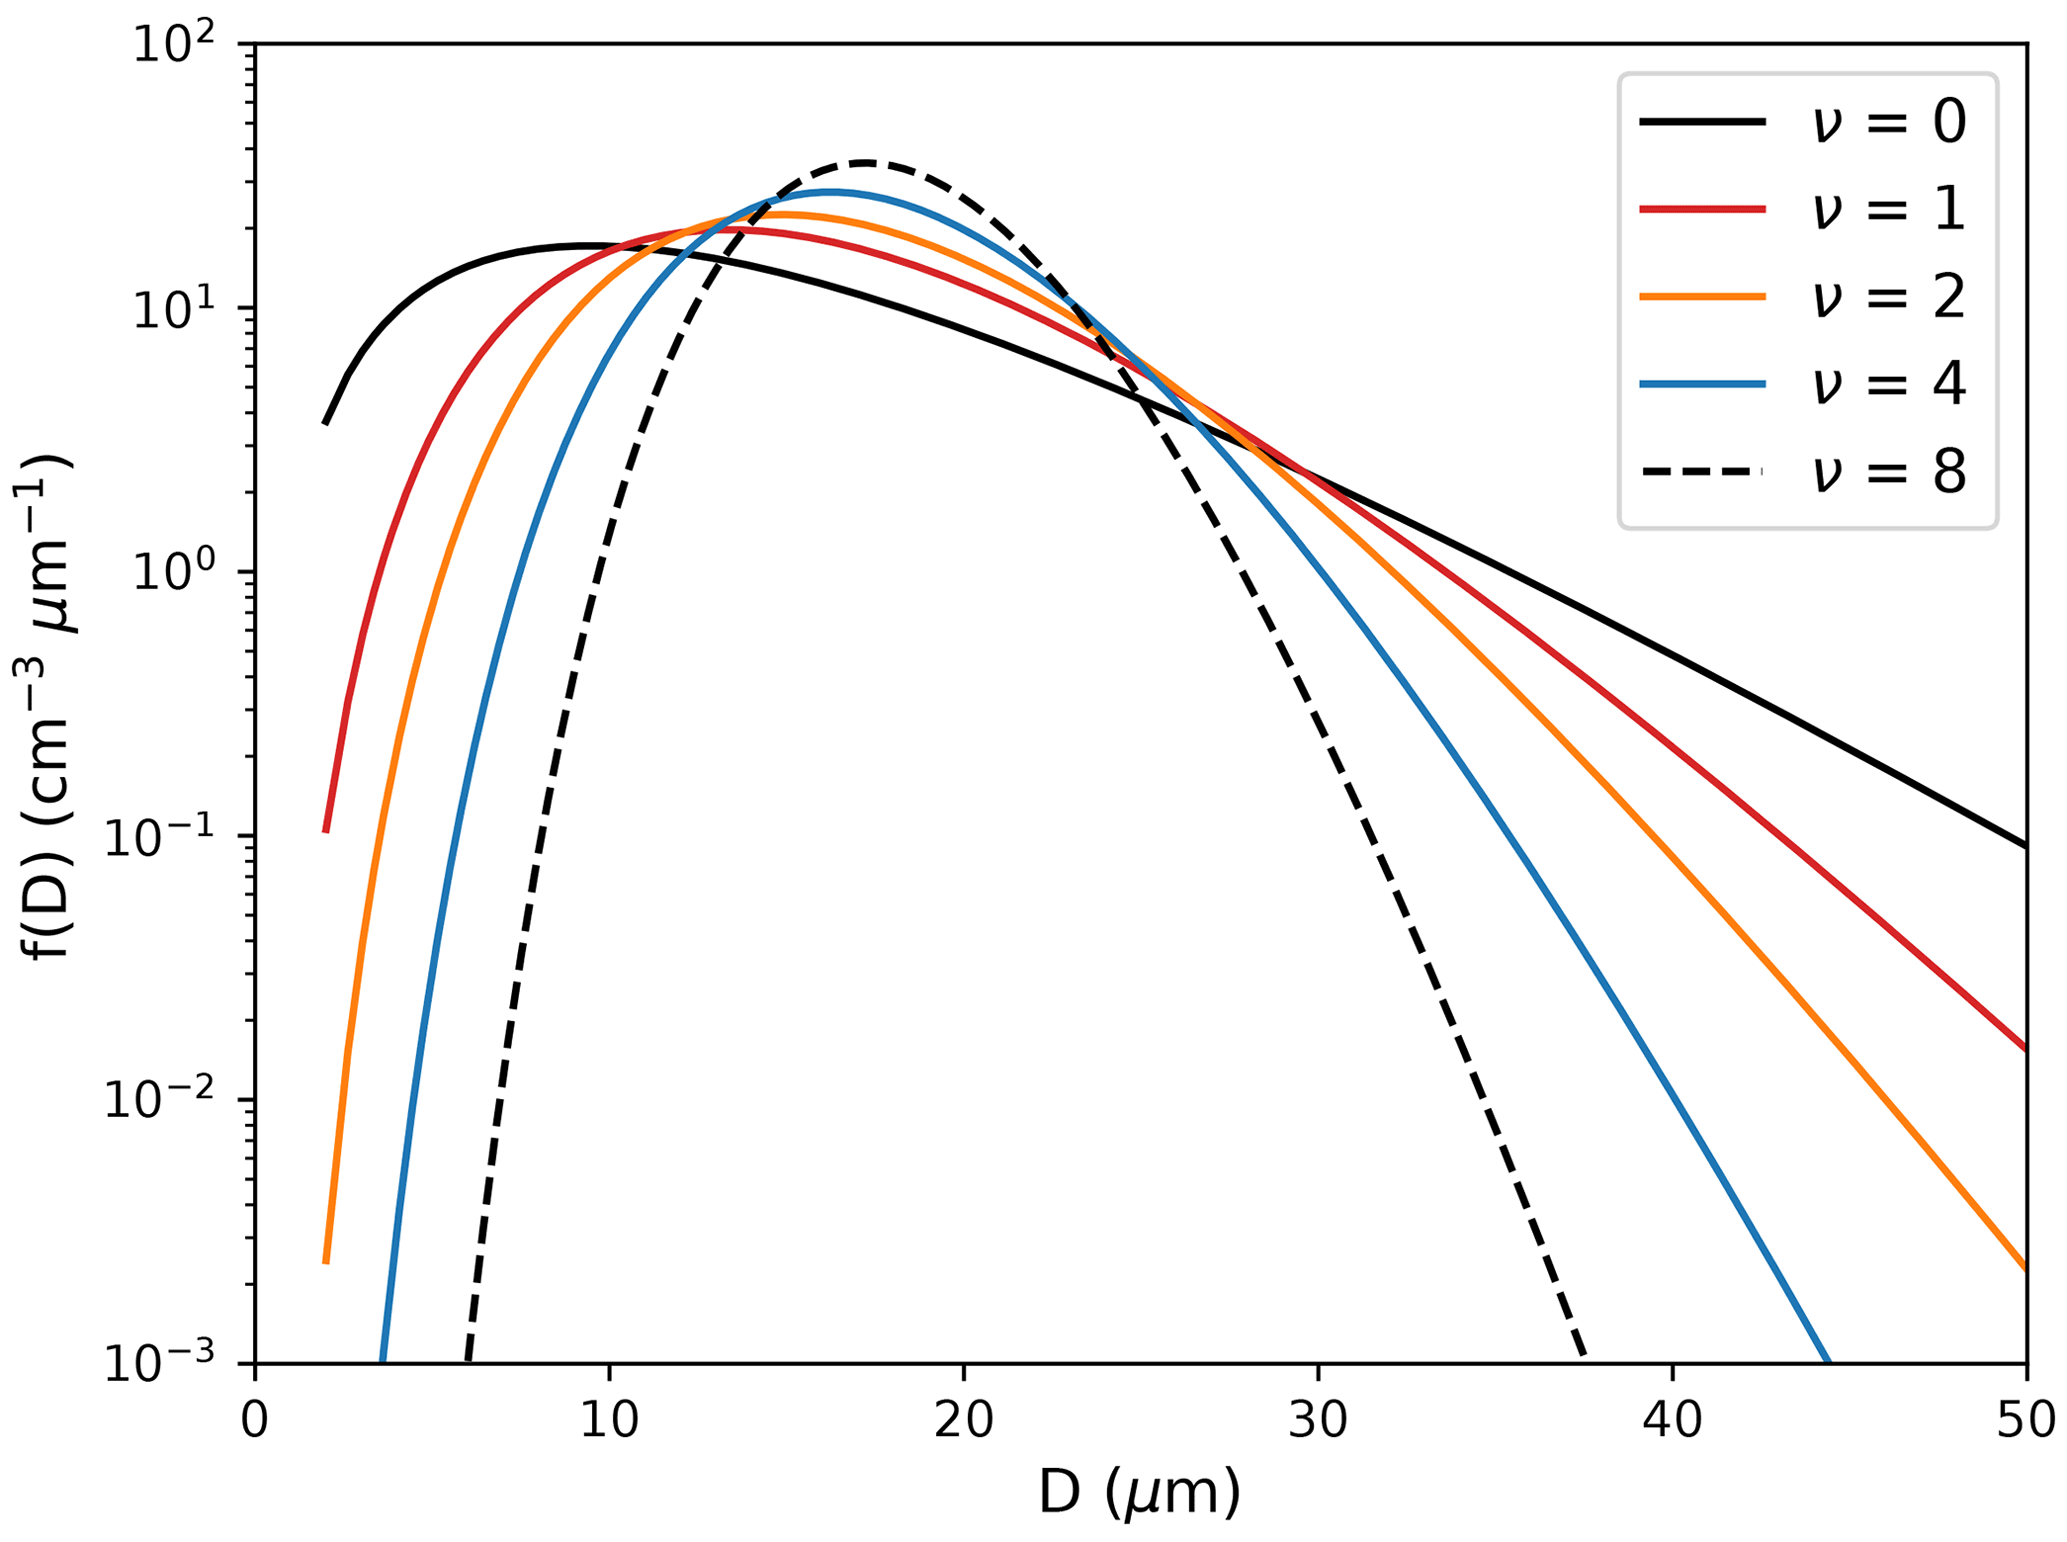
Figure 2Cloud droplet size distributions for different values of the shape parameter ν at fixed cloud water content (QC = 1.0 g m−3) and cloud droplet number concentration (QNC = 300 cm−3). D denotes the diameter of the droplets.
2.1.3 Soil moisture uncertainty
The third uncertainty included in our combined sensitivity analysis consists of three different soil moisture initializations. Besides a reference run with initial values coming from the ICON-EU analysis, we conduct simulations with a dry and wet bias (±25 %) to account for uncertainties in soil moisture. The value of 25 % was selected because Hauck et al. (2011) showed that simulated and observed soil moistures in southwestern Germany differ by around 20 %–30 %. Our procedure to include a soil moisture bias is as follows: first, the soil moisture index (SMI) is converted to a volumetric water content (VWC) using the field capacity and the permanent wilting point for each soil type. Then the VWC is increased/decreased by a factor of ±25 % at every grid point at all levels. To ensure physically meaningful values, we restrict the modifications to the limits of the air dryness point and the pore volume for each soil type. Finally, the modified SMI is calculated and written to the file used for model initialization.
In summary, this study investigates the effects of two microphysical uncertainties (i.e., CCN concentration and shape parameter) combined with land-surface uncertainties (soil moisture realizations). By applying four different CCN concentrations, five different shape parameter values, and three soil moisture initializations, we end up with an ensemble of 60 model runs per case. The reference run uses unmodified soil moisture values, a continental CCN assumption typical for central Europe, and a shape parameter of 0. All model runs are abbreviated based on three letters:
-
soil moisture content: dry (DRY), reference (REF), or wet (WET);
-
CCN concentration: maritime (m), intermediate (i), continental (c), or polluted (p);
-
shape parameter ν: 0, 1, 2, 4, or 8.
The reference run would therefore be labeled as run REFc0. Including more microphysical uncertainties (e.g., ice-nucleating particle concentration, hydrometeor sedimentation, or ice multiplication) as in idealized simulations by Wellmann et al. (2020) could be considered in the future but was not done for the moment due to the high number of possible combinations.
2.2 Case studies
We performed numerical simulations for a total of 4 d. To cover different typical weather regimes in central Europe, we selected two cases with weak and strong synoptic forcing, respectively (Table 2). Both weak forcing cases were also used in Barthlott et al. (2022) and the strong forcing case of 17 August 2020 in Matsunobu et al. (2022). The 5 June 2016 case occurred during an exceptional sequence of severe thunderstorms in Germany; its meteorological situation is described in detail by Piper et al. (2016). Mohr et al. (2020) investigated the role of large-scale dynamics in an exceptional sequence of severe thunderstorms of May–June 2018 in Europe to which the 9 June 2018 case belongs. Large amounts of hail fell on 10 June 2019, when a severe storm system was passing over the city of Munich in southeastern Germany. This day was part of a 3 d storm series in June 2019 whose synoptic controls are given in Wilhelm et al. (2021).
Table 2List of cases with convective adjustment timescale τ and mean initial relative water content RWC for the three soil moisture scenarios.
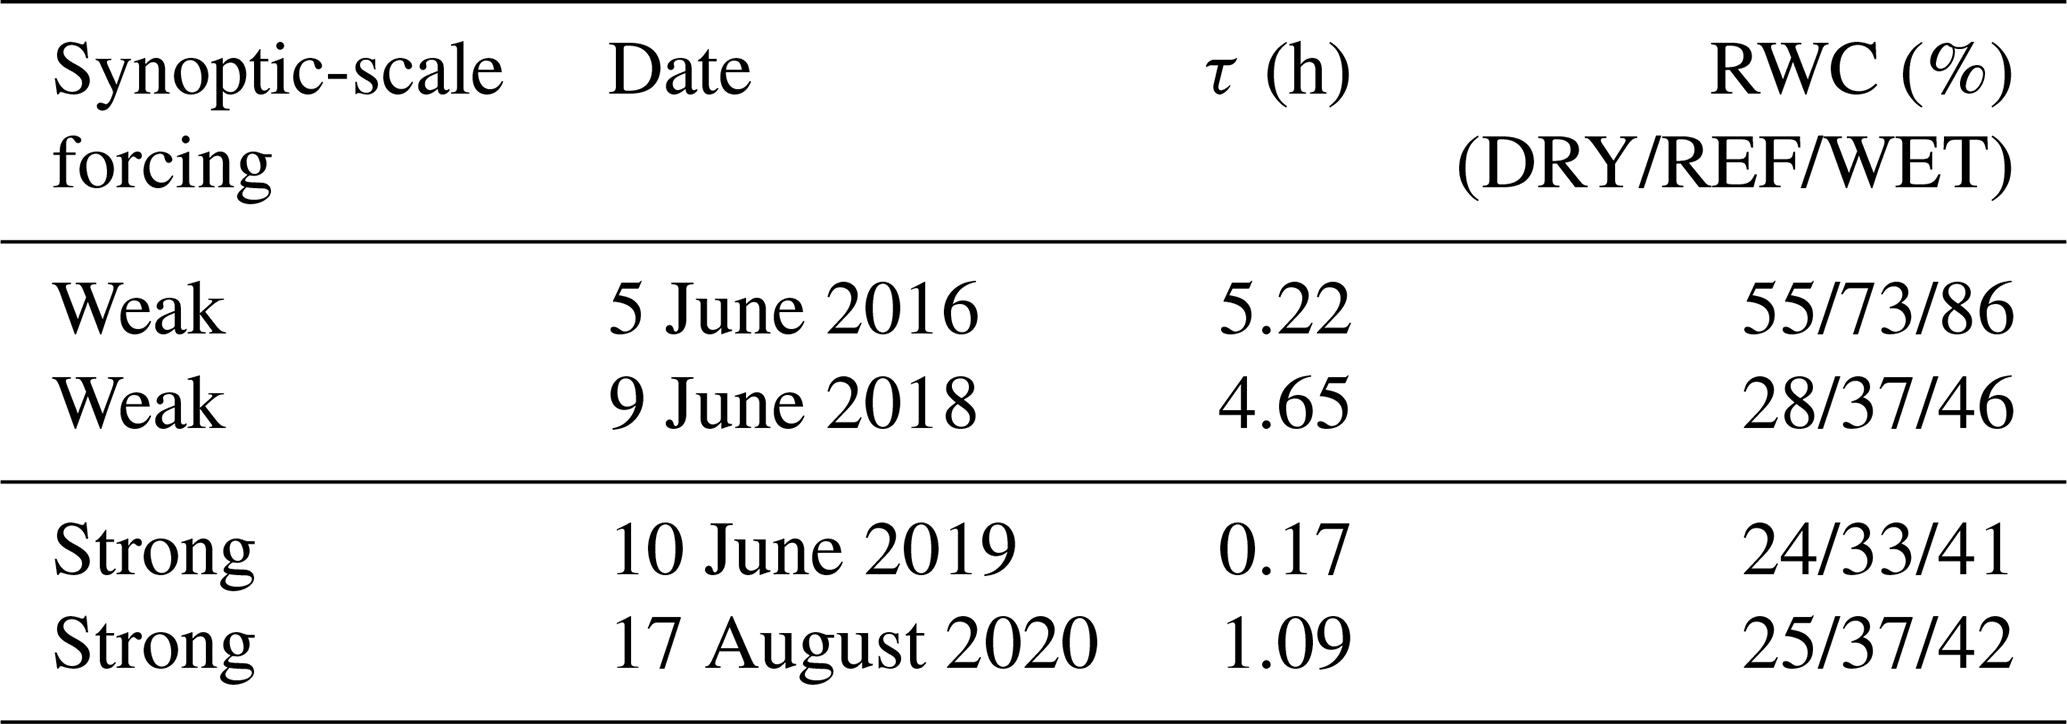
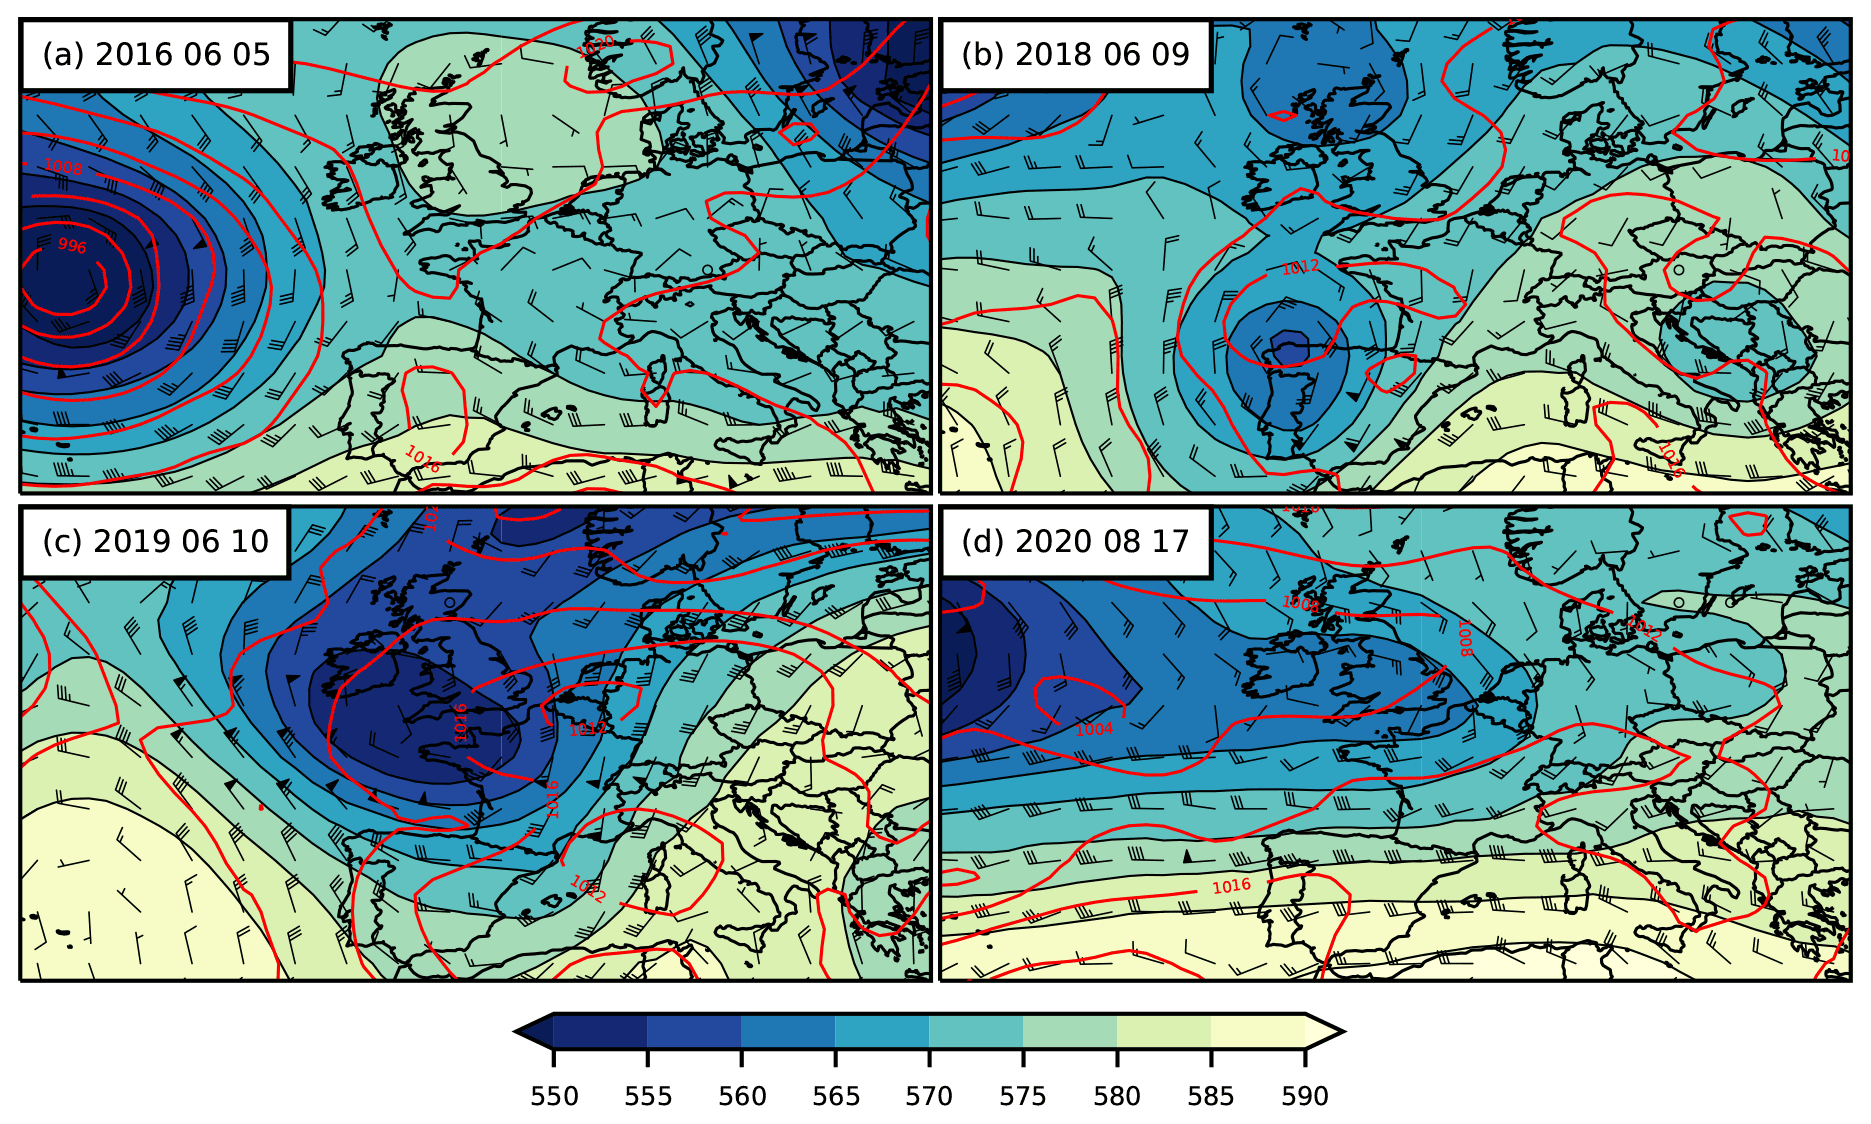
Figure 3Global Forecast System (GFS) analyses at 12:00 UTC for the cases with weak (a, b) and strong (c, d) synoptic-scale forcing showing 500 hPa geopotential height (gpdm; shading), sea-level pressure (hPa, red contours), and 500 hPa wind barbs.
To objectively quantify the degree of synoptic-scale forcing, we computed the convective adjustment timescale τ following Keil et al. (2014):
with reference values for density, ρ0=1.292 kg m−3, and temperature, T0=273.15 K, specific heat of air at constant pressure cp, latent heat of vaporization Lv, acceleration due to gravity g, convective available potential energy (CAPE), and the precipitation rate P. It is a measure to distinguish between different flow regimes and can be considered an estimate of the timescale for the removal of conditional instability. Daily mean values of this timescale below a threshold of 3 h indicate strong forcing, higher values weak forcing. A visual inspection of the synoptic weather charts in Fig. 3 confirms the results of the timescale analysis (Table 2).
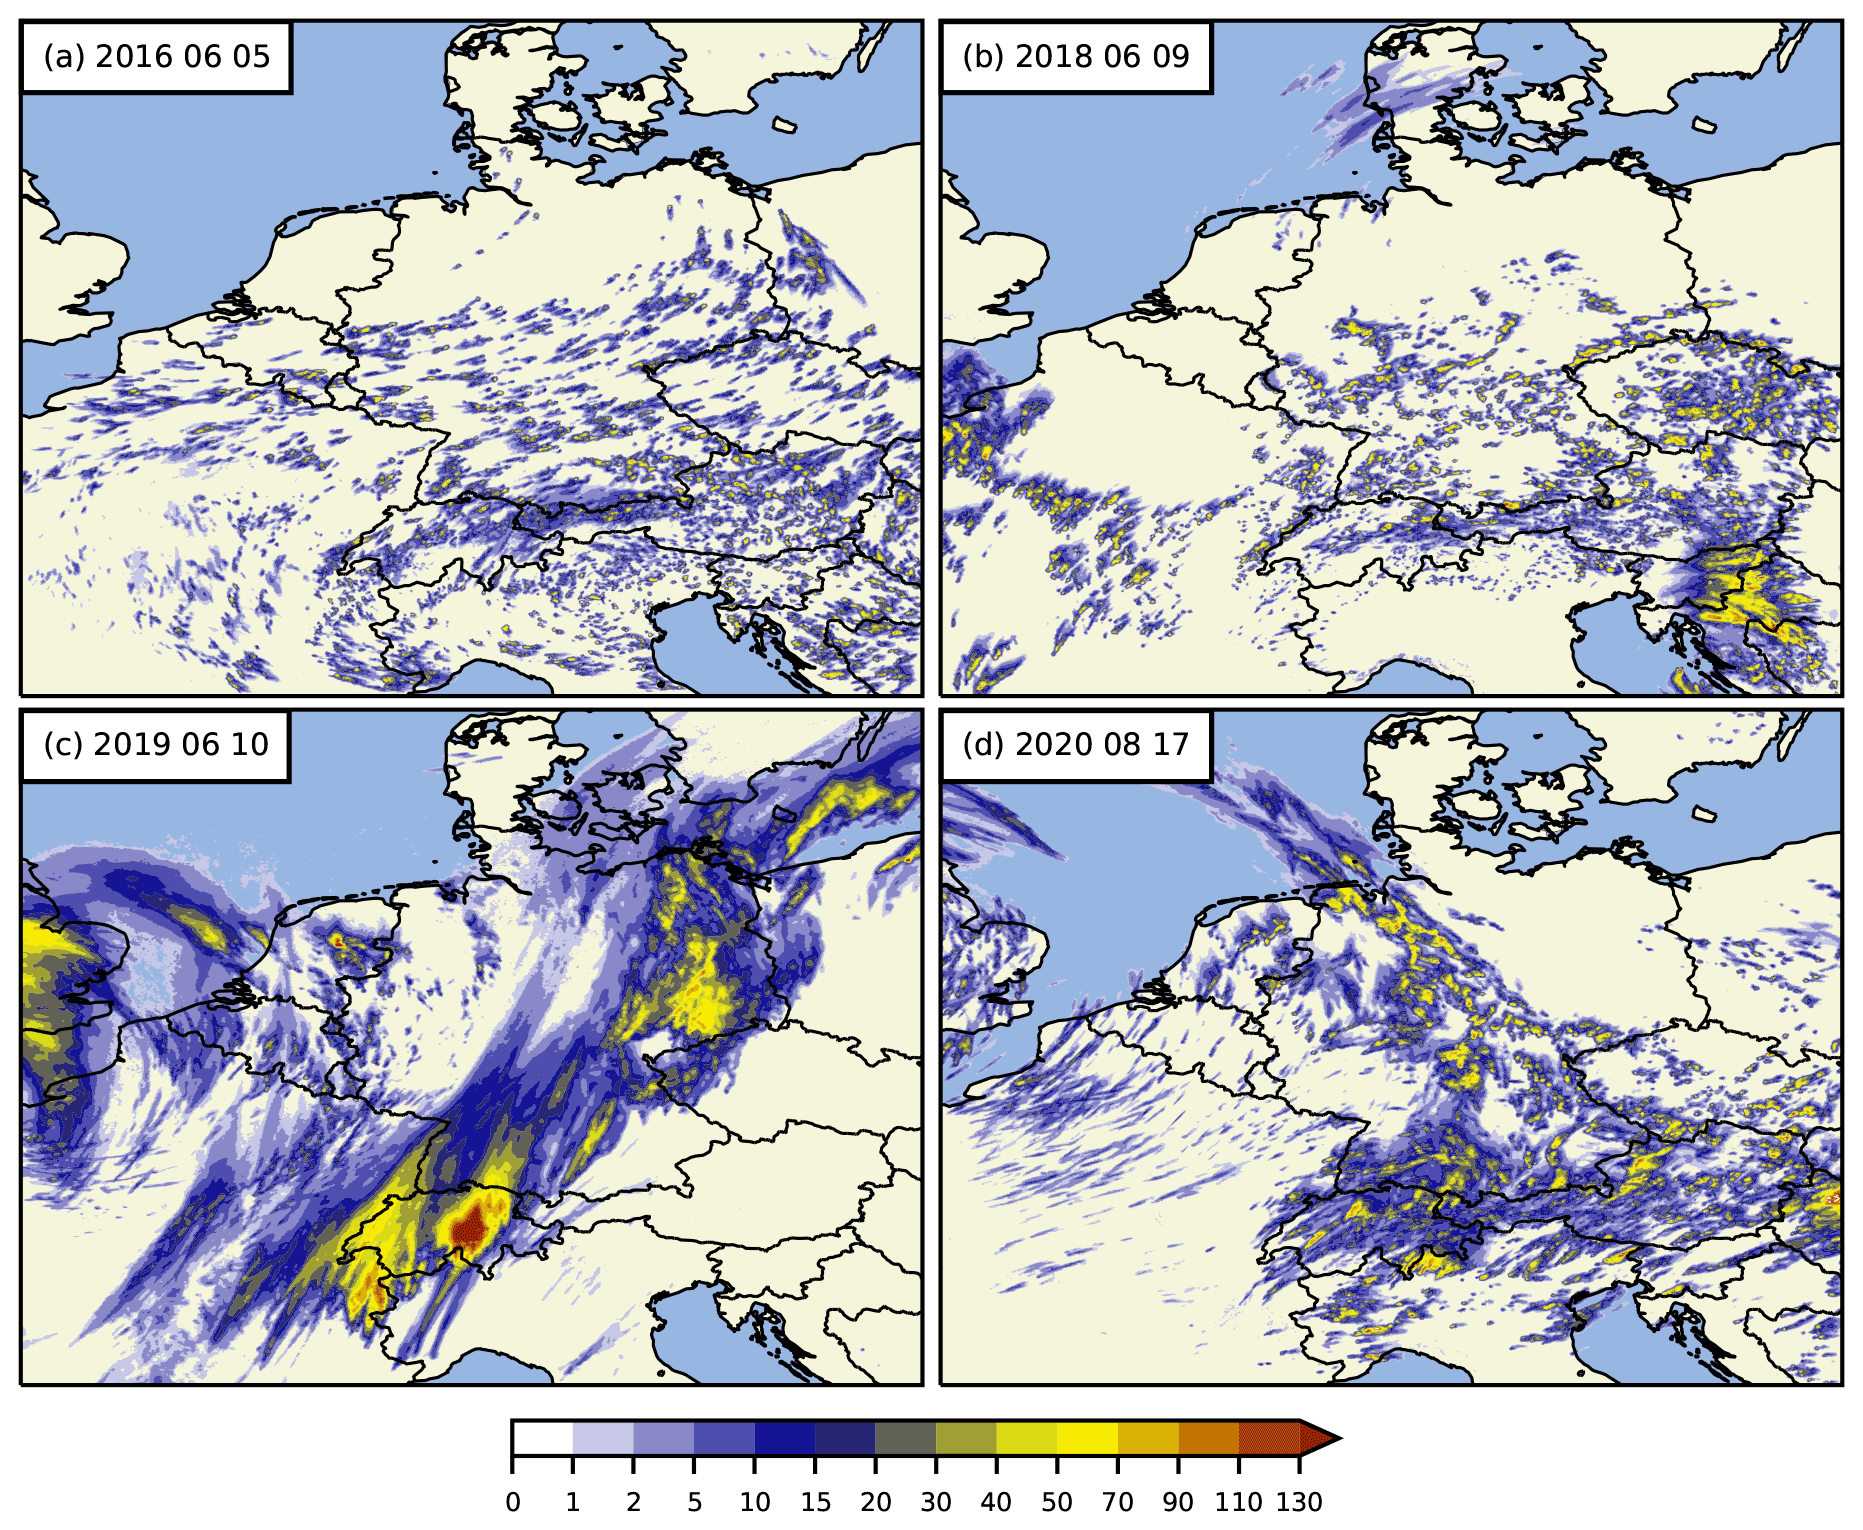
Figure 424 h precipitation amount (mm) of the reference runs with continental CCN concentration, broad cloud droplet size distribution (ν=0), and reference initial soil moisture for the cases with weak (a, b) and strong (c, d) synoptic-scale forcing.
We now briefly describe the synoptic situation of these cases and the 24 h rain distribution of the respective reference runs. Under weak synoptic forcing, there lies a dominating ridge in central Europe with a ridge axis over the Iberian Peninsula on 5 June 2016 and further to the east on 9 June 2018. On both days, low-pressure systems are situated over the eastern Atlantic. Over Germany, the surface pressure lies between 1012 and 1020 hPa with weak horizontal gradients, and mid-tropospheric winds are weak from the easterly (Fig. 3a) and southwesterly (Fig. 3b) directions. The 24 h accumulated precipitation of the reference runs shows scattered convective showers over Germany for these cases (Fig. 4a, b).
Under strong synoptic forcing, both analyzed days show a stronger baroclinicity of the flow (Fig. 3c, d), with a low-pressure system northwest of France (10 June 2019) and over the eastern Atlantic (17 August 2020). Mid-tropospheric winds are more cyclonic from southwesterly directions, with stronger winds on 10 June 2019 due to deeper low and larger pressure gradients over Germany. The precipitation distribution reveals more organized convection and, especially on 10 June 2019, larger cloud clusters and more long-lived convection. We also compared the simulated precipitation to data from the precipitation analysis algorithm RADOLAN (Radar Online Adjustment) that combines weather radar data with hourly surface precipitation measurements of about 1300 automated rain gauges (not shown). For 24 h accumulated precipitation, we find an overall good agreement, even if the precise locations of individual convective cells are not always simulated at the right place. However, the model succeeds reasonably well in reproducing the observed cloud and precipitation evolution, which implies that these runs serve as a good basis for our combined perturbation experiments.
3.1 Precipitation amount and timing
To investigate the response of precipitation amounts to the perturbations applied in this study, we computed domain-integrated precipitation totals for the evaluation domain given in Fig. 1. The percentage deviations for each of the 60 ensemble members from the respective reference run are given in Fig. 5. We see a positive soil moisture–precipitation relationship for the vast majority of the performed simulations, as the accumulated precipitation in most runs with different shape parameters within one CCN concentration increases with increasing soil moisture, independent of the type of synoptic forcing. Although not shown here, the increase (decrease) in the initial soil moisture leads to a systematic increase (decrease) in CAPE and a decrease (increase) in convection inhibition (CIN) for all cases, independent of the microphysical uncertainties. As soil moisture controls the partitioning of the available energy at the ground into latent and sensible heat, the near-surface temperatures show a negative relationship with soil moisture, whereas specific humidity reveals a systematic positive relationship with soil moisture (not shown). This leads to an overall lower level of free convection, resulting in larger amounts of CAPE with smaller CIN despite lower boundary layer heights. However, the soil moisture impact is comparably weaker for the case of 5 June 2016. Especially for polluted conditions, there is only a marginal precipitation increase with soil moisture. This day, however, is characterized by already quite wet initial soils with an average relative water content of 73 % (see Table 2). As was pointed out by Barthlott and Kalthoff (2011), for already quite wet soils, the influence of increasing soil moisture is much weaker and the general response of precipitation to soil moisture is not systematic anymore. For drier soils, however, where evapotranspiration is controlled by soil moisture, a systematic positive relationship of the 24 h accumulated precipitation with soil moisture exists, which can also be found in our simulations. The remaining days have considerably drier initial soil moisture values (36 % on 9 June 2018, 33 % on 10 June 2019, 34 % on 17 August 2020) and reveal a uniform positive soil moisture–precipitation feedback. There is one exception for the case of 9 June 2018: only in the runs with a polluted atmosphere does more rain fall for three of the shape parameter runs in the dry run than in the reference run. On this day, the precipitation amounts in a polluted environment are rather similar in the runs with dry and reference soil moisture. Reasons for that behavior could be related to the fact that a stronger thermal forcing with drier soils compensates for the reduction in CAPE. It is worth noting that, although stronger latent heat fluxes increase near-surface specific humidity, the impact on vertically integrated water vapor is negligible (−1.4 % to +0.8 %). This is important for the comparability of the runs from our 60-member ensemble. Although this study comprises only three different soil moisture realizations, we tested whether there is a linear response of accumulated precipitation to the initial soil moisture. Recently, a modeling study by Drager et al. (2022) has suggested a new type of rainfall response to soil moisture in which intermediate-moisture soils receive less rainfall than do the driest or wettest soils. This non-monotonic soil moisture–precipitation relationship was found to result from the permanent wilting point's modulation of transpiration of water vapor by plants. Our simulations revealed a monotonic soil moisture–precipitation relationship for all runs under strong synoptic forcing and for 85 % of the runs under weak synoptic forcing. Mean correlation coefficients were also high and ranged between 0.914 and 0.988. For more robust results, however, a higher number of soil moisture scenarios as applied in Drager et al. (2022) or Barthlott and Kalthoff (2011) would be necessary.
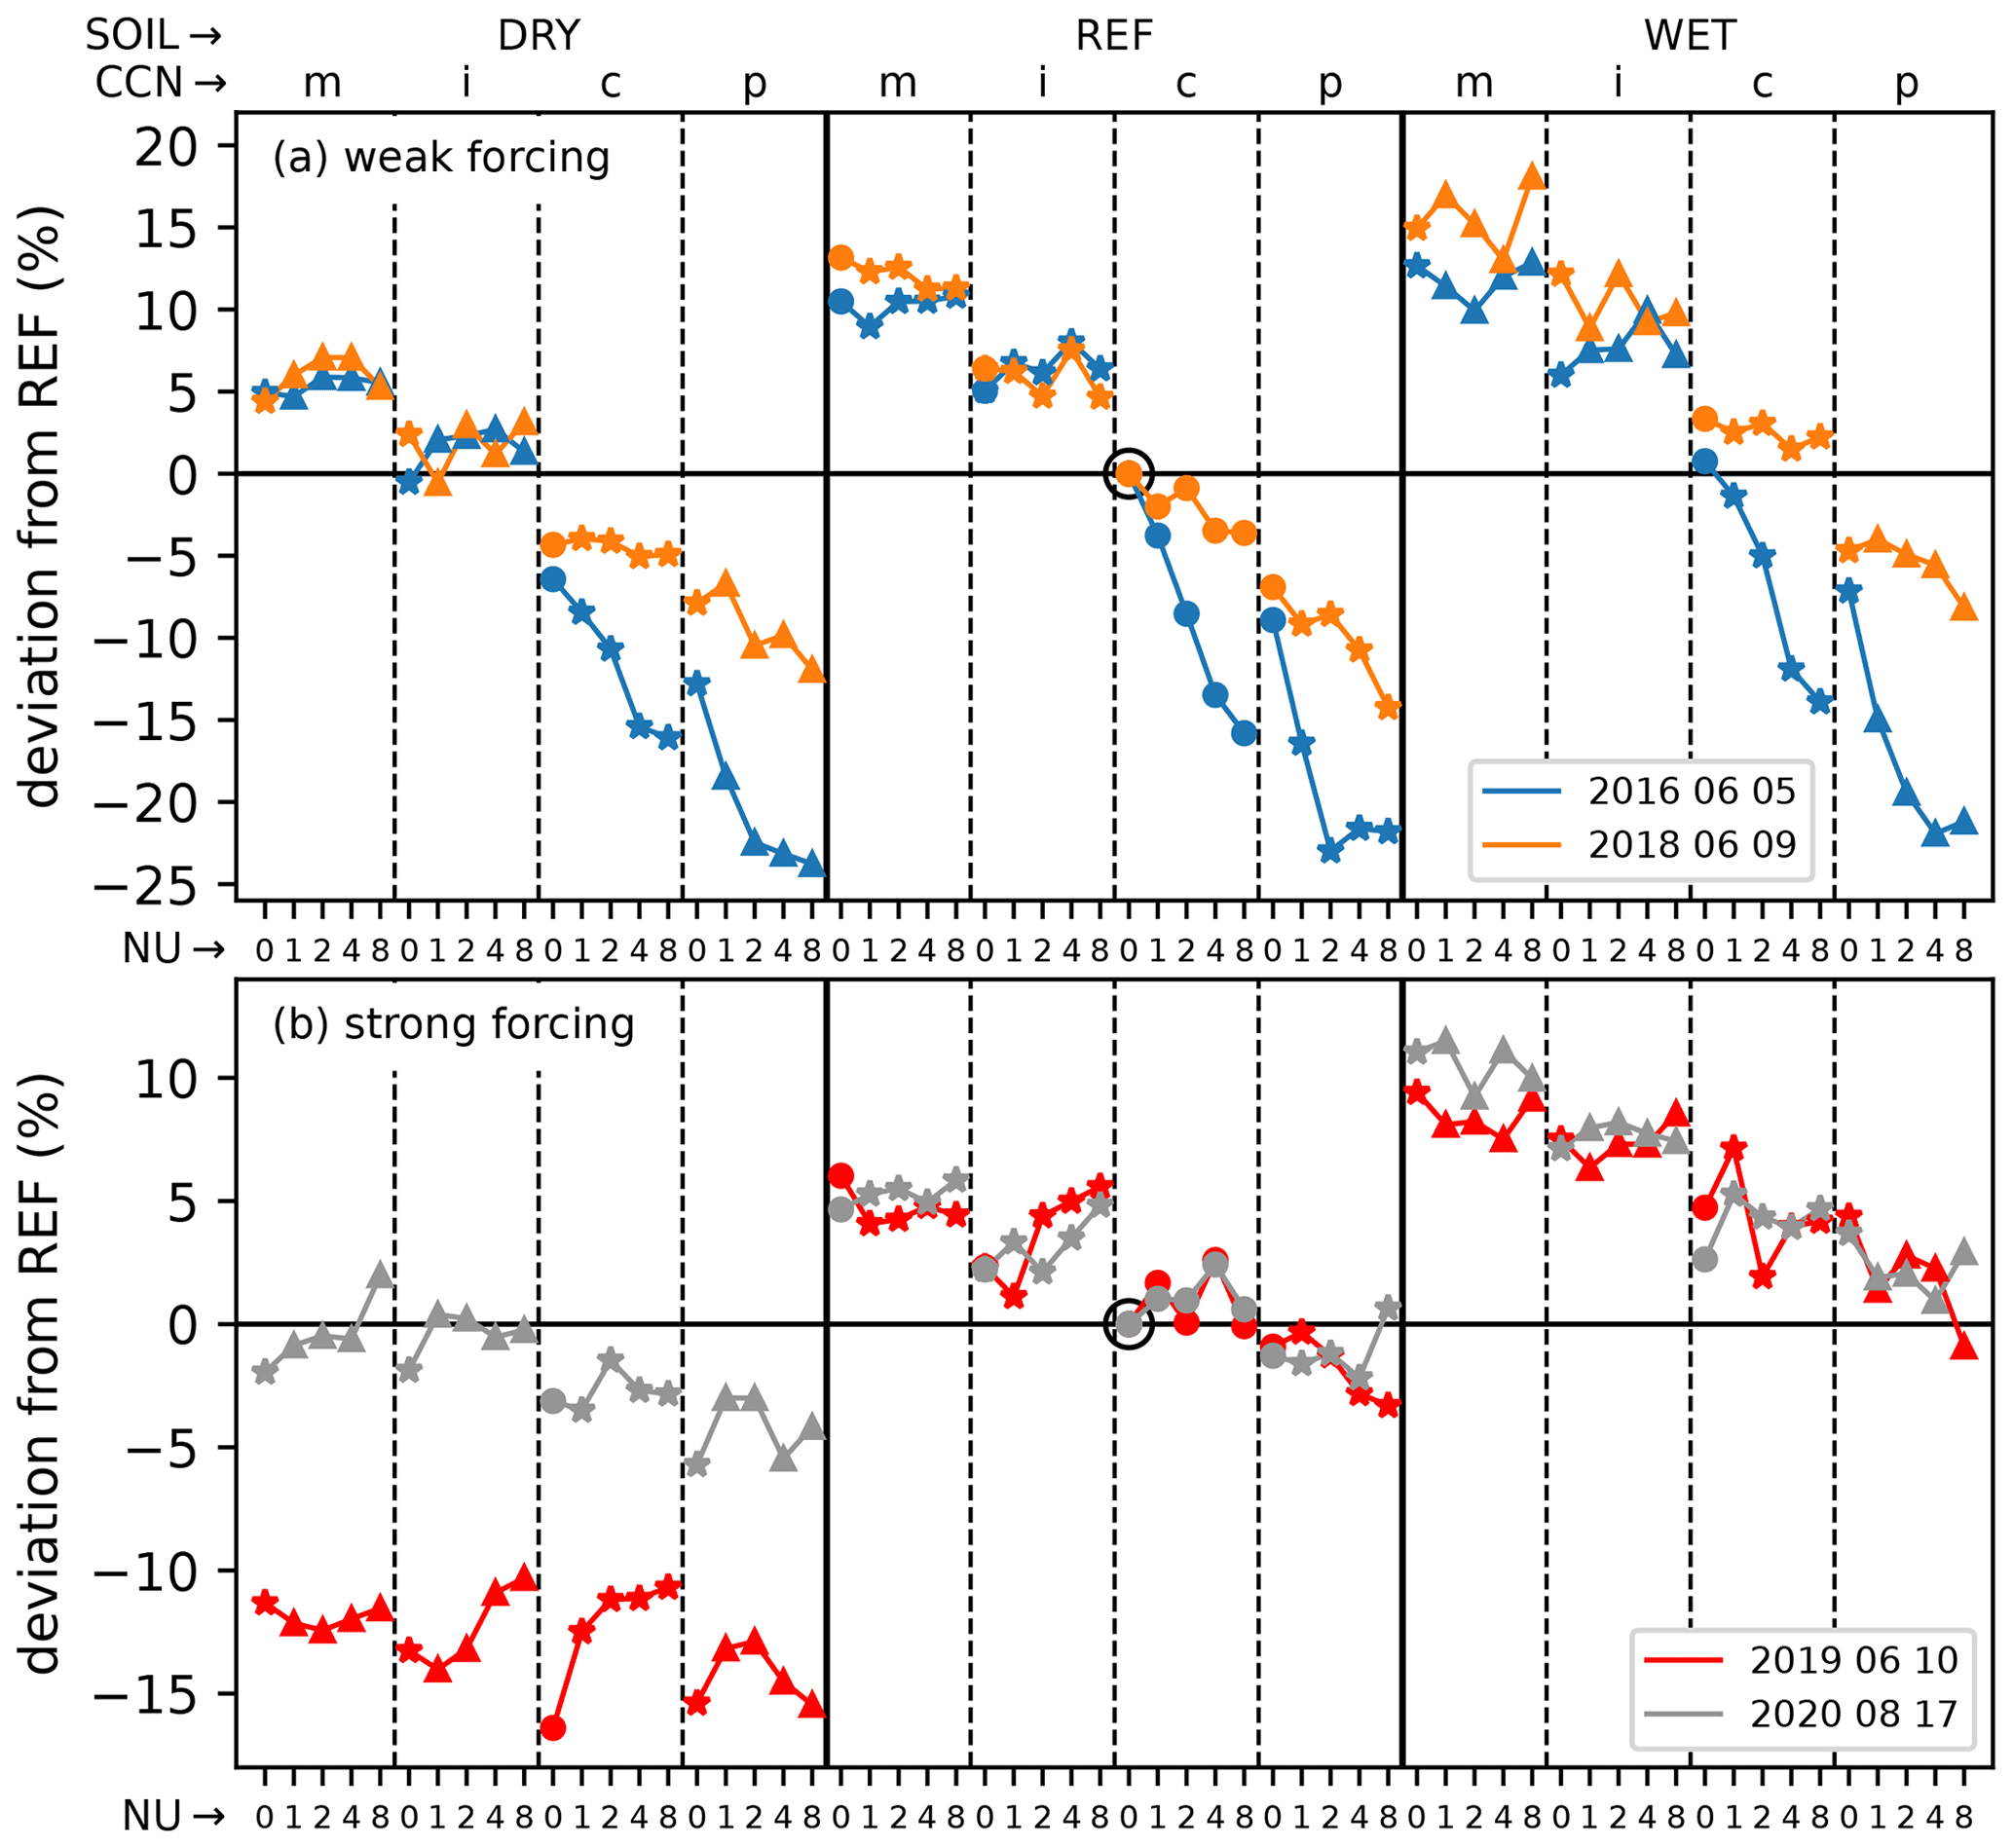
Figure 5Precipitation deviation from the respective reference run (marked with a black circle) for (a) weak and (b) strong synoptic forcing. Data points are arranged in three blocks with different soil moisture contents (DRY, REF, WET), each of which is divided into four blocks with increasing CCN concentration (m, i, c, p). The points inside one CCN concentration then indicate the sensitivity with respect to the shape parameter (NU) from 0 to 8. The type of marking distinguishes between single effects (circles), double synergies (stars), and triple synergies (triangles).
The response of total precipitation to varying CCN concentrations shows a systematic precipitation decrease with increasing CCN concentrations for the weak forcing cases, irrespective of the underlying soil moisture content. This general trend is also apparent for the strong forcing cases; however, there are some shape parameter runs that deviate from this systematic behavior: e.g., for the runs at the reference soil moisture, the intermediate CCN concentrations with shape parameters between 2 and 8 reveal larger rain amounts than with maritime CCN concentration for the 10 June 2019 case. The same applies to the case of 17 August 2020 in wet soils from continental to polluted conditions with a shape parameter of 0. However, the magnitude of the CCN response for the strong forcing cases is much lower (−16.4 % to +11.5 %) than for weak forcing (−23 % to +18 %), which is in agreement with previous findings regarding aerosol–cloud interactions with the COSMO model (Barthlott and Hoose, 2018; Keil et al., 2019) and with ICON (Barthlott et al., 2022). Note that different models may produce different responses to aerosol perturbations, but these studies used the same double-moment scheme for simulating convective episodes over central Europe. The validity of the convection invigoration mechanism proposed in Rosenfeld et al. (2008) is still open, and many studies documented a decrease in total precipitation with increasing aerosol concentrations (e.g., Tao et al., 2012; Storer and van den Heever, 2013). Using idealized simulations, Grant and van den Heever (2015) showed that the influence of aerosols varies inversely with storm organization, and Fan et al. (2009) found that vertical wind shear qualitatively determines whether aerosols suppress or enhance convective strength.
It is further of interest to analyze the impact of different shape parameters on precipitation deviations. For the weak forcing cases, there is only a small sensitivity of total precipitation for maritime and intermediate CCN concentrations. For more polluted environments (runs c and p), the sensitivity to the shape parameter becomes much larger, and precipitation amounts tend to decrease with larger values of the shape parameter. The shape parameter impact for the strong forcing cases remains generally small in all the soil moisture and CCN concentration regimes. Furthermore, there is no observable systematic effect on precipitation totals. Only for runs DRYc0 to DRYc8 on 10 June 2019 is there a systematic precipitation increase with somewhat stronger precipitation deviations compared to the other cases.
A feature only apparent for weak synoptic forcing is the fact that for maritime and intermediate CCN concentrations in dry soils, more precipitation is simulated, as with reference soil moisture and continental conditions. The enhanced warm-rain process together with the stronger thermal forcing seems to balance the CAPE reduction for drier soils. For the strong forcing case of 17 August 2020, the maritime and intermediate runs with drier soils simulate similar precipitation amounts to the reference run. Obviously, the enhanced warm-rain process roughly balances the reduction in CAPE. To support this statement, we calculated the percentage deviations of CAPE and autoconversion/accretion of those model runs to the reference run. We find that the percentage magnitudes are almost identical: CAPE decreases by 11.8 %, whereas the warm-rain process increases by 11.5 %. Although these variables cannot be used to quantitatively determine their impact on the total rain amount, this nevertheless supports our hypothesis that the CAPE reduction with drier soils can be compensated by the effects of a strengthened warm-rain process. Interestingly, the reference runs in both cases with weak forcing still have larger precipitation amounts than those from the wet scenario with polluted CCN concentrations. This points towards a dominating precipitation reduction by a reduced collision–coalescence process over a soil moisture increase due to higher instability. An important result is that an increase in the shape parameter can cause almost as large a change in precipitation totals as a CCN increase from maritime to polluted conditions, and for weak forcing cases, the shape parameter has a larger effect on precipitation totals in polluted environments.
For a more complete picture of the rain response to our microphysical and land-surface perturbations, we also analyze the fraction of cloudy grid points of each model run. We find a mostly systematic increase in cloud cover with increasing CCN concentrations and larger shape parameters (not shown). Although the relative changes are considerable (−13 % to +29 %), the absolute changes are much smaller and range between +1 % and +3 %. Nevertheless, the increase in cloud cover seems contrary to the mostly decreasing total precipitation amounts with increasing CCN concentration and increasing shape parameter (see Fig. 5). The answer to this is twofold: (i) the reduced warm-rain process as a result of a less efficient collision–coalescence process leads to a longer cloud lifetime, or (ii) stronger rain intensities must compensate for the smaller cloud cover. We therefore now analyze the daily cycle of 30 min precipitation rates to investigate the reasons for the strong effects on precipitation totals and to assess whether longer/shorter lifetimes or increased/reduced rain rates are simulated by the model.
The first case of 5 June 2016 is characterized by a similar diurnal cycle in all runs, indicating that the initiation of convection is, on average, not sensitive to the perturbations applied in this study (Fig. 6). However, the maximum precipitation intensities are strongly modified, ranging from 0.15 mm (30 min−1) to 0.25 mm (30 min−1). The higher the CCN concentration, the lower the rain intensities. The range of the shape parameter runs within one CCN concentration increases with higher CCN concentrations. These features explain the lower precipitation amounts and the stronger precipitation deviation in polluted environments found in Fig. 5. The second weak forcing case (9 June 2018) generally shows a similar behavior. On this day, we also see a soil moisture impact: in the wet scenario, the increase in precipitation rates after 09:00 UTC is weaker than in the reference run. As the resulting maximum precipitation rates later on are mostly larger than with the reference soil moisture and precipitation rates at the end of the simulation time (21:00–00:00 UTC) are still higher than in the REF run (probably due to the larger amounts of CAPE), precipitation totals are larger than in the REF run.
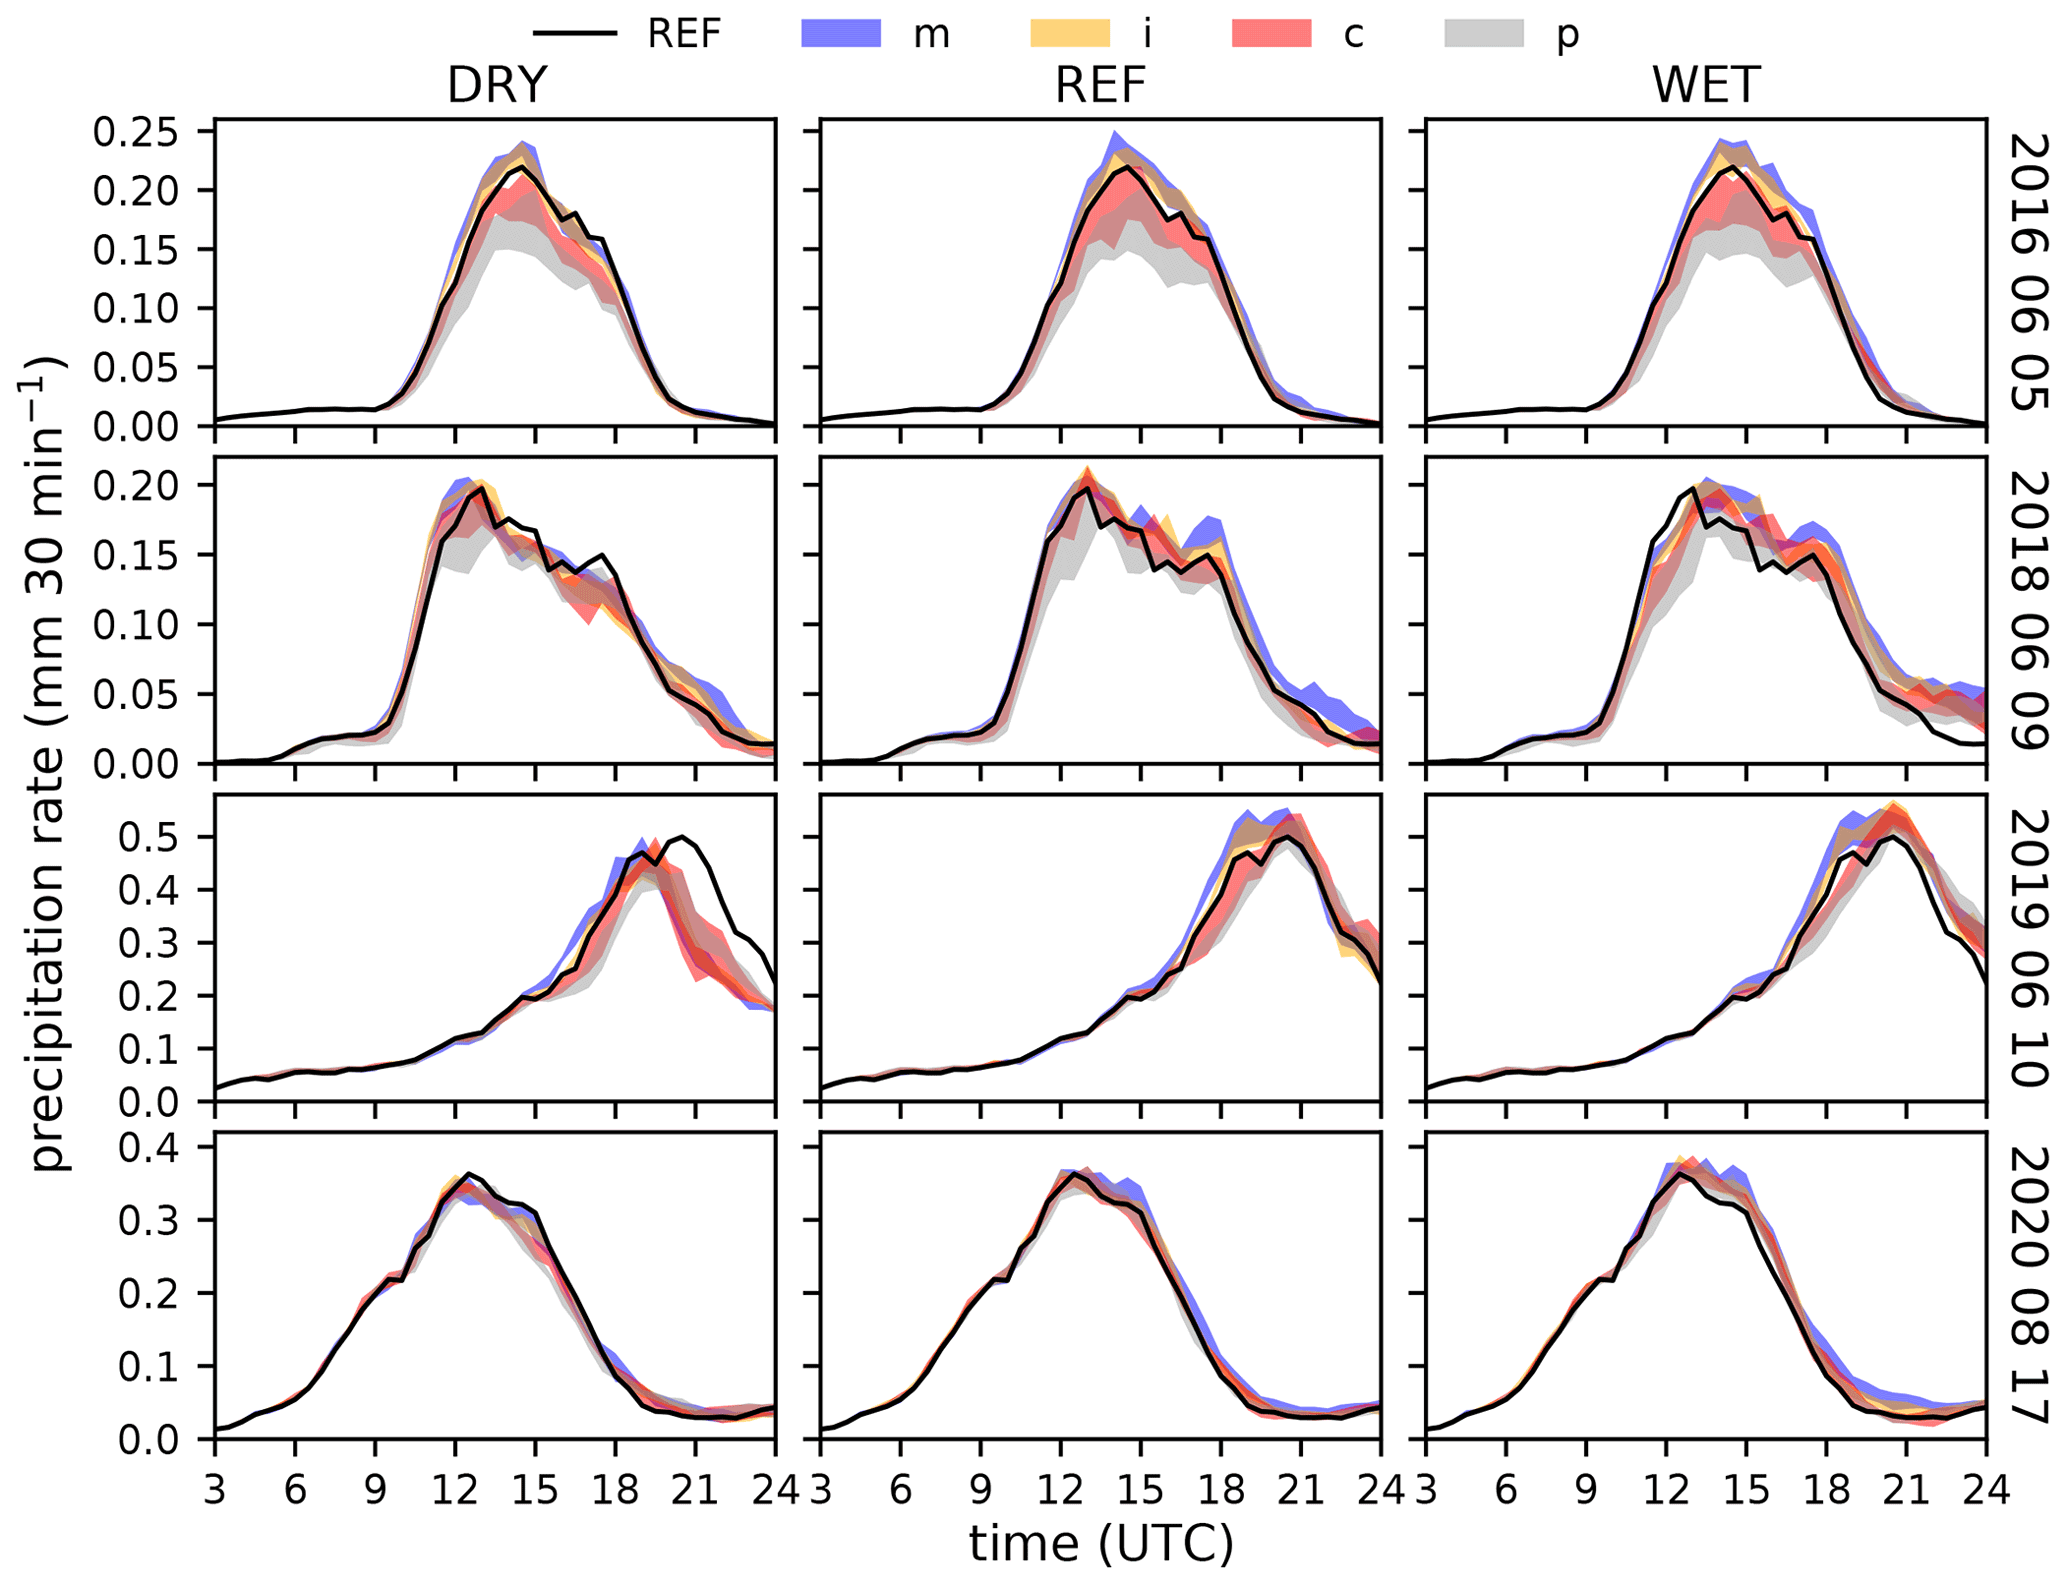
Figure 6Domain-averaged precipitation rates for weak forcing (rows 1 and 2) and strong forcing (rows 3 and 4) for dry (left), reference (middle), and wet soil conditions (right). The color-coded areas indicate the range between the minimum and maximum precipitation rate for all shape parameter sensitivities within one CCN concentration. Different colors indicate the four different CCN concentrations. The black lines indicate the respective reference runs with reference soil moisture, continental CCN concentration, and a shape parameter of 0.
The two strong forcing cases are characterized by larger mean rain intensities than the weak forcing cases as the ratio of rainy grid points is higher (see the precipitation distribution in Fig. 4). As the timing is again broadly similar and the spread in rain intensities is generally smaller, the total sensitivity to our perturbations is less than for weak forcing, in agreement with the findings for the total precipitation deviations (Fig. 5). For both strong forcing cases, a systematic soil moisture impact is present: the higher the soil moisture, the higher the maximum rain intensities, which is most likely a direct effect of the CAPE increase. In addition, maximum precipitation rates in the dry runs for 10 June 2019 occur 1–2 h earlier than in the reference run. The earlier decaying phase of convection is then responsible for the strong total precipitation reduction on that day. The case of 17 August 2020 shows increasing precipitation rates with higher soil moisture, although the increase is less pronounced than on 10 June 2019. Again, the largest precipitation rates are found for maritime CCN concentrations, and the spread with respect to different shape parameters remains small.
In order to quantify the ensemble spread, we computed the domain average of the grid-point-based normalized standard deviation Sn as follows (see, e.g., Keil et al., 2019):
Pi(x,y) denotes the hourly precipitation of member i, represents the ensemble mean hourly precipitation, and N is the ensemble size. The normalization of the spread is done in order to remove fluctuations that are due to the diurnal variation of precipitation. Besides an ensemble spread based on all 60 members, we also computed the spread induced by soil moisture, CCN, and the shape parameter individually. As only three soil moisture regimes are available for each identical CCN concentration and shape parameter, we used the bootstrapping method to randomly pick between different suitable combinations to calculate their normalized spread. This procedure was repeated 100 times. The results show that the area-averaged local precipitation variability introduced by varied CCN concentrations and shape parameters is rather similar (Fig. 7). This finding holds true for all days irrespective of the synoptic-scale forcing. For both uncertainties, the variability increases rapidly already in the first hours of the forecast, followed by a rather constant plateau until a further increase occurs in the afternoon at the peak of convective activity (see the rain rates in Fig. 6). In contrast to that, the variability due to soil moisture reveals a weaker increase early in the simulation and reaches similarly high values (or even higher ones on 9 June 2018) to CCN and shape parameter variability only around noon. In the afternoon, a similarly weak increase is simulated, as in the other types of uncertainty. Later, soil moisture variability remains slightly below the ones from the CCN and shape parameter. For a high-impact weather period of 2016, Keil et al. (2019) found that the spread induced by soil moisture was slightly larger than the one induced by different CCN concentrations in the afternoon. However, in their study soil moisture was perturbed by applying high-, low-, and band-pass filters to introduce surface perturbations, which is different from our approach of using a soil moisture bias. Figure 7 further reveals that the overall ensemble spread when accounting for all three uncertainties during the active convective period lies between 2.2 and 4.1. More importantly, the absolute values lie in the same range as the ones from the operational convective-scale COSMO ensemble prediction system with 20 members at that time (Keil et al., 2019). This indicates that the combination of different perturbations used in our study may be suitable for increasing the variability and reducing the underdispersion of convective precipitation and that this method should be evaluated against other sources of uncertainty.
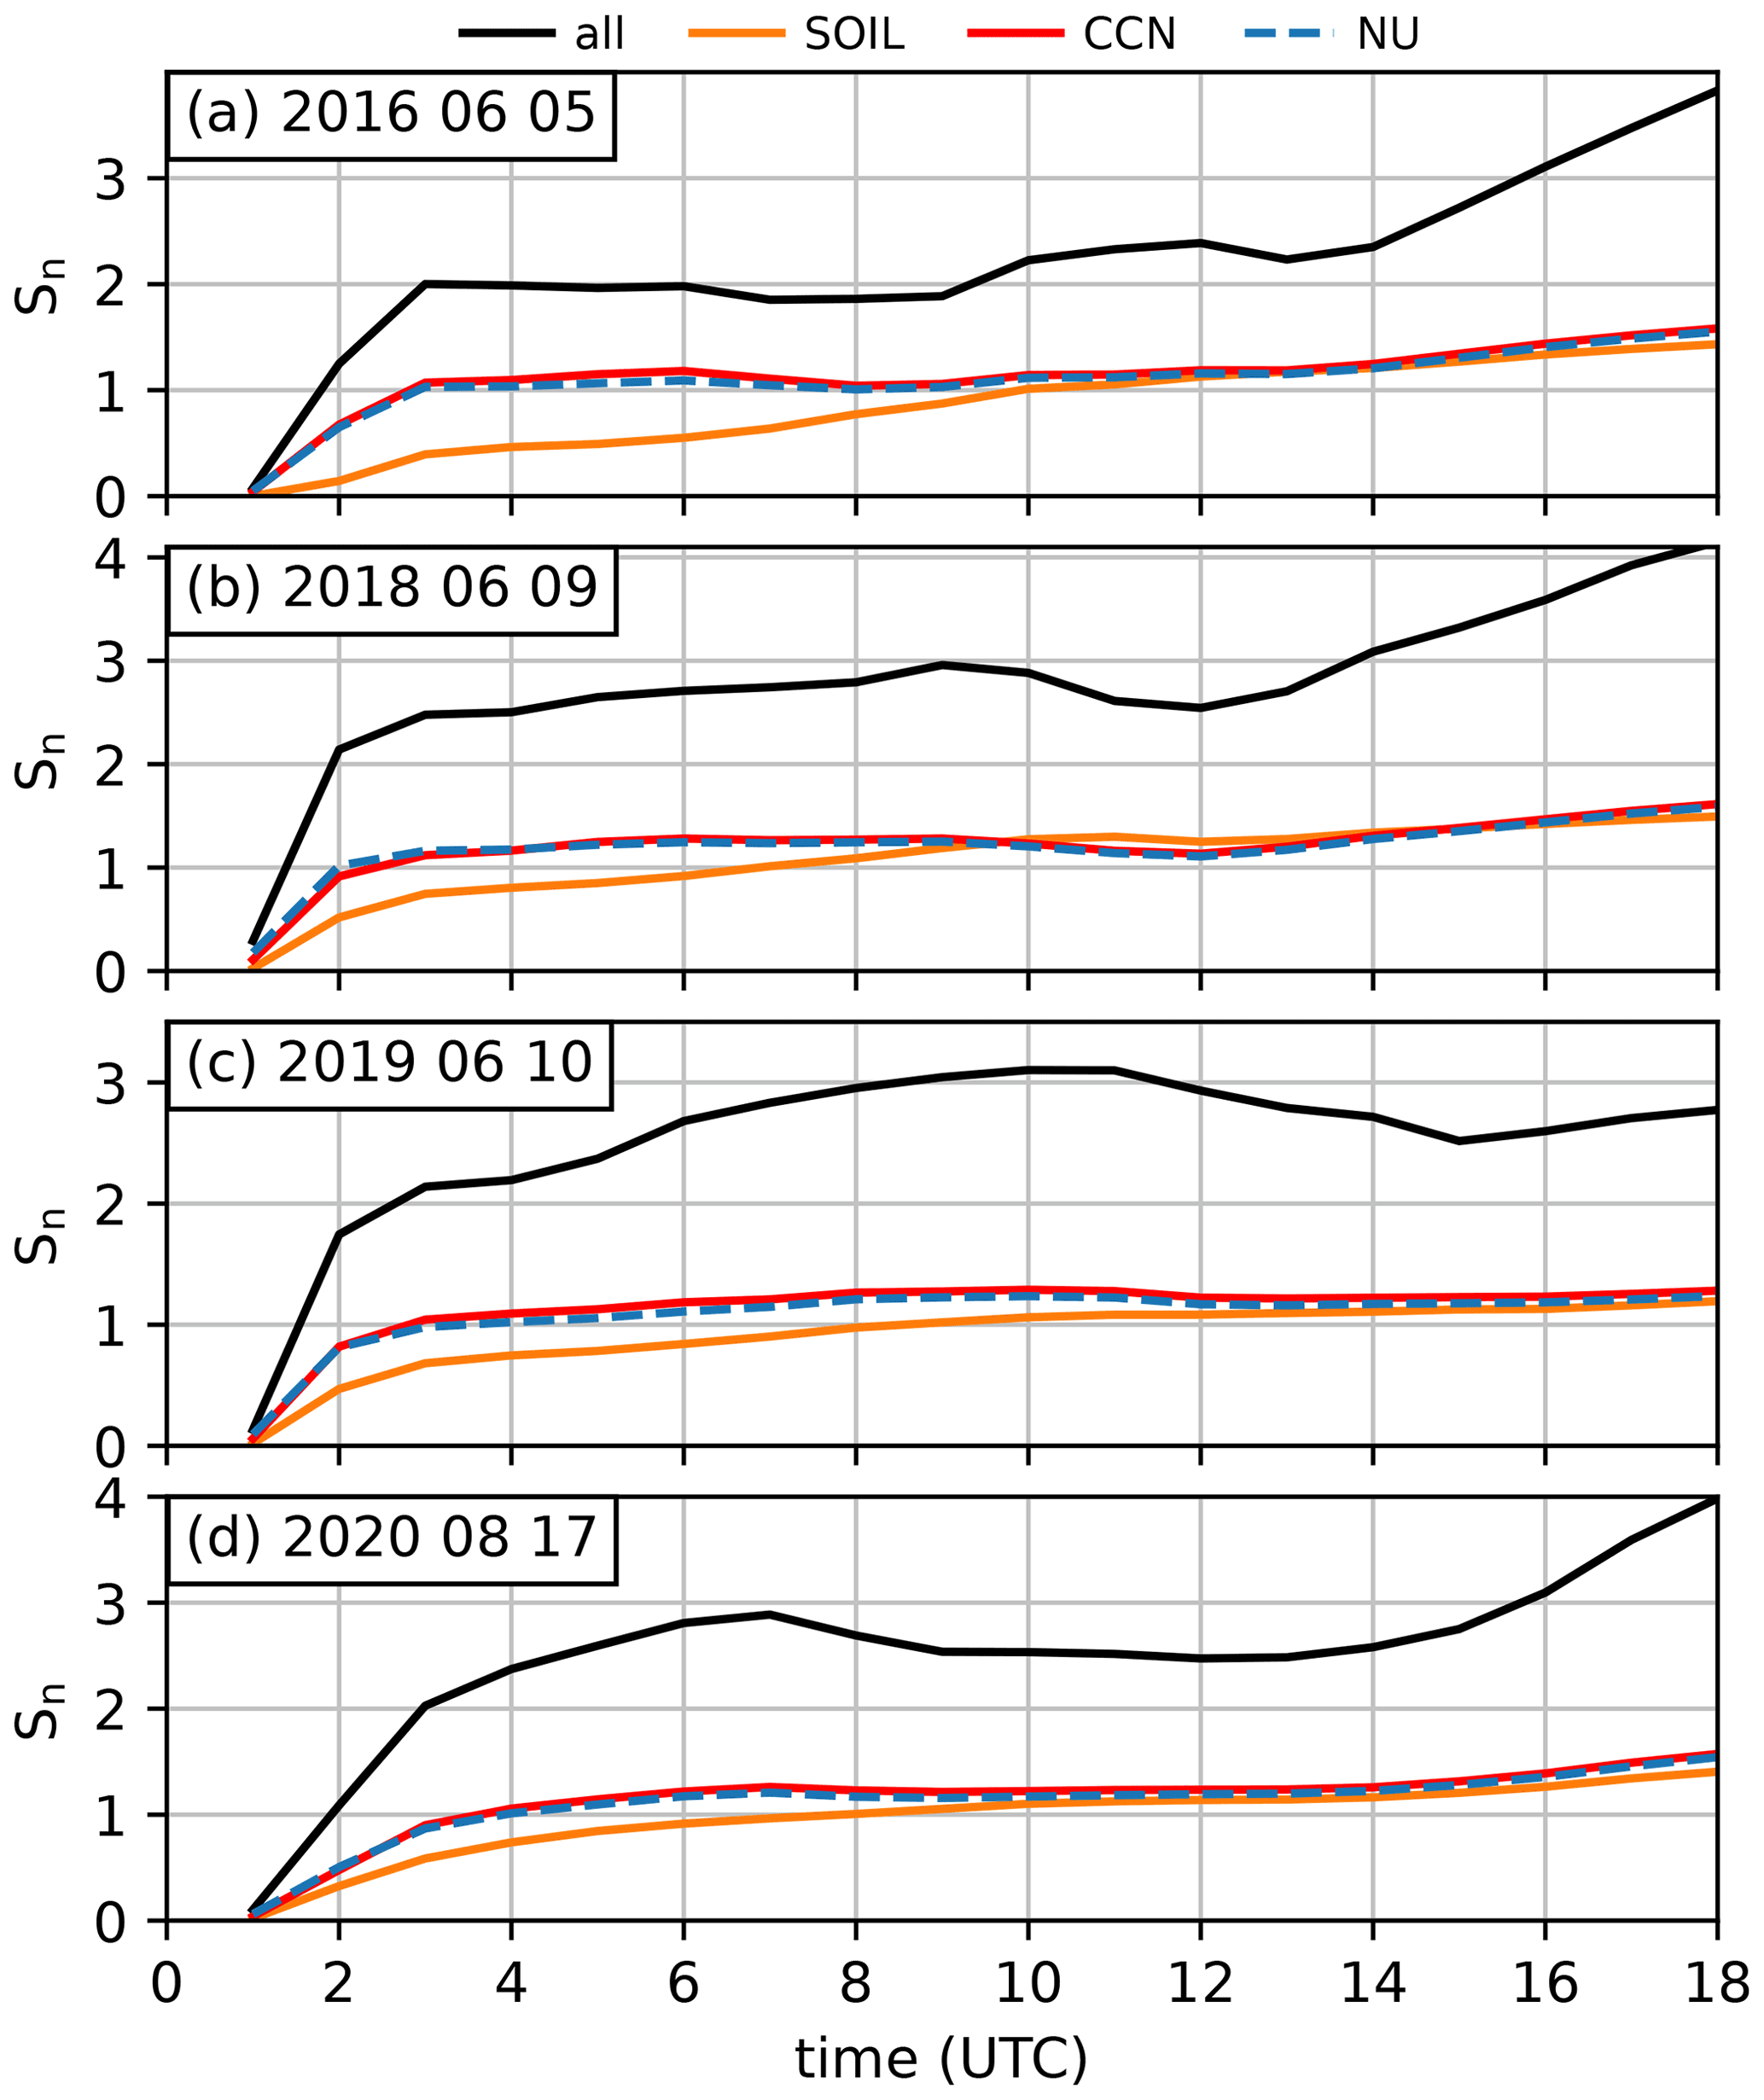
Figure 7Domain-averaged normalized ensemble spread Sn based on hourly precipitation amounts evaluated for different uncertainties (soil moisture SOIL, cloud condensation nuclei CCN, and shape parameter NU).
The spread of the model results and the impact of double and triple synergies have been demonstrated so far with precipitation deviations, precipitation intensities, and the normalized ensemble spread. Although the quantitative interpretation of nonlinear interactions is not the main focus of this study, we used the factor separation methodology of Stein and Alpert (1993) in order to understand how aerosols, the shape parameter, and soil moisture may interact synergistically. This methodology is a simple way of showing how multiple factors and their nonlinear interactions influence a predicted field and has been applied many times in the atmospheric sciences, e.g., for aerosol–cloud–land-surface interactions within tropical sea breeze convection (Grant and van den Heever, 2014) or for the effects of topography, convection, and latent and sensible heat fluxes on Alpine lee cyclogenesis (Alpert, 2011). For the four cases analyzed here, we find that the single impact of changing one parameter has a much weaker response than the double or triple synergies (not shown). Furthermore, all double synergies work to enhance accumulated precipitation, whereas all triple synergistic interactions reduce the precipitation, in agreement with findings from Grant and van den Heever (2014). The triple synergies are greater than the double synergies by a factor of approximately 3. Whereas the factor separation for the single impacts is always correlated with the rainfall difference compared to the respective reference run, the double and triple synergy terms rather represent the contributions of the synergistic interactions that occur. We must emphasize that synergy terms may not be meaningful for a field that has a finite range like total precipitation and when individual impacts of one parameter dominate the change in precipitation. Nevertheless, the results from the factor separation and ensemble spread shown before demonstrate the importance of considering synergistic effects for convective-scale predictability.
3.2 Hydrometeor contents and microphysical process rates
To understand the impact of our perturbations on the precipitation amount and timing, we now analyze vertically integrated hydrometeor contents (Fig. 8). We find a systematic increase in total cloud water with increasing CCN concentration and also with increasing shape parameters. This can be attributed to a reduced warm-rain process, which is in agreement with previous studies (e.g., Tao et al., 2012; Storer and van den Heever, 2013; Barthlott and Hoose, 2018; Barthlott et al., 2022). We find a strong systematic reduction in autoconversion and accretion rates with larger aerosols and larger shape parameters (not shown). Especially for maritime CCN concentrations, the impact on the autoconversion process is substantial and ranges from a more than 800 % increase with a low shape parameter to a 11 % increase for a shape parameter of 8 compared to the respective reference run. Interestingly, total cloud water contents are almost independent of the initial soil moisture. The spread of the runs with different shape parameters is larger for polluted environments. The impact of the microphysical uncertainties is substantial, with reductions of more than 50 % and increases of more than 150 %.
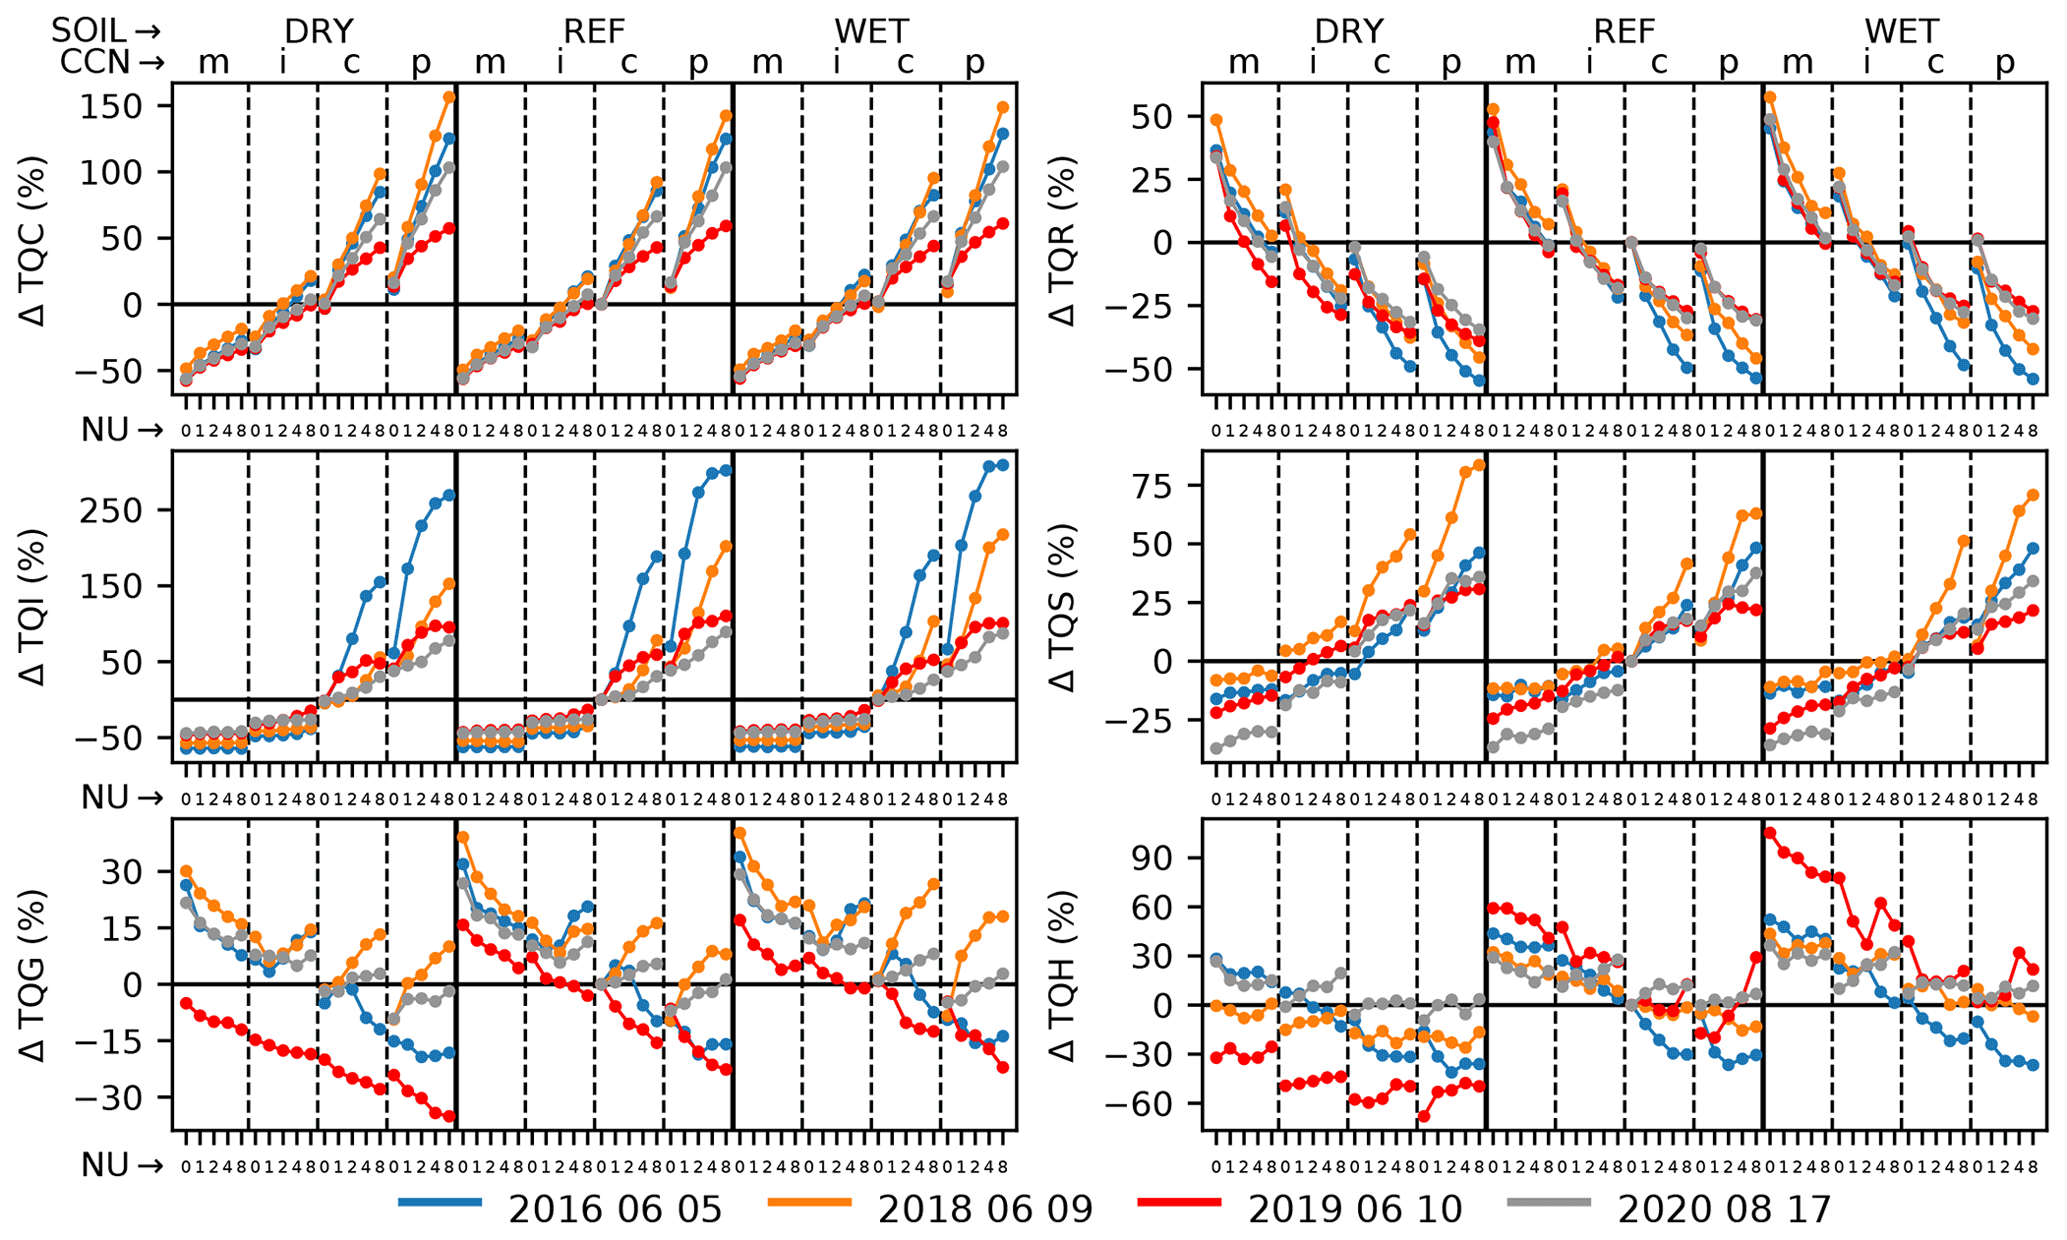
Figure 8Percentage deviations from the respective reference runs of spatiotemporal averages of total cloud water (TQC), rainwater (TQR), ice (TQI), snow (TQS), graupel (TQG), and hail (TQH). Data points are arranged as in Fig. 5.
For total rainwater, we find an opposite behavior to that of cloud water, namely, a systematic negative response to higher CCN concentrations and shape parameters. In contrast to cloud water, the spread of shape parameter runs is rather similar in all CCN regimes. The overall response is smaller than for cloud water but still large and ranges between −55 % and +58 % compared to the reference run. There is also a very weak sensitivity to soil moisture but with positive and negative relationships depending on the day and specific configuration. An important finding is the fact that the percentage range is rather similar for different CCN concentrations and different shape parameters, indicating that the CCN concentration and the shape parameter are equally important for total rainwater deviations. For both cloud water and rainwater, the weak forcing cases show a stronger sensitivity than the ones with strong synoptic forcing.
The total ice content increases with higher CCN concentrations but shows a remarkable feature: for rather clean environments (i.e., maritime and intermediate runs), the total ice content is not sensitive to different shape parameters and remains constant in all runs with the respective CCN concentrations. Only the intermediate CCN concentration with large shape parameters of ν=8 shows a weak increase in total ice. With larger aerosol amounts, there is also a strong dependence of the ice content on the shape parameter. The strongest increase is simulated for polluted environments, with an increase of +66 % to +309 % on 5 June 2016 compared to the reference run. The positive relationship with the aerosol content was also found by Barthlott et al. (2022) and is probably related to the larger water load at higher levels caused by the reduced warm-rain process. The independence of the ice content from varied shape parameters in cleaner environments can be explained by the response of heterogeneous and homogeneous freezing rates to our perturbations. We find that, in all cases, there is almost no dependence of homogeneous freezing with varied shape parameters, whereas under continental and polluted conditions, a strong sensitivity exists (not shown). Heterogeneous freezing, although mostly much smaller than homogeneous freezing, only reveals a small sensitivity to different shape parameters in clean environments. We therefore conclude that smaller amounts of supercooled liquid water with a broad size distribution in cleaner environments are less susceptible to the impact of narrowing the size distribution with varied shape parameters.
The total snow content generally increases with larger aerosol loads and also shows a weak increase to larger shape parameters at maritime and intermediate CCN concentrations. The spread of the different shape parameter runs increases with CCN concentrations. The overall response is smaller than the one from ice, i.e., −37 % to +84 %. Both the ice and the snow content are rather independent of the initial soil moisture assumption.
A more complex response is simulated for the total graupel content. For 10 June 2019, the model simulates an increase with soil moisture, an increase with CCN concentration, but a mostly systematic decrease with increasing shape parameters. The remaining three cases show a weak response to soil moisture only and, especially at higher CCN concentrations, also an increase with larger shape parameters. Similar results were found by Barthlott et al. (2022), where some of the days show a graupel increase and others a decrease with narrower CDSD. Comparing the absolute graupel contents of the cases analyzed reveals that the case of 10 June 2019 has a much larger graupel content than the remaining three cases. Some of the cases show a decrease in graupel mass for maritime CCN conditions and an increase for higher CCN concentrations. This can be attributed to graupel/hail riming with cloud droplets, which increases with larger shape parameters for already narrower size distributions (not shown). Overall, the total graupel content exhibits a smaller response than snow (−35 % to +40 %). The total hail content shows a strong response to soil moisture for the case of 10 June 2019 and a weaker but still positive response for the remaining three cases. The CCN impact is mostly negative: only some runs with larger shape parameters reveal an increase in polluted environments. The impact of larger shape parameters is weaker than the one from CCN and is mostly negative or neutral.
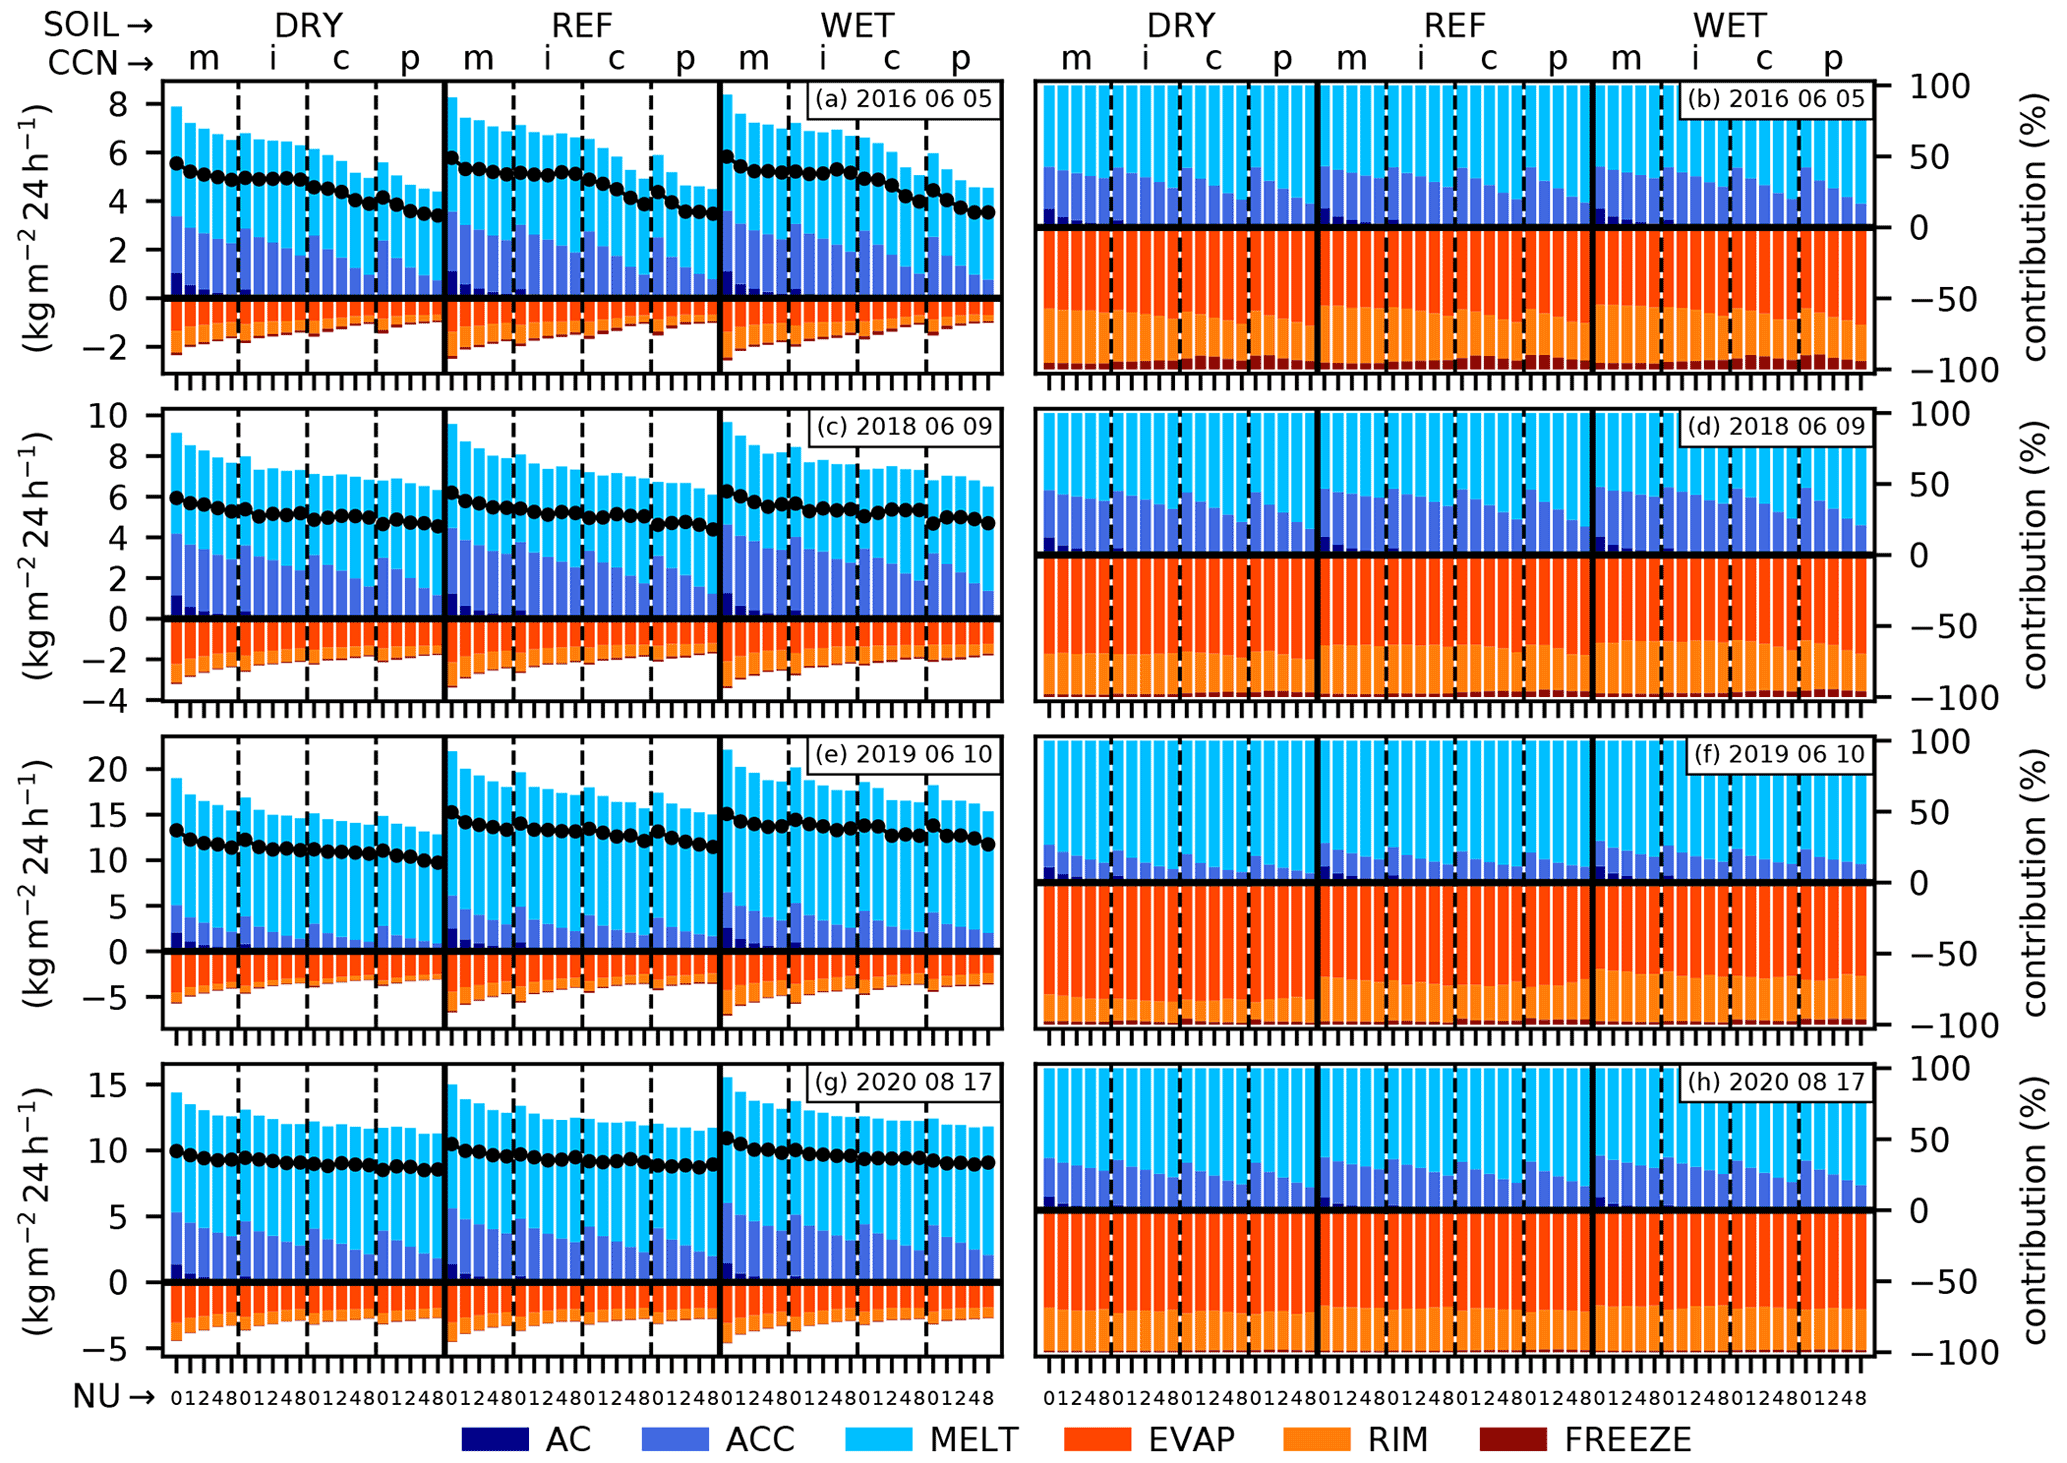
Figure 9Rainwater budget (a, c, e, g) with sources from autoconversion (AC), accretion (ACC), melting (MELT), and sinks from evaporation (EVAP), riming (RIM), and rain freeze (FR), with black points indicating the overall budget (i.e., sources minus sinks) and percentage contributions (b, d, f, h) of individual process rates to sources and sinks, respectively. Bars are arranged as the data points in Fig. 5.
It is now of interest to study the contribution of individual microphysical processes to the production and loss of rainwater and to analyze the sensitivity to and the magnitude of the perturbations applied in this paper. We therefore computed a rainwater budget (B) that consists of the sources autoconversion (AC), accretion (ACC), and melting (MELT) and sinks from evaporation (EVAP), riming (RIM), and rain freeze (FR) as follows:
We apply Eq. (4) to domain averages of vertically integrated and time-accumulated process rates (Fig. 9). It can be seen that the melting of frozen hydrometeors dominates the contribution to rainwater production and always has a contribution of more than 50 %. For the strong forcing case of 10 June 2019, its contribution is even larger (over 70 %) than on the other days, as the total absolute solid hydrometeor contents (ice, snow, graupel, hail) are the largest of all the cases (not shown). Accretion possesses the second-largest contribution for rain formation. Melting and accretion reveal an opposing response to increased shape parameters: the contribution of melting increases with larger shape parameters, whereas the one from accretion decreases. This highlights the greater importance of cold-rain processes when the warm-rain process is reduced. The contribution of autoconversion is minor in all the cases. Only with maritime CCN concentrations is there a larger contribution of autoconversion to rainwater formation from 9 % to 13 % for low shape parameters (broad CDSD). With higher shape parameters, its contribution rapidly decreases to 3 % to 5 %. For the remaining higher CCN concentrations, the contribution of autoconversion is negligible. The absolute values of the sum of the source terms decrease with increasing CCN concentrations as well as with increasing shape parameters. The relative change is higher for CCN differences, as for different shape parameters.
The dominant sink term in our budget analysis is rain evaporation, followed by riming. The freezing of rain is below 5 % for both strong forcing cases and on 9 June 2018, but on 5 June 2016, the contribution is larger (4 %–11 %). The response of the relative contributions from evaporation and riming to CCN and shape parameters is rather weak and nonsystematic. The absolute values of riming decrease in a systematic way with increasing CCN concentrations but show no systematic reaction to variations in the shape parameter. The response of raindrop evaporation reveals a feature already found in earlier work (e.g., Barthlott et al., 2022): total evaporation rates are highest for clean environments and systematically decay with both increasing CCN and larger shape parameters. The combined effect of high aerosol loads with narrower size distributions by larger shape parameters can lead to an evaporation increase of 57 % and a 30 % reduction compared to the reference simulation. This large effect can be related to the raindrop size distribution. As the aerosol concentration and shape parameter are increased, the size distribution shifts to populations of raindrops that are fewer in number but larger in size, and evaporation is reduced due to the smaller surface area of large raindrops relative to their volume (see, e.g., Storer et al., 2010; Barthlott et al., 2017). The sum of all source terms decreases with increasing CCN concentrations and larger shape parameters. However, as the sink terms also reveal a reduction in magnitude, the net rainwater budget is reduced less than expected from the reduced source terms. We also see a weak positive soil moisture impact which was already apparent in the analysis of the surface rain amounts (Fig. 5).
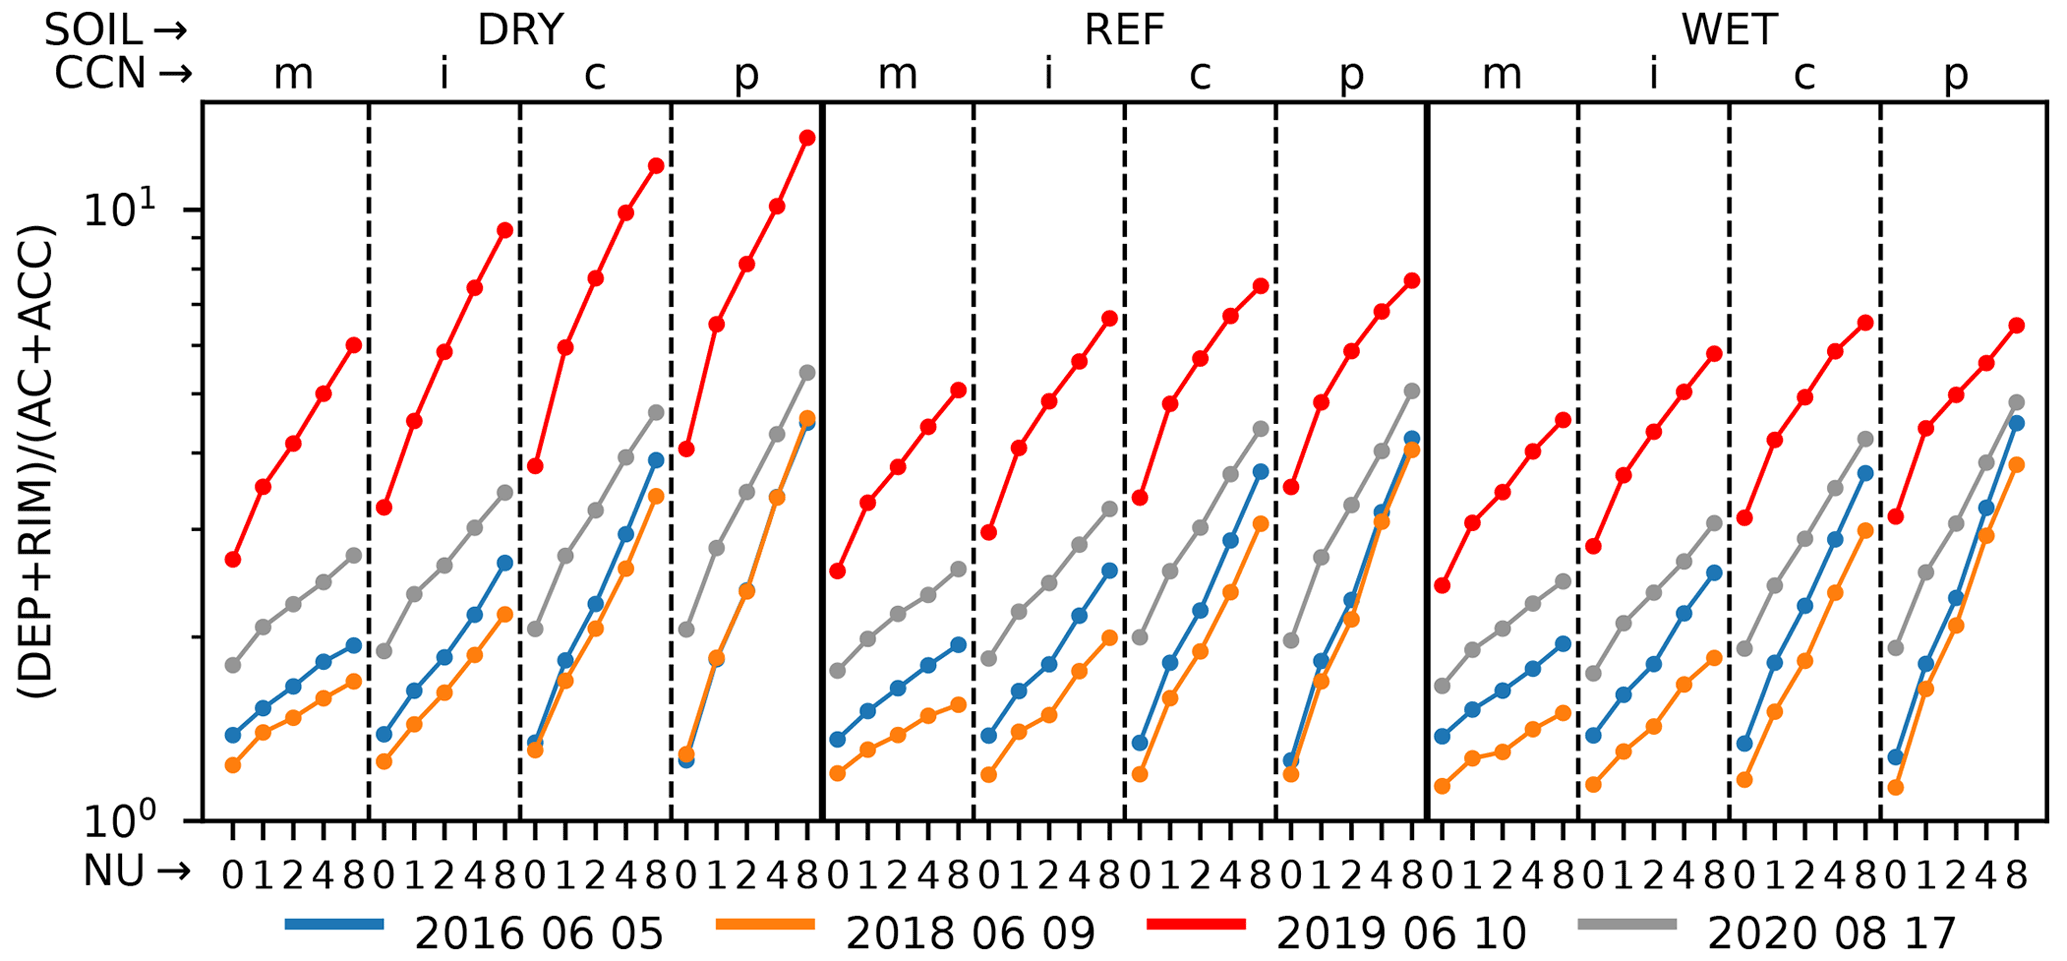
Figure 10Ratio of cold-rain formation (deposition DEP and riming RIM) to warm-rain formation (autoconversion AC and accretion ACC). Data points are arranged as in Fig. 5.
It is also of interest to assess the relative role of warm-rain and cold-rain processes and how they depend on the microphysical and land-surface uncertainties applied in this study. Therefore, we inspect the ratio of cold-rain formation (vapor deposition and riming) to warm-rain formation (autoconversion and accretion) integrated over the entire simulation time (Fig. 10). Our simulations show that, on average, the cold-rain contribution dominates the rain formation for all days. In agreement with the reduction in autoconversion and accretion documented earlier, the relative role of the processes via the ice phase increases with larger shape parameters and increased CCN concentrations. It is also evident that the higher the CCN concentration, the larger the response to varied shape parameters. For example, on 6 June 2018, the shape-parameter-induced increase in the maritime environment is from a ratio of 1.38 to 1.94 (increase factor 1.41), whereas in the polluted environment, the increase is from 1.26 to 4.48 (increase factor 3.6) in the runs with drier soil moisture. The higher shape parameter sensitivity in polluted conditions was also seen, e.g., for total hydrometeor contents (see Fig. 8). As expected, the case with the highest ice water path (10 June 2019) shows the largest ratio of cold-rain to warm-rain formation of all analyzed cases. The ratios found with our ICON simulations lie in a similar range to previous COSMO simulations using the same two-moment microphysics scheme (Barthlott and Hoose, 2018; Baur et al., 2022).
3.3 Impact on latent heat release and updraft velocities
Microphysical processes have an impact on atmospheric dynamics, in particular via the release of latent heat during condensation, deposition, riming, or freezing. Latent heat release in regions of precipitation is considered to be the prime mechanism for the upscale growth of small errors affecting the predictability of convective systems (e.g., Selz and Craig, 2015). Whereas the relative role of cold-rain processes increases with narrower size distributions (see Fig. 10), the absolute values are declining (see the budget analysis in Sect. 3.2). This is the reason why the release of latent heat shows an opposing response to the ratio of cold-rain to warm-rain formation (Fig. 11a). For maritime CCN concentrations, the model simulates a mostly systematic decreasing latent heat release. There is not much of a sensitivity of the latent heat release to different shape parameters in the intermediate CCN regime, and for larger aerosol loads (continental, polluted), the shape parameter sensitivity is case-dependent, where either an increase or a decrease is simulated. Compared to the respective reference run, the magnitude of the latent heat response is quite large and ranges between −19.4 % and +24.5 %. There is also a weak positive soil moisture response for most cases, with again the strong forcing case of 10 June 2019 showing the strongest impact.
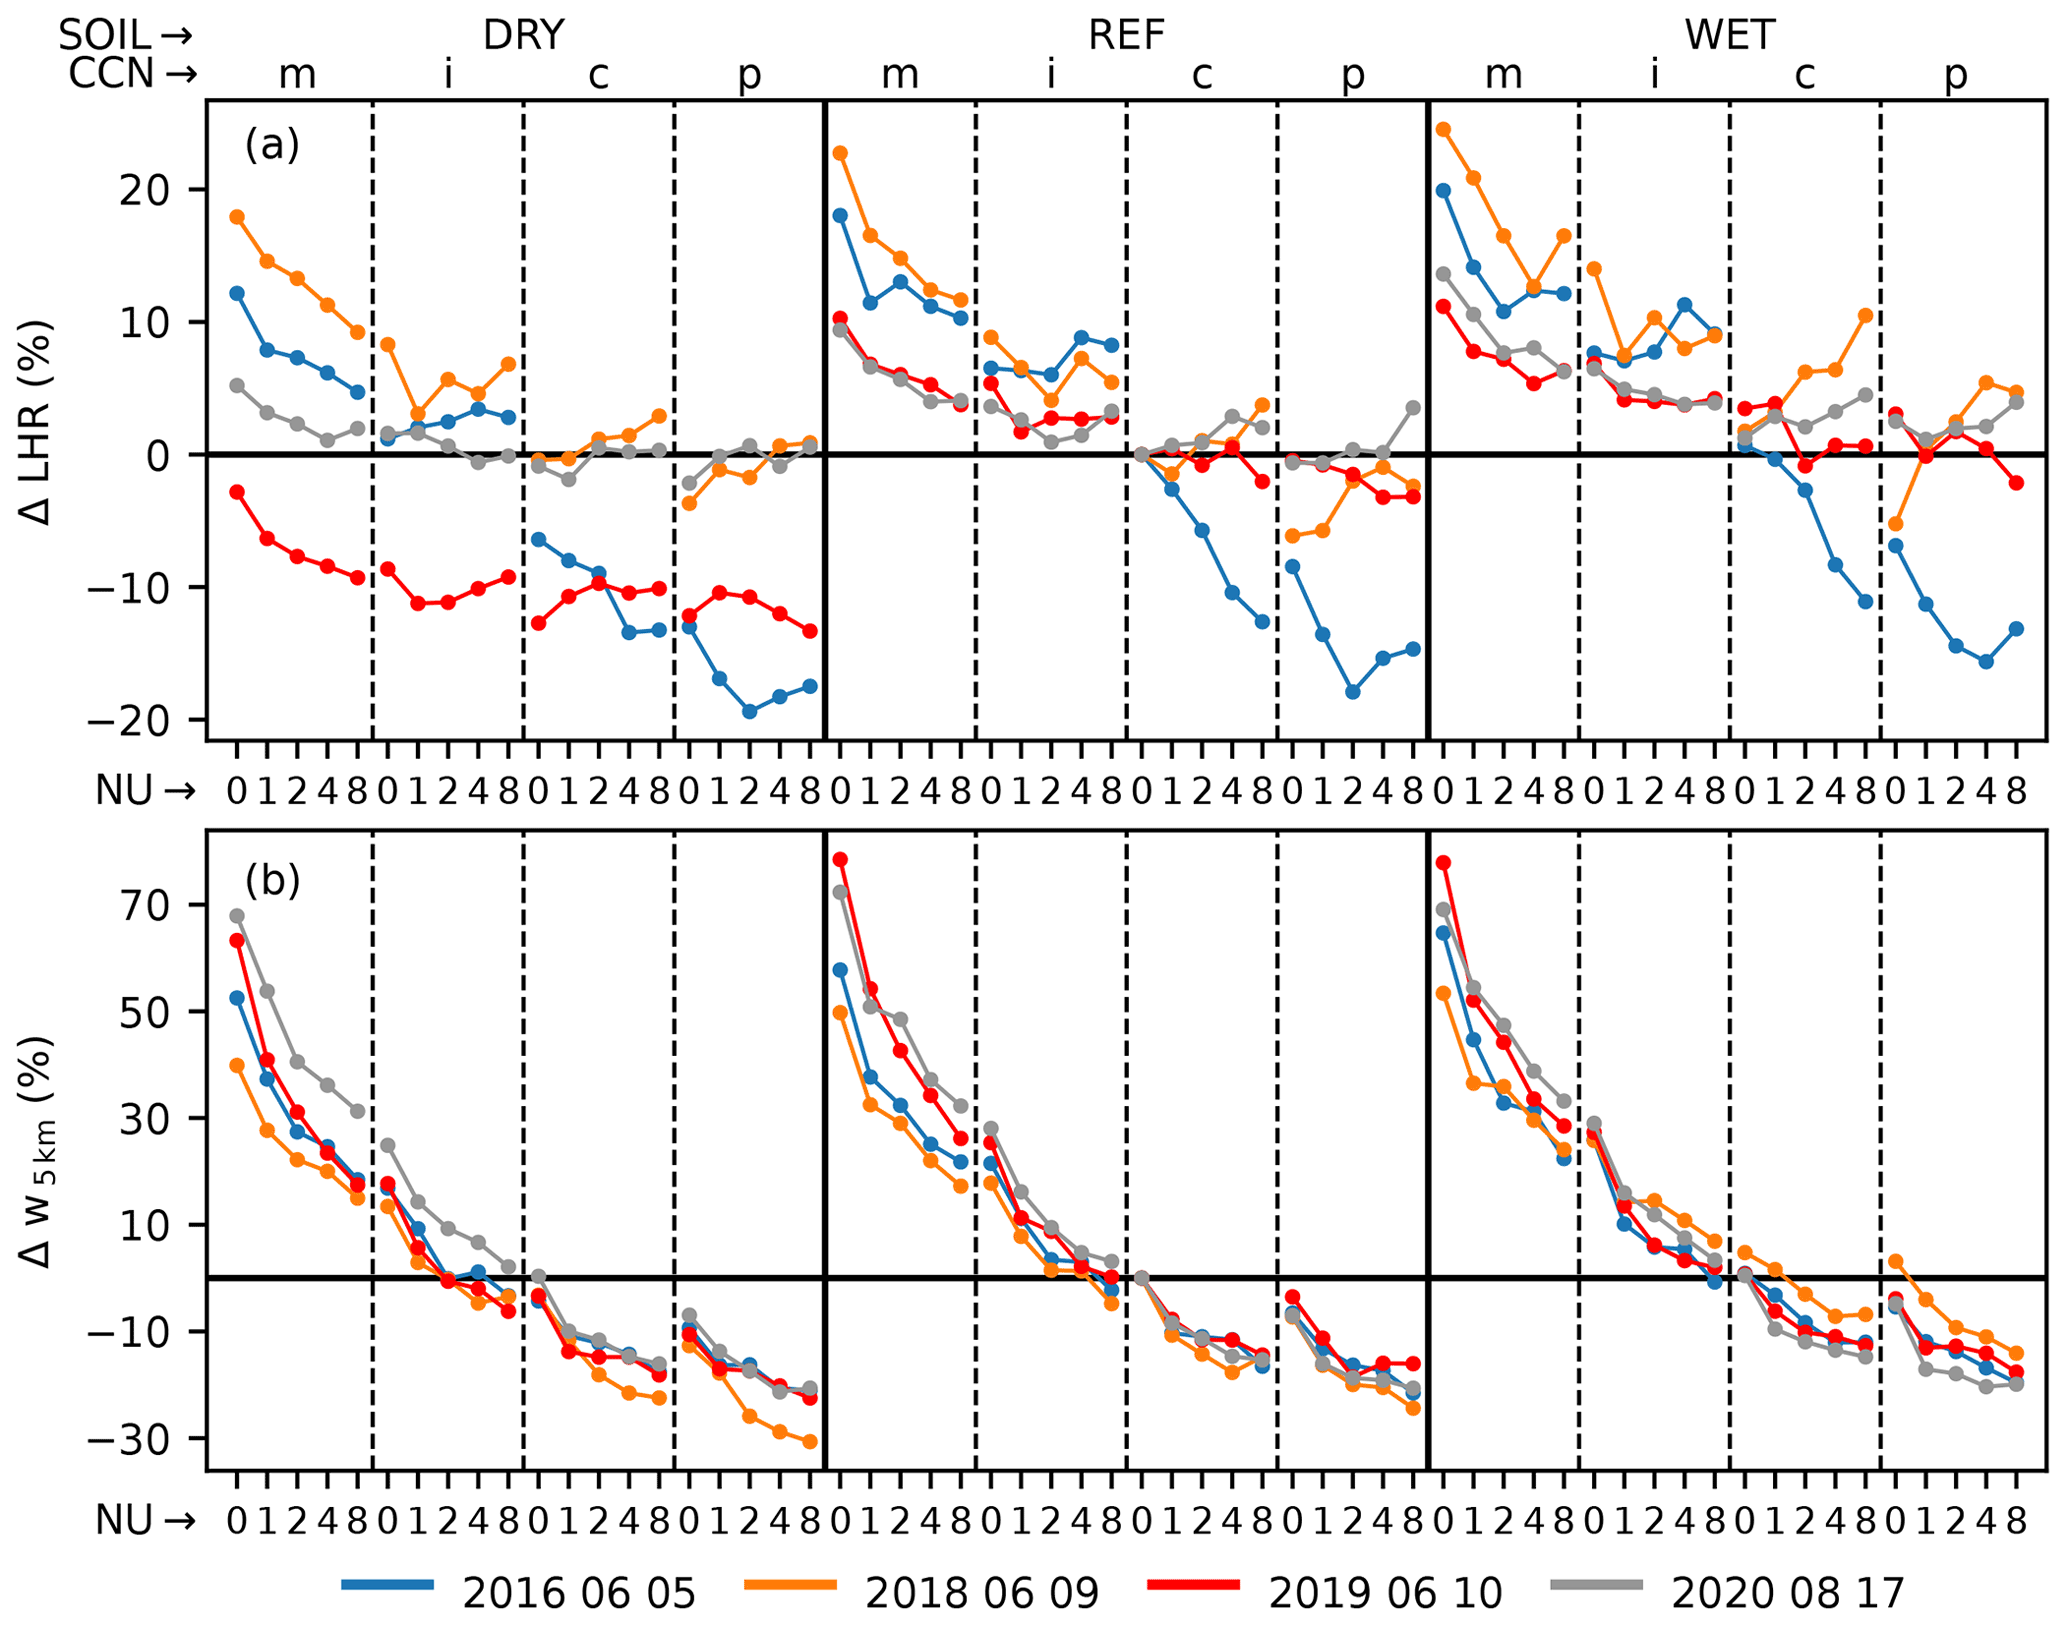
Figure 11Percentage deviations of latent heat release (LHR) (a) and deviations of updraft velocities w at 5 km a.m.s.l (b). The latter were calculated for cloudy grid points only, for which vertically integrated total cloud water content is larger than 0.3 kg m−2. Data points are arranged as in Fig. 5.
To study the impact on the dynamics, we computed spatiotemporal averages of updraft velocities (i.e., only positive values were accounted for) for cloudy grid points defined with a total cloud water content larger than 0.3 kg m−2 (Fig. 11b). For this analysis we selected the vertical updrafts at a height of 5 km a.g.l. because mean profiles reveal a systematic response of updraft velocities throughout the entire troposphere and the maximum differences between different aerosol loads occur between 5 and 6 km a.g.l. The largest updraft velocities occur for maritime CCN concentrations and low shape parameters. The mean updraft speeds then decline with larger aerosol loads. For almost all analyzed cases, the updraft strength also declines with larger shape parameters. The impact is larger in clean environments, irrespective of the initial soil moisture assumption. Compared to the reference simulation, the differences are substantial (+78 % to −31 %). The decline of updraft strength mostly follows the decline of latent heating, but at continental and polluted CCN concentrations, there are some cases that are not correlated well. However, the overall correlation of all data points within one soil moisture regime is still very high and ranges between 0.81 and 0.9 (not shown). As in previous studies with the ICON model (Barthlott et al., 2022), there is no CCN-induced convective invigoration as the updraft strength always declines with increasing CCN concentrations. In contrast to the theory suggested by Rosenfeld et al. (2008), the higher number concentrations of cloud droplets and the larger water load in the mixed-phase region do not increase latent heating in our simulations. Thus, updrafts are less buoyant and convection is not invigorated. However, the validity of the invigoration hypothesis remains open as there are contradictory results depending on the details of the microphysics scheme, the environmental conditions, or the cloud type (e.g., Altaratz et al., 2014; van den Heever et al., 2011; Fan et al., 2017). A recent study of Igel and van den Heever (2021) used theoretical calculations to demonstrate that a CCN-induced increase in storm updraft velocity is theoretically possible but much smaller (and often negative) than earlier calculations suggested.
The purpose of this study was to quantify the individual and collective effects of land-surface and microphysical uncertainties and to assess their impacts on convective-scale predictability. We therefore constructed a 60-member ensemble with the ICON model for four cases with different synoptic-scale forcing. The ensemble consists of combined perturbations of varied aerosol concentrations (maritime to polluted), different shape parameters of the cloud droplet size distribution (0–8), and different initial soil moisture conditions (dry and wet bias). We find a systematic positive soil moisture–precipitation feedback for all cases, independent of the type of synoptic forcing as a result of higher instability. The precipitation response to different CCN concentrations and the shape parameter is stronger for weak forcing than for strong forcing, in agreement with previous studies (e.g., Schneider et al., 2019; Keil et al., 2019; Barthlott et al., 2022). While the days with weak forcing show a systematic decrease in precipitation as the aerosol load increases, days with strong forcing also show nonsystematic responses for some shape parameter values. For weak forcing, the response to the shape parameter is small for maritime and intermediate CCN concentrations but becomes much larger in polluted environments. On the other hand, the shape parameter impact remains generally small in all soil moisture and CCN concentration regimes for the strong forcing cases, and no systematic effect on precipitations totals can be identified. Based on the magnitude of the total precipitation response ranging between −16.4 % and +11.5 % for strong forcing and between −23 % and +18 % for weak forcing, we conclude that the uncertainties investigated here and, in particular, their collective effects are highly relevant for quantitative precipitation forecasting of summertime convection in central Europe. These values gain even more importance if we consider that they are mean values over a large area and that the location and intensity of precipitation certainly vary locally, with further implications for hazard assessments of convective storms. In some cases, we also find compensating effects of different disturbances. For example, the enhanced warm-rain process in clean environments can offset the CAPE reduction for drier soils and lead to an increase in precipitation compared to the reference run.
The analysis of the cloud fraction and rain intensities revealed that the overall timing of convection is not sensitive to the microphysical perturbations applied in this study. From this it can be concluded that different rain amounts are only caused by stronger or weaker rainfall intensities. The maximum rain intensities are higher for clean environments with a broad drop size distribution. An important finding is the fact that the combined ensemble spread when accounting for all three uncertainties lies in the same range as the ones from the operational convective-scale COSMO ensemble prediction system with 20 members determined in previous studies (Keil et al., 2019). Similarly, the factor separation methodology showed a larger impact of triple synergies on the simulation results compared to double synergies or single impacts, which demonstrates the importance of considering synergistic effects for convective-scale predictability. To our knowledge, only Grant and van den Heever (2014), Park and van den Heever (2022), and Baur et al. (2022) have studied synergistic effects of aerosols and soil moisture so far. Grant and van den Heever (2014) conducted idealized cloud-resolving simulations of tropical sea breeze convection and found precipitation reductions by over 40 % and 50 % for the most extreme perturbations. Park and van den Heever (2022) performed two large idealized 130-member ensembles that represent different initial conditions typical of tropical sea breeze environments in which they simultaneously perturbed six atmospheric and four surface parameters. Comparisons of the clean and polluted ensembles demonstrated that aerosol direct effects reduce the incoming shortwave radiation as well as the outgoing longwave radiation within the polluted ensemble and that enhanced aerosol loading results in a weakening of the convection initiated along the sea breeze front. The realistic convection-resolving simulations of Baur et al. (2022) were conducted for a single case study only, but they found a similar sensitivity of precipitation deviations to this study (−23 % and +10 %).
The analysis of vertically integrated hydrometeor contents shows a strong systematic increase in total cloud water content with increasing CCN concentrations and larger shape parameters along with a decrease in total rainwater content. This could be attributed to a systematic decrease in the warm-rain processes of autoconversion and accretion. The impact of the microphysical uncertainties is substantial, with variations in total cloud water ranging between −50 % and +150 % and in rainwater between −55 % and +58 % compared to the reference run. Interestingly, cloud ice is insensitive to shape parameter variations in clean environments, whereas the CCN-induced ice increase is fostered with larger shape parameters in polluted environments. It is hypothesized that the smaller amounts of supercooled liquid water with a broad size distribution in cleaner environments are less susceptible to the impact of narrowing the size distribution with the shape parameter. The results from a rainwater budget analysis revealed that melting of frozen hydrometeors is dominating the rain production, followed by accretion and an only minor contribution from autoconversion. Whereas the contribution of melting increases with larger shape parameters, the one from accretion decreases. This opposing response highlights the greater importance of the cold-rain processes when the warm-rain process is reduced. The evaporation of raindrops proved to be by far the most important sink term, with the largest values occurring in clean environments with broad size distributions. Larger aerosol loads and/or higher shape parameters lead to raindrop distributions that are larger in size and therefore less susceptible to evaporation. The sum of all source terms decreases with increasing CCN concentrations and larger shape parameters. The relative change is larger for CCN differences than for various shape parameters. However, because the sink terms also show a decrease in magnitude, the net rainfall budget is reduced less than expected due to the reduced source terms.
Finally, our results also showed a dominant cold-rain process for all cases and a stronger relative role of processes via the ice phase for larger shape parameters and increased CCN concentrations. Compared to the respective reference run, the magnitude of latent heat response is quite large and ranges between −19.4 % and +24.5 %. Consistent with previous work with the ICON model (Barthlott et al., 2022), there is no CCN-induced convection invigoration, with updrafts being less buoyant when the CCN concentration is increased.
Our findings demonstrate that aerosols and the shape parameter of the CDSD are both important for quantitative precipitation forecasting. Especially the concept of combined perturbations based on realistic parameter perturbations in combination with soil moisture heterogeneities can provide a good ensemble spread. This indicates that the combination of different perturbations used in our study may be suitable for ensemble forecasting and that this method should be evaluated against other sources of uncertainty. The first efforts in this direction were made by Matsunobu et al. (2022), who investigated the relative importance of microphysical uncertainties for cloud and precipitation forecasts implemented in an ICON-D2 ensemble prediction system on different spatial and temporal scales for five real cases in central Europe. Given the overall large impact of uncertainties due to aerosols and the shape parameter identified in this work, the use of a stochastically perturbed parameter (SPP) scheme for these microphysical uncertainties could be beneficial and should be pursued in future work.
ICON model output is available on request from the authors.
CB and CK developed the project idea and designed the numerical experiments. AZ performed the numerical simulations. CB and AZ conducted the analyses, TM calculated the convective adjustment timescale, and all contributed to the interpretation of the results. CB wrote the paper, with contributions from all the co-authors.
The contact author has declared that none of the authors has any competing interests.
Publisher’s note: Copernicus Publications remains neutral with regard to jurisdictional claims in published maps and institutional affiliations.
The research leading to these results has been done within subproject B3 of the Transregional Collaborative Research Center SFB/TRR 165, “Waves to Weather” (http://www.wavestoweather.de, last access: 25 August 2022) funded by the German Research Foundation (DFG). The authors wish to thank the German Weather Service (DWD) for providing the ICON model code and the initial and boundary data. This work was performed on the ForHLR supercomputer funded by the Ministry of Science, Research and the Arts Baden-Württemberg and by the Federal Ministry of Education and Research.
This research has been supported by the Deutsche Forschungsgemeinschaft (project B3 of the Transregional Collaborative Research Center SFB/TRR 165, “Waves to Weather”, project ID 257899354 – TRR 165).
This paper was edited by Yuan Wang and reviewed by two anonymous referees.
Albrecht, B. A.: Aerosols, cloud microphysics, and fractional cloudiness, Science, 245, 1227–1230, https://doi.org/10.1126/science.245.4923.1227, 1989. a
Alpert, P.: Meso-meteorology: Factor separation examples in atmospheric meso-scale motions, Factor Separation in the Atmosphere: Applications and Future Prospects, edited by: Alpert, P. and Sholokhman, T., Cambridge University Press, 53–66, https://doi.org/10.1017/CBO9780511921414.007, 2011. a
Altaratz, O., Koren, I., Remer, L., and Hirsch, E.: Review: Cloud invigoration by aerosols–Coupling between microphysics and dynamics, Atmos. Res., 140–141, 38–60, https://doi.org/10.1016/j.atmosres.2014.01.009, 2014. a, b
Barthlott, C. and Barrett, A. I.: Large impact of tiny model domain shifts for the Pentecost 2014 mesoscale convective system over Germany, Weather Clim. Dynam., 1, 207–224, https://doi.org/10.5194/wcd-1-207-2020, 2020. a
Barthlott, C. and Hoose, C.: Spatial and temporal variability of clouds and precipitation over Germany: multiscale simulations across the “gray zone”, Atmos. Chem. Phys., 15, 12361–12384, https://doi.org/10.5194/acp-15-12361-2015, 2015. a
Barthlott, C. and Hoose, C.: Aerosol effects on clouds and precipitation over central Europe in different weather regimes, J. Atmos. Sci., 75, 4247–4264, https://doi.org/10.1175/JAS-D-18-0110.1, 2018. a, b, c, d, e
Barthlott, C. and Kalthoff, N.: A Numerical Sensitivity Study on the Impact of Soil Moisture on Convection-related Parameters and Convective Precipitation over Complex Terrain, J. Atmos. Sci., 68, 2971–2987, https://doi.org/10.1175/JAS-D-11-027.1, 2011. a, b, c
Barthlott, C., Mühr, B., and Hoose, C.: Sensitivity of the 2014 Pentecost storms over Germany to different model grids and microphysics schemes, Q. J. Roy. Meteor. Soc., 143, 1485–1503, https://doi.org/10.1002/qj.3019, 2017. a, b, c
Barthlott, C., Zarboo, A., Matsunobu, T., and Keil, C.: Importance of aerosols and shape of the cloud droplet size distribution for convective clouds and precipitation, Atmos. Chem. Phys., 22, 2153–2172, https://doi.org/10.5194/acp-22-2153-2022, 2022. a, b, c, d, e, f, g, h, i, j, k, l, m, n, o
Baur, F., Keil, C., and Craig, G.: Soil Moisture - Precipitation Coupling over Central Europe: Interactions between surface anomalies at different scales and its dynamical implication, Q. J. Roy. Meteor. Soc., 144, 2863–2875, https://doi.org/10.1002/qj.3415, 2018. a, b
Baur, F., Keil, C., and Barthlott, C.: Combined effects of soil moisture and microphysical perturbations on convective clouds and precipitation for a locally forced case over Central Europe, Q. J. Roy. Meteor. Soc., 148, 2132–2146, https://doi.org/10.1002/qj.4295, 2022. a, b, c, d, e
Bechtold, P., Köhler, M., Jung, T., Doblas-Reyes, F., Leutbecher, M., Rodwell, M. J., Vitart, F., and Balsamo, G.: Advances in simulating atmospheric variability with the ECMWF model: From synoptic to decadal time-scales, Q. J. Roy. Meteor. Soc., 134, 1337–1351, https://doi.org/10.1002/qj.289, 2008. a
Bennett, L. J., Browning, K. A., Blyth, A. M., Parker, D. J., and Clark, P. A.: A review of the initiation of precipitating convection in the United Kingdom, Q. J. Roy. Meteor. Soc., 132, 1001–1020, https://doi.org/10.1256/qj.05.54, 2006. a
Bouttier, F., Vié, B., Nuissier, O., and Raynaud, L.: Impact of Stochastic Physics in a Convection-Permitting Ensemble, Mon. Weather Rev., 140, 3706–3721, https://doi.org/10.1175/MWR-D-12-00031.1, 2012. a
Clark, P., Roberts, N., Lean, H., Ballard, S. P., and Charlton-Perez, C.: Convection-permitting models: a step-change in rainfall forecasting, Meteorol. Appl., 23, 165–181, https://doi.org/10.1002/met.1538, 2016. a
Costa-Surós, M., Sourdeval, O., Acquistapace, C., Baars, H., Carbajal Henken, C., Genz, C., Hesemann, J., Jimenez, C., König, M., Kretzschmar, J., Madenach, N., Meyer, C. I., Schrödner, R., Seifert, P., Senf, F., Brueck, M., Cioni, G., Engels, J. F., Fieg, K., Gorges, K., Heinze, R., Siligam, P. K., Burkhardt, U., Crewell, S., Hoose, C., Seifert, A., Tegen, I., and Quaas, J.: Detection and attribution of aerosol–cloud interactions in large-domain large-eddy simulations with the ICOsahedral Non-hydrostatic model, Atmos. Chem. Phys., 20, 5657–5678, https://doi.org/10.5194/acp-20-5657-2020, 2020. a
Drager, A. J., Grant, L. D., and van den Heever, S. C.: A Non-Monotonic Precipitation Response to Changes in Soil Moisture in the Presence of Vegetation, J. Hydrometeor., 23, 1095–1111, https://doi.org/10.1175/JHM-D-21-0109.1, 2022. a, b
Fan, J., Yuan, T., Comstock, J. M., Ghan, S., Khain, A., Leung, L. R., Li, Z., Martins, V. J., and Ovchinnikov, M.: Dominant role by vertical wind shear in regulating aerosol effects on deep convective clouds, J. Geophys. Res., 114, D22206, https://doi.org/10.1029/2009JD012352, 2009. a
Fan, J., Wand, Y., Rosenfeld, D., and Liu, X.: Review of Aerosol-Cloud Interactions: Mechanisms, Significance, and Challenges, J. Atmos. Sci., 73, 4221–4252, https://doi.org/10.1175/JAS-D-16-0037.1, 2016. a
Fan, J., Leung, L. R., Rosenfeld, D., and DeMott, P. J.: Effects of cloud condensation nuclei and ice nucleating particles on precipitation processes and supercooled liquid in mixed-phase orographic clouds, Atmos. Chem. Phys., 17, 1017–1035, https://doi.org/10.5194/acp-17-1017-2017, 2017. a
Findell, K. L. and Eltahir, E. A. B.: Atmospheric controls on soil moisture-boundary layer interactions. Part I: Framework development, J. Hydrometeor., 4, 552–569, 2003. a
Gossard, E. E.: Measurement of Cloud Droplet Size Spectra by Doppler Radar, J. Atmos. Ocean. Tech., 11, 712–726, https://doi.org/10.1175/1520-0426(1994)011<0712:MOCDSS>2.0.CO;2, 1994. a
Grant, L. D. and van den Heever, S. C.: Aerosol-cloud-land surface interactions within tropical sea breeze convection, J. Geophys. Res., 119, 8340–8361, https://doi.org/10.1002/2014JD021912, 2014. a, b, c, d, e
Grant, L. D. and van den Heever, S. C.: Cold pool and precipitation responses to aerosol loading: Modulation by dry layers, J. Atmos. Sci., 72, 1398–1408, https://doi.org/10.1175/JAS-D-14-0260.1, 2015. a
Griffin, S. M., Otkin, J. A., Thompson, G., Frediani, M., Berner, J., and Kong, F.: Assessing the impact of stochastic perturbations in cloud microphysics using GOES-16 infrared brightness temperatures, Mon. Weather Rev., 148, 3111–3137, https://doi.org/10.1175/MWR-D-20-0078.1, 2020. a
Hande, L. B., Engler, C., Hoose, C., and Tegen, I.: Seasonal variability of Saharan desert dust and ice nucleating particles over Europe, Atmos. Chem. Phys., 15, 4389–4397, https://doi.org/10.5194/acp-15-4389-2015, 2015. a
Hande, L. B., Engler, C., Hoose, C., and Tegen, I.: Parameterizing cloud condensation nuclei concentrations during HOPE, Atmos. Chem. Phys., 16, 12059–12079, https://doi.org/10.5194/acp-16-12059-2016, 2016. a
Hauck, C., Barthlott, C., Krauss, L., and Kalthoff, N.: Soil moisture variability and its influence on convective precipitation over complex terrain, Q. J. Roy. Meteor. Soc., 137, 42–56, https://doi.org/10.1002/qj.766, 2011. a, b
Heinze, R., Dipankar, A., Carbajal Henken, C., Moseley, C., Sourdeval, O., Trömel, S., Xie, X., Adamidis, P., Ament, F., Baars, H., Barthlott, C., Behrendt, A., Blahak, U., Bley, S., Brdar, S., Brueck, M., Crewell, S., Deneke, H., Di Girolamo, P., Evaristo, R., Fischer, J., Frank, C., Friederichs, P., Göcke, T., Gorges, K., Hande, L., Hanke, M., Hansen, A., Hege, H.-C., Hoose, C., Jahns, T., Kalthoff, N., Klocke, D., Kneifel, S., Knippertz, P., Kuhn, A., van Laar, T., Macke, A., Maurer, V., Mayer, B., Meyer, C. I., Muppa, S. K., Neggers, R. A. J., Orlandi, E., Pantillon, F., Pospichal, B., Röber, N., Scheck, L., Seifert, A., Seifert, P., Senf, F., Siligam, P., Simmer, C., Steinke, S., Stevens, B., Wapler, K., Weniger, M., Wulfmeyer, V., Zängl, G., Zhang, D., and Quaas, J.: Large-eddy simulations over Germany using ICON: a comprehensive evaluation, Q. J. Roy. Meteor. Soc., 143, 69–100, https://doi.org/10.1002/qj.2947, 2017. a
Heise, E., Ritter, B., and Schrodin, E.: Operational implementation of the multilayer soil model TERRA, Technical Report 9, 19 pp., http://www.cosmo-model.org (last access: 18 September 2018), 2006. a
Hohenegger, C., Brockhaus, P., Bretherton, C. S., and Schär, C.: The soil moisture precipitation feedback in simulations with explicit and parameterized convection, J. Climate, 22, 5003–5020, https://doi.org/10.1175/2009JCLI2604.1, 2009. a
Igel, A. L. and van den Heever, S. C.: The Importance of the Shape of Cloud Droplet Size Distributions in Shallow Cumulus Clouds. Part II: Bulk Microphysics Simulations, J. Atmos. Sci., 74, 259–273, https://doi.org/10.1175/JAS-D-15-0383.1, 2017. a
Igel, A. L. and van den Heever, S. C.: Invigoration or Enervation of Convective Clouds by Aerosols?, Geophys. Res. Lett., 48, e2021GL093804, https://doi.org/10.1029/2021GL093804, 2021. a
Imamovic, A., Schlemmer, L., and Schär, C.: Collective Impacts of Orography and Soil Moisture on the Soil Moisture-Precipitation Feedback, Geophys. Res. Lett., 44, 11682–11691, https://doi.org/10.1002/2017GL075657, 2017. a
Jorgensen, D. P. and Weckwerth, T. M.: Forcing and organization of convective systems, in: Radar and Atmospheric Science: A collection of essays in Honor of David Atlas, edited by: Wakimoto, R. M. and Srivastava, R., American Meteorological Society, Boston, 75–103, https://doi.org/10.1175/0065-9401(2003)030<0075:FAOOCS>2.0.CO;2, 2003. a
Kärcher, B. and Lohmann, U.: A parameterization of cirrus cloud formation: Homogeneous freezing of supercooled aerosols, J. Geophys. Res., 107, AAC 4-1–AAC 4-10, https://doi.org/10.1029/2001JD000470, 2002. a
Kärcher, B., Hendricks, J., and Lohmann, U.: Physically based parameterization of cirrus cloud formation for use in global atmospheric models, J. Geophys. Res., 111, D01205, https://doi.org/10.1029/2005JD006219, 2006. a
Keil, C., Heinlein, F., and Craig, G. C.: The convective adjustment time-scale as indicator of predictability of convective precipitation, Q. J. Roy. Meteor. Soc., 140, 480–490, https://doi.org/10.1002/qj.2143, 2014. a
Keil, C., Baur, F., Bachmann, K., Rasp, S., Schneider, L., and Barthlott, C.: Relative contribution of soil moisture, boundary-layer and microphysical perturbations on convective predictability in different weather regimes, Q. J. Roy. Meteor. Soc., 145, 3102–3115, https://doi.org/10.1002/qj.3607, 2019. a, b, c, d, e, f, g, h
Khain, A. P., BenMoshe, N., and Pokrovsky, A.: Factors Determining the Impact of Aerosols on Surface Precipitation from Clouds: An Attempt at Classification, J. Atmos. Sci., 65, 1721–1748, https://doi.org/10.1175/2007JAS2515.1, 2008. a
Khain, A. P., Beheng, K. D., Heymsfield, A., Korolev, A., Krichak, S. O., Levin, Z., Pinsky, M., Phillips, V., Prabhakaran, T., Teller, A., van den Heever, S. C., and Yano, J.-I.: Representation of microphysical processes in cloud-resolving models: Spectral (bin) microphysics versus bulk parameterization, Rev. Geophys., 53, 247–322, https://doi.org/10.1002/2014RG000468, 2015. a
Leuenberger, D., Koller, M., Fuhrer, O., and Schär, C.: A Generalization of the SLEVE Vertical Coordinate, Mon. Weather Rev., 138, 3683–3689, https://doi.org/10.1175/2010MWR3307.1, 2010. a
Levin, M.: Functions to represent drop size distributions in clouds: The optical density of clouds, Ser. Geofiz., 10, 698–702, 1958. a
Liu, W., Zhang, Q., Li, C., Xu, L., and Xiao, W.: The influence of soil moisture on convective activity: a review, Theor. Appl. Climatol., 149, 221–232, https://doi.org/10.1007/s00704-022-04046-z, 2022. a
Marinescu, P. J., van den Heever, S. C., Heikenfeld, M., Barrett, A. I., Barthlott, C., Hoose, C., Fan, J., Fridlind, A. M., Matsui, T., Miltenberger, A. K., Stier, P., Vie, B., White, B. A., and Zhang, Y.: Impacts of Varying Concentrations of Cloud Condensation Nuclei On Deep Convective Cloud Updrafts – A Multimodel Assessment, J. Atmos. Sci., 78, 1147–1172, https://doi.org/10.1175/JAS-D-20-0200.1, 2021. a
Martins, J. A. and Silva Dias, M. A. F.: The impact of smoke from forest fires on the spectral dispersion of cloud droplet size distributions in the Amazonian region, Environ. Res. Lett., 4, 1–8, https://doi.org/10.1088/1748-9326/4/1/015002, 2009. a
Matsunobu, T., Zarboo, A., Barthlott, C., and Keil, C.: Impact of combined microphysical uncertainties on convective clouds and precipitation in ICON-D2-EPS forecasts during different synoptic control, Weather Clim. Dynam. Discuss. [preprint], https://doi.org/10.5194/wcd-2022-17, in review, 2022. a, b, c
Miles, N. L., Verlinde, J., and Clothiaux, E. E.: Cloud Droplet Size Distributions in Low-Level Stratiform Clouds, J. Atmos. Sci., 57, 295–311, https://doi.org/10.1175/1520-0469(2000)057<0295:CDSDIL>2.0.CO;2, 2000. a
Mlawer, E. J., Taubman, S. J., Brown, P. D., Iacono, M. J., and Clough, S. A.: Radiative transfer for inhomogeneous atmospheres: RRTM, a validated correlated-k model for the longwave, J. Geophys. Res., 102, 16663–16682, https://doi.org/10.1029/97JD00237, 1997. a
Mohr, S., Wilhelm, J., Wandel, J., Kunz, M., Portmann, R., Punge, H. J., Schmidberger, M., Quinting, J. F., and Grams, C. M.: The role of large-scale dynamics in an exceptional sequence of severe thunderstorms in Europe May–June 2018, Weather Clim. Dynam., 1, 325–348, https://doi.org/10.5194/wcd-1-325-2020, 2020. a
Morales, A., Posselt, D. J., Morrison, H., and He, F.: Assessing the Influence of Microphysical and Environmental Parameter Perturbations on Orographic Precipitation, J. Atmos. Sci., 76, 1373–1395, https://doi.org/10.1175/jas-d-18-0301.1, 2019. a
Pan, Z., Takle, E., Segal, M., and Turner, R.: Influences of model parameterization schemes on the response of rainfall to soil moisture in the central United States, Mon. Weather Rev., 124, 1786–1802, 1996. a
Park, J. M. and van den Heever, S. C.: Weakening of tropical sea breeze convective systems through interactions of aerosol, radiation, and soil moisture, Atmos. Chem. Phys., 22, 10527–10549, https://doi.org/10.5194/acp-22-10527-2022, 2022. a, b
Piper, D., Kunz, M., Ehmele, F., Mohr, S., Mühr, B., Kron, A., and Daniell, J.: Exceptional sequence of severe thunderstorms and related flash floods in May and June 2016 in Germany – Part 1: Meteorological background, Nat. Hazards Earth Syst. Sci., 16, 2835–2850, https://doi.org/10.5194/nhess-16-2835-2016, 2016. a
Posselt, D. J., He, F., Bukowski, J., and Reid, J. S.: On the Relative Sensitivity of a Tropical Deep Convective Storm to Changes in Environment and Cloud Microphysical Parameters, J. Atmos. Sci., 76, 1163–1185, https://doi.org/10.1175/JAS-D-18-0181.1, 2019. a
Raschendorfer, M.: The new turbulence parameterization of LM, COSMO Newsletter 1, 89–97, http://www.cosmo-model.org (last access: 13 May 2020), 2001. a
Raynaud, L. and Bouttier, F.: The impact of horizontal resolution and ensemble size for convective-scale probabilistic forecasts, Q. J. Roy. Meteor. Soc., 143, 3037–3047, https://doi.org/10.1002/qj.3159, 2017. a
Richard, E., Chaboureau, J. P., Flamant, C., Champollion, C., Hagen, M., Schmidt, K., Kiemle, C., Corsmeier, U., Barthlott, C., and Di Girolamo, P.: Forecasting summer convection over the Black Forest: a case study from the Convective and Orographically-induced Precipitation Study (COPS) experiment, Q. J. Roy. Meteor. Soc., 137, 101–117, https://doi.org/10.1002/qj.710, 2011. a
Rosenfeld, D., Lohmann, U., Raga, G., O'Dowd, C., Kulmala, M., Fuzzi, S., Reissell, A., and Andreae, M.: Flood or Drought: How Do Aerosols Affect Precipitation?, Science, 321, 1309–1313, https://doi.org/10.1126/science.1160606, 2008. a, b
Schneider, L., Barthlott, C., Barrett, A. I., and Hoose, C.: The precipitation response to variable terrain forcing over low-mountain ranges in different weather regimes, Q. J. Roy. Meteor. Soc., 144, 970–989, https://doi.org/10.1002/qj.3250, 2018. a
Schneider, L., Barthlott, C., Hoose, C., and Barrett, A. I.: Relative impact of aerosol, soil moisture, and orography perturbations on deep convection, Atmos. Chem. Phys., 19, 12343–12359, https://doi.org/10.5194/acp-19-12343-2019, 2019. a, b
Segal, Y. and Khain, A.: Dependence of droplet concentration on aerosol conditions in different cloud types: application to droplet concentration parameterization of aerosol conditions, J. Geophys. Res., 111, D15240, https://doi.org/10.1029/2005JD006561, 2006. a, b
Seifert, A. and Beheng, K. D.: A double-moment parameterization for simulating autoconversion, accretion and selfcollection, Atmos. Res., 59-60, 265–281, https://doi.org/10.1016/S0169-8095(01)00126-0, 2001. a
Seifert, A. and Beheng, K. D.: A two-moment cloud microphysics parameterization for mixed-phase clouds. Part I: Model description, Meteorol. Atmos. Phys., 92, 67–82, https://doi.org/10.1007/s00703-005-0112-4, 2006a. a, b, c
Seifert, A. and Beheng, K. D.: A two-moment cloud microphysics parameterization for mixed-phase clouds. Part II: Maritime vs. continental deep convective storms, Meteorol. Atmos. Phys., 92, 45–66, 2006b. a
Seifert, A., Köhler, C., and Beheng, K. D.: Aerosol-cloud-precipitation effects over Germany as simulated by a convective-scale numerical weather prediction model, Atmos. Chem. Phys., 12, 709–725, https://doi.org/10.5194/acp-12-709-2012, 2012. a, b
Selz, T. and Craig, G. C.: Upscale Error Growth in a High-Resolution Simulation of a Summertime Weather Event over Europe, Mon. Weather Rev., 143, 813–827, https://doi.org/10.1175/MWR-D-14-00140.1, 2015. a
Seneviratne, S. I., Corti, T., Davin, E. L., Hirschi, M., Jaeger, E. B., Lehner, I., Orlowsky, B., and Teuling, A. J.: Investigating soil moisture–climate interactions in a changing climate: A review, Earth-Sci. Rev., 99, 125–161, https://doi.org/10.1016/j.earscirev.2010.02.004, 2010. a
Stein, U. and Alpert, P.: Factor Separation in Numerical Simulations, J. Atmos. Sci., 50, 2107–2115, https://doi.org/10.1175/1520-0469(1993)050<2107:FSINS>2.0.CO;2, 1993. a
Storer, R. L. and van den Heever, S. C.: Microphysical Processes Evident in Aerosol Forcing of Tropical Deep Convective Clouds, J. Atmos. Sci., 70, 430–446, https://doi.org/10.1175/JAS-D-12-076.1, 2013. a, b
Storer, R. L., van den Heever, S. C., and Stephens, G. L.: Modeling Aerosol Impacts on Convective Storms in Different Environments, J. Atmos. Sci., 67, 3904–3915, https://doi.org/10.1175/2010JAS3363.1, 2010. a
Tao, W.-K., Chen, J.-P., Li, Z., Wang, C., and Zhang, C.: Impact of aerosols on convective clouds and precipitation, Rev. Geophys., 50, RG2001, https://doi.org/10.1029/2011RG000369, 2012. a, b, c, d
Taylor, C. M., de Jeu, R. A. M., Guichard, F., Harris, P. P., and Dorigo, W. A.: Afternoon rain more likely over drier soils, Nature, 489, 423–426, 2012. a
Thompson, G., Berner, J., Frediani, M., Otkin, J. A., and Griffin, S. M.: A Stochastic Parameter Perturbation Method to Represent Uncertainty in a Microphysics Scheme, Mon. Weather Rev., 149, 1481–1497, https://doi.org/10.1175/MWR-D-20-0077.1, 2021. a, b
Tiedtke, M.: A comprehensive mass flux scheme for cumulus parameterization in large-scale models, Mon. Weather Rev., 117, 1779–1800, https://doi.org/10.1175/1520-0493(1989)117<1779:ACMFSF>2.0.CO;2, 1989. a
van den Heever, S. C., Stephens, G. L., and Wood, N. B.: Aerosol indirect effects on tropical convection characteristics under conditions of radiative-convective equilibrium, J. Atmos. Sci., 68, 699–718, https://doi.org/10.1175/2010JAS3603.1, 2011. a, b
Wellmann, C., Barrett, A. I., Johnson, J. S., Kunz, M., Vogel, B., Carslaw, K. S., and Hoose, C.: Comparing the impact of environmental conditions and microphysics on the forecast uncertainty of deep convective clouds and hail, Atmos. Chem. Phys., 20, 2201–2219, https://doi.org/10.5194/acp-20-2201-2020, 2020. a, b
Wilhelm, J., Mohr, S., Punge, H. J., Mühr, B., Schmidberger, M., Daniell, J. E., Bedka, K. M., and Kunz, M.: Severe thunderstorms with large hail across Germany in June 2019, Weather, 76, 228–237, https://doi.org/10.1002/wea.3886, 2021. a
Zängl, G.: Extending the Numerical Stability Limit of Terrain-Following Coordinate Models over Steep Slopes, Mon. Weather Rev., 140, 3722–3733, https://doi.org/10.1175/MWR-D-12-00049.1, 2012. a
Zängl, G., Reinert, D., Rípodas, P., and Baldauf, M.: The ICON (ICOsahedral Non-hydrostatic) modelling framework of DWD and MPI-M: Description of the non-hydrostatic dynamical core, Q. J. Roy. Meteor. Soc., 141, 563–579, https://doi.org/10.1002/qj.2378, 2015. a