the Creative Commons Attribution 4.0 License.
the Creative Commons Attribution 4.0 License.
 | 26 Aug 2022
Secondary organic aerosols from OH oxidation of cyclic volatile methyl siloxanes as an important Si source in the atmosphere
Chong Han
Hongxing Yang
Patrick Lee
John Liggio
Amy Leithead
Cyclic volatile methyl siloxanes (cVMSs), which can volatilize into the atmosphere, are active ingredients in widely used consumer products, thus attracting much attention due to their potential environmental risks. While in the atmosphere the cVMSs undergo oxidation, yielding both gaseous and particulate products. The aerosol yields and compositions from the OH oxidation of four cVMSs (D3–D6) were determined under low- and high-NOx conditions in an oxidation flow reactor. The aerosol yields increased progressively from D3 to D6, consistent with the volatilities and molecule weights of these cVMSs. NOx can restrict the formation of secondary organic aerosols (SOAs), leading to lower SOA yields under high-NOx conditions than under low-NOx conditions, with a yield decrease between 0.05–0.30 depending on the cVMSs. Ammonium sulfate seeds exhibited minor impacts on SOA yields under low-NOx conditions but significantly increased the SOA yields in the oxidation of D3–D5 at short photochemical ages under high-NOx conditions. The mass spectra of the SOAs showed a dependence of its chemical compositions on OH exposure. At high exposures equivalent to photochemical ages of >4 d in the atmosphere, D4–D6 SOAs mainly consisted of CxHy and CxHyOzSin under low-NOx conditions, whereas they primarily contained NmOz, CxHy, CxHyO1, CxHyO>1 and CxHyOzSin under high-NOx conditions. The potential contributions of cVMSs to SOA formation in the atmosphere were evaluated using the reported cVMSs annual production and the yield obtained in the present study. A global cVMS-derived (D4–D6) SOA source strength is estimated to be 0.01 Tg yr−1, distributed over major urban centers.
- Article
(2183 KB) - Full-text XML
-
Supplement
(2211 KB) - BibTeX
- EndNote


Secondary organic aerosols (SOAs), which contribute 50 %–85 % to the mass of atmospheric organic aerosols (OAs) (Glasius and Goldstein, 2016), are mainly formed via the partitioning of low volatility products as a result of oxidation of volatile organic compounds (VOCs), semi- and intermediate volatile organic compounds (S IVOCs) (Riipinen et al., 2012). SOAs have attracted significant attention due to their important impacts on climate, ecosystems and human health (Berndt et al., 2016). Global budgets of SOAs remain an unresolved issue despite extensive research, largely due to uncertainties associated with aerosol yields and the presence of unconsidered SOA precursors.
As one type of anthropogenic VOC and potential SOA precursor, cyclic volatile methyl siloxanes (cVMSs) are widely used in industrial applications and personal care products (Genualdi et al., 2011; Krogseth et al., 2013a). cVMSs have been classified as high-volume chemicals with an annual production of millions of tons globally (Rücker and Kümmerer, 2015; Ahrens et al., 2014). Studies of cVMSs in the environment have focused on investigating their impact on health and the environment, particularly due to their potential persistence, bioaccumulation and toxicity (Guo et al., 2019; Liu et al., 2018; Farasani and Darbre, 2017; Xu et al., 2019; Kim et al., 2018; Coggon et al., 2018). As a result, the European Council has proposed a restriction on the octamethylcyclotetrasiloxane (D4) and decamethylcyclopentasiloxane (D5) content in wash-off personal care products to a limit of 0.1 mass % by 2020 (Eur-Lex, 2018). The legislative actions notwithstanding, knowledge of the environmental behavior of cVMSs still needs to be further deepened as compared to knowledge of their applications and economic significance (Rücker and Kümmerer, 2015).
It has been estimated that approximately 90 % of cVMSs are emitted into the atmosphere due to their high saturation vapor pressures (Allen et al., 1997). Gas-phase cVMSs have been observed in both indoor and outdoor air. Tang et al. (2015) reported that cVMSs accounted for about one-third of the total VOC mass concentration in a classroom. Outdoor air concentrations of cVMSs have also been measured at different sites worldwide (Li et al., 2020; Wang et al., 2018; Rauert et al., 2018), increasing from rural to urban sites and consistent with increasing population density (Rücker and Kümmerer, 2015). For example, at a rural site in Sweden, the concentrations of hexamethylcyclotrisiloxane (D3), D4, D5 and dodecamethylcyclohexasiloxane (D6) were 0.94, 3.5, 13 and 1 ng m−3, respectively (Kierkegaard and Mclachlan, 2013), while they were 18, 55, 172 and 14 ng m−3 in urban areas of Toronto in Canada, respectively (Genualdi et al., 2011; Rauert et al., 2018). cVMSs have also been detected in the remote Arctic atmosphere, confirming their long-range transport (Genualdi et al., 2011; Krogseth et al., 2013b). Atmospheric half-lives of cVMSs are on the order of 30, 15, 10 and 6 d for D3–D6, respectively, which allow cVMSs to exhibit a hemispherical distribution in the atmosphere (Canada, 2008; Xiao et al., 2015). These lifetimes are driven mostly by reactions with OH radicals (Xiao et al., 2015; Wang et al., 2013), which generate silanols and dimeric products that can be partitioned to condensed phases (Coggon et al., 2018; Sommerlade, 1993; Wu and Johnston, 2016). Different OH concentrations could partly explain the seasonal variation of cVMS lifetimes that are characteristically longer during winter than in summer (Rücker and Kümmerer, 2015). The loss of cVMSs in the atmosphere is negligible through O3 and NO3 due to their small reaction rates (Atkinson, 1991). The global loss as a result of the reaction with Cl atoms is less than 5 % on account of low Cl concentrations, although it may be higher in some regions where cVMS emissions and Cl sources overlap in both space and time (Alton and Browne, 2020). It has been demonstrated that elemental Si is a frequent constituent of nanoparticles in rural and urban areas (Phares et al., 2003; Rhoads, 2003; Bein, 2005; Bzdek et al., 2014) and in remote regions (Li and Winchester, 1990, 1993). These Si-containing nanoparticles have previously been attributed to ore smelting processes, but recent studies have shown that Si-containing species are one of the main components in cVMS SOAs, suggesting that the oxidation of cVMSs may be an important source of Si in atmospheric aerosols (Wu and Johnston, 2016, 2017). In a modeling study, the oxidation products of cVMSs (D4, D5 and D6) were considered in order to quantify the maximum potential for aerosol formation through reactions with the OH radicals (Janechek et al., 2017). Chandramouli and Kamens (2001) demonstrated the gas-particle partitioning of silanols from D5 oxidation by the OH radicals. Wu and Johnston (2016, 2017) analyzed the chemical composition of secondary aerosols from OH oxidation of D4 and D5, showing a large number of monomeric and dimeric products. Janechek et al. (2017, 2019) reported the physical properties of SOAs generated by OH oxidation of D5, including hygroscopicity, cloud seeding potential and volatility. Charan et al. (2022) measured SOA yields of D5 using chambers and flow tube reactors, emphasizing the importance of the relevant OH concentrations and exposures when extrapolating these laboratory results or when comparing with other studies. These studies mainly focused on D5 and occasionally D4 but rarely others. To better understand the SOA-forming potentials of typical cVMSs in the atmosphere, accurate yields and molecular compositions of SOAs from the oxidation of cVMSs under various atmospheric conditions are needed.
In this work, the formation of SOAs from the oxidation of four cVMSs (D3–D6) by OH radicals was investigated in an oxidation flow reactor (OFR). Under various combinations of NOx and ammonium sulfate seed concentrations, the yields and compositions of SOAs formed from the oxidation were measured using a suite of instruments, including a scanning mobility particle sizer (SMPS), a proton transfer reaction time of flight mass spectrometer (PTR-ToF-MS) and an aerosol mass spectrometer (AMS). Based on these SOA yields, the contribution of cVMSs to SOAs in the global atmosphere was estimated using reported cVMSs concentrations. The results obtained here could largely improve our understanding of the contribution and composition of SOAs from cVMSs.
2.1 Photo-oxidation experiments
The reactions of cVMSs with OH radicals were controlled at a constant temperature (21±1 ∘C) and relative humidity (35 % ± 2 %) in a custom-made oxidation flow reactor (the Environment and Climate Change Canada oxidation flow reactor, ECCC-OFR), which is shown in Fig. S1 in the Supplement and has been described in detail previously (Li et al., 2019a). Briefly, the ECCC-OFR is a fused quartz cylinder (length: 50.8 cm, inner diameter: 20.3 cm) equipped with a conical inlet and seven outlets. Wall losses of particles and gases in the ECCC-OFR have been shown to be lower than in other OFRs (Huang et al., 2017; Lambe et al., 2011; Simonen et al., 2017; Li et al., 2019a). The length and full angle of the cone inlet are 35.6 cm and 30∘, respectively, designed to minimize the formation of jetting and recirculation in the OFR. The outlet at the reactor center is a stainless-steel sampling port (inner diameter: 0.18 in) extending 12.7 cm length-wise into the ECCC-OFR. This sampling inlet reduces the impact of potential turbulent eddies caused by the back end of the reactor. The remaining six outlets around the perimeter are designed to allow side flows to pass through the OFR as a sheath flow, indirectly reducing wall losses of gases and particles inside the OFR upon sampling. Ozone-free mercury UV lamps for generating OH radicals are housed in small quartz tubes around and in parallel to the quartz reaction cylinder, and a large flow of air through each of these smaller quartz tubes is used to remove the heat produced by the lamps. The relative humidity was adjusted by controlling the ratio of dry air to wet air in the reactor and was measured using a humidity sensor (Vaisala) at one of the sheath flow outlets (side flows) of the reactor. The volume of the entire ECCC-OFR is about 16 L and the total flow rate is 8 L min−1, leading to a residence time of 2 min in the OFR.
OH radicals were produced through the reaction of water vapor with O(1D) formed from O3 photolysis at 254 nm. The OH concentration in the ECCC-OFR was regulated by controlling the input voltage and the number of UV lamps. Methanol vapor, introduced into the ECCC-OFR through a bubbler containing methanol solution, was used to determine the OH exposure (i.e., photochemical age, derived from the multiplication of OH concentration and reaction time) by tracking its decay in the reactor from the reaction with the OH. The decay, or fractional loss, of gas-phase methanol, [MeOH] [MeOH]0 was measured with the PTR-ToF-MS and was used to calculate the OH concentration via Eq. (1):
where kMeOH is the second-order rate constant of methanol reaction with OH at 298 K ( cm3 molecule−1 s−1). The OH exposure measurement was offline, because methanol can affect the OH reactivity with cVMSs. Under the low- and high-NOx conditions described below, the OH exposure varied in the range of 5.5×10¹⁰–1.8×10¹² and 8.2×10¹⁰–1.1×10¹² molecules cm−3 s, respectively. They correspond to 0.4–14.2 and 0.6–8.5 equivalent days (photochemical age), respectively, assuming that an average OH concentration in the air is 1.5×10⁶ molecules cm−3 (Mao et al., 2009).
Pure D3–D6 cVMS compounds (solid D3 and liquid D4, D5 and D6) were placed in a glass U-type tube and maintained at room temperature. Vapors from these compounds (Table S1 in the Supplement) were separately introduced into the ECCC-OFR by a small flow of zero air (1–18 mL min−1) passing over the headspace of the U-tube containing the pure compounds. The concentrations of D3–D6 in the ECCC-OFR ranged from 20 to 43 ppb (Table S2), depending on their volatilities. Table S2 summarizes the concentrations of cVMSs at the reactor inlet and outlet, when the OH exposure was 1.85×10¹² and 1.10×10¹² molecules cm−3 s in low and high-NOx experiments, respectively, indicating the reaction depth of cVMSs. To study the influence of existing particles on the SOA formation, ammonium sulfate (AS) seed particles were produced using an atomizer, dried by a diffusion dryer, neutralized by a neutralizer and then injected into the reactor without size selection. The mass concentration of AS seed particles was approximately 30 µg m−3 for all experiments.
N2O was used as a source of NO to achieve high-NOx conditions (Lambe et al., 2017). NOx conditions were defined by the fate of peroxy radicals (RO2), which are described by the reaction rate ratio (RNO) of RO2 + NO and RO2 + HO2 (Peng et al., 2018). The RNO ratio increases with increasing OH exposures at a constant concentration of N2O (Li et al., 2019b). To achieve a constant branching ratio during the high-NOx experiments, the initial N2O concentration in the OFR was varied (1.6 %–8.0 %) to maintain an RNO value of 20 (Li et al., 2019b), as calculated using a model (OFR Exposures Estimator v3.1) (Peng et al., 2018). A ratio of RNO=20 indicates that 95 % of RO2 reacts with NO, ensuring the dominance of RO2 + NO, which represents conditions that are relevant for urban atmosphere (Peng et al., 2019). The role of RO2 + RO2 here should be minor or negligible due to the low concentrations of SOA precursors (cVMSs, 18–46 ppb) (Lambe et al., 2017; Peng et al., 2019; Li et al., 2019b). Peng et al. (2019) have reported that in the experiments utilizing the injection of N2O to achieve high-NOx conditions, the relative importance of RO2 + OH was generally negatively correlated with N2O due to the suppressing effect of NOx on OH radicals and the increasing role of RO2 + NO. Under low-NOx conditions, N2O was not introduced into the OFR, where the reaction ratio of RO2 with HO2 was estimated to be larger than 99 % according to the model mentioned above (Peng et al., 2018), representing atmospheric scenarios with few NOx sources.
2.2 Characterization and analysis
The concentrations of cVMSs in the OFR were measured online with PTR-ToF-MS (Ionicon Analytik GmbH) (Liggio et al., 2016). The number and mass size distribution of aerosols were monitored using a scanning mobility particle sizer (SMPS, TSI). The mass spectra and elemental composition of aerosols were determined with a high-resolution time-of-flight aerosol mass spectrometer (HR-ToF-AMS, Aerodyne) and analyzed with the AMS analysis software Squirrel (version 1.62G) and Pika (version 1.22G).
SOA mass yields (Y) were calculated via Eq. (2):
where ΔCSOAs and ΔCcVMSs are the mass concentrations of SOAs formed and cVMSs lost, respectively. The mass concentration of SOAs was determined by multiplying the effective aerosol density by the integrated SOAs volume concentration from the SMPS, subtracting the AS seed volume for experiments with AS seeds. The effective aerosol density (ρ) was calculated for unseeded experiments through the following Eq. (3) (Lambe et al., 2015):
where Dva is the vacuum aerodynamic diameter obtained from the HR-ToF-AMS, and Dm is the electric mobility diameter measured by the SMPS. The ρ varied in the range of 1.6–1.8 depending on the cVMSs. The same ρ value was also used in the seeded experiments. It should be pointed out that the background values in Table S3 have been subtracted when calculating the cVMS SOA yields. The average data of SMPS and AMS in the last ∼10 min for each OH exposure were used to calculate the SOA yields (inset of Fig. S2), which could reduce the deviation caused by unstable SOA loadings at high OH exposures.
3.1 SOA yields
Taking the D5 SOAs under unseeded conditions as an example, the number and mass size distributions of aerosols are shown in Fig. S3 at three photochemical ages (PA), i.e., time-integrated OH exposure. It can be seen that small particles dominated the total particle number counts, while large ones dominated the mass. The mass mode diameter of SOAs for mass size distributions increased with PA under low- and high-NOx conditions. The mass concentrations and time series of SOAs obtained from SMPS and AMS are shown in Table S4 and Fig. S2, respectively, which reflected a step-by-step pattern with increasing OH exposures. Unstable SOA loadings at high OH exposures may be attributed to the fragmentation reactions, leading to the difficulty in the deposition of products on SOAs.
Figure 1 shows the SOA yields from the photooxidation of the D3–D6 cVMSs under low- and high-NOx conditions as a function of PA, with and without AS seed particles. SOA yields have been widely used to estimate the potential of precursors to produce aerosol mass (Mcfiggans et al., 2019; Li et al., 2019a; Bruns et al., 2015; Lambe et al., 2015). As shown in Fig. 1, the cVMS SOA yields exhibited an overall increasing trend with PA, expressed in equivalent photochemical days, which agreed with the trend of D5 SOA yields reported by Janechek et al. (2019). Under low-NOx conditions (Fig. 1a), SOA yields exhibited a slow growth, reaching a plateau after 10 equivalent days. This may be due to the increased gas-phase fragmentation of cVMSs and the generation of some higher volatility products, leading to a small increasing amplitude of partition ratio of species into SOAs at longer photochemical ages.
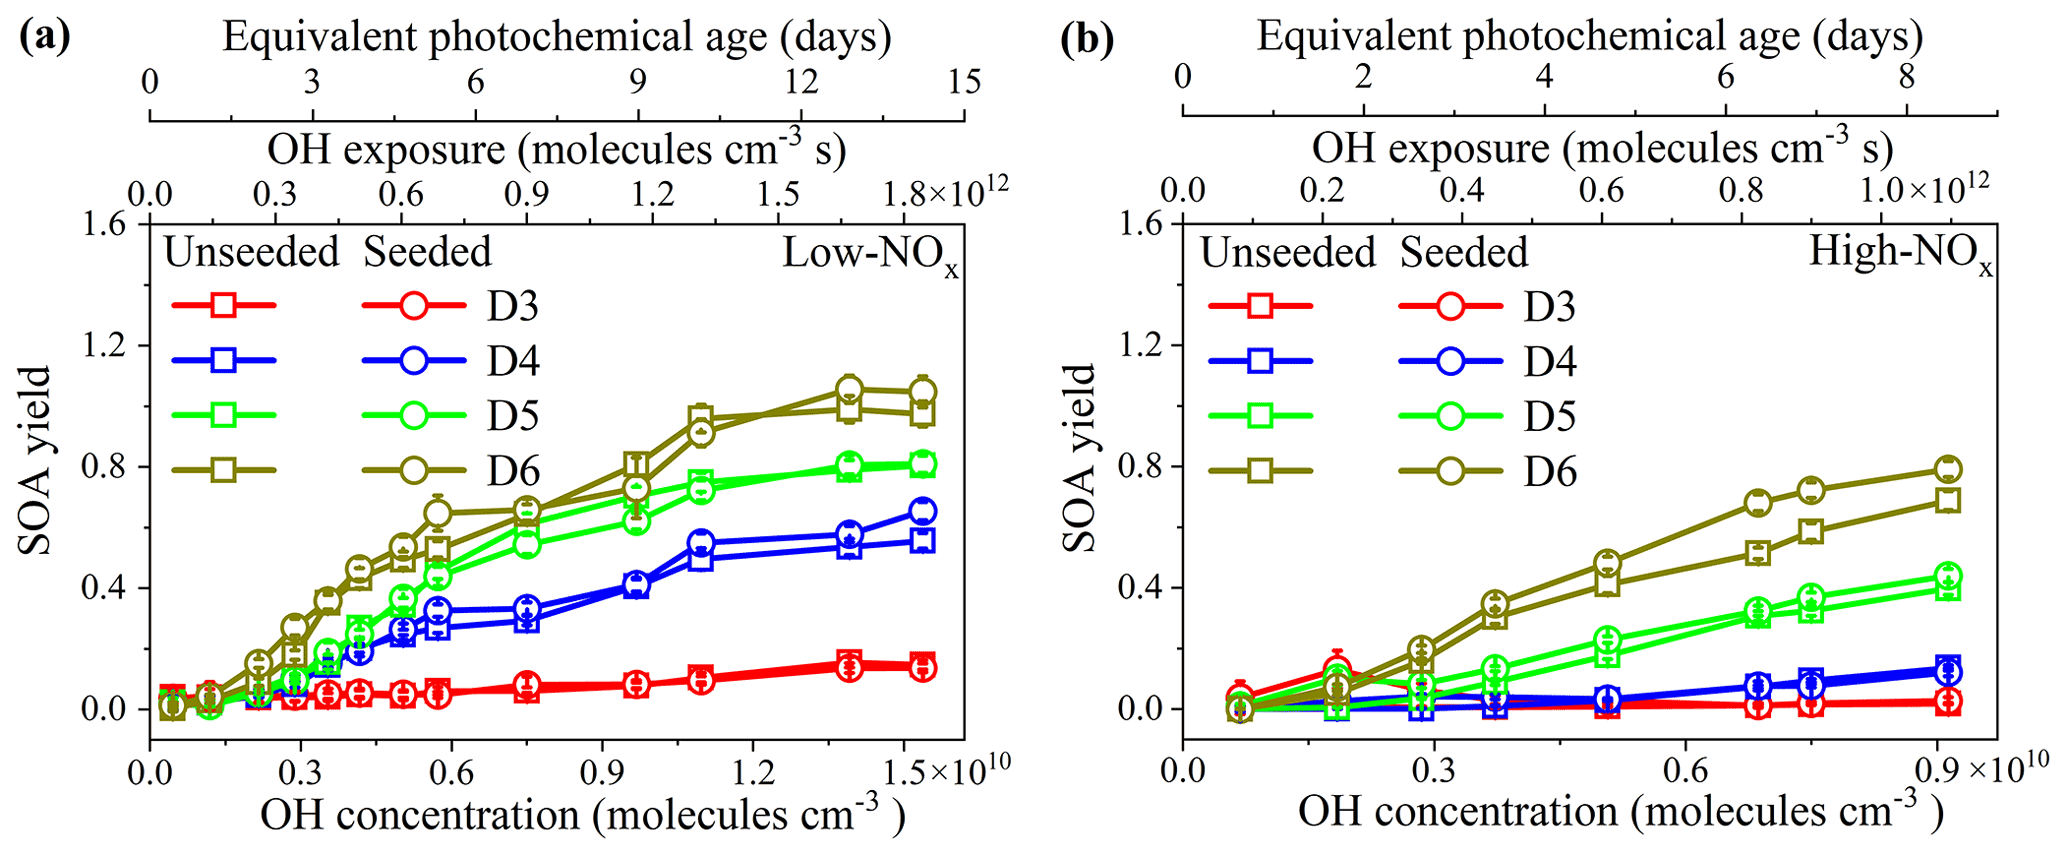
Figure 1SOA yields from unseeded and seeded (30 µg m−3) photooxidation of cVMSs by OH radicals. (a) low-NOx experiments; (b) high-NOx experiments.
For the unseeded and low-NOx experiments in Fig. 1a, SOA yields of four cVMSs exhibited significant differences in values over the same number of equivalent days. The SOA yields successively increased from D3 to D6, consistent with the volatilities and molecular masses of the cVMSs as well as their reaction rate constants with the OH radical (Alton and Browne, 2020; Kim and Xu, 2017; Safron et al., 2015). The maximum SOA yields of D3–D6 were (0.16±0.02), (0.56±0.03), (0.80±0.03) and (0.99±0.04), respectively, occurring after a PA of 12 equivalent days. It has been reported that D5 SOA yields varied in the range of 0–1.1 (Janechek et al., 2019; Wu and Johnston, 2017; Charan et al., 2022). Under a low OH exposure (∼1010–1011 molecules cm−3 s), the D5 SOA yield (0.01–0.11) obtained here was similar to that (chamber, 0–0.057; flow tube, 0.018–0.06) measured by Charan et al. (2022). However, under a high OH exposure of ∼1011–1012 molecules cm−3 s, the D5 SOA yield of 0.46–0.70 was higher than 0.22 and 0.14–0.35 (flow tube), as was reported by Janechek et al. (2019) and Charan et al. (2022), respectively; this may be attributed to differences in experimental conditions, such as differences in reactors, wall losses, SOA measurement methods, determination of OH concentrations and initial D5 concentrations (Table S5) (Janechek et al., 2019; Charan et al., 2022). Although the amount of cVMSs lost was variable, cVMS SOA yields positively depended on SOA mass concentrations (Fig. S4). This trend was observed in previous D5 SOA experiments with OH oxidation (Wu and Johnston, 2017).
As shown in Fig. 1b, the order of SOA yields from the four cVMSs under high-NOx conditions was the same as that under low-NOx conditions. However, the SOA yields under high-NOx conditions were generally smaller than the corresponding yields at similar OH exposures under low-NOx conditions, with a decrease of 0.05–0.30 depending on the cVMSs. Such a reduction suggests that NOx could restrict the formation of cVMS SOAs. NOx has been shown to reduce SOA yields for some anthropogenic alkanes (Li et al., 2019b), aromatics (Ng et al., 2007a; Chan et al., 2009; Zhou et al., 2019), monoterpenes (Zhao et al., 2018) and other terpenes (Ng et al., 2007b), attributable to the formation of higher volatility products (e.g., organic nitrates) generated by RO2 + NO compared to RO2 + HO2 (Presto et al., 2005; Li et al., 2019b), which is also likely to be the case here. The higher volatility products favor partitioning in the gas phase, thus reducing the potential for forming SOAs (Zhou et al., 2019). Moreover, high NOx levels could suppress the formation of products for nucleation, thereby reducing the aerosol surface as a condensational sink and increasing the wall loss of condensable species in an OFR under high-NOx conditions (Zhao et al., 2018; Sarrafzadeh et al., 2016; Wildt et al., 2014). Figure S5 indicates that the difference between SOA yields with and without NOx decreased with increasing silicon atoms within individual cVMSs, indicating a less restricting effect of NOx on the SOA formation for larger cVMSs. This means that high NOx levels play a lessor role in the SOA yields of lower volatility precursors.
SOA yields in the AS-seeded experiments under low- and high-NOx conditions are also shown in Figs. 1 and S5, indicating the minimal impact of the AS seed particles on SOA yields. A yield enhancement ratio (, Fig. S6) was used to show the seed impacts more clearly. Under low-NOx conditions, the RE values for all cVMSs were close to 1.0 (Fig. S6a), suggesting a negligible impact of AS seed particles on SOA yields; however, under high-NOx conditions, RE was much larger (17.81, 13.18 and 15.51 for D3–D5, respectively) at short PA but gradually decreased to 1.0 with increasing PA for D3–D5, while it was always close to 1.0 for D6 regardless of PA (Fig. S6b). RE values greater than 1.0 suggest that AS seed particles played an enhancement role in the cVMS SOA formation, as similarly observed in SOA formation from hydrocarbons (Sarrafzadeh et al., 2016; Lamkaddam et al., 2017; Li et al., 2019b). Under low-NOx conditions, the general lack of impact on cVMS SOA yields by the AS seed particles suggests that condensation was not the main process driving SOA formation in cVMS oxidation. For the few cases of high NOx level at low PA, where RE was >1 for D3–D5, it is possible that their early generations of oxidation products were more volatile than successive generations of products and hence more prone to condensation enhanced by AS seeds. As PA increased, further reactions of these early generation oxidation products with OH radicals resulted in further generation products that were likely to be less volatile, thereby weakening the enhancing role of AS seeds at high OH exposure. Such an effect was less pronounced for D6, likely because its oxidation products at different PA had similar volatilities. Figure S6b shows that the effect of AS seed particles on SOA yields negatively correlated with the number of silicon atoms in the cVMSs. Lower volatility precursors (D5 and D6) may form lower volatility products, resulting in SOA yields less sensitive to the pre-existing seeds.
3.2 Aerosol compositions
3.2.1 Compositions of SOAs under low-NOx conditions
Figures 2 and S7 show the normalized HR-ToF-AMS mass spectra of cVMS SOAs from unseeded experiments under low-NOx conditions at OH exposures of 9.0×10¹¹ molecules cm−3 s (i.e., OH concentration of 7.5×10⁹ molecules cm−3). The mass spectral signals can be identified as fragments with a formula of CxHyOzSin. For D3 SOAs, the most prominent peaks were at and 29, dominated by CO and CHO+, which were tracers for organic acids (Ng et al., 2010), alcohols and aldehydes (Lee et al., 2012), respectively. They may result from the oxidation of the methyl groups in D3 by OH radicals. For the mass spectra of D4–D6 SOAs, the two highest peaks at and 15 were CH and CH, respectively. In addition, there were several dominant CxHyOzSin peaks, which were fragments of silicon-containing products. For the CxHyOzSin group in D4 SOAs, there were four typical peaks at , 257, 271 and 273, with formulae of C4H11O7Si, C3H9O8Si, C3H7O9Si and C3H9O9Si, respectively. The CxHyOzSin fragment group containing Si of D5 SOAs had three dominant peaks at , 329 and 331, corresponding to C12H11O2Si, C9H9O8Si and C5H15O9Si, respectively. For the CxHyOzSin group containing Si in D6 SOAs, there were five main peaks at (C3H9Si), 387 (C8H23O8Si), 389 (C8H9O9Si), 401 (C9H21O10Si) and 403 (C7H15O12Si).
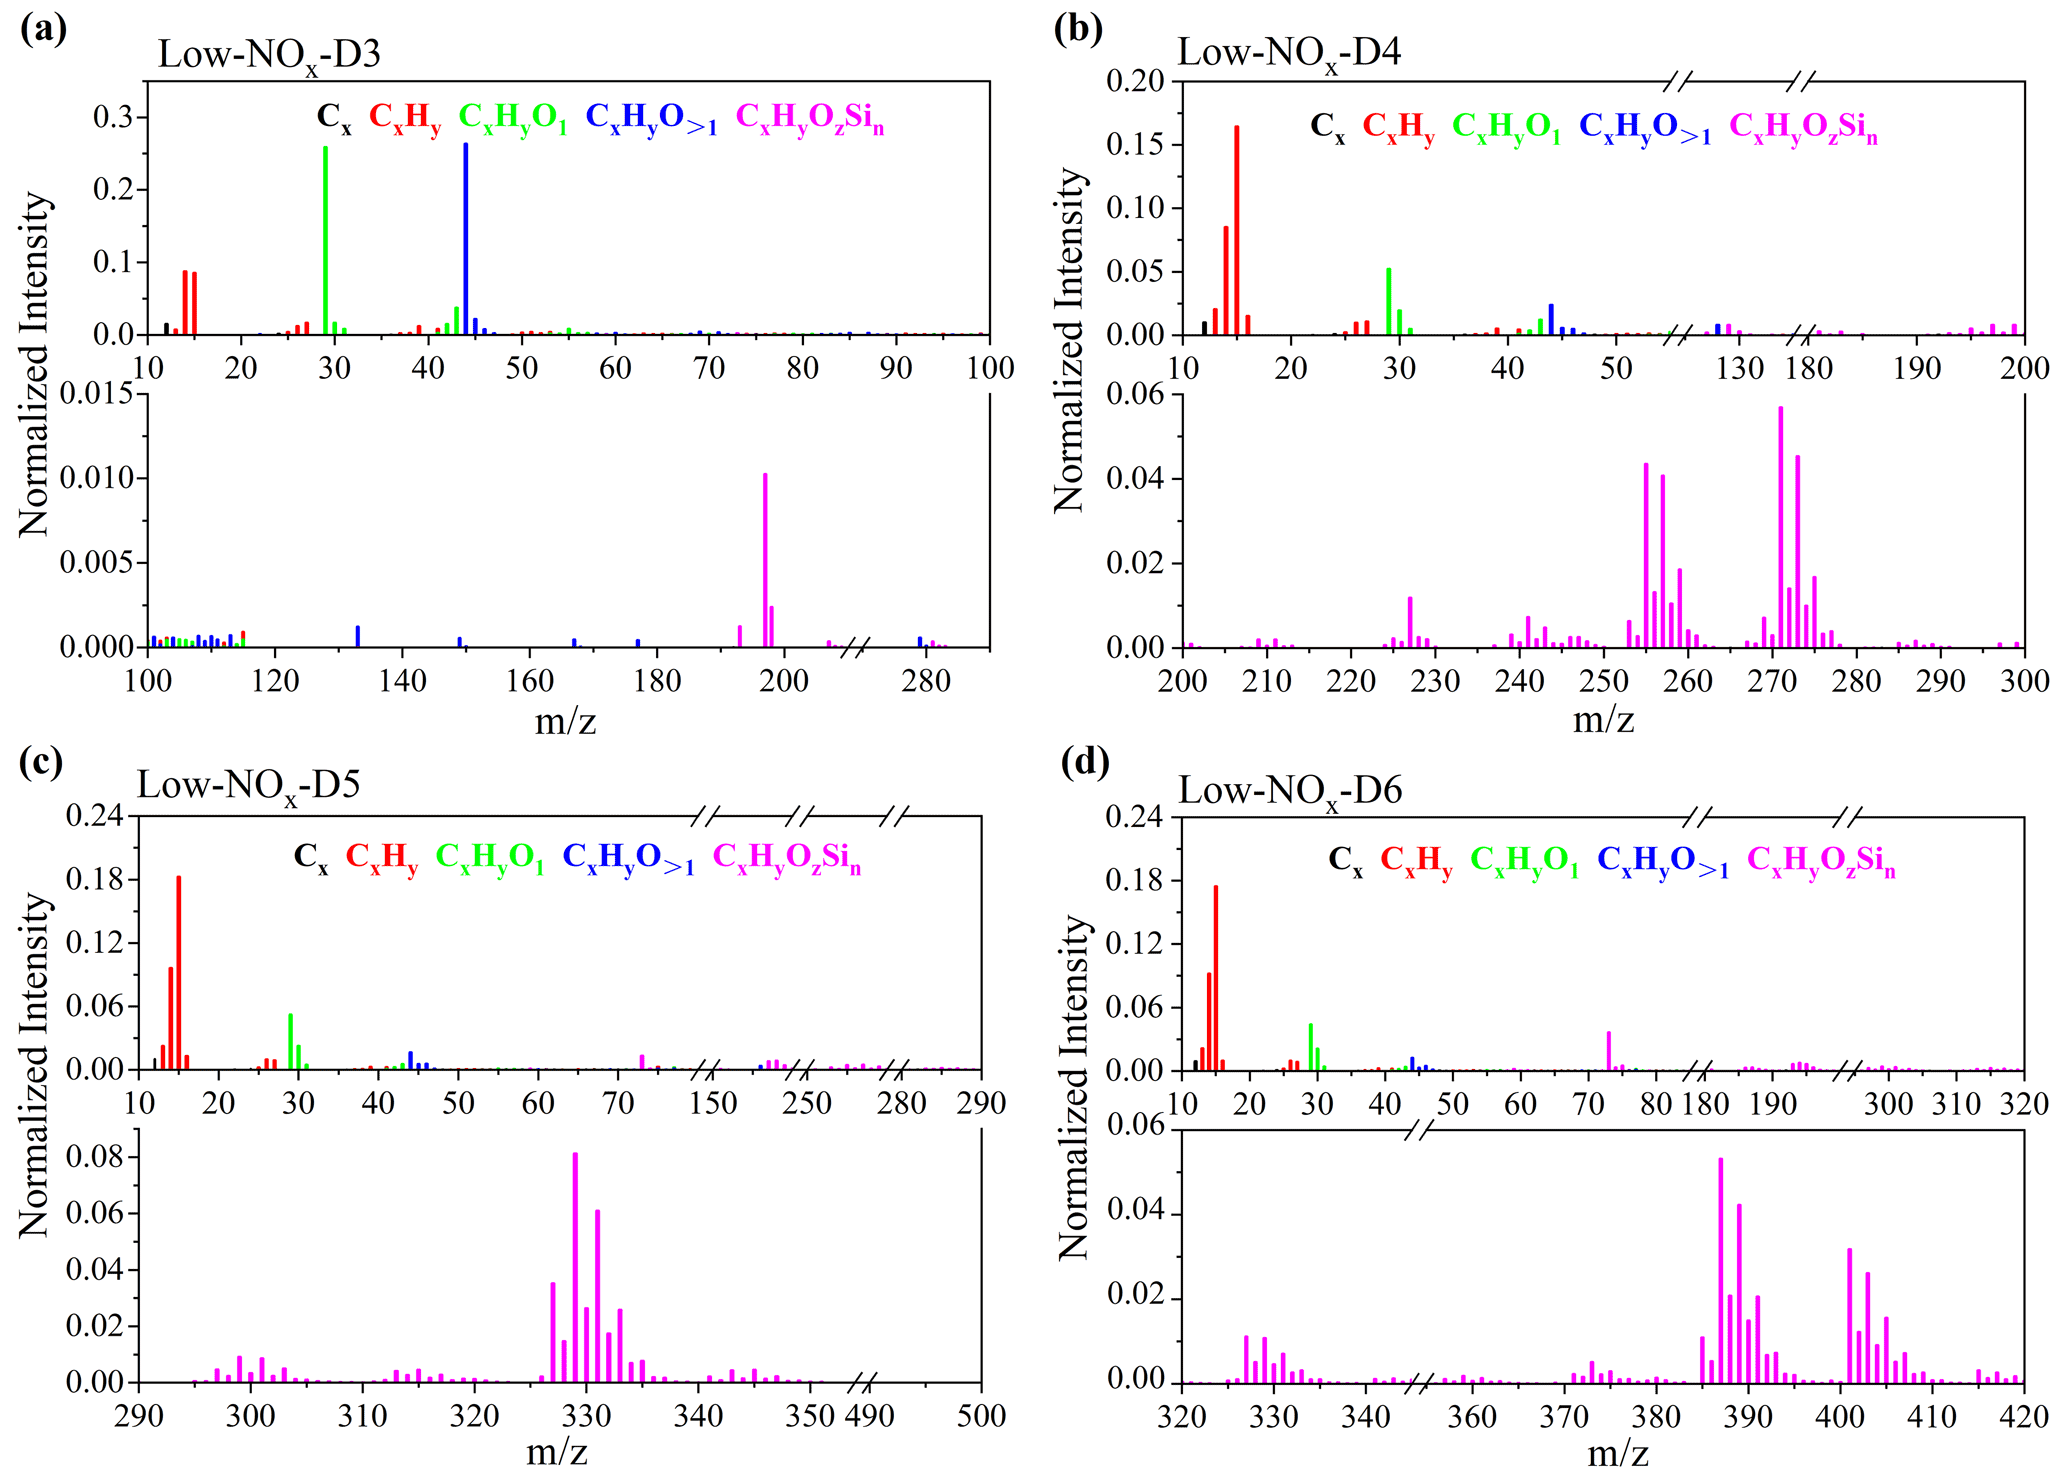
Figure 2HR-ToF-AMS mass spectra of cVMS SOAs at OH exposure of 9.0×10¹¹ molecules cm−3 s (i.e., OH concentration of 7.5×10⁹ molecules cm−3) under low-NOx conditions in unseeded experiments. Panels (a)–(d) represent the mass spectra of D3–D6 SOAs, respectively.
Figure 3 shows the evolution of different groups of ions in the HR-ToF-AMS spectra of the cVMS SOAs as a function of PA in equivalent days. For D3–D6 under unseeded conditions, CxHyO1 and CxHyO>1 ions significantly decreased within 0–4 equivalent days of PA, but remained essentially unchanged when PA increased to 7–15 equivalent days. The CxHy ion increased to its peak value at about 9 equivalent days of PA for D3 and 2–3 equivalent days of PA for D4–D6 and then gradually decreased with further PA increases. The CxHyOzSin group of ions maintained an increasing trend until 9–10 d of PA; thereafter it decreased slightly for D4–D6 SOAs.
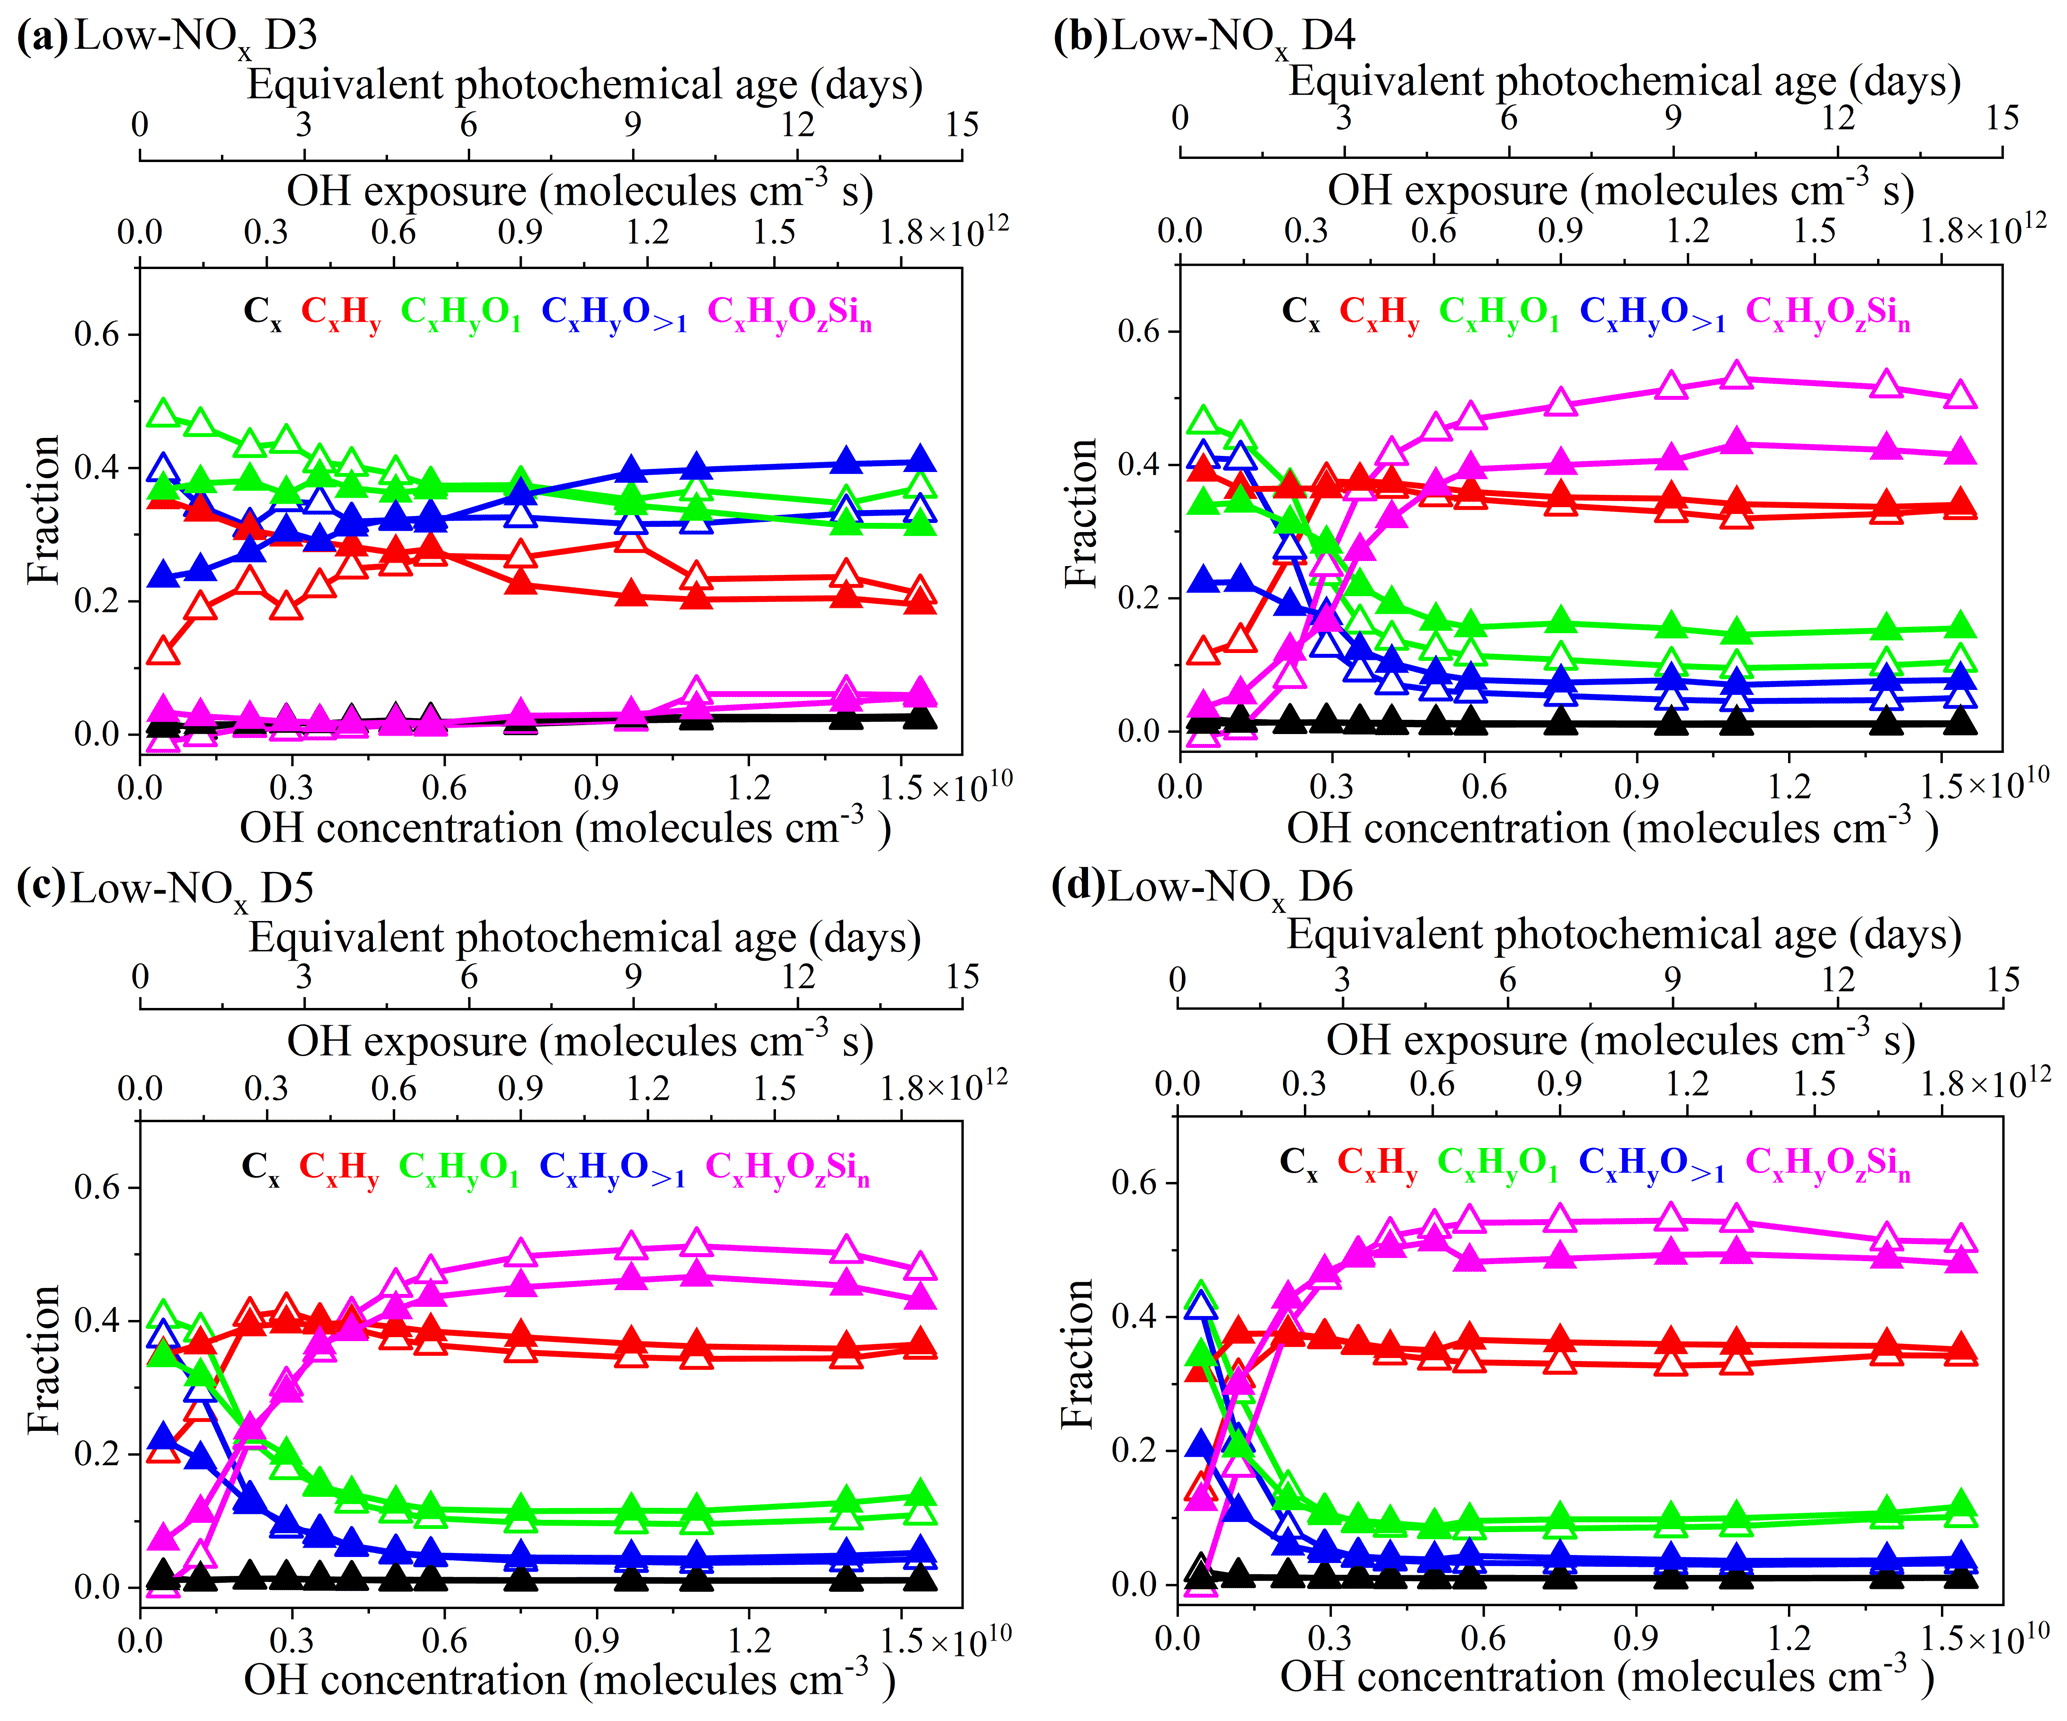
Figure 3Fraction of Cx, CxHy, CxHyO1, CxHyO>1 and CxHyOzSin ion groups for SOAs derived from the oxidation of cVMSs (a–d) by OH radicals at different photochemical ages under low-NOx conditions. Empty and solid triangles represent experimental data under unseeded and seeded conditions, respectively.
The weighted values of the Si C () and Si O () atomic ratios for the CxHyOzSin groups in D5 and D6 SOAs at different PA are plotted in Fig. S8 (detailed calculations in Text S1 in the Supplement), which can be used to indicate the changes in the Si element of SOAs. The Si C ratio increased slightly with increasing PA, whereas the Si O ratio had an overall decreasing trend. While it is difficult to separate the effect of fragmentation due to the AMS ionization process, the relative changes of group intensities and the evolution of Si C and Si O in CxHyOzSin over different PA may be attributed to the evolution of cVMSs when oxidized by the OH radicals. The initial step of OH radical oxidation is H abstraction from the methyl groups on the -Si-O- ring of the cVMSs to form Si-containing radicals, which may generate OH and CH2OH substitution products, such as silanol and silyl methanol (Wu and Johnston, 2016; Alton and Browne, 2020). Such Si-containing products may partition into SOAs and result in an appearance of CxHyOzSin ions in the AMS mass spectra. Notably, it has been reported that one of oxidation products of D5, 1-hydroxynonamethylcyclopentasiloxane (D4TOH), has been detected in ambient particulate matter (Milani et al., 2021). At low PA, some oxygen-containing functional groups (), which were formed by the reaction of methyl groups in cVMSs with OH, resulted in a decrease of Si O ratio. The Si–O bond breaking may happen mainly at high OH exposures, and it may occur after the cleavage of Si–C bonds (Rücker and Kümmerer, 2015). According to the previous study of Wu and Johnston (2017), some ring-opened products were generated from the reaction of D5 with OH radicals, necessarily requiring the cleavage of Si–O bonds. The Si–O bond cleavage from the OH radical attack may reduce the number of Si atoms, leading to a continuous decrease of Si O at high PA. The continued breaking of Si–O bonds would lead to fragmentation and more volatile products, which caused a lower SOA yield and CxHyOzSin fraction at longer PA (Figs. 1 and 3). The field measurements observed that Si acts as a frequent component of atmospheric nanoparticles (Bzdek et al., 2014). This work further determines that cVMS SOAs could become an important contributor to Si in aerosols.
As shown in Fig. 3, the presence of seeds led to some changes in the evolution trends of ion groups in the AMS spectra. For instance, the initial fraction of CxHy in seeded experiments was larger than that in unseeded experiments – which may be related to the volatility of species containing CxHy that may be more easily deposited in the presence of seeds – whereas CxHyO1 and CxHyO>1 exhibited opposite changes. The presence of seeds led to larger initial and smaller steady-state CxHyOzSin fractions than those in unseeded experiments. Regardless of the presence of seeds, CxHy, CxHyO1 and CxHyO>1 mainly contributed to the composition of all cVMS SOAs at initial OH radicals oxidation, but D4–D6 SOAs primarily consisted of CxHy and CxHyOzSin after 4 equivalent days.
3.2.2 Compositions of SOAs under high-NOx conditions
Figure S9 shows the HR-ToF-AMS mass spectra of cVMS SOAs from unseeded experiments under high-NOx conditions at OH exposures of 9.0×10¹¹ molecules cm−3 s (∼6.9 d). Compared to that under low-NOx conditions (Figs. 2 and S7), there was one additional N-containing group (NmOz) in the SOA mass spectra under high-NOx conditions, which accounted for 16 %–31 %. For the mass spectra of D3–D6 SOAs originating from unseeded experiments under high-NOx conditions in Fig. S9, the dominating peaks of the NmOz family were (NO+) and (NO). The common main peaks were located at (NO+) for cVMS SOAs, (CO) for D3–D4 SOAs, and (NO) for D4–D6 SOAs. In addition, there were other primary peaks at (CHO+) for D4 SOAs and at (CH) and (CO+) for D5–D6 SOAs. The (CO+), similar to (CO), is considered as a tracer for organic acids (Ng et al., 2010). In the mass spectra for D3–D6 SOAs under high-NOx conditions, the presence of NO+ () and NO () illustrated the formation of organic or inorganic nitrates in SOAs (Ng et al., 2007b; Zhao et al., 2018).
For the CxHyOzSin group in the D4 SOA mass spectra under high-NOx conditions, the dominating peaks and their formulas were the same as those under low-NOx conditions. For the CxHyOzSin group in D5 SOAs, in addition to two typical peaks at and 329 in the low-NOx experiments, there was another prominent peak at , with a formula of C8H12O5Si5. The CxHyOzSin group in D6 SOAs had three typical peaks at (C3H9Si), (C8H23O8Si) and (C9H21O10Si). For the CxHyOzSin groups in cVMS SOAs, there was little difference in the and n value assignment of CxHyOzSin peaks in SOAs generated under low-NOx and high-NOx conditions, suggesting the formation of similar Si-containing oxidation products.
For cVMS SOAs under high-NOx conditions, the evolution of family groups as a function of OH exposure is summarized in Fig. S10. The dominant composition at the initial stage was CxHyO>1 groups for D3–D6 SOAs. At equivalent days larger than 4, D3 SOAs primarily consisted of CxHyO>1, NmOz and CxHyO1 groups, while D4–D6 SOAs were mainly composed of CxHyOzSin, NmOz, CxHyO1, CxHy and CxHyO>1 groups. Figure S10 also shows the influences of seeds on the evolution of family groups under high-NOx conditions. It was observed that all groups in D3–D6 SOAs displayed similar change trends regardless of the existence of seeds. As shown in Fig. S11, the trend of the Si O ratio in the CxHyOzSin groups at different photochemical ages under high-NOx conditions was similar to that in low-NOx experiments. However, the Si C ratios remained almost unchanged and were close to the initial value (0.5) in cVMSs. This may be attributed to the possible suppression of cleavage of methyl groups from the -Si-O- ring of the cVMSs under high-NOx conditions.
The yields and compositions of SOAs generated from the photooxidation of four cVMSs (D3–D6) with OH radicals were investigated using an oxidation flow reactor. cVMS SOA yields exhibited an overall increasing trend with PA, and their values gradually increased with cVMSs from D3 to D6. SOA formations depended on NOx, as shown by smaller SOA yields under high-NOx conditions. Ammonium sulfate seeds significantly enhanced SOA yields of D3–D5 at short PA under high-NOx conditions. The SOA mass spectra showed that Si-containing species were one of main chemical compositions at PA >4 d.
To evaluate the potential contributions of cVMSs to SOA formation in the atmosphere, global SOA concentrations produced from cVMSs were estimated according to the cVMS SOA yields measured in this work and using the cVMS concentrations reported in multiple studies, which are listed in Table S6. Figure 4 shows the global concentration distribution of SOAs from four cVMSs (D3–D6) at 36 sites worldwide, as estimated by the Eq. (4):
where CcVMSs and CcVMS-SOAs are the mass concentrations of cVMSs reported in the literature and cVMS SOAs estimated in global sites, respectively; Cin-cVMSs and ΔCcVMSs are the mass concentrations of initial and lost cVMSs at the selected equivalent days during the experiments of this work, respectively (Table S7); Y is the cVMS SOA mass yield selected here. The estimations from the Eq. (4) were based on assumptions that the lost cVMS ratio is not affected by the cVMS concentration and that the background CcVMS-SOAs is zero. The dilution of cVMSs would occur during transportation in the atmosphere, leading to an uncertainty of cVMS concentrations (CcVMSs) in Eq. (4). To simplify the estimation process, the effect of dilution on CcVMSs was not taken into account, and the reported CcVMSs values were directly used. It was noted that the time-integrated consumption over the lifetime of a precursor compound in the atmosphere should be suitable for evaluating the SOA formation. Accordingly, when considering atmospheric half-lives (6–30 d) of cVMSs, the values in low-NOx and unseeded experiments at 14.2 equivalent days (Table S7) are used to calculate cVMS SOAs at background and polar sites. Due to a short residence time of air mass over urban areas, the values in high-NOx and seeded experiments at 0.63 equivalent days (Table S7) are employed to estimate cVMS SOAs at urban sites.

Figure 4Global concentrations of cVMS SOAs (ng m−3) on the basis of the cVMS concentrations reported in multiple studies and the cVMS SOA yields measured in this work. The numbers of polar, background and urban sites are enclosed in pink, white circles and gray boxes, respectively. The details about cVMS and SOA concentrations at different sites are summarized in Table S6 in the Supplement.
It should be noted that OH concentrations and exposures have different effects on the reaction systems, leading to different SOA yields. Under an ideal condition, a low OH concentration for a long exposure time and a high OH concentration for a short exposure time could achieve the same degree of degradation of the precursor compound. However, this is not applicable for the formation of SOAs. Charan et al. (2022) have claimed that D5 SOA yields are dependent on the OH concentrations rather than OH exposures. When extrapolating the laboratory data to the real atmosphere, it is necessary to consider atmospherically relevant OH concentrations and exposures. Charan et al. (2022) also stated that the D5 SOA yield varied in a small range (0 %–6 %) at the OH concentration molecules cm−3. It was assumed that the SOA yields at environmentally relevant OH concentrations (∼106 molecules cm−3) were similar to those at the lowest OH concentrations (∼108 molecules cm−3) used here. Thus, the high-NOx SOA yields (D3: 0.038; D4: 0.001; D5: 0.011; D6: 0.000) under the seeded conditions at the OH concentration of 6.83×10⁸ molecules cm−3 (0.63 equivalent days) were employed in the calculation of cVMS SOA concentrations at urban sites, while the low-NOx SOA yields (D3: 0.041; D4: 0.013; D5: 0.023; D6: 0.004) under the unseeded conditions at the OH concentration of 4.57×10⁸ molecules cm−3 (0.42 equivalent days) were used to estimate cVMS SOAs at background and polar sites. Although there may be some uncertainties in extrapolating our results to the real atmosphere, these extrapolations may still provide an estimation for understanding the SOA potential of cVMSs.
Table S6 summarizes the details regarding sites and concentrations of cVMS SOAs. The derived concentrations of cVMS SOAs vary significantly among urban, background and polar sites. The total cVMS SOA concentrations in urban areas are the highest, up to 33.52 ng m−3, which was comparable with the maximum cVMS SOA formation (21 ng m−3) reported by Pennington et al. (2021) using the CMAQ model for Los Angeles. They are 0.57–8.86 and 0.37–1.97 ng m−3 for background and Arctic sites, respectively. cVMS SOA concentrations in urban regions of Asia (sites 29–36) and Europe (sites 26–28) are generally larger than those of North America (sites 20–25). In China, the total cVMS SOA concentrations in urban sites range from 0.11 to 33.52 ng m−3. The main precursors of cVMS SOAs are different among Chinese cities. For three cities along the southeast coast of China (Guangzhou, Macau and Foshan), the dominant precursors of cVMS SOAs are D3 and D4, which are related to industrial emissions of these two siloxanes in this region (Wang et al., 2001). For Dalian in China, D5 mainly contributes to cVMS SOAs, which can be attributed to the industrial production and the use of personal care products in Dalian (Li et al., 2020). In the other Chinese urban areas with reported cVMS concentrations (Lhasa, Golmud, Kunming and Yantai), the total cVMS SOA concentrations are considerably smaller than those in the urban areas above, with D5 acting as the main precursor, which may be ascribed to the relatively low population densities in these cities (Wang et al., 2018).
At urban sites in Europe and North America, cVMS SOA concentrations are reported in the range of 0.91–9.16 and 0.19–3.23 ng m−3, respectively. Among these cVMSs, D5 is the main contributor to cVMS SOAs at these locations, averaging 89.1 % of total cVMS SOAs. For instance, D5 SOAs are calculated to be 5.63 ng m−3 in Catalonia, Spain; 3.19 ng m−3 in Chicago, USA; 1.89 ng m−3 in Zurich, Switzerland; and 0.81 ng m−3 in Paris, France, where there are high levels of economic activity and high population densities. These results suggest that personal care products as one of the main sources of D5 may be the most important anthropogenic origin of Si-containing SOAs in Europe and North America. The D5 SOA concentration (0.11–5.63 ng m−3) estimated here is larger than that (0.016–0.206 ng m−3) reported by Milani et al. (2021), who obtained their data using semi-quantified concentrations of D4TOH (first-generation D5 SOA product) extracted from PM2.5 samples in Atlanta and Houston. The difference may be mainly attributed to the missing analysis of multi-generation SOA products or dimers (Wu and Johnston, 2016, 2017).
At background and Arctic sites, cVMS SOAs are primarily derived from D3, D4 and D5. The background sites are located in mountains, rural areas, forested areas, lakes and at high altitudes. The three highest cVMS SOA concentrations at background sites are located at Kosetice in the Czech Republic (8.86 ng m−3), the Tibetan Plateau in China (6.78 ng m−3) and Hilo of Hawaii in the USA (5.97 ng m−3), where the contribution percentages of SOAs from D3 to D5 are 92.8 %, 99.9 % and 99.0 %, respectively. The cVMS SOA concentrations at the Alert site in Nunavut, Canada, are the highest (1.97 ng m−3) among the three locations in the Arctic, 92.4 % of which are accounted for by D3–D5 SOAs. The dominance of D3–D5 SOAs in both background and the Arctic regions highlights their persistence in the atmosphere and their potential for long-range atmospheric transport.
The global annual production of D4, D5 and D6 is about 1, 0.1 and 0.01 Tg yr−1, respectively, and 90 % of these cVMSs are eventually released into the atmosphere (Li et al., 2020; Genualdi et al., 2011; Wang et al., 2013; Sakurai et al., 2019). Based on the results shown in Fig. 4, the annual production of cVMS (D4–D6) SOAs was estimated to be 0.01 Tg yr−1, which was about 0.34 % of SOAs (2.9 Tg yr−1) produced from mobile source emissions in the USA and 33 %–50 % of SOAs generated by Athabasca oil sands (0.02–0.03 Tg yr−1, one of the largest sources of anthropogenic secondary organic aerosols in North America) (Tkacik et al., 2014; Liggio et al., 2016). Moreover, it was 0.05 % and 0.14 % of isoprene SOAs (20 Tg yr−1) and monoterpenes SOAs (7 Tg yr−1) (typical biogenic SOAs), respectively, indicating the potential importance of cVMS SOAs (Jokinen et al., 2015). While these cVMS SOA sources may seem small, they could make substantially higher contributions to ambient air SOAs in population centers where cVMS compounds are primarily used.
The data used in this study are available from the corresponding author upon request (shaomeng.li@pku.edu.cn).
The supplement related to this article is available online at: https://doi.org/10.5194/acp-22-10827-2022-supplement.
CH designed and conducted all experiments; CH and HY analyzed the data and prepared the paper with contributions from KL, PL, JL, AL and SML. SML supervised the project.
At least one of the (co-)authors is a member of the editorial board of Atmospheric Chemistry and Physics. The peer-review process was guided by an independent editor, and the authors also have no other competing interests to declare.
Publisher's note: Copernicus Publications remains neutral with regard to jurisdictional claims in published maps and institutional affiliations.
This project was supported by Environment and Climate Change Canada's Climate and Clean Air Program (CCAP), the National Natural Science Foundation of China (grant no. 42077198), the LiaoNing Revitalization Talents Program (XLYC1907185), and the Fundamental Research Funds for the Central Universities (N2025011).
This research has been supported by the National Natural Science Foundation of China (grant no. 42077198), the Liaoning Revitalization Talents Program (grant no. XLYC1907185), and the Fundamental Research Funds for the Central Universities (grant no. N2025011).
This paper was edited by Jason Surratt and reviewed by three anonymous referees.
Ahrens, L., Harner, T., and Shoeib, M.: Temporal Variations of Cyclic and Linear Volatile Methylsiloxanes in the Atmosphere Using Passive Samplers and High-Volume Air Samplers, Environ. Sci. Technol., 48, 9374–9381, https://doi.org/10.1021/es502081j, 2014.
Allen, R., Kochs, P., and Chandra, G.: Industrial Organosilicon Materials, Their Environmental Entry and Predicted Fate, edited by: Chandra, G., Springer, 3, 1–25, https://doi.org/10.1007/978-3-540-68331-5_1, 1997.
Alton, M. and Browne, E.: Atmospheric Chemistry of Volatile Methyl Siloxanes: Kinetics and Products of Oxidation by OH Radicals and Cl Atoms, Environ. Sci. Technol., 54, 5992–5999, https://doi.org/10.1021/acs.est.0c01368, 2020.
Atkinson, R.: Kinetics of the Gas-Phase Reactions of a Series of Organosilicon Compounds with OH and NO3 Radicals and O3 at 297±2 K, Environ. Sci. Technol., 25, 863–866, https://doi.org/10.1021/es00017a005, 1991.
Bein, K., Zhao, Y., Wexler, A., and Johnston, M.: Speciation of Size-Resolved Individual Ultrafine Particles in Pittsburgh, Pennsylvania, J. Geophys. Res., 110, D07S05, https://doi.org/10.1029/2004jd004708, 2005.
Berndt, T., Richters, S., Jokinen, T., Hyttinen, N., Kurtén, T., Otkjaer, R., Kjaergaard, H., Stratmann, F., Herrmann, H., Sipilä, M., Kulmala, M., and Ehn, M.: Hydroxyl Radical-Induced Formation of Highly Oxidized Organic Compounds, Nat. Commun., 7, 1–8, https://doi.org/10.1038/ncomms13677, 2016.
Bruns, E. A., El Haddad, I., Keller, A., Klein, F., Kumar, N. K., Pieber, S. M., Corbin, J. C., Slowik, J. G., Brune, W. H., Baltensperger, U., and Prévôt, A. S. H.: Inter-comparison of laboratory smog chamber and flow reactor systems on organic aerosol yield and composition, Atmos. Meas. Tech., 8, 2315–2332, https://doi.org/10.5194/amt-8-2315-2015, 2015.
Bzdek, B., Horan, A., Pennington, M., Janechek, N., Baek, J., Stanier, C., and Johnston, M.: Silicon is a Frequent Component of Atmospheric Nanoparticles, Environ. Sci. Technol., 48, 11137–11145, https://doi.org/10.1021/es5026933, 2014.
Canada, E. C. H. C.: https://www.ec.gc.ca/ese-ees/FC0D11E7-DB34-41AA-B1B3-E66EFD8813F1/batch2_540-97-6_en.pdf (last access: 9 February 2022), 2008.
Chan, A. W. H., Kautzman, K. E., Chhabra, P. S., Surratt, J. D., Chan, M. N., Crounse, J. D., Kürten, A., Wennberg, P. O., Flagan, R. C., and Seinfeld, J. H.: Secondary organic aerosol formation from photooxidation of naphthalene and alkylnaphthalenes: implications for oxidation of intermediate volatility organic compounds (IVOCs), Atmos. Chem. Phys., 9, 3049–3060, https://doi.org/10.5194/acp-9-3049-2009, 2009.
Chandramouli, B. and Kamens, R.: The Photochemical Formation and Gas-Particle Partitioning of Oxidation Products of Decamethyl Cyclopentasiloxane and Decamethyl Tetrasiloxane in the Atmosphere, Atmos. Environ., 35, 87–95, https://doi.org/10.1016/S1352-2310(00)00289-2, 2001.
Charan, S. M., Huang, Y., Buenconsejo, R. S., Li, Q., Cocker III, D. R., and Seinfeld, J. H.: Secondary organic aerosol formation from the oxidation of decamethylcyclopentasiloxane at atmospherically relevant OH concentrations, Atmos. Chem. Phys., 22, 917–928, https://doi.org/10.5194/acp-22-917-2022, 2022.
Coggon, M., McDonald, B., Vlasenko, A., Veres, P., Bernard, F., Koss, A., Yuan, B., Gilman, J., Peischl, J., Aikin, K., DuRant, J., Warneke, C., Li, S.-M., and Gouw, J.: Diurnal Variability and Emission Pattern of Decamethylcyclopentasiloxane (D5) from the Application of Personal Care Products in Two North American Cities, Environ. Sci. Technol., 52, 5610–5618, https://doi.org/10.1021/acs.est.8b00506, 2018.
EUR-Lex: https://eur-lex.europa.eu/legal-content/EN/TXT/?uri=uriserv:OJ.L_.2018.006.01.0045.01.ENG&toc=OJ:L:2018:006:TOCECHA (last access: 25 November 2021), 2018.
Farasani, A. and Darbre, P.: Exposure to Cyclic Volatile Methylsiloxanes (cVMS) Causes Anchorage-Independent Growth and Reduction of BRCA1 in Non-Transformed Human Breast Epithelial Cells, J. Appl. Toxicol., 37, 454–461, https://doi.org/10.1002/jat.3378, 2017.
Genualdi, S., Harner, T., Cheng, Y., Macleod, M., Hansen, K., Egmond, R., Shoeib, M., and Lee, S.: Global Distribution of Linear and Cyclic Volatile Methyl Siloxanes in Air, Environ. Sci. Technol., 45, 3349–3354, https://doi.org/10.1021/es200301j, 2011.
Glasius, M. and Goldstein, A.: Recent Discoveries and Future Challenges in Atmospheric Organic Chemistry, Environ. Sci. Technol., 50, 2754–2764, https://doi.org/10.1021/acs.est.5b05105, 2016.
Guo, J., Zhou, Y., Cui, J., Zhang, B., and Zhang, J.: Assessment of Volatile Methylsiloxanes in Environmental Matrices and Human Plasma, Sci. Total. Environ., 668, 1175–1182, https://doi.org/10.1016/j.scitotenv.2019.03.092, 2019.
Huang, Y., Coggon, M. M., Zhao, R., Lignell, H., Bauer, M. U., Flagan, R. C., and Seinfeld, J. H.: The Caltech Photooxidation Flow Tube reactor: design, fluid dynamics and characterization, Atmos. Meas. Tech., 10, 839–867, https://doi.org/10.5194/amt-10-839-2017, 2017.
Janechek, N. J., Hansen, K. M., and Stanier, C. O.: Comprehensive atmospheric modeling of reactive cyclic siloxanes and their oxidation products, Atmos. Chem. Phys., 17, 8357–8370, https://doi.org/10.5194/acp-17-8357-2017, 2017.
Janechek, N. J., Marek, R. F., Bryngelson, N., Singh, A., Bullard, R. L., Brune, W. H., and Stanier, C. O.: Physical properties of secondary photochemical aerosol from OH oxidation of a cyclic siloxane, Atmos. Chem. Phys., 19, 1649–1664, https://doi.org/10.5194/acp-19-1649-2019, 2019.
Jokinen, T., Berndt, T., Makkonen, R., Kerminen, V., Junninen, H., Paasonen, P., Stratmann, F., Herrmann, H., Guenther, A., Worsnop, D., Kulmala, M., Ehn, M., and Sipilä, M.: Production of Extremely Low Volatile Organic Compounds from Biogenic Emissions: Measured Yields and Atmospheric Implications, P. Natl. Acad. Sci. USA, 112, 7123–7128, https://doi.org/10.1073/pnas.1423977112, 2015.
Kierkegaard, A. and McLachlan, M.: Determination of Linear and Cyclic Volatile Methylsiloxanes in Air at a Regional Background Site in Sweden, Atmos. Environ., 80, 322–329, https://doi.org/10.1016/j.atmosenv.2013.08.001, 2013.
Kim, J. and Xu, S.: Quantitative Structure-Reactivity Relationships of Hydroxyl Radical Rate Constants for Linear and Cyclic Volatile Methylsiloxanes, Environ. Toxicol. Chem., 36, 3240–3245, https://doi.org/10.1002/etc.3914, 2017.
Kim, J., Mackay, D., and Whelan, M.: Predicted Persistence and Response Times of Linear and Cyclic Volatile Methylsiloxanes in Global and Local Environments, Chemosphere, 195, 325–335, https://doi.org/10.1016/j.chemosphere.2017.12.071, 2018.
Krogseth, I., Zhang, X., Lei, Y., Wania, F., and Breivik, K.: Calibration and Application of a Passive Air Sampler (XAD-PAS) for Volatile Methyl Siloxanes, Environ. Sci. Technol., 47, 4463–4470, https://doi.org/10.1021/es400427h, 2013a.
Krogseth, I., Kierkegaard, A., McLachlan, M., Breivik, K., Hansen, K., and Schlabach, M.: Occurrence and Seasonality of Cyclic Volatile Methyl Siloxanes in Arctic Air, Environ. Sci. Technol., 47, 502–509, https://doi.org/10.1021/es3040208, 2013b.
Lambe, A. T., Ahern, A. T., Williams, L. R., Slowik, J. G., Wong, J. P. S., Abbatt, J. P. D., Brune, W. H., Ng, N. L., Wright, J. P., Croasdale, D. R., Worsnop, D. R., Davidovits, P., and Onasch, T. B.: Characterization of aerosol photooxidation flow reactors: heterogeneous oxidation, secondary organic aerosol formation and cloud condensation nuclei activity measurements, Atmos. Meas. Tech., 4, 445–461, https://doi.org/10.5194/amt-4-445-2011, 2011.
Lambe, A. T., Chhabra, P. S., Onasch, T. B., Brune, W. H., Hunter, J. F., Kroll, J. H., Cummings, M. J., Brogan, J. F., Parmar, Y., Worsnop, D. R., Kolb, C. E., and Davidovits, P.: Effect of oxidant concentration, exposure time, and seed particles on secondary organic aerosol chemical composition and yield, Atmos. Chem. Phys., 15, 3063–3075, https://doi.org/10.5194/acp-15-3063-2015, 2015.
Lambe, A., Massoli, P., Zhang, X., Canagaratna, M., Nowak, J., Daube, C., Yan, C., Nie, W., Onasch, T., Jayne, J., Kolb, C., Davidovits, P., Worsnop, D., and Brune, W.: Controlled nitric oxide production via O(1D) + N2O reactions for use in oxidation flow reactor studies, Atmos. Meas. Tech., 10, 2283–2298, https://doi.org/10.5194/amt-10-2283-2017, 2017.
Lamkaddam, H., Gratien, A., Pangui, E., Cazaunau, M., Varrault, B., and Doussin, J.: High-NOx Photooxidation of n-Dodecane: Temperature Dependence of SOA Formation, Environ. Sci. Technol., 51, 192–201, https://doi.org/10.1021/acs.est.6b03821, 2017.
Lee, A. K. Y., Hayden, K. L., Herckes, P., Leaitch, W. R., Liggio, J., Macdonald, A. M., and Abbatt, J. P. D.: Characterization of aerosol and cloud water at a mountain site during WACS 2010: secondary organic aerosol formation through oxidative cloud processing, Atmos. Chem. Phys., 12, 7103–7116, https://doi.org/10.5194/acp-12-7103-2012, 2012.
Li, K., Liggio, J., Lee, P., Han, C., Liu, Q., and Li, S.-M.: Secondary organic aerosol formation from α-pinene, alkanes, and oil-sands-related precursors in a new oxidation flow reactor, Atmos. Chem. Phys., 19, 9715–9731, https://doi.org/10.5194/acp-19-9715-2019, 2019a.
Li, K., Liggio, J., Han, C., Liu, Q., Moussa, S., Lee, P., and Li, S.-M.: Understanding the Impact of High-NOx Conditions on the Formation of Secondary Organic Aerosol in the Photooxidation of Oil Sand-Related Precursors, Environ. Sci. Technol., 53, 14420–14429, https://doi.org/10.1021/acs.est.9b05404, 2019b.
Li, Q., Lan, Y., Liu, Z., Wang, X., Wang, X., Hu, J., and Geng, H.: Cyclic Volatile Methylsiloxanes (cVMSs) in the Air of the Wastewater Treatment Plants in Dalian, China-Levels, Emissions, and Trends, Chemosphere, 256, 1–8, https://doi.org/10.1016/j.chemosphere.2020.127064, 2020.
Li, S.-M. and Winchester, J.: Particle Size Distribution and Chemistry of Late Winter Arctic Aerosols, J. Geophys. Res., 95, 13897–13908, https://doi.org/10.1029/JD095iD09p13897, 1990.
Li, S.-M. and Winchester, J.: Aerosol Silicon and Associated Elements in the Arctic High and Mid-Troposphere, Atmos. Environ., 27, 2907–2912, https://doi.org/10.1016/0960-1686(93)90322-P, 1993.
Liggio, J., Li, S.-M., Hayden, K., Taha, Y., Stroud, C., Darlington, A., Drollette, B., Gordon, M., Lee, P., Liu, P., Leithead, A., Moussa, S., Wang, D., Brien, J., Mittermeier, R., Brook, J., Lu, G., Staebler, R., Han, Y., Tokarek, T., Osthoff, H., Makar, P., Zhang, J., Plata, D., and Gentner, D.: Oil Sands Operations as a Large Source of Secondary Organic Aerosols, Nature, 534, 91–94, https://doi.org/10.1038/nature17646, 2016.
Liu, N., Xu, L., and Cai, Y.: Methyl Siloxanes in Barbershops and Residence Indoor Dust and the Implication for Human Exposures, Sci. Total. Environ., 618, 1324–1330, https://doi.org/10.1016/j.scitotenv.2017.09.250, 2018.
Mao, J., Ren, X., Brune, W. H., Olson, J. R., Crawford, J. H., Fried, A., Huey, L. G., Cohen, R. C., Heikes, B., Singh, H. B., Blake, D. R., Sachse, G. W., Diskin, G. S., Hall, S. R., and Shetter, R. E.: Airborne measurement of OH reactivity during INTEX-B, Atmos. Chem. Phys., 9, 163–173, https://doi.org/10.5194/acp-9-163-2009, 2009.
McFiggans, G., Mentel, T., Wildt, J., Pullinen, I., Kang, S., Kleist, E., Schmitt, S., Springer, M., Tillmann, R., Wu, C., Zhao, D., Hallquist, M., Faxon, C., Breton, M., Hallquist, A., Simpson, D., Bergström, R., Jenkin, M., Ehn, M., Thornton, J., Alfarra, M., Bannan, T., Percival, C., Priestley, M., Topping, D., and Scharr, A.: Secondary Organic Aerosol Reduced by Mixture of Atmospheric Vapours, Nature, 565, 587–593, https://doi.org/10.1038/s41586-018-0871-y, 2019.
Milani, A., Al-Naiema, I., and Stone, E.: Detection of a Secondary Organic Aerosol Tracer Derived from Personal Care Products, Atmos. Environ., 246, 118078, https://doi.org/10.1016/j.atmosenv.2020.118078, 2021.
Ng, N. L., Kroll, J. H., Chan, A. W. H., Chhabra, P. S., Flagan, R. C., and Seinfeld, J. H.: Secondary organic aerosol formation from m-xylene, toluene, and benzene, Atmos. Chem. Phys., 7, 3909–3922, https://doi.org/10.5194/acp-7-3909-2007, 2007a.
Ng, N. L., Chhabra, P. S., Chan, A. W. H., Surratt, J. D., Kroll, J. H., Kwan, A. J., McCabe, D. C., Wennberg, P. O., Sorooshian, A., Murphy, S. M., Dalleska, N. F., Flagan, R. C., and Seinfeld, J. H.: Effect of NOx level on secondary organic aerosol (SOA) formation from the photooxidation of terpenes, Atmos. Chem. Phys., 7, 5159–5174, https://doi.org/10.5194/acp-7-5159-2007, 2007b.
Ng, N., Canagaratna, M., Zhang, Q., Jimenez, J., Tian, J., Ulbrich, I., Kroll, J., Docherty, K., Chhabra, P., Bahreini, R., Murphy, S., Seinfeld, J., Hildebrandt, L., Donahue, N., DeCarlo, P., Lanz, V., Prévôt, A., Dinar, E., Rudich, Y., and Worsnop, D.: Organic Aerosol Components Observed in Northern Hemispheric Datasets from Aerosol Mass Spectrometry, Atmos. Chem. Phys., 10, 4625–4641, https://doi.org/10.5194/acp-10-4625-2010, 2010.
Peng, Z., Palm, B., Day, D., Talukdar, R., Hu, W., Lambe, A., Brune, W., and Jimenez, J.: Model Evaluation of New Techniques for Maintaining High-NO Conditions in Oxidation Flow Reactors for the Study of OH-Initiated Atmospheric Chemistry, ACS. Earth. Space. Chem., 2, 72–86, https://doi.org/10.1021/acsearthspacechem.7b00070, 2018.
Peng, Z., Lee-Taylor, J., Orlando, J. J., Tyndall, G. S., and Jimenez, J. L.: Organic peroxy radical chemistry in oxidation flow reactors and environmental chambers and their atmospheric relevance, Atmos. Chem. Phys., 19, 813–834, https://doi.org/10.5194/acp-19-813-2019, 2019.
Pennington, E. A., Seltzer, K. M., Murphy, B. N., Qin, M., Seinfeld, J. H., and Pye, H. O. T.: Modeling secondary organic aerosol formation from volatile chemical products, Atmos. Chem. Phys., 21, 18247–18261, https://doi.org/10.5194/acp-21-18247-2021, 2021.
Phares, D., Rhoads, K., Johnston, M., and Wexler, A.: Size-Resolved Ultrafine Particle Composition Analysis 2. Houston, J. Geophys. Res., 108, 1–14, https://doi.org/10.1029/2001jd001212, 2003.
Presto, A., Hartz, K., and Donahue, N.: Secondary Organic Aerosol Production from Terpene Ozonolysis. 2. Effect of NOx Concentration, Environ. Sci. Technol., 39, 7046–7054, https://doi.org/10.1021/es050400s, 2005.
Rauert, C., Shoieb, M., Schuster, J., Eng, A., and Harner, T.: Atmospheric Concentrations and Trends of Poly- and Perfluoroalkyl Substances (PFAS) and Volatile Methyl Siloxanes (VMS) over 7 Years of Sampling in the Global Atmospheric Passive Sampling (GAPS) Network, Environ. Pollut., 238, 94–102, https://doi.org/10.1016/j.envpol.2018.03.017, 2018.
Rhoads, K., Phares, D., Wexler, A., and Johnston, M.: Size-Resolved Ultrafine Particle Composition Analysis 1. Atlanta, J. Geophys. Res., 108, 1–13, https://doi.org/10.1029/2001jd001211, 2003.
Riipinen, I., Juuti, T., Pierce, J., Petäjä, T., Worsnop, D., Kulmala, M., and Donahue, N.: The Contribution of Organics to Atmospheric Nanoparticle Growth, Nat. Geosci., 5, 453–458, https://doi.org/10.1038/ngeo1499, 2012.
Rücker, C. and Kümmerer, K.: Environmental Chemistry of Organosiloxanes, Chem. Rev., 115, 466–524, https://doi.org/10.1021/cr500319v, 2015.
Safron, A., Strandell, M., Kierkegaard, A., and Macleod, M.: Rate Constants and Activation Energies for Gas-Phase Reactions of Three Cyclic Volatile Methyl Siloxanes with the Hydroxyl Radical, Int. J. Chem. Kinet., 47, 420–428, https://doi.org/10.1002/kin.20919, 2015.
Sakurai, T., Imaizumi, Y., Kuroda, K., Hayashi, T., and Suzuki, N.: Georeferenced multimedia environmental fate of volatile methylsiloxanes modeled in the populous Tokyo Bay catchment basin, Sci. Total Environ., 689, 843–853, https://doi.org/10.1016/j.scitotenv.2019.06.462, 2019.
Sarrafzadeh, M., Wildt, J., Pullinen, I., Springer, M., Kleist, E., Tillmann, R., Schmitt, S. H., Wu, C., Mentel, T. F., Zhao, D., Hastie, D. R., and Kiendler-Scharr, A.: Impact of NOx and OH on secondary organic aerosol formation from β-pinene photooxidation, Atmos. Chem. Phys., 16, 11237–11248, https://doi.org/10.5194/acp-16-11237-2016, 2016.
Simonen, P., Saukko, E., Karjalainen, P., Timonen, H., Bloss, M., Aakko-Saksa, P., Rönkkö, T., Keskinen, J., and Dal Maso, M.: A new oxidation flow reactor for measuring secondary aerosol formation of rapidly changing emission sources, Atmos. Meas. Tech., 10, 1519–1537, https://doi.org/10.5194/amt-10-1519-2017, 2017.
Sommerlade, R., Parlar, H., Wrobel, D., and Kochs, P.: Product Analysis and Kinetics of the Gas-Phase Reactions of Selected Organosilicon Compounds with OH Radicals Using a Smog Chamber-Mass Spectrometer System, Environ. Sci. Technol., 27, 2435–2440, https://doi.org/10.1021/es00048a019, 1993.
Tang, X., Misztal, P., Nazaroff, W., and Goldstein, A.: Siloxanes Are the Most Abundant Volatile Organic Compound Emitted from Engineering Students in a Classroom, Environ. Sci. Technol. Lett., 2, 303–307, https://doi.org/10.1021/acs.estlett.5b00256, 2015.
Tkacik, D., Lambe, A., Jathar, S., Li, X., Presto, A., Zhao, Y., Blake, D., Meinardi, S., Jayne, J., Croteau, P., and Robinson, A.: Secondary Organic Aerosol Formation from in-Use Motor Vehicle Emissions Using a Potential Aerosol Mass Reactor, Environ. Sci. Technol., 48, 11235–11242, https://doi.org/10.1021/es502239v, 2014.
Wang, D.-G., Norwood, W., Alaee, M., Byer, J., and Brimble, S.: Review of Recent Advances in Research on the Toxicity, Detection, Occurrence and Fate of Cyclic Volatile Methyl Siloxanes in the Environment, Chemosphere, 93, 711–725, https://doi.org/10.1016/j.chemosphere.2012.10.041, 2013.
Wang, X., Lee, S., Sheng, G., Chan, L., Fu, J., Li, X., Min, Y., and Chan, C.: Cyclic organosilicon compounds in ambient air in Guangzhou, Macau and Nanhai, Pearl River Delta, Appl. Geochemistry, 16, 1447–1454, https://doi.org/10.1016/S0883-2927(01)00044-0, 2001.
Wang, X., Schuster, J., Jones, K. C., and Gong, P.: Occurrence and spatial distribution of neutral perfluoroalkyl substances and cyclic volatile methylsiloxanes in the atmosphere of the Tibetan Plateau, Atmos. Chem. Phys., 18, 8745–8755, https://doi.org/10.5194/acp-18-8745-2018, 2018.
Wildt, J., Mentel, T. F., Kiendler-Scharr, A., Hoffmann, T., Andres, S., Ehn, M., Kleist, E., Müsgen, P., Rohrer, F., Rudich, Y., Springer, M., Tillmann, R., and Wahner, A.: Suppression of new particle formation from monoterpene oxidation by NOx, Atmos. Chem. Phys., 14, 2789–2804, https://doi.org/10.5194/acp-14-2789-2014, 2014.
Wu, Y. and Johnston, M.: Molecular Characterization of Secondary Aerosol from Oxidation of Cyclic Methylsiloxanes, J. Am. Soc. Mass Spectrom., 27, 402–409, https://doi.org/10.1007/s13361-015-1300-1, 2016.
Wu, Y. and Johnston, M.: Aerosol Formation from OH Oxidation of the Volatile Cyclic Methyl Siloxane (cVMS) Decamethylcyclopentasiloxane, Environ. Sci. Technol., 51, 4445–4451, https://doi.org/10.1021/acs.est.7b00655, 2017.
Xiao, R., Zammit, I., Wei, Z., Hu, W.-P., MacLeod, M., and Spinney, R.: Kinetics and Mechanism of the Oxidation of Cyclic Methylsiloxanes by Hydroxyl Radical in the Gas Phase: An Experimental and Theoretical Study, Environ. Sci. Technol., 49, 13322–13330, https://doi.org/10.1021/acs.est.5b03744, 2015.
Xu, S., Warner, N., Nizzetto, P., Durham, J., and McNett, D.: Long-Range Transport Potential and Atmospheric Persistence of Cyclic Volatile Methylsiloxanes Based on Global Measurements, Chemosphere, 228, 460–468, https://doi.org/10.1016/j.chemosphere.2019.04.130, 2019.
Zhao, D., Schmitt, S. H., Wang, M., Acir, I.-H., Tillmann, R., Tan, Z., Novelli, A., Fuchs, H., Pullinen, I., Wegener, R., Rohrer, F., Wildt, J., Kiendler-Scharr, A., Wahner, A., and Mentel, T. F.: Effects of NOx and SO2 on the secondary organic aerosol formation from photooxidation of α-pinene and limonene, Atmos. Chem. Phys., 18, 1611–1628, https://doi.org/10.5194/acp-18-1611-2018, 2018.
Zhou, C., Jang, M., and Yu, Z.: Simulation of SOA formation from the photooxidation of monoalkylbenzenes in the presence of aqueous aerosols containing electrolytes under various NOx levels, Atmos. Chem. Phys., 19, 5719–5735, https://doi.org/10.5194/acp-19-5719-2019, 2019.