the Creative Commons Attribution 4.0 License.
the Creative Commons Attribution 4.0 License.
 | 25 Aug 2022
Source attribution of cloud condensation nuclei and their impact on stratocumulus clouds and radiation in the south-eastern Atlantic
Philip Stier
Duncan Watson-Parris
Hamish Gordon
Lucia Deaconu
The semi-permanent stratocumulus clouds over the south-eastern Atlantic Ocean (SEA) can act as an “air conditioner” to the regional and global climate system. The interaction of aerosols and clouds becomes important in this region and can lead to negative radiative effects, partially offsetting the positive radiative forcing of greenhouse gases. A key pathway by which aerosols affect cloud properties is by acting as cloud condensation nuclei (CCN). In this paper, we use the United Kingdom Earth System Model (UKESM1) to investigate the sources of CCN (from emissions and atmospheric processes) in the SEA as well as the response of the cloud droplet number concentration (CDNC), the cloud liquid water path (LWP), and radiative forcing to these sources during 2016 and 2017. Overall, free and upper troposphere nucleated aerosols are the dominant source of the boundary layer CCN concentration at 0.2 % supersaturation (CCN0.2 %), contributing an annual average of ∼ 41 % as they subside and entrain into the marine boundary layer, which is consistent with observations highlighting the important role of nucleation in the boundary layer CCN concentration. In terms of emission sources, anthropogenic emissions (from energy, industry, agriculture, etc.) contribute the most to the annual average CCN0.2 % in the marine boundary layer (∼ 26 %), followed by biomass burning (BB, ∼ 17 %). In the cloud layer, BB contributes about 34 % of the annual CCN0.2 %, midway between the contributions from aerosol nucleation (36 %) and anthropogenic sources (31 %). The contribution of aerosols from different sources to the CDNC is consistent with their contribution to CCN0.2 % within the marine boundary layer, with free and upper troposphere aerosol nucleation being the most important source of the CDNC overall. In terms of emission sources, anthropogenic sources are also the largest contributors to the annual average CDNC, closely followed by BB. However, during the BB season, BB and free and upper troposphere aerosol nucleation are equally the most important sources of the CDNC. The contribution of BB to the CDNC is more significant than its increase to CCN0.2 %, mainly because BB aerosols are mostly located directly above the inversion layer in the model; thus, they can increase the in-cloud CDNC by enhancing the supersaturation through the dynamical feedback due to short-wave absorption. An aerosol source that shows an increase in the CDNC also shows an increase in the LWP resulting from a reduction in autoconversion. Due to the absorption effect, BB aerosol can enhance existing temperature inversions and reduce the entrainment of sub-saturated air, leading to a further increase in the LWP. As a result, the contribution of BB to the LWP is second only to aerosol nucleation on annual averages. These findings demonstrate that BB is not the dominant source of CCN within the marine boundary layer from an emission source perspective. However, as most BB aerosols are located directly above the inversion layer, their effect on clouds increases due to their absorption effect (about the same as anthropogenic sources for the CDNC and more than anthropogenic sources for the LWP), highlighting the crucial role of their radiative effect on clouds. The results on the radiative effects of aerosols show that BB aerosol exhibits an overall positive RFari (radiative forcing associated with aerosol–radiation interactions), but its net effective radiative forcing remains negative due to its effect on clouds (mainly due to its absorbing effect). By quantifying aerosol and cloud properties affected by different sources, this paper provides a framework for understanding the effects of aerosol sources on marine stratocumulus clouds and radiation in the SEA.
- Article
(5003 KB) - Full-text XML
-
Supplement
(5429 KB) - BibTeX
- EndNote


Marine stratocumulus clouds cover approximately one-quarter of the ocean surface on annual average (Hahn and Warren, 2007), resulting in a strong negative net radiative effect that significantly affects climate; therefore, they are referred to as the “air conditioners” of the climate system (Stephens and Slingo, 1992). Stratocumulus clouds in the south-eastern Atlantic Ocean (SEA) are one of the most extensive stratocumulus cloud decks on the planet (Wood, 2012), and they display a semi-permanent presence off the coast of Africa. Therefore, aerosol–cloud interactions become extremely important in this region, as a moderate change in cloud cover or the liquid water path induced by aerosol could compensate for the radiative forcing of greenhouse gases and significantly affect the regional or global climate (Wood, 2012). A key pathway via which aerosols affect cloud properties is by acting as cloud condensation nuclei (CCN). Increases in CCN from different sources can alter the liquid water path (LWP) by affecting the cloud state (Berner et al., 2015) and cloud lifetime (Ackerman et al., 2004). At a fixed LWP, increases in CCN due to emission perturbations lead to an increase in the cloud droplet concentrations of smaller radii and, subsequently, to an increase in cloud albedo, commonly referred to as the radiative forcing associated with aerosol–cloud interactions, i.e. RFaci (Twomey, 1974). Increases in CCN can also trigger rapid adjustments, affecting the cloud lifetime and precipitation (Albrecht, 1989). Under the combined effects of these two factors (RFaci and rapid adjustments), referred to as ERFaci, aerosol–cloud interactions represent one of the largest sources of uncertainties in future climate projections (Boucher et al., 2013).
In the SEA, the persistent stratocumulus cloud deck encounters particles from various sources. Among them, biomass burning (BB) aerosol advected from continental Africa, where one-third of the global BB emissions are produced from July to October (Roberts et al., 2009; van der Werf et al., 2010), plays a unique role in modulating the cloud properties due to its short-wave absorption ability as well as its ability to act as CCN. Previous studies have suggested that, as BB aerosols are mainly located above and near the inversion layer, the main role of their radiative effect in the SEA is to strengthen the capping inversion and reduce dry-air entrainment from cloud tops, thereby increasing the LWP and low-level cloud fraction, resulting in a significant impact on the radiation balance (Wilcox, 2010; Gordon et al., 2018; Deaconu et al., 2019; Mallet et al., 2020; Herbert et al., 2020; Chaboureau et al., 2022). When BB aerosols are located in the marine boundary layer, their radiative effect can enhance the decoupled boundary layer and result in a reduction in cloud cover and the LWP, shifting the stratocumulus-to-cumulus transition to the upwind area (Zhang and Zuidema, 2019; Ajoku et al., 2021). CCN from BB can play an important role in affecting the stratocumulus cloud droplet concentration and the radiative forcing (Lu et al., 2018). However, no consensus exists with respect to the importance of BB aerosol acting as CCN (Che et al., 2021; Gordon et al., 2018; Lu et al., 2018; Mallet et al., 2020) in the SEA, mainly because the fraction of BB aerosol entering the marine boundary layer remains uncertain.
Sea-salt aerosol is one of the largest contributors to global primary aerosols in terms of mass concentration (Seinfeld and Pandis, 2016). Although its particles can be easily activated due to their high hygroscopicity, the contribution of sea-salt aerosol to the marine CCN population and its relative importance in indirect effects over the ocean are uncertain (Tsigaridis et al., 2013). Some studies have reported sea-salt aerosol as the primary source of CCN over the ocean (e.g. Pierce and Adams, 2006), whereas other studies have found that sea salt only contributes a small fraction of marine CCN (Quinn et al., 2017). Besides sea salt, marine emissions are also the primary source of dimethyl sulfide (DMS), which produces the largest fraction of natural sulfur species in the atmosphere via oxidation (Andreae, 1990). The oxidation products of DMS (methanesulfonic acid and H2SO4) can form new particles via multiple aerosol nucleation processes (i.e. binary, ternary, and ion-induced processes) or condense onto existing particles and eventually form CCN (e.g. Lee et al., 2003). CCN formation from DMS is crucial for marine boundary layer clouds and is often found to have a key role in the clean and low-wind marine environment (Sanchez et al., 2018), resulting in profound climate implications (Charlson et al., 1987; Thomas et al., 2010).
With the development of the African economy, anthropogenic emissions from sources such as energy, industry, and agriculture are expected to increase significantly and could have a similar magnitude to that of African biomass burning by around 2030 (Liousse et al., 2014). Many studies have concluded that anthropogenic aerosols are generally hygroscopic and are responsible for the increase in global CCN (Che et al., 2017; Rose et al., 2011; Schmale et al., 2018; Yu et al., 2013). In the SEA, most anthropogenic and BB aerosols are advected from continental Africa and can be activated to cloud droplets by entraining clouds. However, even with a similar advected concentration, these two types of aerosols may contribute differently to the number of activated droplets in the stratocumulus cloud layer due to their different abilities to affect the atmosphere temperature profile. Another potentially important source of CCN is dust. Although insoluble, wettable dust particles with large diameters can act as CCN, while small dust particles can accumulate soluble materials through internal mixing during transportation and dramatically increase their ability to activate (Bègue et al., 2015; Dusek et al., 2006; Gibson et al., 2007; Hatch et al., 2008).
Apart from primary emissions, a large fraction of atmospheric aerosols, known as secondary aerosols, are formed from atmospheric processes (oxidation of gaseous precursors, i.e. aerosol nucleation) and can serve as CCN after the subsequent growth of nucleated clusters to sufficiently larger sizes (Kerminen et al., 2012; Merikanto et al., 2009). Studies have found that the nucleation of aerosols in the boundary layer and free troposphere is the dominant source affecting the particle number in the atmosphere (Kulmala et al., 2004; Kulmala and Kerminen, 2008). However, the contribution of aerosol nucleation to CCN formation is not consistent: some studies have found that less than 10 % of nucleated particles can generally grow to diameters of 100 nm (Kuang et al., 2009; Westervelt et al., 2013), implying the potentially limited role of aerosol nucleation in providing CCN, whereas several studies have shown that small particles generated by aerosol nucleation in the free troposphere can grow with subsidence and contribute more than half of the CCN in the global marine boundary layer (Clarke et al., 2013; Merikanto et al., 2009; Williamson et al., 2019; Clarke and Kapustin, 2002). Therefore, the role of aerosol nucleation in affecting the stratocumulus cloud deck in the SEA remains uncertain, hindering our understanding of the aerosol–cloud interactions in this region.
Two aircraft observation campaigns were performed during the BB season in the SEA in order to enable an intensive study of the aerosol–cloud interactions in this region. Those two campaigns flew over different areas of the SEA: the NASA ORACLES (ObseRvations of Aerosols above CLouds and their intEractionS) observations were launched from Walvis Bay (Namibia) in 2016 and from Sao Tomé in 2017 (Redemann et al., 2021), whereas the CLARIFY (CLoud–Aerosol–Radiation Interaction and Forcing) airborne observations took place around Ascension Island in 2017 and can provide information on aerosol–cloud–radiation interactions in the region where the stratocumulus-to-cumulus transition occurs (Haywood et al., 2021). In addition, the LASIC (Layered Atlantic Smoke Interactions with Clouds) ground-based in situ field measurement campaign was carried out on Ascension Island and provided 18 months of aerosol and cloud observations within the marine boundary layer from June 2016 to October 2017 (Zuidema et al., 2018b). The main focus of these campaigns is BB aerosols and their effects on clouds. Here, we use United Kingdom Earth System Model, UKESM1 (Sellar et al., 2019), to investigate the source attribution of CCN in the SEA, thereby contributing to the understanding of the main sources of CCN in this region. Moreover, the cloud droplet concentration, cloud liquid water, and radiative forcing associated with different sources are also investigated. The model has previously been evaluated with data from ORACLES and CLARIFY observations, and the results show that it provides a good simulation of the spatial and vertical distribution of aerosols (Che et al., 2021). The article is structured as follows: Sect. 2 presents the experimental method, including the model configuration and evaluation; the results are listed in Sect. 3, with the subsections of Sect. 3 investigating the vertical distribution of CCN contributed by emissions and atmospheric processes (Sect. 3.1), the mean concentrations of CCN in different layers (Sect. 3.1), cloud adjustments due to aerosols from different sources (including the cloud droplet number concentration, CDNC, and LWP) (Sect. 3.2), and the radiative forcings associated with the above-mentioned aerosols (Sect. 3.3); Sect. 4 contains conclusions and discussions.
2.1 Model configuration
The first version of the United Kingdom Earth System Model, UKESM1 (Sellar et al., 2019), has been jointly developed by the UK Met Office and Natural Environment Research Council (NERC). The core of UKESM1 is based on the Hadley Centre Global Environmental Model version 3 (HadGEM3) Global Coupled (GC) climate configuration of the Unified Model (UM) (Hewitt et al., 2011). The atmospheric part of the model is configured as Global Atmosphere 7.1 (GA7.1) (Walters et al., 2019). Aerosol and its interactions with clouds are represented by the UK Chemistry and Aerosols (UKCA) model (Mulcahy et al., 2020; O'Connor et al., 2014). In contrast to the standard configuration that represents the dust size distribution as six bins (Woodward, 2001), our configuration uses seven interactive log-normal aerosol modes, comprising sulfate, sea salt, black carbon, organic carbon, and dust as well as allowing for condensation and coagulation on or with dust, in the GLOMAP (Global Model of Aerosol Processes) microphysics scheme (Mann et al., 2010). Using this setting, we can set the hygroscopicity of different aerosol species with a single parameter κ. The bulk properties (cloud fraction, cloud liquid water content, etc.) of large-scale clouds are parameterized using the prognostic cloud fraction and prognostic condensate (PC2) scheme (Wilson et al., 2008a, b) with the modifications described in Morcrette (2012). The cloud droplet concentration is derived using the activation scheme of Abdul-Razzak and Ghan (2000). The activated CCN can be expressed as a function of aerosol properties (size, number, and composition) and thermodynamic properties (e.g. updraught velocity, temperature, pressure, and specific humidity), where thermodynamic properties are used to determine the local supersaturation, and aerosol properties are used to calculate activated CCN. When the local supersaturation has been determined, the activated CCN are calculated with the κ-Köhler scheme, which uses a parameter κ to represent the hygroscopicity of aerosols. The κ value is set to 0.6, 0.2, and 1.2 for sulfate, organic, and sea salt respectively, whereas it is set to 0 for black carbon and dust (Engelhart et al., 2012; Petters and Kreidenweis, 2007). The internal volume mixing rule (Petters and Kreidenweis, 2007) is used to calculate the mean hygroscopicity of each mode. Therefore, a higher fraction of less-hygroscopic components (e.g. organic and black carbon) can reduce the overall κ value. However, the overall κ value may be underestimated when BC has a thicker coating. This has been illustrated by Kacarab et al. (2020), who found a high average κ value of ∼ 0.4 from eight ORACLES 2017 aircraft observations. However, Zhang et al. (2022) found an averaged κ value of ∼ 0.24 in the marine boundary layer from ORACLES 2018 observations, which is consistent with our assumption that BB reduces the overall κ value. Cloud droplet concentrations at the cloud base are replicated vertically throughout contiguous columns of the cloud. After running the cloud activation scheme, the CDNC is then passed to the radiation and microphysics schemes. The Coupled Model Intercomparison Project Phase 6 (CMIP6) emission data for 2014 are used (Eyring et al., 2016; Gidden et al., 2019). Due to the high interannual variability in BB emissions, the Global Fire Assimilation System (GFAS) version 1 data based on satellite fire monitoring are employed with a scaling factor of 2 (Johnson et al., 2016).
The GFAS biomass burning and CMIP6 2014 emissions are used as the baseline simulation. To facilitate source attribution, four additional runs are made with BB, dust, sea-salt, and DMS emissions turned off, and one simulation is run with pre-industrial CMIP6 emissions. The effect of these sources on aerosols, clouds, and radiation can then be derived from the difference between the baseline simulation and the individual runs with emissions turned off. The different aerosol sources (anthropogenic sources, biomass burning, etc.) are defined from the perspective of CMIP6. Note that although black carbon (BC) and organic carbon (OC) are the main components of BB emissions, these two types of aerosols are also present in anthropogenic emissions. However, the “anthropogenic” emissions defined here do not include BB aerosols, although BB in southern Africa is associated with human activity (Roberts et al., 2009). In our model set-up, BC and OC from our anthropogenic emissions are mainly from fossil fuels and biofuels, and their emission sectors are energy, industry, shipping, transportation, solvents, waste, agriculture, and residential. In comparison, BC and OC from BB are mainly emitted from the burning of agricultural land, peat, savanna, forest, and deforestation. It should also be noted that changes in the emissions of aerosols or their precursors can affect the chemical and microphysical ageing capacity of the atmosphere, resulting in a non-linear response of aerosol populations. Stier et al. (2006) investigated the non-linear responses and found that they are generally not dominant and are manifested in alterations of the aerosol lifetimes. In addition to emission sources, three respective runs were performed without SOA (secondary organic aerosol) formation, boundary layer aerosol nucleation, and total aerosol nucleation in order to to allow for aerosol attribution to atmospheric processes. The boundary aerosol nucleation scheme is based on the organic-mediated nucleation parameterization of Metzger et al. (2010), determined by the concentrations of sulfuric acid and SOA, and limited to the boundary layer. The total aerosol nucleation includes the boundary layer nucleation and homogeneous binary aerosol nucleation of sulfuric acid and water, which is applicable to both tropospheric and stratospheric conditions, as described in Vehkamäki et al. (2002). Precursors for aerosol nucleation include H2SO4, which is contained in both natural and anthropogenic emissions. Therefore, aerosol nucleation can also be affected by these emissions, particularly in areas with strong anthropogenic emissions (Saha et al., 2018). However, the exact extent of the impact of these emissions on nucleation remains unresolved in this work and requires future analysis. The gas-phase oxidation of monoterpene by OH, O3, and NO3 yields SOA at a fixed rate of 0.26 (unitless, denotes 26 % production), which is scaled by 2 from the original value based on α-pinene (Spracklen et al., 2006) to compensate for the missing SOA from other sources. The contributions of these atmospheric processes are also derived from the differences between the baseline simulation and individual runs. The resolution of our simulations is N96 (i.e. 1.875∘ × 1.25∘) with 85 vertical levels. Sea surface temperatures and sea ice are prescribed using daily reanalysis data (Reynolds et al., 2007). In all runs, horizontal wind fields above 1500 m are nudged every 6 h with ERA-Interim data (Telford et al., 2008), while the temperature is run freely to allow fast adjustments, following the recommendations of Zhang et al. (2014).
2.2 Investigated area and time period
The model runs from 2016 to 2017 in order to overlap with the ORACLES, CLARIFY, and LASIC observation campaigns conducted in the SEA. The months of July, August, and September are selected in the 2 years to represent the BB season, as the highest mean aerosol optical depth (AOD) values associated with BB are found in these months. The low-level cloud fraction during the BB season is higher than the annual average, indicating the coexistence of an intensive stratocumulus cloud deck and BB plume in the SEA. Figure 1 shows the mean low-level cloud fraction and AOD during the BB season. In addition to the illustrated domain representing the SEA region in the figure, a small area is identified – the “cloud box” region – that outlines an area with a mean low-level cloud fraction of 0.6 for the BB season and a 2-year mean low-level cloud fraction of 0.5. The location and size of the cloud box region are different from that identified by Klein and Hartmann (1993), as we encompass stratocumulus and cumulus clouds. Despite the border of our defined area, the annual mean of the low-level cloud fraction is 0.5 in the cloud box, indicating the semi-permanence of low clouds in this region. The mean AOD in the cloud box region is 0.43 and 0.26 for the BB season and the 2-year average respectively. BB aerosol contributes around 76 % of the total AOD in the cloud box during BB season and can result in a clearly elevated CDNC in the SEA from satellite observations (Redemann et al., 2021), implying the potentially dominant role of BB aerosol with respect to affecting CCN and cloud that originally motivated the ORACLES, CLARIFY, and LASIC campaigns. However, as most of the BB aerosol is above the stratocumulus cloud deck (Fig. 2) and there is a large fraction of low-hygroscopicity particles, such as BC and OC, the fraction of BB aerosol that is activated to form cloud droplets is uncertain.
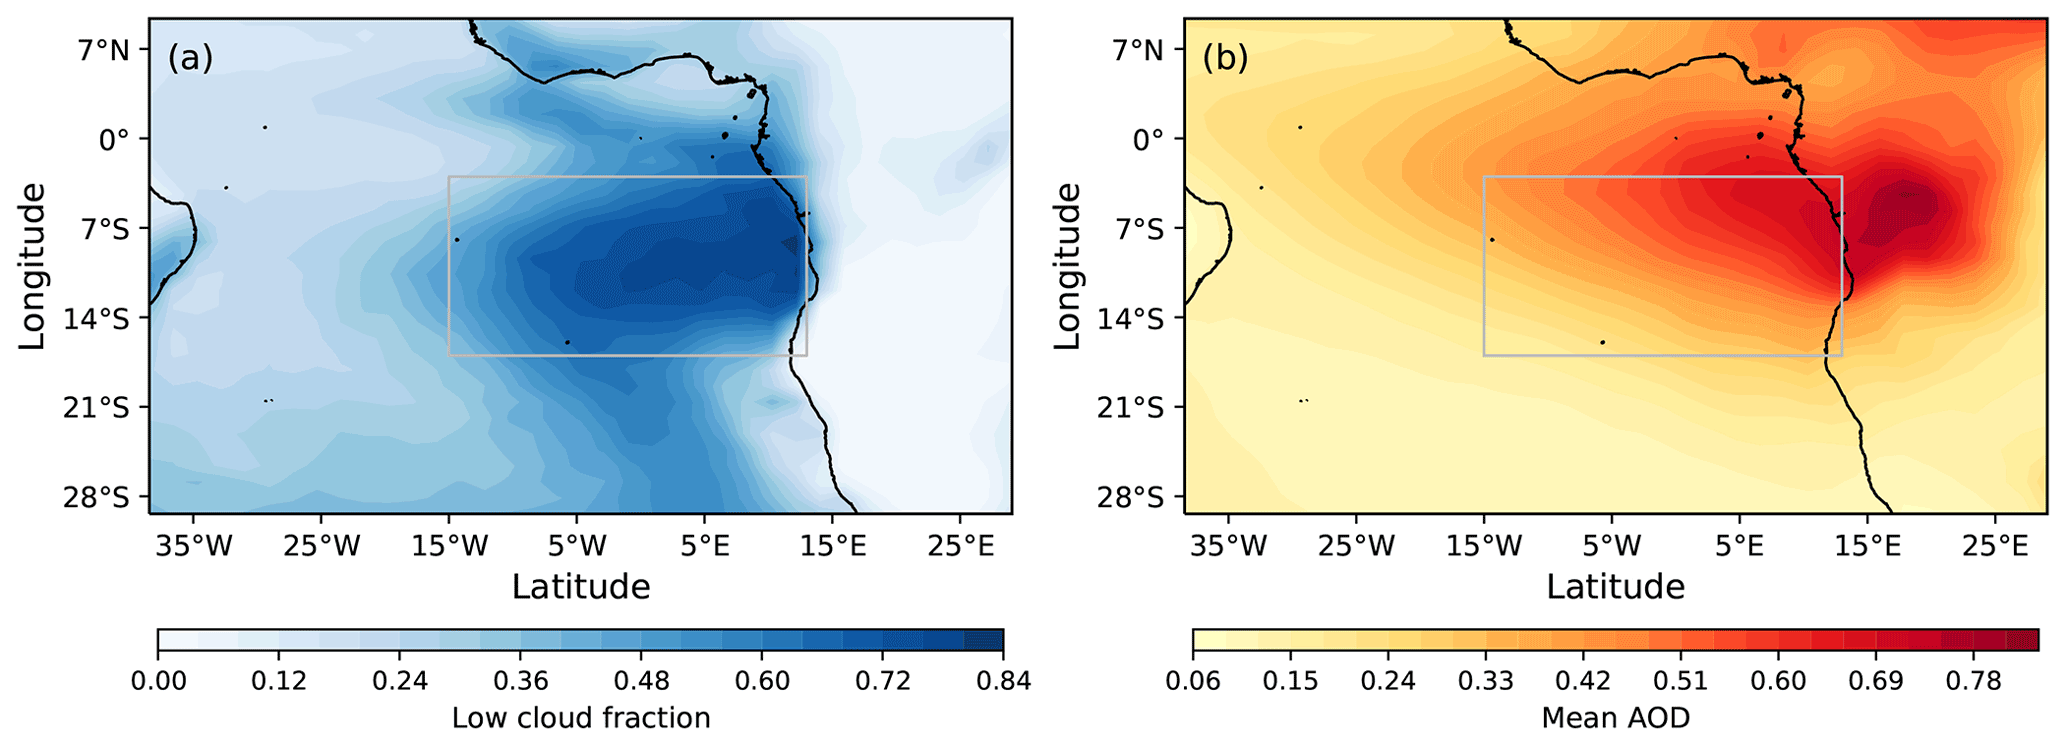
Figure 1UKESM1-simulated mean (a) low-level cloud fraction and (b) aerosol optical depth (AOD) for July–September in 2016 and 2017. The domain, ranging from 30∘ S to 10∘ N and from 40∘ W to 30∘ E, is the area that this paper is interested in. The grey box (cloud box) on the map represents the area where the average low-level cloud fraction is above 0.6.
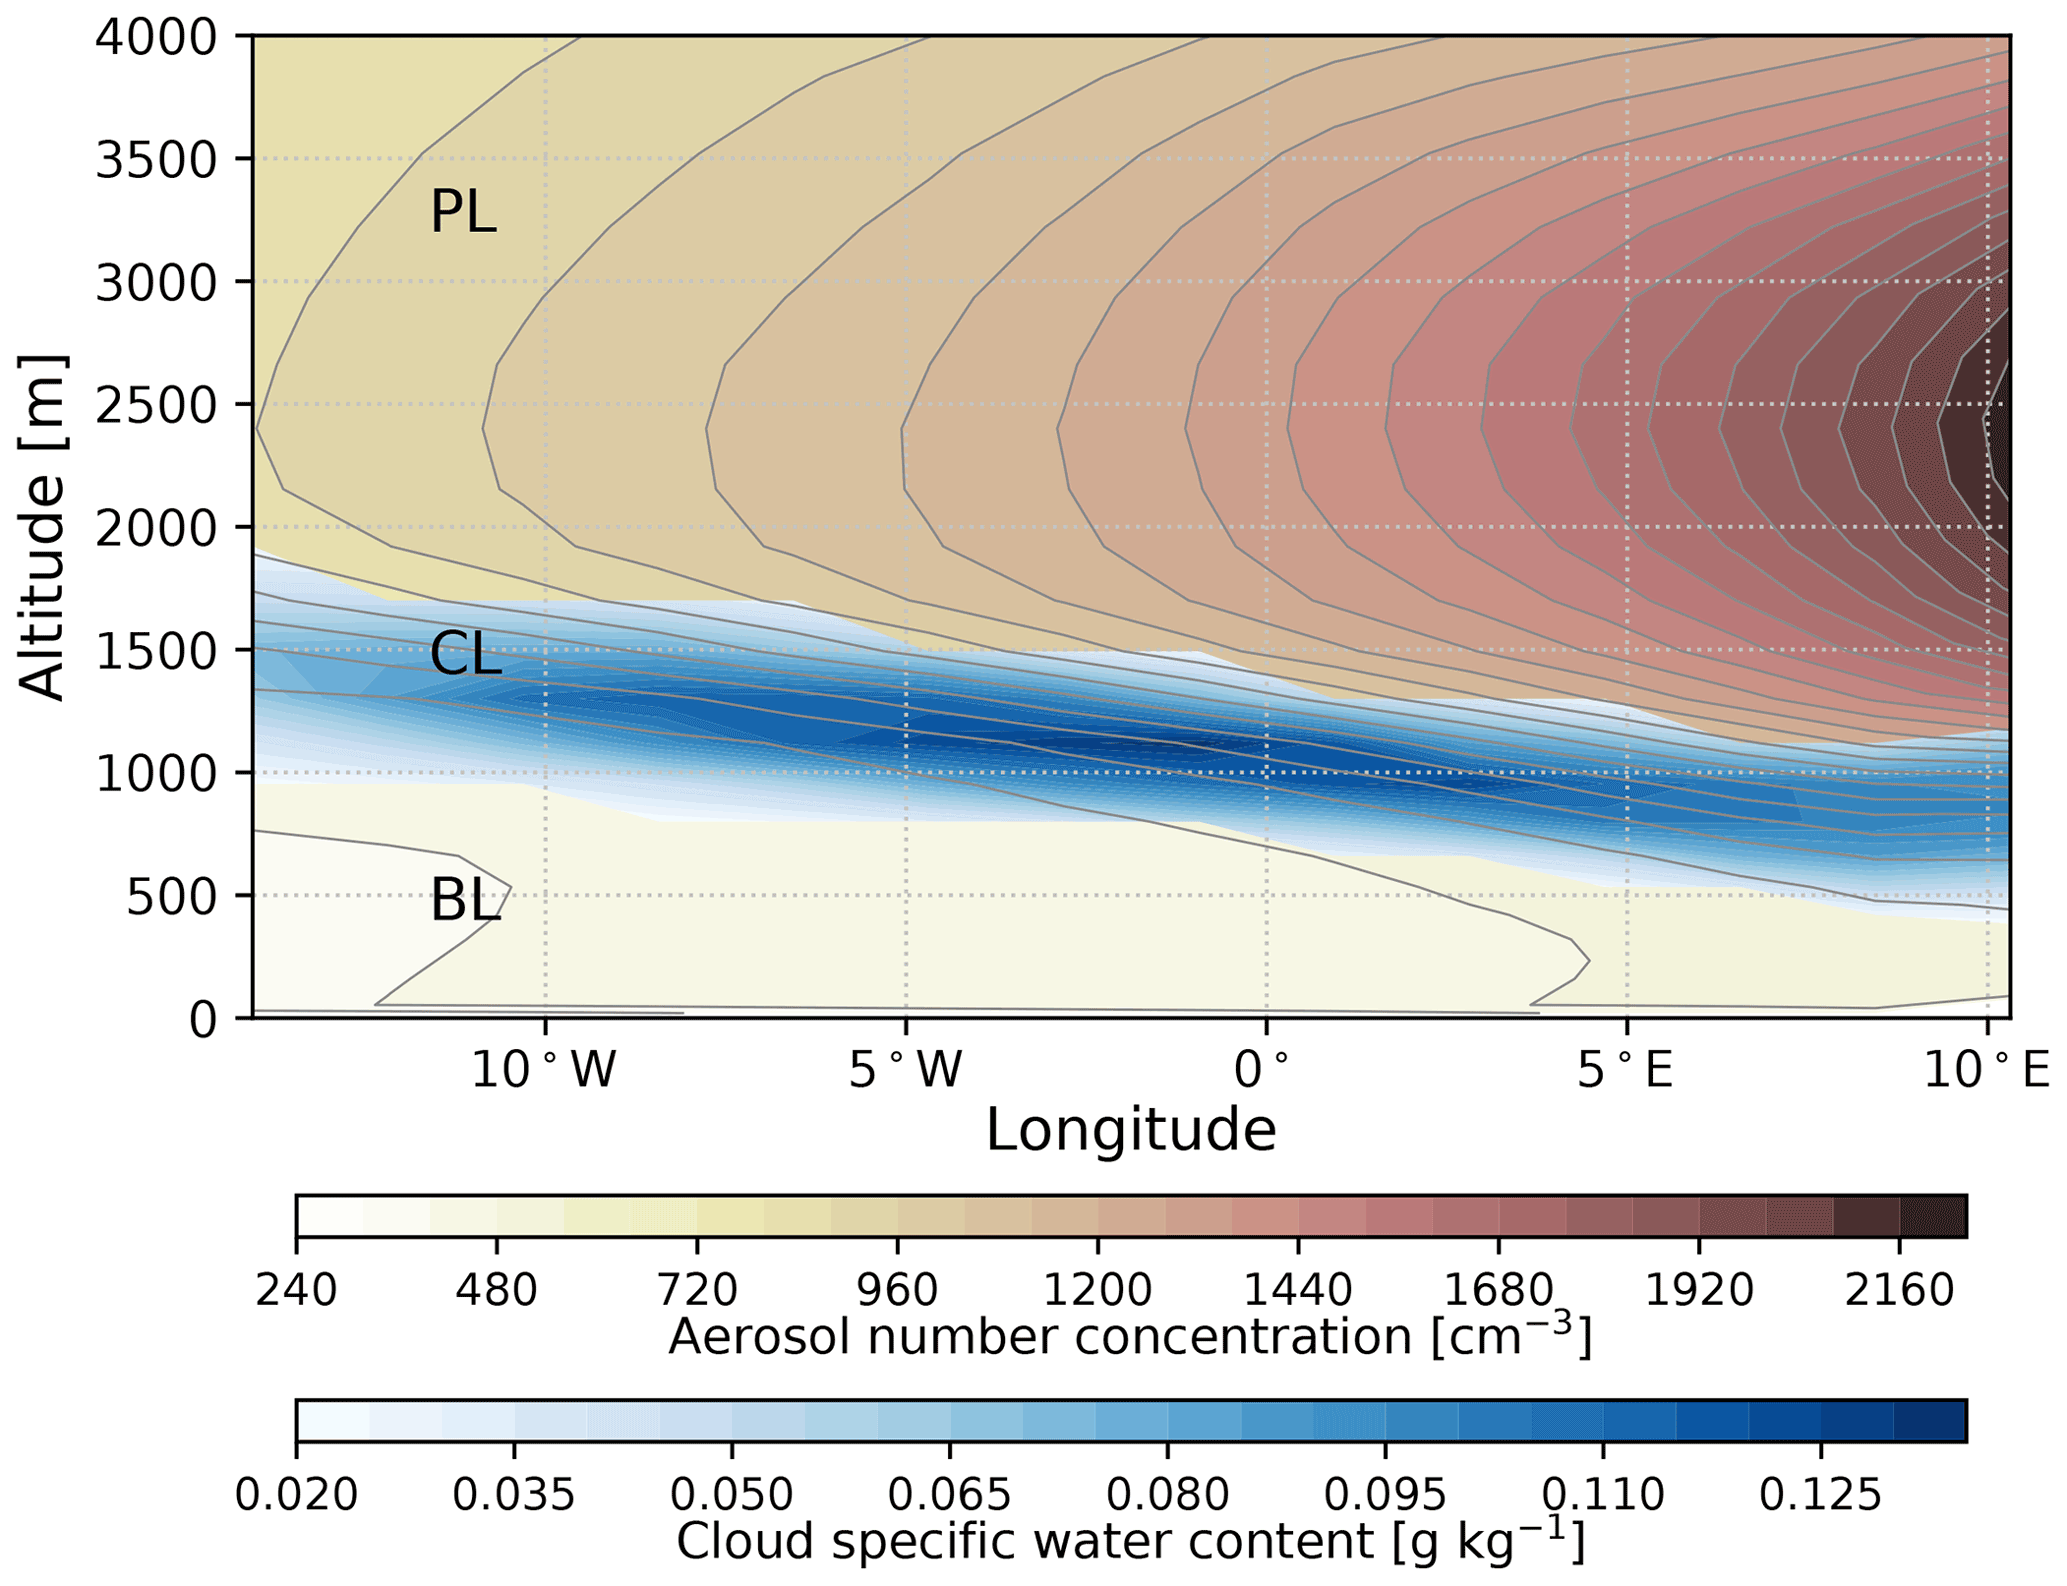
Figure 2UKESM1-simulated mean vertical profiles of cloud specific water content (g kg−1) and aerosol number concentration (cm−3) at standard temperature and pressure (STP) in the cloud box region during BB season. BL, CL, and PL represent the boundary layer, cloud layer, and plume layer respectively. The cloud layer is identified as the layer with a specific liquid water content >0.02 g kg−1.
The mean vertical profiles of the cloud liquid water content and aerosol number concentration in the cloud box during BB season are illustrated in Fig. 2. Three layers are defined to investigate source-attributed CCN in different areas. The cloud layer (CL), where the liquid water content is above 0.02 g kg−1, represents the semi-permanent stratocumulus cloud deck. We also define the area below the cloud layer as the boundary layer (BL) and the area above the cloud layer as the plume layer (PL). As shown in Fig. 2, most aerosols emanating from the continent are located in the plume layer, with a maximum concentration at a height of around 2500 m. The boundary layer has the lowest aerosol concentration. This may be because only a small proportion of aerosols can enter the cloud layer from the top, and the fraction of aerosols that could enter the boundary layer is further reduced by the cloud wet scavenging process (Textor et al., 2006). Therefore, the boundary layer is relatively clean, with an aerosol concentration of around a few hundred per cubic centimetre. However, as the boundary layer is close to the sea surface, it contains a higher proportion of more hygroscopic sea-salt aerosols. The annual mean vertical profiles of the liquid water content and aerosol number concentration in the cloud box have a similar pattern, with a lower concentration of aerosols and cloud liquid water (Fig. S1 in the Supplement). The annual mean cloud supersaturation, CDNC, and LWP are provided in Fig. S2.
2.3 Model evaluation
The model has been evaluated with the ORACLES (2016 and 2017) and CLARIFY measurements by examining the co-located aerosol extinction in our previous paper (Che et al., 2021). The result shows that the model can generally capture the spatial and vertical distributions of BB plumes (Che et al., 2021). However, as these aircraft observations are mainly located in the free troposphere, we further evaluated modelled CCN within the marine boundary layer using LASIC observations.
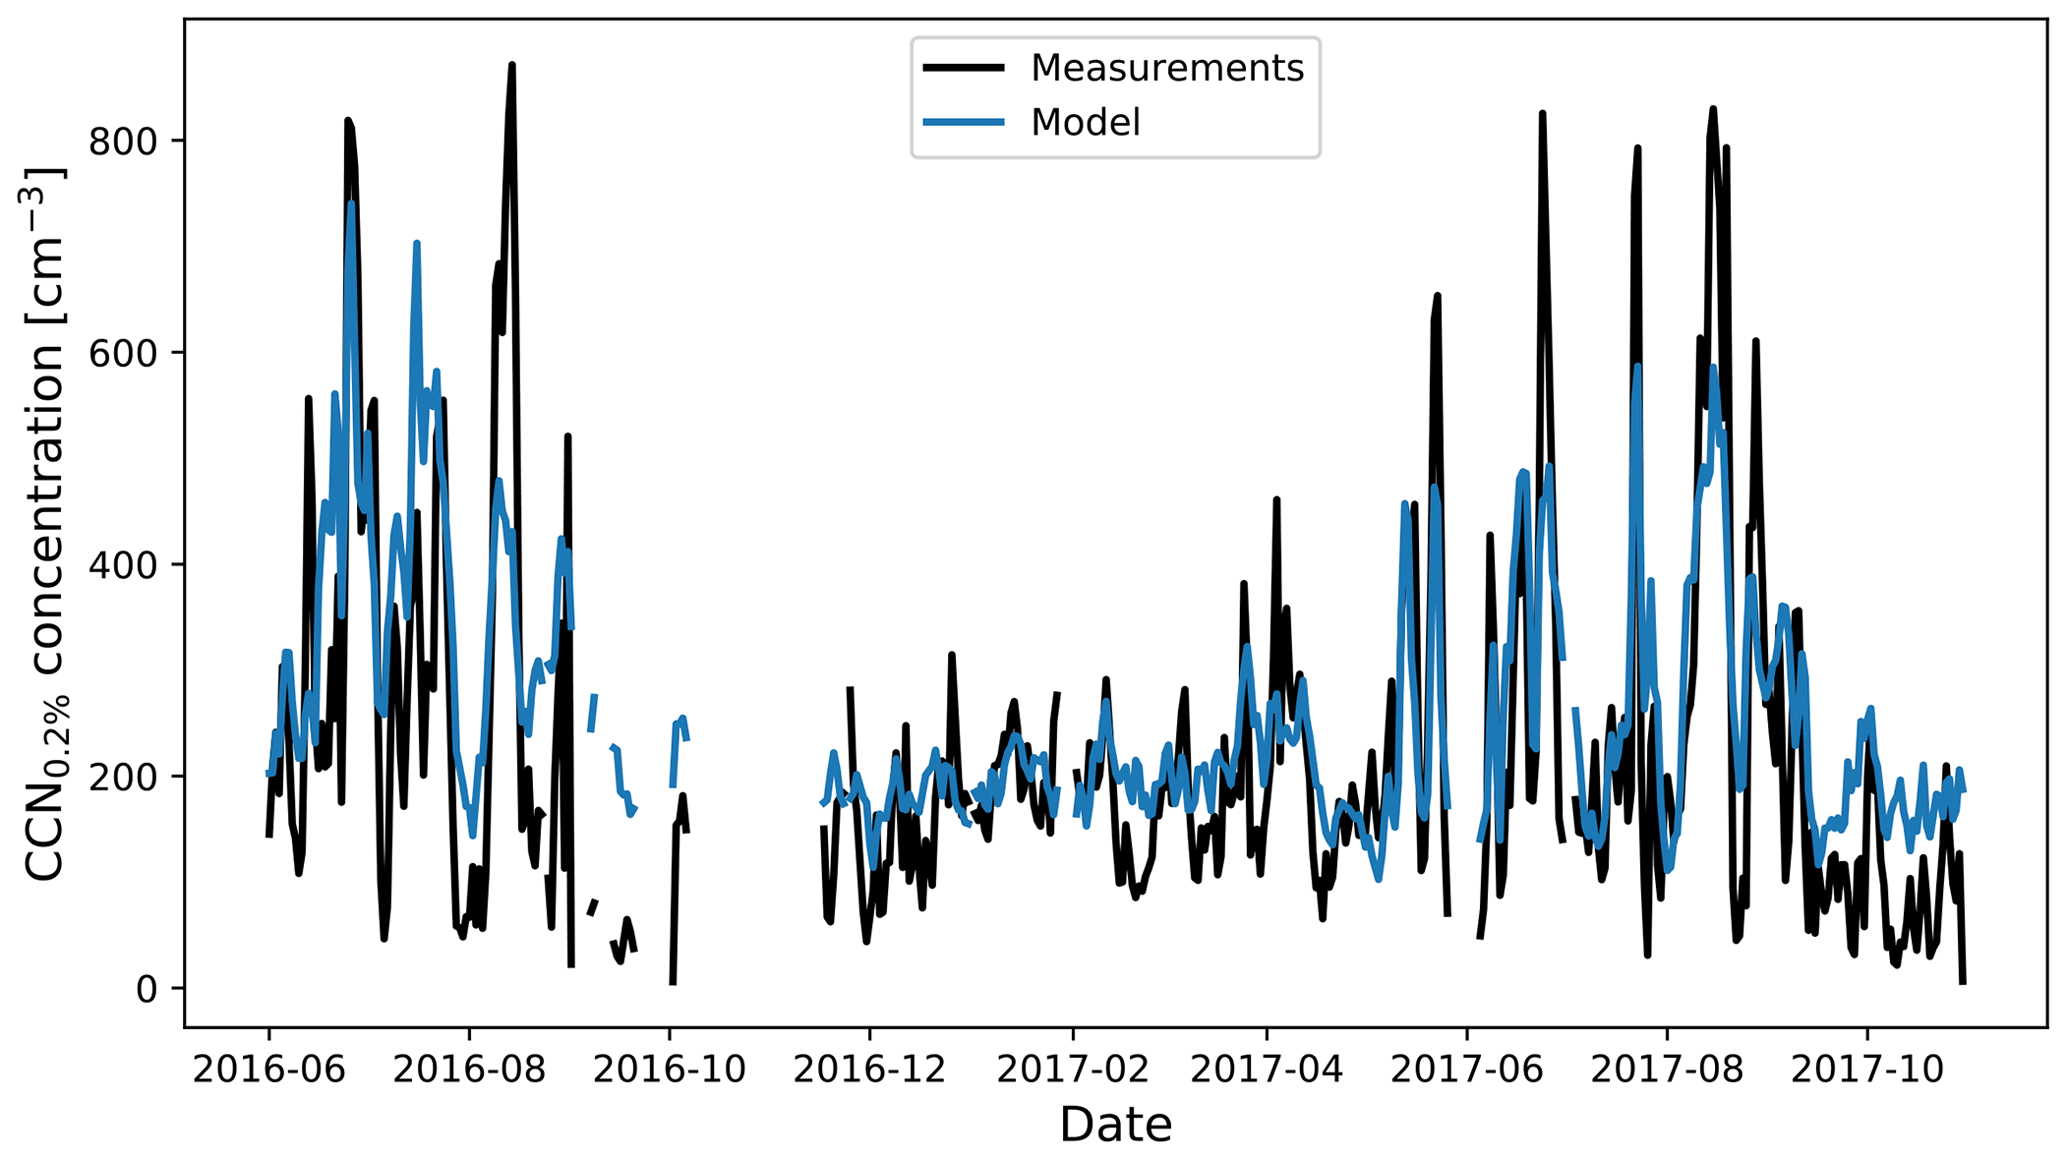
Figure 3Comparison of the modelled and observed daily mean CCN concentration at 0.2 % supersaturation (CCN0.2 %). The measured CCN0.2 % is from the LASIC campaign; the modelled CCN0.2 % is from the baseline simulation and was interpolated to the LASIC coordinates.
The LASIC campaign was carried out at the Atmospheric Radiation Measurement (ARM) Mobile Facility 1 site on Ascension Island (latitude of −7.97∘, longitude of −14.35∘, and altitude of 340.7664 m). The LASIC CCN concentration was measured by a cloud condensation nuclei counter (CCN-200), which provides the CCN concentration at fixed supersaturations (Roberts and Nenes, 2005; Atmospheric Radiation Measurement User Facility, 2022). A more detailed description of the sampling location and instruments can be found in the campaign report (Zuidema et al., 2018a). The modelled CCN concentration at 0.2 % supersaturation (CCN0.2 %) from the baseline simulation is co-located with observations. Due to the temporal resolution of the model output, we compared the daily averages, as illustrated in Fig. 3.
As evident in Fig. 3, the modelled CCN0.2 % is in good agreement with the observation and can capture the daily variation in CCN0.2 % during the BB season. The campaign averaged CCN0.2 % is 225 cm−3, and the modelled corresponding mean is 239 cm−3 (with a mean relative error of around 6.3 % for the latter). However, the observed CCN concentration peaks during the BB season are higher than simulated values, indicating that the model is still inadequate for capturing these peak values. One possible reason for this is the fact that the thick coating on some BC particles may cause the calculated overall κ to be underestimated when using the volume mixing rule, which may further underestimate the CCN concentration associated with BB (Kacarab et al., 2020). In addition, uncertainties in the BB emissions, including the magnitude, size, and height of fires, can lead to incorrect estimates of BB aerosol peak concentrations, which can result in such underestimations of the CCN concentration. Given that we mainly investigate the annual mean CCN concentration in this study, the relatively small error and the well-matched temporal variability with the observations suggest that the model is fairly reasonable with respect to reproducing the CCN concentration in the marine boundary layer in the SEA. Therefore, this result provides confidence in this study.
3.1 CCN concentration
3.1.1 Vertical distribution of CCN
The annual mean profiles of the CCN concentration at 0.2 % supersaturation (CCN0.2 %) from different sources are illustrated in Fig. 4. Overall, BB is the dominant source of CCN0.2 %, although its contribution is mainly distributed above the cloud layer. This is because BB aerosol is emitted from the continent and is mainly located in the free troposphere in its westward transport. Anthropogenic aerosol, also originating from the land, is the second largest source of CCN0.2 % from emissions in the SEA, and its CCN0.2 % concentration is around one-third of that associated with BB above the cloud. However, when in the cloud layer, these two sources are almost equally important, with the CCN0.2 % from BB being only slightly higher. This may be partly due to the fact that the short-wave absorption capability of BB aerosol inhibits cloud-top entrainment when the BB aerosol is above the clouds (Johnson et al., 2004; Sakaeda et al., 2011; Wilcox, 2010), resulting in fewer BB aerosols being able to enter the clouds. Another CCN0.2 % source linked strongly with the land is SOA, as monoterpene, the precursor of SOA in our model, is mostly from plants (Mentel et al., 2009). Marine emissions make a small contribution to monoterpene (Yassaa et al., 2008), contributing to SOA concentrations in the marine boundary layer.

Figure 4UKESM1-simulated annual mean vertical profiles of the CCN concentration at 0.2 % supersaturation (CCN0.2 %) from different sources (at standard temperature and pressure, STP). Profiles are averaged along the latitudes of the cloud box. The contributions of different sources to CCN0.2 % are listed in subplots (a) to (h), where the contribution of emissions is shown using the orange frame, and the contribution of atmospheric processes is shown using the teal frame. Note that boundary layer aerosol nucleation is based on organic-mediated aerosol nucleation and is limited to the boundary layer. Total aerosol nucleation includes boundary layer nucleation and homogeneous binary aerosol nucleation in the free troposphere and stratosphere. The contour lines in each subplot are the cloud specific water content from the baseline simulation at the same temporal and spatial average. The same colour map scale is used in each subplot to facilitate comparison, but the range differs for each plot, corresponding to the maximum and minimum CCN0.2 %.
DMS- and sea-salt-attributed CCN0.2 % have low concentrations and are mainly distributed in the marine boundary layer, as they are both emitted from the ocean surface. Although aerosols from these two sources have high hygroscopicity, their low number concentration limits their CCN number. Dust does not have a notable impact on CCN0.2 %, partly due to the hydrophobic characteristics of its particles, as represented in the model, and partly because of the low concentration of dust in this region. The reduction (negative) in CCN due to dust may be due to the increase in the sulfuric acid condensation sink, which decreases the CCN from aerosol nucleation. For atmospheric processes, both the total and boundary layer aerosol nucleation lead to an increase in the CCN0.2 %, indicating the contribution of aerosol nucleation to CCN. However, the contribution of the above-mentioned processes to CCN0.2 % is lower than that of BB and anthropogenic emissions above clouds. Total aerosol nucleation contributes more to CCN0.2 % compared with boundary layer nucleation, indicating a contribution from the free and upper troposphere. The mean CCN0.2 % profiles during the BB season show a similar pattern to the annual means (Fig. S3), while the CCN0.2 % associated with BB, anthropogenic emissions, and SOA is ∼ 2.3, 1.8, and 1.5 times its annual means respectively, indicating the significant contribution of BB to CCN.
3.1.2 Mean concentration of CCN at different layers
The source attribution of CCN in the cloud box region is investigated in this section. The location and definition of the cloud box region can be found in Sect. 2. Here, we also focus on the CCN concentration at 0.2 % supersaturation, as the maximum supersaturation in the area is usually less than 0.2 % (Che et al., 2021). The annual mean CCN0.2 % in the cloud box at different layers contributed by different sources are illustrated in Fig. 5. In the aforementioned figure, the contributions of different emission sources to CCN0.2 % are shown on the left of the black vertical line, whereas the contributions of atmospheric processes to CCN0.2 % are shown on the right. Overall, the most important source of CCN0.2 % in the marine boundary layer (BL) is total aerosol nucleation. This is evident in both the 2-year and the BB season averages (Fig. S4). As most of the aerosol nucleation occurs in the free and upper troposphere, this result suggests that the subsidence and growth of free and upper troposphere nucleated aerosols contribute significantly to the CCN in the marine boundary layer. Boundary layer aerosol nucleation contributes about 9 % of the CCN0.2 % in the marine boundary layer and about one-fifth of the total nucleation. This may be because the boundary aerosol nucleation scheme is based on organic-mediated nucleation (Metzger et al., 2010), limited by the concentrations of sulfuric acid and SOA in the marine boundary layer. The difference between the total and boundary layer aerosol nucleation can be used to indicate the contribution of free and upper troposphere aerosol nucleation to CCN0.2 %. Therefore, the contribution of free and upper troposphere aerosol nucleation to the CCN0.2 % in the SEA marine boundary layer is about 41 %, which is consistent with the findings of Merikanto et al. (2009), who found that 45 % of the global marine boundary layer CCN0.2 % was contributed by nucleation in the free troposphere.
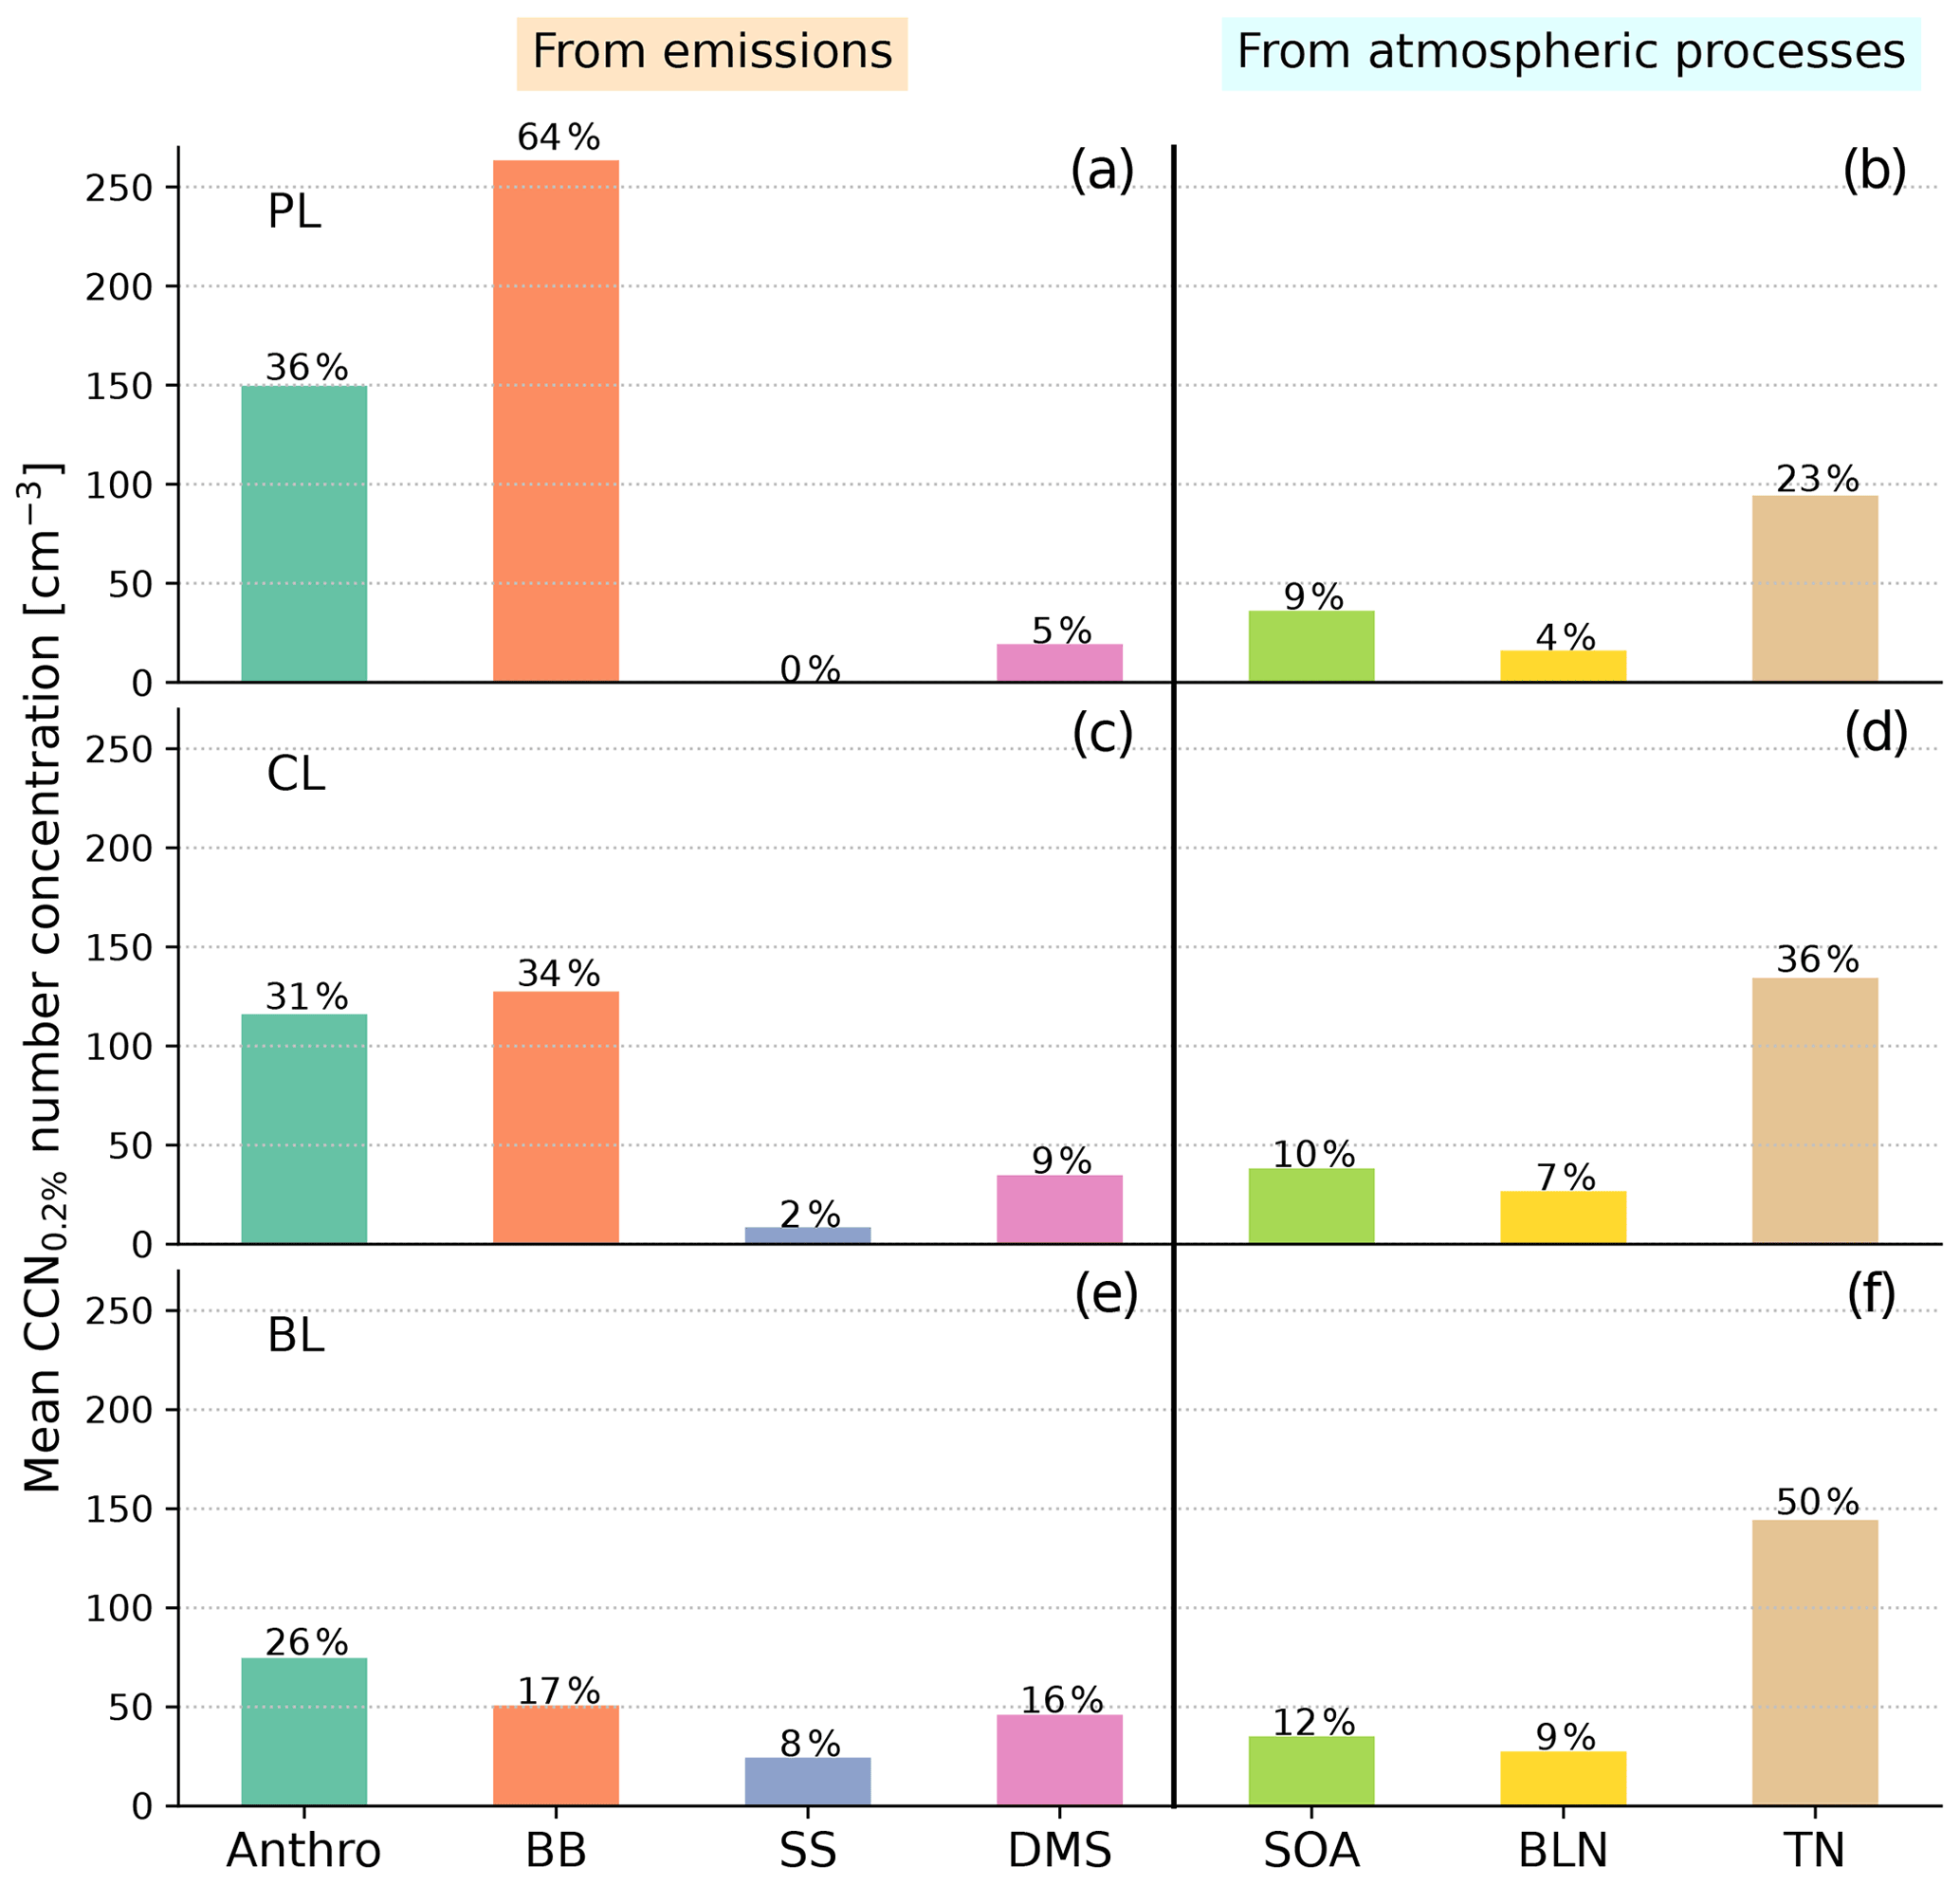
Figure 5UKESM1-simulated annual mean CCN concentration at 0.2 % supersaturation (CCN0.2 %) in the cloud box region from different sources and in different layers. Panels (a) and (b), (c) and (d), and (e) and (f) represent CCN0.2 % attribution in the plume layer (PL), cloud layer (CL), and marine boundary layer (BL) respectively. Panels (a), (c), and (e) indicate the contribution of emission sources, including anthropogenic (Anthro), BB, sea-salt (SS), and DMS sources, to CCN0.2 %. Panel (b), (d), and (f) indicate the contribution of atmospheric processes, including SOA, boundary layer nucleation (BLN), and total aerosol nucleation (TN), to CCN0.2 %. BLN is based on organic-mediated aerosol nucleation and is limited to the boundary layer. TN includes BLN and homogeneous binary aerosol nucleation in the free troposphere and stratosphere. Using the simulation of the present day as the baseline (annual mean CCN0.2 % of around 290 cm−3), the contribution of each source to CCN0.2 % is marked at the top of the corresponding bar as a percentage.
In terms of emission sources, anthropogenic emissions are the largest source of CCN0.2 % within the marine boundary layer, accounting for ∼ 26 % and ∼ 21 % of CCN0.2 % in the annual and BB season averages respectively. BB is the second largest contributor to CCN0.2 % within the marine boundary layer from emissions, accounting for ∼ 17 % and ∼ 19 % of CCN0.2 % in the respective annual and BB season averages. Although BB aerosols strongly influence this region, the contribution of anthropogenic sources to CCN0.2 % remains higher within the boundary layer. This may be due to SO2 emitted from anthropogenic sources, which can increase CCN0.2 % by aerosol nucleation. As aerosol nucleation is an essential source of CCN0.2 %, the nucleation of aerosols due to SO2 from anthropogenic sources may be one of the main ways in which anthropogenic sources increase CCN0.2 %. The CCN0.2 % contributed by sea salt and DMS is mainly concentrated within the marine boundary layer, accounting for ∼ 8 % and ∼ 16 % of the annual mean respectively.
The importance of BB and anthropogenic emissions to CCN0.2 % increases significantly in the cloud and plume layers. Both BB and anthropogenic emissions are transported from the African continent. Due to convection over land and the difference in altitude between the land and the ocean, these emissions are transported in the free troposphere above the cloud layer; therefore, BB and anthropogenic aerosol concentrations increase with altitude, resulting in a concurrent increase in their contribution to CCN0.2 %. In the cloud layer, BB contributes more to CCN0.2 % compared with anthropogenic emissions, and it is the largest source of CCN0.2 % in terms of emission sources. During BB season, BB contributes 43 % of the CCN0.2 % in the cloud layer, even more than the contribution from total aerosol nucleation, making BB the most significant source of CCN0.2 % overall (Fig. S3). The contribution of BB to CCN0.2 % further increases in the plume layer, with BB becoming the most dominant source of CCN0.2 % overall. The contribution of BB to CCN0.2 % in the plume layer is 64 % on annual average, and it increases to 76 % during BB season. This result highlights the significant impact of BB aerosols on CCN0.2 %, especially during the BB season. However, as most of the CCN0.2 % contributed by BB is distributed in the free troposphere, its effect on clouds is likely to be limited and similar to that of anthropogenic sources.
3.2 Cloud adjustments
3.2.1 Maximum supersaturation
As shown in Fig. 6, among the aerosols from various sources (emissions and atmospheric processes), BB aerosol is the only one that noticeably increases the maximum supersaturation. The increase in maximum supersaturation due to BB aerosol is more evident during the BB season, at approximately 0.028 % (Fig. S5). By contrast, all other aerosols generally exhibit a decreasing effect on the maximum supersaturation. The increase in maximum supersaturation due to BB aerosols is caused by the dynamical feedback due to short-wave absorption. As most BB aerosols are located directly above the inversion layer, their short-wave absorption can warm the surrounding air and enhance the underlying inversion. As a result, dry-air entrainment is reduced and water vapour within the boundary layer is preserved, leading to an increase in maximum supersaturation, consistent with the findings of Che et al. (2021). For other types of aerosols, however, their effect on the maximum supersaturation is mainly through microphysical processes (i.e. acting as CCN). Therefore, these aerosols provide condensation sinks for water vapour, resulting in a reduction in the maximum supersaturation. Thus, as the largest contributor to CCN0.2 % in the marine boundary layer, total aerosol nucleation has the strongest effect on reducing the maximum supersaturation among other CCN sources. The decrease in maximum supersaturation due to sea salt is also apparent, second only to the effect of total aerosol nucleation. However, the annual mean CCN0.2 % contributed by sea salt is low in the marine boundary layer, only accounting for one-sixth of that from total aerosol nucleation. This is because, despite the low number concentrations, sea-salt particles have a large diameter and, therefore, provide a larger surface to allow more water vapour to condense.

Figure 6UKESM1-simulated annual mean vertical profiles of maximum supersaturation (%) from different sources. Profiles are averaged along the latitudes of the cloud box. The contributions of different sources to maximum supersaturation are listed in subplots (a) to (h), where the contribution of emissions is shown using the orange frame, and the contribution of atmospheric processes is shown using the teal frame. The contour lines in each subplot are the cloud specific water content from the baseline simulation at the same temporal and spatial average. The same colour map scale is used in each subplot to facilitate comparison, but the range differs in each plot, corresponding to the maximum and minimum of the maximum supersaturation.
3.2.2 Cloud droplet number concentration
The annual means of the cloud droplet number concentration (CDNC) from different sources are illustrated in Fig. 7. As can be seen from the aforementioned figure, the dominant source of the CDNC is generally total aerosol nucleation, which is consistent with the source attribution of CCN0.2 % within the marine boundary layer. Even during the BB season, the concentration of the CDNC contributed by total aerosol nucleation is similar to that of BB (Fig. S6), indicating that total aerosol nucleation remains the most significant source of the CDNC throughout the years. Previous studies have found that more than half of the CCN in the global marine boundary layer are contributed by aerosol nucleation (Clarke et al., 2013; Merikanto et al., 2009; Williamson et al., 2019; Clarke and Kapustin, 2002), consistent with our result. However, source attribution in multiple models is recommended to confirm the importance of aerosol nucleation to the CDNC, as the nucleation- and Aitken-mode aerosol concentrations are significantly overpredicted by HadGEM models (Ranjithkumar et al., 2021; Gordon et al., 2020; Hardacre et al., 2021; Bellouin et al., 2013), suggesting that the contribution from nucleation to the CDNC may also be overestimated in our model. In terms of emission sources, anthropogenic emissions make the highest contribution to the annual mean CDNC, with a slightly higher contribution than that of BB. This finding is also consistent with the result that anthropogenic sources contribute the highest proportion of CCN0.2 % of all emission sources in the marine boundary layer. BB contributes the second largest annual mean with respect to the CDNC in terms of emission sources, closely followed by the contribution from DMS, which is consistent with their contributions to CCN0.2 % within the marine boundary layer. However, during the BB season, the importance of BB to the CDNC increases significantly, and it contributed about the same amount of the CDNC as total aerosol nucleation and almost twice as much as anthropogenic emissions (Fig. S6). The contribution of BB to the CDNC during the BB season is higher than its contribution to CCN0.2 % within the boundary layer. This inconsistency is mainly due to the different contribution mechanisms of BB aerosols to the CDNC compared with other aerosols. BB aerosols can not only provide CCN to increase the CDNC but also increase the CDNC by influencing the vertical distribution of temperature through short-wave absorption, which, in turn, increases the maximum supersaturation in clouds (Che et al., 2021). This is also evidenced in Fig. 6. As a result, BB becomes the most important emission source with respect to the CDNC during the BB season. This result is also supported by a satellite study that found a clearly elevated CDNC in the presence of BB aerosols in this region (Redemann et al., 2021).
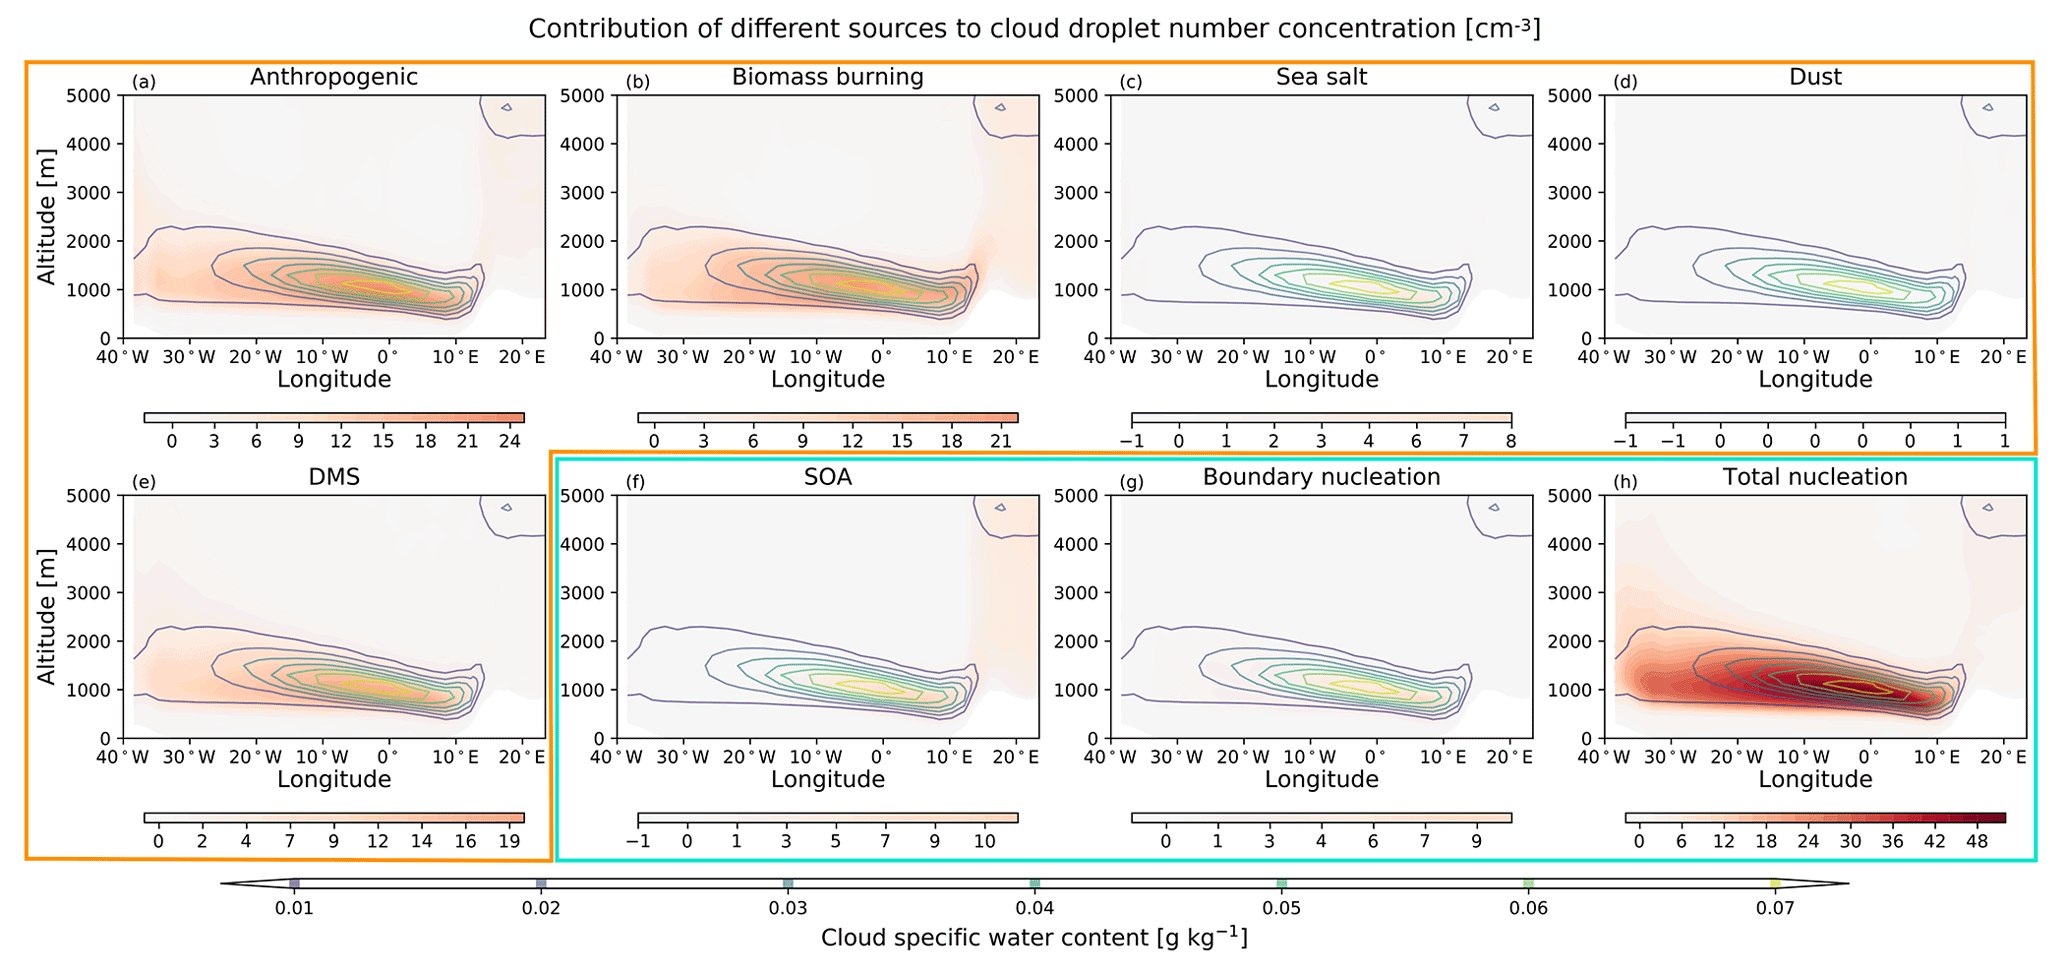
Figure 7UKESM1-simulated annual mean vertical profiles of the cloud droplet number concentration (CDNC) from different sources. Profiles are averaged along the latitudes of the cloud box. The contributions of different sources to CDNC are listed in subplots (a) to (h), where the contribution of emissions is shown using the orange frame, and the contribution of atmospheric processes is shown using the teal frame. The contour lines in each subplot are the cloud specific water content from the baseline simulation at the same temporal and spatial average. The same colour map scale is used in each subplot to facilitate comparison, but the range differs in each plot, corresponding to the maximum and minimum of the CDNC.
3.2.3 Liquid water path
This section examines cloud adjustments due to different sources of aerosols, with a focus on the LWP. It can be seen from Fig. 8 that the LWP generally corresponds well to the CDNC for different sources. Sources with an apparent increase in the CDNC also exhibit an increase in the LWP. However, the ratio of the increase in the LWP to the increase in the CDNC is different for these sources due to different aerosol properties. For the BB source, although the increase in the CDNC has a similar magnitude to that from anthropogenic emissions and is around half of that from total aerosol nucleation, the LWP increase due to BB in the cloud box region is slightly lower than the increase due to total aerosol nucleation and is nearly 3 times that due to anthropogenic sources. This can be attributed to the radiative effect of BB aerosol, strengthening existing temperature capping inversion and reducing the entrainment of sub-saturated air from above (Che et al., 2021; Deaconu et al., 2019; Sakaeda et al., 2011; Wilcox, 2010, 2012), thereby increasing the LWP. Sea salt shows a comparable (slightly lower) increase in the LWP to that of anthropogenic and DMS sources in the cloud region, although its contribution to the CDNC is much lower than that of anthropogenic and DMS emissions. This is probably due to the high hygroscopicity of sea-salt aerosols, which allows them to take up a large amount of water vapour above a certain relative humidity and retain it in the form of liquid in the particles. Other sources such as dust, SOA, and boundary layer aerosol nucleation only contribute a small amount with respect to the CDNC; therefore, the corresponding LWP increase due to these sources may also be limited.

Figure 8UKESM1-simulated annual mean liquid water path (LWP) from different sources. The contributions of different sources to the LWP are listed in subplots (a) to (h), where the contribution of emissions is shown using the orange frame, and the contribution of atmospheric processes is shown using the teal frame. The domain in each subplot ranges from 30∘ S to 10∘ N and from 40∘ W to 30∘ E. TM is the total mean of the domain, and CBM is the mean of the cloud box (the grey box on the map). The same colour map scale is used in each subplot to facilitate comparison, but the range differs for each plot, corresponding to the maximum and minimum of the LWP.
During the BB season, BB significantly increases the LWP within the cloud box region (21.7 g m−2) and has the greatest impact on the LWP of all sources (Fig. S7). The enhancement of the LWP due to BB is 2 times that due to total aerosol nucleation in the cloud box region, even with a similar amount of the CDNC contributed by those two sources during the BB season. The higher LWP caused by BB aerosols when they are located directly above the inversion layer reflects the critical role of the radiative effect of this aerosol source in affecting cloud properties; this is consistent with our previous finding (Che et al., 2021).
3.3 Radiative effects
The radiative effects of different sources are investigated in this section. The radiative forcing from aerosol–radiation interactions (RFari) and the cloud radiative effect (CRE) from aerosol–cloud interactions are calculated using the method of Ghan (2013). CRE includes rapid adjustments from aerosol–radiation interactions (known as the aerosol semi-direct effect) as well as the effective radiative forcing from aerosol–cloud interactions (ERFaci). As the aerosol semi-direct effect can impact the temperature profile and further influence the cloud droplet size, number concentration, and cloud fraction, it is difficult to isolate, and it is reasonable to include it in the CRE. The effect of different aerosol sources on the low-level cloud fraction is shown in Figs. S8 (annual mean) and S9 (BB season mean). Overall, BB aerosols have the largest effect on the low-level cloud fraction, increasing it by 0.04 on annual average and by 0.1 during the BB season in the cloud box region, followed by the contributions from aerosol nucleation and anthropogenic sources. The increase in the cloud fraction from BB aerosols is mainly due to the strengthening of the inversion layer due to short-wave absorption, which reduces dry-air entrainment at the cloud tops and leads to an increase in the liquid water content of the clouds. In contrast, the increase in the cloud fraction due to anthropogenic emissions and the total aerosol nucleation process is driven by the increase in CCN and the CDNC in the region due to aerosols from these two sources.

Figure 9UKESM1-simulated radiative forcing from the aerosol–radiation interaction (RFari) and cloud radiative effect (CRE) for different sources. Panels (a) and (b) are the annual and BB season means of RFari, and panels (c) and (d) are the annual and BB season means of CRE. Anthro, BB, SS, DMS, Dust, SOA, BLN, and TN represent anthropogenic, BB, sea-salt, DMS, dust, SOA, boundary layer nucleation, and total aerosol nucleation sources respectively. Blue, orange, and green colours represent the mean values averaged over the global, investigated SEA area, and cloud box regions respectively.
Figure 9 shows that most aerosols exert a negative RFari except for those from BB, anthropogenic, and total aerosol nucleation sources, especially in the cloud box region. As the sign of the RFari depends on the relative brightness of the underlying surface and particles, the RFari of anthropogenic, BB, and total aerosol nucleation sources is positive in the cloud box region, as these aerosols are generally located above the cloud layer. This is more obvious for the BB season, during which the stratocumulus fraction and emissions from anthropogenic and BB sources increase coincidentally in the cloud box region. However, at the regional SEA and global scales, only BB and total aerosol nucleation exhibit a warming RFari. This is because BB aerosols could absorb short-wave radiation and warm up the lower troposphere, while total aerosol nucleation produces a large number of small particles which can aggregate on the surface of the BC, thereby increasing BC absorption through the coating. Sea salt exhibits the most notable cooling effect, and its RFari shows little difference among the global, SEA, and cloud box regions. Although the aerosol concentration from sea salt is relatively low, the larger size of its particle makes sea salt the most crucial source of aerosol radiative cooling.
Most aerosol sources show a negative effect from the global to the cloud box region for the cloud radiative effect. Total aerosol nucleation dominates the annual negative CRE, whereas the most important source exerting negative CRE during BB season, especially in the cloud box region, is BB. This is consistent with the changes in the LWP, as BB contributes to a larger increase in the LWP during the BB season than that of total aerosol nucleation. DMS shows a negligible RFari but a comparable CRE to that of anthropogenic sources, which is consistent with the finding that it contributes a similar amount to the LWP compared to the anthropogenic source. Combining RFari and CRE, the effective radiative effect for each source is negative. The source showing the greatest total cooling is the total aerosol nucleation, although its RFari is warming, confirming the critical role of aerosol nucleation in the low-level background cloud properties and the global radiation balance.
In this paper, we use the United Kingdom Earth System Model (UKESM1) to attribute CCN and subsequent cloud property changes and radiative effects in the south-eastern Atlantic to different sources. The model has been evaluated with aircraft measurements from the CLARIFY and ORACLES campaigns for the aerosol distribution, and it is further evaluated in this study using LASIC in situ observations for the marine boundary layer CCN. This framework guides our understanding of the effect of different aerosol sources (emissions and atmospheric processes) on marine stratocumulus clouds and radiation in the SEA.
From the results, total aerosol nucleation is generally the most important source of CCN0.2 % in the marine boundary layer and cloud layer, both in terms of the annual and the BB season means. In contrast, organic-mediated boundary layer nucleation contributes a much lower concentration of CCN0.2 %, suggesting that it is not the main mechanism of CCN formation in the SEA region. This result highlights the importance of free and upper troposphere nucleation and subsequent subsidence with respect to aerosol number concentrations, which contribute ∼ 41 % of CCN0.2 % in the SEA marine boundary layer. In terms of emissions, anthropogenic sources are the largest contributor of CCN0.2 % in the marine boundary layer, resulting in an annual and BB season average CCN0.2 % of ∼ 26 % and ∼ 21 % respectively. The contribution of BB to CCN0.2 % in the marine boundary layer closely follows that of anthropogenic sources, with an annual and BB season average of ∼ 17 % and ∼ 19 % respectively. Anthropogenic emissions contribute more CCN0.2 % compared with BB in the marine boundary layer, even during the BB season; this may be attributed to SO2 emitted by anthropogenic sources, as it can form aerosols through nucleation and, thus, provide more CCN. However, the importance of BB emissions to CCN0.2 % increases significantly in the cloud and plume layers. BB contributes ∼ 64 % of the annual average CCN0.2 % in the plume layer, making it the most significant contributor for CCN0.2 %. This result highlights the significant impact of BB aerosols on CCN0.2 %, particularly in the region above the boundary layer. However, as most of the CCN0.2 % contributed by BB is distributed in the free troposphere, its effect on clouds may still be limited by cloud-top entrainment. The contribution of aerosols from different sources to the CDNC is consistent with their contribution to CCN0.2 % within the marine boundary layer in the cloud box region, highlighting the important role of boundary layer aerosols in clouds. Regardless of the annual or BB season averages, total aerosol nucleation is generally the most dominant source of the CDNC. In terms of emissions, anthropogenic sources are also the largest contributors to the annual average of the CDNC, followed by BB. During the BB season, the contribution of BB to the CDNC increases significantly (comparable to the contribution of total nucleation to the CDNC) and is much higher than the contribution of anthropogenic sources to the CDNC. This is mainly because BB aerosols, in addition to acting as CCN like anthropogenic aerosols, are generally located directly above the inversion layer and can enhance the underlying inversion layer through short-wave absorption, suppressing dry-air entrainment at the cloud top, and, thus, increasing the maximum supersaturation, leading to additional increases in the CDNC.
The LWP generally corresponds well to the source-attributed CDNC; however, the ratio of the increase in LWP to the increase in CDNC is different. The increased CDNC due to BB is only half of the CDNC contributed by total aerosol nucleation, whereas BB contributes a similar amount of LWP as total aerosol nucleation. The high ratio of LWP enhancement due to BB emissions highlights the key role of BB short-wave absorption in enhancing the existing temperature inversion and reducing the entrainment of sub-saturated air. Sea salt also more significantly increases the LWP compared with the CDNC, which may be due to the high hygroscopicity of sea-salt particles. During the BB season, BB is the most important aerosol source contributing to the increase in the LWP. Even though both sources contribute similar amounts to the CDNC, the LWP increase due to BB is twice as large as the total aerosol nucleation in the cloud box region, indicating the key role of the BB aerosol radiation effect in affecting cloud properties. Anthropogenic emissions, BB, and total aerosol nucleation exert a positive warming RFari in the cloud box region, as aerosols from these sources are mainly located above the clouds. Only aerosols from BB and total aerosol nucleation exert a positive RFari in both the SEA and global regions, which is because BB aerosol could absorb short-wave radiation and warm the lower troposphere, while the small particles from total aerosol nucleation can aggregate on the surface of BC, thereby increasing absorption through coatings. Sea salt shows the most notable negative RFari, although the aerosol concentration from sea salt is relatively low. For the cloud radiative effect, aerosols from all sources generally exhibit negative effects. Total aerosol nucleation dominates the annual mean CRE perturbation, whereas BB dominates during the BB season, consistent with the change in the LWP. Combining the RFari and CRE, the effective radiative effect for each source is negative. The aerosol source showing the greatest total negative effect is the total aerosol nucleation, indicating the critical role of aerosol nucleation in modulating the background lower-cloud properties and global radiation balance.
In our previous model evaluations, although the model is generally able to simulate the horizontal and vertical distribution of aerosols in the SEA well, aerosols are slightly underestimated at higher altitudes and are overestimated west of 5∘ W (Che et al., 2021). The latter is also confirmed by studies with the same model (although with different configurations) that showed an overestimation of aerosol concentrations in the western part of the SEA (Gordon et al., 2020; Ranjithkumar et al., 2021). By comparing the modelled CCN0.2 % with observations, we find that, although generally in good agreement with the measurements, the model still underestimates the peak CCN0.2 % during the BB season, suggesting that BB-associated CCN0.2 % may be underestimated during the BB season. Moreover, when BC particles have a thick coating, the calculated κ may be underestimated by the volume mixing rule, which may further underestimate CCN concentrations associated with BB. These model biases introduce some uncertainties into our results, particularly with respect to the effects of BB aerosols on CCN and clouds. In addition, Doherty et al. (2022) showed that cloud cover is biased high in this region, at least for the 2017 BB season, which could also lead to an overestimation of CRE. Thus, our results are subject to a certain level of model uncertainty. The discussion of different sources of CCN and their effects on clouds and radiation in this work is based on the averages during the BB season. However, from July to September, BB aerosol emissions vary with the burning conditions and areas, the marine boundary layer evolves as the sea surface temperature decreases, and the stratocumulus cloud fraction varies in different months. Therefore, the impacts of aerosol sources on CCN, clouds, and radiation can be different for each month during the BB season; this requires future study. In addition, the influence of aerosols at different heights (boundary layer, cloud layer, and free troposphere) on clouds and radiation is also an interesting issue that needs future investigation. The LASIC observational campaign provides valuable continuous measurement data for the BB season in 2016 and 2017 that can be used to validate the model's performance in the SEA marine boundary layer at a higher output resolution. The ORACLES and CLARIFY aircraft observations can provide cloud and aerosol measurements at different altitudes, contributing to future studies of the effects of aerosols at different heights on clouds and radiation. The long-term LASIC observations also can provide sufficient data for the study of seasonal variation, benefiting future studies.
The original model simulation data are available from the JASMIN facility (http://www.jasmin.ac.uk/, last access: 16 August 2022) upon request.
The supplement related to this article is available online at: https://doi.org/10.5194/acp-22-10789-2022-supplement.
PS and HC developed the concepts and ideas for the direction of the paper. HC and HG set up the model. HC carried out and analysed the model simulation. DWP and HC performed the model validation. LD, DWP, HG, HC, and PS contributed to the analysis of the results. HC wrote the paper with input and comments from all co-authors.
At least one of the (co-)authors is a member of the editorial board of Atmospheric Chemistry and Physics. The peer-review process was guided by an independent editor, and the authors also have no other competing interests to declare.
Publisher’s note: Copernicus Publications remains neutral with regard to jurisdictional claims in published maps and institutional affiliations.
This article is part of the special issue “New observations and related modelling studies of the aerosol–cloud–climate system in the Southeast Atlantic and southern Africa regions (ACP/AMT inter-journal SI)”. It is not associated with a conference.
This research has been funded by the Natural Environment Research Council (NERC) “CLARIFY” project (grant no. NE/L01355X/1). Philip Stier additionally acknowledges support from the NERC “A-CURE” project (grant no. NE/P013406/1), the European Research Council (ERC) “constRaining the EffeCts of Aerosols on Precipitation” (RECAP) project (grant no. 724602), and the H2020 “FORCeS” project (grant no. 821205), with the latter two projects receiving funding within the framework of the European Union's Horizon 2020 Research and Innovation programme. Hamish Gordon acknowledges support from the NASA “ROSES” programme (grant no. 80NSSC21K1344). The authors sincerely acknowledge the CLARIFY and ORACLES science teams for data support. We acknowledge the use of the Monsoon2 system, a collaborative facility supplied under the Joint Weather and Climate Research Programme, a strategic partnership between the UK Met Office and NERC. We also used the JASMIN facility (http://www.jasmin.ac.uk/, last access: 16 August 2022) via the Centre for Environmental Data Analysis, funded by NERC and the UK Space Agency and delivered by the Science and Technology Facilities Council.
This research has been supported by the Natural Environment Research Council (grant no. NE/L01355X/1).
This paper was edited by Paquita Zuidema and reviewed by three anonymous referees.
Abdul-Razzak, H. and Ghan, S.: A parameterization of aerosol activation 2. Multiple aerosol types, J. Geophys. Res., 105, 6837–6844, https://doi.org/10.1029/1999JD901161, 2000.
Ackerman, A. S., Kirkpatrick, M. P., Stevens, D. E., and Toon, O. B.: The impact of humidity above stratiform clouds on indirect aerosol climate forcing, Nature, 432, 1014–1017, https://doi.org/10.1038/nature03174, 2004.
Ajoku, O. F., Miller, A. J., and Norris, J. R.: Impacts of aerosols produced by biomass burning on the stratocumulus-to-cumulus transition in the equatorial Atlantic, Atmos. Sci. Lett., 22, e1025, https://doi.org/10.1002/asl.1025, 2021.
Albrecht, B. A.: Aerosols, cloud microphysics, and fractional cloudiness, Science, 245, 1227–1230, https://doi.org/10.1126/science.245.4923.1227, 1989.
Andreae, M. O.: Ocean-atmosphere interactions in the global biogeochemical sulfur cycle, Mar. Chem., 30, 1–29, https://doi.org/10.1016/0304-4203(90)90059-L, 1990.
Atmospheric Radiation Measurement (ARM) User Facility: Cloud Condensation Nuclei Particle Counter (AOSCCN2COLA), 2016-06-01 to 2017-10-31, ARM Mobile Facility (ASI) Ascension Island, South Atlantic Ocean; AMF1 (M1), compiled by: Koontz, A. and Uin, J., ARM Data Center [data set], https://doi.org/10.5439/1323892, 16 August 2022.
Bègue, N., Tulet, P., Pelon, J., Aouizerats, B., Berger, A., and Schwarzenboeck, A.: Aerosol processing and CCN formation of an intense Saharan dust plume during the EUCAARI 2008 campaign, Atmos. Chem. Phys., 15, 3497–3516, https://doi.org/10.5194/acp-15-3497-2015, 2015.
Bellouin, N., Mann, G. W., Woodhouse, M. T., Johnson, C., Carslaw, K. S., and Dalvi, M.: Impact of the modal aerosol scheme GLOMAP-mode on aerosol forcing in the Hadley Centre Global Environmental Model, Atmos. Chem. Phys., 13, 3027–3044, https://doi.org/10.5194/acp-13-3027-2013, 2013.
Berner, A. H., Bretherton, C. S., and Wood, R.: Large eddy simulation of ship tracks in the collapsed marine boundary layer: a case study from the Monterey area ship track experiment, Atmos. Chem. Phys., 15, 5851–5871, https://doi.org/10.5194/acp-15-5851-2015, 2015.
Boucher, O., Randall, D., Artaxo, P., Bretherton, C., Feingold, G., Forster, P., Kerminen, V.-M., Kondo, Y., Liao, H., Lohmann, U., Rasch, P., Satheesh, S. K., Sherwood, S., Stevens, B., and Zhang, X. Y.: Clouds and aerosols, in: Climate Change 2013: The Physical Science Basis. Contribution of Working Group I to the Fifth Assessment Report of the Intergovernmental Panel on Climate Change, edited by: Stocker, T. F., Qin, D., Plattner, G.-K., Tignor, M., Allen, S. K., Doschung, J., Nauels, A., Xia, Y., Bex, V., and Midgley, P. M., Cambridge University Press, Cambridge, UK, 571–657, https://doi.org/10.1017/CBO9781107415324.016, 2013.
Chaboureau, J.-P., Labbouz, L., Flamant, C., and Hodzic, A.: Acceleration of the southern African easterly jet driven by the radiative effect of biomass burning aerosols and its impact on transport during AEROCLO-sA, Atmos. Chem. Phys., 22, 8639–8658, https://doi.org/10.5194/acp-22-8639-2022, 2022.
Charlson, R. J., Lovelock, J. E., Andreae, M. O., and Warren, S. G.: Oceanic phytoplankton, atmospheric sulphur, cloud albedo and climate, Nature, 326, 655–661, https://doi.org/10.1038/326655a0, 1987.
Che, H., Stier, P., Gordon, H., Watson-Parris, D., and Deaconu, L.: Cloud adjustments dominate the overall negative aerosol radiative effects of biomass burning aerosols in UKESM1 climate model simulations over the south-eastern Atlantic, Atmos. Chem. Phys., 21, 17–33, https://doi.org/10.5194/acp-21-17-2021, 2021.
Che, H. C., Zhang, X. Y., Zhang, L., Wang, Y. Q., Zhang, Y. M., Shen, X. J., Ma, Q. L., Sun, J. Y., and Zhong, J. T.: Prediction of size-resolved number concentration of cloud condensation nuclei and long-term measurements of their activation characteristics, Sci. Rep., 7, 5819, https://doi.org/10.1038/s41598-017-05998-3, 2017.
Clarke, A. D. and Kapustin, V. N.: A Pacific Aerosol Survey. Part I: A Decade of Data on Particle Production, Transport, Evolution, and Mixing in the Troposphere, J. Atmospheric Sci., 59, 363–382, https://doi.org/10.1175/1520-0469(2002)059<0363:APASPI>2.0.CO;2, 2002.
Clarke, A. D., Freitag, S., Simpson, R. M. C., Hudson, J. G., Howell, S. G., Brekhovskikh, V. L., Campos, T., Kapustin, V. N., and Zhou, J.: Free troposphere as a major source of CCN for the equatorial pacific boundary layer: long-range transport and teleconnections, Atmos. Chem. Phys., 13, 7511–7529, https://doi.org/10.5194/acp-13-7511-2013, 2013.
Deaconu, L. T., Ferlay, N., Waquet, F., Peers, F., Thieuleux, F., and Goloub, P.: Satellite inference of water vapour and above-cloud aerosol combined effect on radiative budget and cloud-top processes in the southeastern Atlantic Ocean, Atmos. Chem. Phys., 19, 11613–11634, https://doi.org/10.5194/acp-19-11613-2019, 2019.
Doherty, S. J., Saide, P. E., Zuidema, P., Shinozuka, Y., Ferrada, G. A., Gordon, H., Mallet, M., Meyer, K., Painemal, D., Howell, S. G., Freitag, S., Dobracki, A., Podolske, J. R., Burton, S. P., Ferrare, R. A., Howes, C., Nabat, P., Carmichael, G. R., da Silva, A., Pistone, K., Chang, I., Gao, L., Wood, R., and Redemann, J.: Modeled and observed properties related to the direct aerosol radiative effect of biomass burning aerosol over the southeastern Atlantic, Atmos. Chem. Phys., 22, 1–46, https://doi.org/10.5194/acp-22-1-2022, 2022.
Dusek, U., Frank, G. P., Hildebrandt, L., Curtius, J., Schneider, J., Walter, S., Chand, D., Drewnick, F., Hings, S., Jung, D., Borrmann, S., and Andreae, M. O.: Size matters more than chemistry for cloud-nucleating ability of aerosol particles, Science, 312, 1375–1378, https://doi.org/10.1126/science.1125261, 2006.
Engelhart, G. J., Hennigan, C. J., Miracolo, M. A., Robinson, A. L., and Pandis, S. N.: Cloud condensation nuclei activity of fresh primary and aged biomass burning aerosol, Atmos. Chem. Phys., 12, 7285–7293, https://doi.org/10.5194/acp-12-7285-2012, 2012.
Eyring, V., Bony, S., Meehl, G. A., Senior, C. A., Stevens, B., Stouffer, R. J., and Taylor, K. E.: Overview of the Coupled Model Intercomparison Project Phase 6 (CMIP6) experimental design and organization, Geosci. Model Dev., 9, 1937–1958, https://doi.org/10.5194/gmd-9-1937-2016, 2016.
Ghan, S. J.: Technical Note: Estimating aerosol effects on cloud radiative forcing, Atmos. Chem. Phys., 13, 9971–9974, https://doi.org/10.5194/acp-13-9971-2013, 2013.
Gibson, E. R., Gierlus, K. M., Hudson, P. K., and Grassian, V. H.: Generation of Internally Mixed Insoluble and Soluble Aerosol Particles to Investigate the Impact of Atmospheric Aging and Heterogeneous Processing on the CCN Activity of Mineral Dust Aerosol, Aerosol Sci. Technol., 41, 914–924, https://doi.org/10.1080/02786820701557222, 2007.
Gidden, M. J., Riahi, K., Smith, S. J., Fujimori, S., Luderer, G., Kriegler, E., van Vuuren, D. P., van den Berg, M., Feng, L., Klein, D., Calvin, K., Doelman, J. C., Frank, S., Fricko, O., Harmsen, M., Hasegawa, T., Havlik, P., Hilaire, J., Hoesly, R., Horing, J., Popp, A., Stehfest, E., and Takahashi, K.: Global emissions pathways under different socioeconomic scenarios for use in CMIP6: a dataset of harmonized emissions trajectories through the end of the century, Geosci. Model Dev., 12, 1443–1475, https://doi.org/10.5194/gmd-12-1443-2019, 2019.
Gordon, H., Field, P. R., Abel, S. J., Dalvi, M., Grosvenor, D. P., Hill, A. A., Johnson, B. T., Miltenberger, A. K., Yoshioka, M., and Carslaw, K. S.: Large simulated radiative effects of smoke in the south-east Atlantic, Atmos. Chem. Phys., 18, 15261–15289, https://doi.org/10.5194/acp-18-15261-2018, 2018.
Gordon, H., Field, P. R., Abel, S. J., Barrett, P., Bower, K., Crawford, I., Cui, Z., Grosvenor, D. P., Hill, A. A., Taylor, J., Wilkinson, J., Wu, H., and Carslaw, K. S.: Development of aerosol activation in the double-moment Unified Model and evaluation with CLARIFY measurements, Atmos. Chem. Phys., 20, 10997–11024, https://doi.org/10.5194/acp-20-10997-2020, 2020.
Hahn, C. and Warren, S.: A Gridded Climatology of Clouds over Land (1971–1996) and Ocean (1954–2008) from Surface Observations Worldwide (NDP-026E)*, Carbon Dioxide Information Analysis Center (CDIAC), Oak Ridge National Laboratory (ORNL), Oak Ridge, TN (United States), ESS-DIVE repository [data set], https://doi.org/10.3334/CDIAC/CLI.NDP026E, 2007.
Hardacre, C., Mulcahy, J. P., Pope, R. J., Jones, C. G., Rumbold, S. T., Li, C., Johnson, C., and Turnock, S. T.: Evaluation of SO2, SO and an updated SO2 dry deposition parameterization in the United Kingdom Earth System Model, Atmos. Chem. Phys., 21, 18465–18497, https://doi.org/10.5194/acp-21-18465-2021, 2021.
Hatch, C. D., Gierlus, K. M., Schuttlefield, J. D., and Grassian, V. H.: Water adsorption and cloud condensation nuclei activity of calcite and calcite coated with model humic and fulvic acids, Atmos. Environ., 42, 5672–5684, https://doi.org/10.1016/j.atmosenv.2008.03.005, 2008.
Haywood, J. M., Abel, S. J., Barrett, P. A., Bellouin, N., Blyth, A., Bower, K. N., Brooks, M., Carslaw, K., Che, H., Coe, H., Cotterell, M. I., Crawford, I., Cui, Z., Davies, N., Dingley, B., Field, P., Formenti, P., Gordon, H., de Graaf, M., Herbert, R., Johnson, B., Jones, A. C., Langridge, J. M., Malavelle, F., Partridge, D. G., Peers, F., Redemann, J., Stier, P., Szpek, K., Taylor, J. W., Watson-Parris, D., Wood, R., Wu, H., and Zuidema, P.: The CLoud–Aerosol–Radiation Interaction and Forcing: Year 2017 (CLARIFY-2017) measurement campaign, Atmos. Chem. Phys., 21, 1049–1084, https://doi.org/10.5194/acp-21-1049-2021, 2021.
Herbert, R. J., Bellouin, N., Highwood, E. J., and Hill, A. A.: Diurnal cycle of the semi-direct effect from a persistent absorbing aerosol layer over marine stratocumulus in large-eddy simulations, Atmos. Chem. Phys., 20, 1317–1340, https://doi.org/10.5194/acp-20-1317-2020, 2020.
Hewitt, H. T., Copsey, D., Culverwell, I. D., Harris, C. M., Hill, R. S. R., Keen, A. B., McLaren, A. J., and Hunke, E. C.: Design and implementation of the infrastructure of HadGEM3: the next-generation Met Office climate modelling system, Geosci. Model Dev., 4, 223–253, https://doi.org/10.5194/gmd-4-223-2011, 2011.
Johnson, B. T., Shine, K. P., and Forster, P. M.: The semi-direct aerosol effect: Impact of absorbing aerosols on marine stratocumulus, Q. J. Roy. Meteor. Soc., 130, 1407–1422, https://doi.org/10.1256/qj.03.61, 2004.
Johnson, B. T., Haywood, J. M., Langridge, J. M., Darbyshire, E., Morgan, W. T., Szpek, K., Brooke, J. K., Marenco, F., Coe, H., Artaxo, P., Longo, K. M., Mulcahy, J. P., Mann, G. W., Dalvi, M., and Bellouin, N.: Evaluation of biomass burning aerosols in the HadGEM3 climate model with observations from the SAMBBA field campaign, Atmos. Chem. Phys., 16, 14657–14685, https://doi.org/10.5194/acp-16-14657-2016, 2016.
Kacarab, M., Thornhill, K. L., Dobracki, A., Howell, S. G., O'Brien, J. R., Freitag, S., Poellot, M. R., Wood, R., Zuidema, P., Redemann, J., and Nenes, A.: Biomass burning aerosol as a modulator of the droplet number in the southeast Atlantic region, Atmos. Chem. Phys., 20, 3029–3040, https://doi.org/10.5194/acp-20-3029-2020, 2020.
Kerminen, V.-M., Paramonov, M., Anttila, T., Riipinen, I., Fountoukis, C., Korhonen, H., Asmi, E., Laakso, L., Lihavainen, H., Swietlicki, E., Svenningsson, B., Asmi, A., Pandis, S. N., Kulmala, M., and Petäjä, T.: Cloud condensation nuclei production associated with atmospheric nucleation: a synthesis based on existing literature and new results, Atmos. Chem. Phys., 12, 12037–12059, https://doi.org/10.5194/acp-12-12037-2012, 2012.
Klein, S. A. and Hartmann, D. L.: The Seasonal Cycle of Low Stratiform Clouds, J. Climate, 6, 1587–1606, https://doi.org/10.1175/1520-0442(1993)006<1587:TSCOLS>2.0.CO;2, 1993.
Kuang, C., McMurry, P. H., and McCormick, A. V.: Determination of cloud condensation nuclei production from measured new particle formation events, Geophys. Res. Lett., 36, L09822, https://doi.org/10.1029/2009GL037584, 2009.
Kulmala, M. and Kerminen, V. M.: On the formation and growth of atmospheric nanoparticles, Atmos. Res., 90, 132–150, https://doi.org/10.1016/j.atmosres.2008.01.005, 2008.
Kulmala, M., Vehkamäki, H., Petäjä, T., Dal Maso, M., Lauri, A., Kerminen, V.-M., Birmili, W., and McMurry, P. H.: Formation and growth rates of ultrafine atmospheric particles: a review of observations, J. Aerosol Sci., 35, 143–176, https://doi.org/10.1016/j.jaerosci.2003.10.003, 2004.
Lee, S.-H., Reeves, J. M., Wilson, J. C., Hunton, D. E., Viggiano, A. A., Miller, T. M., Ballenthin, J. O., and Lait, L. R.: Particle Formation by Ion Nucleation in the Upper Troposphere and Lower Stratosphere, Science, 301, 1886–1889, https://doi.org/10.1126/science.1087236, 2003.
Liousse, C., Assamoi, E., Criqui, P., Granier, C., and Rosset, R.: Explosive growth in African combustion emissions from 2005 to 2030, Environ. Res. Lett., 9, 035003, https://doi.org/10.1088/1748-9326/9/3/035003, 2014.
Lu, Z., Liu, X., Zhang, Z., Zhao, C., Meyer, K., Rajapakshe, C., Wu, C., Yang, Z., and Penner, J. E.: Biomass smoke from southern Africa can significantly enhance the brightness of stratocumulus over the southeastern Atlantic Ocean, P. Natl. Acad. Sci. USA, 115, 2924–2929, https://doi.org/10.1073/pnas.1713703115, 2018.
Mallet, M., Solmon, F., Nabat, P., Elguindi, N., Waquet, F., Bouniol, D., Sayer, A. M., Meyer, K., Roehrig, R., Michou, M., Zuidema, P., Flamant, C., Redemann, J., and Formenti, P.: Direct and semi-direct radiative forcing of biomass-burning aerosols over the southeast Atlantic (SEA) and its sensitivity to absorbing properties: a regional climate modeling study, Atmos. Chem. Phys., 20, 13191–13216, https://doi.org/10.5194/acp-20-13191-2020, 2020.
Mann, G. W., Carslaw, K. S., Spracklen, D. V., Ridley, D. A., Manktelow, P. T., Chipperfield, M. P., Pickering, S. J., and Johnson, C. E.: Description and evaluation of GLOMAP-mode: a modal global aerosol microphysics model for the UKCA composition-climate model, Geosci. Model Dev., 3, 519–551, https://doi.org/10.5194/gmd-3-519-2010, 2010.
Mentel, Th. F., Wildt, J., Kiendler-Scharr, A., Kleist, E., Tillmann, R., Dal Maso, M., Fisseha, R., Hohaus, Th., Spahn, H., Uerlings, R., Wegener, R., Griffiths, P. T., Dinar, E., Rudich, Y., and Wahner, A.: Photochemical production of aerosols from real plant emissions, Atmos. Chem. Phys., 9, 4387–4406, https://doi.org/10.5194/acp-9-4387-2009, 2009.
Merikanto, J., Spracklen, D. V., Mann, G. W., Pickering, S. J., and Carslaw, K. S.: Impact of nucleation on global CCN, Atmos. Chem. Phys., 9, 8601–8616, https://doi.org/10.5194/acp-9-8601-2009, 2009.
Metzger, A., Verheggen, B., Dommen, J., Duplissy, J., Prevot, A. S. H., Weingartner, E., Riipinen, I., Kulmala, M., Spracklen, D. V., Carslaw, K. S., and Baltensperger, U.: Evidence for the role of organics in aerosol particle formation under atmospheric conditions, P. Natl. Acad. Sci. USA, 107, 6646–6651, https://doi.org/10.1073/pnas.0911330107, 2010.
Morcrette, C. J.: Improvements to a prognostic cloud scheme through changes to its cloud erosion parametrization, Atmos. Sci. Lett., 13, 95–102, https://doi.org/10.1002/asl.374, 2012.
Mulcahy, J. P., Johnson, C., Jones, C. G., Povey, A. C., Scott, C. E., Sellar, A., Turnock, S. T., Woodhouse, M. T., Abraham, N. L., Andrews, M. B., Bellouin, N., Browse, J., Carslaw, K. S., Dalvi, M., Folberth, G. A., Glover, M., Grosvenor, D. P., Hardacre, C., Hill, R., Johnson, B., Jones, A., Kipling, Z., Mann, G., Mollard, J., O'Connor, F. M., Palmiéri, J., Reddington, C., Rumbold, S. T., Richardson, M., Schutgens, N. A. J., Stier, P., Stringer, M., Tang, Y., Walton, J., Woodward, S., and Yool, A.: Description and evaluation of aerosol in UKESM1 and HadGEM3-GC3.1 CMIP6 historical simulations, Geosci. Model Dev., 13, 6383–6423, https://doi.org/10.5194/gmd-13-6383-2020, 2020.
O'Connor, F. M., Johnson, C. E., Morgenstern, O., Abraham, N. L., Braesicke, P., Dalvi, M., Folberth, G. A., Sanderson, M. G., Telford, P. J., Voulgarakis, A., Young, P. J., Zeng, G., Collins, W. J., and Pyle, J. A.: Evaluation of the new UKCA climate-composition model – Part 2: The Troposphere, Geosci. Model Dev., 7, 41–91, https://doi.org/10.5194/gmd-7-41-2014, 2014.
Petters, M. D. and Kreidenweis, S. M.: A single parameter representation of hygroscopic growth and cloud condensation nucleus activity, Atmos. Chem. Phys., 7, 1961–1971, https://doi.org/10.5194/acp-7-1961-2007, 2007.
Pierce, J. R. and Adams, P. J.: Global evaluation of CCN formation by direct emission of sea salt and growth of ultrafine sea salt, J. Geophys. Res.-Atmos., 111, D06203, https://doi.org/10.1029/2005JD006186, 2006.
Quinn, P. K., Coffman, D. J., Johnson, J. E., Upchurch, L. M., and Bates, T. S.: Small fraction of marine cloud condensation nuclei made up of sea spray aerosol, Nat. Geosci., 10, 674–679, https://doi.org/10.1038/ngeo3003, 2017.
Ranjithkumar, A., Gordon, H., Williamson, C., Rollins, A., Pringle, K., Kupc, A., Abraham, N. L., Brock, C., and Carslaw, K.: Constraints on global aerosol number concentration, SO2 and condensation sink in UKESM1 using ATom measurements, Atmos. Chem. Phys., 21, 4979–5014, https://doi.org/10.5194/acp-21-4979-2021, 2021.
Redemann, J., Wood, R., Zuidema, P., Doherty, S. J., Luna, B., LeBlanc, S. E., Diamond, M. S., Shinozuka, Y., Chang, I. Y., Ueyama, R., Pfister, L., Ryoo, J.-M., Dobracki, A. N., da Silva, A. M., Longo, K. M., Kacenelenbogen, M. S., Flynn, C. J., Pistone, K., Knox, N. M., Piketh, S. J., Haywood, J. M., Formenti, P., Mallet, M., Stier, P., Ackerman, A. S., Bauer, S. E., Fridlind, A. M., Carmichael, G. R., Saide, P. E., Ferrada, G. A., Howell, S. G., Freitag, S., Cairns, B., Holben, B. N., Knobelspiesse, K. D., Tanelli, S., L'Ecuyer, T. S., Dzambo, A. M., Sy, O. O., McFarquhar, G. M., Poellot, M. R., Gupta, S., O'Brien, J. R., Nenes, A., Kacarab, M., Wong, J. P. S., Small-Griswold, J. D., Thornhill, K. L., Noone, D., Podolske, J. R., Schmidt, K. S., Pilewskie, P., Chen, H., Cochrane, S. P., Sedlacek, A. J., Lang, T. J., Stith, E., Segal-Rozenhaimer, M., Ferrare, R. A., Burton, S. P., Hostetler, C. A., Diner, D. J., Seidel, F. C., Platnick, S. E., Myers, J. S., Meyer, K. G., Spangenberg, D. A., Maring, H., and Gao, L.: An overview of the ORACLES (ObseRvations of Aerosols above CLouds and their intEractionS) project: aerosol–cloud–radiation interactions in the southeast Atlantic basin, Atmos. Chem. Phys., 21, 1507–1563, https://doi.org/10.5194/acp-21-1507-2021, 2021.
Reynolds, R. W., Smith, T. M., Liu, C., Chelton, D. B., Casey, K. S., and Schlax, M. G.: Daily High-Resolution-Blended Analyses for Sea Surface Temperature, J. Climate, 20, 5473–5496, https://doi.org/10.1175/2007JCLI1824.1, 2007.
Roberts, G., Wooster, M. J., and Lagoudakis, E.: Annual and diurnal african biomass burning temporal dynamics, Biogeosciences, 6, 849–866, https://doi.org/10.5194/bg-6-849-2009, 2009.
Roberts, G. C. and Nenes, A.: A Continuous-Flow Streamwise Thermal-Gradient CCN Chamber for Atmospheric Measurements, Aerosol Sci. Technol., 39, 206–221, https://doi.org/10.1080/027868290913988, 2005.
Rose, D., Gunthe, S. S., Su, H., Garland, R. M., Yang, H., Berghof, M., Cheng, Y. F., Wehner, B., Achtert, P., Nowak, A., Wiedensohler, A., Takegawa, N., Kondo, Y., Hu, M., Zhang, Y., Andreae, M. O., and Pöschl, U.: Cloud condensation nuclei in polluted air and biomass burning smoke near the mega-city Guangzhou, China – Part 2: Size-resolved aerosol chemical composition, diurnal cycles, and externally mixed weakly CCN-active soot particles, Atmos. Chem. Phys., 11, 2817–2836, https://doi.org/10.5194/acp-11-2817-2011, 2011.
Saha, P. K., Robinson, E. S., Shah, R. U., Zimmerman, N., Apte, J. S., Robinson, A. L., and Presto, A. A.: Reduced Ultrafine Particle Concentration in Urban Air: Changes in Nucleation and Anthropogenic Emissions, Environ. Sci. Technol., 52, 6798–6806, https://doi.org/10.1021/acs.est.8b00910, 2018.
Sakaeda, N., Wood, R., and Rasch, P. J.: Direct and semidirect aerosol effects of southern African biomass burning aerosol, J. Geophys. Res.-Atmos., 116, D12205, https://doi.org/10.1029/2010JD015540, 2011.
Sanchez, K. J., Chen, C.-L., Russell, L. M., Betha, R., Liu, J., Price, D. J., Massoli, P., Ziemba, L. D., Crosbie, E. C., Moore, R. H., Müller, M., Schiller, S. A., Wisthaler, A., Lee, A. K. Y., Quinn, P. K., Bates, T. S., Porter, J., Bell, T. G., Saltzman, E. S., Vaillancourt, R. D., and Behrenfeld, M. J.: Substantial Seasonal Contribution of Observed Biogenic Sulfate Particles to Cloud Condensation Nuclei, Sci. Rep., 8, 3235, https://doi.org/10.1038/s41598-018-21590-9, 2018.
Schmale, J., Henning, S., Decesari, S., Henzing, B., Keskinen, H., Sellegri, K., Ovadnevaite, J., Pöhlker, M. L., Brito, J., Bougiatioti, A., Kristensson, A., Kalivitis, N., Stavroulas, I., Carbone, S., Jefferson, A., Park, M., Schlag, P., Iwamoto, Y., Aalto, P., Äijälä, M., Bukowiecki, N., Ehn, M., Frank, G., Fröhlich, R., Frumau, A., Herrmann, E., Herrmann, H., Holzinger, R., Kos, G., Kulmala, M., Mihalopoulos, N., Nenes, A., O'Dowd, C., Petäjä, T., Picard, D., Pöhlker, C., Pöschl, U., Poulain, L., Prévôt, A. S. H., Swietlicki, E., Andreae, M. O., Artaxo, P., Wiedensohler, A., Ogren, J., Matsuki, A., Yum, S. S., Stratmann, F., Baltensperger, U., and Gysel, M.: Long-term cloud condensation nuclei number concentration, particle number size distribution and chemical composition measurements at regionally representative observatories, Atmos. Chem. Phys., 18, 2853–2881, https://doi.org/10.5194/acp-18-2853-2018, 2018.
Seinfeld, J. H. and Pandis, S. N.: Atmospheric chemistry and physics: from air pollution to climate change, 3rd edn., Wiley, 1152 pp., ISBN 978-1-118-94740-1, 2016.
Sellar, A. A., Jones, C. G., Mulcahy, J. P., Tang, Y., Yool, A., Wiltshire, A., O'Connor, F. M., Stringer, M., Hill, R., Palmieri, J., Woodward, S., Mora, L. de, Kuhlbrodt, T., Rumbold, S. T., Kelley, D. I., Ellis, R., Johnson, C. E., Walton, J., Abraham, N. L., Andrews, M. B., Andrews, T., Archibald, A. T., Berthou, S., Burke, E., Blockley, E., Carslaw, K., Dalvi, M., Edwards, J., Folberth, G. A., Gedney, N., Griffiths, P. T., Harper, A. B., Hendry, M. A., Hewitt, A. J., Johnson, B., Jones, A., Jones, C. D., Keeble, J., Liddicoat, S., Morgenstern, O., Parker, R. J., Predoi, V., Robertson, E., Siahaan, A., Smith, R. S., Swaminathan, R., Woodhouse, M. T., Zeng, G., and Zerroukat, M.: UKESM1: Description and Evaluation of the U.K. Earth System Model, J. Adv. Model. Earth Syst., 11, 4513–4558, https://doi.org/10.1029/2019MS001739, 2019.
Spracklen, D. V., Carslaw, K. S., Kulmala, M., Kerminen, V.-M., Mann, G. W., and Sihto, S.-L.: The contribution of boundary layer nucleation events to total particle concentrations on regional and global scales, Atmos. Chem. Phys., 6, 5631–5648, https://doi.org/10.5194/acp-6-5631-2006, 2006.
Stephens, G. and Slingo, T.: An air-conditioned greenhouse, Nature, 358, 369–370, https://doi.org/10.1038/358369a0, 1992.
Stier, P., Feichter, J., Kloster, S., Vignati, E., and Wilson, J.: Emission-Induced Nonlinearities in the Global Aerosol System: Results from the ECHAM5-HAM Aerosol-Climate Model, J. Climate, 19, 3845–3862, https://doi.org/10.1175/JCLI3772.1, 2006.
Telford, P. J., Braesicke, P., Morgenstern, O., and Pyle, J. A.: Technical Note: Description and assessment of a nudged version of the new dynamics Unified Model, Atmos. Chem. Phys., 8, 1701–1712, https://doi.org/10.5194/acp-8-1701-2008, 2008.
Textor, C., Schulz, M., Guibert, S., Kinne, S., Balkanski, Y., Bauer, S., Berntsen, T., Berglen, T., Boucher, O., Chin, M., Dentener, F., Diehl, T., Easter, R., Feichter, H., Fillmore, D., Ghan, S., Ginoux, P., Gong, S., Grini, A., Hendricks, J., Horowitz, L., Huang, P., Isaksen, I., Iversen, I., Kloster, S., Koch, D., Kirkevåg, A., Kristjansson, J. E., Krol, M., Lauer, A., Lamarque, J. F., Liu, X., Montanaro, V., Myhre, G., Penner, J., Pitari, G., Reddy, S., Seland, Ø., Stier, P., Takemura, T., and Tie, X.: Analysis and quantification of the diversities of aerosol life cycles within AeroCom, Atmos. Chem. Phys., 6, 1777–1813, https://doi.org/10.5194/acp-6-1777-2006, 2006.
Thomas, M. A., Suntharalingam, P., Pozzoli, L., Rast, S., Devasthale, A., Kloster, S., Feichter, J., and Lenton, T. M.: Quantification of DMS aerosol-cloud-climate interactions using the ECHAM5-HAMMOZ model in a current climate scenario, Atmos. Chem. Phys., 10, 7425–7438, https://doi.org/10.5194/acp-10-7425-2010, 2010.
Tsigaridis, K., Koch, D., and Menon, S.: Uncertainties and importance of sea spray composition on aerosol direct and indirect effects, J. Geophys. Res.-Atmos., 118, 220–235, https://doi.org/10.1029/2012JD018165, 2013.
Twomey, S.: Pollution and the planetary albedo, Atmos Env., 8, 1251–1256, 1974.
van der Werf, G. R., Randerson, J. T., Giglio, L., Collatz, G. J., Mu, M., Kasibhatla, P. S., Morton, D. C., DeFries, R. S., Jin, Y., and van Leeuwen, T. T.: Global fire emissions and the contribution of deforestation, savanna, forest, agricultural, and peat fires (1997–2009), Atmos. Chem. Phys., 10, 11707–11735, https://doi.org/10.5194/acp-10-11707-2010, 2010.
Vehkamäki, H., Kulmala, M., Napari, I., Lehtinen, K. E. J., Timmreck, C., Noppel, M., and Laaksonen, A.: An improved parameterization for sulfuric acid–water nucleation rates for tropospheric and stratospheric conditions, J. Geophys. Res.-Atmos., 107, 4622, https://doi.org/10.1029/2002JD002184, 2002.
Walters, D., Baran, A. J., Boutle, I., Brooks, M., Earnshaw, P., Edwards, J., Furtado, K., Hill, P., Lock, A., Manners, J., Morcrette, C., Mulcahy, J., Sanchez, C., Smith, C., Stratton, R., Tennant, W., Tomassini, L., Van Weverberg, K., Vosper, S., Willett, M., Browse, J., Bushell, A., Carslaw, K., Dalvi, M., Essery, R., Gedney, N., Hardiman, S., Johnson, B., Johnson, C., Jones, A., Jones, C., Mann, G., Milton, S., Rumbold, H., Sellar, A., Ujiie, M., Whitall, M., Williams, K., and Zerroukat, M.: The Met Office Unified Model Global Atmosphere 7.0/7.1 and JULES Global Land 7.0 configurations, Geosci. Model Dev., 12, 1909–1963, https://doi.org/10.5194/gmd-12-1909-2019, 2019.
Westervelt, D. M., Pierce, J. R., Riipinen, I., Trivitayanurak, W., Hamed, A., Kulmala, M., Laaksonen, A., Decesari, S., and Adams, P. J.: Formation and growth of nucleated particles into cloud condensation nuclei: model–measurement comparison, Atmos. Chem. Phys., 13, 7645–7663, https://doi.org/10.5194/acp-13-7645-2013, 2013.
Wilcox, E. M.: Stratocumulus cloud thickening beneath layers of absorbing smoke aerosol, Atmos. Chem. Phys., 10, 11769–11777, https://doi.org/10.5194/acp-10-11769-2010, 2010.
Wilcox, E. M.: Direct and semi-direct radiative forcing of smoke aerosols over clouds, Atmos. Chem. Phys., 12, 139–149, https://doi.org/10.5194/acp-12-139-2012, 2012.
Williamson, C. J., Kupc, A., Axisa, D., Bilsback, K. R., Bui, T., Campuzano-Jost, P., Dollner, M., Froyd, K. D., Hodshire, A. L., Jimenez, J. L., Kodros, J. K., Luo, G., Murphy, D. M., Nault, B. A., Ray, E. A., Weinzierl, B., Wilson, J. C., Yu, F., Yu, P., Pierce, J. R., and Brock, C. A.: A large source of cloud condensation nuclei from new particle formation in the tropics, Nature, 574, 399–403, https://doi.org/10.1038/s41586-019-1638-9, 2019.
Wilson, D. R., Bushell, A. C., Kerr-Munslow, A. M., Price, J. D., and Morcrette, C. J.: PC2: A prognostic cloud fraction and condensation scheme. I: Scheme description, Q. J. Roy. Meteor. Soc., 134, 2093–2107, https://doi.org/10.1002/qj.333, 2008a.
Wilson, D. R., Bushell, A. C., Kerr-Munslow, A. M., Price, J. D., Morcrette, C. J., and Bodas-Salcedo, A.: PC2: A prognostic cloud fraction and condensation scheme. II: Climate model simulations, Q. J. Roy. Meteor. Soc., 134, 2109–2125, https://doi.org/10.1002/qj.332, 2008b.
Wood, R.: Stratocumulus Clouds, Mon. Weather Rev., 140, 2373–2423, https://doi.org/10.1175/MWR-D-11-00121.1, 2012.
Woodward, S.: Modeling the atmospheric life cycle and radiative impact of mineral dust in the Hadley Centre climate model, J. Geophys. Res.-Atmos., 106, 18155–18166, https://doi.org/10.1029/2000JD900795, 2001.
Yassaa, N., Peeken, I., Zöllner, E., Bluhm, K., Arnold, S., Spracklen, D., and Williams, J.: Evidence for marine production of monoterpenes, Environ. Chem., 5, 391–401, https://doi.org/10.1071/EN08047, 2008.
Yu, F., Ma, X., and Luo, G.: Anthropogenic contribution to cloud condensation nuclei and the first aerosol indirect climate effect, Environ. Res. Lett., 8, 024029, https://doi.org/10.1088/1748-9326/8/2/024029, 2013.
Zhang, J. and Zuidema, P.: The diurnal cycle of the smoky marine boundary layer observed during August in the remote southeast Atlantic, Atmos. Chem. Phys., 19, 14493–14516, https://doi.org/10.5194/acp-19-14493-2019, 2019.
Zhang, K., Wan, H., Liu, X., Ghan, S. J., Kooperman, G. J., Ma, P.-L., Rasch, P. J., Neubauer, D., and Lohmann, U.: Technical Note: On the use of nudging for aerosol–climate model intercomparison studies, Atmos. Chem. Phys., 14, 8631–8645, https://doi.org/10.5194/acp-14-8631-2014, 2014.
Zhang, L., Segal-Rozenhaimer, M., Che, H., Dang, C., Sun, J., Kuang, Y., and Howell, S. G.: Enhanced hygroscopicity of biomass burning aerosols with aging over the South-East Atlantic Ocean, Environ. Sci. Technol., in review, 2022.
Zuidema, P., Alvarado, M., Chiu, C., DeSzoeke, S., Fairall, C., Feingold, G., Freedman, A., Ghan, S., Haywood, J., Kollias, P., Lewis, E., McFarquhar, G., McComiskey, A., Mechem, D., Onasch, T., Redemann, J., Romps, D., and Turner, D.: Layered Atlantic Smoke Interactions with Clouds (LASIC) Field Campaign Report, 47, https://www.arm.gov/publications/programdocs/doe-sc-arm-18-018.pdf (last access: 16 August 2022), 2018a.
Zuidema, P., Sedlacek, A. J., Flynn, C., Springston, S., Delgadillo, R., Zhang, J., Aiken, A. C., Koontz, A., and Muradyan, P.: The Ascension Island Boundary Layer in the Remote Southeast Atlantic is Often Smoky, Geophys. Res. Lett., 45, 4456–4465, https://doi.org/10.1002/2017GL076926, 2018b.