the Creative Commons Attribution 4.0 License.
the Creative Commons Attribution 4.0 License.
 | 15 Aug 2022
Sources and processes of water-soluble and water-insoluble organic aerosol in cold season in Beijing, China
Zhiqiang Zhang
Chun Chen
Bo You
Aodong Du
Weiqi Xu
Yan Li
Zhijie Li
Lu Lei
Jiaxing Sun
Yanmei Qiu
Lianfang Wei
Pingqing Fu
Zifa Wang
Water-soluble and water-insoluble organic aerosol (WSOA and WIOA) constitute a large fraction of fine particles in winter in northern China, yet our understanding of their sources and processes are still limited. Here we have a comprehensive characterization of WSOA in cold season in Beijing. Particularly, we present the first mass spectral characterization of WIOA by integrating online and offline organic aerosol measurements from high-resolution aerosol mass spectrometer. Our results showed that WSOA on average accounted for 59 % of the total OA and comprised dominantly secondary OA (SOA, 69 %). The WSOA composition showed significant changes during the transition season from autumn to winter. While the photochemical-related SOA dominated WSOA (51 %) in early November, the oxidized SOA from biomass burning increased substantially from 8 % to 29 % during the heating season. Comparatively, local primary OA dominantly from cooking aerosol contributed the major fraction of WSOA during clean periods. WIOA showed largely different spectral patterns from WSOA which were characterized by prominent hydrocarbon ions series and low oxygen-to-carbon ( = 0.19) and organic mass-to-organic carbon ( = 1.39) ratios. The nighttime WIOA showed less oxidized properties ( = 0.16 vs. 0.24) with more pronounced polycyclic aromatic hydrocarbons (PAHs) signals than daytime, indicating the impacts of enhanced coal combustion emissions on WIOA. The evolution process of WSOA and WIOA was further demonstrated by the triangle plot of f44 (fraction of 44 in OA) vs. f43, f44 vs. f60, and the Van Krevelen diagram ( vs. ). We also found more oxidized WSOA and an increased contribution of SOA in WSOA compared with previous winter studies in Beijing, indicating that the changes in OA composition due to clean air act have affected the sources and properties of WSOA.
- Article
(5807 KB) - Full-text XML
-
Supplement
(1015 KB) - BibTeX
- EndNote


Organic aerosol (OA) is an important component of atmospheric fine particles and exerts significant impacts on air pollution, public health, radiative forcing, and climate change (Jimenez et al., 2009; Tsigaridis et al., 2014). OA can be divided into primary OA (POA) emitted directly to the atmosphere, e.g., from combustion processes, and secondary OA (SOA) from oxidation of volatile organic compounds (VOCs), or water-soluble OA (WSOA) and water-insoluble OA (WIOA) based on water solubilities of OA. Recent studies showed that SOA formed from both anthropogenic and biogenic VOCs (especially in summer), and POAs emitted from biomass burning (especially during winter) are important contributors of WSOA (Y. Sun et al., 2011; Bozzetti et al., 2017a, b). WSOA can absorb water due to its hydrophilic properties, affect the optical properties and the ability to act as cloud condensation nuclei, and thus influence the microphysical and radiative properties of clouds (Facchini et al., 1999; Ervens et al., 2005). WSOA can also generate reactive oxygen species and have an adverse effect on human health (Verma et al., 2015). Therefore, WSOA has been widely characterized worldwide in recent years.
The aerodyne aerosol mass spectrometer (AMS) is one of the most widely used instruments for characterization of WSOA (Decarlo et al., 2006; Huang et al., 2010; Sun et al., 2016) because of its capability of measuring high-resolution mass spectra of OA followed by elemental analysis and positive matrix factorization (PMF) analysis. Y. Sun et al. (2011) performed the first offline-AMS analyses of water-extracted OA in PM2.5 and investigated the sources of WSOA in the southeastern US. The results illustrated the different contributions of biogenic SOA and biomass burning emissions to WSOA in different seasons. Subsequent studies also showed different characteristics of WSOA in different chemical environments. For instance, L. Xu et al. (2017) characterized WSOA and the water solubility by integrating a particle-into-liquid sampler (PILS) and AMS. The results showed that more than 70 % of OA was water-soluble at both urban and rural sites in the southeastern US. The PMF analyses revealed much higher water solubilities of SOA factors than POA factors from traffic, cooking, and biomass burning. In highly polluted regions, e.g., Kanpur, India, Chakraborty et al. (2017) found that WSOA on average accounted for 55 % of OA, and the oxidation level of WSOA ( = 0.73) was high. Ge et al. (2017) characterized the WSOA in Yangtze River Delta, China, in different seasons. The results showed that OA comprised 60.3 % WSOA that was mainly from secondary organic aerosol (68.1 %), while the contributions of primary sources to WSOA were small. In 2019, Qiu et al. (2019) investigated the vertical differences in WSOA in Beijing and found that WSOA showed higher contribution in OA (52 %) and higher in city aloft than at ground level. Also, coal combustion was found to be an important component of WSOA in the heating season in Beijing. In addition to WSOA, several studies also demonstrated the importance of WIOA in OA. For example, Qiu et al. (2019) found that WIOA contributed a larger fraction than WSOA (53 % vs. 47 %) in winter in Beijing, while H. Li et al. (2021) found that WIOA accounted for up to 71 % of the total OA in a polluted urban site, Handan. Recent studies found that WIOA played an important role in brown carbon absorption, and the contributions were even higher than that of WSOA (Huang et al., 2020; Atwi et al., 2022). However, our understanding of the characteristics of WIOA is very limited.
In this work, we characterize WSOA in PM2.5 samples that were collected in Beijing, China, in the cold season from 6 November 2020 to 19 January 2021 mainly using a high-resolution time-of-flight aerosol mass spectrometer (AMS hereafter). The sources, day–night differences, elemental composition, and the roles of WSOA and WIOA in haze formation are elucidated. In particular, we present the first spectral characterization of WIOA by integrating the online and offline AMS measurements, which provides new insights into the sources and composition of WIOA.
2.1 Sampling site and measurements
Filter sampling was conducted on the roof of a two-floor building at the tower branch of the Institute of Atmospheric Physics (39∘58′28′′ N, 116∘22′16′′ E) in Beijing (Fig. S1a in the Supplement) during the cold season using a high volume sampler (TISCH, USA) at a flow rate of 1.1 m3 min−1. The total of 103 day (08:00–18:00) and night (from 18:30 to 07:30 the next day) samples from 6 November to 5 December 2020, and daily samples (from 08:00 to 07:00 the next day) from 6 December 2020 to 19 January 2021) with two additional blank filters were collected during this study. After sampling, the filter samples were stored in a freezer (−20 ∘C) immediately before the analyses. The details on the measurement site and experimental methods can be found in previous studies (Qiu et al., 2019, 2020).
Simultaneously, real-time measurements of non-refractory aerosol species with aerodynamic diameter less than 2.5 µm (NR-PM2.5) including organics (Org), sulfate (SO4), nitrate (NO3), ammonium (NH4), and chloride (Chl) were conducted with a time-of-flight aerosol chemical speciation monitor equipped with a capture vaporizer (CV-ToF-ACSM, Tofwerk), and the operations of CV-ToF-ACSM were described in detail in a previous study (Z. Li et al., 2021). In the middle of this study, i.e., from 6 November to 5 December, non-refractory submicron aerosol (NR-PM1) species were also measured by the AMS. The detailed descriptions of AMS measurements are given in Xu et al. (2022). In addition, the equivalent black carbon (eBC) was synchronously measured using an Aethalometer (AE-33, Magee Scientific Corp.) and gaseous species including NO2, SO2, O3, and CO were obtained from the Olympic Center observation site (http://zx.bjmemc.com.cn, last access: 13 March 2022), which is ∼ 4 km from the sampling site. The meteorological parameters including temperature (T), relative humidity (RH), wind speed (WS), and wind direction (WD) were obtained from the Beijing meteorological tower at the same site.
2.2 Offline analysis
A total of 2–4 punches (diameter: 24 mm) of filter samples depending on OA mass concentrations were extracted with 40 mL deionized water (18.3 MΩ). After being sonicated for 30 min under low-temperature ice-bath conditions, the extracted solutions were filtered with 0.45 µm syringe filters (Anpel, PVDF). An aliquot solution was aerosolized with a constant output atomizer using pure argon (99.999 %) that can reduce the influence of N2 on the separation of organic fragments at 28 (mainly CO+, , and CH2N+) substantially (Bozzetti et al., 2017b). Note that the oxygen-to-carbon () ratios were on average 4 % lower and the hydrogen-to-carbon () ratios were 3 % higher than those determined using the traditional assumptions, i.e., CO+ = (Fig. S4d). The aerosolized particles were dried with a silica gel diffusion dryer followed by a Nafion dryer and then measured by AMS operated in mass-sensitive V mode. After sample analysis, three deionized water samples were analyzed to reduce the background signals.
Another aliquot was analyzed for water-soluble anions and cations (, , , Cl−, F−, , Na+, K+, Mg2+, and Ca2+) using an ion chromatographer (Thermo Scientific, Dionex Aqunion-1100) equipped with IonPac AS11-HC (anion) and IonPac CS12A (cation) chromatographic column systems. The third aliquot was used to measure the WSOC using a total organic carbon () analyzer (Shimadzu, TOC-L). In addition, organic carbon (OC) and elemental carbon (EC) in filter samples were measured using a Sunset analyzer (Sunset Laboratory Inc., Model-4). The detailed descriptions of the analyses of water-soluble ions, WSOC, and are given in Qiu et al. (2019).
Figure S2 shows that most of the water-soluble species correlated well with the online-measured species by the CV-ToF-ACSM. The relatively poor correlation of may be caused by a certain amount of organic sulfate (OS) existing in the atmosphere especially during the episodes with high RH (Chen et al., 2019; Wei et al., 2020), because CV-ToF-ACSM cannot separate OS from sulfate. Despite this, most of the online- and offline-measured sulfate is comparable (Fig. S2h). eBC showed an overall higher concentration than EC, which may be caused by the different measuring methods. The reconstructed PM2.5 (PM2.5_reconstructed = WSOA + WIOA + + + + Cl− + EC + Ca2+ + F− + Na+ + + K+ + Mg2+) showed a tight correlation with PM2.5 measured at the Olympic Center monitoring site (r2 = 0.92, slope = 0.96) and the online-measured PM2.5 (NR-PM2.5 measured by CV-ToF-ACSM plus eBC, r2 = 0.95, slope = 0.95). All these results indicate that the measurements, analyses and quantification of aerosol species in this study are of reasonably high quality.
2.3 AMS data analysis
The AMS data were analyzed with Squirrel 1.62F and PIKA 1.22F written in Igor Pro (http://cires1.colorado.edu/jimenez-group/ToFAMSResources/ToFSoftware/index.html, last access: 13 March 2022). We found that CO+ was highly correlated with (r2 = 0.98, Fig. S3a), and the ratio of CO+ to (0.67) was similar to those (0.65 and 0.72) reported in previous studies (Qiu et al., 2019, 2020). Therefore, the original CO+ values were used for subsequent elemental analysis and PMF analysis. We determined PAHs in the same way as that in Dzepina et al. (2007) and Sun et al. (2016), in which PAHs refer as the sum of PAH-related values (i.e., 115, 128, 152, 165, 178, 189, 202, 215, 226, 239, 252, 276, 300, 326, 350). In the high-resolution mass spectrum analysis, we used the PAH-related fragment ions, i.e., , , , , , and , as surrogates. The organic mass-to-organic carbon (), ), , and nitrogen-to-carbon () ratios were then determined using the improved-ambient (I-A) method (Canagaratna et al., 2015). WSOA was simply determined as × WSOC. Previously, WIOC (= OC − WSOC) was converted to WIOA using a constant ratio of 1.3 (Y. Sun et al., 2011).
In this study, we had a period of collocated real-time online measurements of ambient OA in PM1 by the same AMS. As a result, WIOA can also be determined as the difference between the ambient OA and WSOA. Because of the different size cutoff of online measurements and filter collections, the OA measured by AMS was first scaled to PM2.5 OA using a factor of 1.50 according to the inter-comparisons (Fig. S3b). Therefore, WIOA was determined as WIOA = × 1.5 − WSOA. Similarly, the high-resolution mass spectra (HRMS) of WIOA, for the first time, were obtained as the difference between the average mass-weighted HRMS of ambient OA by multiplying by a factor of 1.5 and those of WSOA measured during the same period of the time. The uncertainty of WIOA was estimated based on the error propagation of the uncertainties of OA and WSOA; the conversion of PM1 to PM2.5; and the artifacts during the sampling, water extraction, and other experiment operations (approximately 10 %). Our analysis showed that the average uncertainty of WIOA was 10.1 %, and the uncertainty can be up to 12.1 % for the data with low concentrations or the data with low fractions of WIOA.
The I-A elemental analysis showed that the average ratio of WIOA was 1.46. The I-A approach was used in field studies mainly due to the underestimation of oxidized organic compounds; however, the high-resolution mass spectra of WIOA showed the dominance of hydrocarbon ion series. We therefore determined the elemental composition of WIOA using the Aiken-ambient (A-A) method and found that the average of WIOA was 1.39. WIOA was then estimated as (OC − WSOC) × 1.4, which was 8 % higher than that from previous studies. Figure S3c shows that WIOA estimated with a constant ratio of 1.4 was highly correlated (r2 = 0.78) with that calculated from the difference between OA and WSOA, and the slope of 0.85 suggested that the WIOA is reasonably well quantified. In addition, the reconstructed OA (= WSOA + WIOA) was highly correlated with the total PM2.5 OA measured by CV-ToF-ACSM (r2 = 0.94, slope = 0.97, Fig. S2c), further supporting the reasonable quantification of WSOA and WIOA in this study.
PMF analysis (Paatero and Tapper, 1994) was performed on the high-resolution mass spectra of WSOA. The values up to 150 and specific polycyclic aromatic hydrocarbon (PAH) fragments (e.g., , , , , and ) were included in the PMF analysis (Ulbrich et al., 2009). The detailed procedures for the data processing and the selection of PMF factors have been given in Zhang et al. (2011). According to the diagnostic plots in Fig. S5, the correlations between OA factors with tracer species (Figs. S6 and S7 in the Supplement), and the comparisons of mass spectra with previously resolved WSOA factors, the five-factor solution at fPeak=0 includes three SOA factors, i.e., OOA1, OOA2 and an oxidized BBOA (oBBOA); two POA factors including a coal combustion and biomass burning OA (CBOA); and a local OA (LOA) factor (Fig. 4). Comparatively, PMF analysis of online measurements of OA resolved three POA factors including a fossil fuel OA (FFOA), a BBOA, and a cooking OA (COA) and two SOA factors, i.e., OOA1 and OOA2 (Xu et al., 2022).
We further estimated primary OC (POC) and secondary OC (SOC) using the EC-tracer method (Turpin and Huntzicker, 1995), in which the lowest ratio of organic carbon to elemental carbon from primary emissions (5.4) was used in this study (Fig. S8). Then, POC was estimated as POC = EC × , and SOC was calculated as the difference between OC and POC, i.e., SOC = OC − POC. It should be noted that the ratio in this study was relatively higher than previous works, which might be due to the relatively higher oxidation process during this campaign. POC was converted to POM using a factor of 1.2 (POM = POC × 1.2, the factor is adopted from the vehicle related POA in Collier et al., 2015), which has also been used in previous studies (Y. Sun et al., 2011; Wang et al., 2016; Qiu et al., 2020), and SOM was estimated as the difference of OA and POM, i.e., SOM = OA − POM.
3.1 General descriptions of WSOA and WIOA
The average (± 1σ) PM2.5 mass loading during the observation period was 32.6 (± 26.0) µg m−3, and the composition was dominated by OA (39 %) and nitrate (27 %). The average mass concentration of WSOA and WIOA was 7.5 (± 5.5) and 5.1 (± 3.8) µg m−3, on average contributing 59 % and 41 %, respectively, to OA. WSOA showed a higher mass fraction in OA compared with previous studies in Beijing (Qiu et al., 2019). One explanation is the continuous increase in SOA in total OA during wintertime in recent years (Lei et al., 2021).
WSOA was well correlated with SOM (r2 = 0.92, Fig. S9a), suggesting that WSOA may be dominantly from secondary formation processes in the atmosphere (Zhang et al., 2018). Further supporting this are the good correlations between WSOC and SOC and between WSOA and SNA (Fig. S9b and c). Comparatively, WIOA was highly correlated with POM (r2 = 0.87, Fig. S9d) and EC (r2 = 0.87, Fig. S9f), and WIOC was highly correlated with POC (r2 = 0.87, Fig. S9e), indicating the major sources of primary emissions for WIOA and WIOC. The slope of 0.90 for WIOA vs. POM indicated that part of POM was water-soluble, which was consistent with the results in a previous study (Qiu et al., 2020).
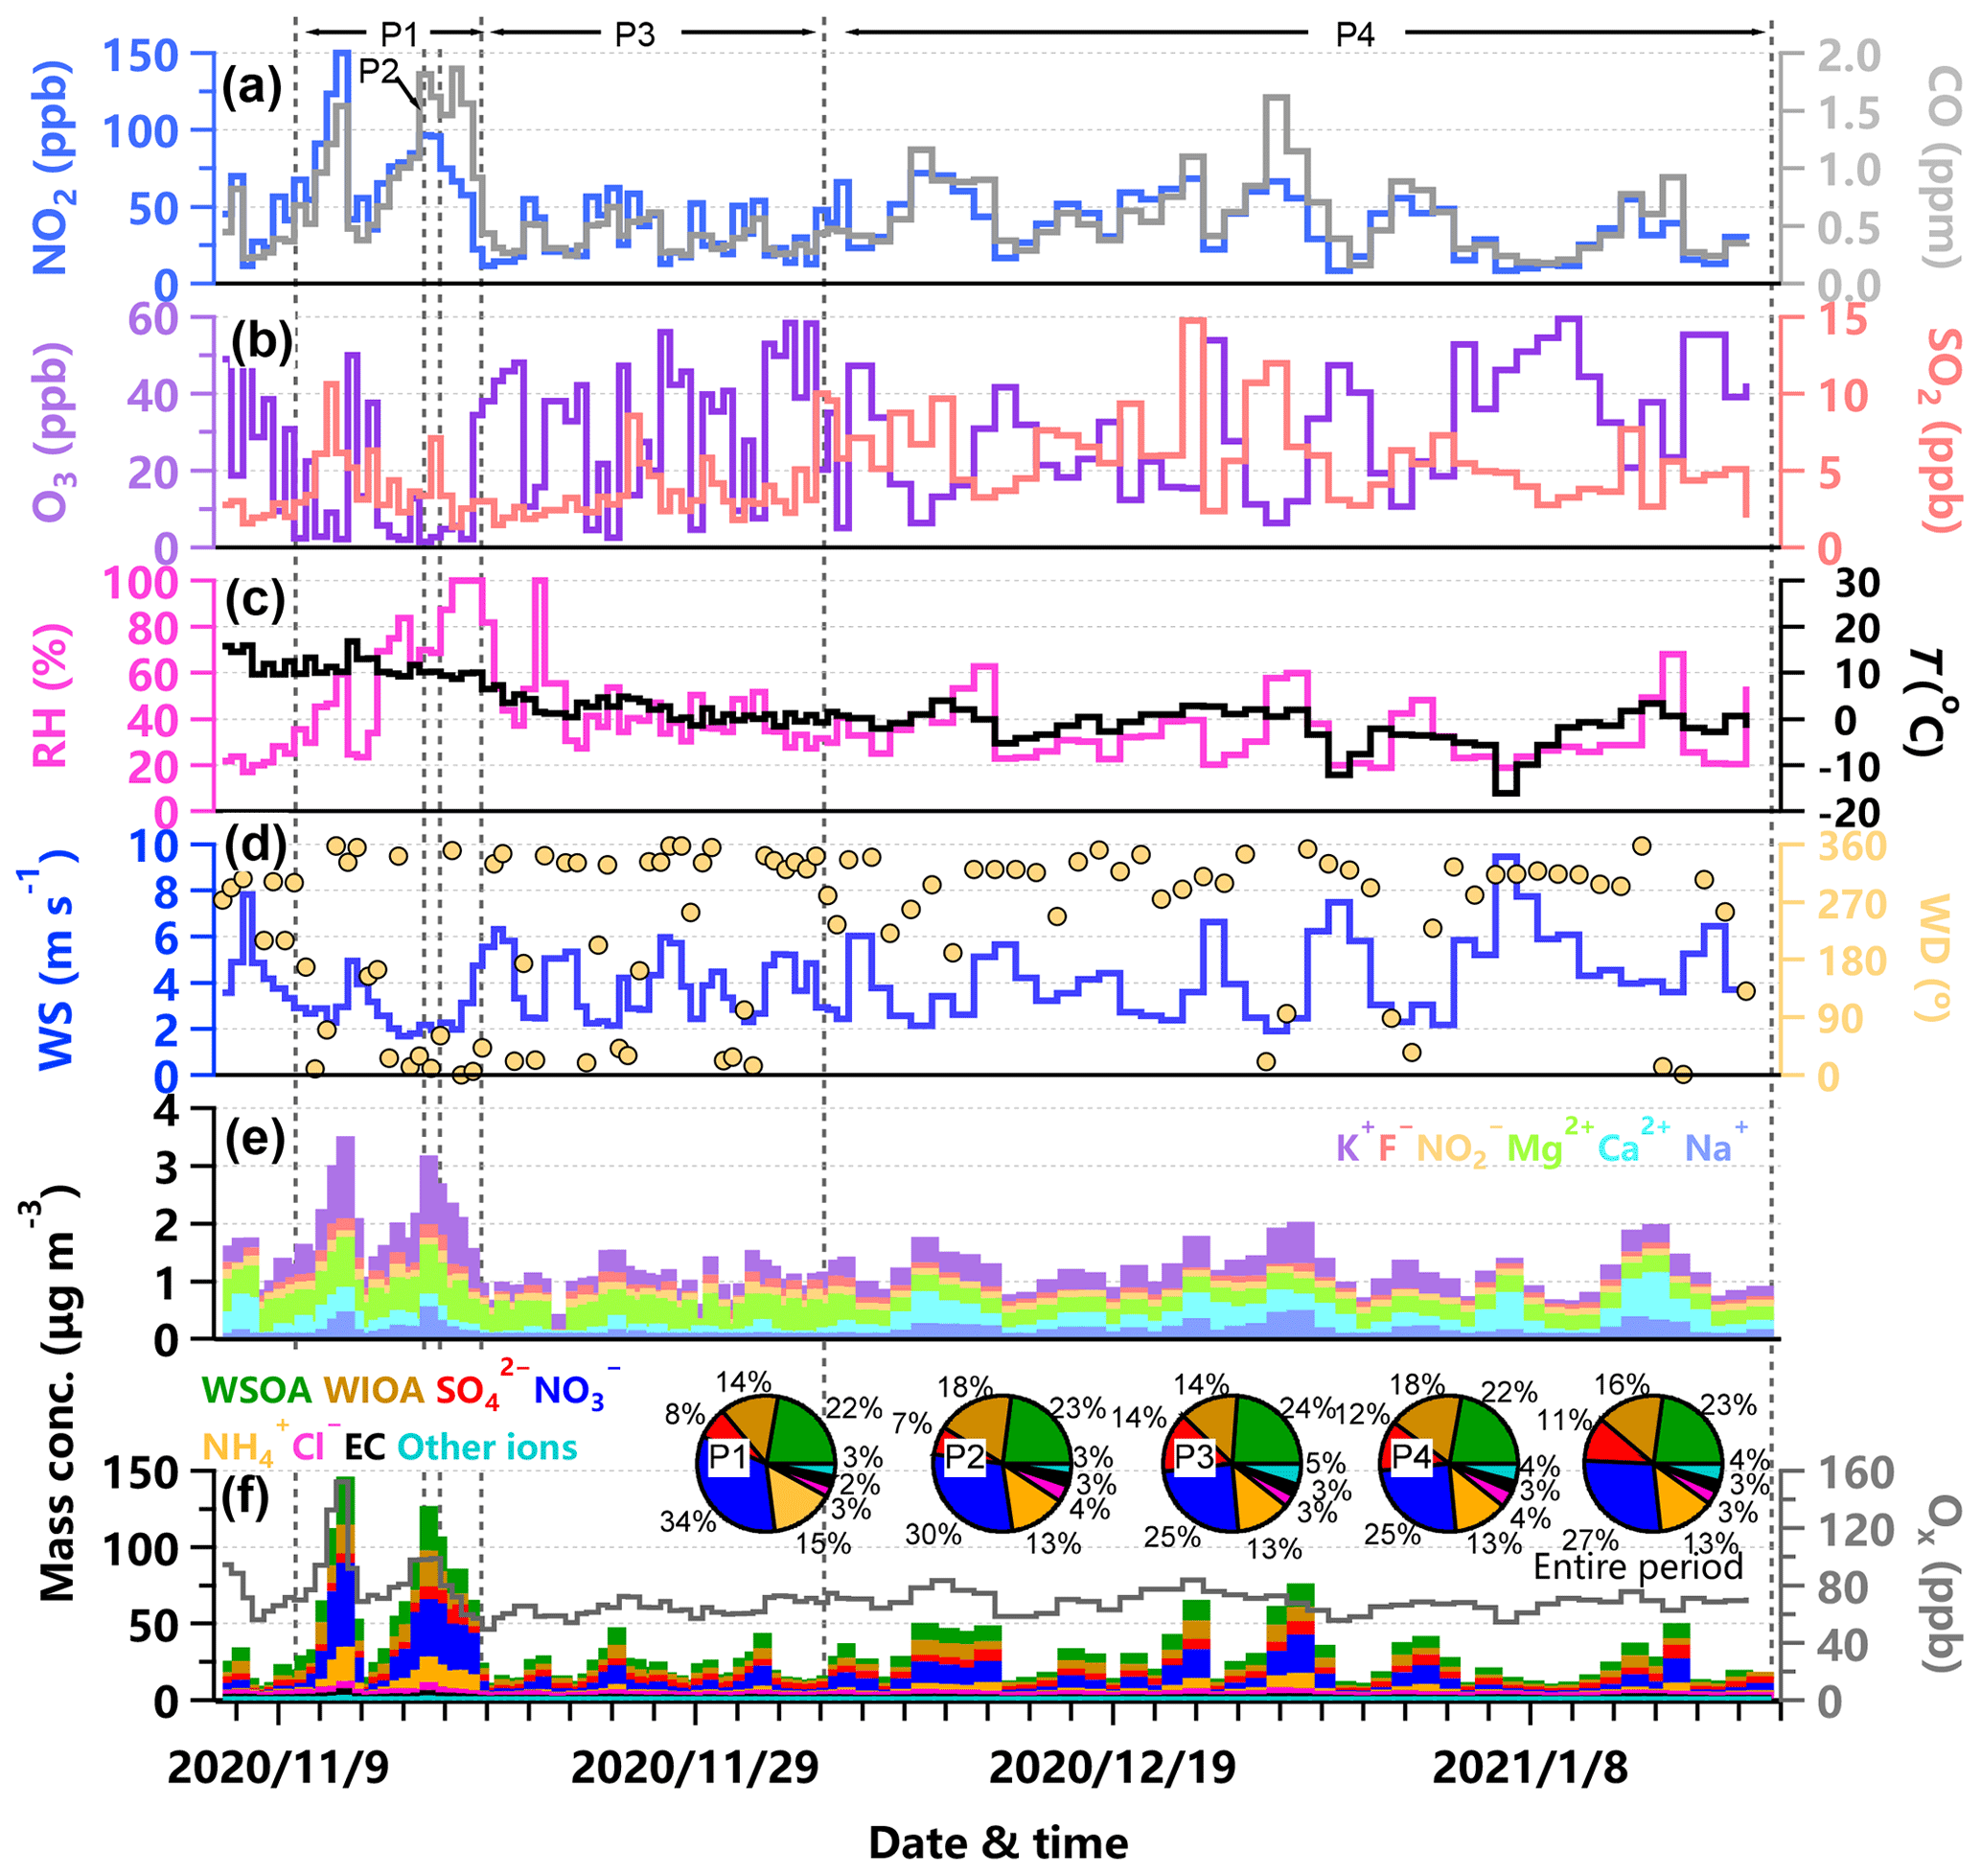
Figure 1Time series of (a) NO2 and CO, (b) O3 and SO2, (c) relative humidity (RH) and temperature (T), (d) wind speed (WS) and wind direction (WD), (e) mass concentration of K+, F−, , Mg2+, Ca2+ and Na+, (f) mass concentration of WSOA, WIOA, , , , Cl−, EC and other ions (sum of K+, F−, , Mg2+, Ca2+ and Na+), also shown in the panel (f) are the offline-measured PM2.5 composition pie charts of the four periods and the entire period.
To better understand the variations in WSOA and WIOA, we classified the entire study into four periods (Fig. 1). The first period (P1) showed high PM2.5 concentration (73.1 ± 37.7 µg m−3) with a dominance of nitrate (34 %) and WSOA (22 %). The second period (P2) occurred at Hanyi festival and showed a large influence of biomass burning (Xu et al., 2022), and the contributions of WIOA and chloride to PM2.5 increased to 18 % and 4 %, respectively. The third period (P3) was relatively clean with an average PM2.5 concentration of 21.9 (± 9.0) µg m−3, and WSOA on average contributed 24 % to the total OA. The last period (P4), with an average PM2.5 of 28.4 (± 16.6) µg m−3, showed comparable contributions of nitrate (25 %) and WSOA (22 %). Although the PM2.5 composition showed significant changes from P1–P2 to P3–P4 as indicated by large decreases in nitrate and increases in sulfate, the contribution of WSOA was relatively stable (22 %–24 %) suggesting that WSOA was consistently important during both non-heating and heating periods.
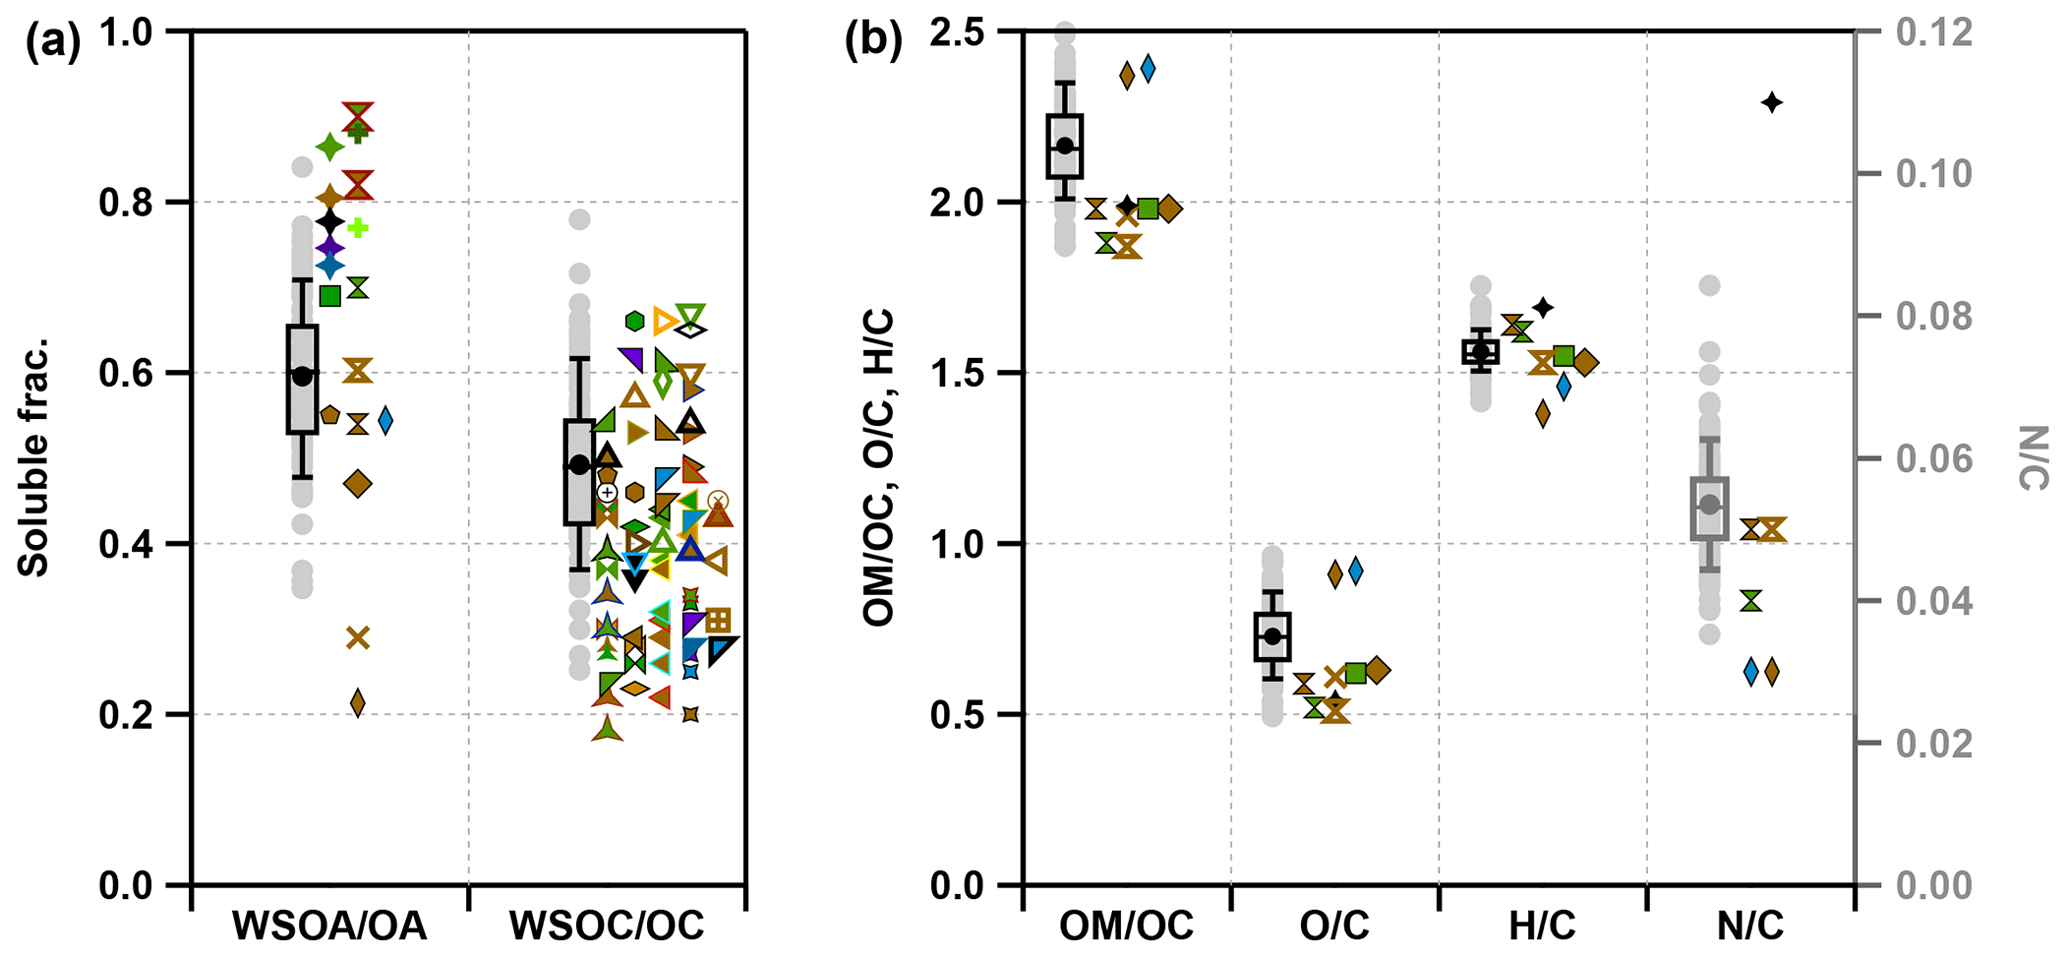
Figure 2Box and whisker plots of (a) the water-soluble fractions of OA () and OC () and (b) , , and ratios (I-A method) of WSOA. The circles represent the mean values, the horizontal lines represent the 50th percentiles, the lower and upper of the boxes represent the 25th and 75th percentiles, and the lower and upper whiskers represent the 10th and 90th percentiles in this study. Colored markers represent data values from previous references: data are in purple in spring, green in summer, blue in autumn, and brown in winter. The data across the year are in black, and the results of different seasons and different sites in the same reference are shown with the different edge colors. The sources of the data are detailed in the Fig. S10.
Figure 2 shows the fractions of WSOA in OA and elemental compositions of WSOA in this study, and a comparison with the data from previous studies. Previous studies found that OA in summer was more water-soluble than in winter at the same site (Feng et al., 2006; Kondo et al., 2007; Y. Sun et al., 2011; Du et al., 2014; Cheng et al., 2014; Xiang et al., 2017; Ye et al., 2017; Qiu et al., 2019, 2020) due to high primary emissions with less oxidation and related PAHs and n-alkanes with low solubility in winter (Capel et al., 1991; Zhang et al., 2008). Indeed, the in the bin of 0.6–0.7 showed a higher frequency in summer than winter (Fig. S11b). However, the statistics of multiple datasets in Fig. S11a showed that WSOC had slightly higher fractions in OC in winter (0.40) than summer (0.36), and ratios fell dominantly within the range of 0.3–0.4 in summer and 0.4–0.5 in winter (Fig. S11b). These results suggest various factors influencing the water solubility of OC in different chemical environments. For example, OA can be relatively water-soluble in winter in an environment with large impacts of biomass burning. In this study, the average ratio of and was 0.60 and 0.49, respectively, which was higher than that ( = 0.47) observed at the same site in winter in 2019 (Qiu et al., 2019) and the North China Plain in winter in 2015 ( = 0.29) (H. Li et al., 2021). The higher water solubility of OA in this study might be the result of the continuous increase in SOA and the decrease in POA in Beijing in recent years. Consistently, the average and were 2.16 and 0.73, respectively, which were also higher than those of WSOA observed previously. We noticed that WSOA in this study also showed a relatively high ratio (0.053), indicating the importance of nitrogen-containing compounds.
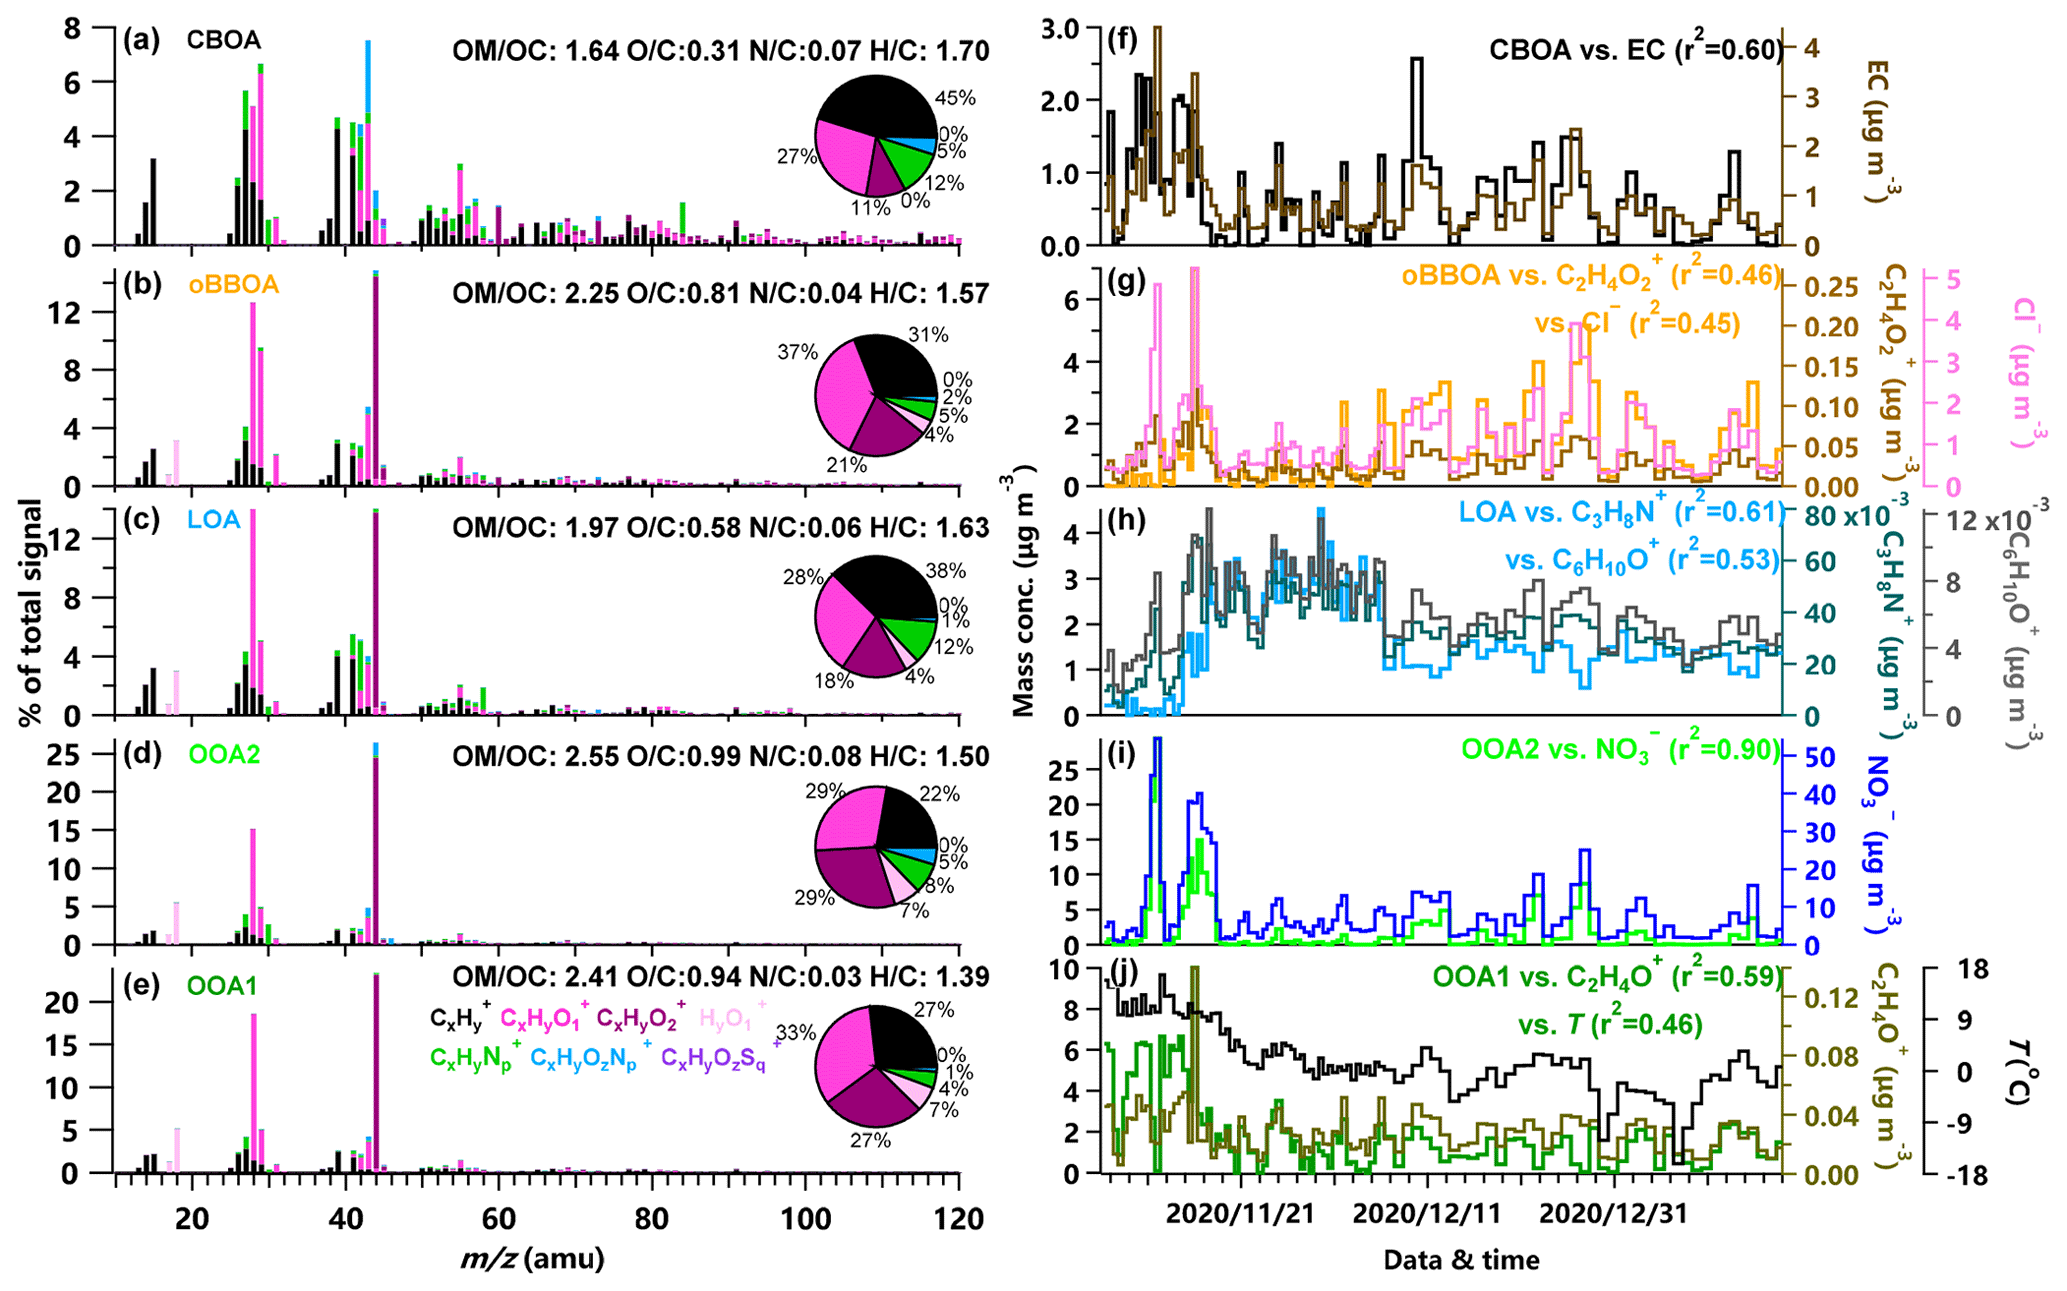
Figure 3(a–e) High-resolution mass spectra of WSOA factors (CBOA, oBBOA, LOA, OOA2, and OOA1) resolved by PMF, (f–j) time series of PMF-resolved WSOA factors, corresponding external tracers, and the correlation coefficients between them. Also shown in panels (a–e) are the elemental ratios of WSOA factors that were calculated with the improved-ambient (I-A) method (Canagaratna et al., 2015) and pie charts of the average ion compositions in each factor.
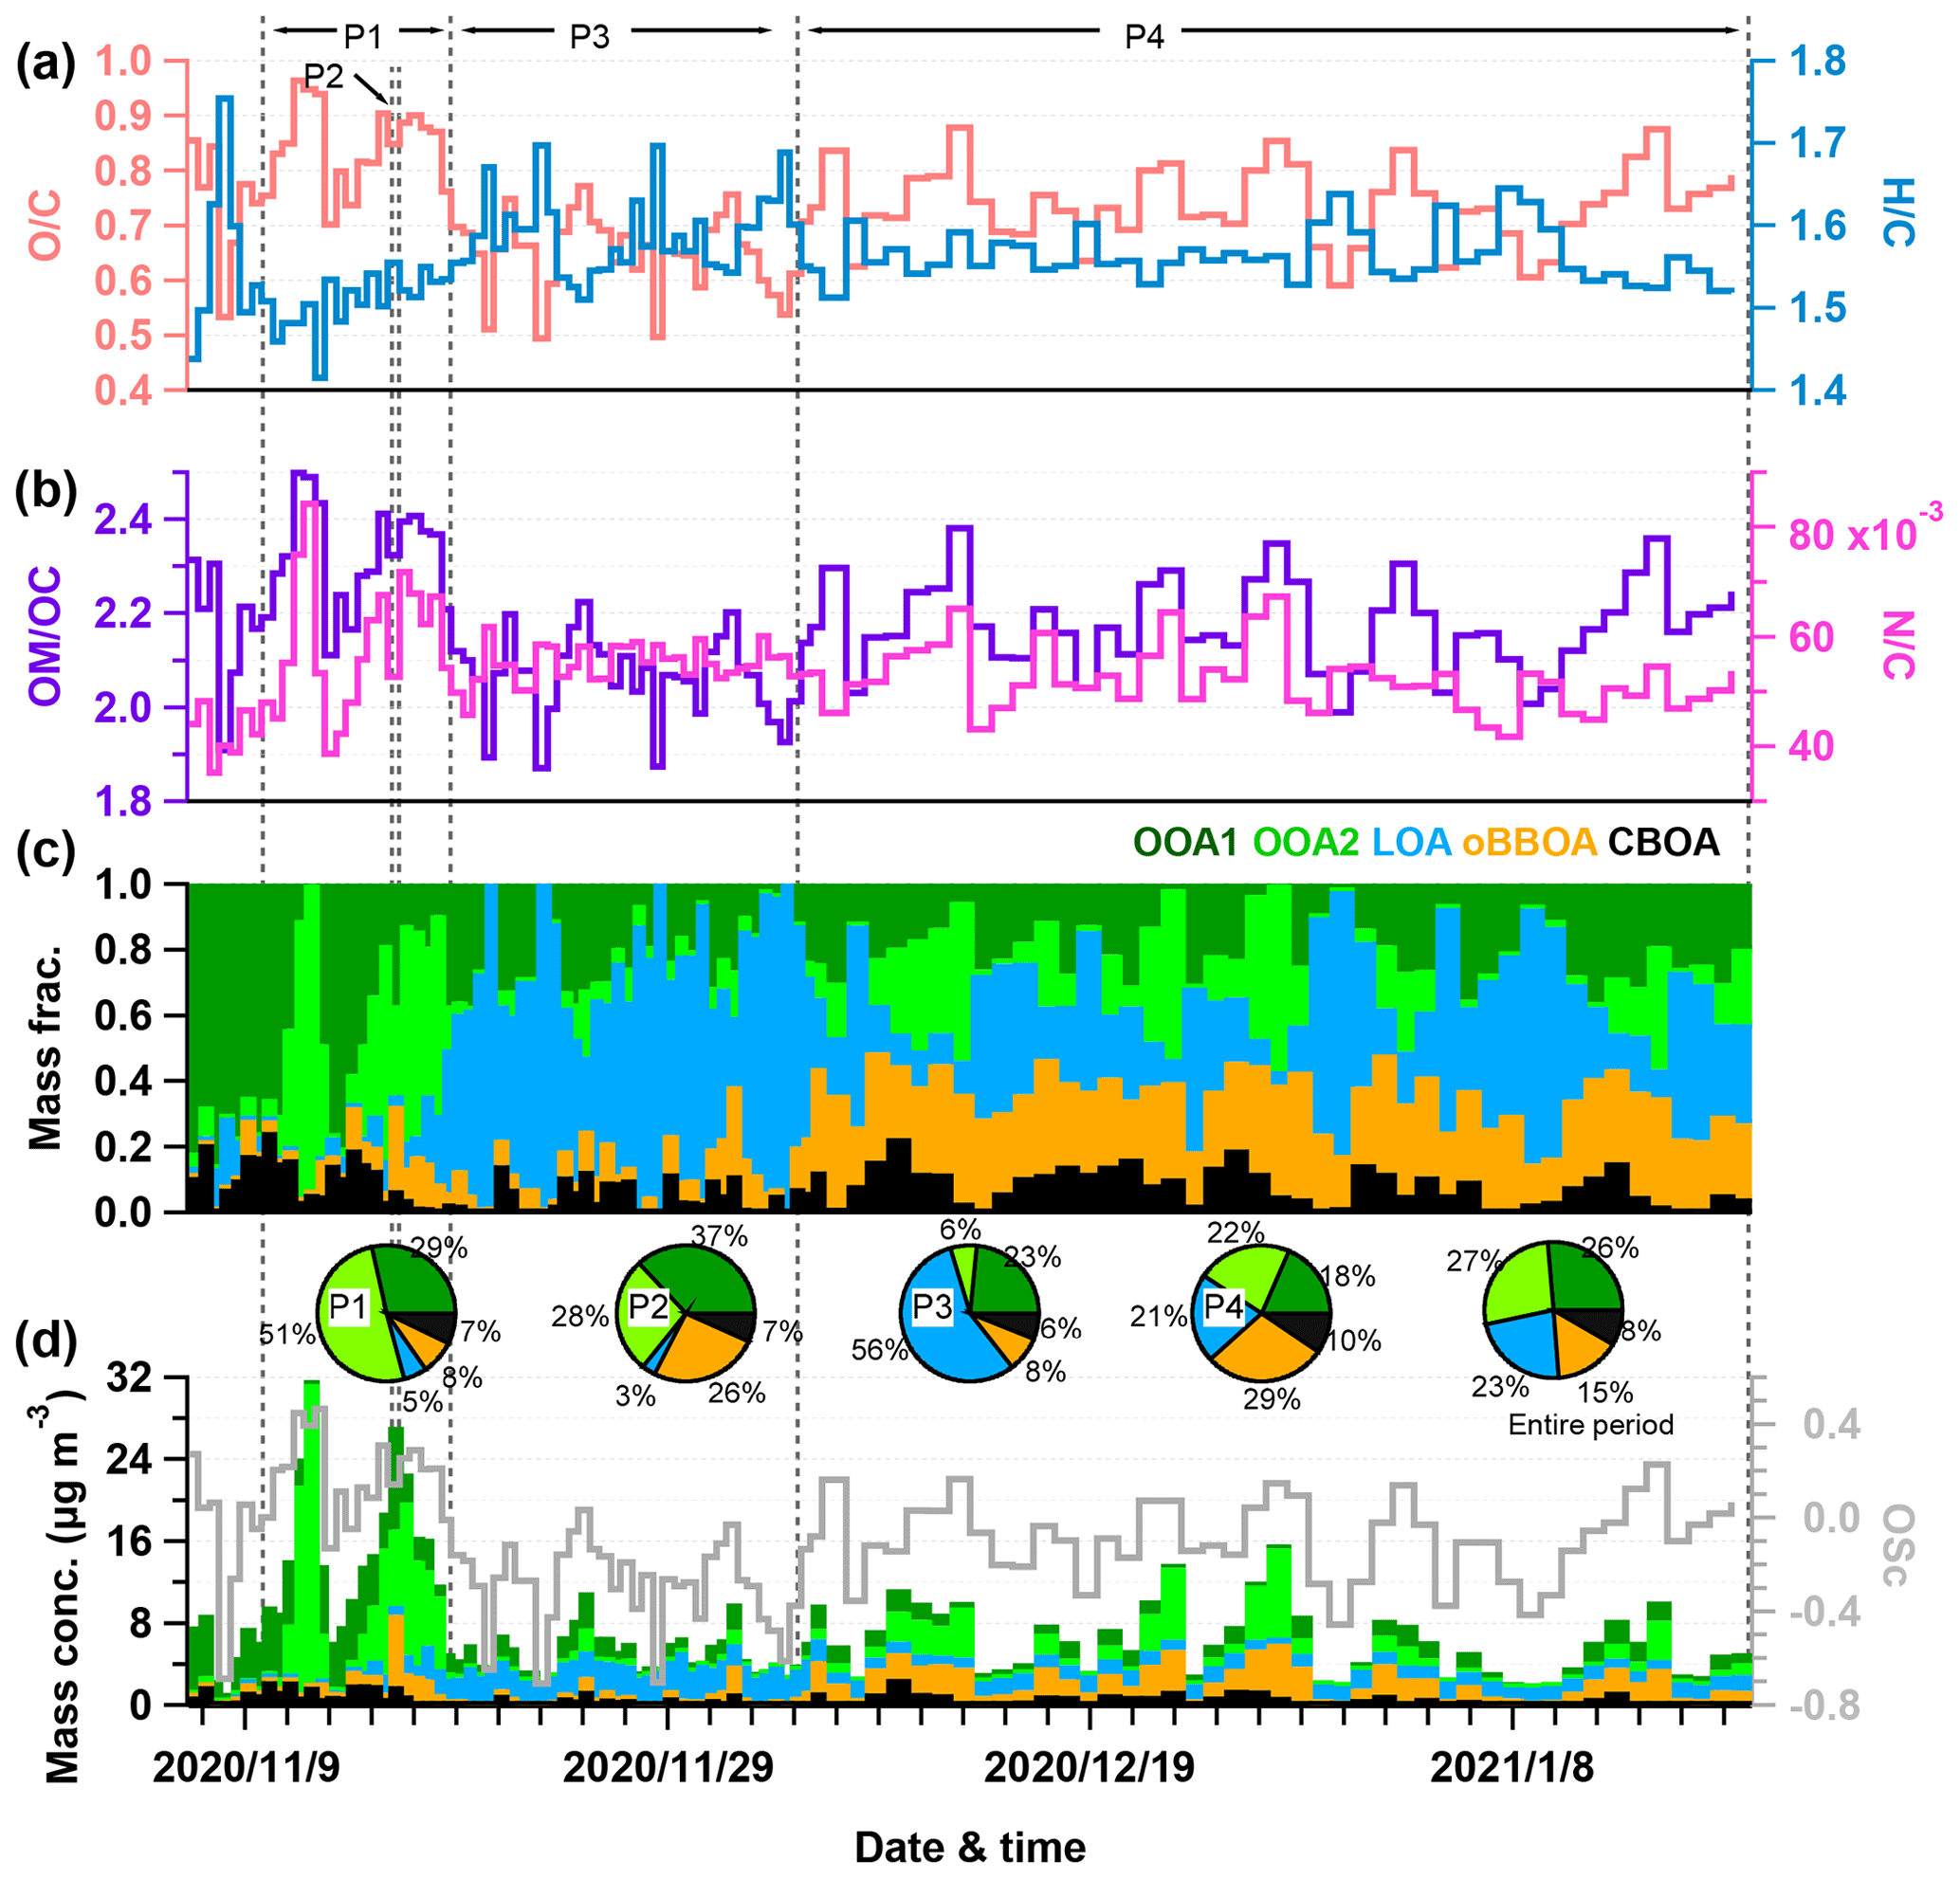
Figure 4Time series of (a, b) elemental ratios of WSOA, (c) mass fractions, (d) mass concentrations of OA factors and oxidation state of WSOA. Also shown in panel (d) are the composition pie charts of the four divided periods and the entire period.
3.2 Sources of WSOA
Figure 3 shows the high-resolution mass spectra and time series of five WSOA factors from PMF analysis. The first OOA1 showed a consistent variation with temperature and was moderately correlated with C2H4O+ ( 44). However, this factor was not correlated with either secondary inorganic species or primary aerosol species. One explanation is that OOA1 was likely from the partitioning of water-soluble organic compounds, the emissions of which depend on temperature. Similar temperature-related trends of OA have also been observed in previous studies (Leaitch et al., 2011; Daellenbach et al., 2016; Bozzetti et al., 2017b). The second OOA2 is similar to the SV-OOA identified in previous studies (Decarlo et al., 2010; Zhao et al., 2019) and showed a good correlation with that was found dominantly from photochemical processing in winter (Y. L. Sun et al., 2013; Chen et al., 2020). The higher concentration of nitrate during daytime than nighttime further supported the dominant formation of nitrate from photochemical production. Moreover, OOA2 correlated moderately well with hydrocarbon ions and PAH-related ions, suggesting that OOA2 is very likely a factor from photochemical processing of anthropogenic VOCs. Although both OOA1 and OOA2 were characterized by high ( 44), OOA2 showed a slightly higher ratio (0.99 vs. 0.94) and very different CO+/ ratio (0.56 vs. 0.75). This result indicated that the composition of OOA1 and OOA2 could be very different. LOA is well correlated with the tracer ion of COA (C6H10O+) (Y.-L. Sun et al., 2011) and specific nitrogen-containing ions (e.g., C3H8N+ and C2H4N+) (Aiken et al., 2009; Y.-L. Sun et al., 2011; Ye et al., 2017) indicating that this factor is mainly from local emissions. We noticed that the temporal variations of LOA were relatively small throughout the study, consistent with the relatively stable cooking emissions in Beijing. This result further supported that the LOA factor could be dominantly from local cooking emissions. The high (2.37) of LOA as shown in the triangle plot of f55 versus f57 in Fig. 7b also supported that the LOA factor was likely from local cooking emissions. The oxidized BBOA (oBBOA) showed good correlations with chloride, and the two marker ions of biomass burning, i.e., and (Chhabra et al., 2010; Sun et al., 2016). Considering that oBBOA showed a large increase during the biomass burning event on 15 November 2020 and the small signals of in the spectrum, this factor likely represented a SOA factor from oxidation of biomass burning emissions. Compared with previous studies, we were unable to distinguish water-soluble coal combustion and biomass burning OA. Indeed, the CBOA factor in Fig. 3 was well correlated with EC and PAHs (Figs. S6 and S7), and the mass spectrum was characterized by high value of f60 indicating that it is a mixed factor from coal combustion and biomass burning. The low ratio (0.31) and high content of ions (45 % of total WSOA composition) further supported the primary characteristics of this factor.
SOA (= OOA1 + OOA2 + oBBOA) is the dominant contributor of WSOA (69 %), and LOA is the dominant water-soluble POA on average accounting for 23 %. Although WSOA and WIOA showed relatively stable contributions throughout the study, the WSOA composition showed substantial changes among different periods. As shown in Fig. 4, the photochemical-related OOA2 constituted the majority of WSOA (51 %) during P1, and the oxidized BBOA showed a large increase from 8 % to 26 % during the biomass burning period P2. Comparatively, water-soluble POA showed large increases during the heating season, particularly during the relatively clean P3. LOA accounted for more than half of WSOA (56 %) during P3. This is consistent with previous studies showing much higher contributions of COA during cleaner periods in Beijing (Y. L. Sun et al., 2013). Although the coal combustion and biomass burning-related water-soluble CBOA showed an increase from 6 %–7 % to 10 %, we found that the largest increase in WSOA during the heating season was oBBOA. This result suggested that the considerable fraction of oBBOA in Beijing was likely from regional transport rather than local source emissions.
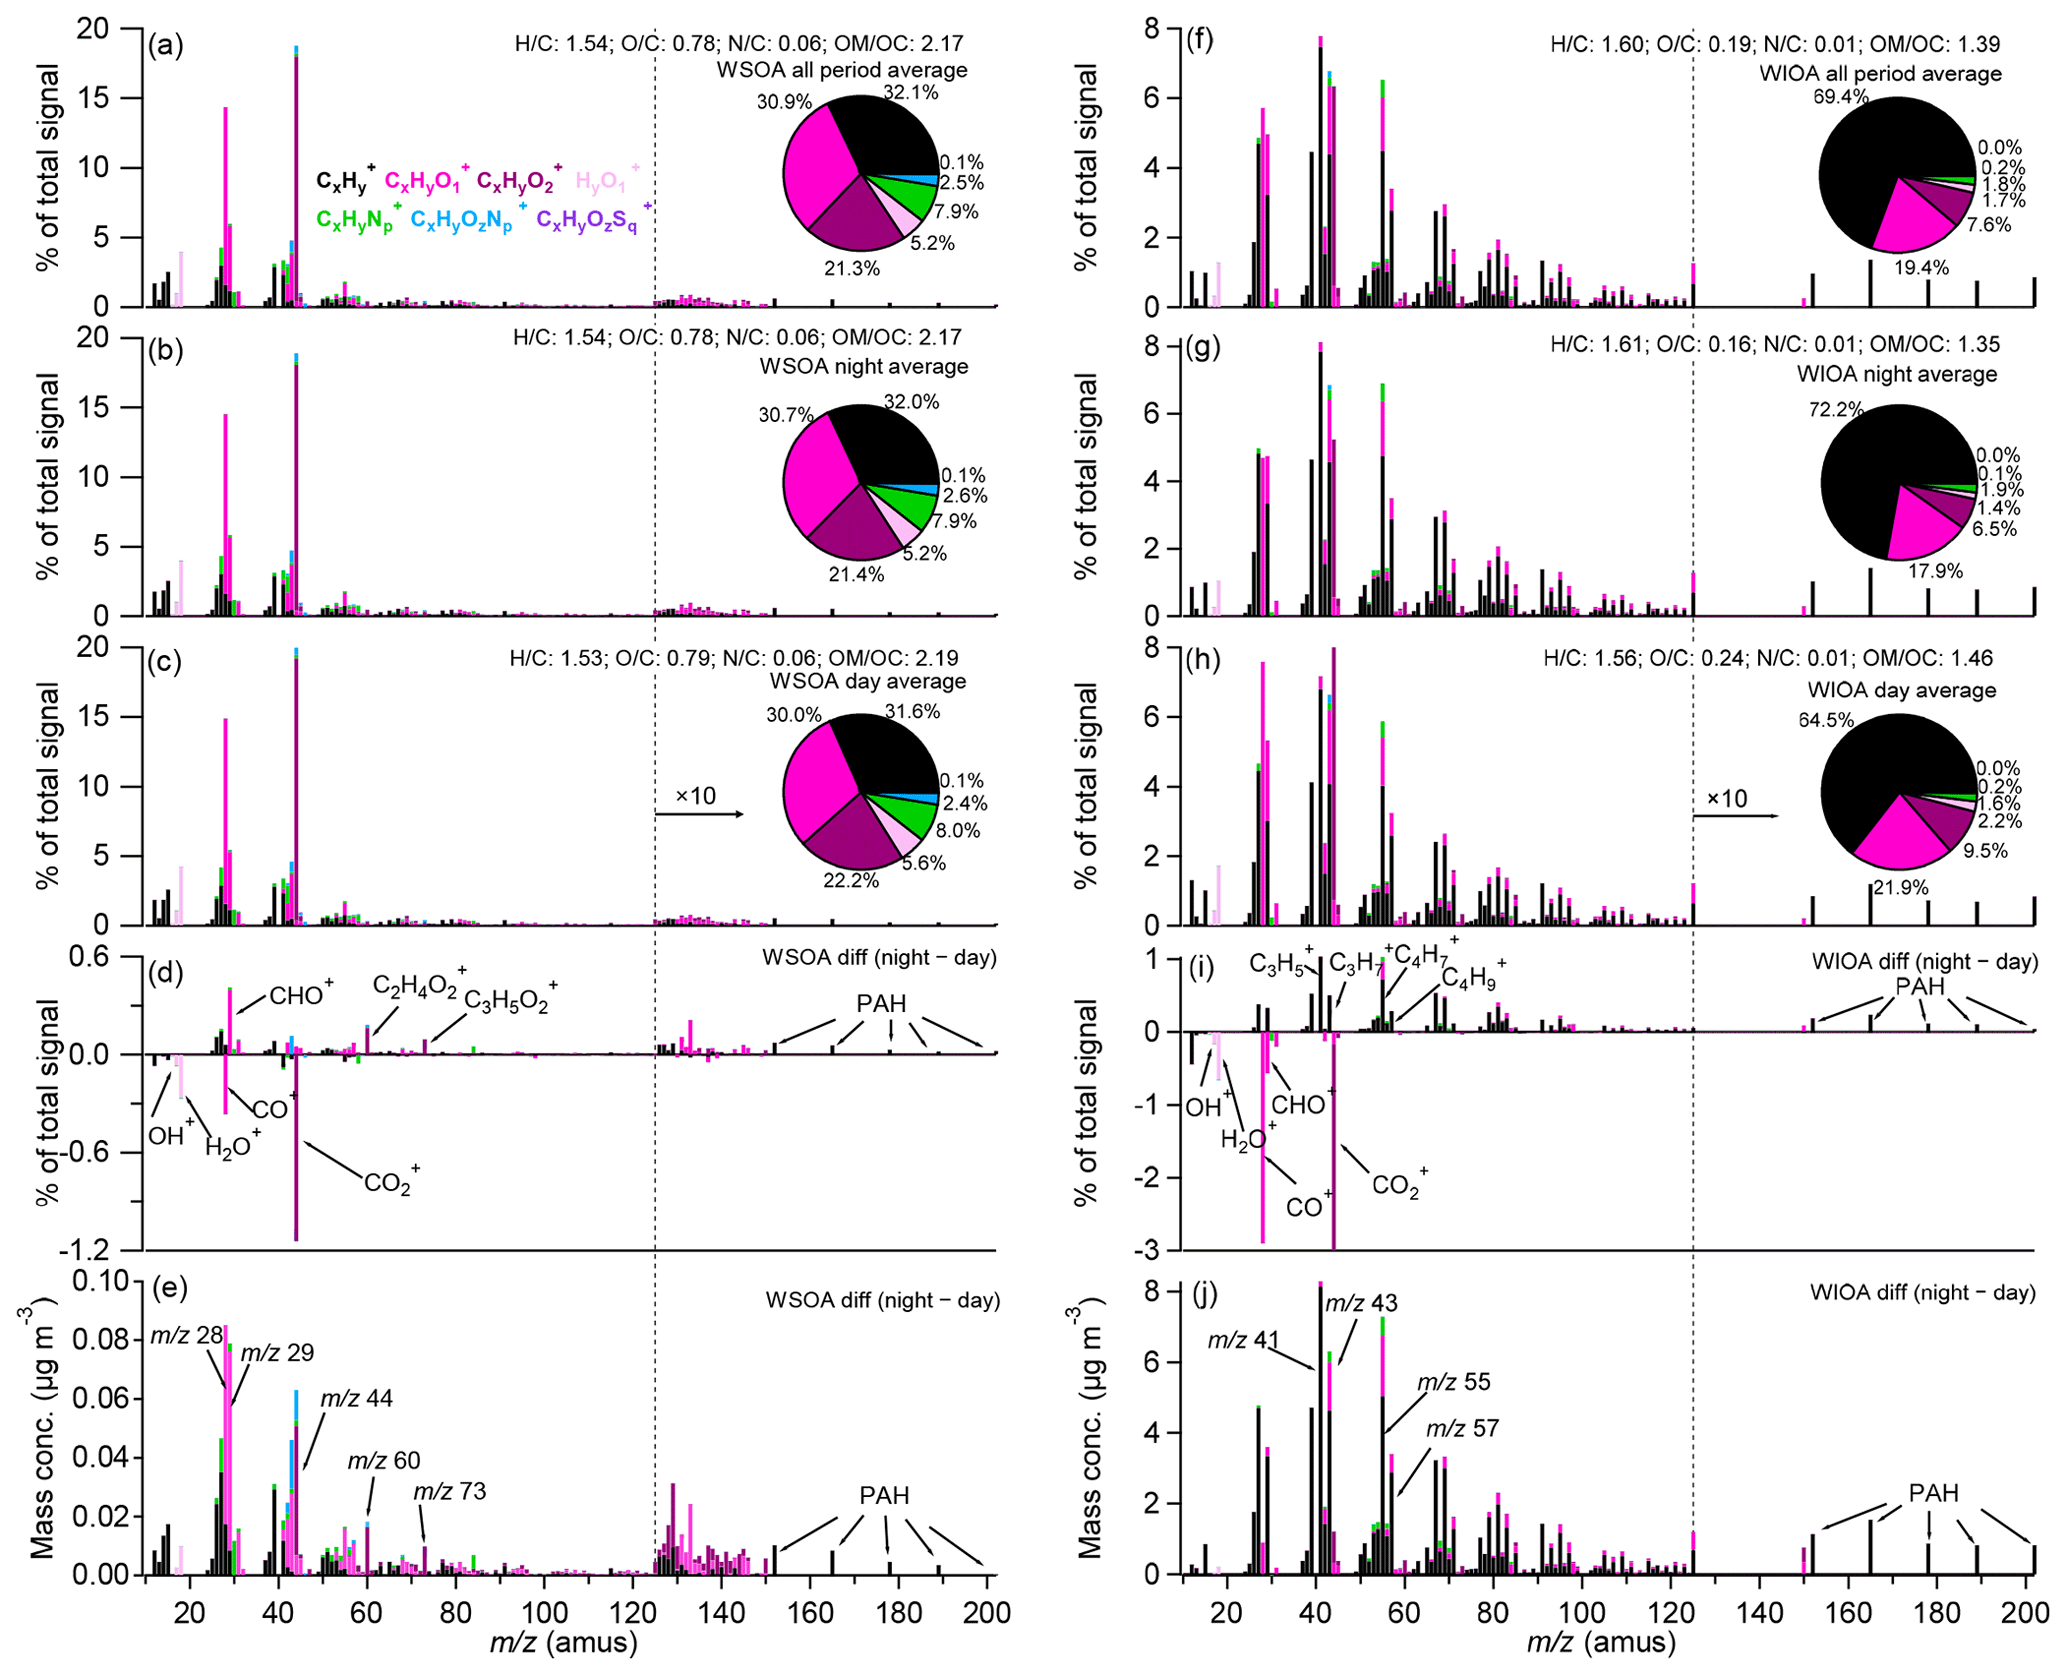
Figure 5Mass spectra of (a, f) all-period, (b, g) night, (c, h) day, and (d, i) night-day differences of signal fraction and (e, j) night-day differences of mass concentration of WSOA and WIOA, respectively, also shown in (a–c) and (f–h) are the ions fraction pie charts of WSOA and WIOA, respectively, note that the value of the mass spectra with s larger than 125 are multiplied by 10 for more intuitive display.

Figure 6Composition of online-measured species (WSOA_day + WSOA_night + WIOA_day + WIOA_night) of (a) PAH, (b) , (c) , (d) , (e) CHO+, and (f) . The shading areas indicate the fraction in the night, while the solid areas indicate the fraction in the day, and the green parts indicate WSOA, while the brown parts indicate WIOA.
3.3 Mass spectral characterization of WIOA
Figure 5 presents the average mass spectra of WIOA for the entire period, daytime and nighttime, and a comparison with those of WSOA. While the WSOA spectra were characterized by high 44 (mainly ) and (∼ 0.8), and high contents of oxygenated ions of and (21.3 % and 30.9 %), the mass spectra of WIOA resembled previously resolved primary OAs, e.g., HOA and COA, which are characterized by prominent peaks at 41, 43, 55, and 57. The average and ratios of WIOA were 0.19 and 0.01, respectively, which are much lower than those of WSOA. Comparatively, the content of in WIOA increased significantly up to 69.4 %. Therefore, WSOA and WIOA showed largely different composition. While WSOA comprised more oxygenated organic compounds and N-containing species, WIOA was more contributed by hydrophobic compounds with low oxygen and nitrogen contents (Saxena and Hildemann, 1996).
We further compared the mass spectral difference of WIOA between day and night. As shown in Fig. 5, the WIOA spectrum during daytime showed higher 44 and (0.24 vs. 0.16) than that at nighttime, suggesting that WIOA was more oxidized during daytime. Indeed, the spectral difference of night and day showed ubiquitously higher and ions at night, while CO+, CHO+, and dominate during daytime (Fig. 5i). In addition, the bigger presence of alkyl fragments at night could also be due to repartitioning for lower temperature at night. The concentration difference (Fig. 5j) further illustrated the greater impacts of primary emissions, e.g., traffic and coal combustion at night, which was supported by the similar spectrum to previously resolved HOA and pronounced PAHs signals (, , , , , and ). The concentration difference between night and day showed typical characteristics of BBOA with pronounced 60 and 73 (Fig. 5e), indicating that BBOA exerted more impacts on WSOA at nighttime.
The water-soluble and water-insoluble fractions of several specific ions are shown in Figs. 6 and S12. While and were dominantly contributed by WIOA, the oxygenated ions of CHO+ and showed much higher contributions from WSOA. This result is consistent with our conclusion that WSOA contained more oxygenated compounds while WIOA comprised mainly compounds with carbon and hydrogen. Comparatively, the biomass burning marker ion showed higher contributions in WSOA than WIOA suggesting the water-soluble properties of BBOA. We noticed that PAHs showed comparable contributions in WSOA and WIOA during daytime, and higher contributions in WIOA at nighttime. This result suggested the different sources of PAHs between daytime and nighttime. The PAH-related compounds during daytime had higher water solubility likely due to the aging process during the transport, while the locally dominant PAHs at nighttime were characterized by higher water-insoluble fractions.

Figure 7Triangle plots of (a) f44 vs. f43; the dash reference lines are adopted from Ng et al. (2010). (b) f55 vs. f57; the dashed and solid reference lines are adopted from Mohr et al. (2012). (c) f44 vs. f60; the dashed background level line and dashed reference lines are adopted from Cubison et al. (2011). (d) Van Krevelen diagram; the reference lines are adopted from Heald et al. (2010). The data results in the figures contain WSOA (colored squares), online OA (solid grey circles) and WIOA (pink triangles), and the open circles are the source experiment results adopted from Xu et al. (2020). Note that the contributions of water-soluble OOA factors (OOA1 and OOA2) to f55 and f57 in panel (b) were subtracted.
3.4 Evolution of WSOA and WIOA
The triangle plot of f44 vs. f43 (or vs. in Fig. S13a) has been widely used in previous studies to describe the OA evolution process (Ng et al., 2010). As demonstrated in Fig. 7a, WSOA, online OA, and WIOA fell within the different regions in the f44 vs. f43 plot. WIOA showed relatively lower f44 and higher f43 than online OA and WSOA, yet was characterized by an evolutionary trend from the bottom-left to the top-left corner. Comparatively, WSOA was mainly located at the top-left corner of the plot with high f44. It should be noted that as f44 increased from ∼ 0.1 to 0.25, f43 of WSOA remained relatively stable indicating the different evolutionary mechanism of WSOA from previous ambient OA.
The V-shape plot of f55 vs. f57 (or vs. in Fig. S13b) can be used as a diagnostic for the presence of COA and HOA (Mohr et al., 2012). COA was generally characterized by high f55 and the ratio of (Mohr et al., 2012; Zhao et al., 2019). As shown in Fig. 7b, WSOA, especially water-soluble SOA factors (OOA1 and OOA2) showed relatively small values of both f55 and f57 and thus fell within the bottom-left region of the plot, indicating that COA was unlikely an important contributor of WSOA. Comparatively, WIOA located at the top-right region showed relatively high f55 and f57, and the ratio of (1.82) was slightly lower than that of LOA (2.37) and those (∼ 2) from previously resolved COA factors. This result indicated that COA could be an important component of WIOA.
f44 vs. f60 (or vs. in Fig. S13c) was commonly used to investigate the aging process of BBOA in the atmosphere (Cubison et al., 2011). BBOA typically evolves from the bottom-right region with low f44 and high f60 (e.g., fresh BBOA from straw burning and wood combustion in Fig. 7c) to the top-left region with high f44 and low f60 (e.g., LV-OOA and SV-OOA with a smaller signature of biomass burning). However, we found that the f60 of most WSOA and WIOA was close to that of the background value (f60 = ∼ 0.3 %) in the absence of biomass burning. This result suggested that fresh biomass burning was not an important source of OA in this study. In contrast, the biomass burning event and the factor of water-soluble CBOA showed relatively high f60 with different f44, indicating that biomass burning was important during specific events or periods.
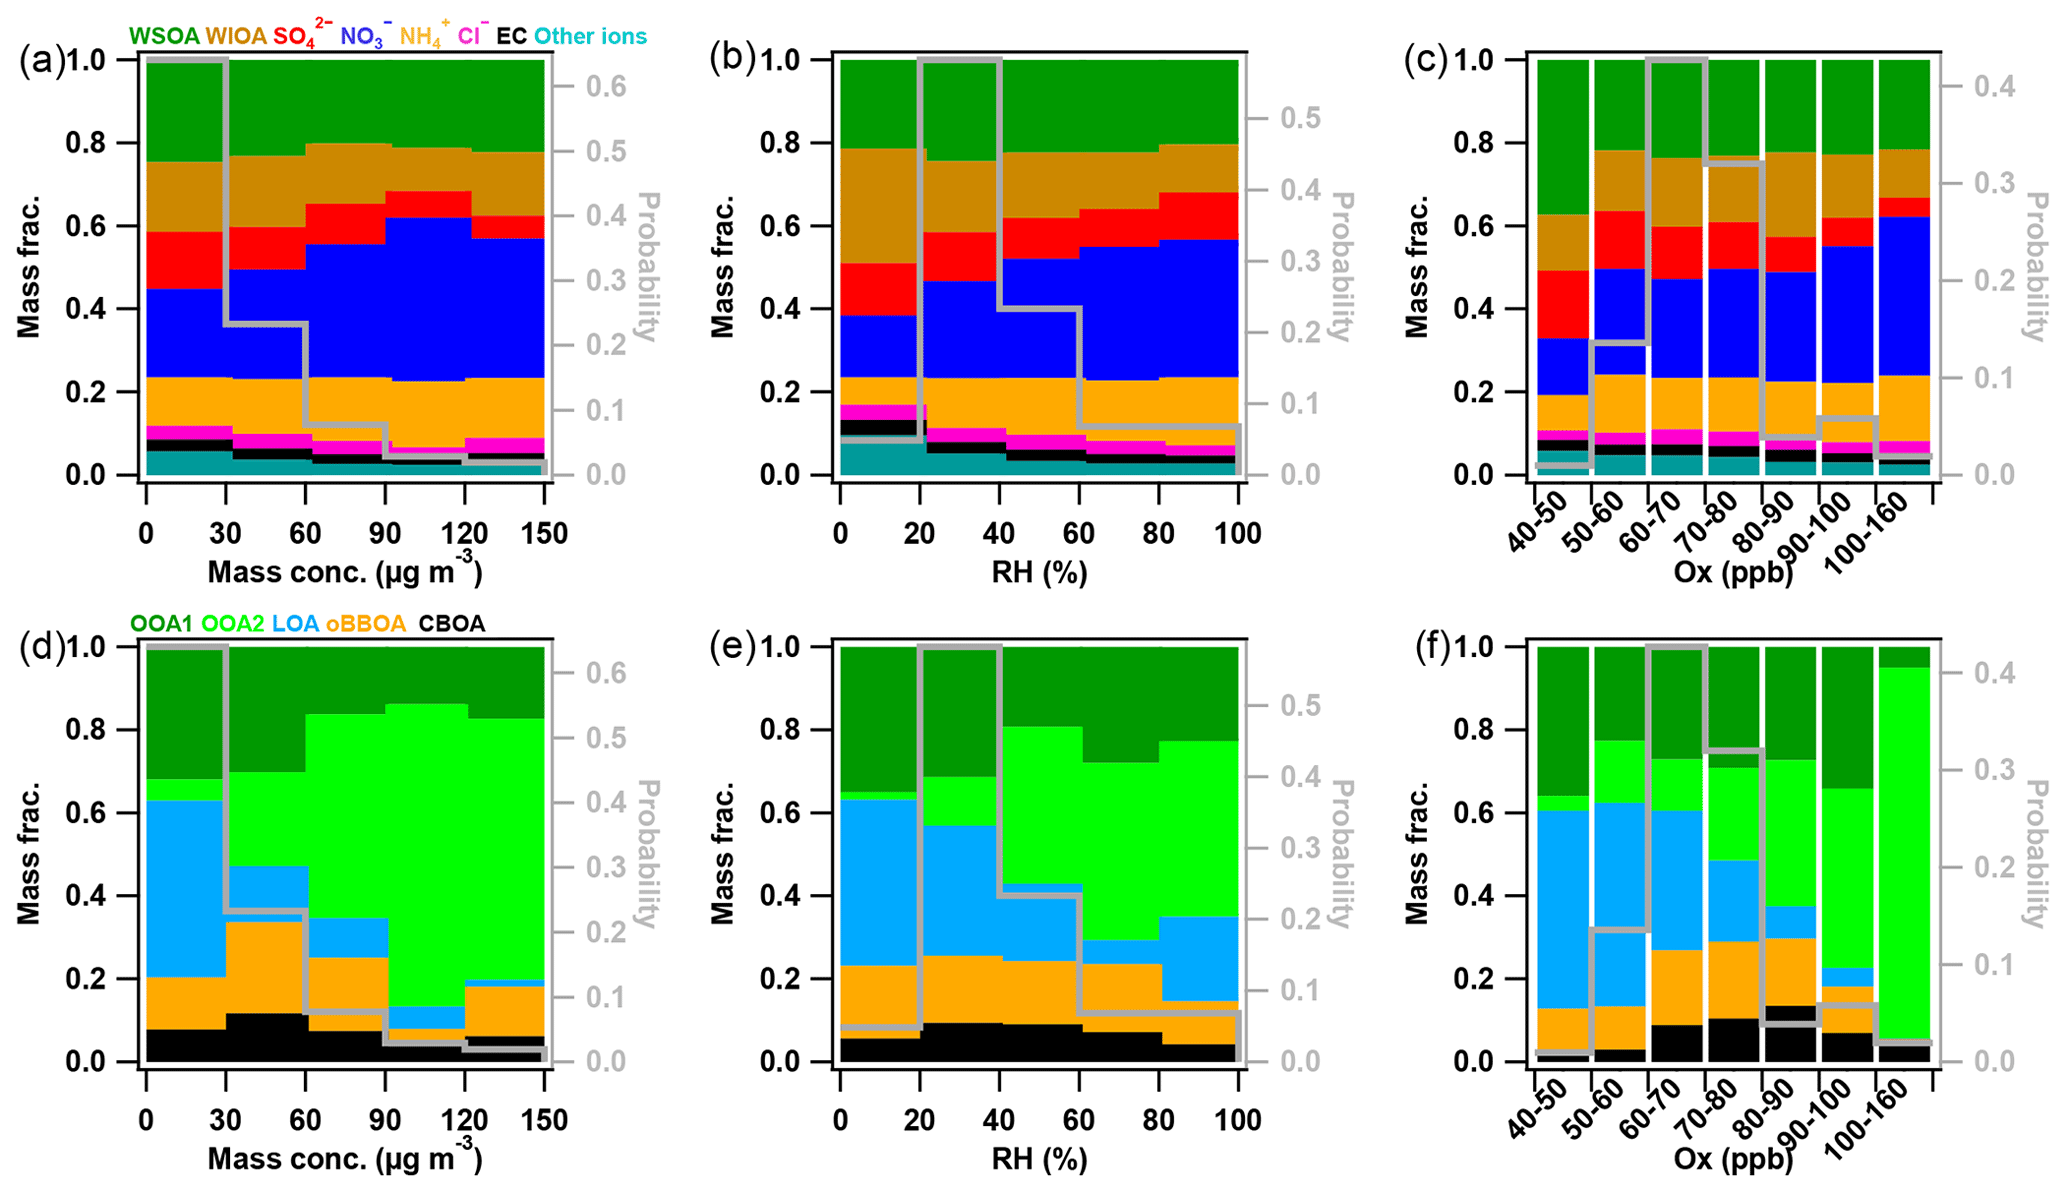
Figure 8Mass fractions variations of aerosol species in PM2.5 as well as OA factors in WSOA as a function of (a, d) mass concentration, (b, e) RH, and (c, f) Ox.
The evolution processes of WSOA and WIOA are further demonstrated by a Van Krevelen diagram ( vs. ) (Heald et al., 2010). As shown in Fig. 7d, WIOA is located in the top-left corner with overall high and low and evolves towards the bottom-right region. Comparatively, WSOA located in the middle of Van Krevelen diagram evolves similarly to WIOA, yet with different slopes (−0.42 vs. −0.74). This result indicated the different evolutionary mechanism of WIOA and WSOA. For example, the WIOA is mostly outside the region defined by Ng et al. (2011), and the steeper slope suggested the importance of initial heterogeneous oxidation, followed by the addition of carbonyl group evolving along with a shallower slope in the diagram (Ng et al., 2011). Comparatively, the shallow slope of WSOA might indicate that fragmentation of carboxylic acid might be a more important evolution pathway.
3.5 Chemically resolved PM pollution
Figure 8 shows the variations of PM2.5 and WSOA composition as a function of PM2.5 mass loadings, RH, and Ox. Nitrate and OOA2 showed the most prominent increases as the increase in PM2.5 mass loadings, indicating the importance of photochemical processing during the campaign, while other species showed corresponding decreases. In particular, the contribution of OOA2 to WSOA increased from 23 % to 63 % as PM2.5 increased from 30–60 to 120–150 µg m−3, highlighting the significance of OOA2 in WSOA. Comparatively, LOA played the most important role in WSOA during the clean period (0–30 µg m−3). Note that OA and chloride showed considerable increases during the severely polluted period (120–150 µg m−3) due to the impact of biomass burning events, which is also supported by a corresponding increase in oBBOA in WSOA.
Similar to previous studies (Y. Sun et al., 2013; W. Xu et al., 2017; Wu et al., 2018; Z. Li et al., 2021), nearly all species increased with the increase in RH when RH < 80 %. One explanation is high RH was generally associated with stagnant meteorological conditions leading to the accumulation of pollutants, and enhanced aqueous-phase reactions. However, we found that the photochemical-related OOA2 showed the most significant increase in WSOA as a function of RH. Figure 1 shows that overall the RH was low throughout the study particularly during the P3–P4 periods (RH < 60 % for most of the time), and the high RH (> 80 %) occurred dominantly during the severe haze episode on 16–18 November. Therefore, the RH dependence of PM2.5 and aerosol composition further highlighted the important role of photochemical reactions in the formation of severe haze pollution. Another supporting factor is the changes in PM2.5 species and WSOA factors as a function of Ox (O3 + NO2) levels. Although nearly all species showed increases with the increase in Ox, the increases in nitrate and OOA2 in PM2.5 and WSOA were the most significant, and the nitrogen oxidation ratio (NOR) also increased along with Ox (Fig. S14), further demonstrating the importance of photochemical processing in this study.
We present a comprehensive characterization of WSOA and WIOA in PM2.5 during the transition season from autumn to winter in urban Beijing by combining offline analysis and real-time online measurements. Our results showed that WSOA (59 %) accounted for a larger fraction than WIOA (41 %) in OA and comprised mainly secondary OA (69 %). The WSOA composition showed significant changes from autumn to winter. While SOA (88 %), especially OOA2 (51 %) dominated WSOA in early November, the oxidized SOA from biomass burning increased substantially from 8 % to 29 % during the heating season. Comparatively, POA (62 %), especially LOA (56 %), dominantly from cooking aerosol accounted for the major portion of WSOA during the clean period. The characteristics of WIOA were analyzed, for the first time, by integrating online and offline AMS measurements. The mass spectra of WIOA showed prominent hydrocarbon ion series with low (0.19) and (1.39). Also, the WIOA showed a higher contribution of (69.4 % vs. 32.1 %) and lower contributions of (7.6 % vs. 21.3 %), and (19.4 % vs. 30.9 %) than WSOA. The nighttime WIOA showed less oxidized properties ( = 0.16 vs. 0.24) with more pronounced PAH signals than daytime, indicating the impacts of enhanced coal combustion emissions on WIOA. Further analysis showed increased water solubility of OA compared with previous studies likely due to the increased oxidation process since the clean air action in 2013. Overall, the results in this study improved our understanding of the sources and processes of water-soluble and water-insoluble organic aerosol during the transition season from autumn to winter in Beijing and are also helpful to serve as constraints to investigate the impacts of OA on cloud condensation nuclei and radiative forcing.
The data in this study are available from the authors upon request (sunyele@mail.iap.ac.cn).
The supplement related to this article is available online at: https://doi.org/10.5194/acp-22-10409-2022-supplement.
YS designed the research. ZZ, CC, BY, AD, WX, and YL conducted the measurements and experiments. ZZ and YS analyzed the data. ZL, LL, WZ, JS, YQ, LW, PF, and ZW reviewed and commented on the paper. ZZ and YS wrote the paper.
The contact author has declared that none of the authors has any competing interests.
Publisher's note: Copernicus Publications remains neutral with regard to jurisdictional claims in published maps and institutional affiliations.
This research has been supported by the National Natural Science Foundation of China (grant nos. 41975170 and 91744207).
This paper was edited by Dantong Liu and reviewed by two anonymous referees.
Aiken, A. C., Salcedo, D., Cubison, M. J., Huffman, J. A., DeCarlo, P. F., Ulbrich, I. M., Docherty, K. S., Sueper, D., Kimmel, J. R., Worsnop, D. R., Trimborn, A., Northway, M., Stone, E. A., Schauer, J. J., Volkamer, R. M., Fortner, E., de Foy, B., Wang, J., Laskin, A., Shutthanandan, V., Zheng, J., Zhang, R., Gaffney, J., Marley, N. A., Paredes-Miranda, G., Arnott, W. P., Molina, L. T., Sosa, G., and Jimenez, J. L.: Mexico City aerosol analysis during MILAGRO using high resolution aerosol mass spectrometry at the urban supersite (T0) – Part 1: Fine particle composition and organic source apportionment, Atmos. Chem. Phys., 9, 6633–6653, https://doi.org/10.5194/acp-9-6633-2009, 2009.
Atwi, K., Cheng, Z., El Hajj, O., Perrie, C., and Saleh, R.: A dominant contribution to light absorption by methanol-insoluble brown carbon produced in the combustion of biomass fuels typically consumed in wildland fires in the United States, Environ. Sci.: Atmos., 2, 182–191, https://doi.org/10.1039/D1EA00065A, 2022.
Bozzetti, C., El Haddad, I., Salameh, D., Daellenbach, K. R., Fermo, P., Gonzalez, R., Minguillón, M. C., Iinuma, Y., Poulain, L., Elser, M., Müller, E., Slowik, J. G., Jaffrezo, J.-L., Baltensperger, U., Marchand, N., and Prévôt, A. S. H.: Organic aerosol source apportionment by offline-AMS over a full year in Marseille, Atmos. Chem. Phys., 17, 8247–8268, https://doi.org/10.5194/acp-17-8247-2017, 2017a.
Bozzetti, C., Sosedova, Y., Xiao, M., Daellenbach, K. R., Ulevicius, V., Dudoitis, V., Mordas, G., Byčenkienė, S., Plauškaitė, K., Vlachou, A., Golly, B., Chazeau, B., Besombes, J.-L., Baltensperger, U., Jaffrezo, J.-L., Slowik, J. G., El Haddad, I., and Prévôt, A. S. H.: Argon offline-AMS source apportionment of organic aerosol over yearly cycles for an urban, rural, and marine site in northern Europe, Atmos. Chem. Phys., 17, 117–141, https://doi.org/10.5194/acp-17-117-2017, 2017b.
Canagaratna, M. R., Jimenez, J. L., Kroll, J. H., Chen, Q., Kessler, S. H., Massoli, P., Hildebrandt Ruiz, L., Fortner, E., Williams, L. R., Wilson, K. R., Surratt, J. D., Donahue, N. M., Jayne, J. T., and Worsnop, D. R.: Elemental ratio measurements of organic compounds using aerosol mass spectrometry: characterization, improved calibration, and implications, Atmos. Chem. Phys., 15, 253–272, https://doi.org/10.5194/acp-15-253-2015, 2015.
Capel, P. D., Leuenberger, C., and Giger, W.: Hydrophobic organic chemicals in urban fog, Atmos. Environ. A-Gen., 25, 1335–1346, https://doi.org/10.1016/0960-1686(91)90244-2, 1991.
Chakraborty, A., Rajeev, P., Rajput, P., and Gupta, T.: Water soluble organic aerosols in Indo Gangetic Plain (IGP): insights from aerosol mass spectrometry, Sci. Total Environ., 599–600, 1573–1582, https://doi.org/10.1016/j.scitotenv.2017.05.142, 2017.
Chen, X., Wang, H., Lu, K., Li, C., Zhai, T., Tan, Z., Ma, X., Yang, X., Liu, Y., Chen, S., Dong, H., Li, X., Wu, Z., Hu, M., Zeng, L., and Zhang, Y.: Field determination of nitrate formation pathway in winter Beijing, Environ. Sci. Technol., 54, 9243–9253, https://doi.org/10.1021/acs.est.0c00972, 2020.
Chen, Y., Xu, L., Humphry, T., Hettiyadura, A. P. S., Ovadnevaite, J., Huang, S., Poulain, L., Schroder, J. C., Campuzano-Jost, P., Jimenez, J. L., Herrmann, H., O'Dowd, C., Stone, E. A., and Ng, N. L.: Response of the aerodyne aerosol mass spectrometer to inorganic sulfates and organosulfur compounds: applications in field and laboratory measurements, Environ. Sci. Technol., 53, 5176–5186, https://doi.org/10.1021/acs.est.9b00884, 2019.
Cheng, Y., Engling, G., He, K.-b., Duan, F.-k., Du, Z.-y., Ma, Y.-l., Liang, L.-l., Lu, Z.-f., Liu, J.-m., Zheng, M., and Weber, R. J.: The characteristics of Beijing aerosol during two distinct episodes: impacts of biomass burning and fireworks, Environ. Pollut., 185, 149–157, https://doi.org/10.1016/j.envpol.2013.10.037, 2014.
Chhabra, P. S., Flagan, R. C., and Seinfeld, J. H.: Elemental analysis of chamber organic aerosol using an aerodyne high-resolution aerosol mass spectrometer, Atmos. Chem. Phys., 10, 4111–4131, https://doi.org/10.5194/acp-10-4111-2010, 2010.
Collier, S., Zhou, S., Kuwayama, T., Forestieri, S., Brady, J., Zhang, M., Kleeman, M., Cappa, C., Bertram, T., and Zhang, Q.: Organic PM emissions from vehicles: composition, ratio, and dependence on PM concentration, Aerosol Sci. Technol., 49, 86–97, https://doi.org/10.1080/02786826.2014.1003364, 2015.
Cubison, M. J., Ortega, A. M., Hayes, P. L., Farmer, D. K., Day, D., Lechner, M. J., Brune, W. H., Apel, E., Diskin, G. S., Fisher, J. A., Fuelberg, H. E., Hecobian, A., Knapp, D. J., Mikoviny, T., Riemer, D., Sachse, G. W., Sessions, W., Weber, R. J., Weinheimer, A. J., Wisthaler, A., and Jimenez, J. L.: Effects of aging on organic aerosol from open biomass burning smoke in aircraft and laboratory studies, Atmos. Chem. Phys., 11, 12049–12064, https://doi.org/10.5194/acp-11-12049-2011, 2011.
Daellenbach, K. R., Bozzetti, C., Křepelová, A., Canonaco, F., Wolf, R., Zotter, P., Fermo, P., Crippa, M., Slowik, J. G., Sosedova, Y., Zhang, Y., Huang, R.-J., Poulain, L., Szidat, S., Baltensperger, U., El Haddad, I., and Prévôt, A. S. H.: Characterization and source apportionment of organic aerosol using offline aerosol mass spectrometry, Atmos. Meas. Tech., 9, 23–39, https://doi.org/10.5194/amt-9-23-2016, 2016.
DeCarlo, P. F., Kimmel, J. R., Trimborn, A., Northway, M. J., Jayne, J. T., Aiken, A. C., Gonin, M., Fuhrer, K., Horvath, T., Docherty, K. S., Worsnop, D. R., and Jimenez, J. L.: Field-deployable, high-resolution, time-of-flight aerosol mass spectrometer, Anal. Chem., 78, 8281–8289, https://doi.org/10.1021/ac061249n, 2006.
DeCarlo, P. F., Ulbrich, I. M., Crounse, J., de Foy, B., Dunlea, E. J., Aiken, A. C., Knapp, D., Weinheimer, A. J., Campos, T., Wennberg, P. O., and Jimenez, J. L.: Investigation of the sources and processing of organic aerosol over the Central Mexican Plateau from aircraft measurements during MILAGRO, Atmos. Chem. Phys., 10, 5257–5280, https://doi.org/10.5194/acp-10-5257-2010, 2010.
Du, Z., He, K., Cheng, Y., Duan, F., Ma, Y., Liu, J., Zhang, X., Zheng, M., and Weber, R.: A yearlong study of water-soluble organic carbon in Beijing I: sources and its primary vs. secondary nature, Atmos. Environ., 92, 514–521, https://doi.org/10.1016/j.atmosenv.2014.04.060, 2014.
Dzepina, K., Arey, J., Marr, L. C., Worsnop, D. R., Salcedo, D., Zhang, Q., Onasch, T. B., Molina, L. T., Molina, M. J., and Jimenez, J. L.: Detection of particle-phase polycyclic aromatic hydrocarbons in Mexico City using an aerosol mass spectrometer, Internat. J. Mass Spectrom., 263, 152–170, https://doi.org/10.1016/j.ijms.2007.01.010, 2007.
Ervens, B., Feingold, G., and Kreidenweis, S. M.: Influence of water-soluble organic carbon on cloud drop number concentration, J. Geophys. Res.-Atmos., 110, D18211, https://doi.org/10.1029/2004JD005634, 2005.
Facchini, M. C., Mircea, M., Fuzzi, S., and Charlson, R. J.: Cloud albedo enhancement by surface-active organic solutes in growing droplets, Nature, 401, 257–259, https://doi.org/10.1038/45758, 1999.
Feng, J., Hu, M., Chan, C. K., Lau, P. S., Fang, M., He, L., and Tang, X.: A comparative study of the organic matter in PM2.5 from three Chinese megacities in three different climatic zones, Atmos. Environ., 40, 3983–3994, https://doi.org/10.1016/j.atmosenv.2006.02.017, 2006.
Ge, X., Li, L., Chen, Y., Chen, H., Wu, D., Wang, J., Xie, X., Ge, S., Ye, Z., Xu, J., and Chen, M.: Aerosol characteristics and sources in Yangzhou, China resolved by offline aerosol mass spectrometry and other techniques, Environ. Pollut., 225, 74–85, https://doi.org/10.1016/j.envpol.2017.03.044, 2017.
Heald, C. L., Kroll, J. H., Jimenez, J. L., Docherty, K. S., DeCarlo, P. F., Aiken, A. C., Chen, Q., Martin, S. T., Farmer, D. K., and Artaxo, P.: A simplified description of the evolution of organic aerosol composition in the atmosphere, Geophys. Res. Lett., 37, L08803, https://doi.org/10.1029/2010GL042737, 2010.
Huang, R.-J., Yang, L., Shen, J., Yuan, W., Gong, Y., Guo, J., Cao, W., Duan, J., Ni, H., Zhu, C., Dai, W., Li, Y., Chen, Y., Chen, Q., Wu, Y., Zhang, R., Dusek, U., O'Dowd, C., and Hoffmann, T.: Water-insoluble organics dominate brown carbon in wintertime urban aerosol of China: chemical characteristics and optical properties, Environ. Sci. Technol., 54, 7836–7847, https://doi.org/10.1021/acs.est.0c01149, 2020.
Huang, X.-F., He, L.-Y., Hu, M., Canagaratna, M. R., Sun, Y., Zhang, Q., Zhu, T., Xue, L., Zeng, L.-W., Liu, X.-G., Zhang, Y.-H., Jayne, J. T., Ng, N. L., and Worsnop, D. R.: Highly time-resolved chemical characterization of atmospheric submicron particles during 2008 Beijing Olympic Games using an Aerodyne High-Resolution Aerosol Mass Spectrometer, Atmos. Chem. Phys., 10, 8933–8945, https://doi.org/10.5194/acp-10-8933-2010, 2010.
Jimenez, J. L., Canagaratna, M. R., Donahue, N. M., Prevot, A. S. H., Zhang, Q., Kroll, J. H., DeCarlo, P. F., Allan, J. D., Coe, H., Ng, N. L., Aiken, A. C., Docherty, K. S., Ulbrich, I. M., Grieshop, A. P., Robinson, A. L., Duplissy, J., Smith, J. D., Wilson, K. R., Lanz, V. A., Hueglin, C., Sun, Y. L., Tian, J., Laaksonen, A., Raatikainen, T., Rautiainen, J., Vaattovaara, P., Ehn, M., Kulmala, M., Tomlinson, J. M., Collins, D. R., Cubison, M. J., Dunlea, J., Huffman, J. A., Onasch, T. B., Alfarra, M. R., Williams, P. I., Bower, K., Kondo, Y., Schneider, J., Drewnick, F., Borrmann, S., Weimer, S., Demerjian, K., Salcedo, D., Cottrell, L., Griffin, R., Takami, A., Miyoshi, T., Hatakeyama, S., Shimono, A., Sun, J. Y., Zhang, Y. M., Dzepina, K., Kimmel, J. R., Sueper, D., Jayne, J. T., Herndon, S. C., Trimborn, A. M., Williams, L. R., Wood, E. C., Middlebrook, A. M., Kolb, C. E., Baltensperger, U., and Worsnop, D. R.: Evolution of organic aerosols in the atmosphere, Science, 326, 1525, https://doi.org/10.1126/science.1180353, 2009.
Kondo, Y., Miyazaki, Y., Takegawa, N., Miyakawa, T., Weber, R. J., Jimenez, J. L., Zhang, Q., and Worsnop, D. R.: Oxygenated and water-soluble organic aerosols in Tokyo, J. Geophys. Res.-Atmos., 112, D01203, https://doi.org/10.1029/2006JD007056, 2007.
Leaitch, W. R., Macdonald, A. M., Brickell, P. C., Liggio, J., Sjostedt, S. J., Vlasenko, A., Bottenheim, J. W., Huang, L., Li, S.-M., Liu, P. S. K., Toom-Sauntry, D., Hayden, K. A., Sharma, S., Shantz, N. C., Wiebe, H. A., Zhang, W., Abbatt, J. P. D., Slowik, J. G., Chang, R. Y. W., Russell, L. M., Schwartz, R. E., Takahama, S., Jayne, J. T., and Ng, N. L.: Temperature response of the submicron organic aerosol from temperate forests, Atmos. Environ., 45, 6696–6704, https://doi.org/10.1016/j.atmosenv.2011.08.047, 2011.
Lei, L., Zhou, W., Chen, C., He, Y., Li, Z., Sun, J., Tang, X., Fu, P., Wang, Z., and Sun, Y.: Long-term characterization of aerosol chemistry in cold season from 2013 to 2020 in Beijing, China, Environ. Pollut., 268, 115952, https://doi.org/10.1016/j.envpol.2020.115952, 2021.
Li, H., Zhang, Q., Jiang, W., Collier, S., Sun, Y., Zhang, Q., and He, K.: Characteristics and sources of water-soluble organic aerosol in a heavily polluted environment in Northern China, Sci. Total Environ., 758, 143970, https://doi.org/10.1016/j.scitotenv.2020.143970, 2021.
Li, Z., Lei, L., Li, Y., Chen, C., Wang, Q., Zhou, W., Sun, J., Xie, C., and Sun, Y.: Aerosol characterization in a city in central China plain and implications for emission control, J. Environ. Sci., 104, 242–252, https://doi.org/10.1016/j.jes.2020.11.015, 2021.
Mohr, C., DeCarlo, P. F., Heringa, M. F., Chirico, R., Slowik, J. G., Richter, R., Reche, C., Alastuey, A., Querol, X., Seco, R., Peñuelas, J., Jiménez, J. L., Crippa, M., Zimmermann, R., Baltensperger, U., and Prévôt, A. S. H.: Identification and quantification of organic aerosol from cooking and other sources in Barcelona using aerosol mass spectrometer data, Atmos. Chem. Phys., 12, 1649–1665, https://doi.org/10.5194/acp-12-1649-2012, 2012.
Ng, N. L., Canagaratna, M. R., Zhang, Q., Jimenez, J. L., Tian, J., Ulbrich, I. M., Kroll, J. H., Docherty, K. S., Chhabra, P. S., Bahreini, R., Murphy, S. M., Seinfeld, J. H., Hildebrandt, L., Donahue, N. M., DeCarlo, P. F., Lanz, V. A., Prévôt, A. S. H., Dinar, E., Rudich, Y., and Worsnop, D. R.: Organic aerosol components observed in Northern Hemispheric datasets from Aerosol Mass Spectrometry, Atmos. Chem. Phys., 10, 4625–4641, https://doi.org/10.5194/acp-10-4625-2010, 2010.
Ng, N. L., Canagaratna, M. R., Jimenez, J. L., Chhabra, P. S., Seinfeld, J. H., and Worsnop, D. R.: Changes in organic aerosol composition with aging inferred from aerosol mass spectra, Atmos. Chem. Phys., 11, 6465–6474, https://doi.org/10.5194/acp-11-6465-2011, 2011.
Paatero, P. and Tapper, U.: Positive matrix factorization: A non-negative factor model with optimal utilization of error estimates of data values, Environmetrics, 5, 111–126, https://doi.org/10.1002/env.3170050203, 1994.
Qiu, Y., Xie, Q., Wang, J., Xu, W., Li, L., Wang, Q., Zhao, J., Chen, Y., Chen, Y., Wu, Y., Du, W., Zhou, W., Lee, J., Zhao, C., Ge, X., Fu, P., Wang, Z., Worsnop, D. R., and Sun, Y.: Vertical characterization and source apportionment of water-soluble organic aerosol with high-resolution aerosol mass spectrometry in Beijing, China, ACS Earth Space Chem., 3, 273–284, https://doi.org/10.1021/acsearthspacechem.8b00155, 2019.
Qiu, Y., Xu, W., Jia, L., He, Y., Fu, P., Zhang, Q., Xie, Q., Hou, S., Xie, C., Xu, Y., Wang, Z., Worsnop, D. R., and Sun, Y.: Molecular composition and sources of water-soluble organic aerosol in summer in Beijing, Chemosphere, 255, 126850, https://doi.org/10.1016/j.chemosphere.2020.126850, 2020.
Saxena, P. and Hildemann, L. M.: Water-soluble organics in atmospheric particles: a critical review of the literature and application of thermodynamics to identify candidate compounds, J. Atmos. Chem., 24, 57–109, https://doi.org/10.1007/BF00053823, 1996.
Sun, Y., Zhang, Q., Zheng, M., Ding, X., Edgerton, E. S., and Wang, X.: Characterization and source apportionment of water-soluble organic matter in atmospheric fine particles (PM2.5) with high-resolution aerosol mass spectrometry and GC–MS, Environ. Sci. Technol., 45, 4854–4861, https://doi.org/10.1021/es200162h, 2011.
Sun, Y., Wang, Z., Fu, P., Jiang, Q., Yang, T., Li, J., and Ge, X.: The impact of relative humidity on aerosol composition and evolution processes during wintertime in Beijing, China, Atmos. Environ., 77, 927–934, https://doi.org/10.1016/j.atmosenv.2013.06.019, 2013.
Sun, Y., Du, W., Fu, P., Wang, Q., Li, J., Ge, X., Zhang, Q., Zhu, C., Ren, L., Xu, W., Zhao, J., Han, T., Worsnop, D. R., and Wang, Z.: Primary and secondary aerosols in Beijing in winter: sources, variations and processes, Atmos. Chem. Phys., 16, 8309–8329, https://doi.org/10.5194/acp-16-8309-2016, 2016.
Sun, Y.-L., Zhang, Q., Schwab, J. J., Demerjian, K. L., Chen, W.-N., Bae, M.-S., Hung, H.-M., Hogrefe, O., Frank, B., Rattigan, O. V., and Lin, Y.-C.: Characterization of the sources and processes of organic and inorganic aerosols in New York city with a high-resolution time-of-flight aerosol mass apectrometer, Atmos. Chem. Phys., 11, 1581–1602, https://doi.org/10.5194/acp-11-1581-2011, 2011.
Sun, Y. L., Wang, Z. F., Fu, P. Q., Yang, T., Jiang, Q., Dong, H. B., Li, J., and Jia, J. J.: Aerosol composition, sources and processes during wintertime in Beijing, China, Atmos. Chem. Phys., 13, 4577–4592, https://doi.org/10.5194/acp-13-4577-2013, 2013.
Tsigaridis, K., Daskalakis, N., Kanakidou, M., Adams, P. J., Artaxo, P., Bahadur, R., Balkanski, Y., Bauer, S. E., Bellouin, N., Benedetti, A., Bergman, T., Berntsen, T. K., Beukes, J. P., Bian, H., Carslaw, K. S., Chin, M., Curci, G., Diehl, T., Easter, R. C., Ghan, S. J., Gong, S. L., Hodzic, A., Hoyle, C. R., Iversen, T., Jathar, S., Jimenez, J. L., Kaiser, J. W., Kirkevåg, A., Koch, D., Kokkola, H., Lee, Y. H., Lin, G., Liu, X., Luo, G., Ma, X., Mann, G. W., Mihalopoulos, N., Morcrette, J.-J., Müller, J.-F., Myhre, G., Myriokefalitakis, S., Ng, N. L., O'Donnell, D., Penner, J. E., Pozzoli, L., Pringle, K. J., Russell, L. M., Schulz, M., Sciare, J., Seland, Ø., Shindell, D. T., Sillman, S., Skeie, R. B., Spracklen, D., Stavrakou, T., Steenrod, S. D., Takemura, T., Tiitta, P., Tilmes, S., Tost, H., van Noije, T., van Zyl, P. G., von Salzen, K., Yu, F., Wang, Z., Wang, Z., Zaveri, R. A., Zhang, H., Zhang, K., Zhang, Q., and Zhang, X.: The AeroCom evaluation and intercomparison of organic aerosol in global models, Atmos. Chem. Phys., 14, 10845–10895, https://doi.org/10.5194/acp-14-10845-2014, 2014.
Turpin, B. J. and Huntzicker, J. J.: Identification of secondary organic aerosol episodes and quantitation of primary and secondary organic aerosol concentrations during SCAQS, Atmos. Environ., 29, 3527–3544, https://doi.org/10.1016/1352-2310(94)00276-Q, 1995.
Ulbrich, I. M., Canagaratna, M. R., Zhang, Q., Worsnop, D. R., and Jimenez, J. L.: Interpretation of organic components from Positive Matrix Factorization of aerosol mass spectrometric data, Atmos. Chem. Phys., 9, 2891–2918, https://doi.org/10.5194/acp-9-2891-2009, 2009.
Verma, V., Fang, T., Xu, L., Peltier, R. E., Russell, A. G., Ng, N. L., and Weber, R. J.: Organic aerosols associated with the generation of reactive oxygen species (ROS) by water-soluble PM2.5, Environ. Sci. Technol., 49, 4646–4656, https://doi.org/10.1021/es505577w, 2015.
Wang, D., Zhou, B., Fu, Q., Zhao, Q., Zhang, Q., Chen, J., Yang, X., Duan, Y., and Li, J.: Intense secondary aerosol formation due to strong atmospheric photochemical reactions in summer: observations at a rural site in eastern Yangtze River Delta of China, Sci. Total Environ., 571, 1454–1466, https://doi.org/10.1016/j.scitotenv.2016.06.212, 2016.
Wei, L., Fu, P., Chen, X., An, N., Yue, S., Ren, H., Zhao, W., Xie, Q., Sun, Y., Zhu, Q.-F., Wang, Z., and Feng, Y.-Q.: Quantitative determination of hydroxymethanesulfonate (HMS) using ion chromatography and UHPLC-LTQ-orbitrap mass spectrometry: a missing source of sulfur during haze episodes in Beijing, Environ. Sci. Tech. Let., 7, 701–707, https://doi.org/10.1021/acs.estlett.0c00528, 2020.
Wu, Y., Ge, X., Wang, J., Shen, Y., Ye, Z., Ge, S., Wu, Y., Yu, H., and Chen, M.: Responses of secondary aerosols to relative humidity and photochemical activities in an industrialized environment during late winter, Atmos. Environ., 193, 66–78, https://doi.org/10.1016/j.atmosenv.2018.09.008, 2018.
Xiang, P., Zhou, X., Duan, J., Tan, J., He, K., Yuan, C., Ma, Y., and Zhang, Y.: Chemical characteristics of water-soluble organic compounds (WSOC) in PM2.5 in Beijing, China: 2011–2012, Atmos. Res., 183, 104–112, https://doi.org/10.1016/j.atmosres.2016.08.020, 2017.
Xu, L., Guo, H., Weber, R. J., and Ng, N. L.: Chemical characterization of water-soluble organic aerosol in contrasting rural and urban environments in the southeastern United States, Environ. Sci. Technol., 51, 78–88, https://doi.org/10.1021/acs.est.6b05002, 2017.
Xu, W., Han, T., Du, W., Wang, Q., Chen, C., Zhao, J., Zhang, Y., Li, J., Fu, P., Wang, Z., Worsnop, D. R., and Sun, Y.: Effects of aqueous-phase and photochemical processing on secondary organic aerosol formation and evolution in Beijing, China, Environ. Sci. Technol., 51, 762–770, https://doi.org/10.1021/acs.est.6b04498, 2017.
Xu, W., He, Y., Qiu, Y., Chen, C., Xie, C., Lei, L., Li, Z., Sun, J., Li, J., Fu, P., Wang, Z., Worsnop, D. R., and Sun, Y.: Mass spectral characterization of primary emissions and implications in source apportionment of organic aerosol, Atmos. Meas. Tech., 13, 3205–3219, https://doi.org/10.5194/amt-13-3205-2020, 2020.
Xu, W., Li, Z., Lambe, A. T., Li, J., Liu, T., Du, A., Zhang, Z., Zhou, W., and Sun, Y.: Secondary organic aerosol formation and aging from ambient air in an oxidation flow reactor during wintertime in Beijing, China, Environ. Res., 209, 112751, https://doi.org/10.1016/j.envres.2022.112751, 2022.
Ye, Z., Liu, J., Gu, A., Feng, F., Liu, Y., Bi, C., Xu, J., Li, L., Chen, H., Chen, Y., Dai, L., Zhou, Q., and Ge, X.: Chemical characterization of fine particulate matter in Changzhou, China, and source apportionment with offline aerosol mass spectrometry, Atmos. Chem. Phys., 17, 2573–2592, https://doi.org/10.5194/acp-17-2573-2017, 2017.
Zhang, Q., Jimenez, J. L., Canagaratna, M. R., Ulbrich, I. M., Ng, N. L., Worsnop, D. R., and Sun, Y.: Understanding atmospheric organic aerosols via factor analysis of aerosol mass spectrometry: a review, Anal. Bioanal. Chem., 401, 3045–3067, https://doi.org/10.1007/s00216-011-5355-y, 2011.
Zhang, Y., Schauer, J. J., Zhang, Y., Zeng, L., Wei, Y., Liu, Y., and Shao, M.: Characteristics of particulate carbon emissions from real-world Chinese coal combustion, Environ. Sci. Technol., 42, 5068–5073, https://doi.org/10.1021/es7022576, 2008.
Zhang, Y.-L., El-Haddad, I., Huang, R.-J., Ho, K.-F., Cao, J.-J., Han, Y., Zotter, P., Bozzetti, C., Daellenbach, K. R., Slowik, J. G., Salazar, G., Prévôt, A. S. H., and Szidat, S.: Large contribution of fossil fuel derived secondary organic carbon to water soluble organic aerosols in winter haze in China, Atmos. Chem. Phys., 18, 4005–4017, https://doi.org/10.5194/acp-18-4005-2018, 2018.
Zhao, J., Qiu, Y., Zhou, W., Xu, W., Wang, J., Zhang, Y., Li, L., Xie, C., Wang, Q., Du, W., Worsnop, D. R., Canagaratna, M. R., Zhou, L., Ge, X., Fu, P., Li, J., Wang, Z., Donahue, N. M., and Sun, Y.: Organic aerosol processing during winter severe haze episodes in Beijing, J. Geophys. Res.-Atmos., 124, 10248–10263, https://doi.org/10.1029/2019JD030832, 2019.