the Creative Commons Attribution 4.0 License.
the Creative Commons Attribution 4.0 License.
 | 18 May 2021
Shape dependence of snow crystal fall speed
Sandra Vázquez-Martín
Salomon Eliasson
Improved snowfall predictions require accurate knowledge of the properties of ice crystals and snow particles, such as their size, cross-sectional area, shape, and fall speed. The fall speed of ice particles is a critical parameter for the representation of ice clouds and snow in atmospheric numerical models, as it determines the rate of removal of ice from the modelled clouds. Fall speed is also required for snowfall predictions alongside other properties such as ice particle size, cross-sectional area, and shape. For example, shape is important as it strongly influences the scattering properties of these ice particles and thus their response to remote sensing techniques.
This work analyzes fall speed as a function of particle size (maximum dimension), cross-sectional area, and shape using ground-based in situ measurements. The measurements for this study were done in Kiruna, Sweden, during the snowfall seasons of 2014 to 2019, using the ground-based in situ instrument Dual Ice Crystal Imager (D-ICI). The resulting data consist of high-resolution images of falling hydrometeors from two viewing geometries that are used to determine particle size (maximum dimension), cross-sectional area, area ratio, orientation, and the fall speed of individual particles. The selected dataset covers sizes from about 0.06 to 3.2 mm and fall speeds from 0.06 to 1.6 m s−1.
Relationships between particle size, cross-sectional area, and fall speed are studied for different shapes. The data show in general low correlations to fitted fall speed relationships due to large spread observed in fall speed. After binning the data according to size or cross-sectional area, correlations improve, and we can report reliable parameterizations of fall speed vs. particle size or cross-sectional area for part of the shapes. For most of these shapes, the fall speed is better correlated with cross-sectional area than with particle size. The effects of orientation and area ratio on the fall speed are also studied, and measurements show that vertically oriented particles fall faster on average. However, most particles for which orientation can be defined fall horizontally.
- Article
(8774 KB) - Full-text XML
- BibTeX
- EndNote


The knowledge of the microphysical properties of atmospheric snow particles (ice crystals and snowflakes) is essential to achieve accurate realistic parameterizations in atmospheric models (e.g., Stoelinga et al., 2003; Tao et al., 2003). Also, the accuracy of many different remote sensing applications, such as cloud and precipitation retrievals from satellite passive and active microwave measurements (Posselt et al., 2008; Zhang et al., 2009; Cooper and Garrett, 2010, and others), is highly dependent on the assumptions made on the microphysical properties of snow particles. Some of these critical properties are particle size, particle size distribution, cross-sectional area, area ratio, shape, orientation, and fall speed.
Several studies have classified snow crystal shape according to different classification schemes (Nakaya, 1954; Magono and Lee, 1966; Kikuchi et al., 2013; Vázquez-Martín et al., 2020). Particle shape is essential, not only for investigating growth processes but also because it affects remote sensing measurements, for instance, radar measurements (e.g., Sun et al., 2011; Matrosov et al., 2012; Marchand et al., 2013) or passive measurements of microwave brightness temperatures (Kneifel et al., 2010). Furthermore, it is of significant importance for optical remote sensing retrievals of cloud properties (see, e.g., Yang et al., 2008; Baum et al., 2011; Xie et al., 2011; Loeb et al., 2018) and snow albedo (e.g., Jin et al., 2008). The physical properties of snow particles, including shape, govern their fall speed. For a given volume and density, non-spherical particles fall slower than spheres (Haider, 1989). At the same size, shape variations account for spread in fall speed, which causes variations in other properties such as the vertical mass flux of water (Dunnavan, 2021). Therefore, also the particle shape is an important parameter to ensure accurate cloud parameterizations in climate and forecast models (e.g., Stoelinga et al., 2003; Tao et al., 2003), and for the understanding of precipitation in cold climates.
Together with particle size and shape, the snow particle orientation also plays a significant role. It is highly dependent on the local aerodynamic conditions (Pruppacher and Klett, 1997), and significant uncertainties regarding particle orientation remain, especially for rimed particles and aggregates (Xie et al., 2012; Jiang et al., 2019). The particle orientation determines its horizontal cross-sectional area and influences its drag and therefore its fall speed. Particle orientation also affects the bulk scattering properties of clouds (Yang et al., 2008, 2011). For instance, for microwave radiation, particle orientation significantly affects the radar reflectivity (e.g., Sun et al., 2011; Gergely and Garrett, 2016) and, due to its sizable impact on absorption (e.g., Foster et al., 2000), strongly modulates the microwave brightness temperature (Xie and Miao, 2011; Xie et al., 2015).
The fall speed of snow crystals plays a significant role in modeling microphysical precipitation processes (Schefold et al., 2002) and for climate since it determines the lifetime of cirrus clouds, and thus the cloud coverage and ice water path (Mitchell et al., 2008), and the top-of-atmosphere radiation budget (Westbrook and Sephton, 2017). Additionally, fall speed determines the snowfall rate, i.e., the rate of particle removal from clouds. The precipitation rate is proportional to the fall speed of the particles, implying quantitative forecasts of this variable require accurate snowflake fall speeds (Westbrook and Sephton, 2017). Therefore, it is essential to know particle size, shape, and fall speed simultaneously.
Earlier studies have used different methods to investigate and parameterize the dependence of fall speed on snow particle size. Most parameterizations can be given as a power law with general form , where v is the fall speed, D is the particle size, and aD, bD are constant coefficients. This power-law relationship is often adopted because it facilitates analytical solutions in models, for instance, for calculations of Doppler velocity, and appears in many studies (e.g., Locatelli and Hobbs, 1974; Heymsfield and Kajikawa, 1987; Mitchell, 1996; Barthazy and Schefold, 2006; Yuter et al., 2006; Brandes et al., 2008; Heymsfield and Westbrook, 2010; Zawadzki et al., 2010; Lee et al., 2015). The dependence of fall speed on particle cross-sectional area is also readily represented as a power law, , where v is the fall speed, A is the cross-sectional area, and aA, bA are constant coefficients (e.g., Kuhn and Gultepe, 2016; Kuhn and Vázquez-Martín, 2020). In a few studies, different functions are used to describe relationships. For example, Barthazy and Schefold (2006) showed that an exponential function that asymptotically approaches a constant speed at larger sizes could also be used to describe the size dependence of fall speed, in particular for particles larger than about 3 mm.
This study analyzes the fall speed relationships of snow particles as a function of particle size and cross-sectional area based on a dataset of falling natural snow particles that have been collected in Kiruna in northern Sweden with the ground-based Dual Ice Crystal Imager (D-ICI) instrument presented in Kuhn and Vázquez-Martín (2020). Section 2 describes the measurements and methods used to classify the snow particle shape and determine their size, cross-sectional area, and fall speed. Section 3 investigates the influence of the particle shape on relationships between fall speed and particle size or cross-sectional area. Furthermore, we examine the dependence of fall speed on area ratio and particle orientation. These results are then compared to previous studies. Finally, this study is summarized and concluded in Sect. 4.
2.1 Measurements and instrument
Our measurements are carried out in Kiruna, Sweden (67.8∘ N, 20.4∘ E, at approximately 400 m above sea level), at a site described in Vázquez-Martín et al. (2020), using D-ICI, the ground-based in situ instrument described in Kuhn and Vázquez-Martín (2020). D-ICI captures and records dual images of falling snow crystals and other hydrometeors. Detected particles are imaged simultaneously from two different viewing directions. One is horizontal, recording a side view, and one is close to vertical, recording a top view. From the top-view image, we can determine particle size, cross-sectional area, and area ratio. From the side-view image, since it is exposed twice, we can determine fall speed (see Sect. 2.2).
These images have a high optical resolution of about 10 µm, and one pixel corresponds to 3.7 µm. This resolution allows for the identification of snow particles even smaller than 0.1 mm. The additional information that dual images provide improves the shape classification carried out by looking at both top- and side-view images. The particles are classified according to their shape and sorted into 15 shape groups, as described in Vázquez-Martín et al. (2020).
More than 10 000 particles have been recorded during multiple snowfall seasons, the winters of 2014/2015 to 2018/2019. Each winter season at the Kiruna site lasts approximately from the beginning of November to the middle of May. Part of these data from 2014 to 2018 were selected to carry out this work. During image processing (see Sect. 2.2), we only consider particles that are entirely in the field of view (FOV) and that are not significantly tumbling (for a detailed description, see Kuhn and Vázquez-Martín, 2020). Furthermore, the ambient wind speed is taken into account. As mentioned in Kuhn and Vázquez-Martín (2020), higher wind speeds may alter fall speed measurements. Therefore, data taken at averaged wind speeds higher than 3 m s−1 are excluded. The Swedish Meteorological and Hydrological Institute (SMHI) weather data (SMHI, 2020), based on instruments at the Kiruna airport, are recorded 6 km away from our measurement site and provide the wind speed data used in this study. After excluding FOV and tumbling problems, about 3200 particles remained. Of these, 23 % were measured at wind speeds higher than 3 m s−1, leaving a total of 2461 particles to form our dataset.
2.2 Snow properties
Figure 1 shows two different snow particles from the side (right) and top views (left). The images from the top view are used to determine particle size, cross-sectional area, and area ratio by the automated process presented in Kuhn and Vázquez-Martín (2020). For this, first, the background features are removed; then the in-focus particles are detected and their boundaries traced. Consequently, the particle properties, such as particle size, cross-sectional area, and area ratio, can be determined. As we have described in Vázquez-Martín et al. (2020), the maximum dimension, Dmax, defined as the smallest diameter that completely encircles the particle boundary in the top-view image, is used to describe the particle size. Thus, in the following, particle size and maximum dimension are used synonymously. The cross-sectional area, A, is defined as the area in the top-view image enclosed by the particle boundary based on pixel count. Once the particle size and cross-sectional area are determined, the area ratio Ar can be also calculated from these quantities:
The aerodynamic drag, which chiefly governs fall speed, mostly depends on the quantities Dmax, A, and Ar, which are retrieved using images that view the particles from above (in the falling direction) as done by D-ICI, rather than from a horizontal viewing direction as done by other instruments. Furthermore, this view is more suitable to enable comparison with remote sensing measurements that often also have a vertical viewing geometry.
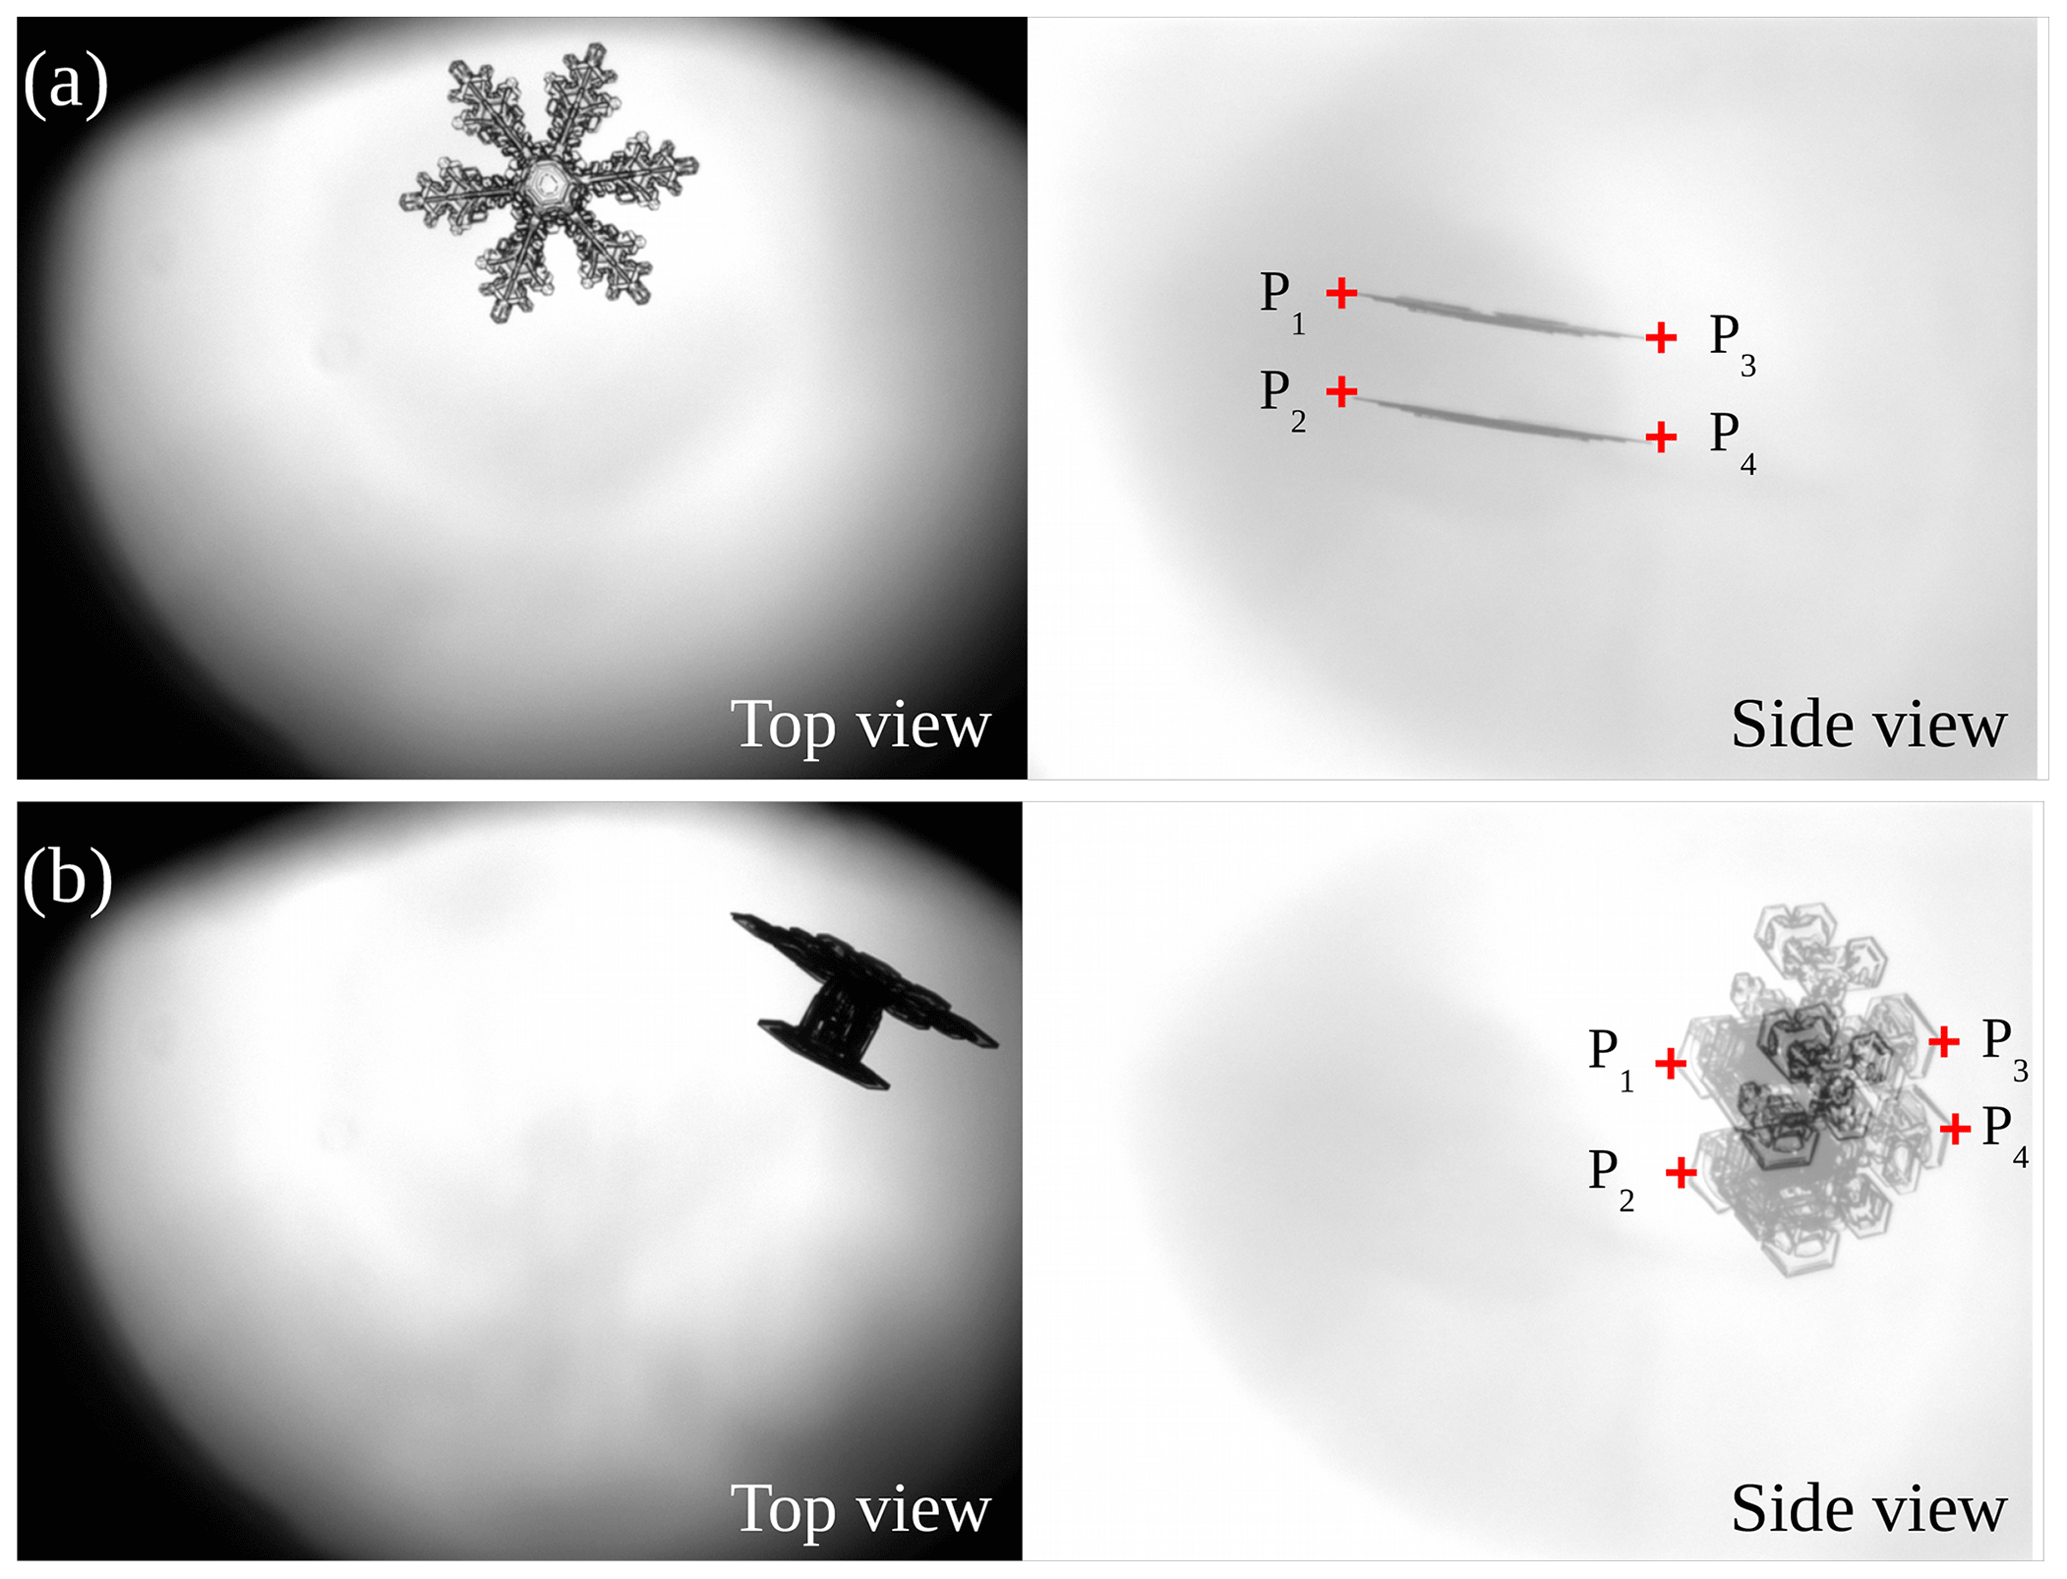
Figure 1 Two particle examples (a–b). Left: top-view images. Right: side-view images, which are exposed twice to enable fall speed measurements. Both viewing geometries are used to classify the particle shape. In both examples, two pairs of points (P1, P3 and P2, P4) were selected to determine the fall speed.
The side-view images are exposed twice to enable fall speed measurements so that both particle exposures are displayed in the same image (Fig. 1, right). These particle exposures correspond to the first and second positions, respectively, of the particle when falling. In our data, the two-particle exposures in the side-view images might be partly overlapping due to a combination of fall speed and size of the particle. Figure 1a shows an example of non-overlapping particles, whereas, in Fig. 1b, the particles are partly overlapping. In both cases, a manual procedure is carried out for the fall speed determination, which is described in the following.
At least two points of the particle need to be selected, for instance, the left and right edges of the particle (P1 and P3 in Fig. 1, right). The same points are found by eye on the second exposure (P2 and P4 in Fig. 1, right). The falling distance is then the average of the Euclidean distances between P1 and P2, and between P3 and P4, and the fall speed is this falling distance divided by the time between exposures. These fall speeds are reported as they are measured at our local conditions and are not corrected to, for example, sea level pressure, which would only change values by less than 3 %.
By selecting at least two points on each particle to determine fall speed, one can notice differences of the fall speed across the particle. If there is no difference, then the particle is falling straight. If there is a difference, then the particle is tumbling; i.e., it has a rotating motion in addition to the straight falling motion. Tumbling is most noticeable if the rotation is around an axis perpendicular to the imaging plane.
When rotating around an axis parallel to the imaging plane, it may be challenging to select the same points on the second exposure. Particle images where it is difficult to identify the same points on both exposures, or when significant tumbling is apparent, are excluded. The tumbling limit is when the speed of the points differs by more than ±10 % from the mean speed. However, tumbling is not observed frequently in our dataset. Figure 2 shows different side-view images of particles included and excluded from the analysis, respectively. In Fig. 2a–d, the particles are not, or are only slightly, tumbling, and therefore they are included in the analysis. In Fig. 2e–h, the particles are tumbling significantly. Consequently, these particles were discarded and not included in the analysis.
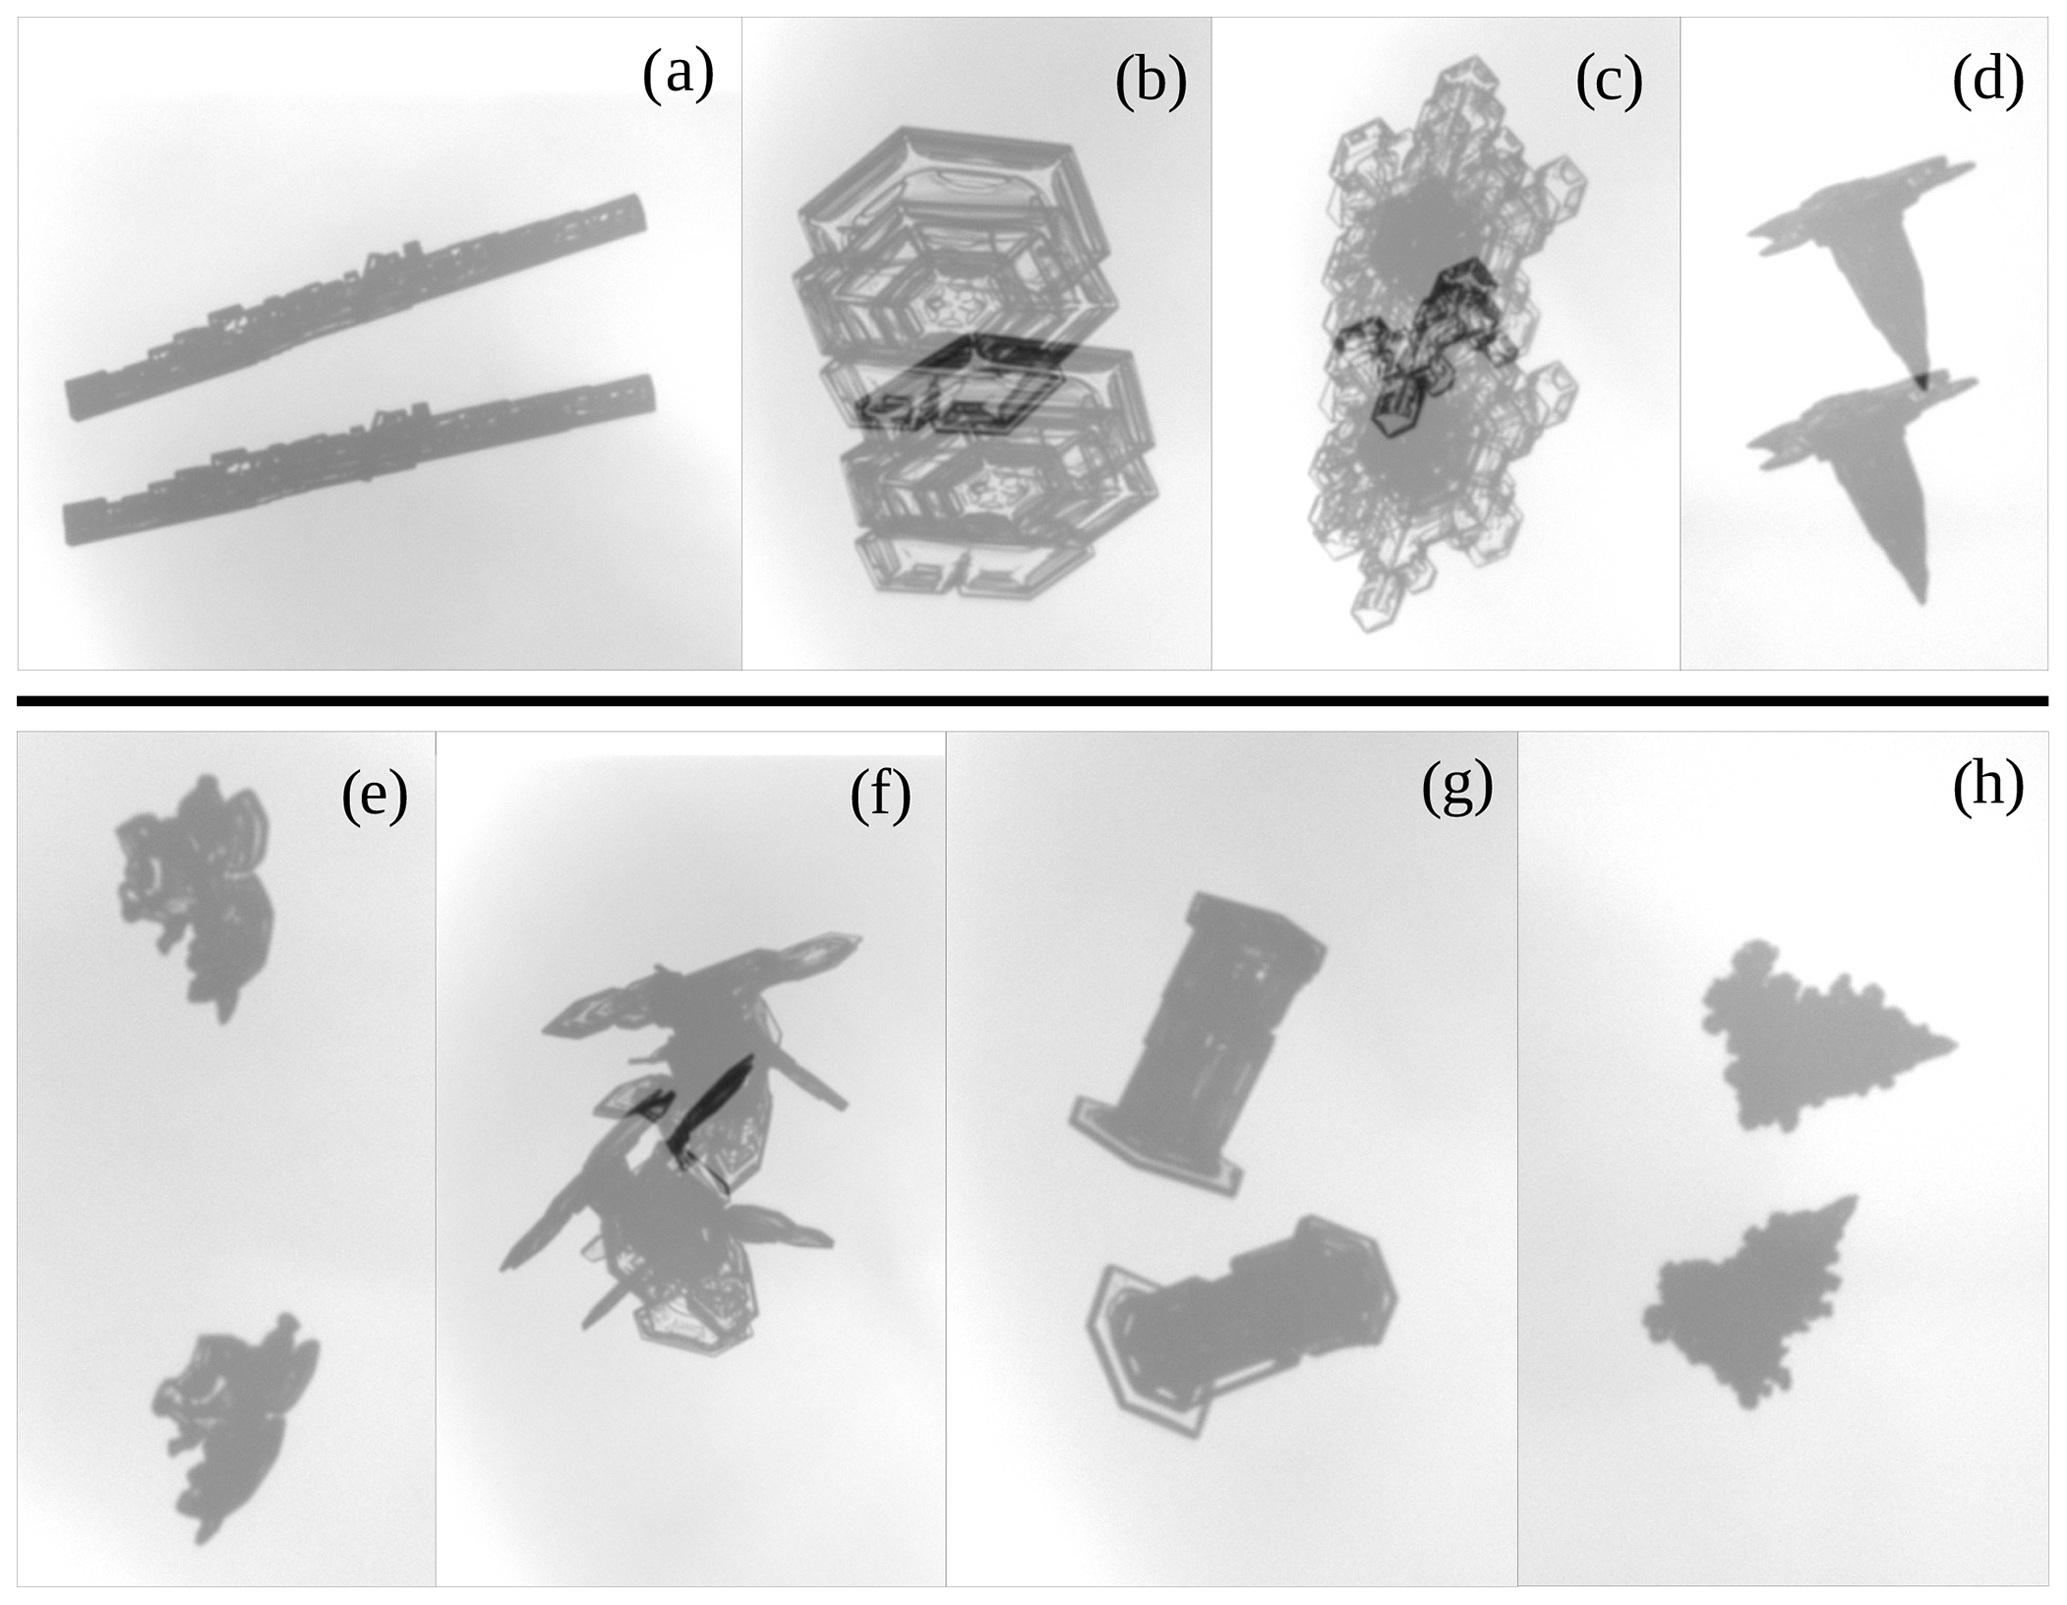
Figure 2 Panels (a)–(h) show eight examples of different particles with side-view images. Panels (a)–(d) show particles that were included in the analysis. Panels (e)–(h) show particles that were excluded since the two-particle exposures revealed significant tumbling.
3.1 Cross-sectional area
For this study, we use a large subset of the data from Vázquez-Martín et al. (2020). Although we excluded measurements with higher wind speeds than 3 m s−1, the cross-sectional areas as a function of particle size are nonetheless very similar here to results presented in Vázquez-Martín et al. (2020). However, for completeness, we briefly analyze and discuss the cross-sectional area vs. particle size, A vs. Dmax, for all the shape groups in this section. Table 1 shows these results, along with the metadata on the particle groups, including their full names. For simplicity, we will use shorter names from here on (see, e.g., in Table 2). As seen in Table 1, generally, particle size and cross-sectional area are very well correlated (R2>0.7) if expressed by the power law
where the parameter a corresponds to the cross-sectional area at Dmax=1 mm and b is the exponent in the power law.
Table 1Cross-sectional area vs. particle size (A vs. Dmax) relationships fitted to a power law given by Eq. (2) for each shape group and for all data, i.e., for all the particles regardless of shape. The number of particles N, the ranges of Dmax and A (min, max), the parameters a and b with their respective uncertainties, and the correlation coefficients R2 are shown for each shape group and all data. The root-mean-square error (RMSE) values of base-10 logarithms of measured A vs. predicted A are also shown to indicate the uncertainty of these power laws. Note that RMSE values of logarithms of Ar as determined from measurements using Eq. (1) vs. predicted values using Eq. (3) are the same.
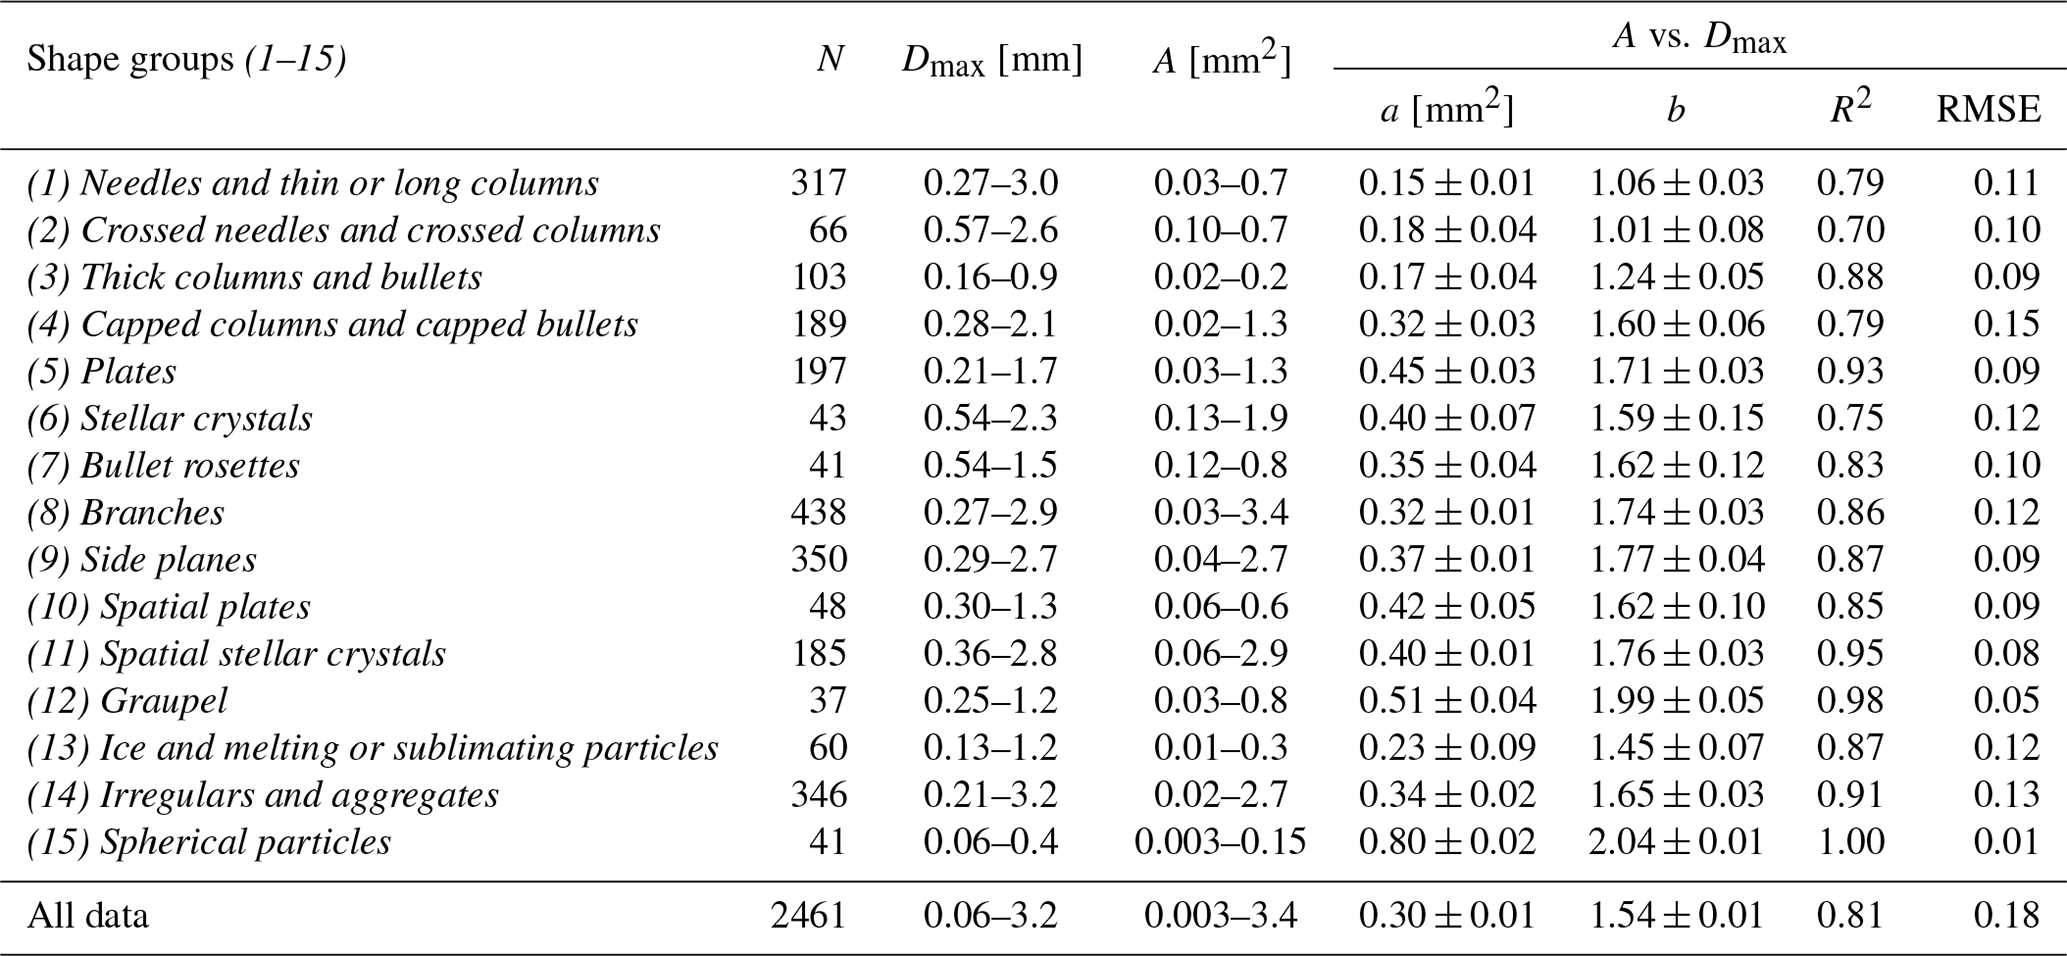
Figure 3 shows these fitted A vs. Dmax relationships. We note that shape groups (1) Needles, (2) Crossed needles, and (3) Thick columns are the groups with the lowest values of parameter b that are close to 1. For these groups, this is understandable from their morphology. An increase in A primarily follows an increase in Dmax (needle length), rather than in both Dmax and the diameter (needle width). The low values of b also explain why the area ratio, Ar, decreases most rapidly with increasing Dmax for these shape groups, which can be seen if one expresses Ar as a power law in Dmax (inserting Eq. 2 into 1),
as the exponent in this power law is b−2. It is also evident in Fig. 4, which shows these power laws for all shape groups determined from Eq. (3), and the coefficients given in Table 1.
For most other shape groups, the coefficient b varies between 1.4 and 1.8. Only for the groups (12) Graupel and (15) Spherical is it larger with b= 2.0, which is the expected theoretical value for spherical shapes. Thus, apart from (15) Spherical, (12) Graupel is the only shape group where Ar remains constant with increasing Dmax.
The fitted relationships for all particles (regardless of shape) also appear in Figs. 3 and 4 for A vs. Dmax and Ar vs. Dmax, respectively. They represent a kind of average; however, they do not seem to be a good approximation for most of the shapes.
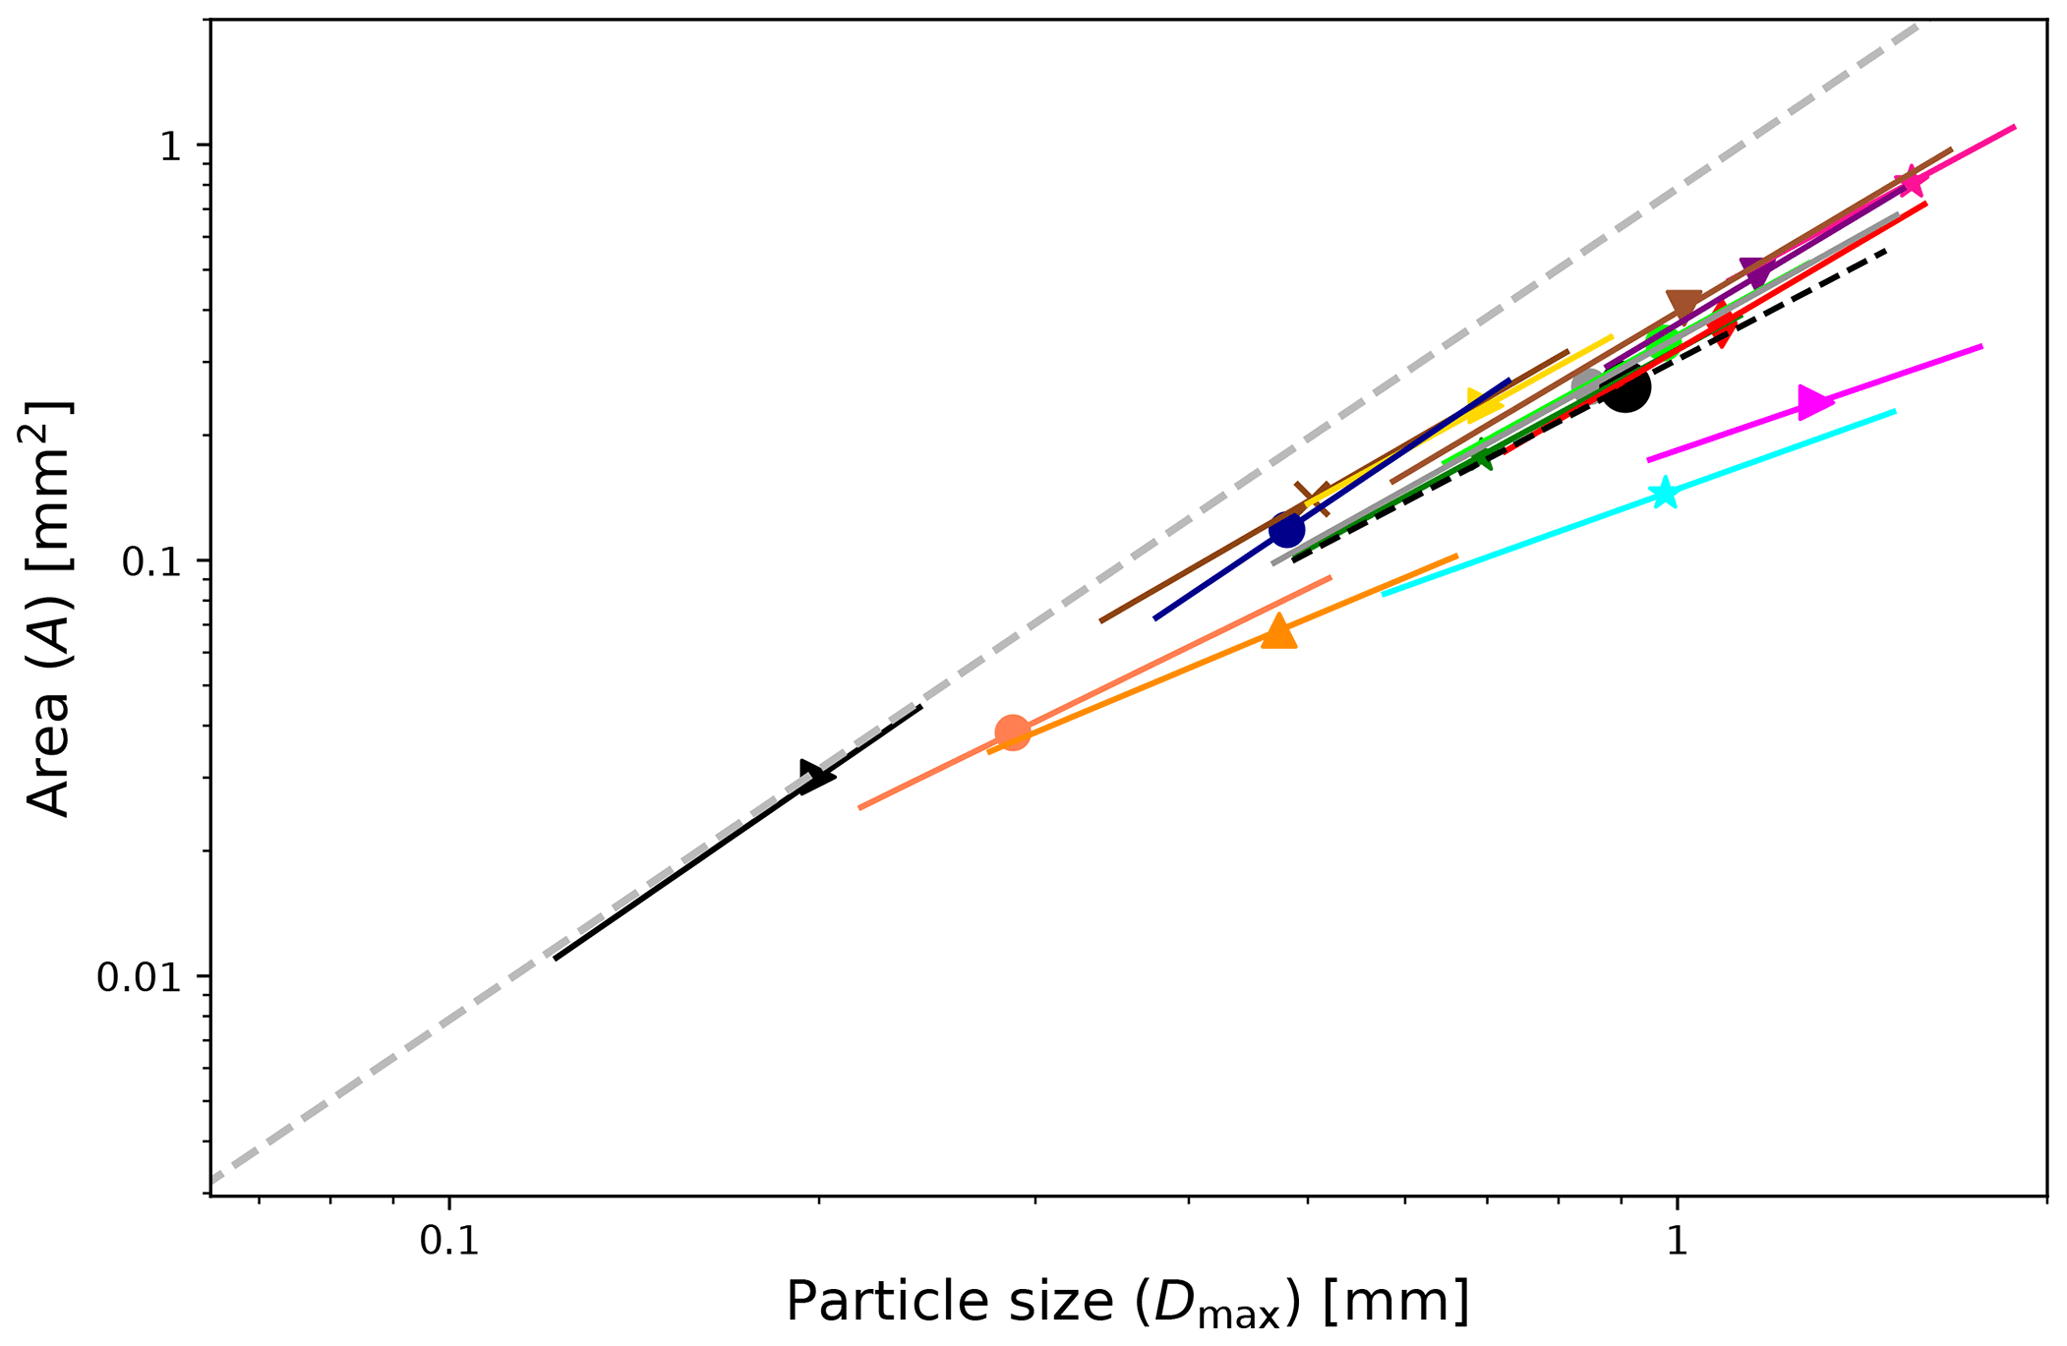
Figure 3 Cross-sectional area vs. particle size (A vs. Dmax) relationships are shown in logarithmic scale for all the shape groups (solid lines) and all data (dashed black line). The median Dmax of the data is represented as a single point on each line. The length of the fit lines is defined by 16th and 84th percentiles of Dmax. For a legend of the shape groups, see Fig. 5. For comparison, the cross-sectional area of spheres given by is shown as a dashed gray line.
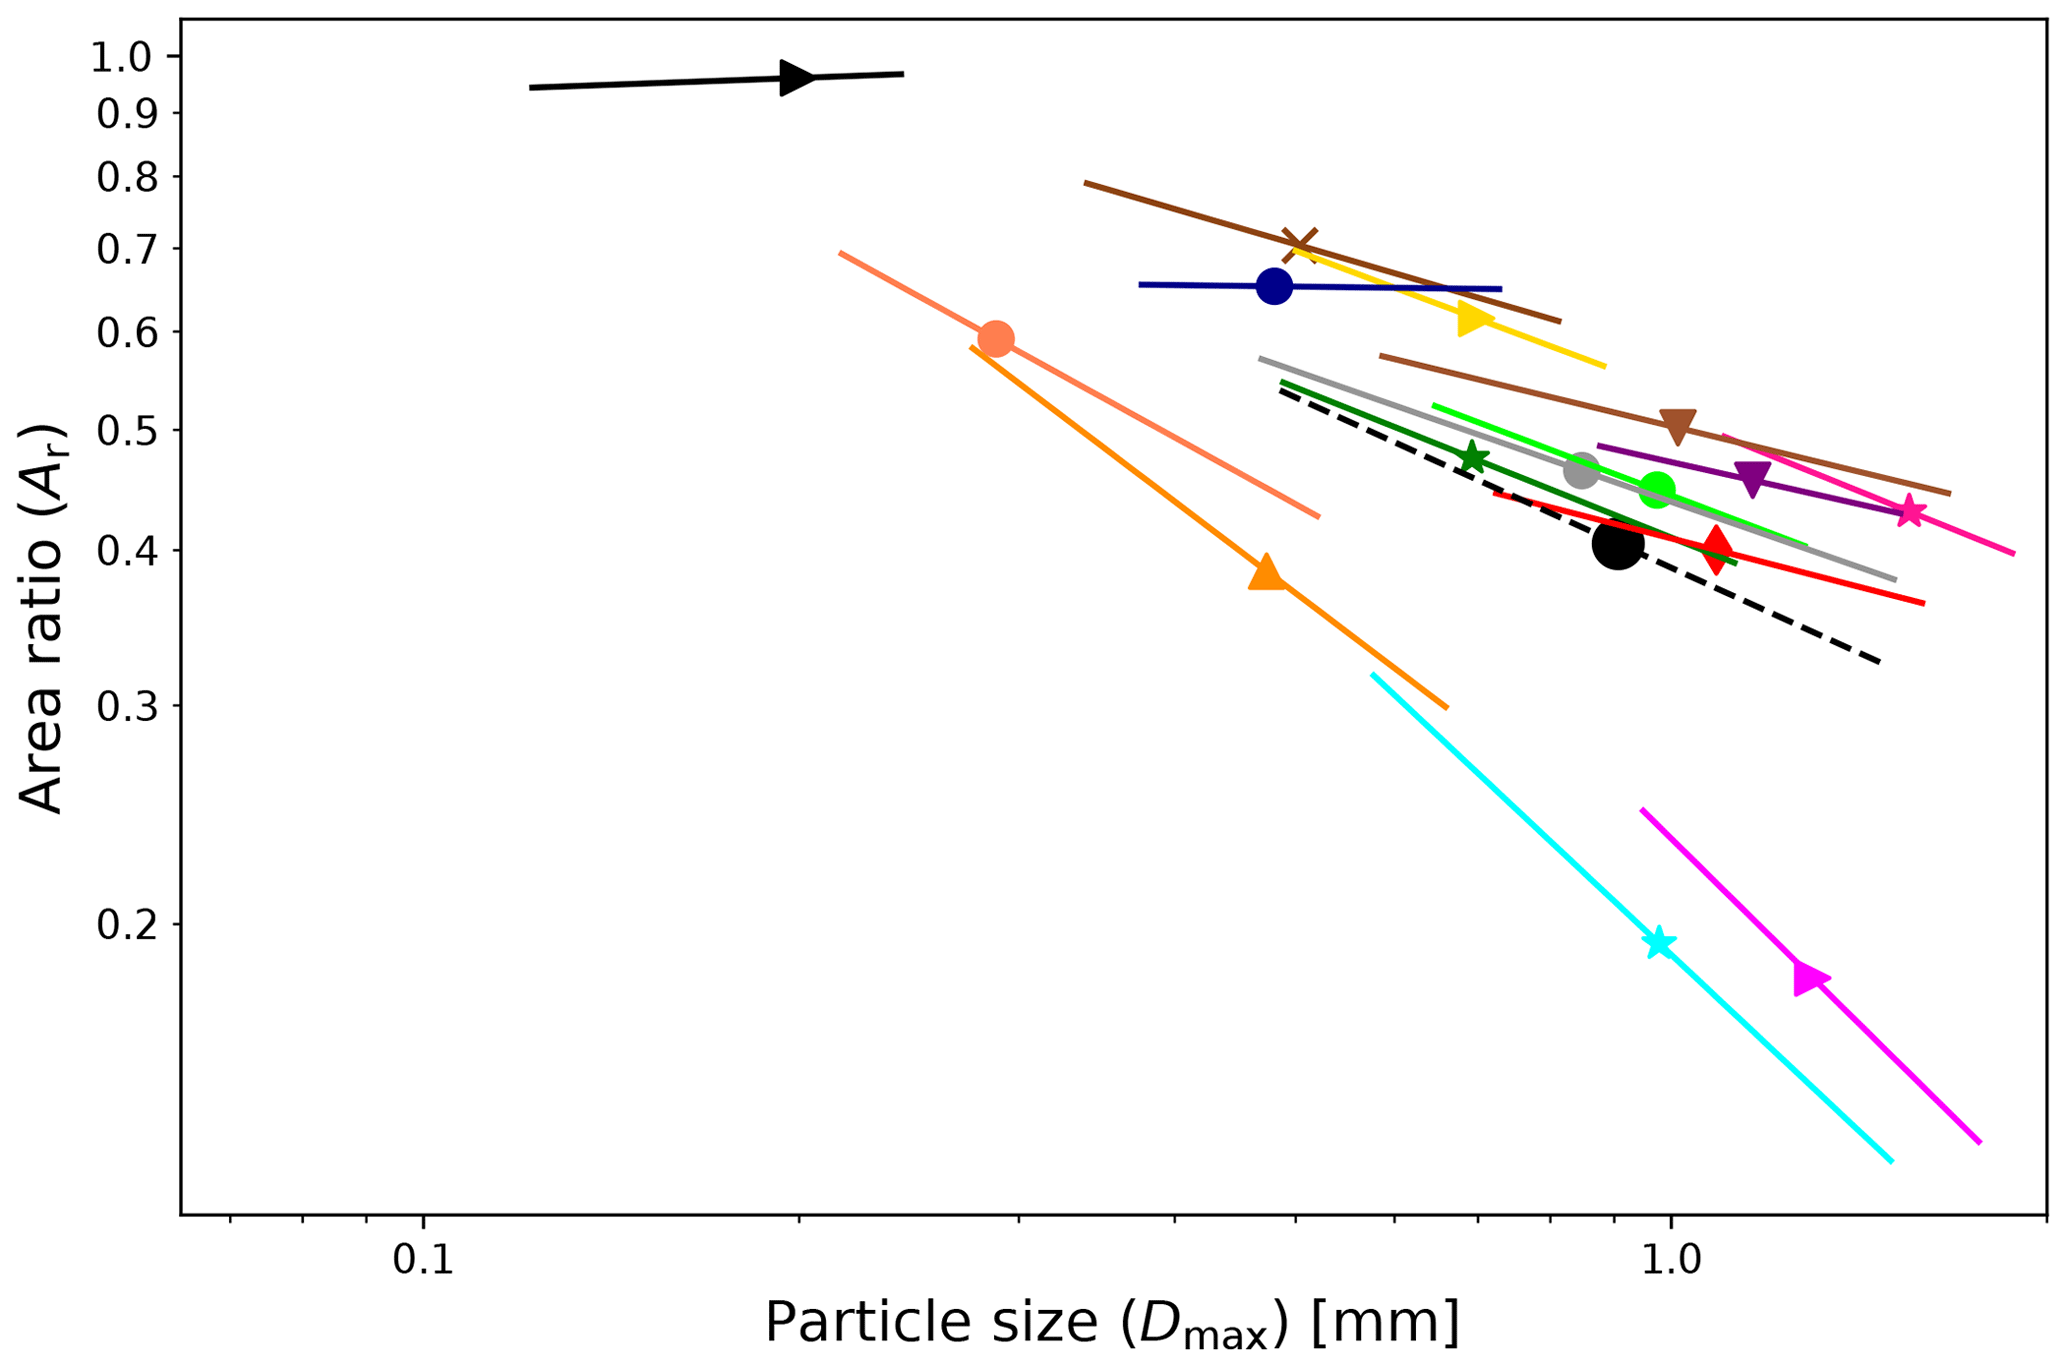
Figure 4 Area ratio vs. particle size (Ar vs. Dmax) relationships are shown in logarithmic scale for all the shape groups (solid lines) and all data (dashed black line). The median Dmax of the data is represented as a single point on each line. The length of the fit lines is defined by 16th and 84th percentiles of Dmax. For a legend of the shape groups, see Fig. 5.
3.2 Fall speed relationships
Analysis of the shape dependence of fall speed (see Fig. 5) shows that shape groups (7) Bullet rosettes and (12) Graupel have the fastest fall speeds with a median value of v≃0.6 m s−1, followed by shape groups (4) Capped columns, (9) Side planes, (11) Spatial stellar, (14) Irregulars, and (15) Spherical with a median fall speed value of v≃0.5 m s−1. The median of all data is approximately 0.43 m s−1, and most shape groups have their median within ±0.08 m s−1 from this value. Shape groups (1) Needles, (2) Crossed needles, and (3) Thick columns have the lowest median values of 0.34 m s−1 or less.
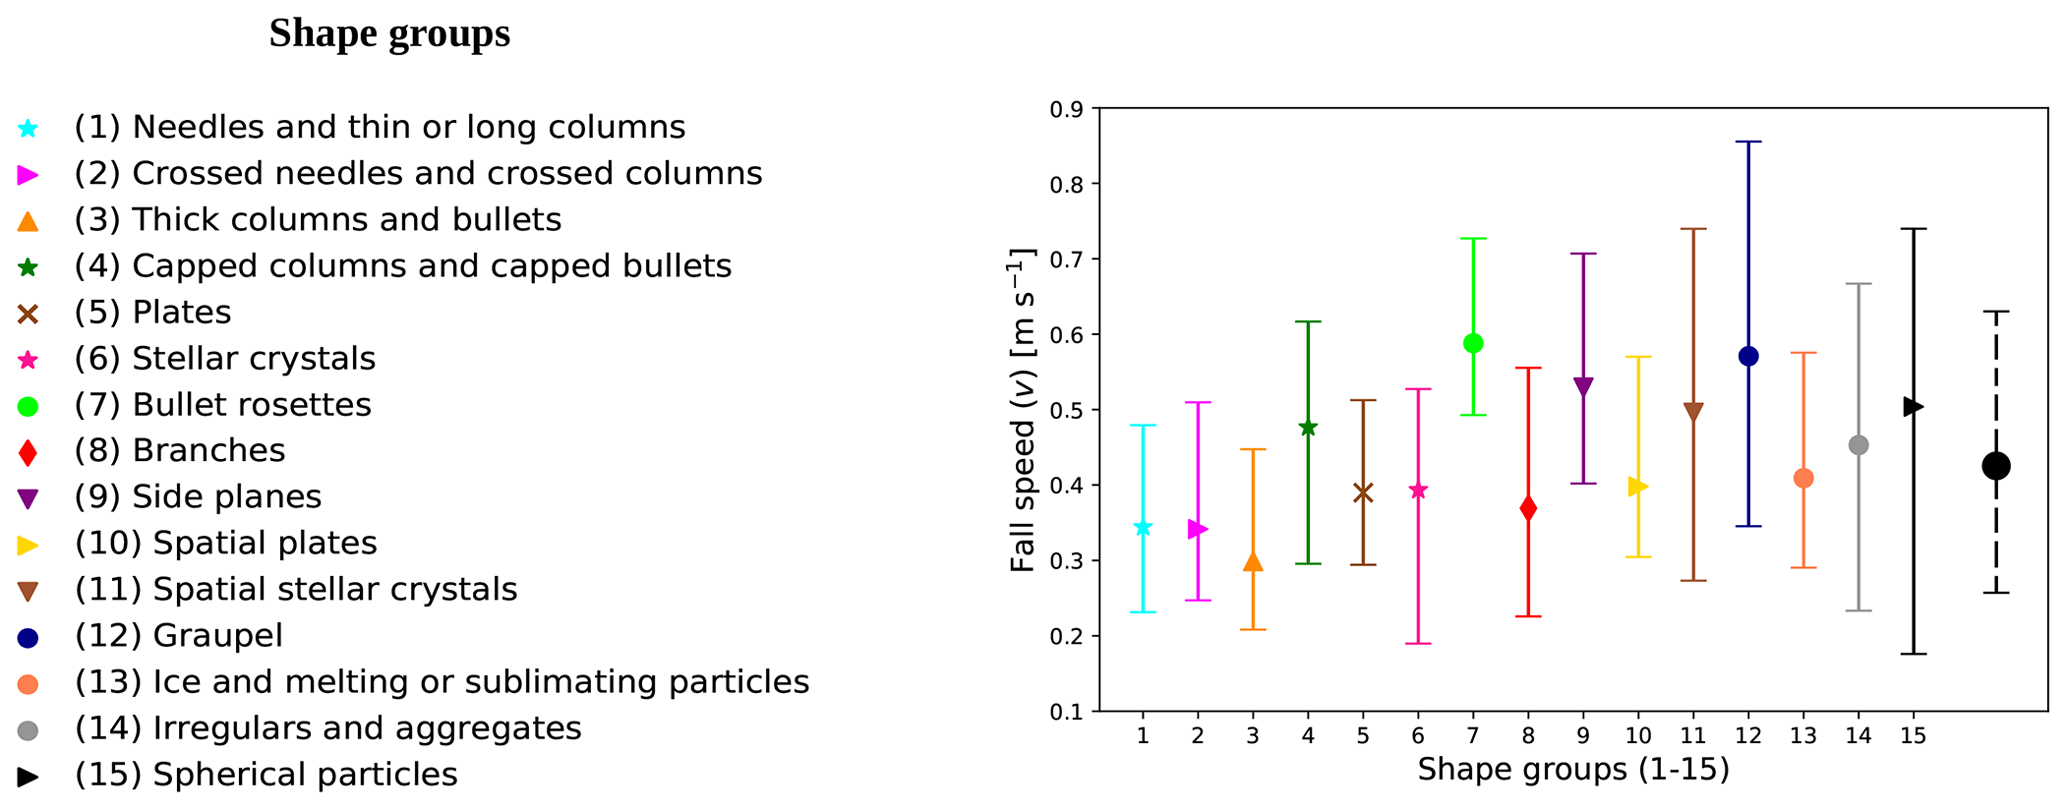
Figure 5The fall speeds v of snow crystals for each shape group are shown in solid lines. The median and the distribution of v are shown. The values of the median are represented by points. The lower and upper ends of the vertical bars indicating the distributions are given by the 16th and 84th percentiles, respectively. These bounds would correspond to ±1σ (standard deviation) if the distribution was normal. For comparison, a dashed black line shows all data (regardless of shape). Table 2 contains a list of these percentiles and medians.
3.2.1 Fitting to individual data: Ma
Fall speed vs. particle size (v vs. Dmax) and fall speed vs. cross-sectional area (v vs. A) relationships are useful to parameterize fall speed. In order to find the v vs. Dmax relationships on the data, one can apply a power-law fit given by
The parameters aD and bD are determined from linear fits to the data expressed as logarithm of v vs. logarithm of Dmax. The v vs. A relationships result from fitting data to a power law given by
The parameters aA and bA are determined from linear fits to the data expressed as log (v) vs. log (A). This method of fitting to individual data is further referred to as Ma. As an example, we look at shape group (5) Plates, representing a commonly occurring shape that has clear results. The individual data points of the measured fall speeds appear in Fig. 6. It also shows the 68 % prediction band, which describes the region of where to expect 68 % of any new measurements. The prediction band can be considered a measure of the spread of the data around the fit line, which appears in the same color as the individual data points.
Table 2Fall speed, v, for the shape groups. The fall speed range, median, and 16th and 84th percentiles are displayed. For comparison, results for all the data, regardless of shape, are also shown.


Figure 6 Fall speed vs. particle size (v vs. Dmax) and fall speed vs. cross-sectional area (v vs. A) relationships for shape group (5) Plates. Individual data (brown symbols) and binned data (blue symbols with error bars) are displayed. Median values in the respective bins represent the binned data. The total length of the error bars represents the spread in fall speed data, which is given by the difference between the 16th and 84th percentiles. Fits that apply to individual data (Ma) and to binned data (Mb) are shown for comparison. The 68 % prediction bands for both fits (Ma, Mb) are shown. The 68 % confidence region is shown for Mb. (a) v vs. Dmax relationship given by Eq. (4). (b) v vs. A relationship given by Eq. (5). The same data are shown in Table 3 for v vs. Dmax and in Table 4 for v vs. A.
The large spread in fall speed apparent from Fig. 6 results in a low correlation to the fit functions. The results for this shape group represent the general features found in all shape groups, i.e., a large spread in fall speed data and relatively low R2 for Ma. The v vs. Dmax and v vs. A relationships for all the shape groups are shown in Figs. A1–A2 (see Appendix A). Tables 3 and 4 show these results for v vs. Dmax and for v vs. A, respectively. The only exceptions from the generally low correlations are shape groups (11) Irregulars, (12) Graupel, and (15) Spherical with R2>0.5. For all other shape groups, the correlation coefficients for Ma are R2≲0.2 for both v vs. Dmax and v vs. A. Judging by these low R2 values, it is uncertain if the fit functions are representative of the measured data.
3.2.2 Fitting to binned data: Mb
The spread of fall speed data is due to several factors such as particle orientation and specific shape, and binning the data should reduce the spread to some extent. Therefore, to improve the correlation, the data are first binned into 10 particle size or cross-sectional area bins before fitting to Eqs. (4) and (5), respectively, where each bin contains as close to the same number of particles as possible. Therefore, the bin widths are variable and specific to each shape group and thereby avoid the problem of individual bins having a disproportional effect on the fit. The number of bins (10) is a compromise: a small enough number of bins to contain enough particles per bin and a large enough number of bins to allow for a good fit to the measurements. The binned data consist of the median values in each bin, i.e., median fall speeds vs. median maximum dimensions and median fall speeds vs. median cross-sectional areas. This method of fitting to binned data is further referred to as Mb. The apparent randomness in fall speed, manifested as the wide spread in data, may have several reasons. While instrumental uncertainties and errors introduced by the manual analysis (see Kuhn and Vázquez-Martín, 2020) contribute to the variability, much of the observed randomness is likely inherent to the data. For example, Dunnavan (2021) showed that aggregate snowflakes' fall speed is very sensitive to shape. Other studies have also reported a wide spread and used a similar method of binning fall speed before data fitting (e.g., Barthazy and Schefold, 2006; Zawadzki et al., 2010). Shape and orientation affect the fall speed, since they are responsible for the drag force. Within most shape groups, there is still a wide variety of different shapes. In addition, for any particle shape, the orientation may also contribute to the spread in data.
Since the binned data are based on the individual data, the fits obtained from the binned data (Mb) should be consistent with the fits based on the individual data (Ma). If so, and, in particular, when R2 for Mb is high, the fits are deemed representative of the given shape group. If R2 remains low after binning, it implies that no reliable relationship could be found. This may indicate that no adequate fit exists for that particular shape group, or it may be the consequence of too much spread in the fall speed data obscuring any relationship. For example, Fig. 6 shows the binned data of shape group (5) Plates and the corresponding fit, which closely matches the fit to Ma. After binning, the correlation coefficients, which for clarity are denoted and for the fits to v vs. Dmax and v vs. A relationships, respectively, are much higher with ≃0.88 (Table 3) and ≃0.88 (Table 4). Therefore, for this shape group, the fits Mb can be considered representative.
The method Ma fits agree with Mb fits for all shape groups if considering confidence regions (see Figs. A1 and A2 in Appendix A). To judge if the relationships are reliable or not, the correlation coefficients (v vs. Dmax) and (v vs. A) for Mb will be considered too. They are plotted in Fig. 7, which shows that the correlation coefficients of 7 out of 15 groups improve past 0.5 in Mb for both and (see Tables 3 and 4), including three shape groups with a very high correlation to their fit (both and ), namely groups (5) Plates, (11) Spatial stellar, and (12) Graupel. The other groups with both correlation coefficients and are (7) Bullet rosettes, (8) Branches, (14) Irregulars, and (15) Spherical. For the other eight shape groups, one of or both and remain below 0.5. Therefore, for these groups, no solid relationship could be found for v vs. Dmax, or v vs. A, or both.
3.2.3 Comparing size and cross-sectional area dependencies
For the seven groups with good correlations, and are similar (see also Fig. 7). As discussed in Sect. 3.1, particle size and cross-sectional area are very well correlated, so this is expected. Only for two of the other eight groups are the values of and similar. While for shape group (4) Capped columns binning the data made a similar improvement to both and , increasing the correlation towards 0.5, for (10) Spatial plates, both and remain very low for Mb. For the remaining six groups, there is a noticeable difference between and . On the one hand, shape groups (6) Stellar and (13) Ice particles have improved their correlation coefficients to above 0.5 but without an improvement in . On the other hand, groups (1) Needles, (2) Crossed needles, (3) Thick columns, and (9) Side planes have values that are significantly larger than the respective values. For example, shape group (1) Needles has =0.24 and =0.50, and (3) Thick columns has =0.11 and =0.44. For the groups (2) Crossed needles and (9) Side planes, the difference between and is most pronounced with no improvement in but moderate values for of 0.36 and 0.50, respectively.
The results discussed above show that among these groups with a noticeable difference between and , more have larger (four groups) than larger (two groups); i.e., more have better v vs. A correlation than v vs. Dmax. Particles are falling at a speed for which gravitational and drag forces are in equilibrium; i.e., fall speed depends on mass and drag, which in turn depends on cross-sectional area A and the drag coefficient CD (e.g., Mitchell, 1996). Since drag depends directly on cross-sectional area, one may expect fall speed to depend more on the cross-sectional area than on maximum dimension. Drag, in addition to cross-sectional area, also depends on CD, which is proportional to the particle Reynolds number, which in turn depends on a characteristic length of the particle. For most particle shapes, Dmax may be a good approximation for this characteristic length; hence, fall speed also depends directly on Dmax. However, for some shapes, Dmax may be significantly different from the characteristic length for the Reynolds number, so that fall speed is not necessarily well correlated to Dmax.
For example, for needles or columns, if falling horizontally, this characteristic length is given by the needle's or column's width rather than its maximum dimension Dmax, which is similar to the needle's or column's length. Indeed, the shape groups related to needles and columns, i.e., (1) Needles, (2) Crossed needles, and (3) Thick columns, are among the four groups for which fall speed is better correlated to A than to Dmax. Interestingly, as seen in Sect. 3.1, these three shape groups also have the lowest exponents b for the A vs. Dmax relationships, with values close to 1. Two of these groups, (1) and (2), are also among the four groups with the lowest correlation between A and Dmax (together with shape groups (4) Capped columns and (6) Stellar), indicating again that the differences between and that we see in three of these four groups are not unexpected.
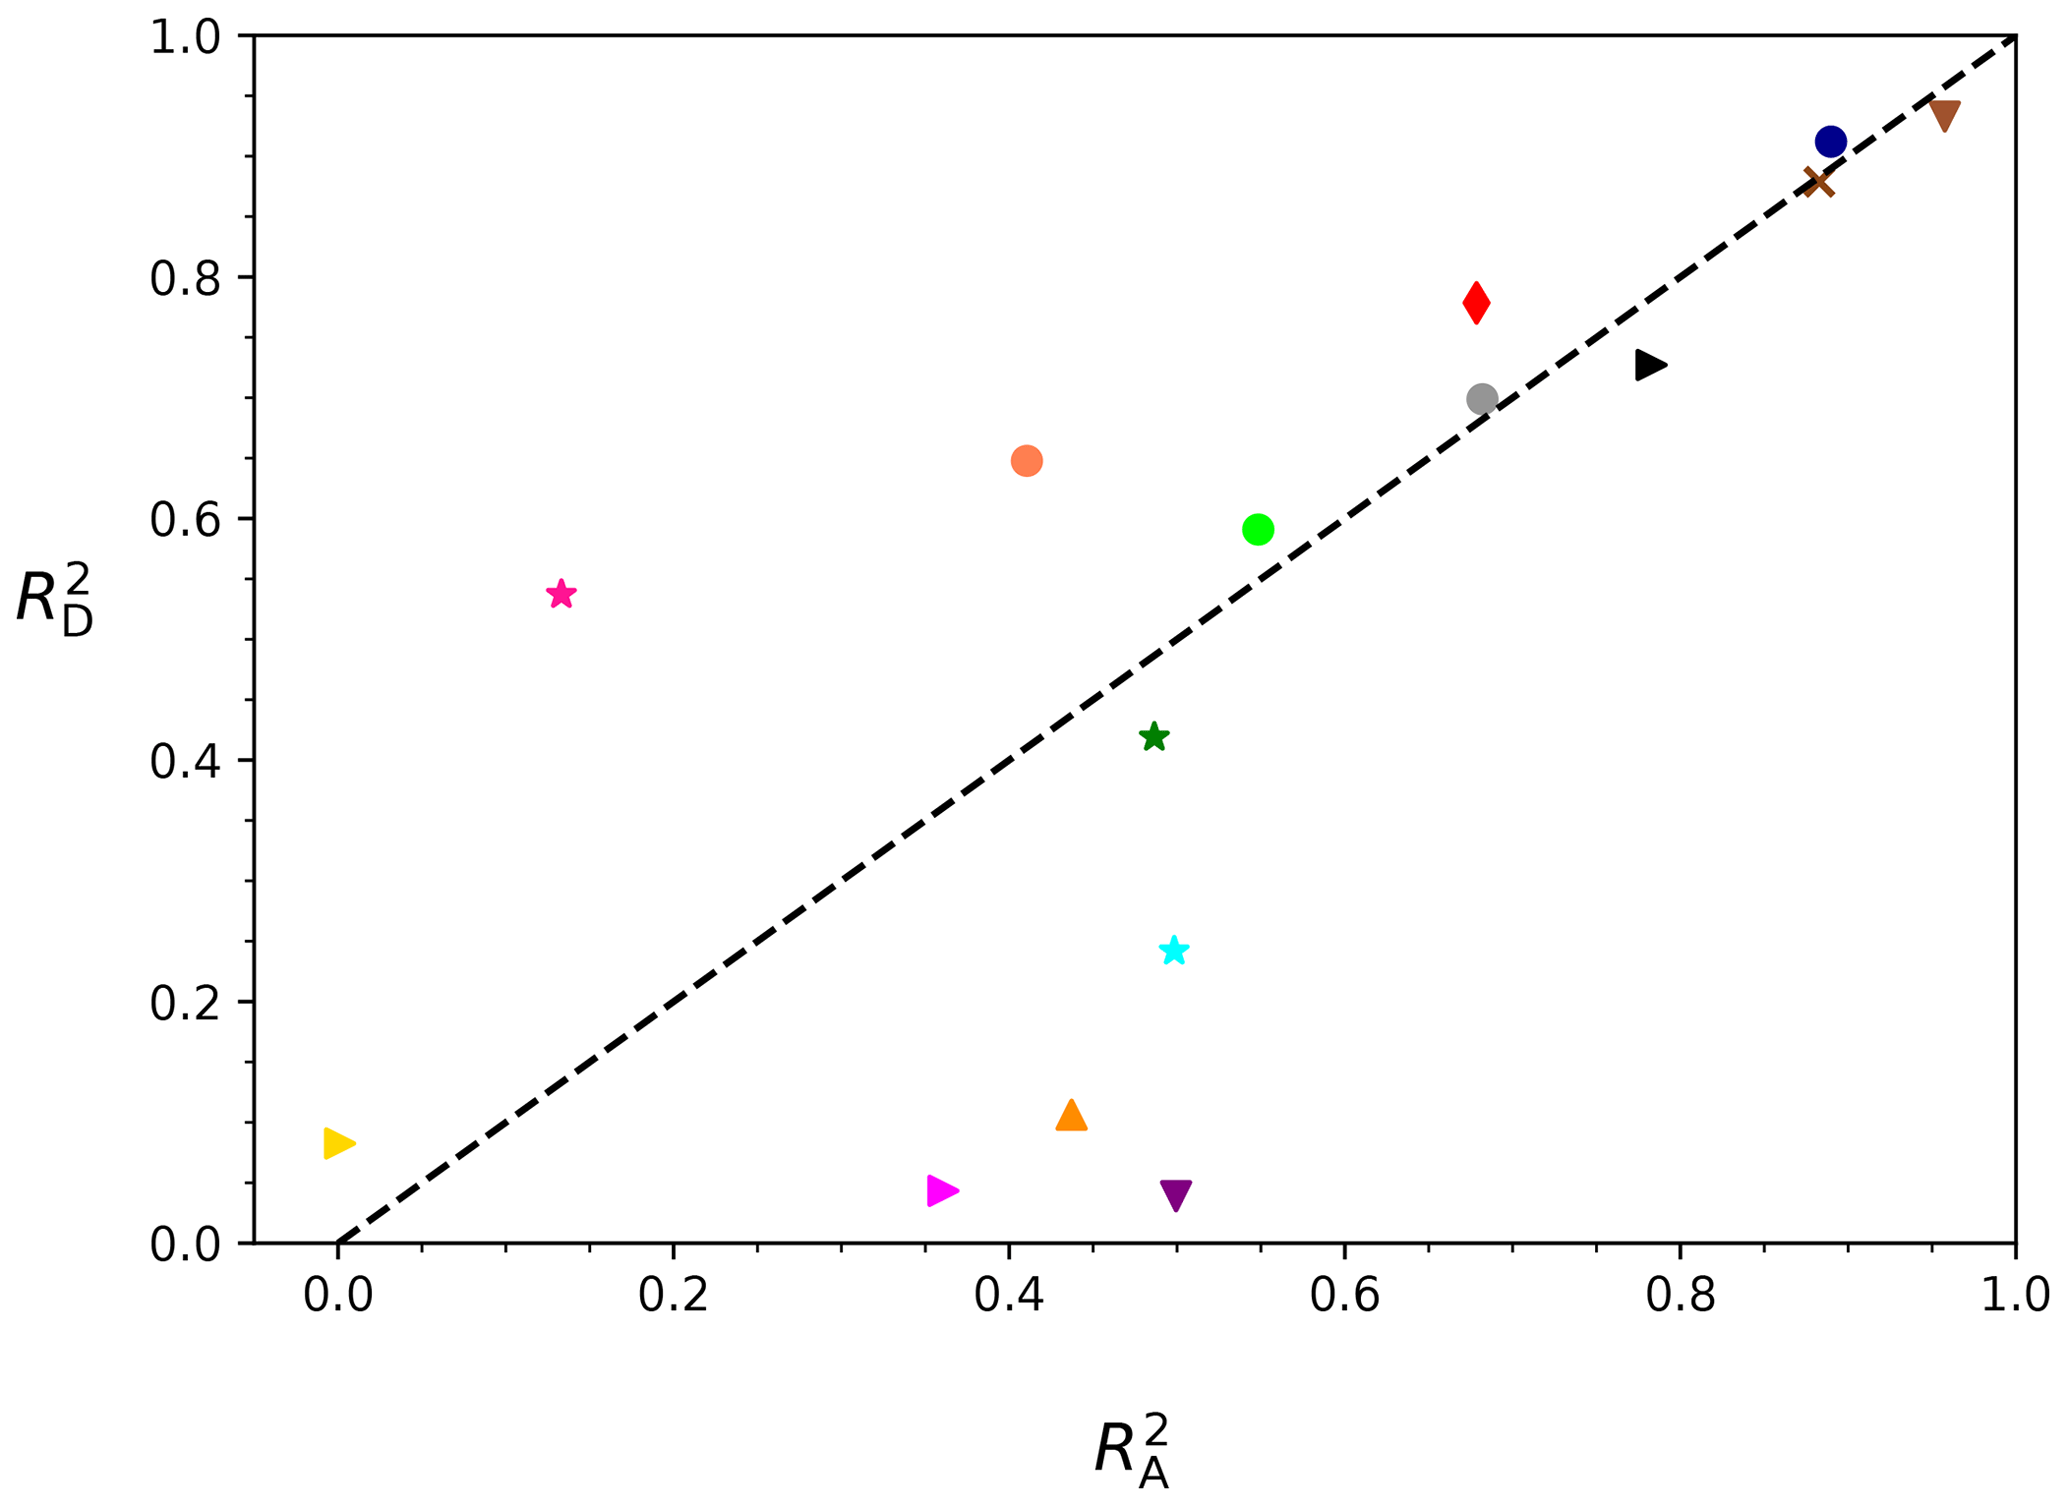
Figure 7The correlation coefficients (v vs. Dmax) and (v vs. A) from Mb are shown for the 15 shape groups. For a legend of the shape groups, see Fig. 5. The dashed black line represents .
Table 3Fall speed vs. particle size (v vs. Dmax) relationships fitted to Eq. (4) for each shape group and all data, i.e., for all the particles regardless of shape. The parameters aD, bD with their respective uncertainties and the correlation coefficients are shown for both methods (Ma and Mb) for each shape group and regardless of shape. The RMSE values of base-10 logarithms of measured v vs. predicted v are also shown to indicate the uncertainty of these power laws.
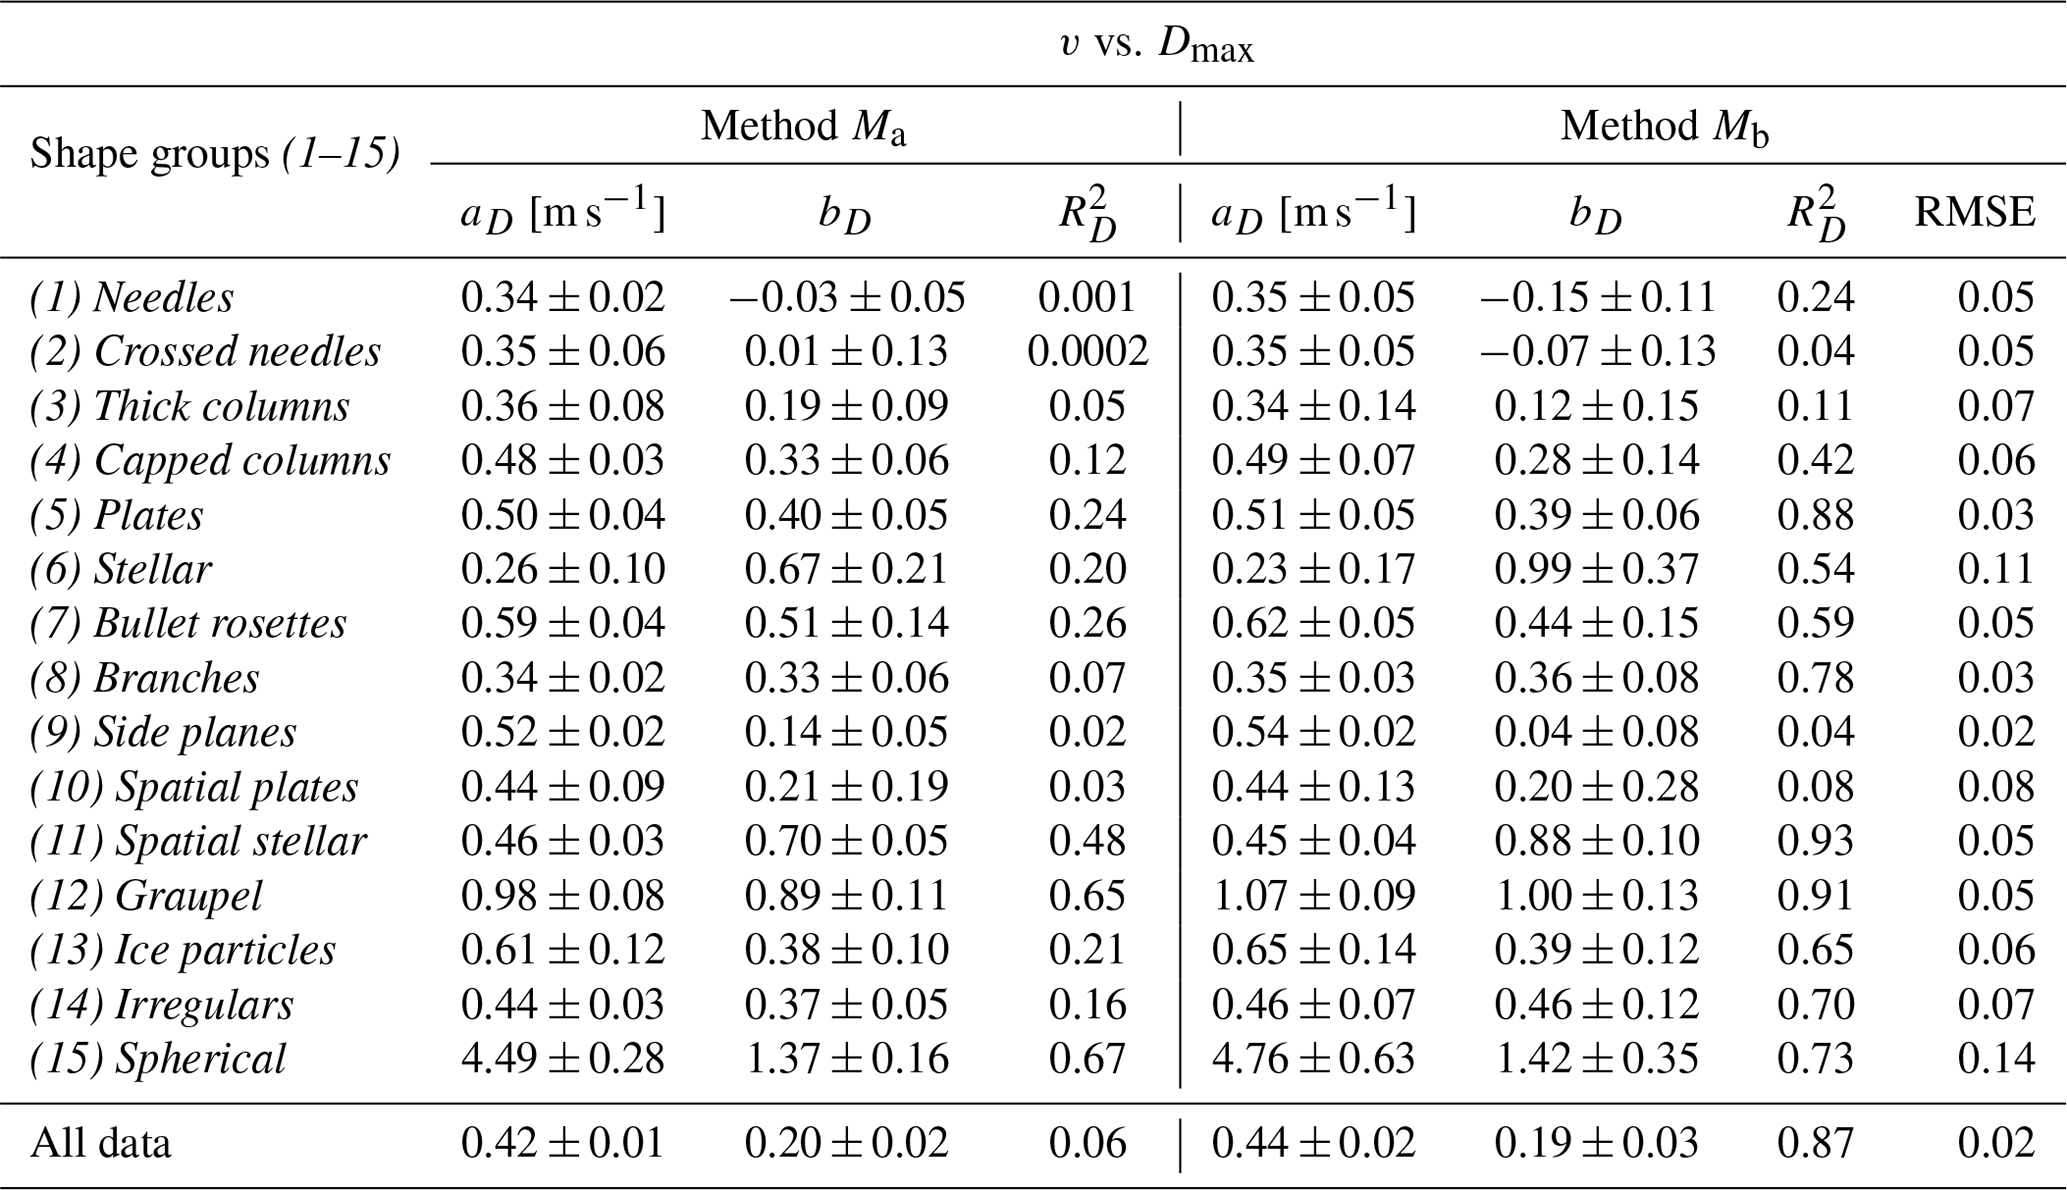
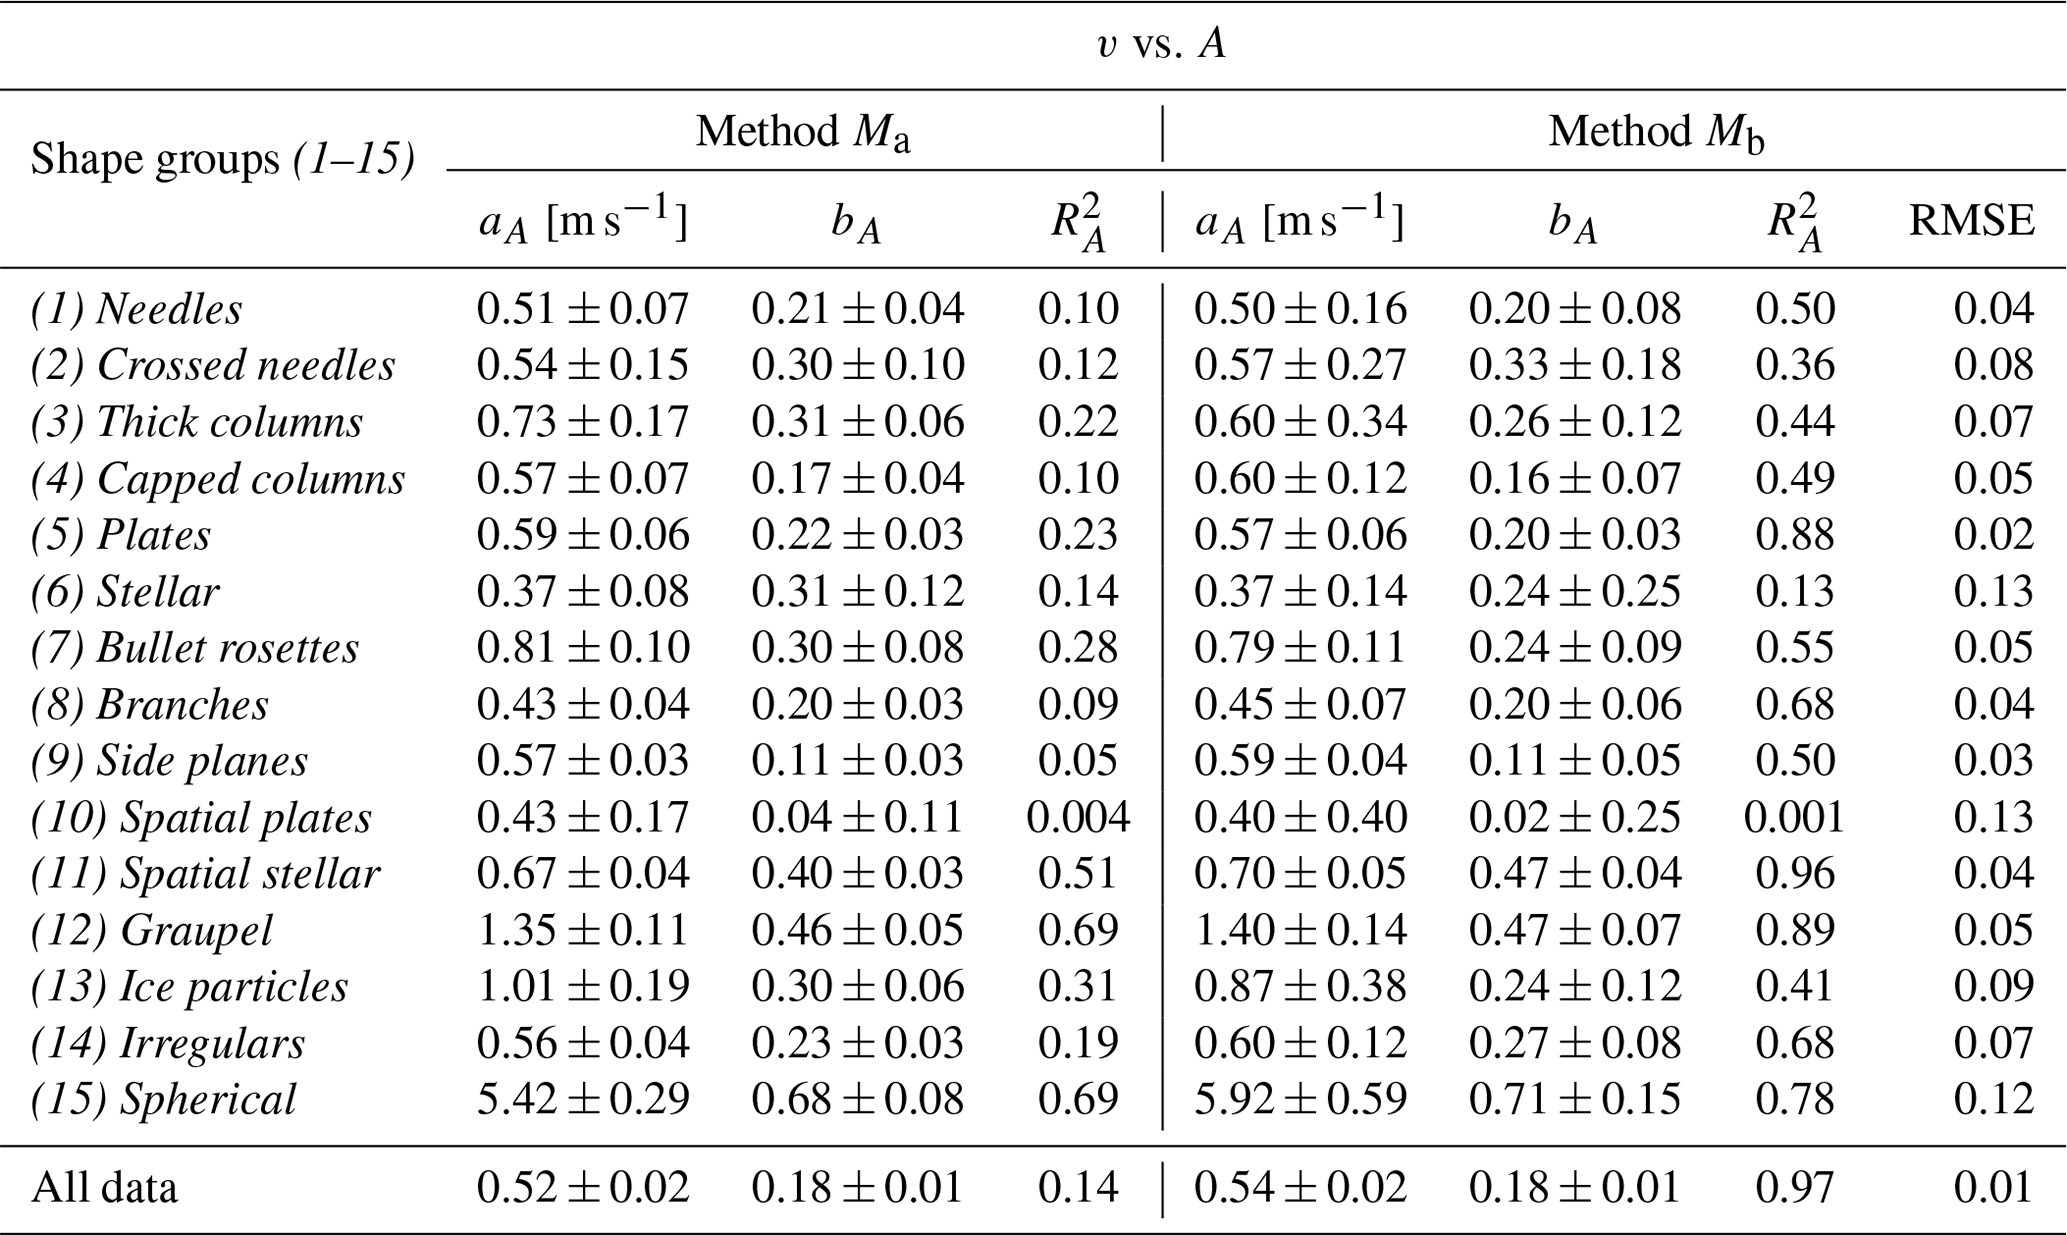
Table 4Fall speed vs. cross-sectional area (v vs. A) relationships fitted to Eq. (5) for each shape group and for all data, i.e., for all the particles regardless of shape. The parameters aA, bA with their respective uncertainties and the correlation coefficients are shown for both methods (Ma and Mb) for each shape group and regardless of shape. The RMSE values of base-10 logarithms of measured v vs. predicted v are also shown to indicate the uncertainty of these power laws.
3.2.4 Representative relationships
Figure 8 shows the fitted v vs. Dmax (left) and v vs. A (right) relationships (from method Mb) as solid lines for the shape groups with relatively good correlations ( or ≳ 0.50, respectively). These are shape groups (5) Plates, (6) Stellar, (7) Bullet rosettes, (8) Branches, (11) Spatial stellar crystals, (12) Graupel, (13) Ice particles, (14) Irregulars, and (15) Spherical for the v vs. Dmax relationships. For the v vs. A relationships, the correlated shape groups are (1) Needles, (4) Capped columns, (5) Plates, (7) Bullet rosettes, (8) Branches, (9) Side planes, (11) Spatial stellar, (12) Graupel, (14) Irregulars, and (15) Spherical. For comparison, the relationships for all shapes combined appear as dashed lines in both figures.
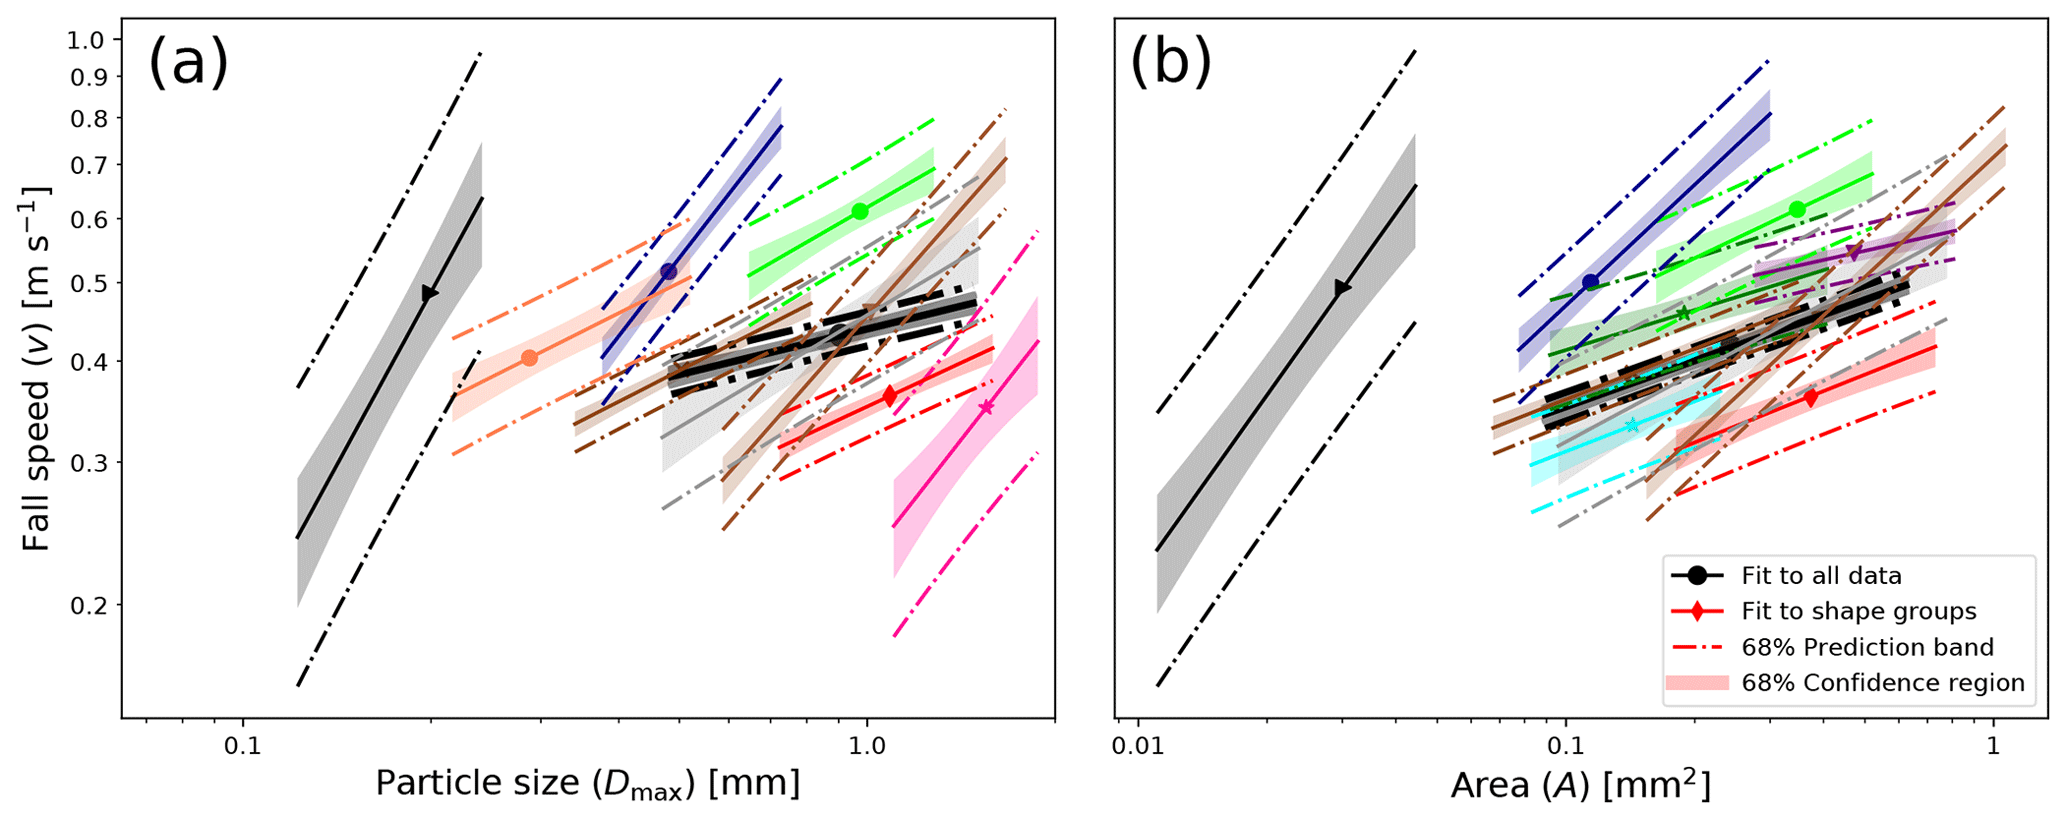
Figure 8Fall speed vs. particle size (v vs. Dmax) and fall speed vs. cross-sectional area (v vs. A) relationships for the shape groups where we have found good correlations (solid lines) and all data regardless of shape (dashed black lines) are shown. The 68 % prediction band and the 68 % confidence region for the fits (Mb) are also shown. For a legend of the shape groups, see Fig. 5. (a) v vs. Dmax relationship. Shape groups (5), (6), (7), (8), (11), (12), (13), (14), and (15) are displayed. The values of the median of Dmax are represented by points. (b) v vs. A relationship. Shape groups (1), (4), (5), (7), (8), (9), (11), (12), (14), and (15) are displayed. The values of the median of A are represented by points. The length of the fit lines is defined by 16th and 84th percentiles of Dmax (a) and A (b). The corresponding data are shown in Tables 3–4.
Given by their compact shape, members of the (15) Spherical group have the largest mass and lowest drag for a given size. Therefore, they will fall faster than any other shape and have the highest slopes, i.e., values for steepest slopes, i.e., highest values of exponents bD and bA. Among all shapes, (12) Graupel is most similar to spherical particles as they often have spheroidal shape. However, their bD (1.0) and bA (0.47) are considerably smaller than those of spheres, though still larger than for any other shape (see Fig. 8 and Tables 3–4).
While two shape groups ((6) Stellar and (11) Spatial stellar) have similarly large values of bD, the relationships shift towards much lower speeds and larger sizes compared to the relationships of shape groups (12) Graupel and (15) Spherical (see Fig. 8). Shape group (11) also has a similarly large value of bA as shape group (12), but again its relationship shifts towards lower speeds and this time larger cross-sectional areas. The other groups with >0.5 have bD values around 0.4, and the other groups with >0.5 have bA values around 0.2 (0.16 to 0.27) except for shape group (9) Side planes, which has the smallest value (0.11).
There seems to be around a factor of 2 between bA and bD. By combining Eqs. (4), (5), and (2), one finds that b should give this factor. As can be seen in Table 1, the coefficient b is for most shape groups between 1.5 and 2. Figure 9 shows the ratios as a function of b, and most ratios on this plot are close to the line . The exceptions are the two shape groups where was larger than ((6) Stellar and (10) Spatial plates), which are found above the line. Group (10) is outside the plot domain since it has an excessively high ratio of 9.37 caused by a very small bD. However, this is probably not meaningful since the correlation is very bad for this group. The four shape groups with larger than ((1) Needles, (2) Crossed needles, (3) Thick columns, and (9) Side planes) are below the line.
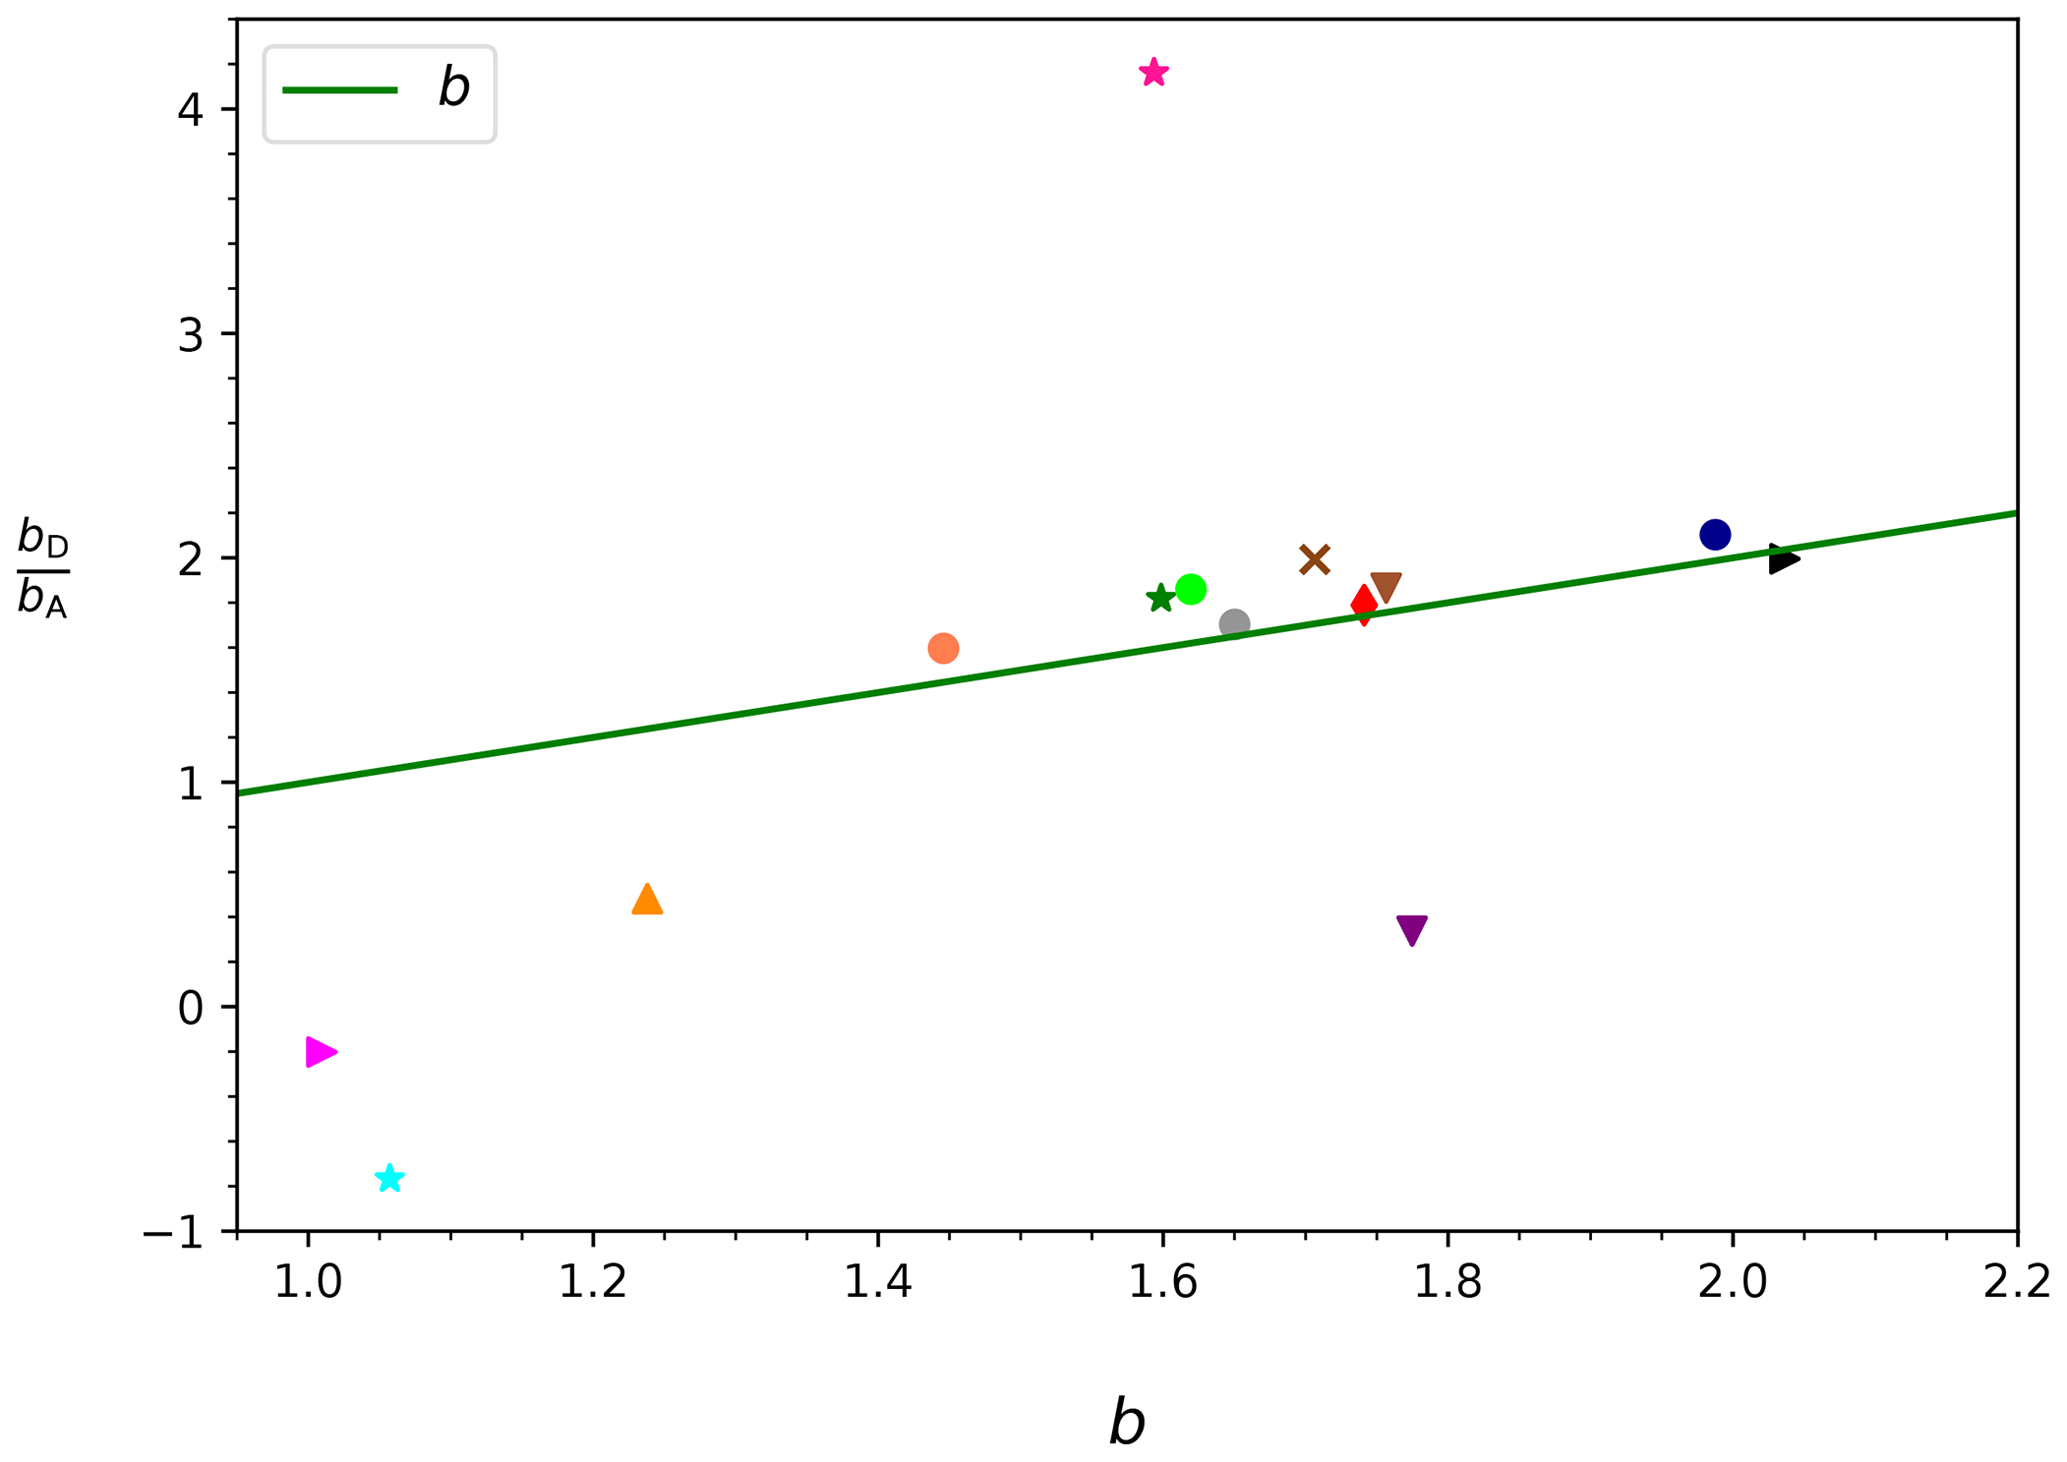
Figure 9Ratio of the coefficients bD and bA from fits (Mb) to v vs. Dmax and v vs. A relationships, respectively, and the coefficient b corresponding to the A vs. Dmax relationship are shown for all the shape groups. The solid green line corresponds to .
3.3 Particle orientation and area ratio
3.3.1 Orientation
For certain shapes, the orientation of the falling particle can considerably change the cross-sectional area seen in the top-view image. Therefore, the particle orientation will influence the drag and thus the fall speed. To test how much this affects our data, particles that clearly show a horizontal or vertical orientation are selected among predominantly elongated particles which are found within the shape group (1) Needles or predominantly planar particles found within one of the (5) Plates and (6) Stellar groups. Particles that are identified by eye as having an orientation angle close to 0∘ are considered horizontal, and conversely, particles with an orientation angle close to 90∘ are considered vertical. The orientation angle is here defined as the angle that the horizontal plane forms with the particle plane, in the case of planar particles, or with the particle axis, in the case of elongated particles. Only a total of 135 particles fulfilled these criteria: 109 with horizontal and 26 with vertical orientation. Figure 10a–f show six examples using side-view images of individual particles with horizontal orientation and six examples (g–l) with vertical orientations.
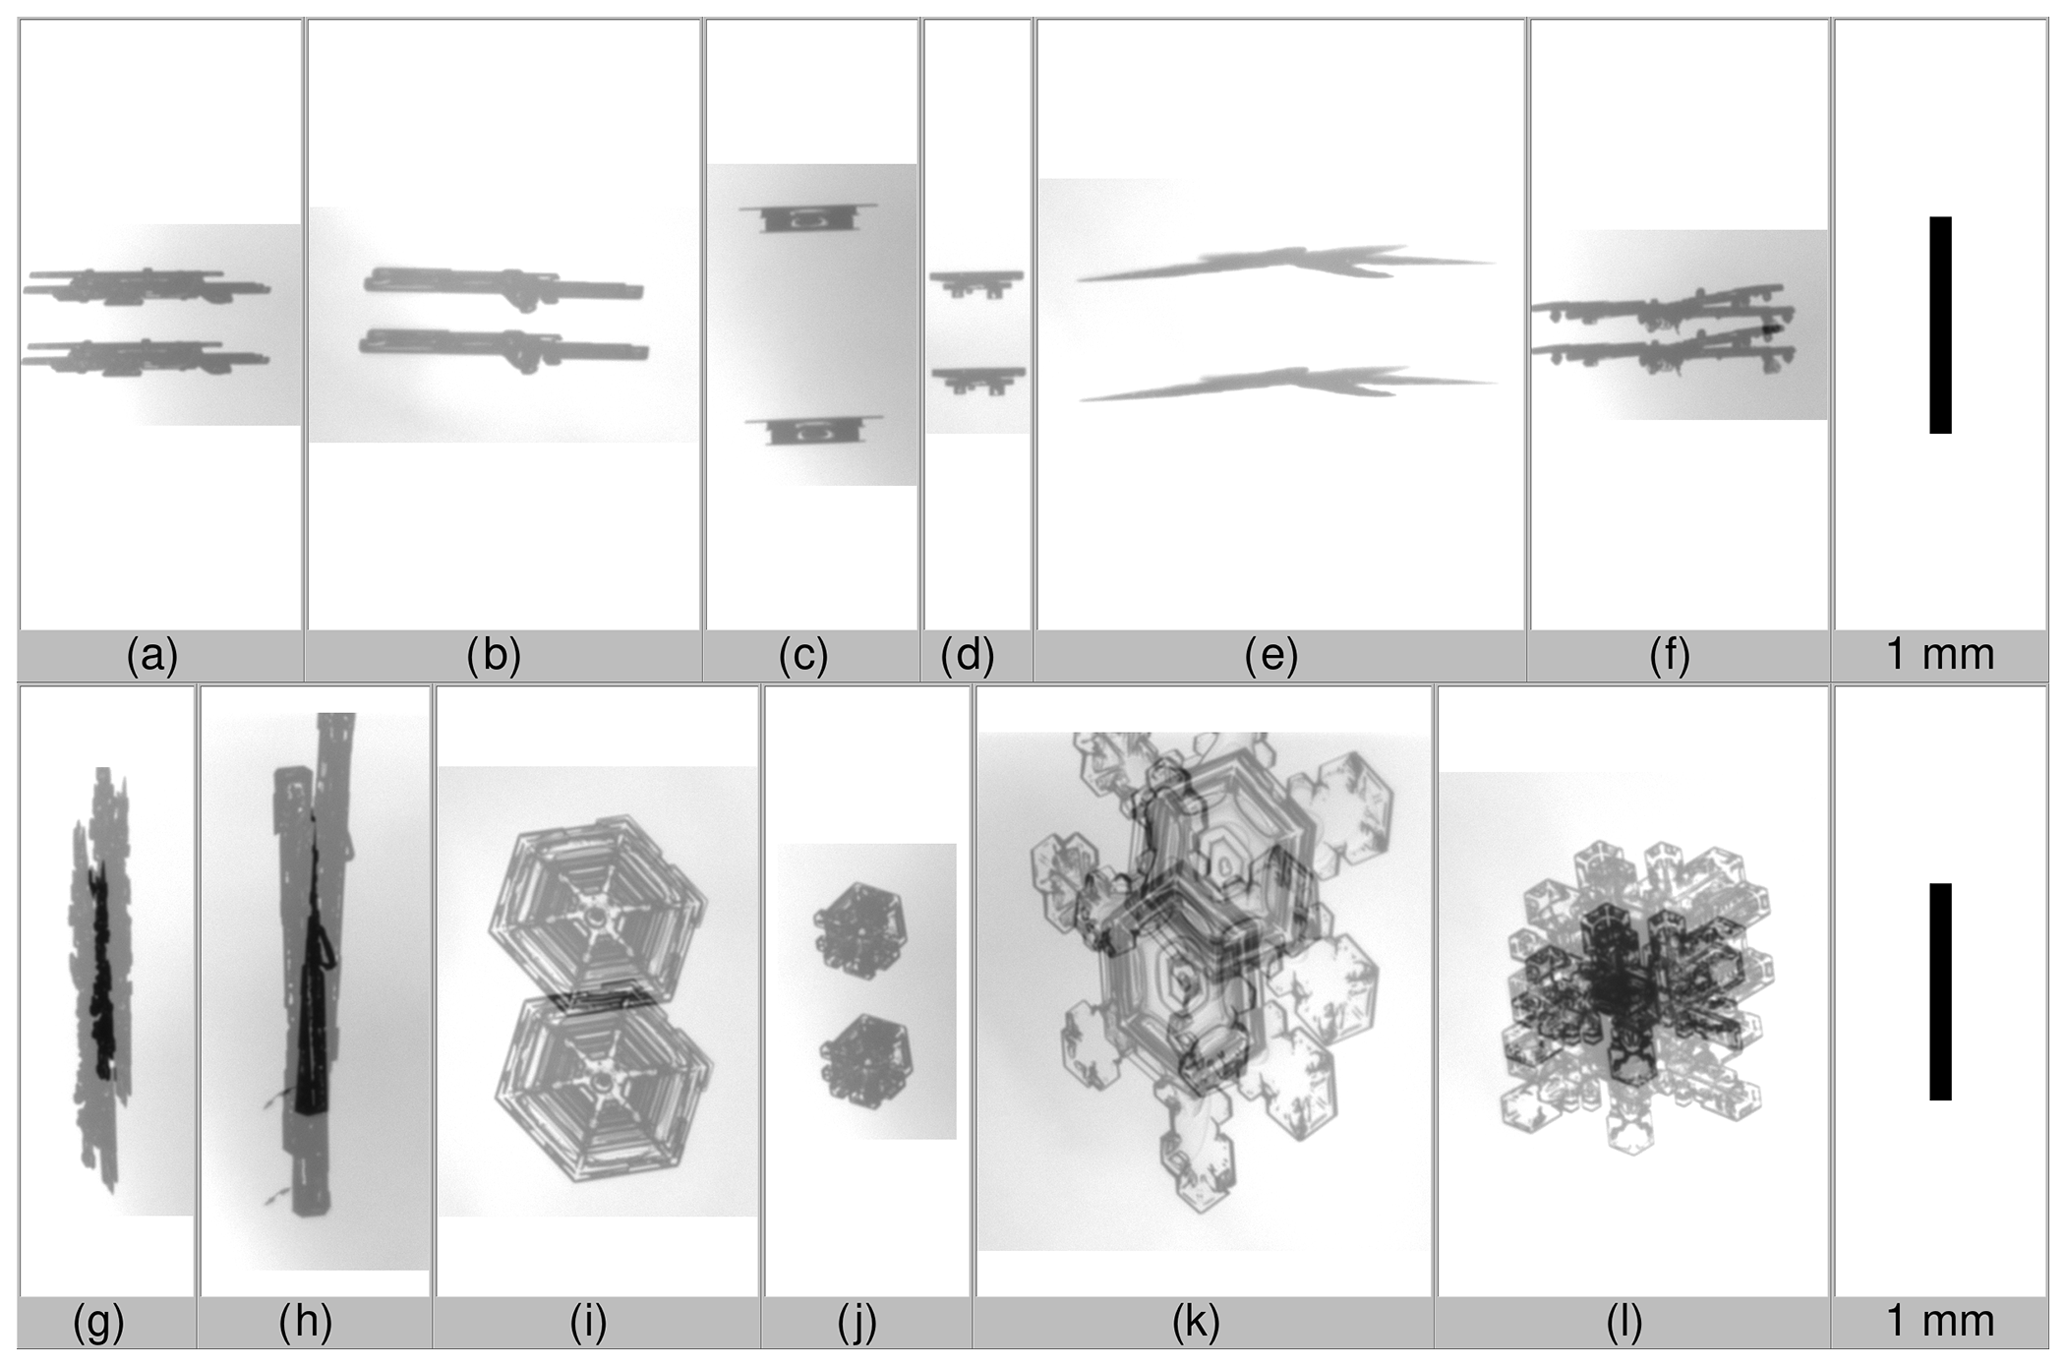
Figure 10 Panels (a)–(f) show six examples using side views of different particles with horizontal orientation, and panels (g)–(l) show six examples using side views of different particles with vertical orientation. These particles have an elongated shape (shape group (1) Needles) and planar shape (shape groups (5) Plates and (6) Stellar). Two examples of each shape group are displayed for both orientations. The same scaling is applied to all images; a 1 mm scale bar is shown for reference.
Figure 11 shows the individual fall speeds of these particles. When trying to fit these data to Eqs. (4) or (5), the correlation coefficients remained very low, and thus no meaningful relationships could be found. However, particles falling with a vertical orientation are slightly faster (with a median v=0.42 m s−1) than the horizontally oriented (with a median v=0.34 m s−1).
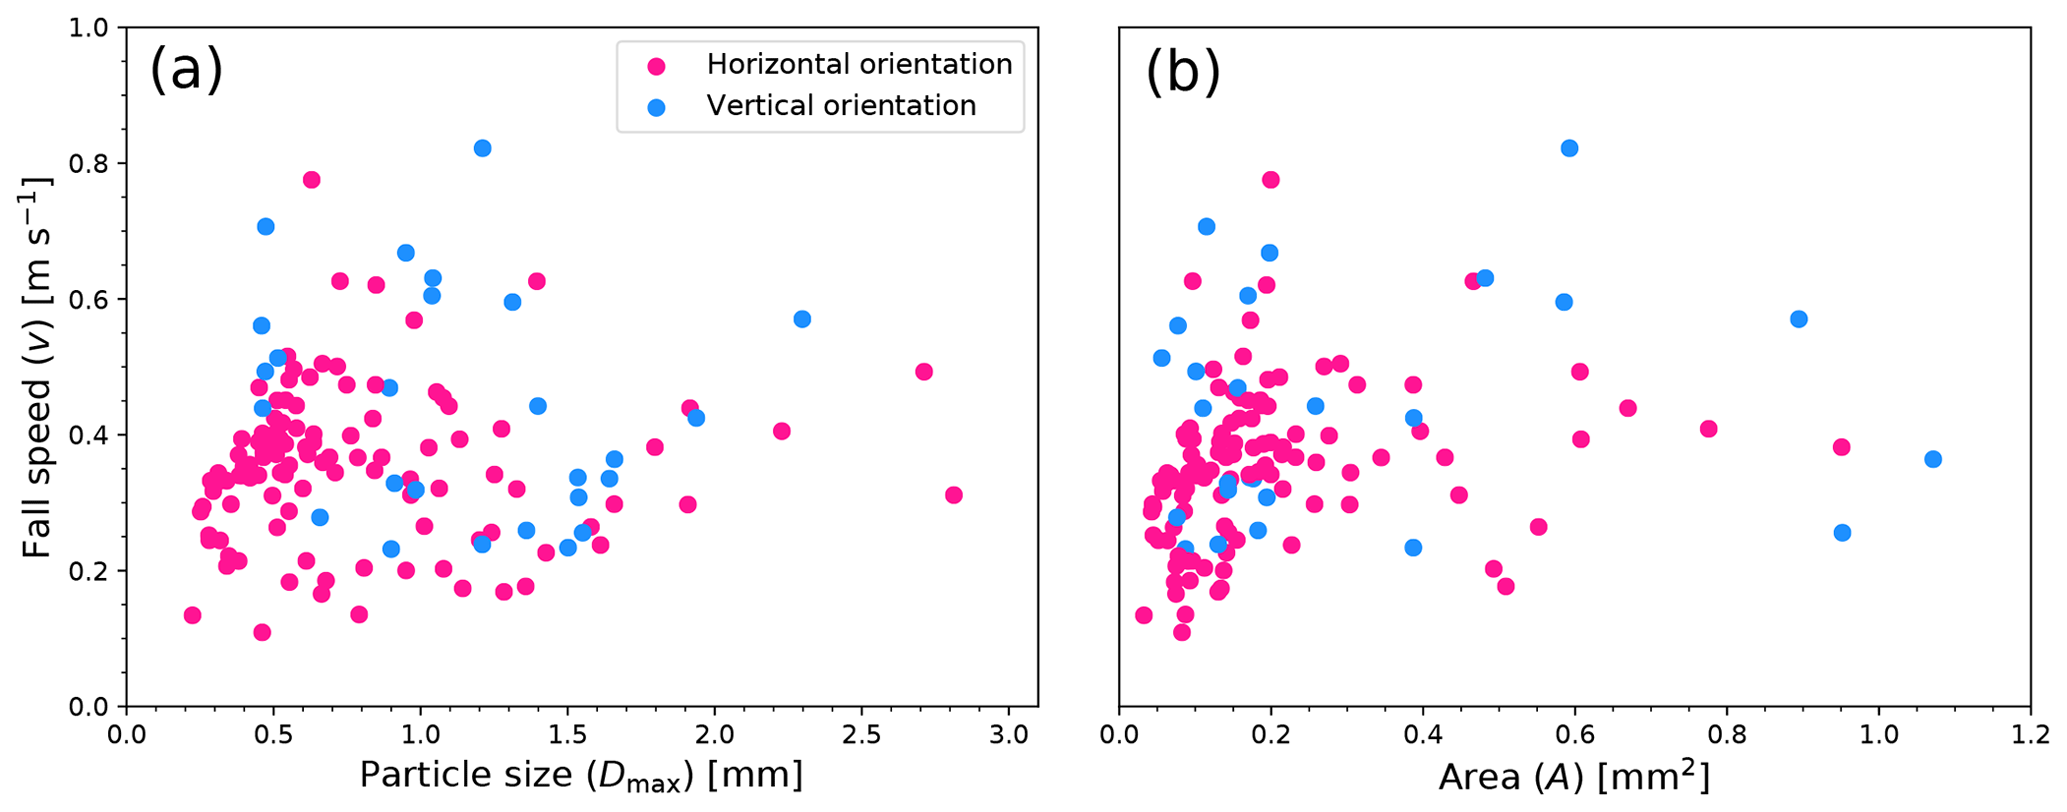
Figure 11 Fall speed vs. particle size (v vs. Dmax) and fall speed vs. cross-sectional area (v vs. A) for mixed particle shapes, elongated particles (shape group (1) Needles), and planar particles (shape groups (5) Plates and (6) Stellar), with horizontal and vertical orientation angles. (a) v vs. Dmax relationship. (b) v vs. A.
3.3.2 Area ratio
In addition to orientation, also area ratio, Ar, may be important, especially given that the Reynolds number, which influences fall speed (Sect. 3.2), can be related, in part, to the area ratio (Heymsfield and Westbrook, 2010). In general, the smallest particles tend to have the largest Ar, and Ar becomes smaller for larger particles. This is true for most shape groups, and this tendency is particularly strong in the four shape groups (1) Needles, (2) Crossed needles, (3) Thick columns, and (13) Ice particles (see Fig. 4), of which groups (1–3) are elongated shapes. The lowest Ar values, at any given size, are found in these shape groups. The elongated shapes also showed a particular size dependence of their cross-sectional area (Sect. 3.1). This dependence of area ratio and of cross-sectional area on particle size leads to a particular fall speed behavior, which can be better visualized by splitting the data into different Ar ranges. Figure 12 shows this after splitting the data equally into three distinct regions of low, intermediate, and high Ar values. In each range, there is a different fall speed relationship for both v vs. Dmax and v vs. A. As can be seen in Fig. 12, these relationships are spread out in a way so that for a given particle size or cross-sectional area, higher and lower Ar means higher and lower fall speed, respectively. One may expect the effects of orientation to be responsible since the same elongated particle would have a relatively larger Ar when oriented vertically, and thus falling faster, compared to when oriented horizontally. However, a closer inspection of the data shows that the majority of particles are horizontally oriented. The predominance of the horizontal orientation is probably a consequence of vertically falling particles being less aerodynamically stable and thus likely to transition to horizontal orientation. Therefore, particle orientation does not appear to explain the dependence of fall speed on area ratio. Instead, particles with higher area ratios are generally bulkier, i.e., needles or columns that are shorter in length, and consequently fall faster.
To better understand this area ratio dependence of fall speed, we first consider elongated particles that have the same Dmax (approximately given by the length) but different values of Ar. Note that the top-view images, used to determine A, always present a view perpendicular to the major axis of elongated particles if these are horizontally oriented. Therefore, the cross-sectional area is approximately given by the length of a particle multiplied by its diameter d (with diameter, we refer to the width perpendicular to the major axis), i.e., .
Also, as can be seen in Eq. (1), the cross-sectional area A is proportional to Ar for the case of Dmax being constant as considered here. Then, also diameter is proportional to Ar. Consequently, volume () or mass (m) is proportional to . While, in the case of constant Dmax, A∝Ar is valid in general for all shapes, the strong dependence is distinctive for elongated shapes. Then, for these shapes, as Ar increases, mass increases much more rapidly than A, and consequently, fall speed needs to increase considerably for drag to compensate gravitational force. This effect can explain the strong dependence of fall speed on area ratio for these elongated shapes.
For other shapes, the general dependence may be similar, though less pronounced due to a weaker Ar dependence of m. Additionally, for these other shapes, the range of Ar is not as wide as for the elongated shapes. Moreover, for no other shape group do the fall speeds separate into distinguishable relationships after splitting the data according to Ar. That indicates that the natural spread in fall speed may hide the Ar dependence of fall speed.
To examine further, we also consider what happens at increasing Dmax in the case of constant Ar. In this case, in general and where β is between 2 and 3. Consequently, as m increases more rapidly with increasing Dmax than A (for all cases but the extreme ), the fall speed also increases rapidly with increasing Dmax, which is consistent with the strongest size dependence of fall speed existing in shape groups (12) Graupel and (15) Spherical (see Sect. 3.2).
Finally, considering the general case when neither Dmax nor Ar is constant, one needs to take into account both of the special cases explained above. On the one hand, increasing Dmax leads directly to increasing fall speed. On the other hand, increasing Dmax changes the particle morphology so that Ar decreases, which, in turn, causes fall speed to decrease. Since these effects are opposed, they cancel each other out to some extent. The stronger the negative size dependence of Ar, the weaker the positive size dependency of fall speed. If the effect related to Ar is the strongest, they cancel out almost entirely, as in the case of shape groups (1–3) where this results in the weakest size dependence of fall speed with low correlation. Another consequence of the Ar dependence of fall speed is that variations in Ar cause variations in fall speed; i.e., they account in part for the natural spread in the data.
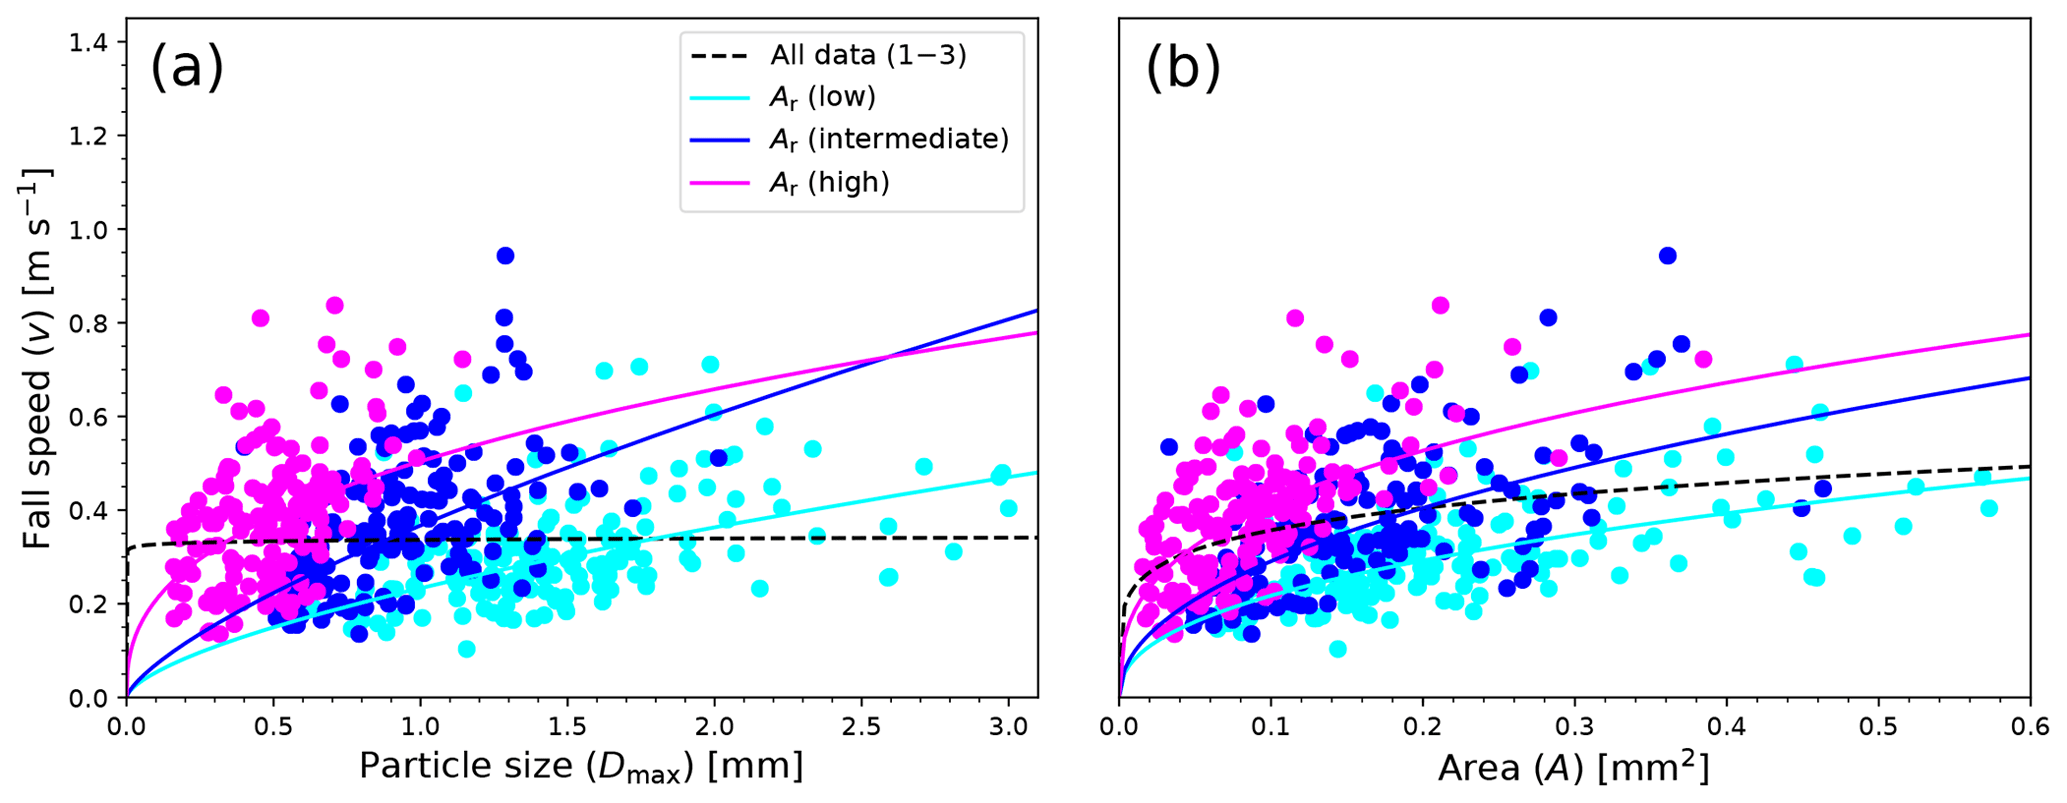
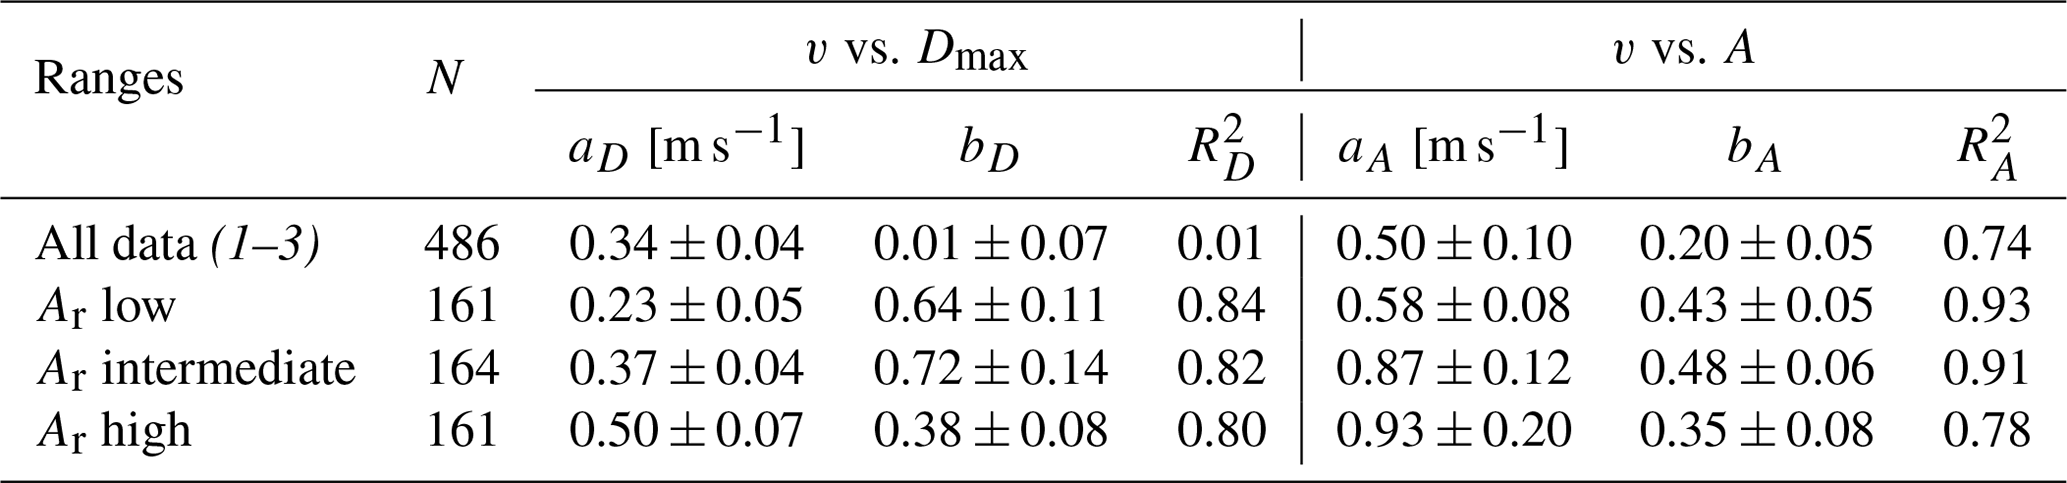
Figure 12 Fall speed vs. particle size (a) and fall speed vs. cross-sectional area (b) relationships for the combination of shape groups (1) Needles, (2) Crossed needles, and (3) Thick columns. Fits that apply to binned data (Mb; see Sect. 3.2.2) are shown for all the data (solid black line) and for different Ar (low, intermediate, and high) ranges. All data, in this case, only include particles in these three shape groups, i.e., (1–3). Same data are shown in Table 5.
Table 5Fall speed vs. particle size (v vs. Dmax) and fall speed vs. cross-sectional area (v vs. A) relationships fitted to binned data (Mb) for the combination of particles in shape groups (1) Needles, (2) Crossed needles, and (3) Thick columns with different area ratio Ar ranges (low, intermediate, and high). The number of particles, N, the parameters aD, bD, aA, bA, and their respective uncertainties, and the correlation coefficients are shown. All data are also shown. In this case, all data include only particles in these three shape groups, i.e., (1–3).
3.4 Comparison with previous fall speed relationships
For shape groups (5) Plates, (6) Stellar (called dendrites in other studies), and (12) Graupel, where we found good correlation (), we compare our fall speed relationships as functions of particle size, further referred to as VM21, against parameterizations of previous studies. Table 6 lists the parameterizations of Locatelli and Hobbs (1974) L74, Heymsfield and Kajikawa (1987) H87, Mitchell (1996) M96, Barthazy and Schefold (2006) B06, and Lee et al. (2015) L15 used in the comparison.
Before comparing, it is important to note that the particle size D was defined somewhat differently depending on the study. For VM21, as well as for H87 and M96, D corresponds to Dmax. For L74, D is the diameter of an estimated circle that has the same cross-sectional area as the imaged particle, and for B06 and L15, D corresponds to the maximum length of any horizontal row in the side-view shadow graphs. Furthermore, we have not adjusted the different studies to common temperature and pressure conditions but compared them as they are reported. While some did adjust measurements to some standard conditions, others did not. For example, H87 adjusted measurements from about 1000 m altitude to a pressure level of 1000 hPa, whereas L74 used measurements from, on average, the same altitude but did not adjust them to a common or standard pressure level, which results in a difference of about 5 %.
L74 studied fall speeds of different types of ice crystals by first measuring the fall speed of individual particles and then subsequently collecting and imaging them. Their fitted relationships of fall speed are often used as a reference by other studies in the literature. H87 also used data from fall speed measurements and subsequent imaging of individual snow particles, which were collected by Kajikawa (1972). What L74 and H87 have in common with VM21 is that all ice particles that contribute to a fall speed parameterization are individually shape classified and therefore belong to the studied shape. B06, on the other hand, loosely tied particle shape to fall speeds by determining the dominant particle shape (occurrence > 50 %) per time interval from an independent instrument and later associated the fall speeds in the time interval to the dominant shape. L15 used a method similar to B06; however, they used a higher occurrence threshold of 70 %. The fall speed parameterizations of the study by M96 are predicted from previous literature relationships of cross-sectional area and mass vs. particle size.
Table 6The v vs. D relationships of previous studies given by Locatelli and Hobbs (1974) L74, Heymsfield and Kajikawa (1987) H87, Mitchell (1996) M96, Barthazy and Schefold (2006) B06, and Lee et al. (2015) L15 are shown for some shapes that were selected for the comparison and correspond to (5) Plates, (6) Stellar, and (12) Graupel. The power laws for M96 have been determined by using Eqs. (20) and (22) in Mitchell (1996). The relationships found in this work are also shown as VM21. The power laws from the literature have been converted to use the same units, i.e., mm and m s−1, as in VM21. The snow particle type, the total number of particles N, ranges of particle sizes D, v vs. D relationships, the correlation coefficient R2, and the references of the studies are displayed. In some of these studies, the particle size is defined somewhat differently. However, in H87 and M96, D is defined as Dmax as in VM21. Magono and Lee (1966)'s symbols are sometimes added for shape clarification. These v vs. D relationships are shown in Fig. 13. To easily connect the fit lines to the power laws, the same relationship numbers have been used in Table 6 and Fig. 13.
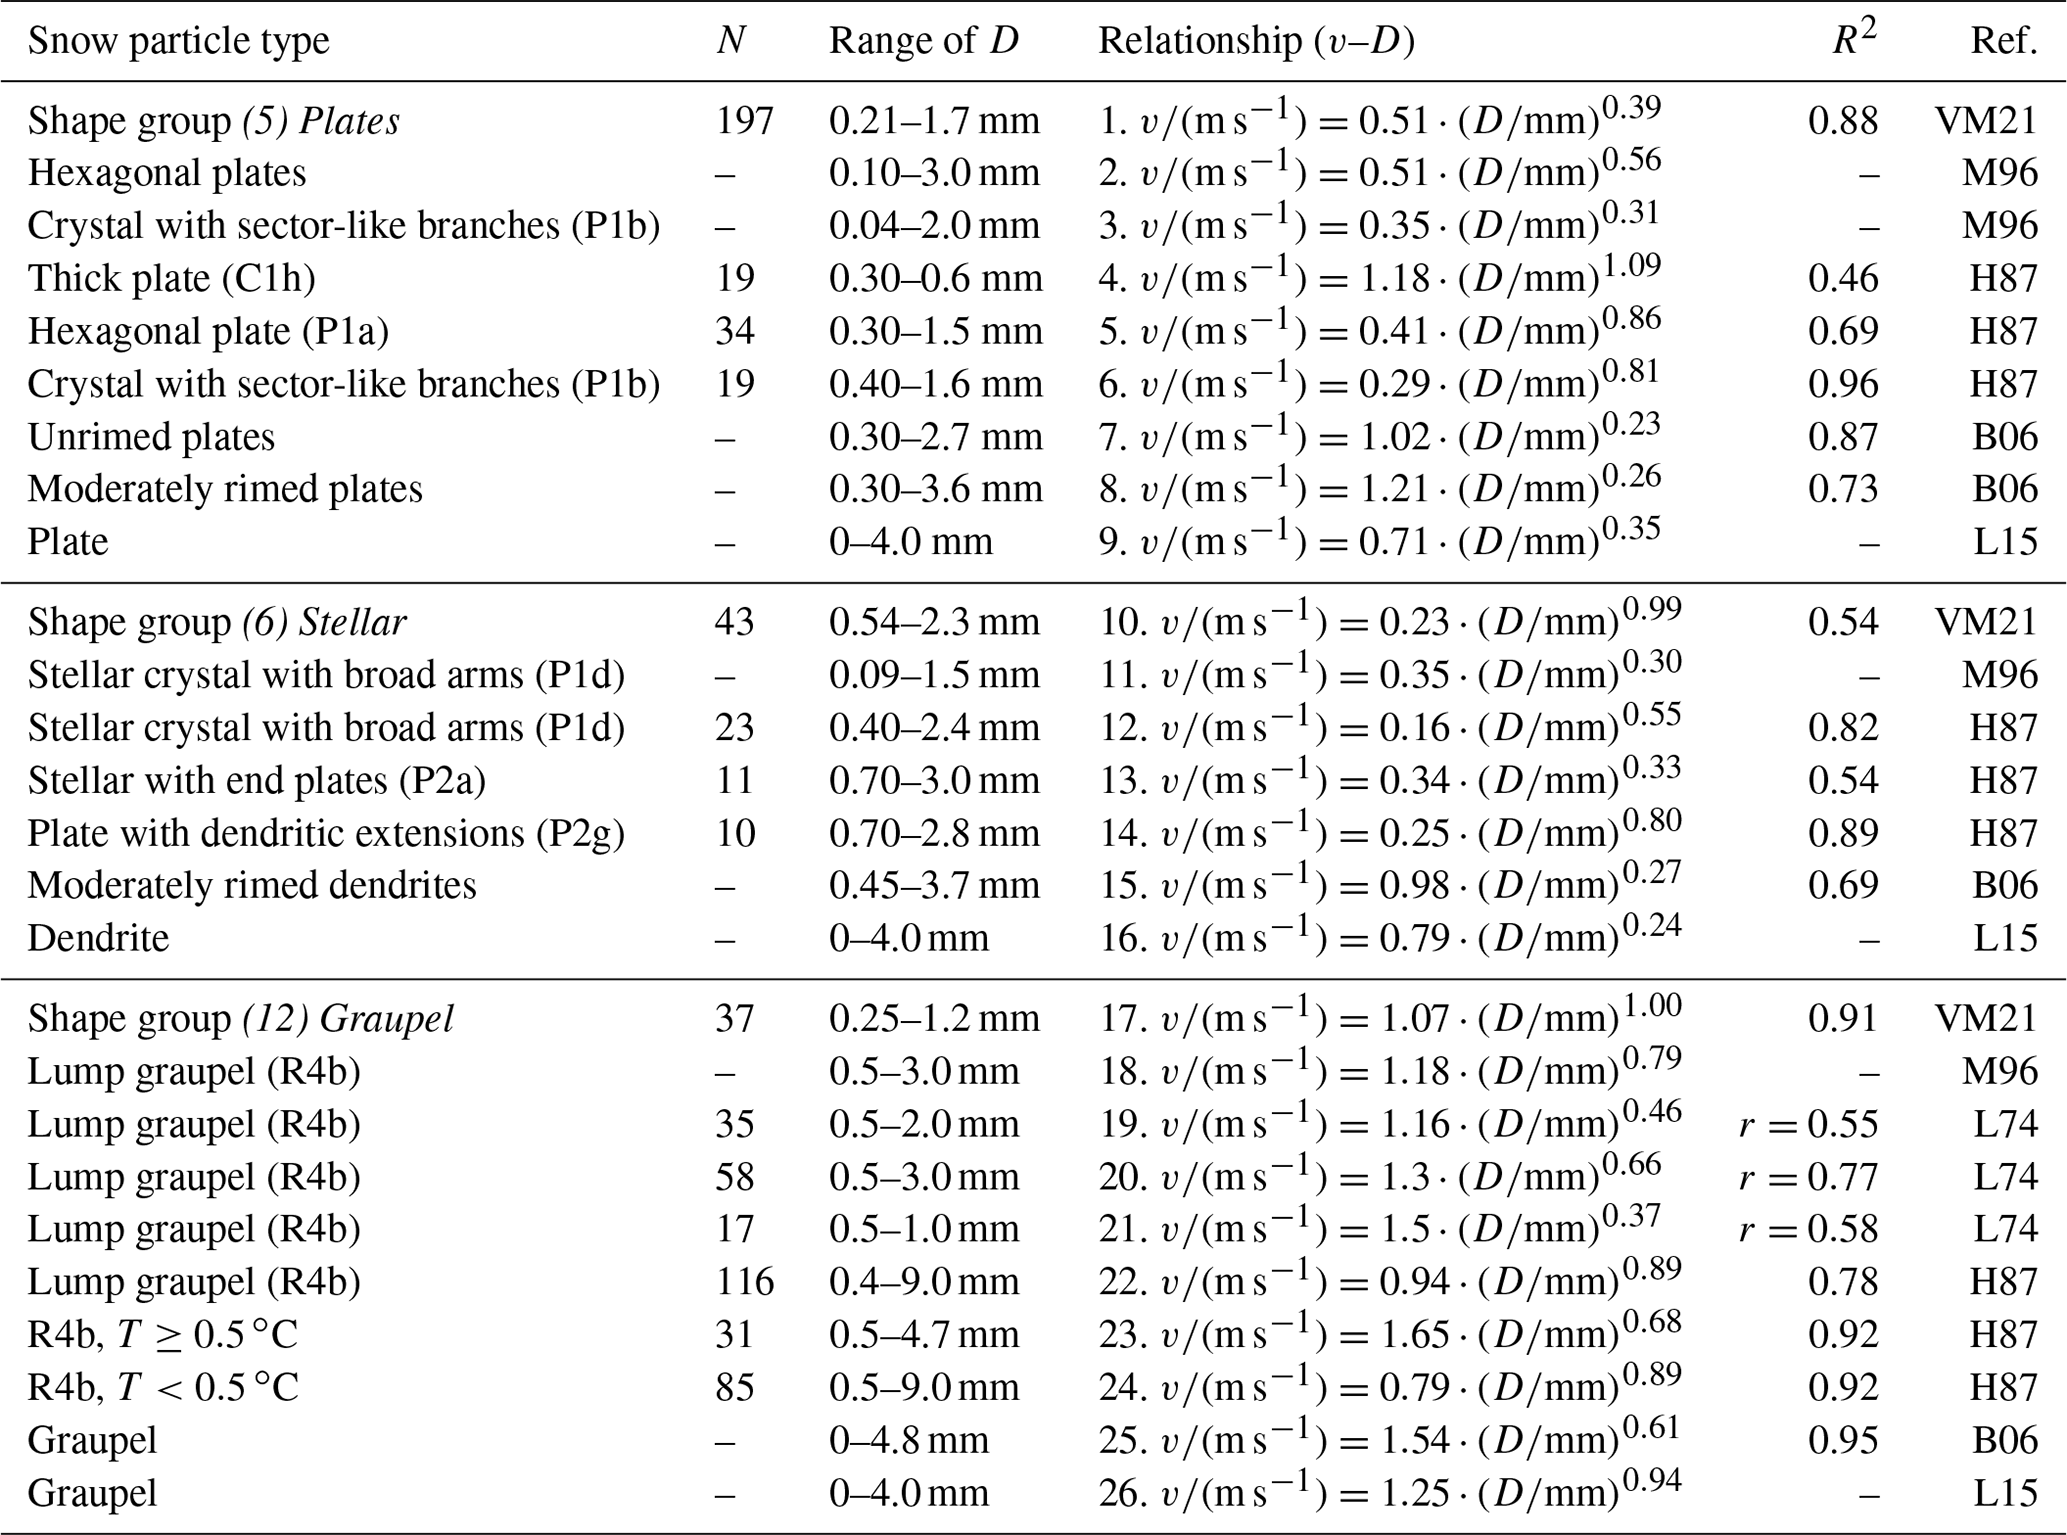
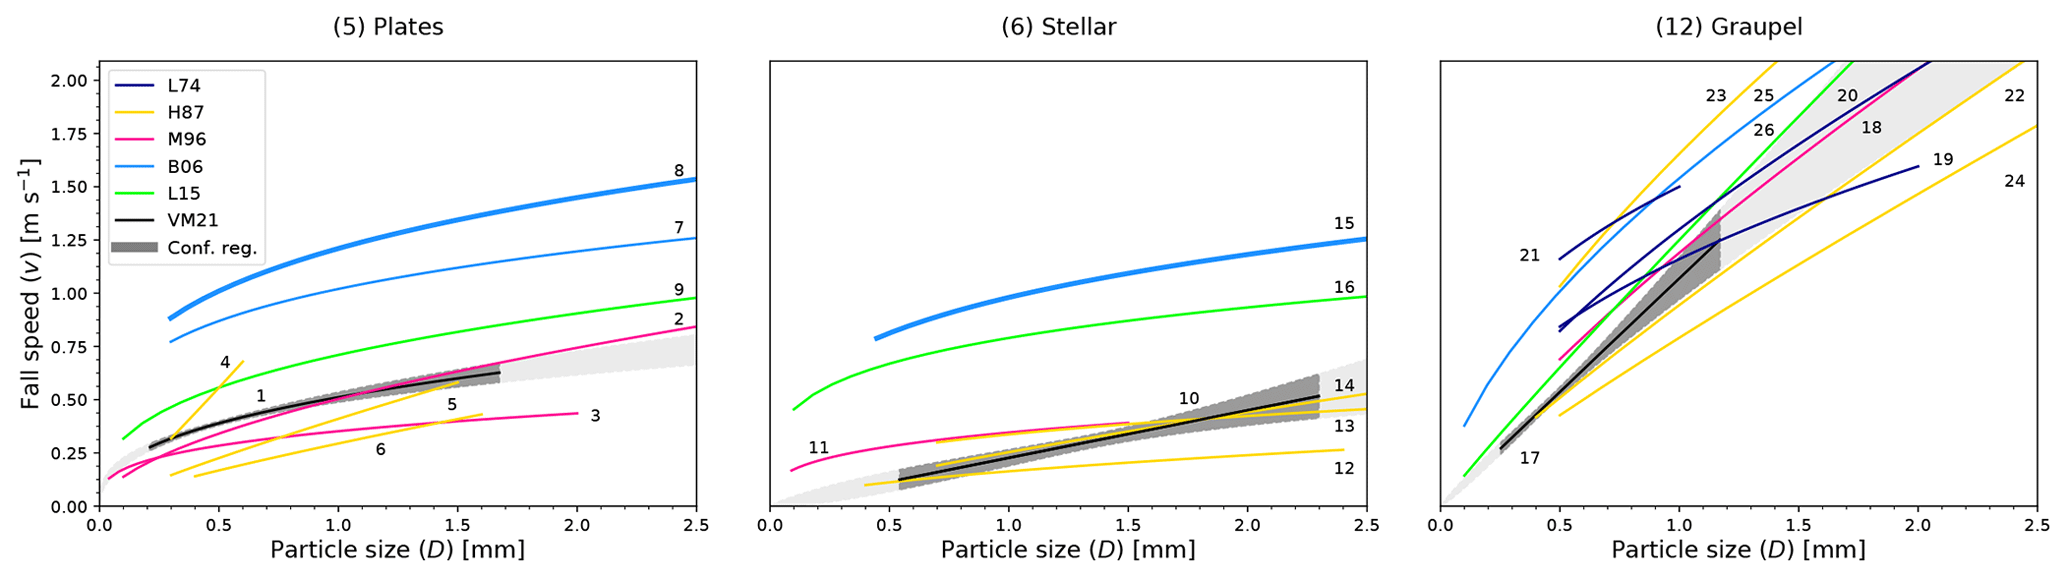
Figure 13 A comparison of the fall speed vs. particle size (v vs. D) relationships between this study and previous studies for some shape groups: (5) Plates, (6) Stellar, and (12) Graupel. For the comparison, v vs. D parameterizations from Locatelli and Hobbs (1974) L74, Heymsfield and Kajikawa (1987) H87, Mitchell (1996) M96, Barthazy and Schefold (2006) B06, Lee et al. (2015) L15, and this work VM21 are shown. These v vs. D relationships are the same as those shown and enumerated in Table 6. The thickness in the lines corresponding to B06 represents the riming degree: the thinner line denotes “unrimed”, and the thicker one denotes “moderately rimed”. The power laws that correspond to VM21 are shown together with their respective 68 % confidence regions (Mb). The lengths of all relationships correspond to the ranges of D (see Table 6).
Figure 13 shows that, for plates, the previous relationships by H87 and M96 are closest to results from VM21. While their relationships for crystal with sector-like branches (P1b) produce slower fall speeds than VM21, their relationships for plates are closer and extend into or cross the confidence region of VM21. H87 also reported a relationship for thick plates, which, in most of its size range, is just above VM21. The relationships reported by B06 have the highest fall speeds for plates. They reported different relationships for different degrees of riming, with more riming leading to higher fall speeds. Our data included in shape group (5) Plates are mainly composed of unrimed particles (for a detailed description, see Vázquez-Martín et al., 2020). However, even the unrimed plates from B06 appear to be much faster. The relationships from B06 may overestimate fall speeds because of their classification method mentioned above, which allowed up to half of the particles that contributed to the relationship to have different shapes. L15 also reported a relationship for plates' speed that is faster than our relationship, although much closer and considerably slower than those of B06. The better agreement is possibly due to a more accurate shape classification, while otherwise using a similar method to B06.
As for plates, also for stellar particles the previous relationships by H87 and M96 are closest to those of VM21. Note that M96 is based on the flow regime for particles larger than about 1 mm (Eq. 20 in M96). Using the flow regime for smaller particles, M96 would come somewhat closer to VM21 below about 0.6 mm. Again, L15 and B06 reported relationships with considerably higher fall speeds.
L74 reported three relationships for lump graupel with different densities. The higher the density, i.e., the more compact the graupel particles are, the faster their predicted fall speeds will be. The relationship for lump graupel by M96 is based on the mass relationship of the medium density graupel by L74; consequently, it is very close to the corresponding fall speed relationship. These are within or above VM21's confidence region. H87 reported lump graupel for temperatures below and above 0.5 ∘C, with faster speeds for higher temperatures. These are below and above VM21's confidence region, respectively. Their relationship for colder temperatures than 0.5 ∘C is closer to VM21. The relationship by L15 is close to VM21, just above the confidence region, and the relationship from B06 is again at higher speeds, similar to the differences for plates and stellar.
In general, our v vs. D relationships agree with the previous studies. The studies with the largest disparity compared to this study may, in large part, be explained by the different approach to classifying snow particle shapes.
We have presented D-ICI measurements of natural snow, ice crystals, and other hydrometeors, covering sizes from 0.06 to 3.2 mm. These data with dual images of every particle enable the retrieval of the particle shape, as well as size parameters from the top view and fall speed from the double-exposed side-view images.
The particles were sorted according to a classification scheme presented in Vázquez-Martín et al. (2020), which uses 15 different shape groups: Needles, Crossed needles, Thick columns, Capped columns, Plates, Stellar crystals, Bullet rosettes, Branches, Side planes, Spatial plates, Spatial stellar, Graupel, Ice particles, Irregulars, and Spherical particles. In this study, we have analyzed fall speed vs. particle size (v vs. Dmax) and fall speed vs. cross-sectional area (v vs. A) for each of the 15 shape groups. Fall speed dependence of particle orientation has also been studied as well as dependence of area ratio. The following is a summary of the conclusions drawn.
-
Power-law functions represent the relationship between the cross-sectional area and the maximum dimension (Eq. 2) very well for all shape groups (see Table 1). The exponent b varies between about 1 and 2. Theoretically, the value approaches 1.0 for very elongated shapes that predominantly grow in only one of the two dimensions shown on the top-view images and 2.0 for spherical shapes. Indeed, data from the shape groups with very elongated shapes, (1) Needles, (2) Crossed needles, and (3) Thick columns, and the groups with round particles, (12) Graupel and (15) Spherical, have b values close to these theoretical limits. For the other shape groups, b varies between 1.4 and 1.8. Ultimately, as can be seen in Eq. (3), the smaller the value in b, the faster Ar decreases as Dmax increases (see Fig. 4).
-
Shape groups (7) Bullet rosettes and (12) Graupel have the fastest fall speeds with median speeds near 0.58 m s−1 (see Sect. 3.2). The lowest median values of 0.34 m s−1 or less are observed for shape groups (1) Needles, (2) Crossed needles, and (3) Thick columns, the median of all data is approximately 0.43 m s−1, and most shape groups have their median within ±0.08 m s−1 from this value.
-
Overall, the fall speed data of individual particles show a broad spread of values as a function of Dmax or A so that no or only weak correlation to the power-law fits given by Eqs. (4) and (5) exists. However, binning the data before applying the power law improves the correlations substantially. For all shape groups, the fit to the individual data and the fit to the data after binning agree with each other within uncertainties. For about half of the shape groups, the correlation coefficients after binning the data are larger than 0.5, and the corresponding fits are considered representative. For the remaining groups, it is uncertain if it is possible to find sufficiently representative power-law fits. See Table 3 (for v vs. Dmax) and Table 4 (for v vs. A) for a full overview of these results.
-
For the majority of shape groups, the v vs. A correlation is about equally good as v vs. Dmax. This is expected, since A and Dmax are strongly correlated.
-
For a few shapes, the v vs. Dmax and v vs. A correlations are different. For most of these shapes, the v vs. A correlation is better than the v vs. Dmax. The fall speed depends on mass and drag, and drag depends on the cross-sectional area, so one expects A to be more important for fall speed than Dmax.
-
The drag force depends on cross-sectional area but also on the particle Reynolds number, which in turn depends on a characteristic particle length. While for most shapes this characteristic length may be well approximated by Dmax, it can be significantly different from Dmax for a few shapes. For such shapes, one can expect low correlation for the v vs. Dmax relationship, and this is the case for shape groups (1–3), for which Dmax is equivalent to the needles' or columns' length, but the characteristic length is given by their width instead. These groups have low v vs. Dmax correlation but better v vs. A correlation.
-
In this dataset, generally, only a few groups contained particles where we could clearly distinguish the orientation of the falling particle, the planar and elongated shape groups. Only 135 particles have been found with close to exactly horizontal and vertical orientation. Of these, most are falling with a horizontal orientation, and we have found only 26 particles that are falling vertically oriented. These are falling slightly faster (the median is 0.08 m s−1 faster) than the horizontally oriented particles (see Sect. 3.3); however, the small sample size inhibited any further analysis of fall speed dependence on particle orientation.
-
The shape groups (1) Needles, (2) Crossed needles, and (3) Thick columns show a distinct fall speed dependence on area ratio. By splitting particles of the same size or cross-sectional area into three categories of area ratio (low, medium, high), we found that those with larger area ratios have higher fall speeds. These relationships have a high correlation, and it is much higher than before splitting the data into different area ratio ranges (see Table 5). Only these three shape groups show this behavior. Thus, if a similar area ratio dependence exists for other shapes, then it is less pronounced.
-
Our v vs. Dmax relationships for some of the better-correlated shape groups, (5) Plates, (6) Stellar, and (12) Graupel, are compared with other fall speed relationships given by previous studies. Our results mostly agree with the studies that determined shape and fall speed for all particles or based on literature area–dimensional and mass–dimensional relationships for specific shapes. Of these studies, some of them are somewhat faster and some are somewhat slower than our relationships for the corresponding shape group. Other studies differ significantly from our relationships. However, in these studies, the shape groups were determined based on the identity of the most frequent particle shape within a time interval; i.e., other particle shapes undoubtedly reduced the precision of the dataset and therefore may be the cause of the bias between this dataset and theirs (see Sect. 3.4).
These resulting parameterizations of the snow microphysical properties as a function of particle shape may be useful for improving our understanding of precipitation in cold climates in addition to helping improve the microphysical parameterizations in the climate and forecast models.
Figures A1 and A2 represent v vs. Dmax and v vs. A, respectively, fitted to a power law, for all 15 shape groups, and, as in Fig. 6 (Sect. 3.2), both methods (Ma, Mb) are shown for comparison.
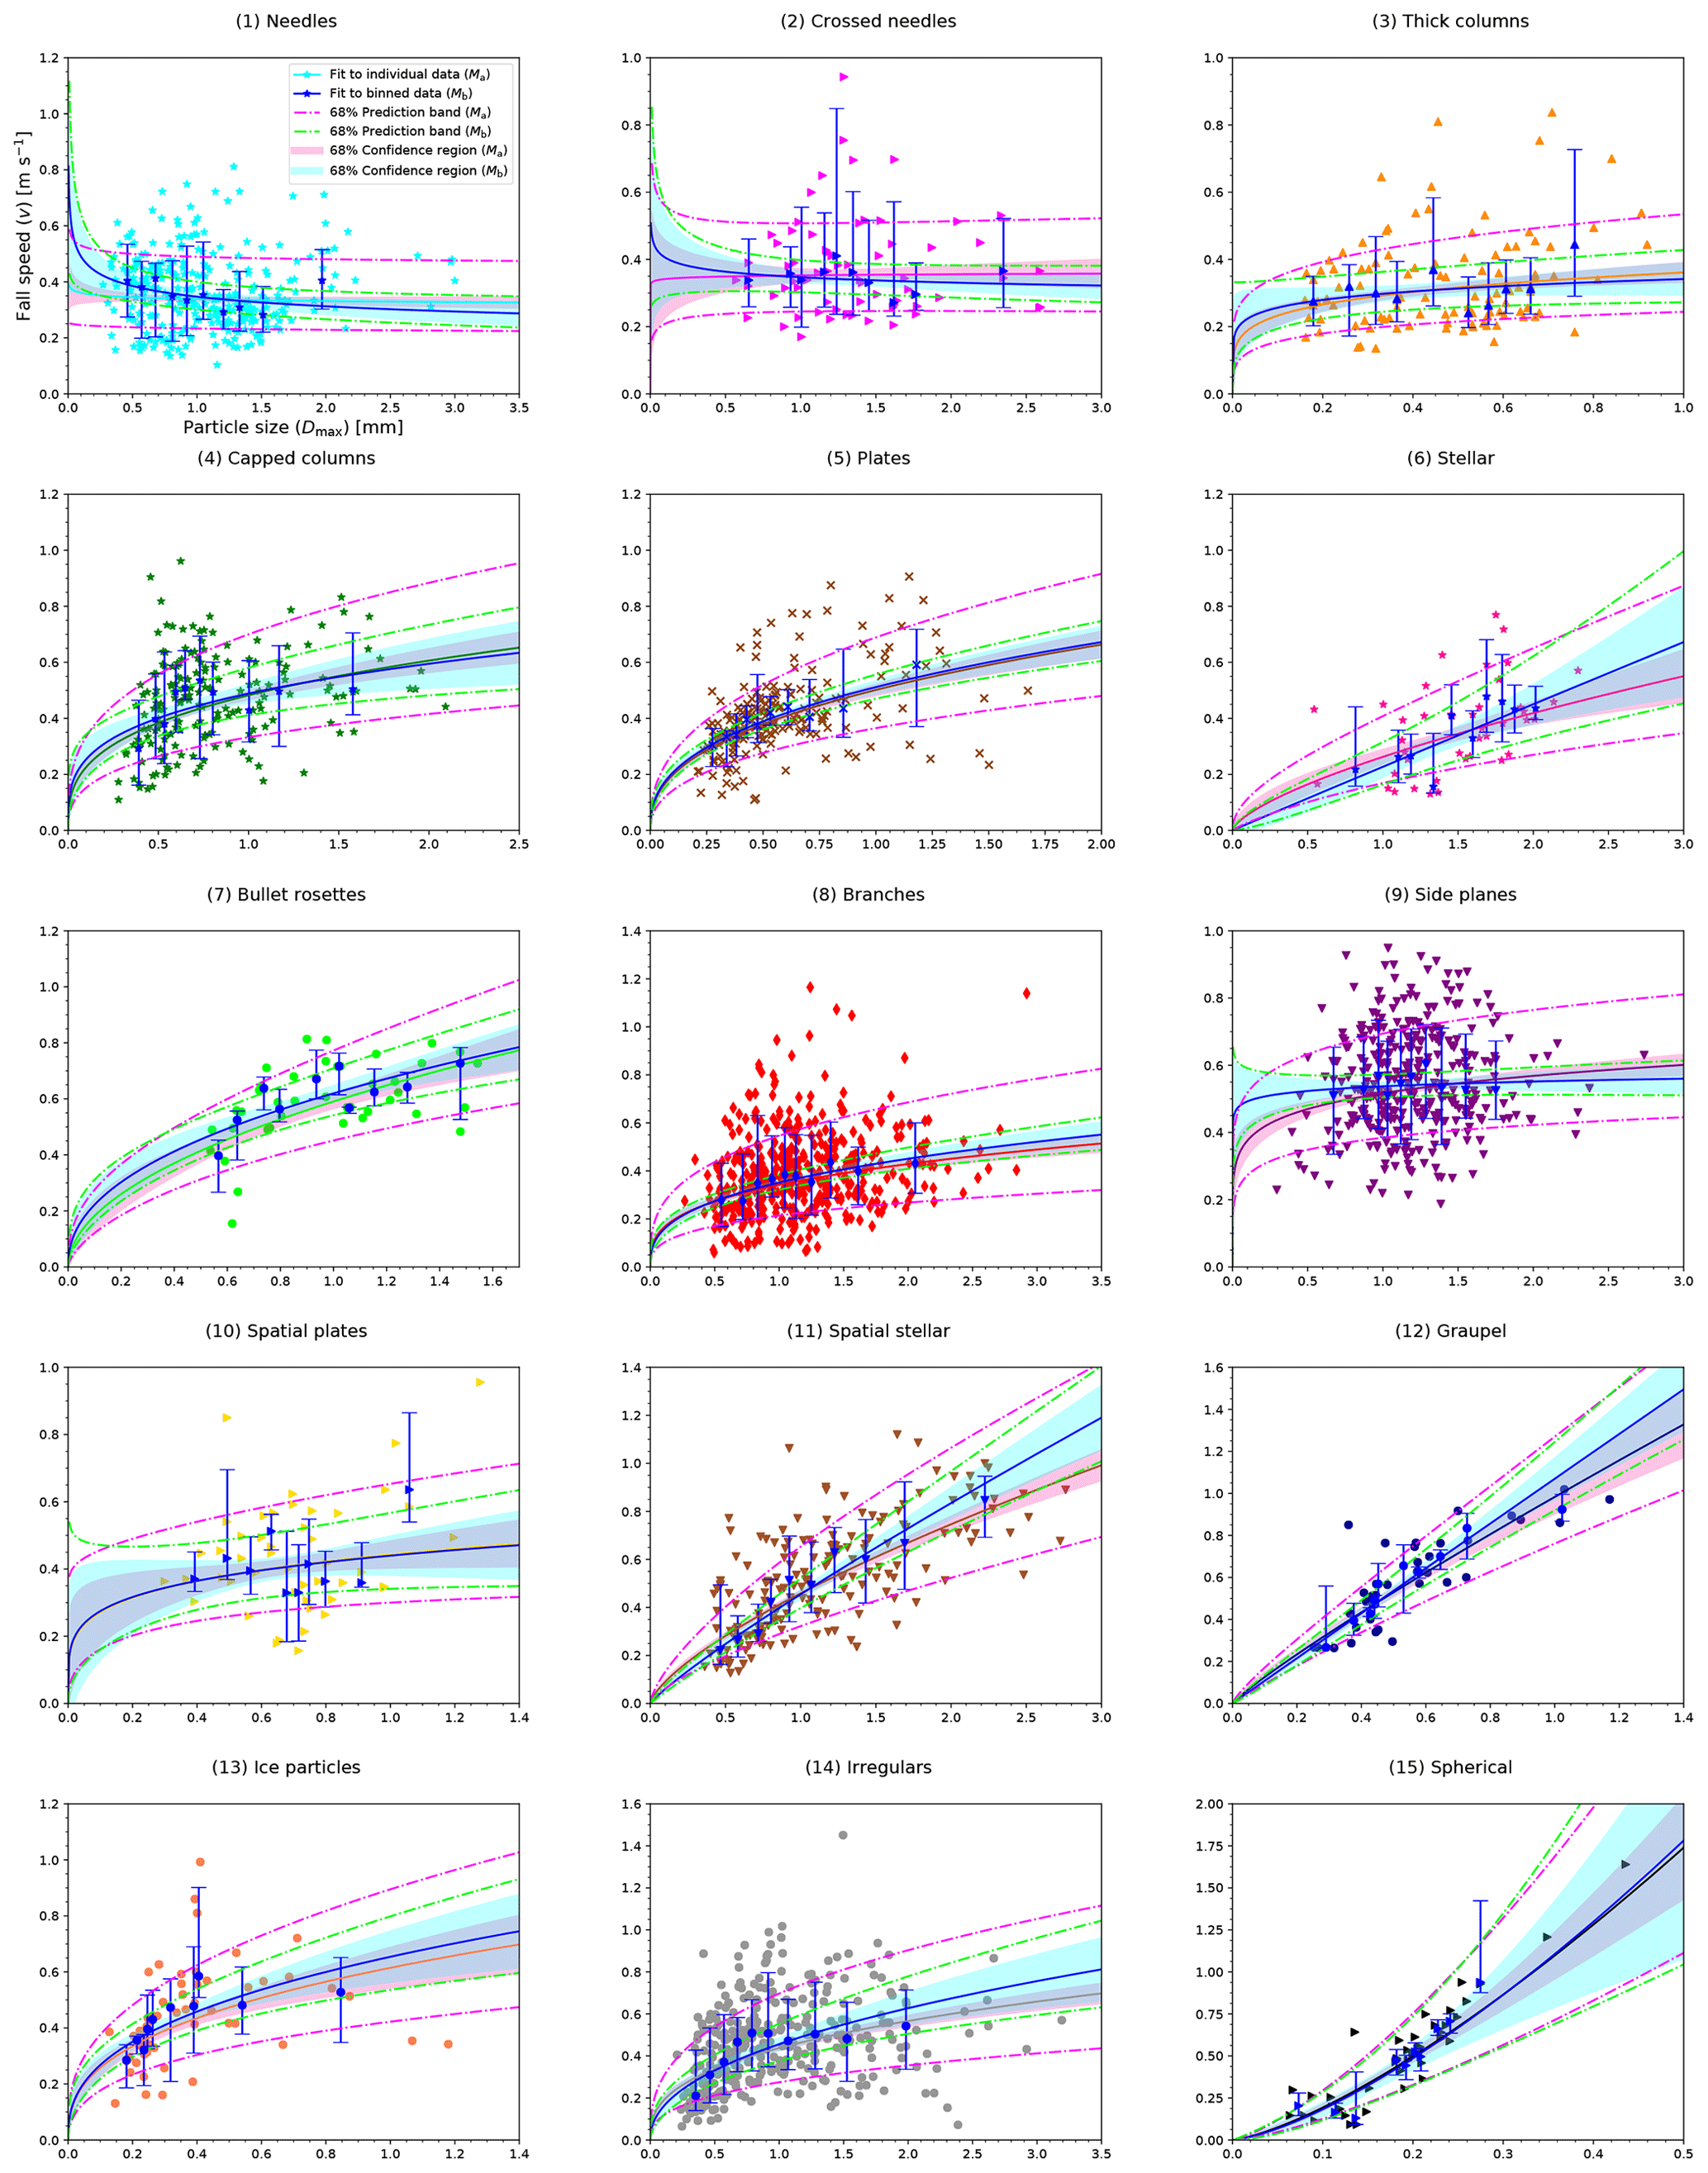
Figure A1 Fall speed vs. particle size (v vs. Dmax) relationships given by Eq. (4) for all the shape groups are shown. Individual data (colored symbols) and binned data (blue symbols with error bars) are displayed. Median values in the respective bins represent the binned data. The total length of the error bars represents the spread in fall speed data, which is given by the difference between the 16th and 84th percentiles. Fits that apply to individual data (Ma) and to binned data (Mb) are shown for comparison. The 68 % prediction band and the 68 % confidence region for both fits (Ma, Mb) are also shown. The same data are shown in Table 3.

The presented data are available at the Swedish National Data Service (SND-ID: 2021-125; https://doi.org/10.5878/dgak-p185, Kuhn and Vázquez-Martín, 2021).
TK and SVM performed the conceptualization; TK prepared the resources and the instrumentation; SVM and TK performed the experiments and data collection; SVM and TK prepared the formal analysis; SVM and TK carried out the data curation; SVM prepared the original draft; SVM, TK and SE contributed to changes and writing during review and revisions; SVM prepared the visualization that includes tables and figures; TK and SE carried out the supervision of the research project.
The authors declare that they have no conflict of interest.
We thank the Graduate School of Space Technology at the Luleå University of Technology for financial support and the Swedish Institute of Space Physics (IRF) at Kiruna for offering its facilities for our instrument.
This paper was edited by Timothy Garrett and reviewed by two anonymous referees.
Barthazy, E. and Schefold, R.: Fall velocity of snowflakes of different riming degree and crystal types, J. Atmos. Res., 82, 391–398, https://doi.org/10.1016/j.atmosres.2005.12.009, 2006. a, b, c, d, e, f
Baum, B. A., Yang, P., Heymsfield, A. J., Schmitt, C. G., Xie, Y., Bansemer, A., Hu, Y.-X., and Zhang, Z.: Improvements in Shortwave Bulk Scattering and Absorption Models for the Remote Sensing of Ice Clouds, J. Appl. Meteorol. Clim., 50, 1037–1056, https://doi.org/10.1175/2010JAMC2608.1, 2011. a
Brandes, E. A., Ikeda, K., Thompson, G., and Schönhuber, M.: Aggregate Terminal Velocity/Temperature Relations, J. Appl. Meteorol. Clim., 47, 2729–2736, https://doi.org/10.1175/2008JAMC1869.1, 2008. a
Cooper, S. J. and Garrett, T. J.: Identification of small ice cloud particles using passive radiometric observations, J. Appl. Meteorol., 49, 2334–247, 2010. a
Dunnavan, E. L.: How Snow Aggregate Ellipsoid Shape and Orientation Variability Affects Fall Speed and Self-Aggregation Rates, J. Atmos. Sci., 78, 51–73, https://doi.org/10.1175/JAS-D-20-0128.1, 2021. a, b
Foster, J., Barton, J., Chang, A., and Hall, D.: Snow crystal orientation effects on the scattering of passive microwave radiation, IEEE T. Geosci. Remote, 38, 2430–2434, https://doi.org/10.1109/36.868899, 2000. a
Gergely, M. and Garrett, T. J.: Impact of the natural variability in snowflake diameter, aspect ratio, and orientation on modeled snowfall radar reflectivity, J. Geophys. Res.-Atmos., 121, 12236–12252, https://doi.org/10.1002/2016JD025192, 2016. a
Haider, A.: Drag Coefficient and Terminal Velocity of Spherical and Non-Spherical Particles, Powder Technol., 58, 63–70, https://doi.org/10.1016/0032-5910(89)80008-7, 1989. a
Heymsfield, A. J. and Kajikawa, M.: An Improved Approach to Calculating Terminal Velocities of Plate-like Crystals and Graupel, J. Atmos. Sci., 44, 1088–1099, https://doi.org/10.1175/1520-0469(1987)044<1088:AIATCT>2.0.CO;2, 1987. a, b, c, d
Heymsfield, A. J. and Westbrook, C. D.: Advances in the Estimation of Ice Particle Fall Speeds Using Laboratory and Field Measurements, J. Atmos. Sci., 67, 2469–2482, https://doi.org/10.1175/2010JAS3379.1, 2010. a, b
Jiang, Z., Verlinde, J., Clothiaux, E., Aydin, K., and Schmitt, C.: Shapes and Fall Orientations of Ice Particle Aggregates, J. Atmos. Sci., 76, 1903–1916, https://doi.org/10.1175/JAS-D-18-0251.1, 2019. a
Jin, Z., Charlock, T. P., Yang, P., Xie, Y., and Miller, W.: Snow optical properties for different particle shapes with application to snow grain size retrieval and MODIS/CERES radiance comparison over Antarctica, Remote Sens. Environ., 112, 3563–3581, https://doi.org/10.1016/j.rse.2008.04.011, 2008. a
Kajikawa, M.: Measurement of Falling Velocity of Individual Snow Crystals, J. Meteorol. Soc. Japan, 50, 577–583, 1972. a
Kikuchi, K., Kameda, T., Higuchi, K., and Yamashita, A.: A global classification of snow crystals, ice crystals, and solid precipitation based on observations from middle latitudes to polar regions, Atmos. Res., 132–133, 460–472, https://doi.org/10.1016/j.atmosres.2013.06.006, 2013. a
Kneifel, S., Löhnert, U., Battaglia, A., Crewell, S., and Siebler, D.: Snow scattering signals in ground-based passive microwave radiometer measurements, J. Geophys. Res.-Atmos., 115, 1–17, https://doi.org/10.1029/2010JD013856, 2010. a
Kuhn, T. and Gultepe, I.: Ice Fog and Light Snow Measurements Using a High-Resolution Camera System, Pure Appl. Geophys., 173, 3049–3064, https://doi.org/10.1007/s00024-016-1343-7, 2016. a
Kuhn, T. and Vázquez-Martín, S.: Microphysical properties and fall speed measurements of snow ice crystals using the Dual Ice Crystal Imager (D-ICI), Atmos. Meas. Tech., 13, 1273–1285, https://doi.org/10.5194/amt-13-1273-2020, 2020. a, b, c, d, e, f, g
Kuhn, T. and Vázquez-Martín, S.: Snow ice particle microphysical properties and fall speed from particle images taken in Kiruna (Sweden) 2014–2018, Swedish National Data Service, Version 1.0, https://doi.org/10.5878/dgak-p185, 2021. a
Lee, J., Jung, S.-H., Park, H.-M., KWON, S., Lin, P.-L., and Lee, G.: Classification of Precipitation Types Using Fall Velocity-Diameter Relationships from 2D-Video Distrometer Measurements, Adv. Atmos. Sci., 32, 1277–1290, https://doi.org/10.1007/s00376-015-4234-4, 2015. a, b, c, d
Locatelli, J. D. and Hobbs, P. V.: Fall speeds and masses of solid precipitation particles, J. Geophys. Res., 79, 2185–2197, https://doi.org/10.1029/JC079i015p02185, 1974. a, b, c, d
Loeb, N. G., Yang, P., Rose, F. G., Hong, G., Sun-Mack, S., Minnis, P., Kato, S., Ham, S.-H., Smith, W. L., Hioki, S., and Tang, G.: Impact of Ice Cloud Microphysics on Satellite Cloud Retrievals and Broadband Flux Radiative Transfer Model Calculations, J. Climate, 31, 1851–1864, https://doi.org/10.1175/JCLI-D-17-0426.1, 2018. a
Magono, C. and Lee, C. W.: Meteorological classification of natural snow crystals, J. Fac. Sci. Hokkaido Univ., 2, 321–335, 1966. a, b
Marchand, R., Mace, G., Hallar, A., McCubbin, I., Matrosov, S., and Shupe, M.: Enhanced Radar Backscattering due to Oriented Ice Particles at 95 GHz during StormVEx, J. Atmos. Ocean. Technol., 30, 2336–2351, https://doi.org/10.1175/JTECH-D-13-00005.1, 2013. a
Matrosov, S., Mace, G., Marchand, R., Shupe, M., Hallar, A., and McCubbin, I.: Observations of Ice Crystal Habits with a Scanning Polarimetric W-Band Radar at Slant Linear Depolarization Ratio Mode, J. Atmos. Ocean. Technol., 29, 989–1008, https://doi.org/10.1175/JTECH-D-11-00131.1, 2012. a
Mitchell, D. L.: Use of Mass- and Area-Dimensional Power Laws for Determining Precipitation Particle Terminal Velocities, J. Atmos. Sci., 53, 1710–1723, https://doi.org/10.1175/1520-0469(1996)053<1710:UOMAAD>2.0.CO;2, 1996. a, b, c, d, e, f
Mitchell, D. L., Rasch, P., Ivanova, D., McFarquhar, G., and Nousiainen, T.: Impact of small ice crystal assumptions on ice sedimentation rates in cirrus clouds and GCM simulations, Geophys. Res. Lett., 35, 1–5, https://doi.org/10.1029/2008GL033552, 2008. a
Nakaya, U.: Snow crystals: natural and artificial, Harvard University Press, Cambridge, 1954. a
Posselt, D. J., L'Ecuyer, T. S., and Stephens, G. L.: Exploring the error characteristics of thin ice cloud property retrievals using a Markov chain Monte Carlo algorithm, J. Geophys. Res., 113, D24206, https://doi.org/10.1029/2008JD010832, 2008. a
Pruppacher, H. R. and Klett, J. D.: Microphysics of clouds and precipitation, Kluwer Academic Publishers, Dordrecht, 2nd rev. and enl. edn., 1997. a
Schefold, R., Baschek, B., Wüest, M., and Barthazy, E.: Fall velocity and axial ratio of snowflakes, In Proceedings of ERAD (2002), pp. 1–6, Copernicus GmbH, available at: https://iacweb.ethz.ch/doc/publications/schefold_delft_2002.pdf (last access: 30 April 2021), 2002. a
SMHI: Ladda ner meteorologiska observationer, available at: https://www.smhi.se/data/meteorologi/ladda-ner-meteorologiska-observationer/#param=wind,stations=all,stationid=180940, last access: 5 February 2020. a
Stoelinga, M. T., Hobbs, P. V., Mass, C. F., Locatelli, J. D., Colle, B. A., Houze, R. A., Rangno, A. L., Bond, N. A., Smull, B. F., Rasmussen, R. M., Thompson, G., and Colman, B. R.: Improvement of Microphysical Parameterization through Observational Verification Experiment, Bull. Amer. Met. Soc., 84, 1807–1826, https://doi.org/10.1175/bams-84-12-1807, 2003. a, b
Sun, W., Hu, Y., Lin, B., Liu, Z., and Videen, G.: The impact of ice cloud particle microphysics on the uncertainty of ice water content retrievals, J. Quant. Spectrosc. Radiat. Transfer, 112, 189–196, https://doi.org/10.1016/j.jqsrt.2010.04.003, 2011. a, b
Tao, W.-K., Simpson, J., Baker, D., Braun, S., Chou, M.-D., Ferrier, B., Johnson, D., Khain, A., Lang, S., Lynn, B., Shie, C.-L., Starr, D., Sui, C.-H., Wang, Y., and Wetzel, P.: Microphysics, radiation and surface processes in the Goddard Cumulus Ensemble (GCE) model, Meteorol. Atmos. Phys., 82, 97–137, 2003. a, b
Vázquez-Martín, S., Kuhn, T., and Eliasson, S.: Shape Dependence of Falling Snow Crystals' Microphysical Properties Using an Updated Shape Classification, Appl. Sci., 10, 1163, https://doi.org/10.3390/app10031163, 2020. a, b, c, d, e, f, g, h
Westbrook, C. D. and Sephton, E. K.: Using 3-D-printed analogues to investigate the fall speeds and orientations of complex ice particles, Geophys. Res. Lett., 44, 7994–8001, https://doi.org/10.1002/2017GL074130, 2017. a, b
Xie, X. and Miao, J.: Polarization difference due to nonrandomly oriented ice particles at millimeter/submillimeter waveband, J. Quant. Spectrosc. Radiat. Transfer, 112, 1090–1098, https://doi.org/10.1016/j.jqsrt.2010.11.020, 2011. a
Xie, X., Löhnert, U., Kneifel, S., and Crewell, S.: Snow particle orientation observed by ground-based microwave radiometry, J. Geophys. Res.-Atmos., 117, D02206, https://doi.org/10.1029/2011JD016369, 2012. a
Xie, X., Crewell, S., Löhnert, U., Simmer, C., and Miao, J.: Polarization signatures and brightness temperatures caused by horizontally oriented snow particles at microwave bands: Effects of atmospheric absorption, J. Geophys. Res.-Atmos., 120, 6145–6160, https://doi.org/10.1002/2015JD023158, 2015. a
Xie, Y., Yang, P., Kattawar, G., Baum, B., and Hu, Y.: Simulation of the optical properties of plate aggregates for application to the remote sensing of cirrus clouds, Appl. Opt., 50, 1065–81, https://doi.org/10.1364/AO.50.001065, 2011. a
Yang, P., Zhang, Z., Kattawar, G. W., Warren, S. G., Baum, B. A., Huang, H.-L., Hu, Y. X., Winker, D., and Iaquinta, J.: Effect of Cavities on the Optical Properties of Bullet Rosettes: Implications for Active and Passive Remote Sensing of Ice Cloud Properties, J. Appl. Meteorol. Clim., 47, 2311–2330, https://doi.org/10.1175/2008JAMC1905.1, 2008. a, b
Yang, P., Wendisch, M., Bi, L., Kattawar, G., and Hu, Y.: Dependence of extinction cross-section on incident polarization state and particle orientation, J. Quant. Spectrosc. Radiat. Transfer, 112, 2035–2039, https://doi.org/10.1016/j.jqsrt.2011.04.012, 2011. a
Yuter, S., Kingsmill, D., Nance, L., and Löffler-Mang, M.: Observations of precipitation size and fall speed characteristics within coexisting rain and wet snow, J. Appl. Meteorol. Clim., 45, 1450–1464, 2006. a
Zawadzki, I., Jung, E., and Lee, G.: Snow Studies. Part I: A Study of Natural Variability of Snow Terminal Velocity, J. Atmos. Sci., 67, 1591–1604, https://doi.org/10.1175/2010JAS3342.1, 2010. a, b
Zhang, Z., Yang, P., Kattawar, G., Riedi, J., -Labonnote, L. C., Baum, B. A., Platnick, S., and Huang, H.-L.: Influence of ice particle model on satellite ice cloud retrieval: lessons learned from MODIS and POLDER cloud product comparison, Atmos. Chem. Phys., 9, 7115–7129, https://doi.org/10.5194/acp-9-7115-2009, 2009. a