the Creative Commons Attribution 4.0 License.
the Creative Commons Attribution 4.0 License.
 | 07 May 2021
Lidar vertical observation network and data assimilation reveal key processes driving the 3-D dynamic evolution of PM2.5 concentrations over the North China Plain
Tianshu Zhang
Chaoqun Ma
Lihui Lv
Jianguo Liu
Wenqing Liu
China has made great efforts to monitor and control air pollution in the past decade. Comprehensive characterization and understanding of pollutants in three-dimensions are, however, still lacking. Here, we used data from an observation network consisting of 13 aerosol lidars and more than 1000 ground observation stations combined with a data assimilation technique to conduct a comprehensive analysis of extreme heavy aerosol pollution (HAP) over the North China Plain (NCP) from November–December 2017. During the studied period, the maximum hourly mass concentration of surface PM2.5 reached ∼390 µg m−3. After assimilation, the correlation between model results and the independent observation sub-dataset was ∼50 % higher than that without the assimilation, and the root mean square error was reduced by ∼40 %. From pollution development to dissipation, we divided the HAP in the NCP (especially in Beijing) into four phases: an early phase (EP), a transport phase (TP), an accumulation phase (AP), and a removal phase (RP). We then analyzed the evolutionary characteristics of PM2.5 concentration during different phases on the surface and in 3-D space. We found that the particles were mainly transported from south to north at a height of 1–2 km (during EP and RP) and near the surface (during TP and AP). The amounts of PM2.5 advected into Beijing with the maximum transport flux intensity (TFI) were through the pathways in the relative order of the southwest > southeast > east pathways. The dissipation of PM2.5 in the RP stage (with negative TFI) was mainly from north to south with an average transport height of ∼1 km above the surface. Our results quantified the multi-dimensional distribution and evolution of PM2.5 concentration over the NCP, which may help policymakers develop efficient air pollution control strategies.
- Article
(20346 KB) - Full-text XML
-
Supplement
(2792 KB) - BibTeX
- EndNote


Frequent heavy air pollution has exerted significant impacts on air visibility, climate, human health, and other environmental concerns (J. Li et al., 2017; Gao et al., 2017; Pokharel et al., 2019; Su et al., 2020). As a developing country with the largest population in the world, China's air quality has exhibited an obvious improvement trend in recent years (Sun et al., 2015; Cao et al., 2017). Regional air pollution in China is still serious, however, especially the heavy aerosol pollution (HAP) caused by fine particulate matter (PM2.5) in winter, which has attracted attention worldwide (Zheng et al., 2015, 2019; X. Li et al., 2017; Cheng et al., 2016). Therefore, providing a reliable distribution of the PM2.5 concentration of HAP, especially at any time and at any height in a given region, is particularly important in the quest for avoiding public health problems and providing government policymakers with help in designing effective controls (Hu et al., 2015).
Compared with other air pollutants (e.g., ozone and nitrogen dioxide), PM2.5 has a longer atmospheric lifetime (3–5 d), during which it can be transported vertically to great heights and horizontally hundreds of kilometers (Wang et al., 2017; Zhang et al., 2014) depending on the meteorological conditions (e.g., relative humidity and precipitation) and chemical composition (Yang et al., 2017). Previous studies demonstrated that regional transport plays an important role for pollution formation in the major cities of China, e.g., transport contributes over 50 % of the PM2.5 mass concentration in Beijing city, Shanghai city, Hangzhou city, Guangzhou city, Hong Kong, and Chengdu city during the relatively polluted period (Sun et al., 2017). Annually from 2005–2010, about 35.5 % (32.8 µg m−3) of the PM2.5 in Beijing was attributed to regional transport from the North China Plain (NCP), within which up to 60.4 % (64.3 µg m−3) was from southerly and westerly air flows (Wang et al., 2015). Since the 2013 implementation of the most stringent clean air policy in China, the control of local pollution sources has led to the rapid reduction of total PM2.5 concentration (J. Wang et al., 2019). It should be noted, however, that the local contributions, intra-regional transport, and inter-regional transport accounted for 47 % (12.7 µg m−3), 25 % (6.6 µg m−3), and 28 % (7.6 µg m−3), respectively, of the total PM2.5 for the Beijing-Tianjin-Hebei (BTH) region from 2014–2017, with the 2017 contribution of regional transport to the BTH concentration rate ranging from 32.5 %–68.4 % (Dong et al., 2020).
Previous studies have shown that it is difficult to use surface observations to characterize the impact of upper-level pollutants in the atmosphere (X. Huang et al., 2018), which is affected by local emissions, regional transport, meteorological conditions, geographical factors, etc. (Tao et al., 2020; Che et al., 2019a). Therefore, understanding the key processes that drive the dynamic temporal and spatial evolutionary characteristics of pollutants on the NCP is essential for revealing the source and transport of aerosols, which has different radiative forcing at different heights (Kumar et al., 2017; Che et al., 2019b). Actually, stereo-monitoring devices and technologies, such as lidar (Sheng et al., 2019; Fan et al., 2019; Z. Chen et al., 2019), MAX-DOAS (Hong et al., 2018; Zhang et al., 2020), and satellite remote sensing (Pang et al., 2018; Schwartz et al., 2012; C. X. Zhang et al., 2019) can reveal the vertical distribution of pollutants at different heights (Tian et al., 2017; Heese et al., 2017). Due to the limited spatial and temporal observations, however, it is impossible to provide physical and chemical properties in the atmosphere at any time period and on any path, which makes it difficult to directly reveal the formation and source of pollution.
On the other hand, although the distribution of pollutants can be simulated by air quality models (M. Huang et al., 2018; Zhang et al., 2008), large uncertainties remain, mainly from the influence of emission inventory, meteorological fields, and some hypothetical conditions (Xu et al., 2016; Zhang et al., 2017; Huang et al., 2016). Fortunately, the above observed data and the results of the model can be fused using data assimilation techniques, which can correct the model simulation results via the observed data (Wang et al., 2013; Ma et al., 2019). Research has shown that mainstream data assimilation (DA) technologies, including 3DVAR (Jiang et al., 2013; Ma et al., 2018), 4DVAR (Yumimoto et al., 2008), and EnKF (D. Chen et al., 2019), can be used to assimilate observation data from the surface, remote sensing data (such as aerosol optical depth – AOD) from satellites, and vertical profile data from lidar, all of which can be used to improve the performance of the model, including the simulation of PM2.5 and PM10.
In this study, we analyzed the observation data from a vertical observation network consisting of 13 lidars and surface observation stations during an extreme pollution event in eastern China, especially in the NCP. Next, all of the data were utilized by the Gridpoint Statistical Interpolation (GSI) three-dimensional (3-D) variational (3DVAR) data assimilation system to revise the PM2.5 results from the WRF-Chem simulation (Pagowski et al., 2014). Finally, the multi-dimensional evolutionary characteristics of PM2.5 at the surface and in the vertical layer, as well as the 3-D distribution, were analyzed in detail. Although data assimilation has been applied in China using surface observation network data (Gao et al., 2017), AOD (Saide et al., 2013, 2014; Schwartz et al., 2012; Liu et al., 2011), and lidar data (Cheng et al., 2019), to our knowledge, this is the first attempt in China to apply lidar network data to assimilation technology, from which the high-precision 3-D distribution of pollutants can be provided, thus supplying effective data support for clarifying the formation mechanism of pollutants (Zheng et al., 2017).
2.1 Lidar observation network
The vertical aerosol observation network of the NCP was composed of 13 aerosol lidar monitoring stations (Fig. 1) covering four main transport channels of Beijing pollutants, including the southwestern transport path of Baoding City (BD), Shijiazhuang City (SJZ), Xingtai City (XT), Handan City (HD), Xinxiang City (XX), and Yangquan City (YQ); the southern transport path of Dezhou City (DZ) and Jining City (JN); the southeastern transport path of Langfang City (LF), Cangzhou City (CZ), and Zibo City (ZB); the eastern transport path of Tianjin City (TJ); and a lidar in the urban area of Beijing (BJ).
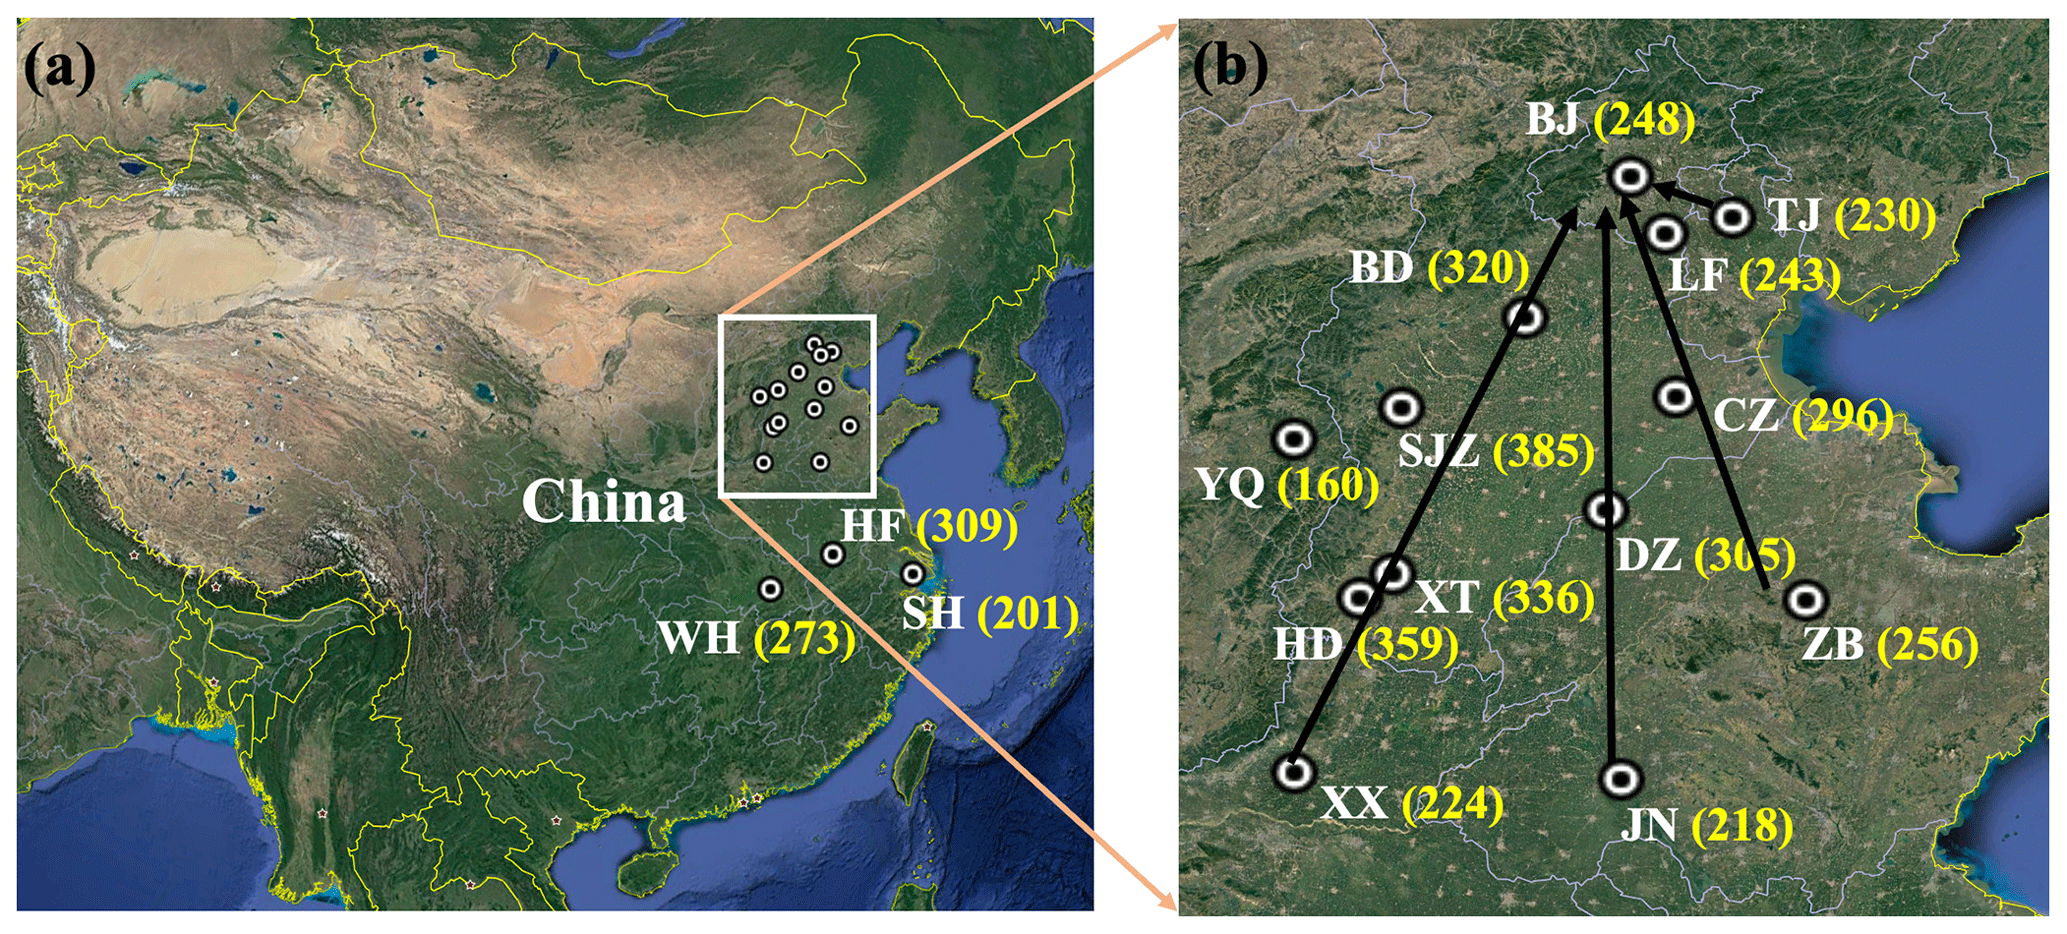
Figure 1© Google Earth map of (a) China with the studied cities and (b) the North China Plain with all the lidar stations. The data in brackets are the maximum PM2.5 concentrations (µg m−3) at the surface during the observation period. The black arrows in (b) from left to right show that the main pollution pathways of Beijing come from the four directions of southwest, south, southeast, and east.
The lidar system was developed by the Anhui Institute of Optics and Fine Mechanics (AIOFM), Chinese Academy of Sciences (CAS), and was used for the long-term continuous observation of aerosol vertical distribution. The lidar system adopted the Nd:YAG laser, which emits a 532 nm wavelength with 30 mJ single-pulse energy and 10–30 Hz pulse repetition frequency. The vertical resolution is 7.5 m with the original time resolution of 3–10 min. The detection blind area is 0.1 km, and more specific technical details can be found in Xiang et al. (2019). The vertical distribution of the aerosol extinction coefficient was retrieved using the Fernald method (Fernald, 1984), which is more suitable for vertical detection and more accurate than the Collis (Collis et al., 1964) and Klett (Klett, 1981) methods (Schafer et al., 2015). Furthermore, combining the extinction coefficient with the PM2.5 in situ surface observations, the vertical distribution of the PM2.5 mass concentration in the boundary layer was obtained using the empirical formula fitting method, which has proven to be reliable and highly accurate; the specific technical details can be found in the literature (L. Lv et al., 2017; Tao et al., 2016; L. H. Lv et al., 2017). In addition, an image recognition algorithm was used to evaluate the height of the atmospheric boundary layer (Xiang et al., 2019; Barrera et al., 2019).
2.2 WRF-Chem model configurations
The WRF-Chem chemical transport model (version 3.8.1) was used to investigate the particulate concentrations and meteorological parameters in the study area and was configured with nested domains consisting of 100×100 (36 km) and 103×103 (12 km) grids (Fig. S1 in the Supplement). The domain had 41 vertical layers from the surface to 50 hPa. To better simulate the conditions within the boundary layer, the resolution of the boundary layer was increased and 20 layers were set in the range of 0–2 km. The initial and boundary meteorological conditions were derived from the 6 h National Centers for Environmental Prediction Final Analysis data with spatial resolution. The inventory of anthropogenic emissions for 2016 was obtained from the Multi-resolution Emission Inventory for China (MEIC) data with resolution (Zhou et al., 2017). Terrestrial biogenic emissions were estimated using the Model of Emissions of Gases and Aerosols from Nature (MEGAN) model (Chatani et al., 2011). The gas-phase chemistry module CBM-Z and the Model for Simulating Aerosol Interactions and Chemistry (MOSAIC) aerosol module were used in this simulation. Detailed information concerning the model configuration is provided in Table S1 in the Supplement. The model runs from 20 November–9 December 2017, and the results from 25 November–9 December 2017 were used for the analysis in Sect. 3.
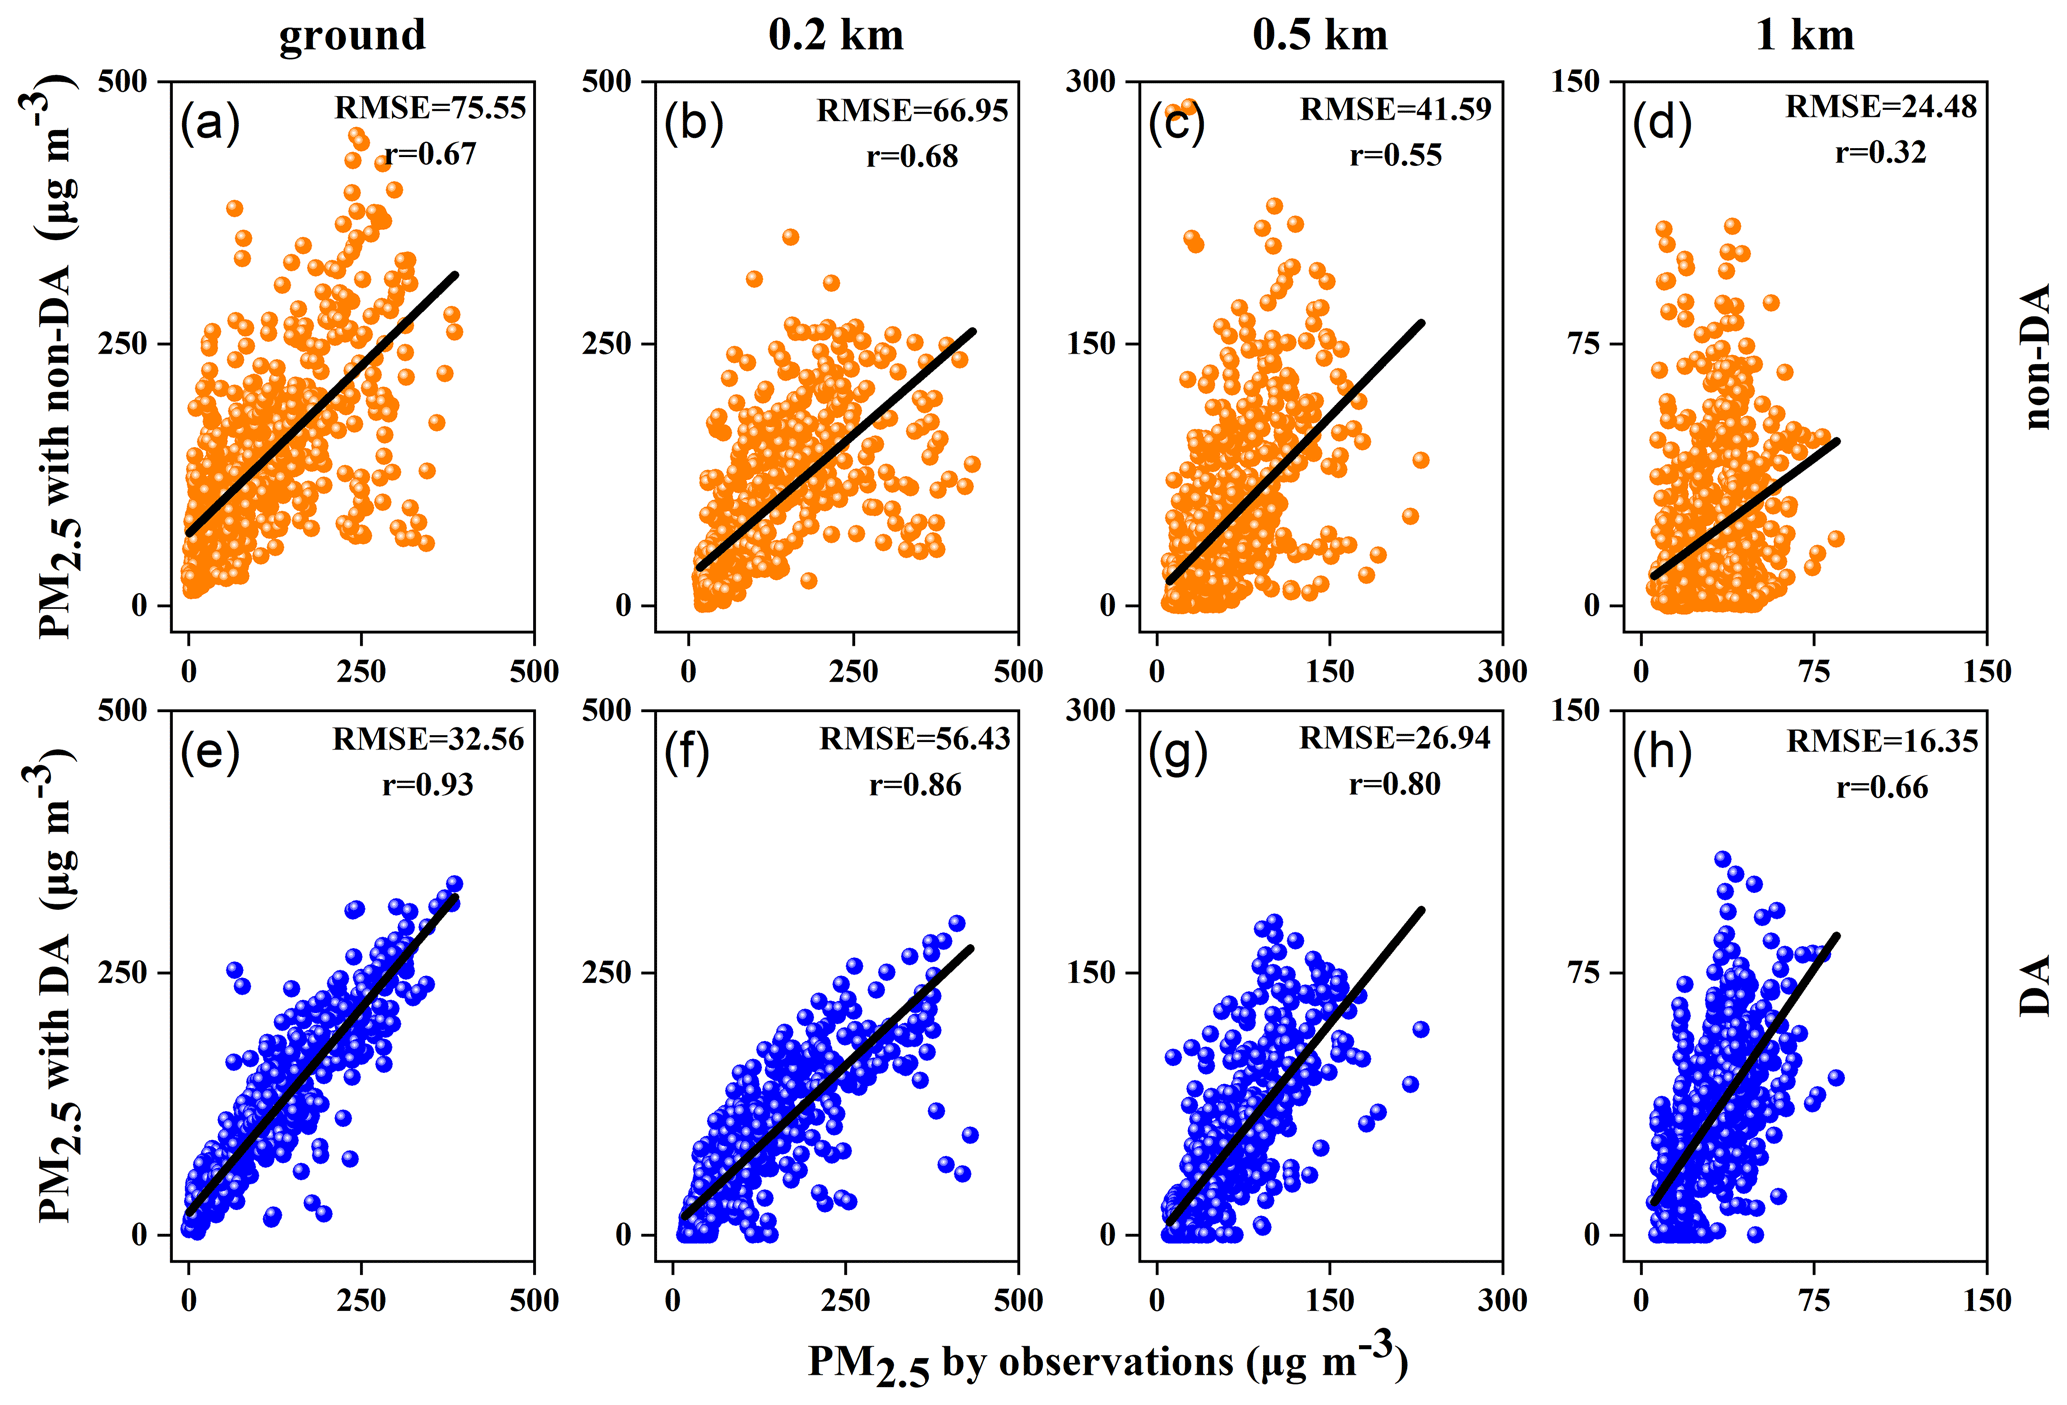
Figure 2PM2.5 mass concentration comparison results from lidar at different heights (b–d, f–h) and surface observations (a, e) with non-assimilation simulations (a–d) and assimilation simulations (e–h).
2.3 GSI 3DVAR DA system
The GSI DA (Gridpoint Statistical Interpolation Data Assimilation) system provides 3DVAR analysis by minimizing the cost function as shown below (Gao et al., 2017):
In this equation, x is the analysis vector, xb denotes the background vector, y is an observation vector, B represents the background error covariance matrix, R represents the observation error covariance matrix, and H is the observation operator used to transform model grid point values to observed variables, which was performed via interpolation in our research. The background error covariance matrix was calculated using the National Meteorological Center (NMC) method (Parrish and Derber, 1992; Saide et al., 2013), which simulated the difference of results at the same time (25 November 2017) with two different starting times (20 and 21 November 2017, respectively). The 1 h assimilated window data included 13 groups (see Fig. 1 for site distribution) of PM2.5 vertical profiles retrieved from lidar and the surface PM2.5 data from hundreds of surface monitoring stations (see Fig. 5 for site distribution) from the China Environmental Monitoring Center. The observation errors of ground PM2.5 and its vertical distribution (through the ground PM2.5 fitting method in Sect. 2.1) originated from measurement errors and representative errors. The measurement error was computed using (Pagowski et al., 2014), where “obs” indicates observed values. The representative error was computed using (Elbern et al., 2007), where γ is the adjustable scale factor (we used the value of 0.5 recommended by the GSI system), Δx is the model grid resolution (we selected 12 km of domain 2), and L is the influencing radius (we used 60 km).
3.1 Evaluation of assimilation performance using vertical PM2.5 data
In order to evaluate the improvement of model simulation performance from data assimilation using lidar vertical profile data and surface station data, considering the sharp decline of PM2.5 value at 1 km height (Fig. 6), only the non-assimilation and assimilation results at the surface, 0.2, 0.5, and 1 km were compared, as shown in Fig. 2. These data were selected from five of the most polluted stations, including the cities of TJ, LF, BD, SJZ, and XT. It should be noted that these observation data were not assimilated, which means that the following comparisons are independent (Bocquet et al., 2015). Obviously, the data assimilation used can greatly improve the simulation accuracy. Compared with the observation data at different heights (ground, 0.2, 0.5, and 1 km), the simulation results of PM2.5 levels under the condition of non-assimilation were higher (Fig. 2a–d), the root mean square error (RMSE) was 52.14±20.27 µg m−3, and the correlation coefficient was only 0.56±0.15. Correspondingly, the results of PM2.5 simulated with assimilation were closer to the observed values (Fig. 2e–h) and the RMSE was 33.07±14.69 µg m−3, which represents a reduction of about 40 % in simulation error after assimilation. The correlation coefficient was 0.81±0.10, demonstrating that the simulation accuracy was improved by about 50 % after assimilation.
In addition, compared with the simulation with assimilation (Fig. 5 in Sect. 3.3), the results without assimilation were significantly higher than the observed values (Fig. S2 in the Supplement), especially during the pollution period (Fig. S2d and e), which may be due to the simulation error caused by the model (Zhang et al., 2016). Meanwhile, the comparison of the 3-D results (Fig. 7 in Sect. 3.5 and Fig. S3 in the Supplement) further reveals that the simulation results of upper air PM2.5 may also overestimate the actual values, which demonstrates the importance of data assimilation in capturing the 3-D structure of pollution.
3.2 The four phases from aerosol pollution development to dissipation
Joint observations and analyses have been widely performed in an effort to reveal the heavy aerosol pollution (HAP) in the NCP region (Li et al., 2016; Zhang et al., 2018). The key processes of a HAP event, from aerosol pollution development to dissipation, usually include an early phase (EP), a transport phase (TP), an accumulation phase (AP), and a removal phase (RP) (Yuan et al., 2019; Zhong et al., 2017), classifications that are based on the increase and decrease of PM2.5 mass concentration in Beijing (BJ) caused by changes in meteorological conditions. Here, the curves in Fig. 3 show the temporal evolution of PM2.5 mass concentration monitored at the surface in different cities on the NCP from 25 November–9 December 2017, while the superimposed colors represent the time-varying profiles of the simulated wind fields in BJ, Baoding (BD), Dezhou (DZ), and Langfang (LF), respectively. Overall, PM2.5 with high concentrations was usually associated with pronounced southerly winds (S in Fig. 3) or southwesterly winds (SW in Fig. 3), while the PM2.5 concentrations decreased significantly under the prevailing northerly winds (including the wind directions of N, NW, and NE in Fig. 3).
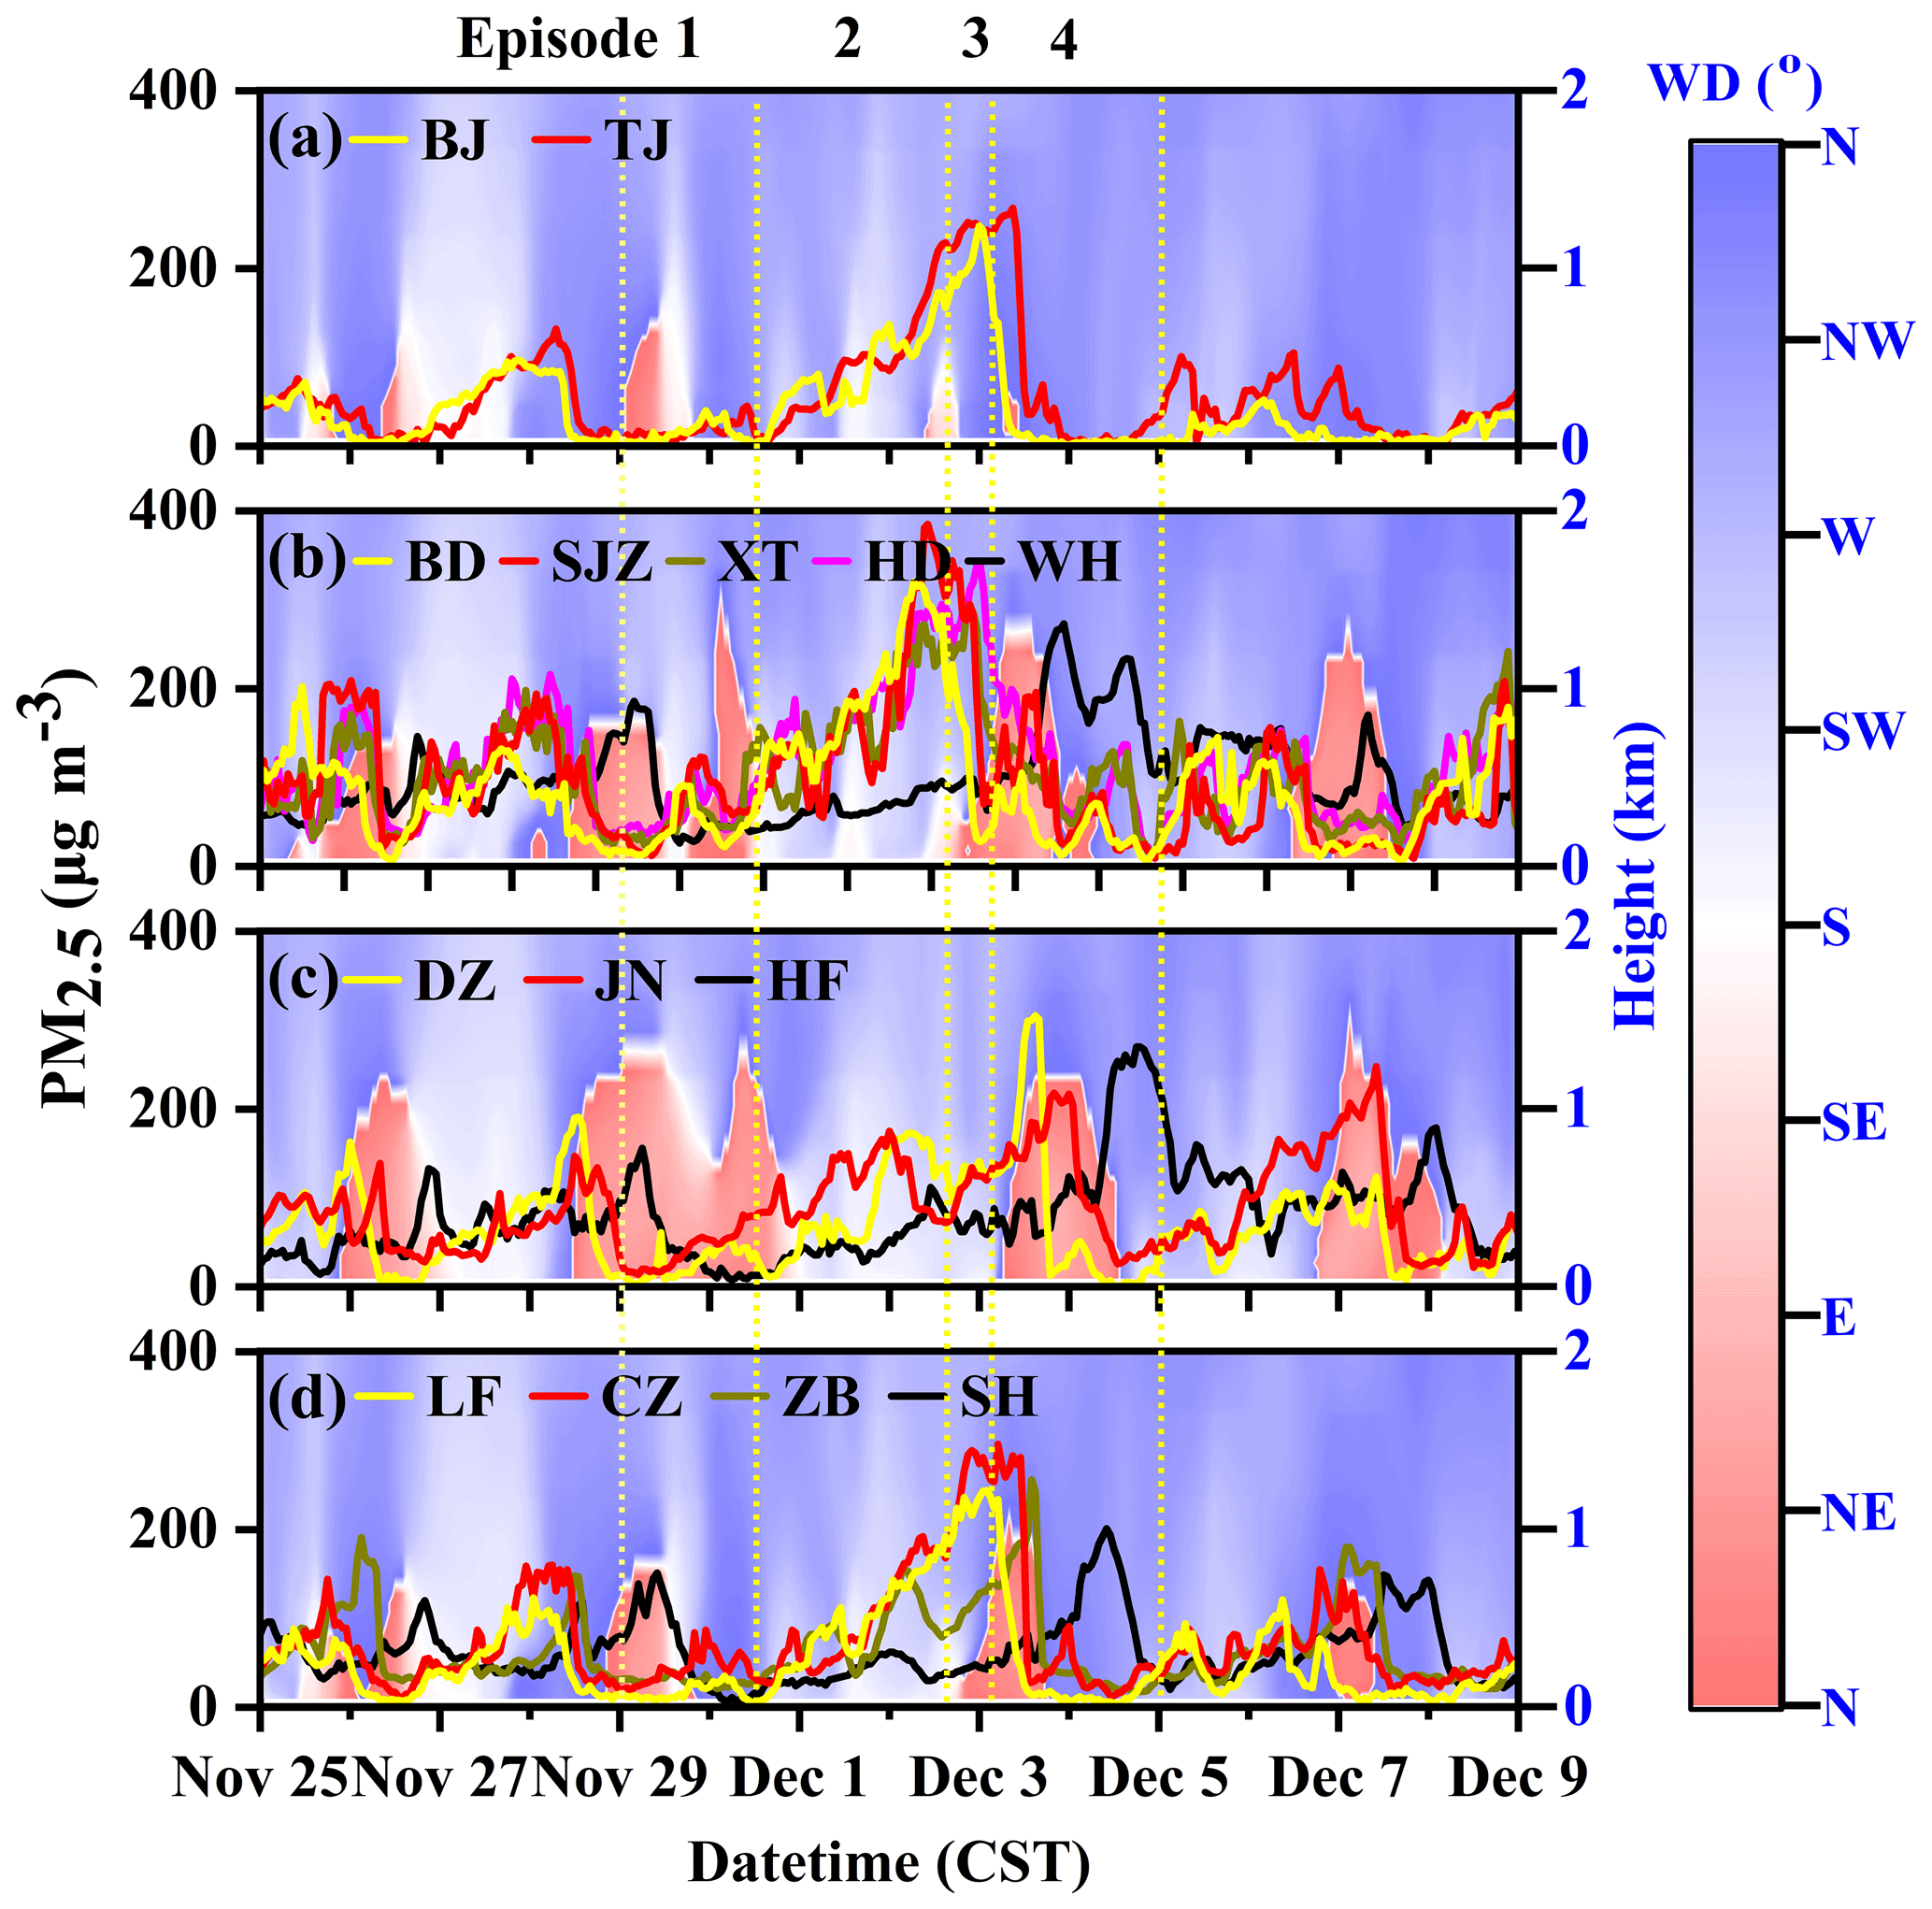
Figure 3Surface PM2.5 observations from different cities: (a) Beijing (including Tianjin) and its (b) southwest cities, (c) southeast cities, and (d) east cities for the period 25 November–9 December 2017. Superimposed colors represent the time-varying profiles of the simulated wind fields in Beijing, Baoding, Dezhou, and Langfang, respectively.
Furthermore, in order to characterize the evolution of PM2.5 during different pollution phases, the period from 29 November–5 December was selected as a typical extreme HAP event covering the four pollution phases. This extreme pollution event lasted more than 4 d and featured a regional transport process. During the EP (29 November–noon 30 November; episode 1 in Fig. 3), the air quality in BJ and its surrounding areas such as Tianjin (TJ) was relatively good, with an average PM2.5 value of ∼15 µg m−3, while slight pollution occurred to the southwest of BJ, including BD, Shijiazhuang (SJZ), Xingtai (XT), and Handan (HD), with an average value of ∼50 µg m−3.
During the TP (approximately the morning of 2 December; episode 2 in Fig. 3), the variation of PM2.5 concentration was more sensitive and responded rapidly to the wind shift from northerly to southerly, causing the PM2.5 concentration in Beijing to increase quickly from ∼30 to ∼50 µg m−3, while southwest of Beijing (e.g., BD, SJZ, XT, and HD) the PM2.5 concentration increased rapidly to ∼200 µg m−3. Research has revealed that the pollutant transport south of Beijing, especially in the southwest areas (the Taihang Mountains), is the most important contribution source to Beijing pollutants (Zhao et al., 2020). During the AP (approximately 3 December; episode 3 in Fig. 3), diffusion of the pollutants was difficult due to the occurrence of a surface temperature inversion in Beijing (Fig. 4) (L. L. Wang et al., 2019), which caused the maximum concentration of PM2.5 in Beijing to reach ∼250 µg m−3. Meanwhile, the PM2.5 concentrations in TJ, LF, BD, and SJZ reached maximum values of ∼270, 250, 320, and 390 µg m−3, respectively. Conversely, the pollution levels in Shanghai (SH), Hefei (HF), and Wuhan (WH) in the southernmost section of the NCP were relatively low with average values < ∼60 µg m−3.

Figure 4Time series of vertical temperatures (a, c, e, g) and temperature gradients (b, d, f, h) from Beijing (a, b), Baoding (c, d), Dezhou (e, f), and Langfang (g, h) simulated by the WRF-Chem model.
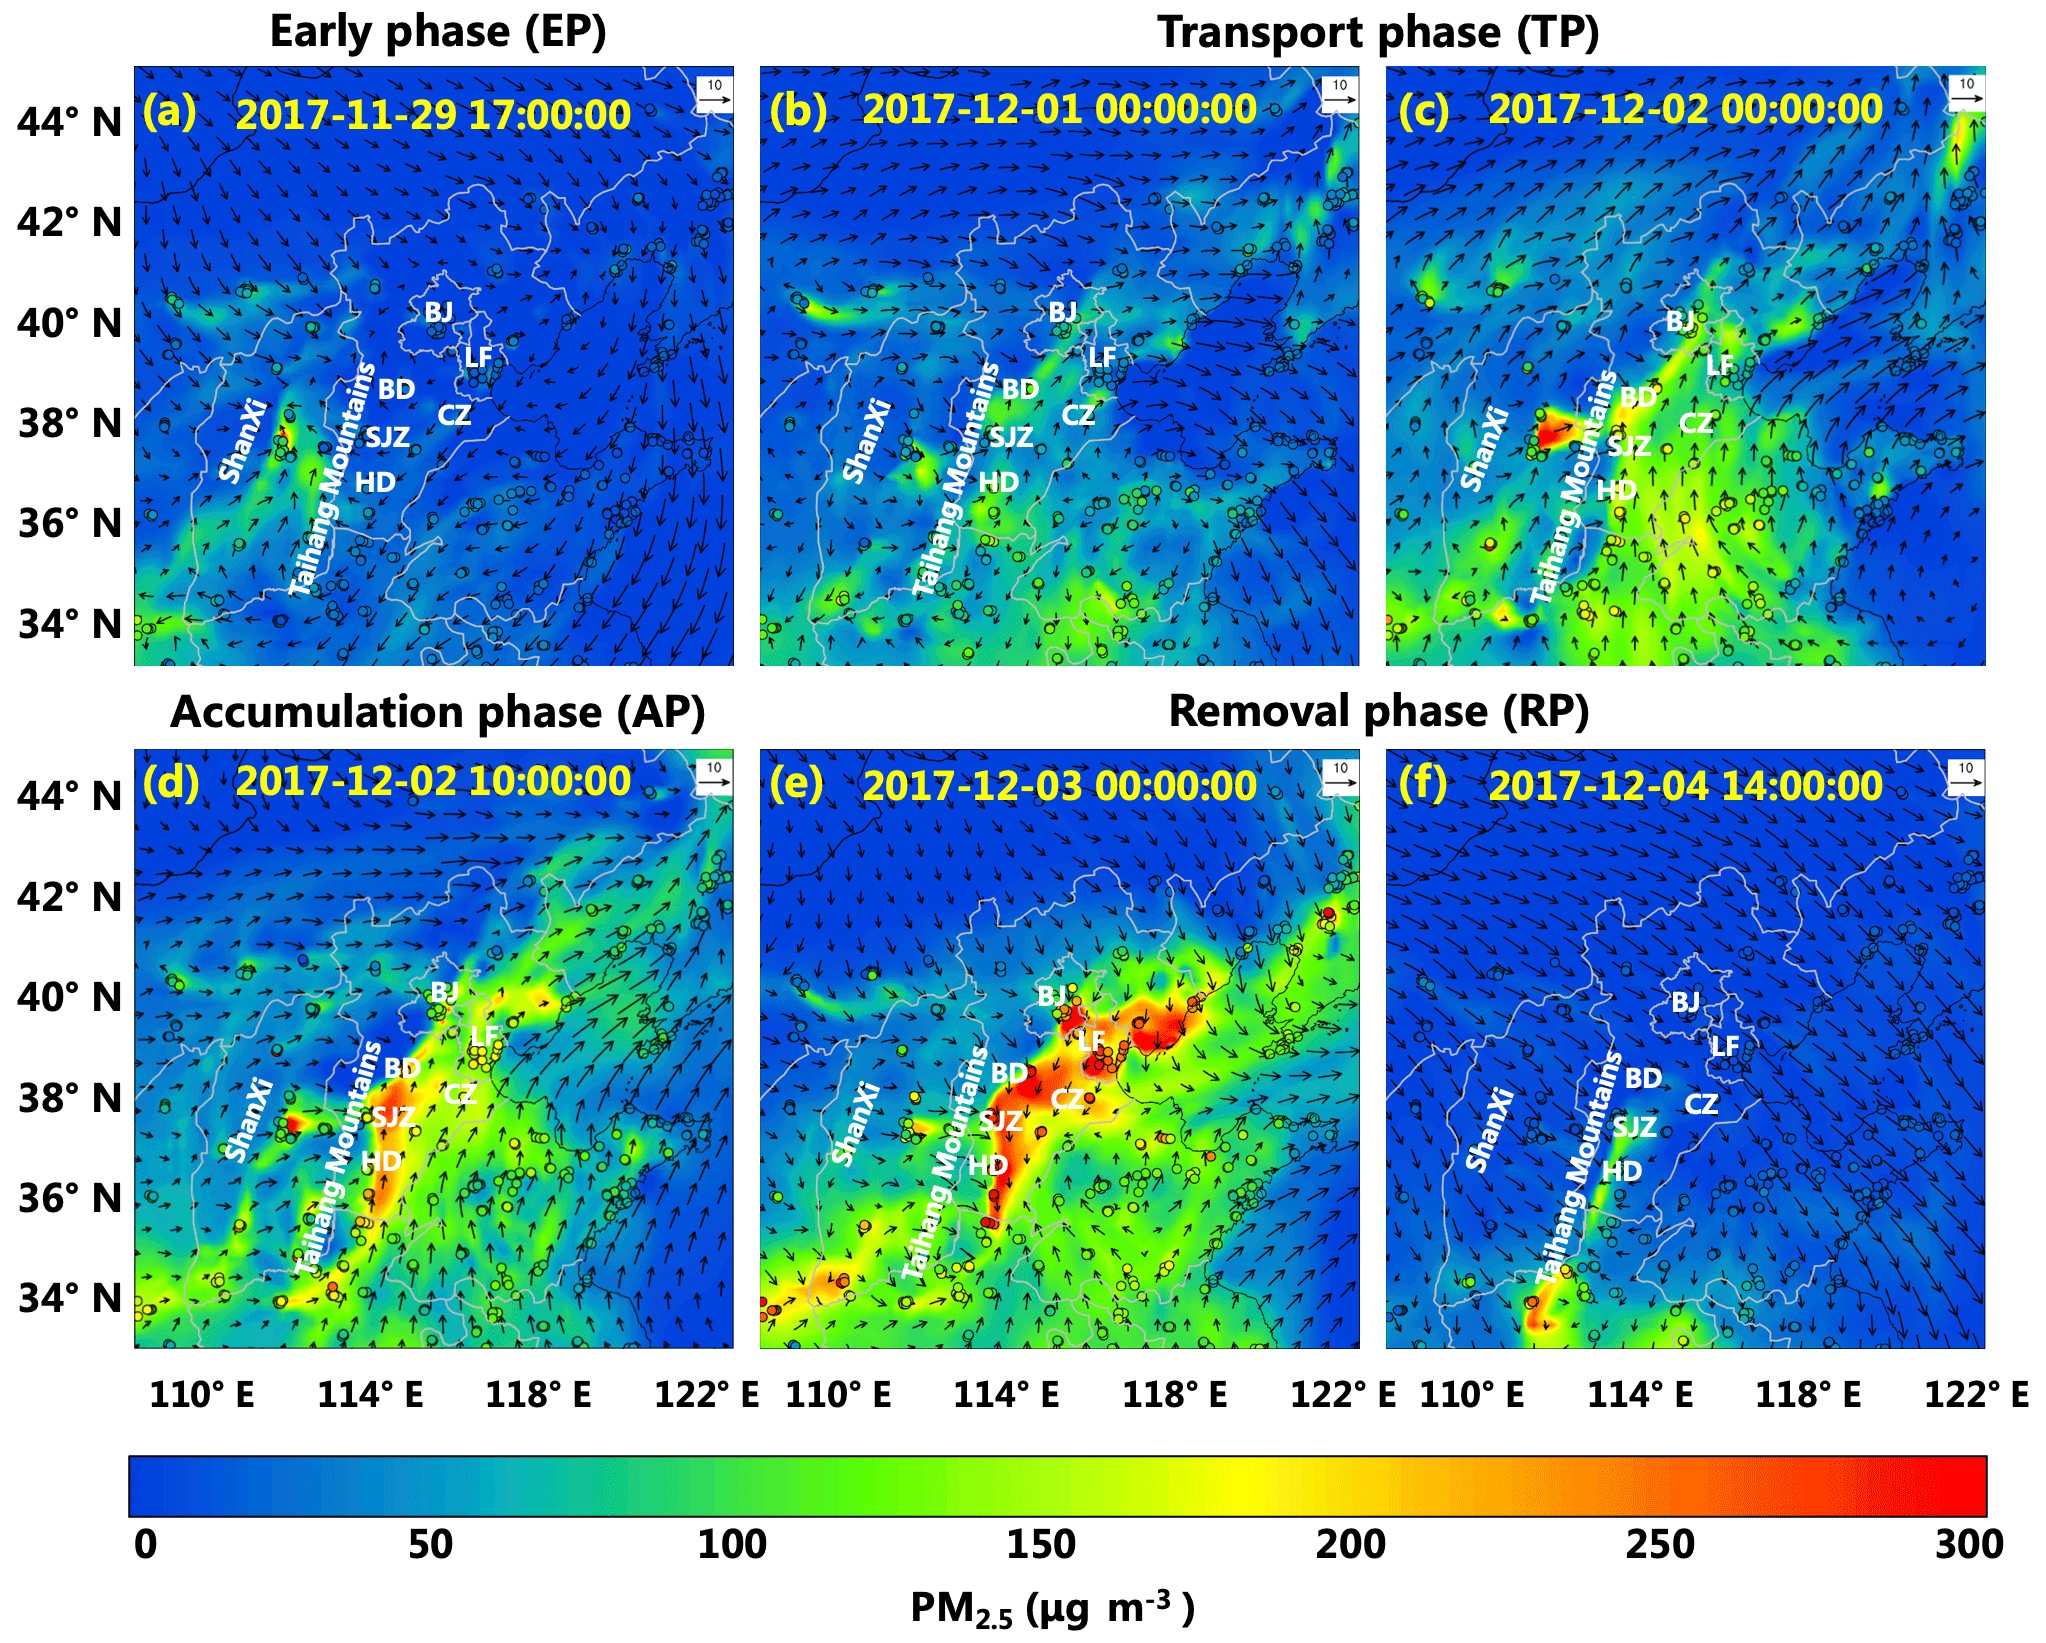
Figure 5Spatial distribution of PM2.5 in the surface layer during different phases after assimilation. The black arrows indicate the wind direction. The circles represent the in situ surface observations.
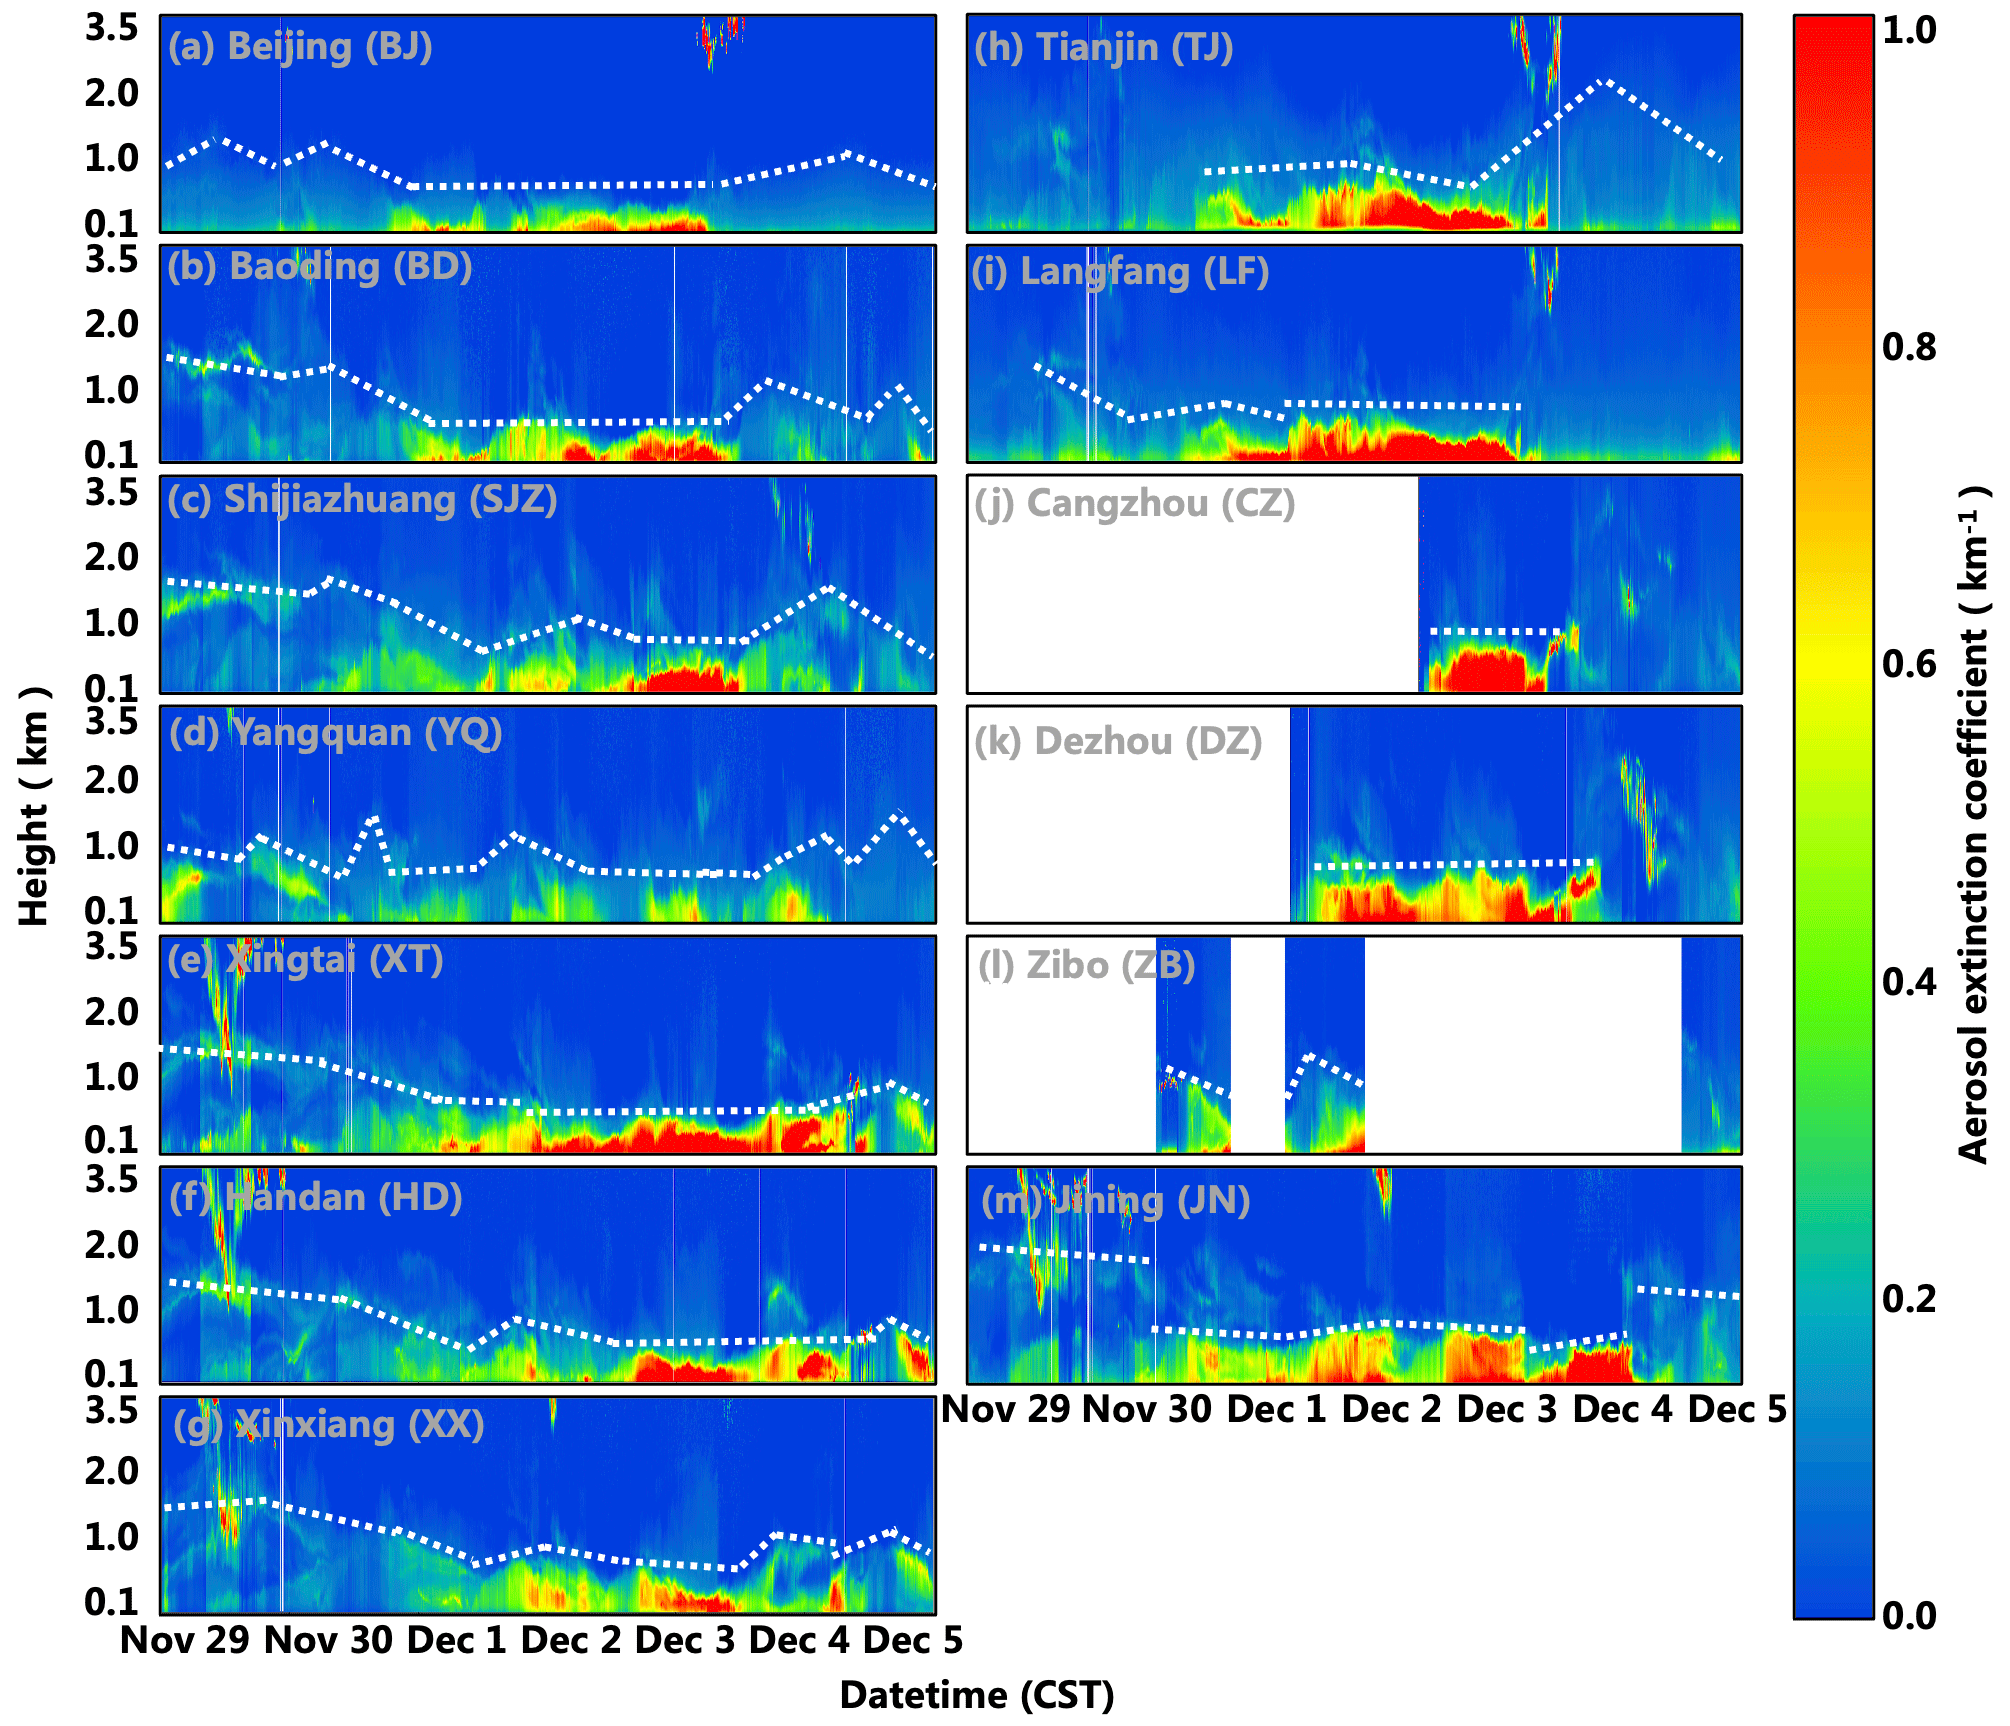
Figure 6Time series of vertical distributions of the aerosol extinction coefficient observed on the North China Plain from 29 November–5 December 2017. The white dashed lines represent the approximate atmospheric boundary layer height. Missing datasets are plotted in white.
During the RP (approximately 5 December; episode 4 in Fig. 3), the wind direction shifted from southwest to north, transporting the relatively clean air in the north to the south and thereby causing the pollutant concentrations in Beijing to decrease rapidly. In just 9 h, the air quality improved from heavy pollution to excellent, and the PM2.5 concentrations in the NCP also decreased significantly. Finally, by noon on 4 December, the pollutant concentrations in the NCP had reached a low level, with an average value of ∼40 µg m−3. In contrast, due to the continuous southward advection of pollutants, serious pollution occurred in SH, HF, and WH, where the PM2.5 concentrations reached maximum values of ∼210, 310, and 280 µg m−3, respectively. These findings are also consistent with the results of previous studies on the regional transport of regional pollutants to the Yangtze River Delta (Hua et al., 2015), which showed them to be due to the continuous southward flow of northwest and northeast winds.
3.3 Spatial distribution of PM2.5 concentration in the surface layer
Additionally, in order to analyze the pollution characteristics of the NCP, the spatial distribution results of PM2.5 after data assimilation were plotted in Fig. 5 for all phases. The high concentrations of PM2.5 in BJ were recorded during the TP, AP, and beginning of the RP, while the PM2.5 concentrations at other times were lower. Moreover, during the EP, only the eastern cities of Shanxi (SX) Province experienced moderate pollution levels (Fig. 5a). During the TP, the pollutants in the south-central NCP were transported to the north of the NCP (Fig. 5b and c) as a result of the southwesterly wind field, and under the superposition of the local pollutant emissions from each city (J. Li et al., 2017), the cities on the windward side of the Taihang Mountains (e.g., HD, SJZ, and BD) quickly developed varying levels of heavy pollution. In addition, during the AP, due to the large-scale inversion (Fig. 4b, d, f, h) caused by the rapid temperature rise (Fig. 4a, c, e, g) of the NCP region at upper levels, the atmospheric stratification was stable, causing pollutant loading on the NCP (including BJ, BD, SJZ, HD, LF, CZ, and elsewhere) to increase (Fig. 5d), nearly reaching their pollution maxima (Fig. 3). Meanwhile, during the RP, affected by the cold air at upper levels (Fig. 4a, c, e, g) from the northwest and the shift in wind direction over the NCP from southwest to north, the pollution severity gradually eased from north to south (Fig. 5e), with the air quality in the northern part of the region improving significantly (Fig. 5f).
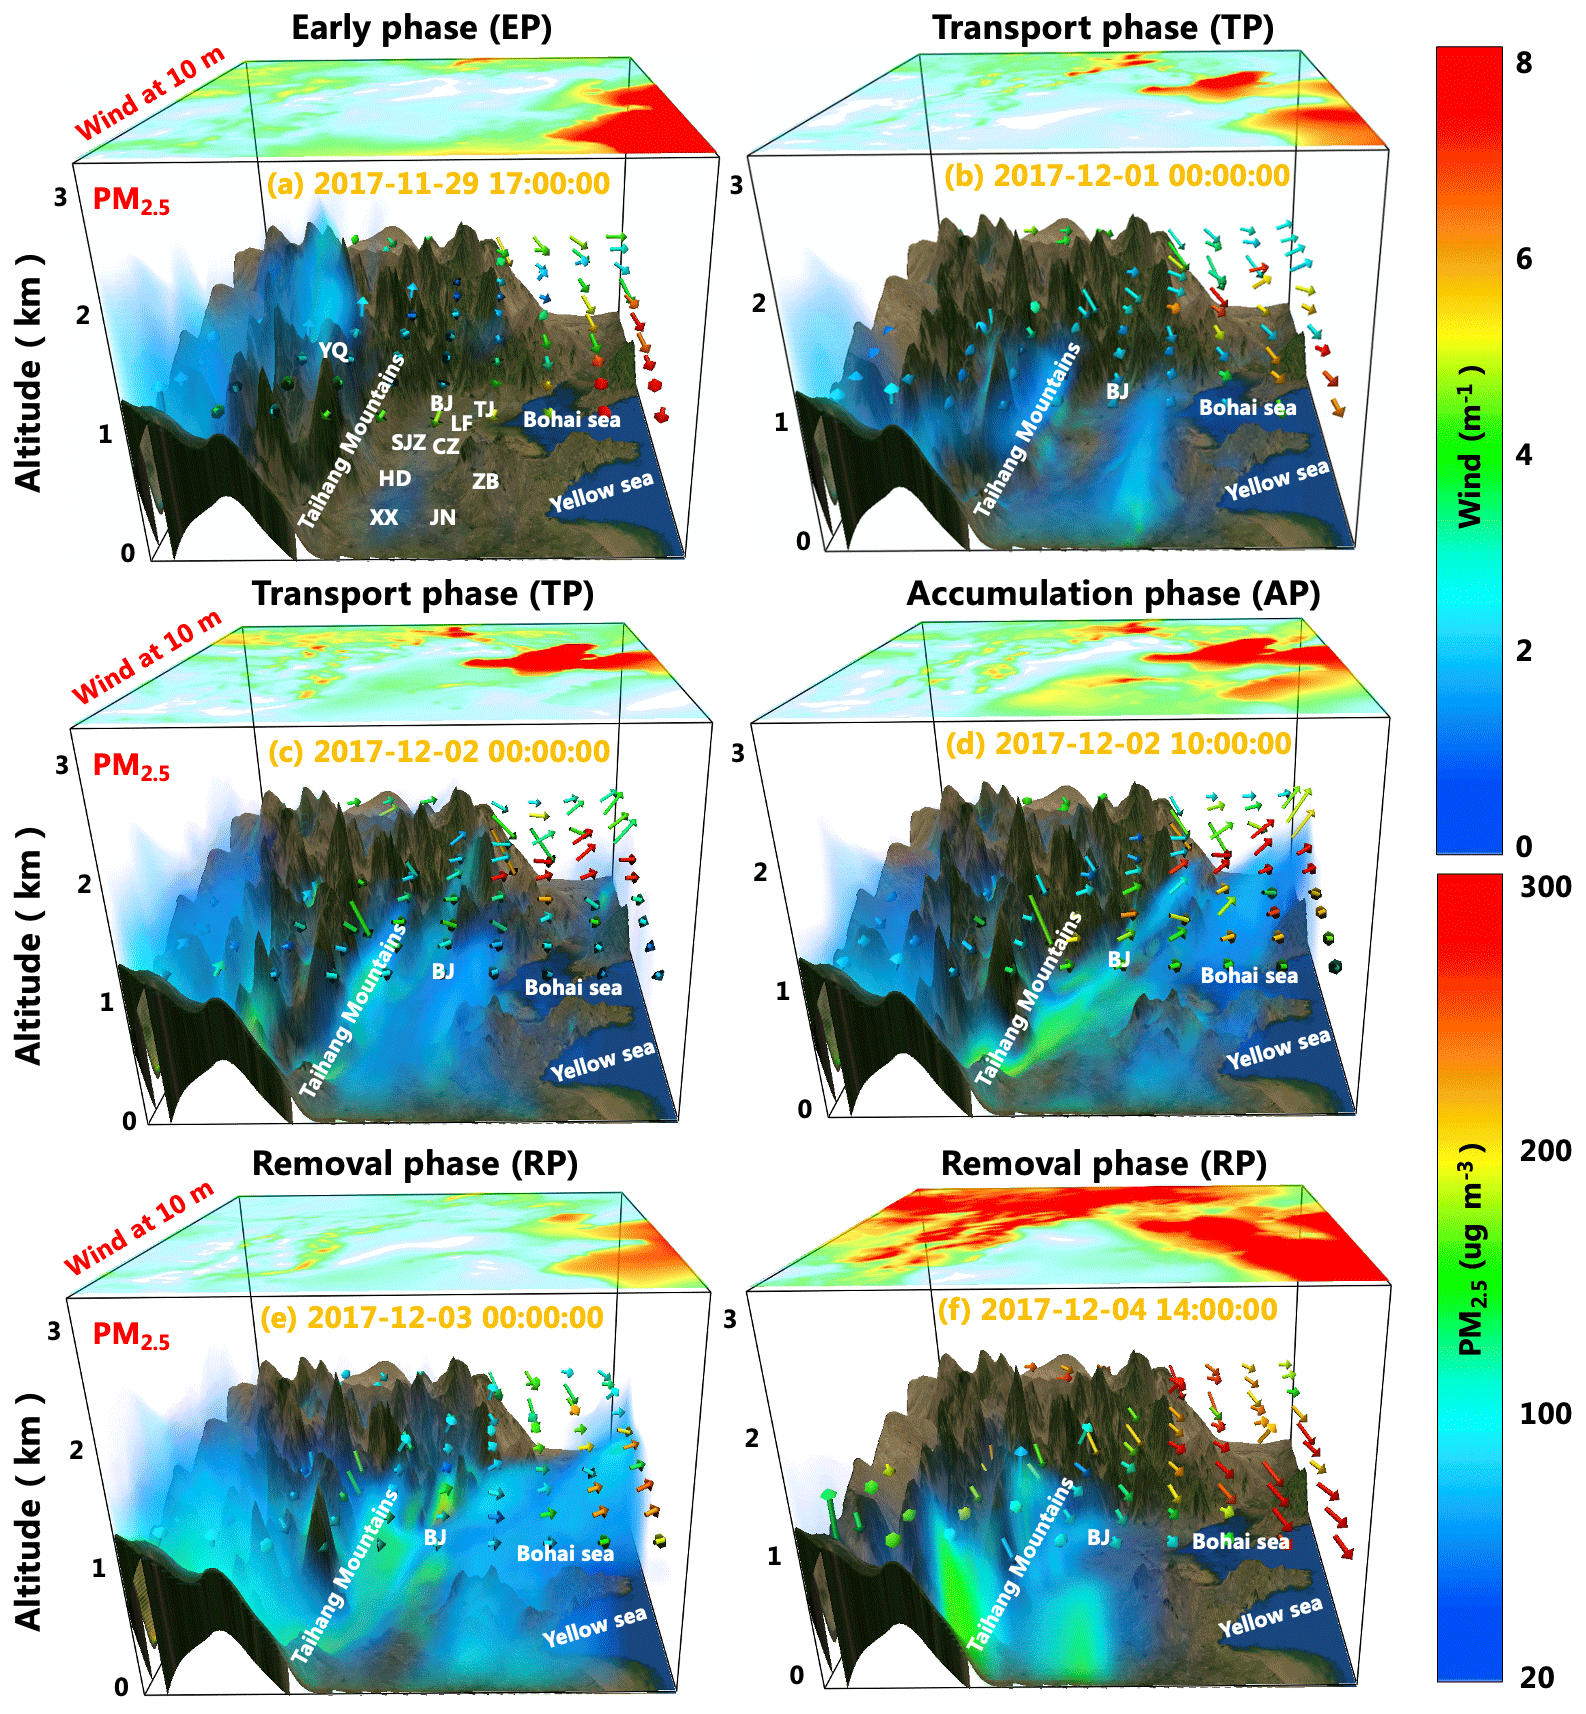
Figure 73-D distribution of PM2.5 during different phases after assimilation. Colors within the boxes depict the PM2.5 concentrations. The color-coded arrows represent the wind direction and speed at 1 km. On the tops of the boxes, the spatial distributions of wind speed at 10 m are plotted.
3.4 Vertical distribution of aerosols observed by the lidar network
In order to quantify the characteristic vertical distribution of aerosols, the observed aerosol extinction coefficients from the 13 lidar stations in the NCP were plotted, as shown in Fig. 6. These results revealed that on 29 November the aerosol concentration at the surface was relatively low, although pollutant transport at heights of 1–2 km (see Fig. 8a and e) occurred at six stations (BD, SJZ, YQ, XT, HD, and XX) on the windward side of the Taihang Mountains. Figure S4 in the Supplement demonstrates that these pollutants in the upper air come from the local emissions on the ground, which is due to the updraft lifting to 1–2 km above the ground on the night of 28 November. The upper air transport of pollutants continued until 1 December, at which point it merged with the surface flow. Contrary to this, the pollutant transport from north to south occurred at a height of 1 km during the RP (e.g., Fig. 6b and d–g). In addition, the atmospheric boundary layer height (ABLH) reached its highest value of the observation period from 29 to 30 November, averaging more than 1.5 km. The ABLH began to decrease on 1 December, averaging approximately 1 km on that day. The lowest value of the ABLH occurred on 2–3 December, when its average dropped to less than 0.5 km, making it difficult for pollutants to diffuse and causing heavy pollution in the NCP (Z. Q. Li et al., 2017). Fortunately, on 4 December, the atmospheric boundary layer gradually lifted, which was conducive to the diffusion of pollutants.
3.5 Dynamic 3-D evolution of the PM2.5 concentrations
Figure 7 presents the 3-D distribution of PM2.5 after assimilation, which clearly shows the generation, dissipation, transport, and diffusion characteristics of pollutants in the atmosphere. The tops of the boxes in the figure depict the wind speeds 10 m above the surface. During the EP, the high-concentration pollutants only occurred in the upper air within ∼1 km of the surface in SX Province (e.g., YQ). During the TP, the high-concentration pollutants were mainly found on the windward side of the Taihang Mountains (southwest pathway) and the loading height of PM2.5 was <1 km, which is illustrated in Fig. 8. During the AP, the average concentration of pollutants > 200 µg m−3 mainly occurred near the surface. Meanwhile, the pollutants with low concentrations at upper levels could be transported to the Bohai Sea. During the RP, high-concentration pollutants > 100 µg m−3 simultaneously occurred over the Bohai Sea and the Yellow Sea.
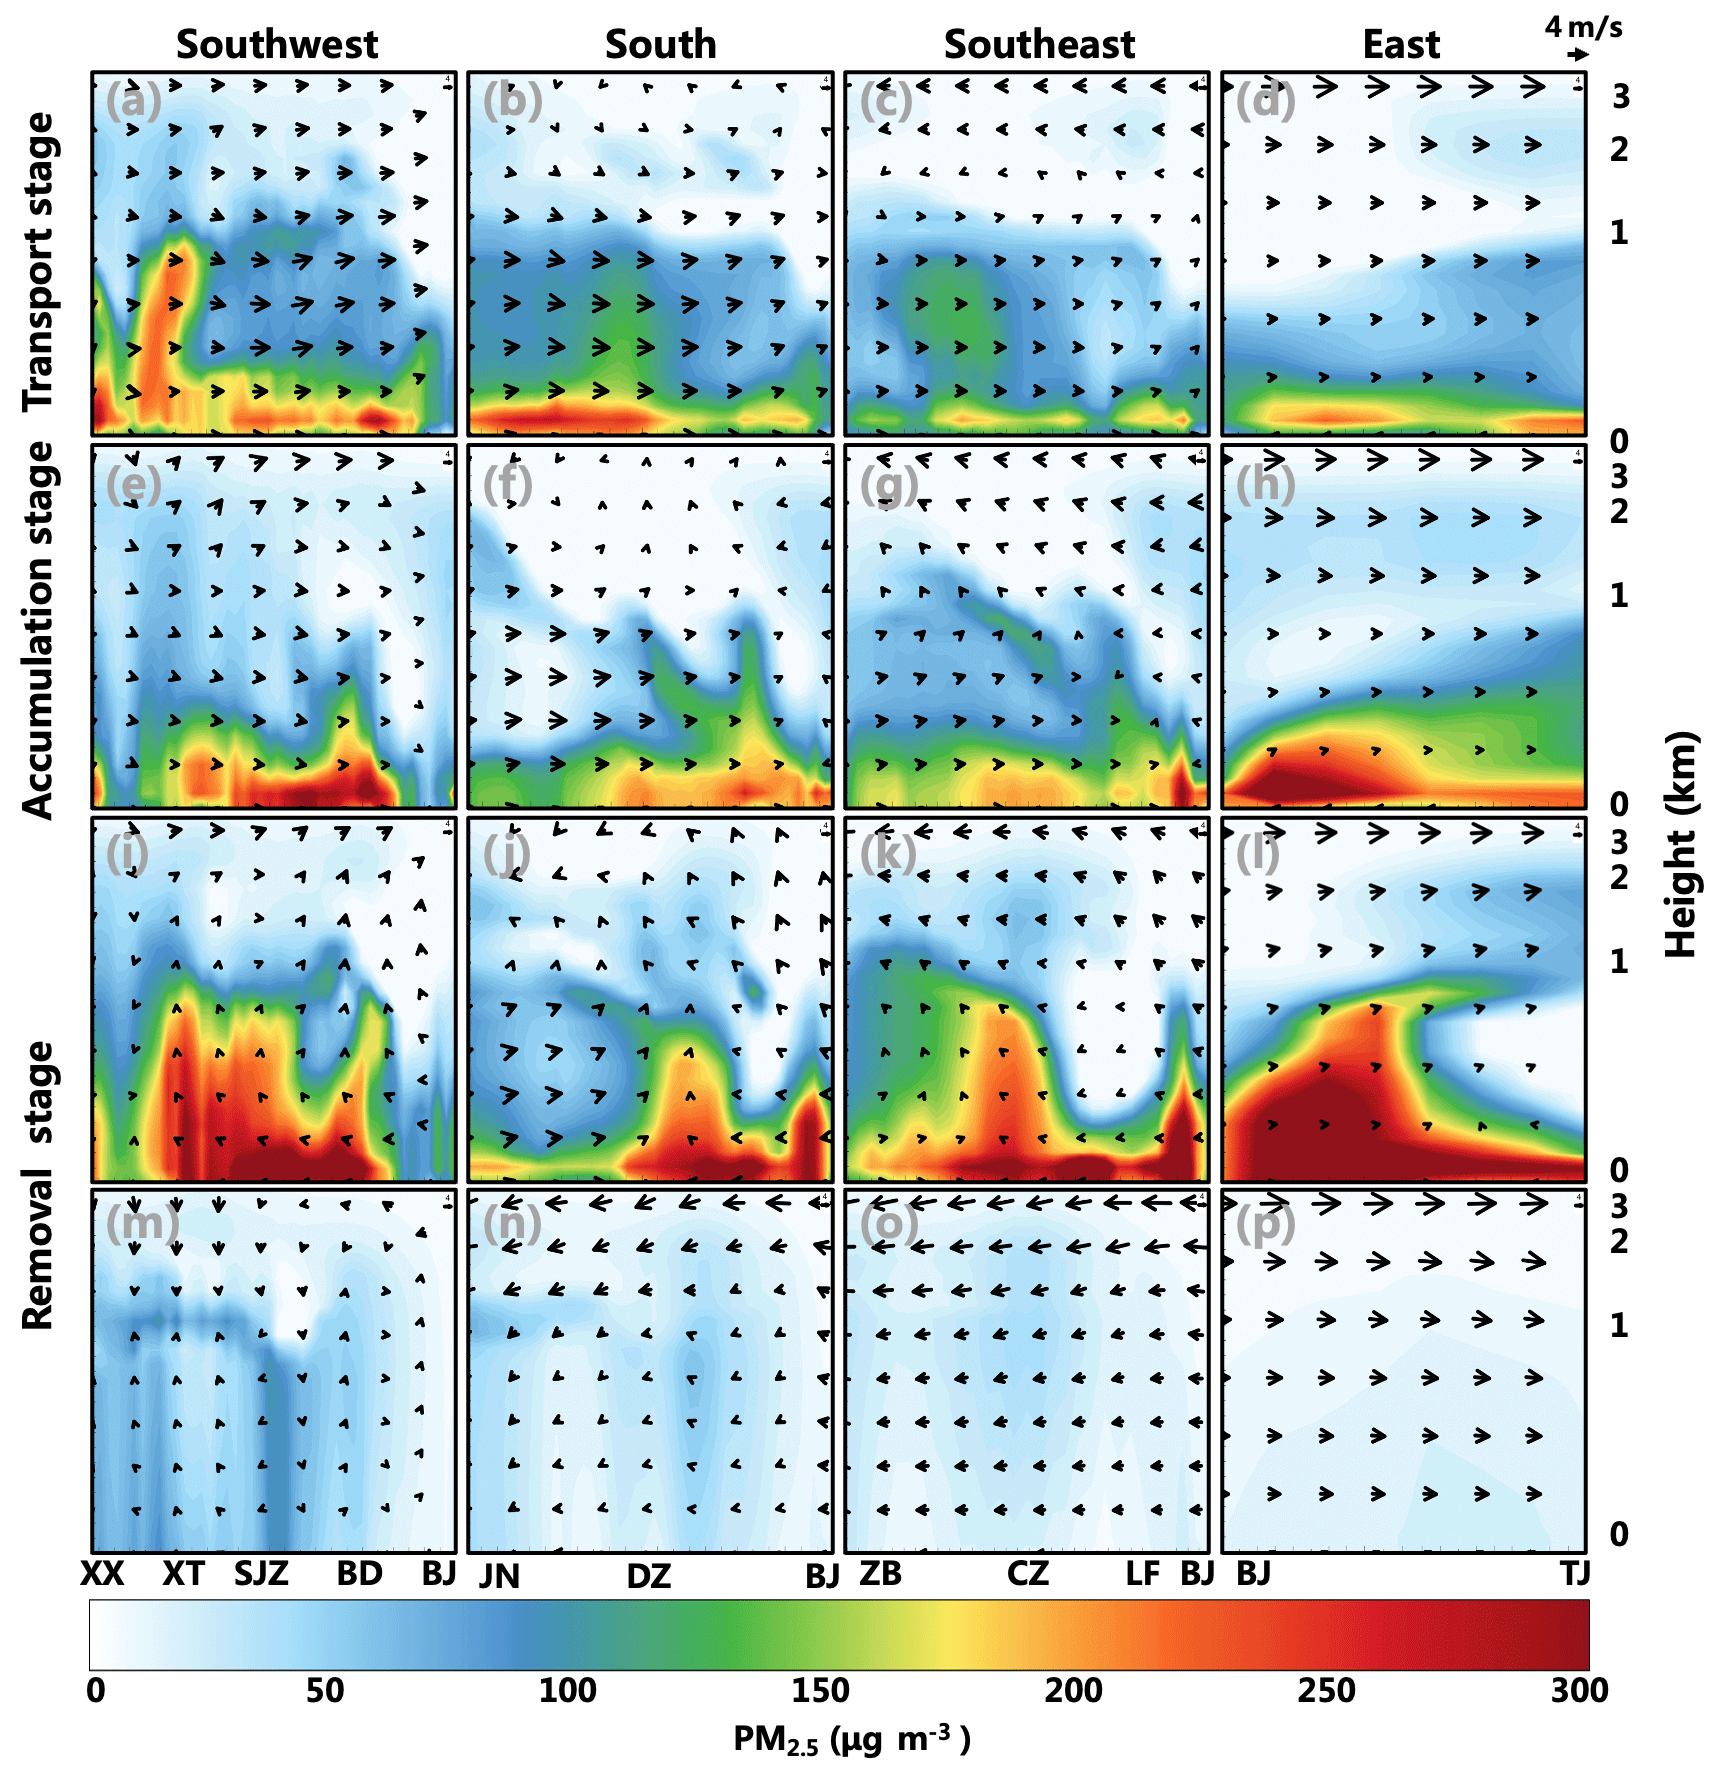
Figure 8Vertical profiles of PM2.5 cross sections with wind vectors along the transport pathways, including southwest (a, e, i, m), south (b, f, j, n), southeast (c, g, k, o), and east (d, h, l, p). The first row (a–d) (00:00 LT 2 December 2017) represents the transport stage, the second row (e–h) (10:00 LT 2 December 2017) represents the accumulation stage, and the third row (i–l) (00:00 LT, 3 December 2017) and fourth row (m–p) (14:00 LT, 4 December 2017) represent the removal stage.
3.6 Quantification of regional transport of PM2.5
To evaluate the variation of pollutants along different transport pathways at different stages, we plotted the vertical profile of the PM2.5 cross section along the main pollution pathways of Beijing coming from the four directions of southwest, south, southeast, and east (see Fig. 1b and d). As shown in Fig. 8, at XX and XT (located at the start of the southwest transport pathway; Fig. 8a), the PM2.5 concentration is more than 200 µg m−3 at a height of 1 km (Fig. 8a) and the surface PM2.5 concentration at JN (located in the south pathway) also exceeds 200 µg m−3 (Fig. 8b). These high concentrations of pollutants were transported to SJZ, BD, LF, BJ, and other cities via southwest winds (Fig. 8e–g). At the same time, vertical downdrafts reduced the height of loading of aerosol layer to ∼0.6 km (Fig. 8e). Different from the southern (including southwest, south, and southeast) transport pathways, the pollutants in TJ were mainly from BJ outflow in all stages of the eastern transport pathways (Fig. 8d, h, l, p). In addition, wind direction inconsistencies at the origin (XX, JN, and ZB) and target location (Beijing) of the transport pathways occurred at the beginning of the removal phase (Fig. 8i–k), which may have been due to the southward delay of the northerly air flow.
To investigate the vertical variation of PM2.5 inflow or outflow at different heights and determine the height at which the main transport occurred (H. Zhang et al., 2019), we plotted the vertical distribution of PM2.5 transport flux in different directions (Fig. 9). Here the PM2.5 transport flux is defined as the product of PM2.5 mass concentration (µg m−3), wind speed (m s−1), and wind direction projection in the current pathway (Xiang et al., 2020). The southwest, southeast, and east pathways in Fig. 9 were represented by BD, LF, and TJ, respectively, which are the three lidar stations closest to BJ (Fig. 1). TF > 0 indicates that the pollutants were imported to Beijing, while TF < 0 indicates that the pollutants were exported from Beijing. The results revealed that below the height of 3 km, the order of the maximum values of imported pollutants in the to Beijing direction was southwest pathway (1122.8 µg m−2 s−1) > southeast pathway (423.6 µg m−2 s−1) > east pathway (278.3 µg m−2 s−1), while the exported pollutants in the from Beijing direction was southwest pathway (−1571.4 µg m−2 s−1) > east pathway (−877.7 µg m−2 s−1) > southeast pathway (−772.4 µg m−2 s−1). Compared with the PM2.5 transport flux on the ground surface, the relatively high value (∼200 µg m−2 s−1) in the southwest pathway (Fig. 9a) occurred on 29 November and early morning on 4 December, while the relatively extreme value ( µg m−2 s−1) on the east pathway (Fig. 9c) was recorded on the night of 2 December.
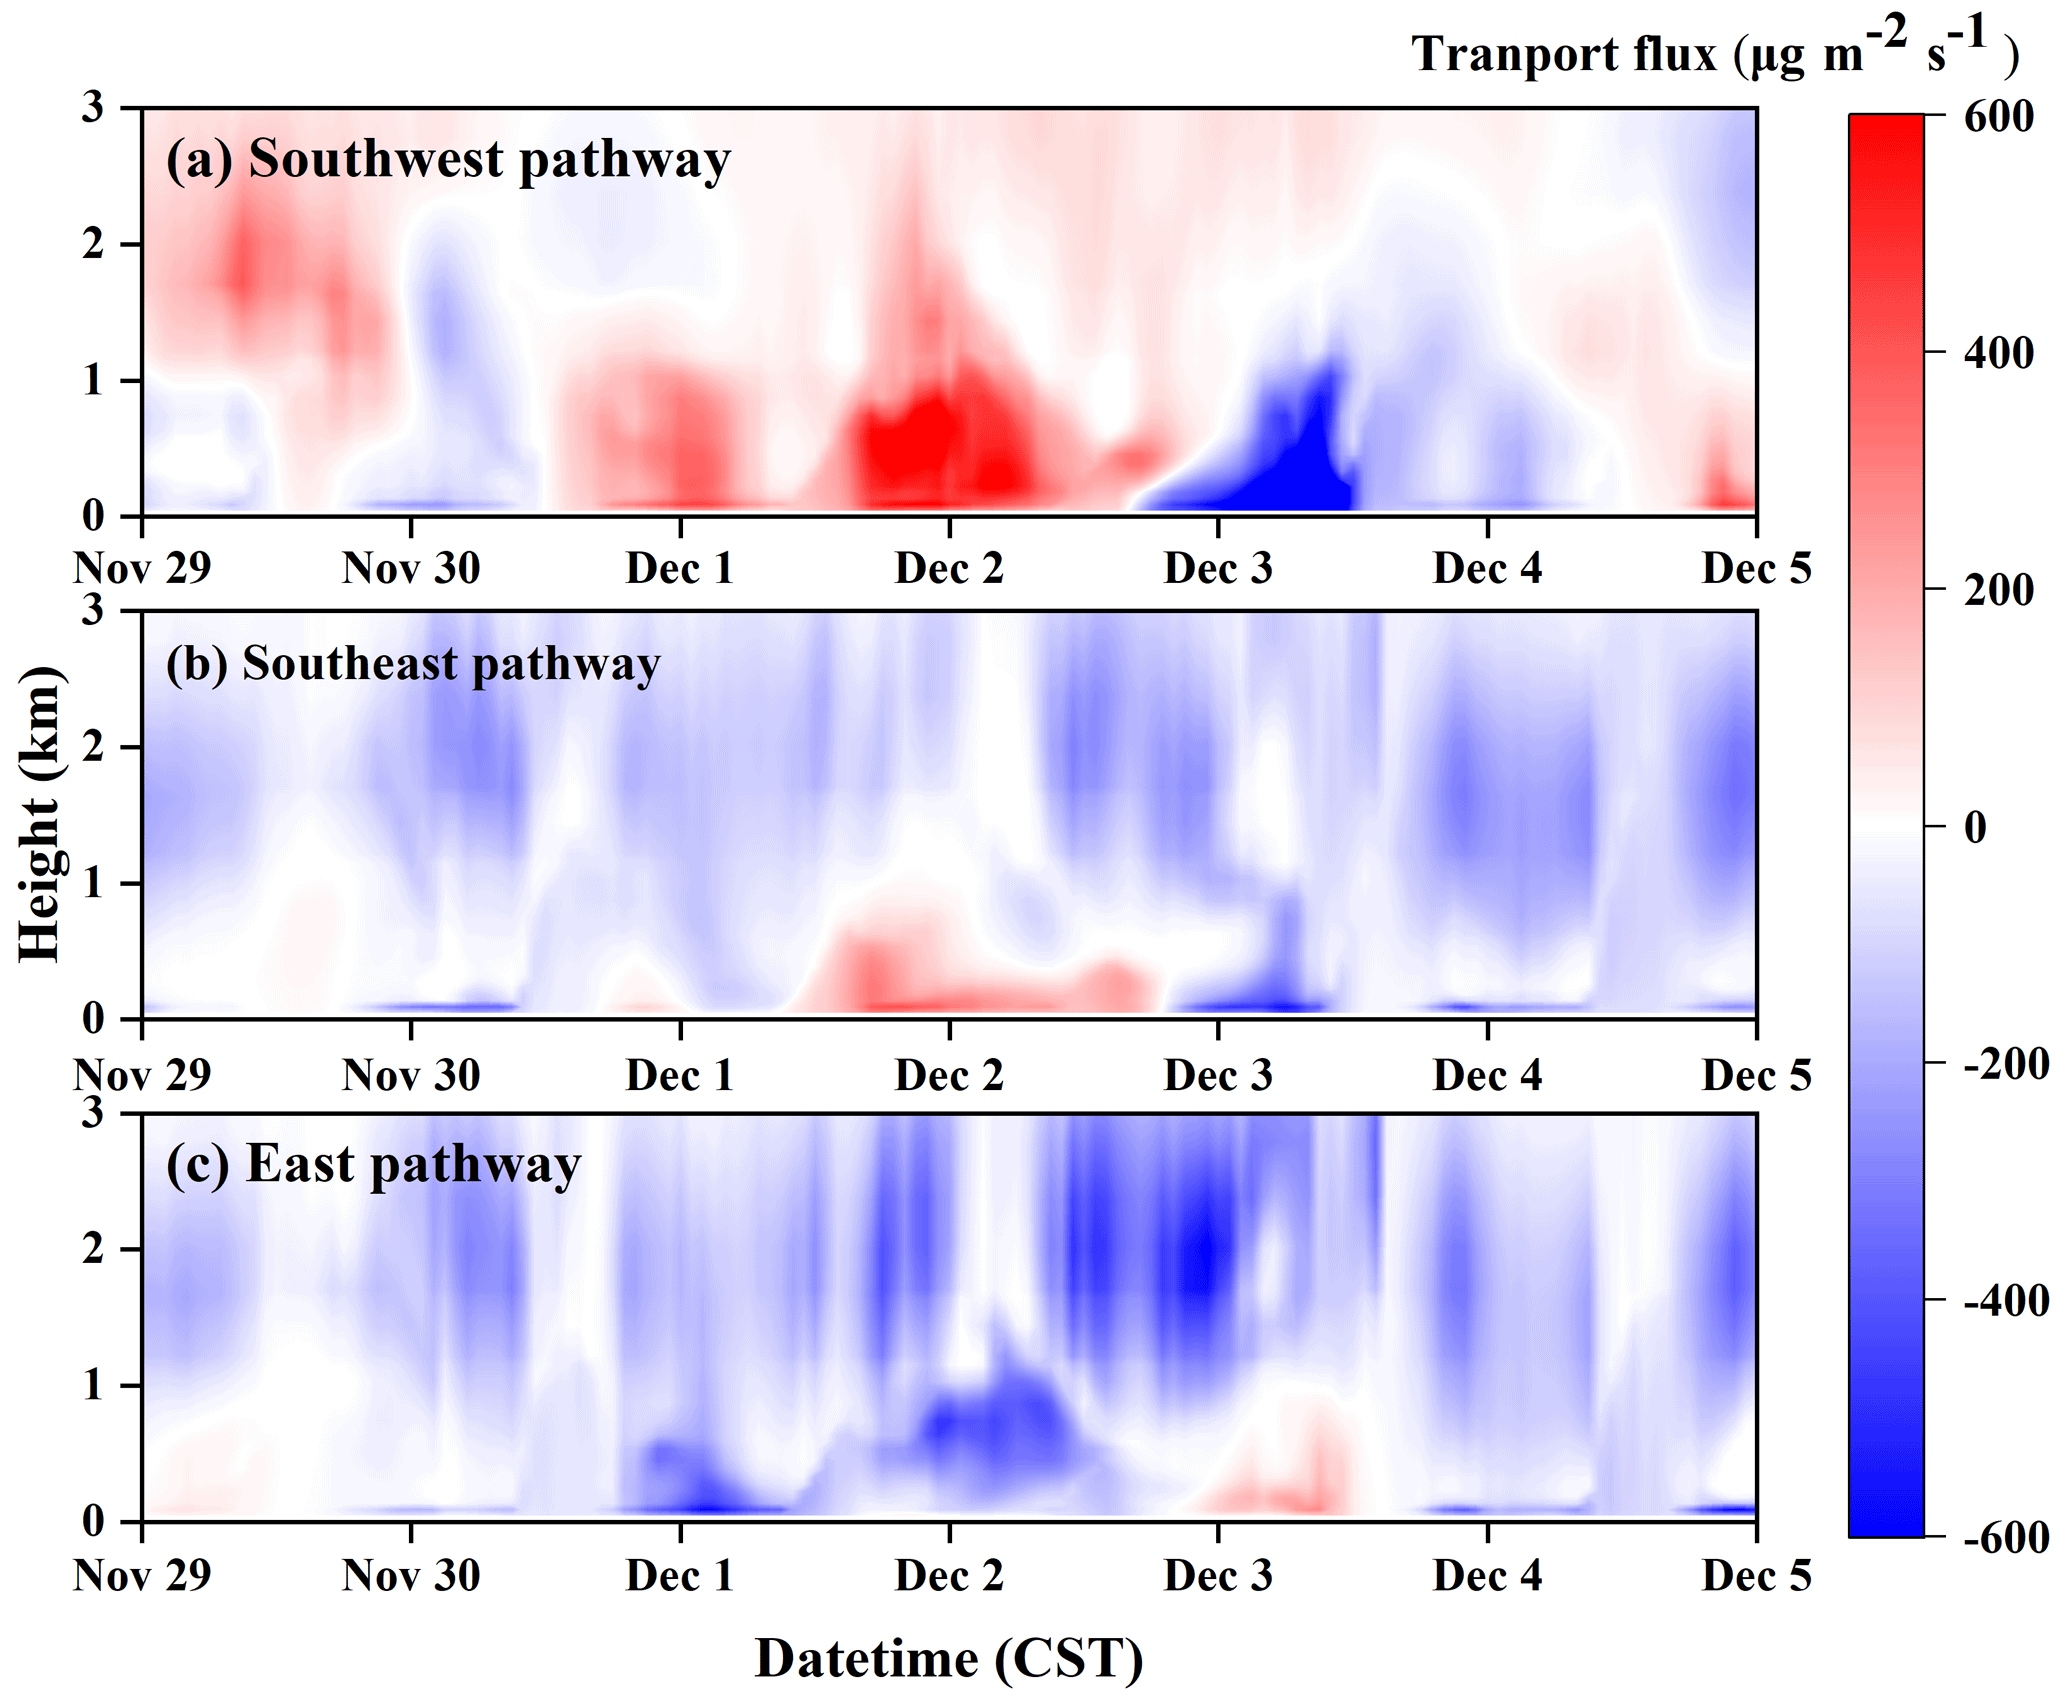
Figure 9Time series of PM2.5 transport flux from different transport pathways. The corresponding directions of the southwest, southeast, and east pathways are shown in Fig. 1.
To further obtain insights into the total transport characteristics in the target area (BJ) and its surrounding area (BD, LF, and TJ) during different evolutionary stages, the time series of the PM2.5 transport flux intensity (TFI) was shown in Fig. 10. The TFI was calculated by integrating the PM2.5 transport flux from the ground to a certain height, and the height was selected as 1.5 km, which is consistent with the main transport height of pollutants (Fig. 8) and the height of the boundary layer (Fig. 7). The TFI of PM2.5 further reveals that pollutants imported into the Beijing area with a maximum PM2.5 TFI of µg m−1 s−1 were transported mainly via the southwest pathway during the TP, while the extreme TFI of pollutants exported from Beijing via the east pathway was approximately µg m−1 s−1. In addition, during the RP, the pollutants from Beijing were exported to the southwest and southeast, with extreme values of approximately and µg m−1 s−1, respectively. In contrast, the absolute value of TFI on the southwest pathway was µg m−1 s−1 during the EP (Fig. 10), which indicates that there was no significant inflow or outflow of pollutants. However, this reason was mainly due to the offsetting of the inflow of pollutants in the upper air and the outflow of pollutants near the ground (Fig. 9a). This special phenomenon also demonstrates that the study of vertical distribution of pollutants has great significance, which can better explain the transport characteristics (H. Zhang et al., 2019).
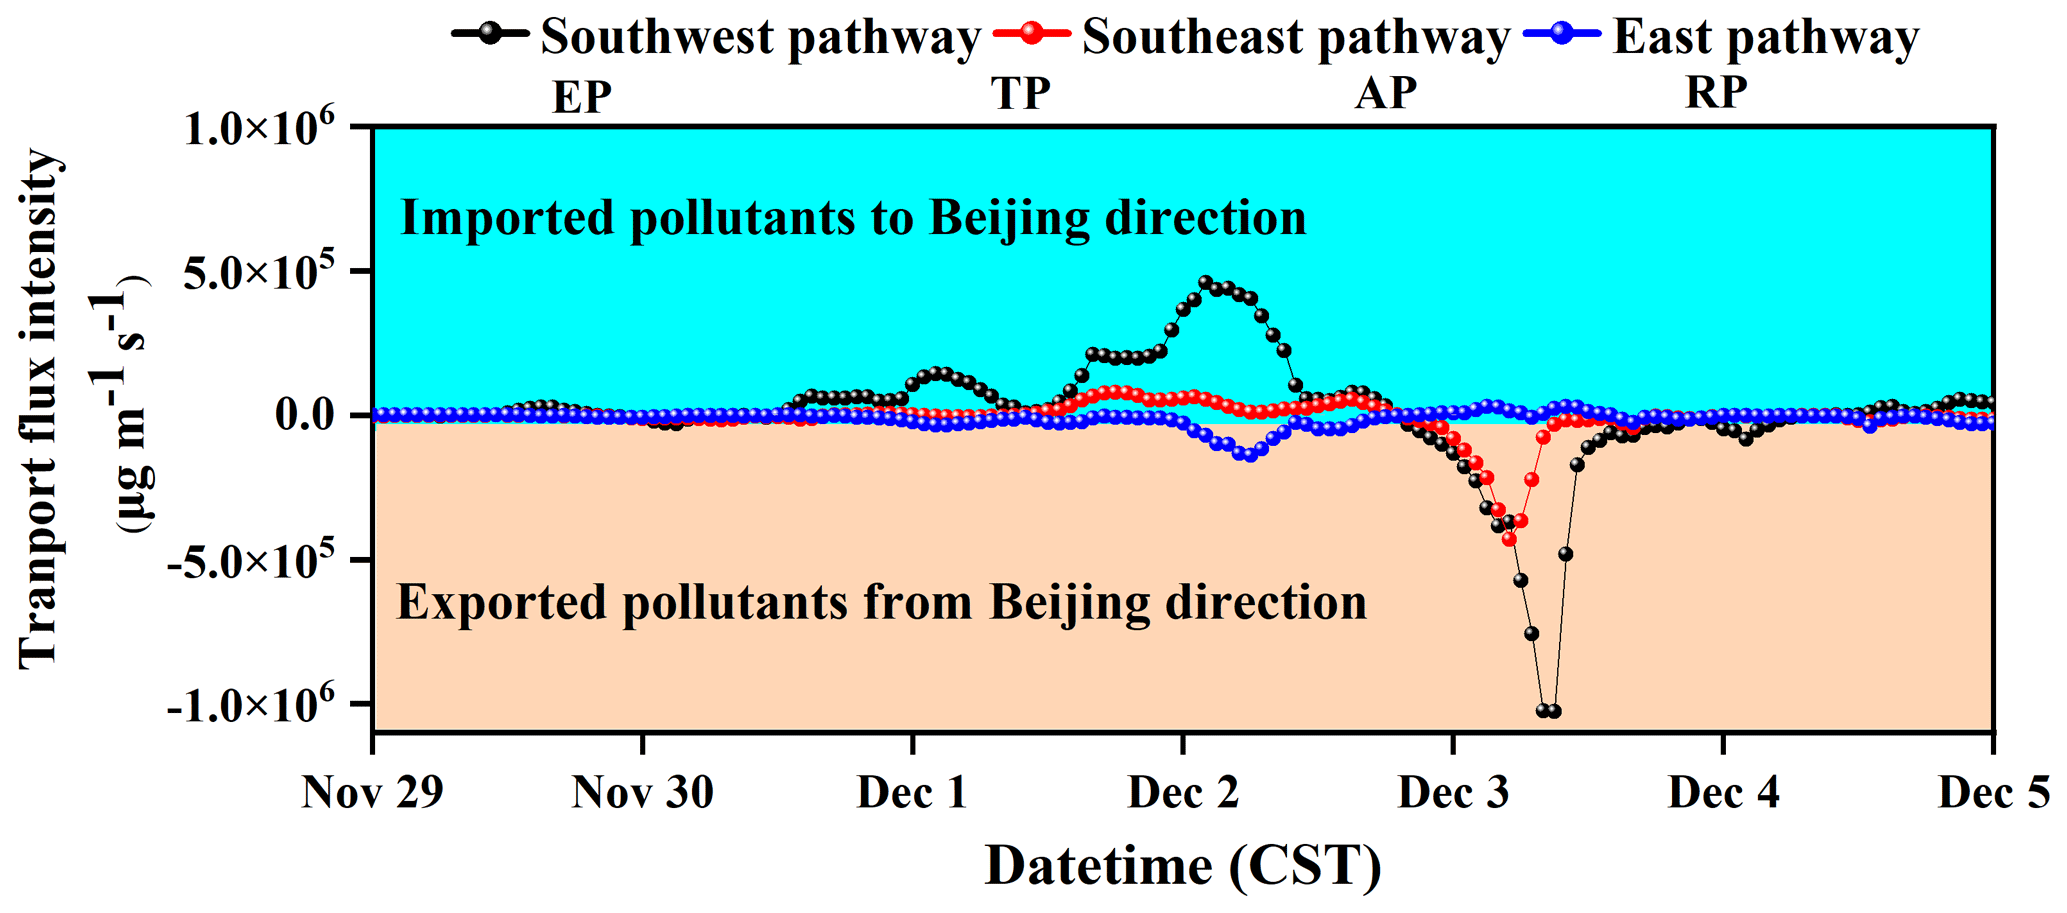
Figure 10Time series of PM2.5 transport flux intensity from different transport pathways. The corresponding directions of the southwest, southeast, and east pathways are shown in Fig. 1.
Accurate quantification of the distribution of particulate matter in the atmosphere is a key requirement for predicting air quality and estimating atmospheric environmental capacity from atmospheric observations. We utilized a vertical observation network composed of 13 aerosol lidars combined with data assimilation technology to improve the simulation accuracy of PM2.5 and further analyzed the multi-dimensional evolutionary characteristics of pollutants in the surface layer, vertical layer, and 3-D space, thereby providing effective data support for clarifying the spatial transport characteristics of heavy pollution.
We found that the average height of the atmospheric boundary layer was <0.5 km during the HAP period. We further demonstrated that the transport of pollutants in the NCP region was mainly via three pathways: southwest, southeast, and east. During the TP, the PM2.5 advected into Beijing with a maximum transport flux intensity (TFI) of µg m−1 s−1 and was mainly via the southwest pathway, while the polluted air mass in the RP dissipated from Beijing via the southwest and southeast pathways, with extreme PM2.5 TFI values of approximately and µg m−1 s−1, respectively. In addition, the transport of regional pollutants to the Yangtze River Delta was due to the continuous southward flow of northwest and northeast winds. Our results directly revealed that pollutants in the North China Plain can be transported to the Yellow Sea and the Bohai Sea, providing a dataset for a further in-depth study of the mechanism of air pollution in the coastal areas of eastern China. This study also captured the regional transport of air pollutants stretching over 1000 km, proving the necessity and importance of the joint prevention and control of regional air pollution.
The FNL (final analysis data) data are available from the following website (https://rda.ucar.edu/datasets/ds083.2/, last access: 6 May 2021) (National Center for Atmospheric Research, 2021a). The data in this study were analyzed using the NCAR Command Language (http://www.ncl.ucar.edu/ last access: 6 May 2021) (National Center for Atmospheric Research, 2021b). The authors gratefully acknowledge the China National Environmental Monitoring Center for providing monitoring data for the PM2.5 (http://106.37.208.233:20035, last access: 6 May 2021) (China National Environmental Monitoring Center, 2021). The lidar data in this study are available upon request from the corresponding author (yxiang@ahu.edu.cn).
The supplement related to this article is available online at: https://doi.org/10.5194/acp-21-7023-2021-supplement.
YX and TZ designed this study. YX wrote the manuscript; YC and CM edited it. LL and TZ helped to analyze the data. YC, CM, WL, and JL provided constructive comments on this study. All authors contributed to the discussion and final version of the manuscript.
The authors declare that they have no conflict of interest.
This work was supported by the National Natural Science Foundation of China (42005106, 41941011), the National Key Project of MOST (2017YFC0213002, 2018YFC0213101, 2018YFC0213106, 2018YFC0213201), the Major science and technology projects of Anhui Province (No. 18030801111), the Natural Science Foundation of Anhui Province, China (1908085QD160, 1908085QD170), and the Doctoral Scientific Research Foundation of Anhui University (Y040418190). The authors are grateful to the China National Environmental Monitoring Center for providing the PM2.5 monitoring data. The authors acknowledge the High-performance Computing Platform of Anhui University for providing computing resources. The authors also gratefully acknowledge © Google Earth for providing the map used in this research. Yafang Cheng and Chaoqun Ma thank the Minerva program of Max Planck Society.
This research has been supported by the National Natural Science Foundation of China (grant nos. 42005106 and 41941011), the National Key Project of MOST (grant nos. 2017YFC0213002, 2018YFC0213101, 2018YFC0213106, and 2018YFC0213201), the Key Technologies Research and Development Program of Anhui Province (grant no. 18030801111), the Natural Science Foundation of Anhui Province (grant nos. 1908085QD160 and 1908085QD170), and the Anhui University (grant no. Y040418190).
This paper was edited by Yves Balkanski and reviewed by two anonymous referees.
Barrera, Y. D., Nehrkorn, T., Hegarty, J., Sargent, M., Benmergui, J., Gottlieb, E., Wofsy, S. C., DeCola, P., Hutyra, L., and Jones, T.: Using Lidar Technology To Assess Urban Air Pollution and Improve Estimates of Greenhouse Gas Emissions in Boston, Environ. Sci. Technol., 53, 8957–8966, https://doi.org/10.1021/acs.est.9b00650, 2019.
Bocquet, M., Elbern, H., Eskes, H., Hirtl, M., Zabkar, R., Carmichael, G. R., Flemming, J., Inness, A., Pagowski, M., Camano, J. L. P., Saide, P. E., San Jose, R., Sofiev, M., Vira, J., Baklanov, A., Carnevale, C., Grell, G., and Seigneur, C.: Data assimilation in atmospheric chemistry models: current status and future prospects for coupled chemistry meteorology models, Atmos. Chem. Phys., 15, 5325–5358, https://doi.org/10.5194/acp-15-5325-2015, 2015.
Cao, F., Zhang, Y. L., Ren, L. J., Liu, J. W., Li, J., Zhang, G., Liu, D., Sun, Y. L., Wang, Z. F., Shi, Z. B., and Fu, P. Q.: New insights into the sources and formation of carbonaceous aerosols in China: potential applications of dual-carbon isotopes, Natl. Sci. Rev., 4, 804–806, https://doi.org/10.1093/nsr/nwx097, 2017.
Chatani, S., Morikawa, T., Nakatsuka, S., Matsunaga, S., and Minoura, H.: Development of a framework for a high-resolution, three-dimensional regional air quality simulation and its application to predicting future air quality over Japan, Atmos. Environ., 45, 1383–1393, https://doi.org/10.1016/j.atmosenv.2010.12.036, 2011.
Che, H., Gui, K., Xia, X., Wang, Y., Holben, B. N., Goloub, P., Cuevas-Agulló, E., Wang, H., Zheng, Y., Zhao, H., and Zhang, X.: Large contribution of meteorological factors to inter-decadal changes in regional aerosol optical depth, Atmos. Chem. Phys., 19, 10497–10523, https://doi.org/10.5194/acp-19-10497-2019, 2019a.
Che, H., Xia, X., Zhao, H., Dubovik, O., Holben, B. N., Goloub, P., Cuevas-Agulló, E., Estelles, V., Wang, Y., Zhu, J., Qi, B., Gong, W., Yang, H., Zhang, R., Yang, L., Chen, J., Wang, H., Zheng, Y., Gui, K., Zhang, X., and Zhang, X.: Spatial distribution of aerosol microphysical and optical properties and direct radiative effect from the China Aerosol Remote Sensing Network, Atmos. Chem. Phys., 19, 11843–11864, https://doi.org/10.5194/acp-19-11843-2019, 2019b.
Chen, D., Liu, Z. Q., Ban, J. M., and Chen, M.: The 2015 and 2016 wintertime air pollution in China: SO2 emission changes derived from a WRF-Chem/EnKF coupled data assimilation system, Atmos. Chem. Phys., 19, 8619–8650, https://doi.org/10.5194/acp-19-8619-2019, 2019.
Chen, Z., Schofield, R., Rayner, P., Zhang, T., Liu, C., Vincent, C., Fiddes, S., Ryan, R. G., Alroe, J., Ristovski, Z. D., Humphries, R. S., Keywood, M. D., Ward, J., Paton-Walsh, C., Naylor, T., and Shu, X.: Characterization of aerosols over the Great Barrier Reef: The influence of transported continental sources, Sci. Total Environ., 690, 426–437, https://doi.org/10.1016/j.scitotenv.2019.07.007, 2019.
Cheng, X., Liu, Y., Xu, X., You, W., Zang, Z., Gao, L., Chen, Y., Su, D., and Yan, P.: Lidar data assimilation method based on CRTM and WRF-Chem models and its application in PM2.5 forecasts in Beijing, Sci. Total Environ., 682, 541–552, https://doi.org/10.1016/j.scitotenv.2019.05.186, 2019.
Cheng, Y. F., Zheng, G. J., Wei, C., Mu, Q., Zheng, B., Wang, Z. B., Gao, M., Zhang, Q., He, K. B., Carmichael, G., Poschl, U., and Su, H.: Reactive nitrogen chemistry in aerosol water as a source of sulfate during haze events in China, Sci. Adv., 2, e1601530, https://doi.org/10.1126/sciadv.1601530, 2016.
China National Environmental Monitoring Center: National urban air quality real time release platform, available at: http://106.37.208.233:20035, last access: 6 May 2021.
Collis, R. T. H., Fernald, F. G., and Ligda, M. G. H.: Laser Radar Echoes from a Stratified Clear Atmosphere, Nature, 203, 1274–1275, https://doi.org/10.1038/2031274a0, 1964.
Dong, Z., Wang, S., Xing, J., Chang, X., Ding, D., and Zheng, H.: Regional transport in Beijing-Tianjin-Hebei region and its changes during 2014–2017: The impacts of meteorology and emission reduction, Sci. Total Environ., 737, 139792, https://doi.org/10.1016/j.scitotenv.2020.139792, 2020.
Elbern, H., Strunk, A., Schmidt, H., and Talagrand, O.: Emission rate and chemical state estimation by 4-dimensional variational inversion, Atmos. Chem. Phys., 7, 3749–3769, https://doi.org/10.5194/acp-7-3749-2007, 2007.
Fan, W. Z., Qin, K., Xu, J., Yuan, L. M., Li, D., Jin, Z., and Zhang, K. F.: Aerosol vertical distribution and sources estimation at a site of the Yangtze River Delta region of China, Atmos. Res., 217, 128–136, https://doi.org/10.1016/j.atmosres.2018.11.002, 2019.
Fernald, F. G.: Analysis of Atmospheric Lidar Observations – Some Comments, Appl. Optics, 23, 652–653, https://doi.org/10.1364/Ao.23.000652, 1984.
Gao, M., Saide, P. E., Xin, J. Y., Wang, Y. S., Liu, Z. R., Wang, Y. X., Wang, Z. F., Pagowski, M., Guttikunda, S. K., and Carmichael, G. R.: Estimates of Health Impacts and Radiative Forcing in Winter Haze in Eastern China through Constraints of Surface PM2.5 Predictions, Environ. Sci. Technol., 51, 2178–2185, https://doi.org/10.1021/acs.est.6b03745, 2017.
Heese, B., Baars, H., Bohlmann, S., Althausen, D., and Deng, R. R.: Continuous vertical aerosol profiling with a multi-wavelength Raman polarization lidar over the Pearl River Delta, China, Atmos. Chem. Phys., 17, 6679–6691, https://doi.org/10.5194/acp-17-6679-2017, 2017.
Hong, Q. Q., Liu, C., Chan, K. L., Hu, Q. H., Xie, Z. Q., Liu, H. R., Si, F. Q., and Liu, J. G.: Ship-based MAX-DOAS measurements of tropospheric NO2, SO2, and HCHO distribution along the Yangtze River, Atmos. Chem. Phys., 18, 5931–5951, https://doi.org/10.5194/acp-18-5931-2018, 2018.
Hu, M., Guo, S., Peng, J. F., and Wu, Z. J.: Insight into characteristics and sources of PM2.5 in the Beijing-Tianjin-Hebei region, China, Natl. Sci. Rev., 2, 257–258, https://doi.org/10.1093/nsr/nwv003, 2015.
Hua, Y., Cheng, Z., Wang, S. X., Jiang, J. K., Chen, D. R., Cai, S. Y., Fu, X., Fu, Q. Y., Chen, C. H., Xu, B. Y., and Yu, J. Q.: Characteristics and source apportionment of PM2.5 during a fall heavy haze episode in the Yangtze River Delta of China, Atmos. Environ., 123, 380—391, https://doi.org/10.1016/j.atmosenv.2015.03.046, 2015.
Huang, M., Crawford, J. H., Diskin, G. S., Santanello, J. A., Kumar, S. V., Pusede, S. E., Parrington, M., and Carmichael, G. R.: Modeling Regional Pollution Transport Events During KORUS-AQ: Progress and Challenges in Improving Representation of Land-Atmosphere Feedbacks, J. Geophys. Res.-Atmos., 123, 10732–10756, https://doi.org/10.1029/2018jd028554, 2018.
Huang, X., Zhou, L. X., Ding, A. J., Qi, X. M., Nie, W., Wang, M. H., Chi, X. G., Petaja, T., Kerminen, V. M., Roldin, P., Rusanen, A., Kulmala, M., and Boy, M.: Comprehensive modelling study on observed new particle formation at the SORPES station in Nanjing, China, Atmos. Chem. Phys., 16, 2477–2492, https://doi.org/10.5194/acp-16-2477-2016, 2016.
Huang, X., Wang, Z., and Ding, A.: Impact of Aerosol–PBL Interaction on Haze Pollution: Multiyear Observational Evidences in North China, Geophys. Res. Lett., 45, 8596–8603, https://doi.org/10.1029/2018gl079239, 2018.
Jiang, Z. Q., Liu, Z. Q., Wang, T. J., Schwartz, C. S., Lin, H. C., and Jiang, F.: Probing into the impact of 3DVAR assimilation of surface PM10 observations over China using process analysis, J. Geophys. Res.-Atmos., 118, 6738–6749, https://doi.org/10.1002/jgrd.50495, 2013.
Klett, J. D.: Stable Analytical Inversion Solution for Processing Lidar Returns, Appl. Optics, 20, 211–220, https://doi.org/10.1364/Ao.20.000211, 1981.
Kumar, M., Raju, M. P., Singh, R. K., Singh, A. K., Singh, R. S., and Banerjee, T.: Wintertime characteristics of aerosols over middle Indo-Gangetic Plain: Vertical profile, transport and radiative forcing, Atmos. Res., 183, 268–282, https://doi.org/10.1016/j.atmosres.2016.09.012, 2017.
Li, J., Du, H. Y., Wang, Z. F., Sun, Y. L., Yang, W. Y., Li, J. J., Tang, X., and Fu, P. Q.: Rapid formation of a severe regional winter haze episode over a mega-city cluster on the North China Plain, Environ. Pollut., 223, 605–615, https://doi.org/10.1016/j.envpol.2017.01.063, 2017.
Li, K., Chen, L. H., Ying, F., White, S. J., Jang, C., Wu, X. C., Gao, X., Hong, S. M., Shen, J. D., Azzi, M., and Cen, K. F.: Meteorological and chemical impacts on ozone formation: A case study in Hangzhou, China, Atmos. Res., 196, 40–52, https://doi.org/10.1016/j.atmosres.2017.06.003, 2017.
Li, X., Zhang, Q., Zhang, Y., Zhang, L., Wang, Y. X., Zhang, Q. Q., Li, M., Zheng, Y. X., Geng, G. N., Wallington, T. J., Han, W. J., Shen, W., and He, K. B.: Attribution of PM2.5 exposure in Beijing-Tianjin-Hebei region to emissions: implication to control strategies, Sci. Bull., 62, 957–964, https://doi.org/10.1016/j.scib.2017.06.005, 2017.
Li, Y. R., Ye, C. X., Liu, J., Zhu, Y., Wang, J. X., Tan, Z. Q., Lin, W. L., Zeng, L. M., and Zhu, T.: Observation of regional air pollutant transport between the megacity Beijing and the North China Plain, Atmos. Chem. Phys., 16, 14265–14283, https://doi.org/10.5194/acp-16-14265-2016, 2016.
Li, Z. Q., Guo, J. P., Ding, A. J., Liao, H., Liu, J. J., Sun, Y. L., Wang, T. J., Xue, H. W., Zhang, H. S., and Zhu, B.: Aerosol and boundary-layer interactions and impact on air quality, Natl. Sci. Rev., 4, 810–833, https://doi.org/10.1093/nsr/nwx117, 2017.
Liu, Z. Q., Liu, Q. H., Lin, H. C., Schwartz, C. S., Lee, Y. H., and Wang, T. J.: Three-dimensional variational assimilation of MODIS aerosol optical depth: Implementation and application to a dust storm over East Asia, J. Geophys. Res.-Atmos., 116, D23206, https://doi.org/10.1029/2011jd016159, 2011.
Lv, L., Liu, W., Zhang, T., Chen, Z., Dong, Y., Fan, G., Xiang, Y., Yao, Y., Yang, N., Chu, B., Teng, M., and Shu, X.: Observations of particle extinction, PM2.5 mass concentration profile and flux in north China based on mobile lidar technique, Atmos. Environ., 164, 360–369, https://doi.org/10.1016/j.atmosenv.2017.06.022, 2017.
Lv, L. H., Liu, W. Q., Zhang, T. S., Chen, Z. Y., Dong, Y. S., Fan, G. Q., Xiang, Y., Yao, Y. W., Yang, N., Chu, B. L., Teng, M., and Shu, X. W.: Observations of particle extinction, PM2.5 mass concentration profile and flux in north China based on mobile lidar technique, Atmos. Environ., 164, 360–369, https://doi.org/10.1016/j.atmosenv.2017.06.022, 2017.
Ma, C. Q., Wang, T. J., Zang, Z. L., and Li, Z. J.: Comparisons of Three-Dimensional Variational Data Assimilation and Model Output Statistics in Improving Atmospheric Chemistry Forecasts, Adv. Atmos. Sci., 35, 813–825, https://doi.org/10.1007/s00376-017-7179-y, 2018.
Ma, C. Q., Wang, T. J., Mizzi, A. P., Anderson, J. L., Zhuang, B. L., Xie, M., and Wu, R. S.: Multiconstituent Data Assimilation With WRF-Chem/DART: Potential for Adjusting Anthropogenic Emissions and Improving Air Quality Forecasts Over Eastern China, J. Geophys. Res.-Atmos., 124, 7393–7412, https://doi.org/10.1029/2019jd030421, 2019.
National Center for Atmospheric Research: NCEP FNL Operational Model Global Tropospheric Analyses, continuing from July 1999, available at: https://rda.ucar.edu/datasets/ds083.2/ (last access: 6 May 2021), 2021a.
National Center for Atmospheric Research: NCAR Command Language, available at: http://www.ncl.ucar.edu/ (last access: 6 May 2021), 2021b.
Pagowski, M., Liu, Z., Grell, G. A., Hu, M., Lin, H. C., and Schwartz, C. S.: Implementation of aerosol assimilation in Gridpoint Statistical Interpolation (v. 3.2) and WRF-Chem (v. 3.4.1), Geosci. Model Dev., 7, 1621–1627, https://doi.org/10.5194/gmd-7-1621-2014, 2014.
Pang, J. M., Liu, Z. Q., Wang, X. M., Bresch, J., Ban, J. M., Cnen, D., and Kim, J.: Assimilating AOD retrievals from GOCI and VIIRS to forecast surface PM2.5 episodes over Eastern China, Atmos. Environ., 179, 288–304, https://doi.org/10.1016/j.atmosenv.2018.02.011, 2018.
Parrish, D. F. and Derber, J. C.: The National Meteorological Center's Spectral Statistical-Interpolation Analysis System, Mon. Weather Rev., 120, 1747–1763, https://doi.org/10.1175/1520-0493(1992)120<1747:Tnmcss>2.0.Co;2, 1992.
Pokharel, M., Guang, J., Liu, B., Kang, S., Ma, Y., Holben, B. N., Xia, X. A., Xin, J., Ram, K., Rupakheti, D., Wan, X., Wu, G., Bhattarai, H., Zhao, C., and Cong, Z.: Aerosol Properties Over Tibetan Plateau From a Decade of AERONET Measurements: Baseline, Types, and Influencing Factors, J. Geophys. Res.-Atmos., 124, 13357–13374, https://doi.org/10.1029/2019jd031293, 2019.
Saide, P. E., Carmichael, G. R., Liu, Z., Schwartz, C. S., Lin, H. C., da Silva, A. M., and Hyer, E.: Aerosol optical depth assimilation for a size-resolved sectional model: impacts of observationally constrained, multi-wavelength and fine mode retrievals on regional scale analyses and forecasts, Atmos. Chem. Phys., 13, 10425–10444, https://doi.org/10.5194/acp-13-10425-2013, 2013.
Saide, P. E., Kim, J., Song, C. H., Choi, M., Cheng, Y. F., and Carmichael, G. R.: Assimilation of next generation geostationary aerosol optical depth retrievals to improve air quality simulations, Geophys. Res. Lett., 41, 9188–9196, https://doi.org/10.1002/2014GL062089, 2014.
Schafer, K., Blumenstock, T., Bonn, B., Gerwig, H., Hase, F., Munkel, C., Nothard, R., and von Schneidemesser, E.: Mixing layer height measurements determines influence of meteorology on air pollutant concentrations in urban area, Proc. SPIE, 9640, 96400O, https://doi.org/10.1117/12.2194976, 2015.
Schwartz, C. S., Liu, Z. Q., Lin, H. C., and McKeen, S. A.: Simultaneous three-dimensional variational assimilation of surface fine particulate matter and MODIS aerosol optical depth, J. Geophys. Res.-Atmos., 117, D13202, https://doi.org/10.1029/2011jd017383, 2012.
Sheng, Z. Z., Che, H. Z., Chen, Q. L., Xia, X. A., Liu, D., Wang, Z. Z., Zhao, H. J., Gui, K., Zheng, Y., Sun, T. Z., Li, X. P., Liu, C., Wang, H., Wang, Y. Q., and Zhang, X. Y.: Aerosol vertical distribution and optical properties of different pollution events in Beijing in autumn 2017, Atmos. Res., 215, 193–207, https://doi.org/10.1016/j.atmosres.2018.08.029, 2019.
Su, H., Cheng, Y., and Poschl, U.: New Multiphase Chemical Processes Influencing Atmospheric Aerosols, Air Quality, and Climate in the Anthropocene, Acc Chem. Res., https://doi.org/10.1021/acs.accounts.0c00246, in press, 2020.
Sun, J., Huang, L., Liao, H., Li, J., and Hu, J.: Impacts of Regional Transport on Particulate Matter Pollution in China: a Review of Methods and Results, Curr. Pollut. Rep., 3, 182–191, https://doi.org/10.1007/s40726-017-0065-5, 2017.
Sun, Y., Du, W., Wang, Q., Zhang, Q., Chen, C., Chen, Y., Chen, Z., Fu, P., Wang, Z., Gao, Z., and Worsnop, D. R.: Real-Time Characterization of Aerosol Particle Composition above the Urban Canopy in Beijing: Insights into the Interactions between the Atmospheric Boundary Layer and Aerosol Chemistry, Environ. Sci. Technol., 49, 11340–11347, https://doi.org/10.1021/acs.est.5b02373, 2015.
Tao, W., Su, H., Zheng, G., Wang, J., Wei, C., Liu, L., Ma, N., Li, M., Zhang, Q., Pöschl, U., and Cheng, Y.: Aerosol pH and chemical regimes of sulfate formation in aerosol water during winter haze in the North China Plain, Atmos. Chem. Phys., 20, 11729–11746, https://doi.org/10.5194/acp-20-11729-2020, 2020.
Tao, Z. M., Wang, Z. Z., Yang, S. J., Shan, H. H., Ma, X. M., Zhang, H., Zhao, S. G., Liu, D., Xie, C. B., and Wang, Y. J.: Profiling the PM2.5 mass concentration vertical distribution in the boundary layer, Atmos. Meas. Tech., 9, 1369–1376, https://doi.org/10.5194/amt-9-1369-2016, 2016.
Tian, P. F., Cao, X. J., Zhang, L., Sun, N. X., Sun, L., Logan, T., Shi, J. S., Wang, Y., Ji, Y. M., Lin, Y., Huang, Z. W., Zhou, T., Shi, Y. Y., and Zhang, R. Y.: Aerosol vertical distribution and optical properties over China from long-term satellite and ground-based remote sensing, Atmos. Chem. Phys., 17, 2509–2523, https://doi.org/10.5194/acp-17-2509-2017, 2017.
Wang, J., Zhang, M., Bai, X., Tan, H., Li, S., Liu, J., Zhang, R., Wolters, M. A., Qin, X., Zhang, M., Lin, H., Li, Y., Li, J., and Chen, L.: Large-scale transport of PM2.5 in the lower troposphere during winter cold surges in China, Sci. Rep., 7, 13238, https://doi.org/10.1038/s41598-017-13217-2, 2017.
Wang, J., Liu, D., Ge, X., Wu, Y., Shen, F., Chen, M., Zhao, J., Xie, C., Wang, Q., Xu, W., Zhang, J., Hu, J., Allan, J., Joshi, R., Fu, P., Coe, H., and Sun, Y.: Characterization of black carbon-containing fine particles in Beijing during wintertime, Atmos. Chem. Phys., 19, 447–458, https://doi.org/10.5194/acp-19-447-2019, 2019.
Wang, L. L., Liu, Z. R., Sun, Y., Ji, D. S., and Wang, Y. S.: Long-range transport and regional sources of PM2.5 in Beijing based on long-term observations from 2005 to 2010, Atmos. Res., 157, 37–48, https://doi.org/10.1016/j.atmosres.2014.12.003, 2015.
Wang, L. L., Liu, J. K., Gao, Z. Q., Li, Y. B., Huang, M., Fan, S. H., Zhang, X. Y., Yang, Y. J., Miao, S. G., Zou, H., Sun, Y. L., Chen, Y., and Yang, T.: Vertical observations of the atmospheric boundary layer structure over Beijing urban area during air pollution episodes, Atmos. Chem. Phys., 19, 6949–6967, https://doi.org/10.5194/acp-19-6949-2019, 2019.
Wang, Y., Sartelet, K. N., Bocquet, M., and Chazette, P.: Assimilation of ground versus lidar observations for PM10 forecasting, Atmos. Chem. Phys., 13, 269–283, https://doi.org/10.5194/acp-13-269-2013, 2013.
Xiang, Y., Zhang, T. S., Liu, J. G., Lv, L. H., Dong, Y. S., and Chen, Z. Y.: Atmosphere boundary layer height and its effect on air pollutants in Beijing during winter heavy pollution, Atmos. Res., 215, 305–316, https://doi.org/10.1016/j.atmosres.2018.09.014, 2019.
Xiang, Y., Lv, L., Chai, W., Zhang, T., Liu, J., and Liu, W.: Using Lidar technology to assess regional air pollution and improve estimates of PM2.5 transport in the North China Plain, Environ. Res. Lett., 15, 094071, https://doi.org/10.1088/1748-9326/ab9cfd, 2020.
Xu, J. M., Chang, L. Y., Qu, Y. H., Yan, F. X., Wang, F. Y., and Fu, Q. Y.: The meteorological modulation on PM2.5 interannual oscillation during 2013 to 2015 in Shanghai, China, Sci. Total Environ., 572, 1138–1149, https://doi.org/10.1016/j.scitotenv.2016.08.024, 2016.
Yang, X., Cheng, S., Li, J., Lang, J., and Wang, G.: Characterization of Chemical Composition in PM2.5 in Beijing before, during, and after a Large-Scale International Event, Aerosol Air Qual. Res., 17, 896–907, https://doi.org/10.4209/aaqr.2016.07.0321, 2017.
Yuan, R. M., Zhang, X. Y., Liu, H., Gui, Y., Shao, B. H., Tao, X. P., Wang, Y. Q., Zhong, J. T., Li, Y. B., and Gao, Z. Q.: Aerosol vertical mass flux measurements during heavy aerosol pollution episodes at a rural site and an urban site in the Beijing area of the North China Plain, Atmos. Chem. Phys., 19, 12857–12874, https://doi.org/10.5194/acp-19-12857-2019, 2019.
Yumimoto, K., Uno, I., Sugimoto, N., Shimizu, A., Liu, Z., and Winker, D. M.: Adjoint inversion modeling of Asian dust emission using lidar observations, Atmos. Chem. Phys., 8, 2869–2884, https://doi.org/10.5194/acp-8-2869-2008, 2008.
Zhang, C. X., Liu, C., Hu, Q. H., Cai, Z. N., Su, W. J., Xia, C. Z., Zhu, Y. Z., Wang, S. W., and Liu, J. G.: Satellite UV-Vis spectroscopy: implications for air quality trends and their driving forces in China during 2005–2017, Light-Sci. Appl., 8, 100, https://doi.org/10.1038/s41377-019-0210-6, 2019.
Zhang, C. X., Liu, C., Chan, K. L., Hu, Q. H., Liu, H. R., Li, B., Xing, C. Z., Tan, W., Zhou, H. J., Si, F. Q., and Liu, J. G.: First observation of tropospheric nitrogen dioxide from the Environmental Trace Gases Monitoring Instrument onboard the GaoFen-5 satellite, Light-Sci. Appl., 9, 66, https://doi.org/10.1038/s41377-020-0306-z, 2020.
Zhang, H., Xie, B., Zhao, S.-Y., and Chen, Q.: PM2.5 and tropospheric O3 in China and an analysis of the impact of pollutant emission control, Adv. Clim. Change Res., 5, 136–141, https://doi.org/10.1016/j.accre.2014.11.005, 2014.
Zhang, H., Cheng, S., Yao, S., Wang, X., and Wang, C.: Insights into the temporal and spatial characteristics of PM2.5 transport flux across the district, city and region in the North China Plain, Atmos. Environ., 218, https://doi.org/10.1016/j.atmosenv.2019.117010, 2019.
Zhang, Y., Zhang, X., Wang, L. T., Zhang, Q., Duan, F. K., and He, K. B.: Application of WRF/Chem over East Asia: Part I. Model evaluation and intercomparison with MM5/CMAQ, Atmos. Environ., 124, 285–300, https://doi.org/10.1016/j.atmosenv.2015.07.022, 2016.
Zhang, Y. H., Su, H., Zhong, L. J., Cheng, Y. F., Zeng, L. M., Wang, X. S., Xiang, Y. R., Wang, J. L., Gao, D. F., Shao, M., Fan, S. J., and Liu, S. C.: Regional ozone pollution and observation-based approach for analyzing ozone-precursor relationship during the PRIDE-PRD2004 campaign, Atmos. Environ., 42, 6203–6218, https://doi.org/10.1016/j.atmosenv.2008.05.002, 2008.
Zhang, Y. P., Chen, J., Yang, H. N., Li, R. J., and Yu, Q.: Seasonal variation and potential source regions of PM2.5-bound PAHs in the megacity Beijing, China: Impact of regional transport, Environ. Pollut., 231, 329–338, https://doi.org/10.1016/j.envpol.2017.08.025, 2017.
Zhang, Y. X., Yuan, Q., Huang, D., Kong, S. F., Zhang, J., Wang, X. F., Lu, C. Y., Shi, Z. B., Zhang, X. Y., Sun, Y. L., Wang, Z. F., Shao, L. Y., Zhu, J. H., and Li, W. J.: Direct Observations of Fine Primary Particles From Residential Coal Burning: Insights Into Their Morphology, Composition, and Hygroscopicity, J. Geophys. Res.-Atmos., 123, 12964–12979, https://doi.org/10.1029/2018jd028988, 2018.
Zhao, D., Liu, G., Xin, J., Quan, J., Wang, Y., Wang, X., Dai, L., Gao, W., Tang, G., Hu, B., Ma, Y., Wu, X., Wang, L., Liu, Z., and Wu, F.: Haze pollution under a high atmospheric oxidization capacity in summer in Beijing: insights into formation mechanism of atmospheric physicochemical processes, Atmos. Chem. Phys., 20, 4575–4592, https://doi.org/10.5194/acp-20-4575-2020, 2020.
Zheng, G. J., Duan, F. K., Su, H., Ma, Y. L., Cheng, Y., Zheng, B., Zhang, Q., Huang, T., Kimoto, T., Chang, D., Poschl, U., Cheng, Y. F., and He, K. B.: Exploring the severe winter haze in Beijing: the impact of synoptic weather, regional transport and heterogeneous reactions, Atmos. Chem. Phys., 15, 2969–2983, https://doi.org/10.5194/acp-15-2969-2015, 2015.
Zheng, M., Yan, C. Q., Wang, S. X., He, K. B., and Zhang, Y. H.: Understanding PM2.5 sources in China: challenges and perspectives, Natl. Sci. Rev., 4, 801–803, https://doi.org/10.1093/nsr/nwx129, 2017.
Zheng, Y., Che, H. Z., Xia, X. G., Wang, Y. Q., Wang, H., Wu, Y. F., Tao, J., Zhao, H. J., An, L. C., Li, L., Gui, K., Sun, T. Z., Li, X. P., Sheng, Z. Z., Liu, C., Yang, X. Y., Liang, Y. X., Zhang, L., Liu, C., Kuang, X., Luo, S., You, Y. C., and Zhang, X. Y.: Five-year observation of aerosol optical properties and its radiative effects to planetary boundary layer during air pollution episodes in North China: Intercomparison of a plain site and a mountainous site in Beijing, Sci. Total Environ., 674, 140–158, https://doi.org/10.1016/j.scitotenv.2019.03.418, 2019.
Zhong, J. T., Zhang, X. Y., Wang, Y. Q., Sun, J. Y., Zhang, Y. M., Wang, J. Z., Tan, K. Y., Shen, X. J., Che, H. C., Zhang, L., Zhang, Z. X., Qi, X. F., Zhao, H. R., Ren, S. X., and Li, Y.: Relative Contributions of Boundary-Layer Meteorological Factors to the Explosive Growth of PM2.5 during the Red-Alert Heavy Pollution Episodes in Beijing in December 2016, J. Meteorol. Res.-Prc, 31, 809–819, https://doi.org/10.1007/s13351-017-7088-0, 2017.
Zhou, Y. D., Zhao, Y., Mao, P., Zhang, Q., Zhang, J., Qiu, L. P., and Yang, Y.: Development of a high-resolution emission inventory and its evaluation and application through air quality modeling for Jiangsu Province, China, Atmos. Chem. Phys., 17, 211–233, https://doi.org/10.5194/acp-17-211-2017, 2017.