the Creative Commons Attribution 4.0 License.
the Creative Commons Attribution 4.0 License.
 | 01 Apr 2021
How frequent is natural cloud seeding from ice cloud layers ( < −35 °C) over Switzerland?
Verena Bessenbacher
Zane Dedekind
Ulrike Lohmann
David Neubauer
Clouds and cloud feedbacks represent one of the largest uncertainties in climate projections. As the ice phase influences many key cloud properties and their lifetime, its formation needs to be better understood in order to improve climate and weather prediction models. Ice crystals sedimenting out of a cloud do not sublimate immediately but can survive certain distances and eventually fall into a cloud below. This natural cloud seeding can trigger glaciation and has been shown to enhance precipitation formation. However, to date, an estimate of its occurrence frequency is lacking. In this study, we estimate the occurrence frequency of natural cloud seeding over Switzerland from satellite data and sublimation calculations.
We use the DARDAR (radar lidar) satellite product between April 2006 and October 2017 to estimate the occurrence frequency of multi-layer cloud situations, where a cirrus cloud at T < −35 ∘C can provide seeds to a lower-lying feeder cloud. These situations are found to occur in 31 % of the observations. Of these, 42 % have a cirrus cloud above another cloud, separated, while in 58 % the cirrus is part of a thicker cloud, with a potential for in-cloud seeding. Vertical distances between the cirrus and the lower-lying cloud are distributed uniformly between 100 m and 10 km. They are found to not vary with topography. Seasonally, winter nights have the most multi-layer cloud occurrences, in 38 % of the measurements. Additionally, in situ and liquid origin cirrus cloud size modes can be identified according to the ice crystal mean effective radius in the DARDAR data. Using sublimation calculations, we show that in a significant number of cases the seeding ice crystals do not sublimate before reaching the lower-lying feeder cloud. Depending on whether bullet rosette, plate-like or spherical crystals were assumed, 10 %, 11 % or 20 % of the crystals, respectively, could provide seeds after sedimenting 2 km.
The high occurrence frequency of seeding situations and the survival of the ice crystals indicate that the seeder–feeder process and natural cloud seeding are widespread phenomena over Switzerland. This hints at a large potential for natural cloud seeding to influence cloud properties and thereby the Earth's radiative budget and water cycle, which should be studied globally. Further investigations of the magnitude of the seeding ice crystals' effect on lower-lying clouds are necessary to estimate the contribution of natural cloud seeding to precipitation.
- Article
(4627 KB) - Full-text XML
- BibTeX
- EndNote


Clouds and cloud feedbacks contribute the largest uncertainty to projections of climate sensitivity in global climate models (Cess et al., 1990; Soden and Held, 2006; Williams and Tselioudis, 2007; Boucher et al., 2013). Cloud microphysics, and especially cloud ice/water content, determine key cloud properties, such as their albedo and lifetime, and control precipitation formation (Mülmenstädt et al., 2015). The representation of the ice phase in clouds is therefore necessary to estimate the Earth's radiation budget and its response to climate change (Sun and Shine, 1995; Tan et al., 2016; Matus and L'Ecuyer, 2017; Lohmann and Neubauer, 2018) as well as to improve forecasts of precipitation in numerical weather prediction models. Natural cloud seeding can be a source of ice crystals in clouds, lead to the glaciation of clouds and enhance precipitation. Moreover, the seeder–feeder mechanism has been associated with the enhancement of extreme precipitation and flooding (Rössler et al., 2014). An understanding of the seeder–feeder mechanism is therefore necessary to improve the representation of the cloud ice phase in weather and climate models, to improve weather forecasts of precipitation and ultimately to reduce uncertainty in climate simulations.
The seeder–feeder mechanism was originally proposed to explain an observed enhancement of precipitation over mountains. In this classical setting, precipitation from an overlying “seeder” cloud falls into an orographic “feeder” cloud. In the lower cloud, the precipitation particles grow by accretion, coalescence or riming, which leads to an enhancement of precipitation over the orography (Roe, 2005). This classical seeder–feeder mechanism has been observed in field studies in various locations (Dore et al., 1999; Purdy et al., 2005; Hill et al., 2007) and has been reproduced in a number of idealized modelling studies (e.g. Carruthers and Choularton, 1983; Robichaud and Austin, 1988).
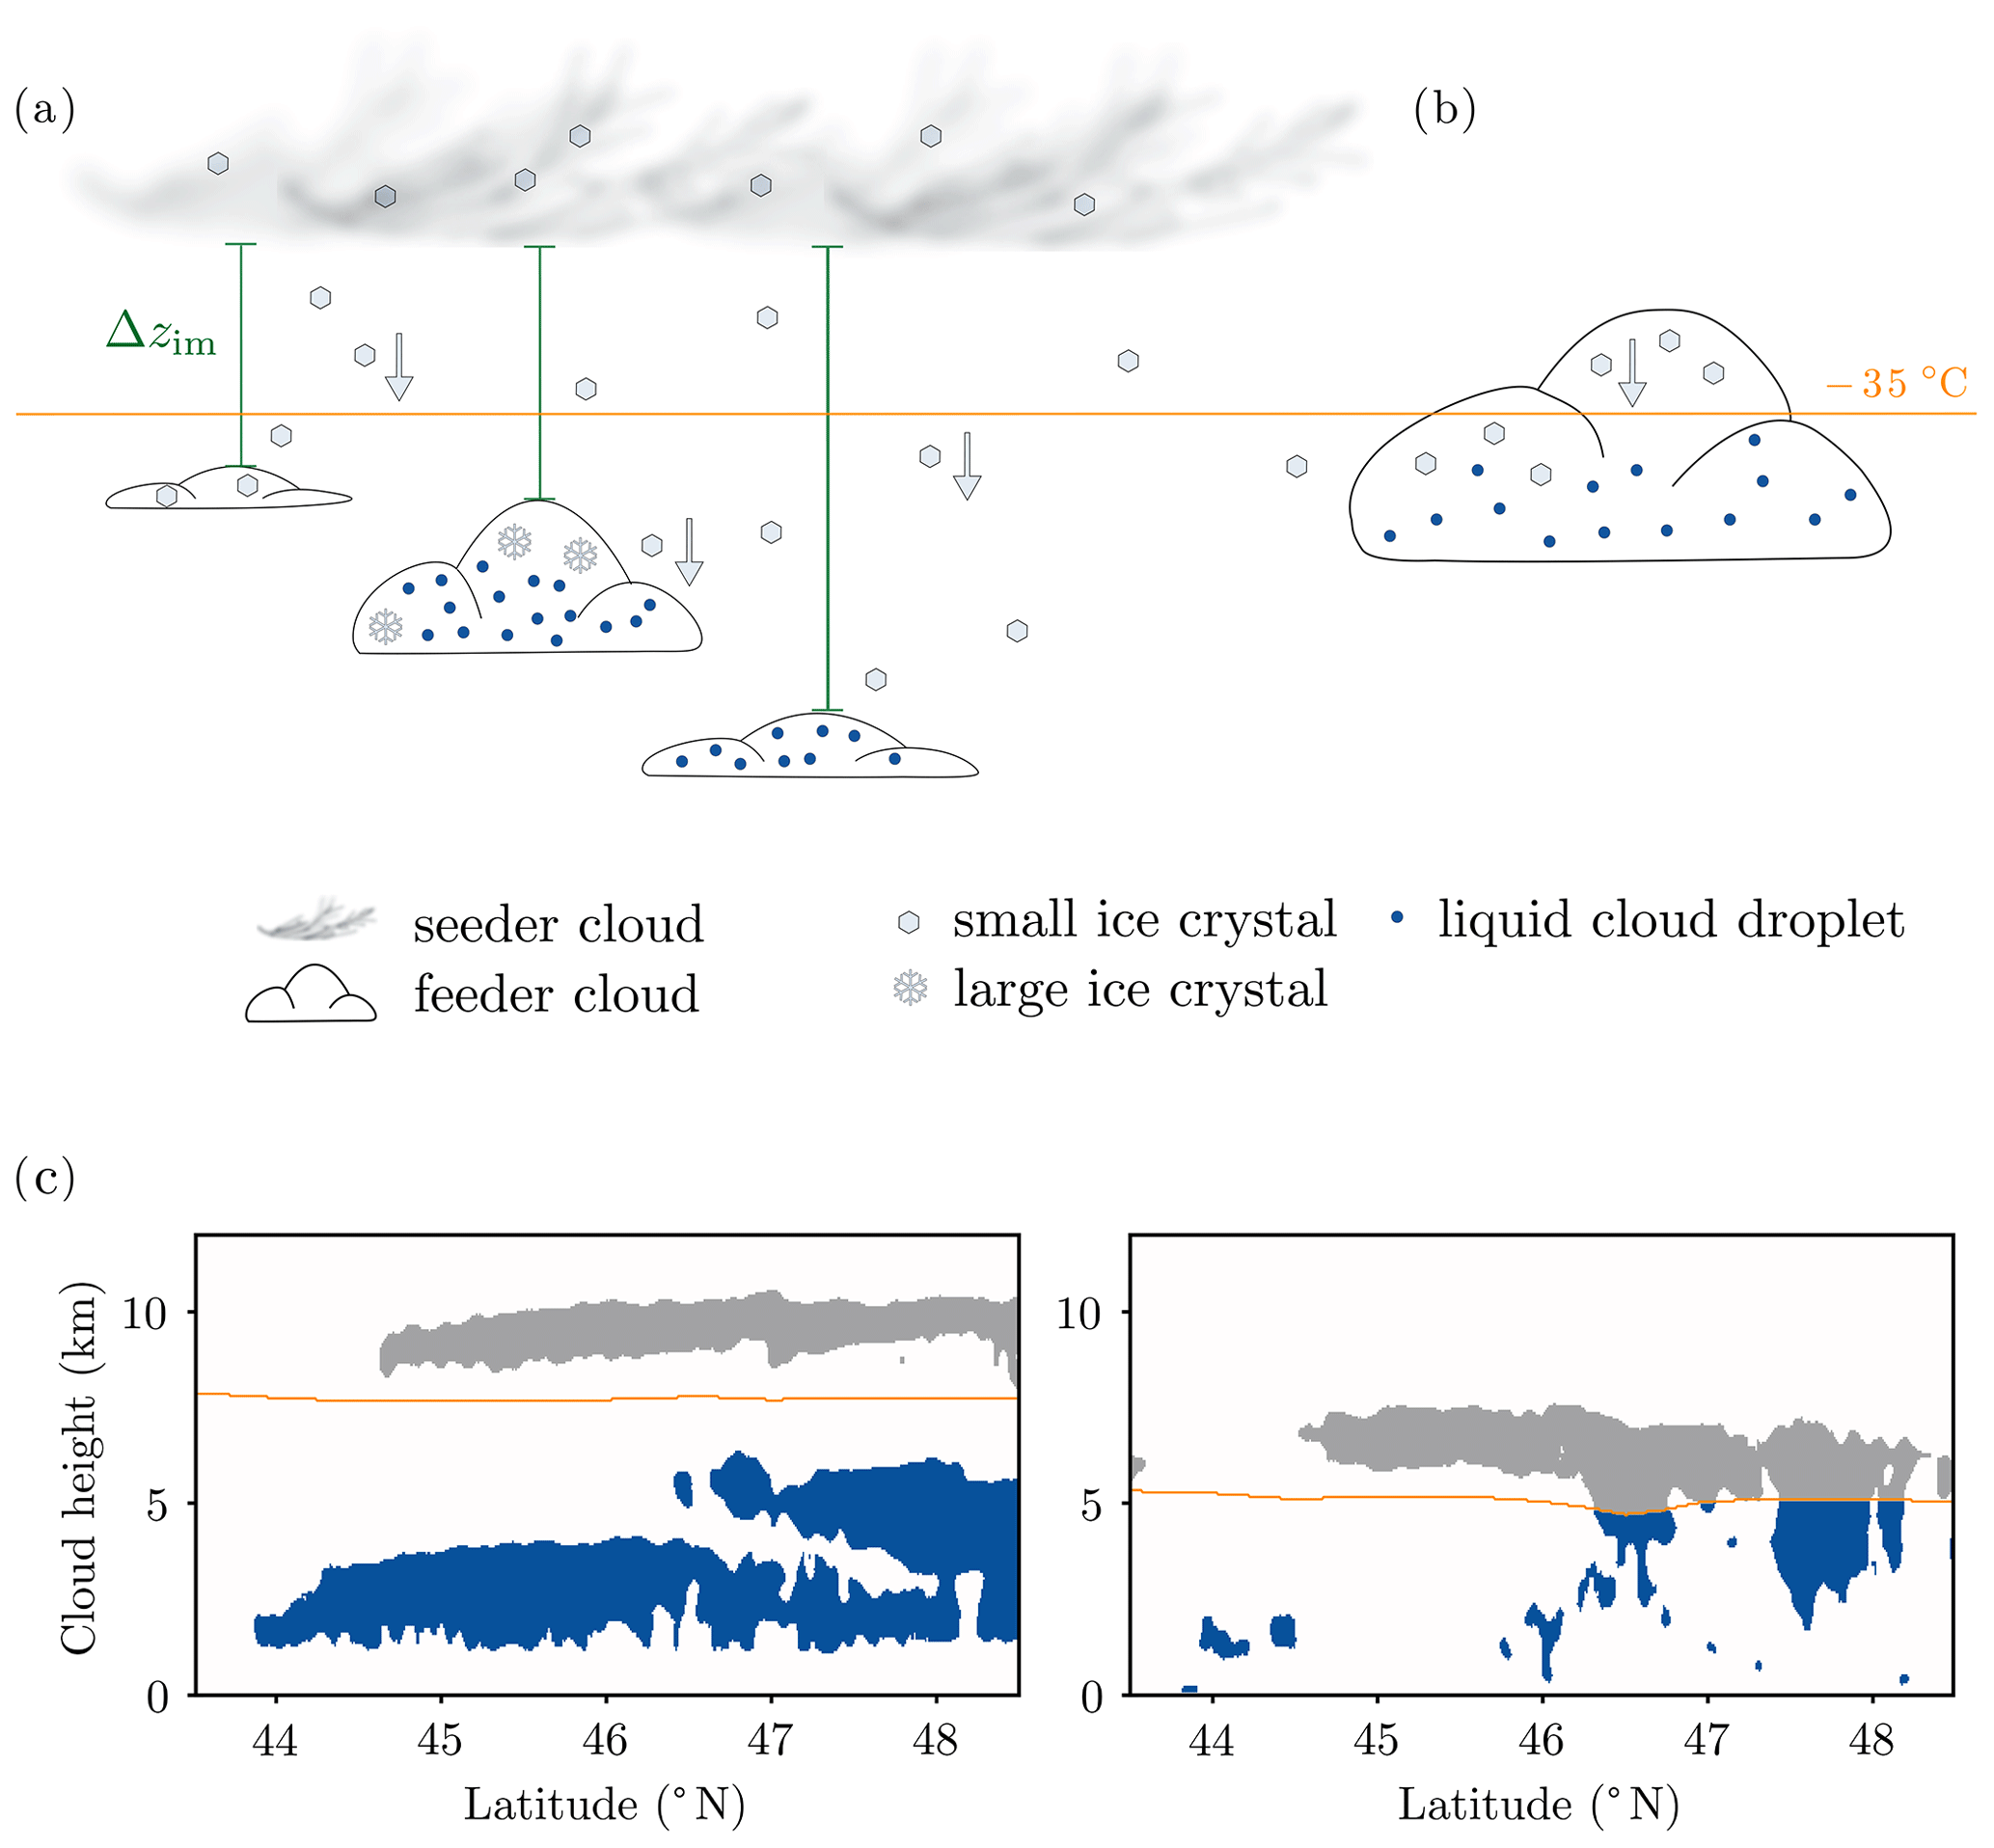
Figure 1Sketch of the two seeder–feeder situations observed in this study. The orange lines depict the −35 ∘C isotherm; Δzim is the distance between the lowest base of the cirrus cloud and the highest top of the cloud below. (a) Classical external seeder–feeder situation: a cirrus cloud ( ∘C) is detected at least 100 m above a cloud at ∘C (Δzim>100 m). The latter cloud is termed a “mixed-phase” cloud for simplicity but could also be liquid or ice phase. (b) In-cloud seeder–feeder situation: the algorithm detects the cloud part above the −35 ∘C isotherm as a cirrus cloud and the cloud part below as a mixed-phase cloud (Δzim<100 m). Ice crystal shapes are depicted according to Libbrecht (2005, Fig. 2). (c) Seeder–feeder situations as seen in the DARDAR data. Cirrus clouds above the −35 ∘C isotherm are depicted in grey; clouds below in blue. Left: exemplary plot of the classical external seeder–feeder situation (data from 29 May 2007); right: exemplary plot of only a mixed-phase or a cirrus cloud present (latitudes equatorwards of 46∘ N) and the in-cloud seeder–feeder situation (polewards of 46∘ N, data from 3 December 2010).
Braham (1967) noted the possibility of ice crystals from cirrus clouds acting as seeds for ice formation in lower-lying warmer clouds. In this special case of the seeder–feeder mechanism, the seeding precipitation is specified as ice, but the presence of orography is not a prerequisite for the mechanism's occurrence. This natural cloud seeding is the focus of the current study, where hereafter the seeder–feeder mechanism and natural cloud seeding refer to ice particles falling from a cirrus cloud into a lower-lying cloud or a lower-lying part of the same cloud, which is either liquid, ice or mixed phase (Fig. 1). In a widened sense, the process of falling precipitation particles that feed on the hydrometeors in a lower part within the same cloud can also be understood as a seeder–feeder process (in-cloud seeder–feeder mechanism; Hobbs et al., 1980; see Fig. 1b). This study focuses on cirrus clouds as seeding clouds because they can be identified readily in the DARDAR (radar lidar) satellite data. Of course, other ice-containing clouds such as altocumulus or altostratus clouds may act as seeding clouds as well and may be the subject of a further study.
Cirrus clouds, which act as seeder clouds in this study, can form either from freezing of liquid droplets or in situ from homogeneous freezing of solution droplets or heterogeneous nucleation. Recent studies have suggested to classify cirrus clouds accordingly, as liquid or in situ origin ice clouds (Luebke et al., 2013; Krämer et al., 2016; Luebke et al., 2016; Wernli et al., 2016; Gasparini et al., 2018; Wolf et al., 2018, 2019). The formation mechanism has been shown to influence clouds' microphysical properties (Luebke et al., 2016; Wolf et al., 2018, 2019).
Seeding ice crystals can have a large influence on cloud properties, because in the atmosphere, at temperatures warmer than −38 ∘C, ice can only be formed via heterogeneous nucleation on ice-nucleating particles (e.g. Kanji et al., 2017, and references therein). Once ice particles are formed within the cloud or enter the cloud from outside, they grow by riming or vapour deposition (rapidly via the Wegener–Bergeron–Findeisen process, where ice crystals grow at the expense of liquid droplets, when the water vapour saturation ratio is subsaturated with respect to water and supersaturated with respect to ice; Wegener, 1911; Bergeron, 1935; Findeisen, 1938) and can multiply through secondary ice production (Korolev and Leisner, 2020, Hallett–Mossop process, Hallett and Mossop, 1974; Mossop and Hallett, 1974, frozen droplet shattering, Lauber et al., 2018 or ice–ice collisional breakup Sullivan et al., 2018). Thereby, seeding ice crystals destabilize a cloud, which subsequently could glaciate and/or form precipitation. Because of the aforementioned enhancement processes in the ice phase, the seeder–feeder mechanism with seeding ice crystals is more efficient than the classical liquid seeder–feeder mechanism and has been found to lead to a larger precipitation enhancement (Choularton and Perry, 1986).
For natural cloud seeding to take place, the ice crystals' survival during the sedimentation through a subsaturated layer of air and into the lower cloud layer is crucial. Braham (1967) observed a spectacular case of ice crystals that survived a distance of 5 km in cloud-free air. This demonstrated the feasibility of natural cloud seeding (Hitschfeld, 1968; Locatelli et al., 1983). In a first theoretical study, Hall and Pruppacher (1976) found that “ice particles could survive distances of up to 2 km when the relative humidity with respect to ice was below 70 %”. Natural cloud seeding through sedimenting ice crystals has been observed in a multitude of remote sensing and aircraft campaigns (Dennis, 1954; Hobbs et al., 1980, 1981; Locatelli et al., 1983; Hobbs et al., 2001; Pinto et al., 2001; Fleishauer et al., 2002; Ansmann et al., 2008; Creamean et al., 2013) and has been studied in mostly idealized model simulations (Rutledge and Hobbs, 1983; Fernández-González et al., 2015; Chen et al., 2020), where it has been found to mainly enhance ice and precipitation formation.
Seifert et al. (2009) and Ansmann et al. (2009) estimated such an occurrence frequency of natural cloud seeding for their lidar field study datasets indirectly when aiming to exclude all seeded clouds. They simply defined all mixed-phase clouds that had an ice cloud within 2 km above cloud top as a seeded ice cloud. For example, in Leipzig, about 10 % of ice-containing clouds at −20 ∘C were marked as seeded (ice-containing clouds made up 90 % of the observations at that temperature). A more thorough, regional estimate of seeder–feeder occurrence frequency in the Arctic was derived by Vassel et al. (2019). Using radiosonde and radar data from Svalbard, they deduced the frequency of multi-layer clouds as 29 %. Calculating the sublimation height of hexagonal plate ice crystals with a radius of 400 µm (radius meaning here: half of the maximum span across the hexagonal face), 26 % of observations contained a seeding case.
Such field studies have begun to elucidate the frequency and thereby the importance of natural cloud seeding regionally, but a thorough estimate is still lacking. With global coverage and sensors increasingly capable of resolving clouds and their vertical distribution, satellite data offer an opportunity to fill the gap from single observations to whole-Earth long-time observations to derive such a frequency estimate. Multi-layer clouds can be investigated using CloudSat and Cloud-Aerosol Lidar and Infrared Pathfinder Satellite Observation (CALIPSO) data (e.g. Wang et al., 2000; Mace et al., 2009; Das et al., 2017; Matus and L'Ecuyer, 2017). To provide an estimate of the natural cloud seeding frequency, sublimation calculations need to be combined with the seeder–feeder situation/multi-layer cloud occurrence frequencies as done by Vassel et al. (2019).
In this study, we employ the DARDAR satellite product that is based on CloudSat and CALIPSO data (Delanoë and Hogan, 2008, 2010b; Ceccaldi et al., 2013) and combine it with sublimation calculations to derive a frequency estimate of seeder–feeder situations over Switzerland. Note that we consider as seeder clouds only cirrus clouds to ensure that the they contain ice. In the following section (Sect. 2), the DARDAR satellite product, our analysis and the sublimation calculations are described. In Sect. 3.1, findings from the analysis of the DARDAR data are presented and discussed, followed by the results from the sublimation calculations in Sect. 3.2. Conclusions and an outlook are given in Sect. 4.
2.1 Satellite data
The DARDAR-CLOUD satellite data product used in this study is based on radar and lidar data from the CloudSat and CALIPSO satellites. The satellites were launched jointly on 28 April 2006 into the A-Train or afternoon constellation, a coordinated group of satellites in a Sun-synchronous polar orbit (Stephens et al., 2002). CloudSat has a cloud profiling radar on-board that senses cloud particles and detects precipitation (Stephens et al., 2008). CALIPSO carries the Cloud-Aerosol Lidar with Orthogonal Polarization (CALIOP) and two passive sensors, a visible camera and a three-channel infrared radiometer (Winker et al., 2010). The two satellites are designed for their data to be combined: the lidar on CALIPSO is able to identify the thin upper layers of cirrus clouds that the radar on CloudSat misses (Winker et al., 2010), while the latter is able to look through thick clouds where the lidar beam is attenuated. Because of their joint operations and almost simultaneous time measurements, the two satellites provide novel ways to look at precipitation, aerosols and the vertical distribution of clouds (Gao et al., 2014; Hong and Liu, 2015; Naud et al., 2015; Stephens et al., 2018; Witkowski et al., 2018).
From the CloudSat and CALIPSO data, Delanoë and Hogan (2010b) developed the DARDAR satellite product that provides cloud classification and ice cloud properties. It was developed further into a DARDAR v2 by Ceccaldi et al. (2013). DARDAR data are retrieved at 60 m vertical resolution up to an altitude of 25 km and a horizontal resolution of 1.4 km (Delanoë and Hogan, 2010a). Next to other cloud properties, it contains a classification of the layer at each grid point with categories like clear sky, ice, liquid or supercooled clouds, aerosols, etc. as well as the retrieved effective ice crystal radius.
In this study, DARDAR-CLOUD v2.1.1 data (as described in Ceccaldi et al., 2013) from April 2006 through October 2017 were used. Due to CloudSat's battery problems, there are no data between April 2011 and April 2012 and merely daylight-only operations mode data thereafter (Stephens et al., 2008; Witkowski et al., 2018; CloudSat radar status, 2020).
Analysis method
The study domain surrounds Switzerland (43.5 to 48.5∘ N and 4 to 12∘ E) and contains most of the Alps.
Figure 2 shows the geographic distribution of all satellite tracks that go through the chosen domain.
In order to evaluate the frequency of seeder–feeder situations four variables were created:
| frac_cov (–) | The fraction of sky covered with a specific combination of cloud top and cloud base temperatures. |
| icebase (m) | The height (altitude above sea level) of the lowest cloud grid point with (lowest base of a cirrus cloud). |
| Δzim (m) | The distance between the lowest cirrus cloud base and the highest top of the cloud below (in the following called mixed-phase cloud). |
| reff (µm) | The effective radius of ice crystals at the lowest cirrus cloud base. |
All variables were derived from a cloud mask, where DARDAR categories 1, 2, 3 and 4 (ice, ice plus supercooled, liquid (warm and supercooled)) were combined to simply signify the presence of cloud layers. This cloud mask was found to be noisy and was therefore filtered (using a median filter over the surrounding 7×7 point plane, in altitude and horizontally along the track). For icebase, Δzim and reff the cloud mask were combined with a temperature mask to differentiate between mixed-phase and cirrus clouds. In this study, cirrus clouds are defined as clouds at temperatures lower than −35 ∘C, and mixed-phase clouds are defined as all clouds with temperatures warmer than −35 ∘C. Depending on their size, liquid cloud droplets supercool to −35 to −40 ∘C before freezing homogeneously (e.g. Pruppacher and Klett, 2010; Murray et al., 2010; Herbert et al., 2015; Kanji et al., 2017). However, in tests preceding this study, a threshold of −38 instead of −35 ∘C proved to have no evident impact on the results. Note that clouds termed “mixed-phase” could in principle be in the liquid or ice phases in reality, depending on their history and the presence of ice-nucleating particles (see Fig. 1a). Similarly, in this study, we denote all ice clouds at temperatures colder than −35 ∘C as cirrus clouds, which could be isolated ice clouds or the upper parts of mixed-phase clouds.
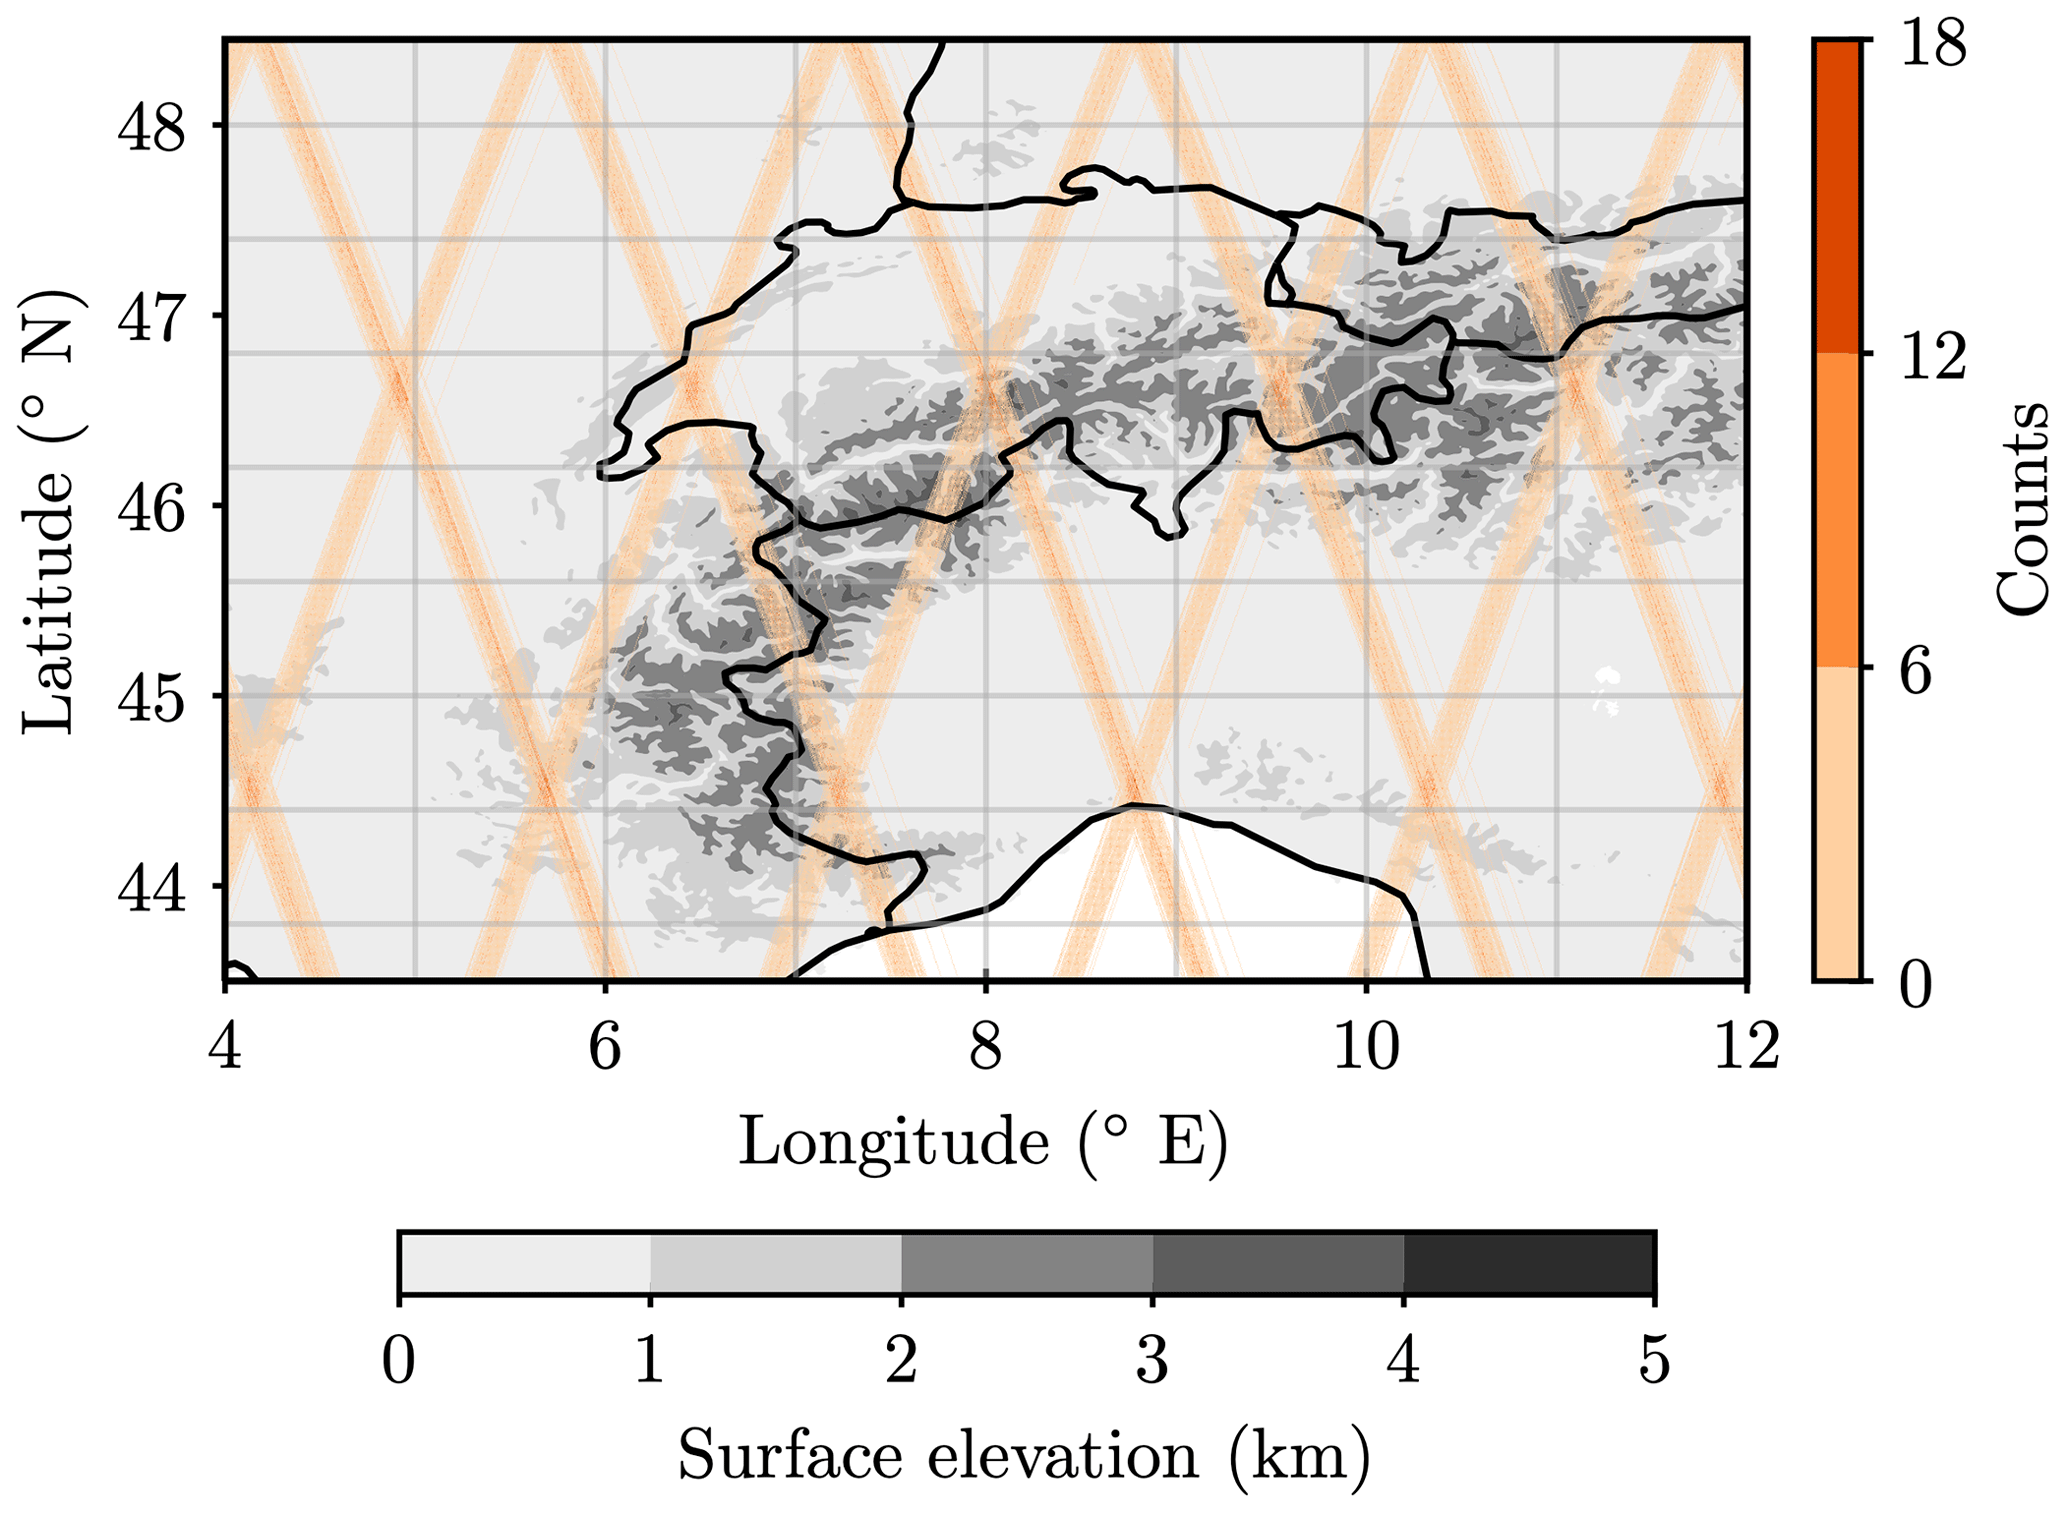
Figure 2Geographical distribution of the satellite observations: number of tracks through each point within the study domain (43.5 to 48.5∘ N and 4 to 12∘ E ) over the whole time period analysed in this study (2006–2017).
The combined cloud and temperature masks were applied to the altitude and effective ice crystal variable in the DARDAR data to find the values at the lowest cirrus cloud base (for icebase, reff and Δzim) and at the highest mixed-phase cloud top (for Δzim). Prior to this, the effective ice crystal radius was also filtered for consistency. As a filter for the effective radius, the vertical median with an extent of four pixels up and four pixels down from the one in question was applied, using only those pixels where the unfiltered cloud mask detected a cloud. For Δzim, the altitude of the highest mixed-phase cloud top was subtracted from the altitude of the lowest cirrus cloud base. Finally, the dataset was saved on a grid with a resolution of with no quality loss compared to the original DARDAR data. During regridding, areas containing no satellite tracks were set to missing data to be able to derive the total number of observations later on.
2.2 Ice crystal sublimation calculations
Environmental parameters such as the air density, air temperature and the relative humidity also affect the ice crystal sublimation rate and fall velocity. For these parameters, Hall and Pruppacher (1976) used the NACA (National Advisory Committee for Aeronautics) standard profile, while Vassel (2018) and Vassel et al. (2019) used radiosonde profiles that were averaged for each subsaturated layer in their calculations. Since the environmental conditions are primary determinants of the sublimation height, we chose the most detailed information available. Relative humidity and temperature were therefore taken from ERA5 reanalysis data from the European Centre for Medium-Range Weather Forecasts (ECMWF; Hersbach et al., 2020). From the DARDAR data icebase, Δzim and reff were used. Prior to calculations, the ERA5 data were regridded vertically to match the DARDAR 60 m resolution; horizontally, points closest to the DARDAR points were chosen. As only hourly ERA5 data were available, data from the hour closest to the entry time of the satellites into the study domain were used. The sublimation height was calculated individually for every point in every available track file where there was at least one cirrus cloud above a mixed-phase cloud present. The algorithm is based on work by Vassel (2018). It was applied to three different shapes of ice crystals, namely spheres, hexagonal plates and bullet rosettes. These three were chosen to sample ice crystal properties, e.g. to span the possible range of terminal velocities. In particular, bullet rosettes have been found to be one of the most abundant shapes in cirrus clouds (Lawson et al., 2019; Heymsfield and Iaquinta, 2000). And ice crystals have been found to evolve into spherical shape while sublimating (Nelson, 1998), which makes these ideal shapes to use. Additionally, the computations were run for plate-like ice crystals, which experience intermediate drag and can also occur in cirrus clouds (Libbrecht, 2005), to include an ice crystal type used in Vassel et al. (2019). The equations shown refer to the spherical particle. Information for the computations using hexagonal plates and bullet rosettes is given in Tables A3 and A4 in Appendix A.
Table 1Variables used in the sublimation calculations as described in the text. For a comprehensive list, see also Table A1.
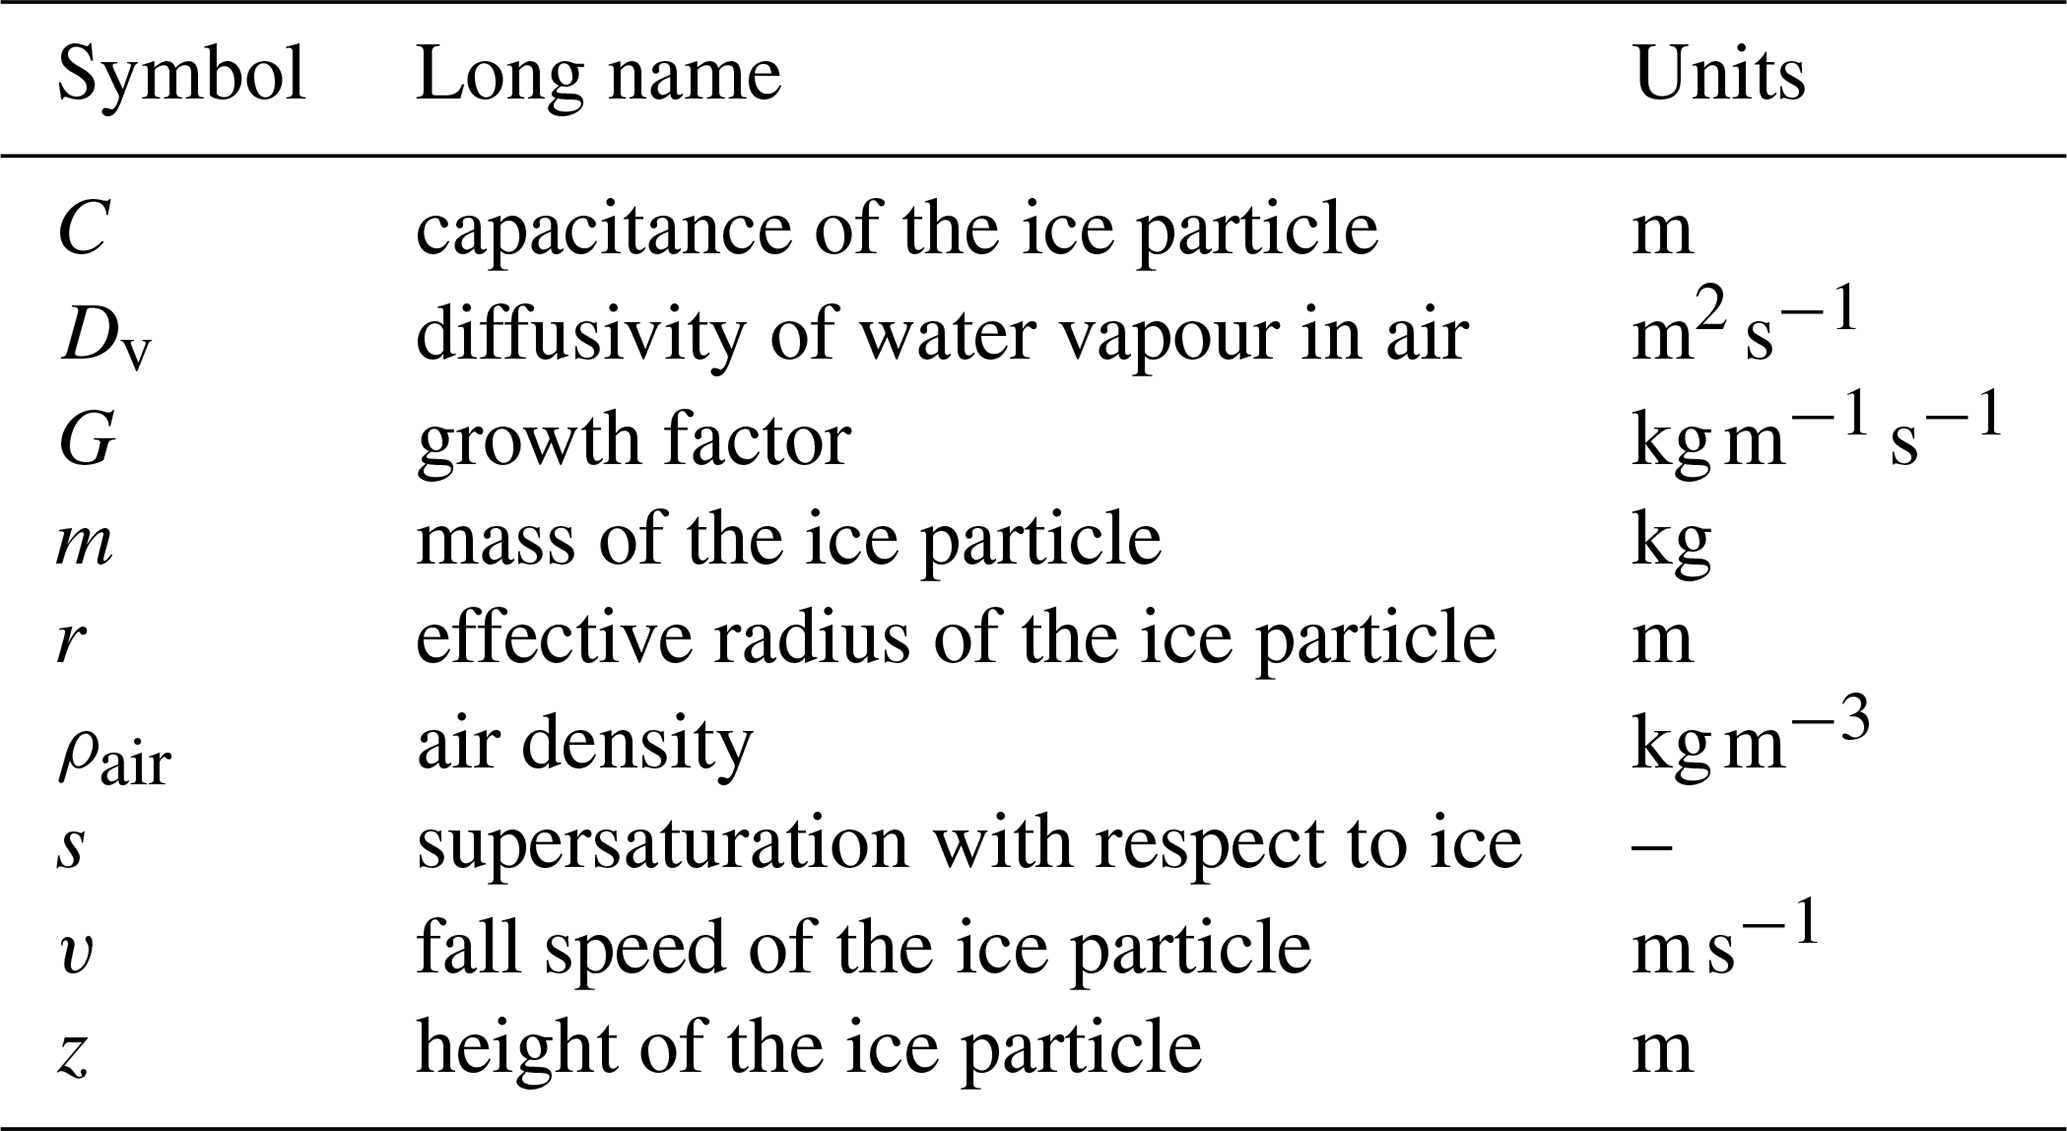
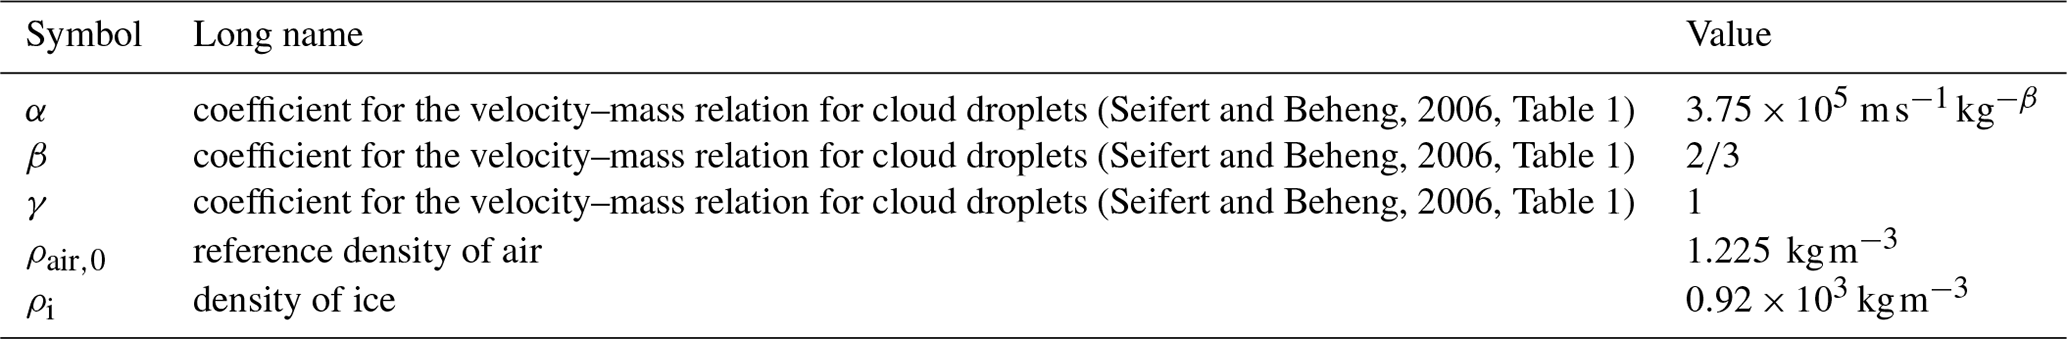
Table 2Constants used in the sublimation calculations for a sphere as described in the text. For a comprehensive list, see also Table A2. Note that the parameterization for the velocity–mass relation for cloud droplets from Seifert and Beheng (2006) is used for spherical ice crystals in this study. Constants that differ for a hexagonal plate or rosette crystal are given in Tables A4 and A6.
The sublimation algorithm was applied in 0.01 s time steps (dt) as follows, where the initial height of the ice particle was icebase. The variables and constants used are given in Tables 1 and 2. The mass of the ice crystal was calculated from the radius:
For a sphere, the capacitance of the ice particle is simply equal to the radius at time step i (Lohmann et al., 2016, p. 240):
Following Lamb and Verlinde (2011), the change in mass is
which was used to time step mass and radius of the ice crystal:
using the ventilation factor f determined from Eq. (A5). The fall speed is calculated following Seifert and Beheng (2006), with coefficients given in Table 2, and used to time step the height of the particle:
Equations used to generate the values needed in the above equations are given in Appendix A, with additional variables and constants in Tables A1 and A2.
In between cloud layers, small up- or downdrafts can be expected. For lack of reliable data on such small scales, the updraft velocity was not considered in the sublimation calculations. Also, radiative heat transfer to and from the ice particles was ignored since Hall and Pruppacher (1976) found that it “is only of secondary importance in determining [an ice particle's] survival distance in subsaturated air”. While the calculations are based on a scheme developed by Vassel (2018), here additional factors such as the ventilation factor and the temperature dependency in the dynamic viscosity were added. Furthermore, Vassel et al. (2019) used mass–diameter relations and fall speed derived in Mitchell (1996), which in this study are taken from Pruppacher and Klett (2010), Heymsfield and Iaquinta (2000) and Seifert and Beheng (2006) due to the differing ice crystal types used here.
The time-stepping script was set to run for a day but was stopped when the particle had reached Earth's surface or sublimated (zero mass or a radius less than 10−8 m). The sublimation height was returned and compared to the height of the mixed-phase cloud top, which was derived from icebase and Δzim in the DARDAR data. When the sublimation height was lower than the height of the mixed-phase cloud top, the ice crystals at that grid point were marked as seeding.
These calculations present a conservative estimate. In reality, ice crystals have a size distribution. The large ice crystals within a distribution survive longer sedimentation distances than the ones with the effective radius, for which the survival is calculated. Also, the effective radius of ice crystals is underestimated in DARDAR v2 compared to the newer version (v3, which is not available yet) by 5 % to as much as 40 % (Cazenave et al., 2019).
3.1 DARDAR data
3.1.1 Distribution of distances between ice and mixed-phase cloud layer
Figure 3 shows the average frequency of Δzim, the distance between the cirrus and mixed-phase cloud, within the DARDAR dataset (as described in Sect. “Analysis method”, any cloud at temperatures ∘C is termed “mixed-phase” in this study). It can be understood as the average distribution of Δzim within a unit area. Overall, 69 % of all measurements do not show a cirrus–mixed-phase cloud distance at all. In those cases, either clouds of only one category were present or none at all (30 % of the measurements are cloud free). In total, 31 % of the measurements contain both a cirrus and a mixed-phase cloud simultaneously. This is the percentage of cases in which a seeding of the lower cloud by ice crystals falling from the ice cloud above is possible. Tailoring this result to the sedimentation of ice crystals from a cirrus cloud, when only the measurements that detect a cirrus cloud are taken into account, in 75 % of these measurements also a mixed-phase cloud below them is detected.
In 44 % of the cases with a detected cirrus cloud (18 % in total), Δzim is smaller than 100 m. This may either be the case when the cirrus and the mixed-phase cloud are truly separated by a small distance, or when the two differently classified layers are actually part of the same cloud. From the construction of the classification algorithm, the latter would be the case when the −35 ∘C isotherm intersects the cloud. This case is illustrated in Fig. 1b. In contrast to Mace et al. (2009) and Vassel et al. (2019), our algorithm does not require a cloud-free layer in between the mixed-phase and the cirrus cloud, so we also observe a potential for in-cloud seeding. However, clouds connected by sedimenting ice would also be seen as a cirrus cloud with a very small or no distance to the next mixed-phase cloud in our analysis. Ansmann et al. (2009) observed ice virga between the seeder and the feeder cloud and Mace et al. (2009) also mentioned this as a cause of misclassification in their study. Of course, in cases where the −35 ∘C isotherm lies within the cirrus cloud, there could be another mixed-phase cloud underneath. The distance to this second cloud does not appear in our analysis.
The other half of the cases (Δzim>100 m) represents the classical external seeder–feeder situation, with a cirrus cloud clearly separated from a mixed-phase cloud below (see Fig. 1a). The Δzim are distributed equally between 2000 and 6000 m, increase for smaller and decrease for larger Δzim. The smaller frequencies at Δzim<2000 m are due to the few possibilities for both cirrus and mixed-phase cloud to be located close to the −35 ∘C isotherm. Because the cirrus cloud frequency decreases for large heights, the Δzim occurrence frequency decreases as well for Δzim>6000 m. Generally speaking, Δzim increases with increasing upper cloud height (see Fig. B2).
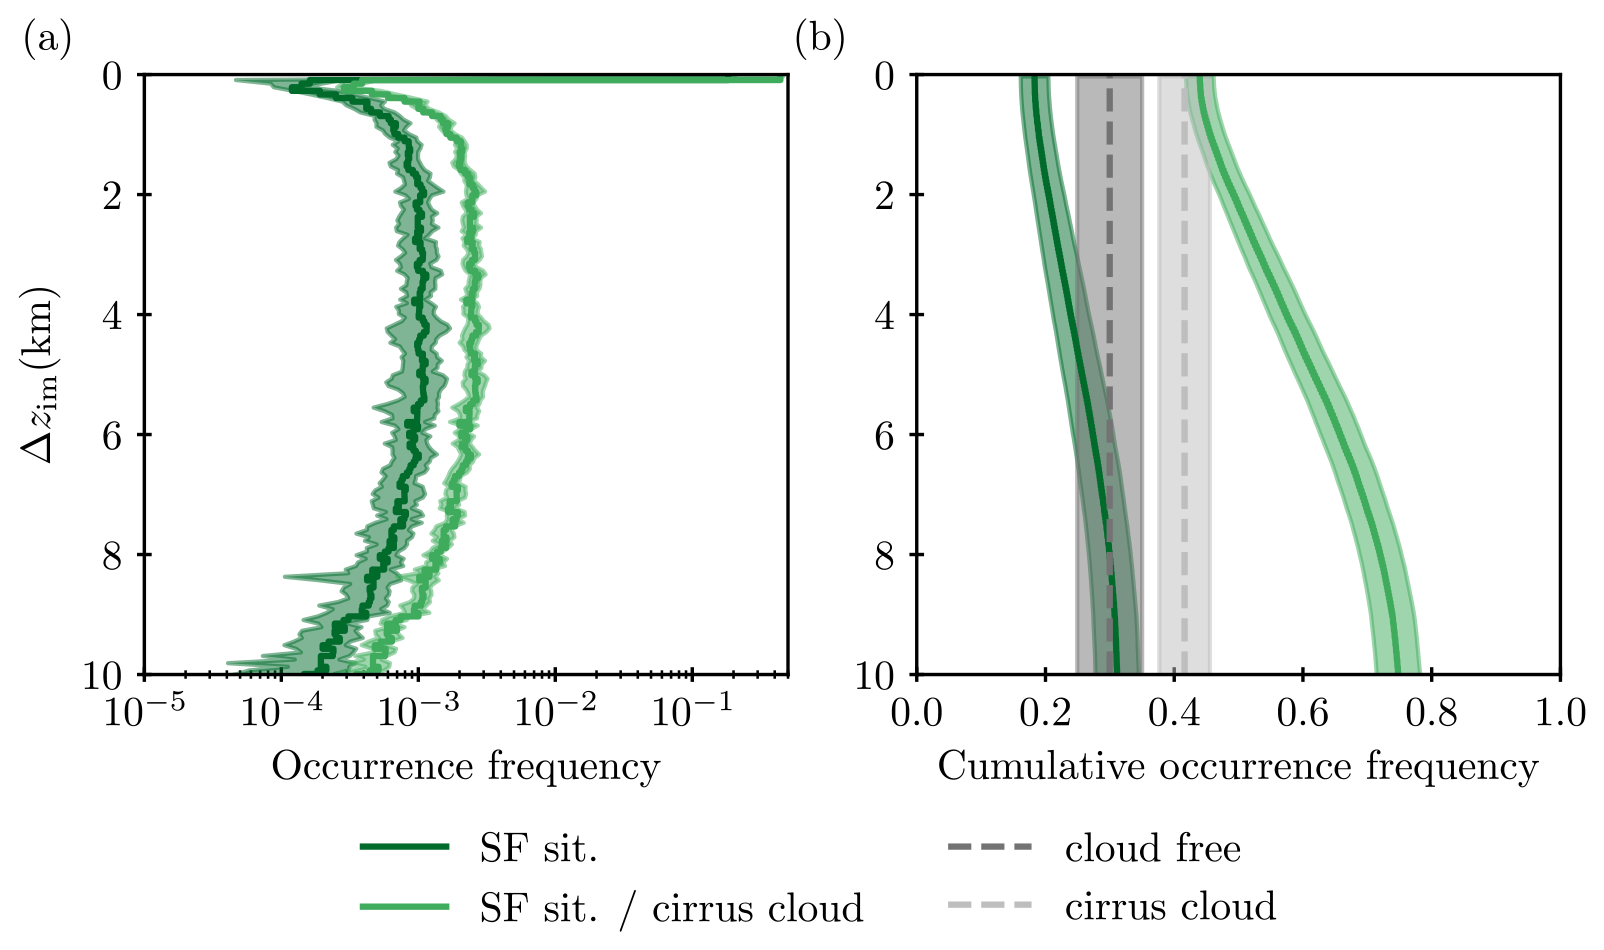
Figure 3(a) Occurrence frequency of seeder–feeder situations (SF sit.) with respective Δzim as a fraction of measurements (dark green) or cirrus cloud measurements (light green). (b) Cumulative occurrence frequency. For Δzim, a vertical resolution of 60 m is used. For comparison, the fractions of measurements with at least one cirrus cloud (light grey) and with a cloud-free atmosphere (dark grey) are given. Here and in the following, data from all tracks in the study time (2006 to 2017) and within the study domain were used (2210 satellite tracks). The total number of measurements is 853 833, with 267 354 measuring Δzim and 355 331 measuring cirrus clouds. The shaded areas visualize the standard deviation of interannual variability. Note that Δzim=0 m is at the base of the lowest cirrus cloud layer with ∘C.
In this distribution and in the following analysis, the effect of vertical wind shear of the horizontal wind cannot be taken into account, because the satellite retrieval only obtains instantaneous profiles, without any information on their temporal development. In the time that ice crystals need to sediment distances of a few kilometres, undoubtedly the clouds in question move relative to each other when wind shear is present. However, this movement can go in both ways, either removing or creating a multi-layer cloud situation. On average, these two effects are expected to cancel out, so that the results with and without considering wind shear should be similar.
Our results for multi-layer cloud occurrence frequency, 13 % (Δzim>100 m), are smaller than the ones given in the following literature. In their analysis of CALIPSO and CloudSat data, Mace et al. (2009) estimated the global occurrence of multiple layers to be 24 %. Wang et al. (2000) derived an estimate of 42 % from a radiosonde dataset. Of course the domain around Switzerland in this study is not expected to reproduce the global average, but Fig. 17a in Mace et al. (2009) and Fig. 5 in Wang et al. (2000) show average frequencies for Switzerland that are similar to the global average frequency. Using CloudSat and CALIPSO data as well, Matus and L'Ecuyer (2017) found an average multi-layer cloud fraction of about 25 % for the midlatitudes of Switzerland. The layers derived from radiosonde data by Wang et al. (2000) are much thinner than the ones found with remote sensing, possibly because large sedimenting particles cause multiple thin layers to be identified as one large layer by the radar (Mace et al., 2009). One might therefore expect that the results from this current satellite study are closer to the ones from Mace et al. (2009) and Matus and L'Ecuyer (2017). Most importantly, the present study only looks at multiple layer occurrence between cirrus and mixed-phase clouds, which is lower than the total multi-layer occurrence frequency. As a proxy for the multiple layer occurrence between cirrus and mixed-phase clouds in Mace et al. (2009), one might use the relative occurrence frequency of low with high clouds and middle with high clouds from Mace et al. (2009) (about 70 % and 10 %), relative to their overall multi-layer occurrence frequency of 24 %. Their resulting absolute high with low or mid-cloud layer occurrence frequency is then approximately 20 %. The result for two cloud cases in this study of 13 % is smaller than the value derived by Mace et al. (2009), although they used even more restrictive conditions for their classification of multiple layers, requiring almost 1 km of cloud-free space in between them. As mentioned before, the in-cloud seeder–feeder situations provide no information on the occurrence of mixed-phase layers below, hiding possible two-cloud cases. Cirrus clouds in the tropical tropopause layer and clouds close to the surface are known to be missed by the radar and lidar on CloudSat and CALIPSO (Chan and Comiso, 2011; Liu et al., 2015; Krämer et al., 2020), but these are not relevant for this study.
3.1.2 Effect of topography
A geographical difference in cloud cover could be expected from the differing impacts that weather regimes have on different European regions in general (Pasquier et al., 2019; Grams et al., 2017). The study domain contains locations with a large range of surface altitudes (see Fig. 2). One could imagine the Δzim to be smaller in the Alps than over the Swiss Plateau, simply because of a thinner troposphere over orography. Also the orographic forcing would be expected to increase cloud cover. For an analysis of topographical influence, we split the dataset by surface altitudes above or below 1 km and analyse the distribution of Δzim, shown in Table 3. The difference in the fraction of distances larger than 100 m between locations with a topography higher or lower than 1 km is less than 1 %. The distribution of total Δzim between mountainous terrain and flat land reproduces the distribution of measurements (about 30 % are taken over orography higher than 1000 m and about 70 % over terrain lower than 1000 m; not shown). Contrary to what we expected, we find no topographical effect in the distribution of Δzim (see also Fig. B1).
3.1.3 Effect of season and time of day
Table 3 also contains the results of the seasonal analysis of Δzim. Winter measurements have more multi-layer clouds according to our definition than summer measurements. The relative increase of the fractions of Δzim is similar for the smaller (Δzim<100 m) and the larger distances (Δzim>100 m). In particular, winter nights have the highest fraction of multiple layer cloud measurements. Multiple cloud layers are about 23 % more frequent in winter nights than in summer nights, mostly due to an increase in Δzim larger than 100 m. Other than the increase in Δzim during the night in winter, there are no substantial differences in frequencies between day and night within a seasonal category.
Table 3Δzim seasonality: fraction (%) of Δzim smaller than 100 m and larger than 100 m in all measurements with the specified surface height, for summer vs. winter and day vs. night (Julian days ≥ 106 and <289 are summer, hours ≥6 and <18 are days). In total, 31 % of the measurements contain both a cirrus and a mixed-phase cloud. Δzim values up to 12 km in length were evaluated.
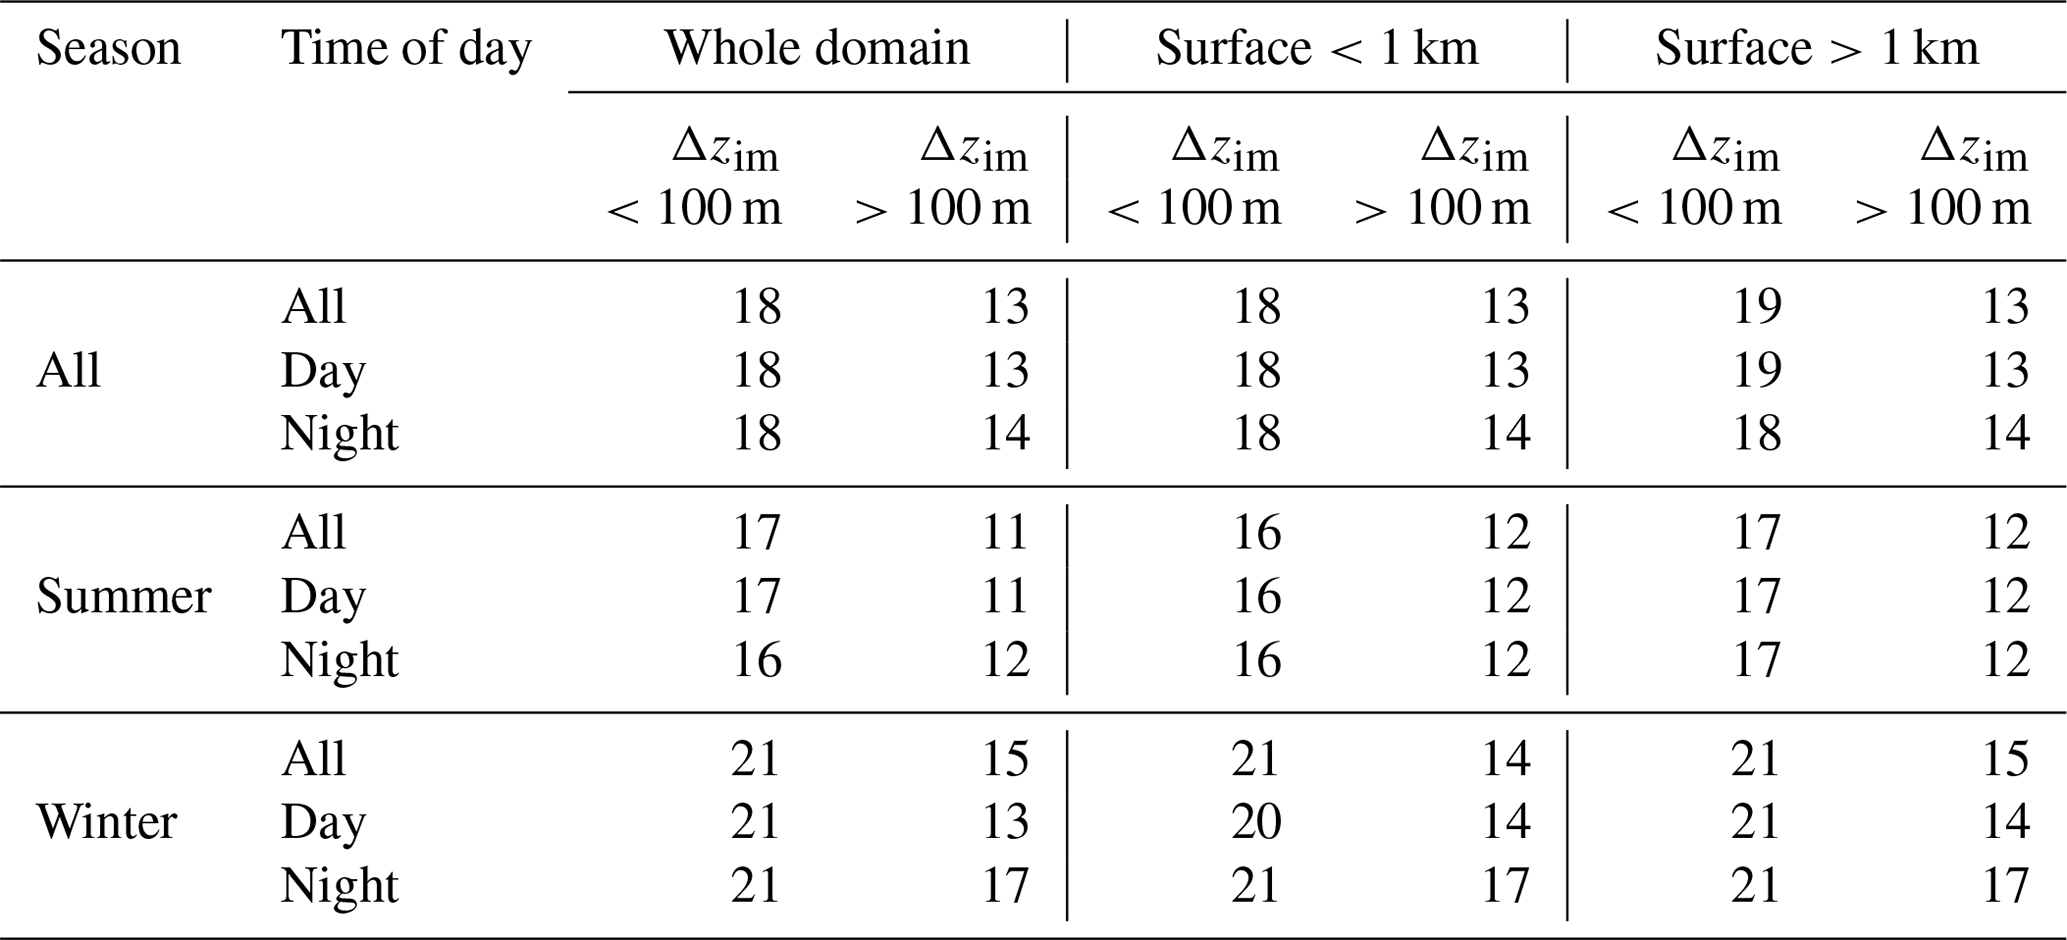
The simplest explanation for the increased frequency of multi-layer clouds in winter measurements is simply an increased cloud cover in winter. To see whether this is a robust finding, it was tested with the CALIPSO – GCM Oriented Cloud Calipso Product (GOCCP) dataset (Chepfer et al., 2010, 2013). With a comparison of frac_cov from DARDAR vs. CALIPSO cloud cover data (Fig. C1), the two datasets were found to mostly agree. Therefore, the CALIPSO dataset can be used to validate the hypothesis of an increased cloud cover in winter. Indeed, in CALIPSO, total winter cloud cover is higher over almost the whole domain (Fig. C1c). The increase of cloud cover in winter is strongest for low and high clouds (low clouds: pressure >680 hPa, height <3.2 km, high clouds: pressure <400 hPa, height >6.5 km in the CALIPSO data; not shown). This confirms the finding that in winter we see an increase in both small and large Δzim. In addition, icebase is lower in winter (not shown), in particular for Δzim<100 m, which also increases the number of Δzim.
3.1.4 Ice crystal effective radius and cirrus cloud origin
The DARDAR dataset provides the mean effective ice crystal radius, which we use in our sublimation calculations. In Fig. 4, the size distribution is displayed by the ice crystals' occurrence height, namely the lowest cirrus cloud base heights (icebase). The ice crystal size range, between 25 and 60 µm in radius, agrees with the one found in another DARDAR study by Hong and Liu (2015). It is also within the range from 1 to 100 µm that Krämer et al. (2009, 2020) find for cirrus clouds in aircraft campaigns.
There is a visible trend for smaller ice crystals at higher altitudes. This again agrees with Hong and Liu (2015) and Heymsfield et al. (2013), who find that ice crystal size decreases with decreasing temperature. An interesting feature in Fig. 4a is that while the shape of the distribution is rather symmetrical around this trend, large ice crystals abruptly stop appearing at heights larger than about 9.5 km. This hints at two modes within the size distribution. These have been found in earlier studies and have lately been linked to the different origins of cirrus clouds by Luebke et al. (2013), Luebke et al. (2016), Krämer et al. (2016), Wernli et al. (2016), Gasparini et al. (2018) and Wolf et al. (2018, 2019). Liquid origin clouds form from supercooled water droplets which are uplifted to the cirrus temperature range. They freeze either heterogeneously at warmer temperatures or predominantly homogeneously at temperatures around −35 ∘C. In the cirrus temperature range, cirrus clouds can also form by homogeneous nucleation of solution droplets or heterogeneous nucleation on ice-nucleating particles. These cirrus clouds are termed “in situ origin cirrus clouds”. The two types mostly differ in their ice water content and the ice crystal size, with both being larger for liquid origin cirrus clouds (Luebke et al., 2016).
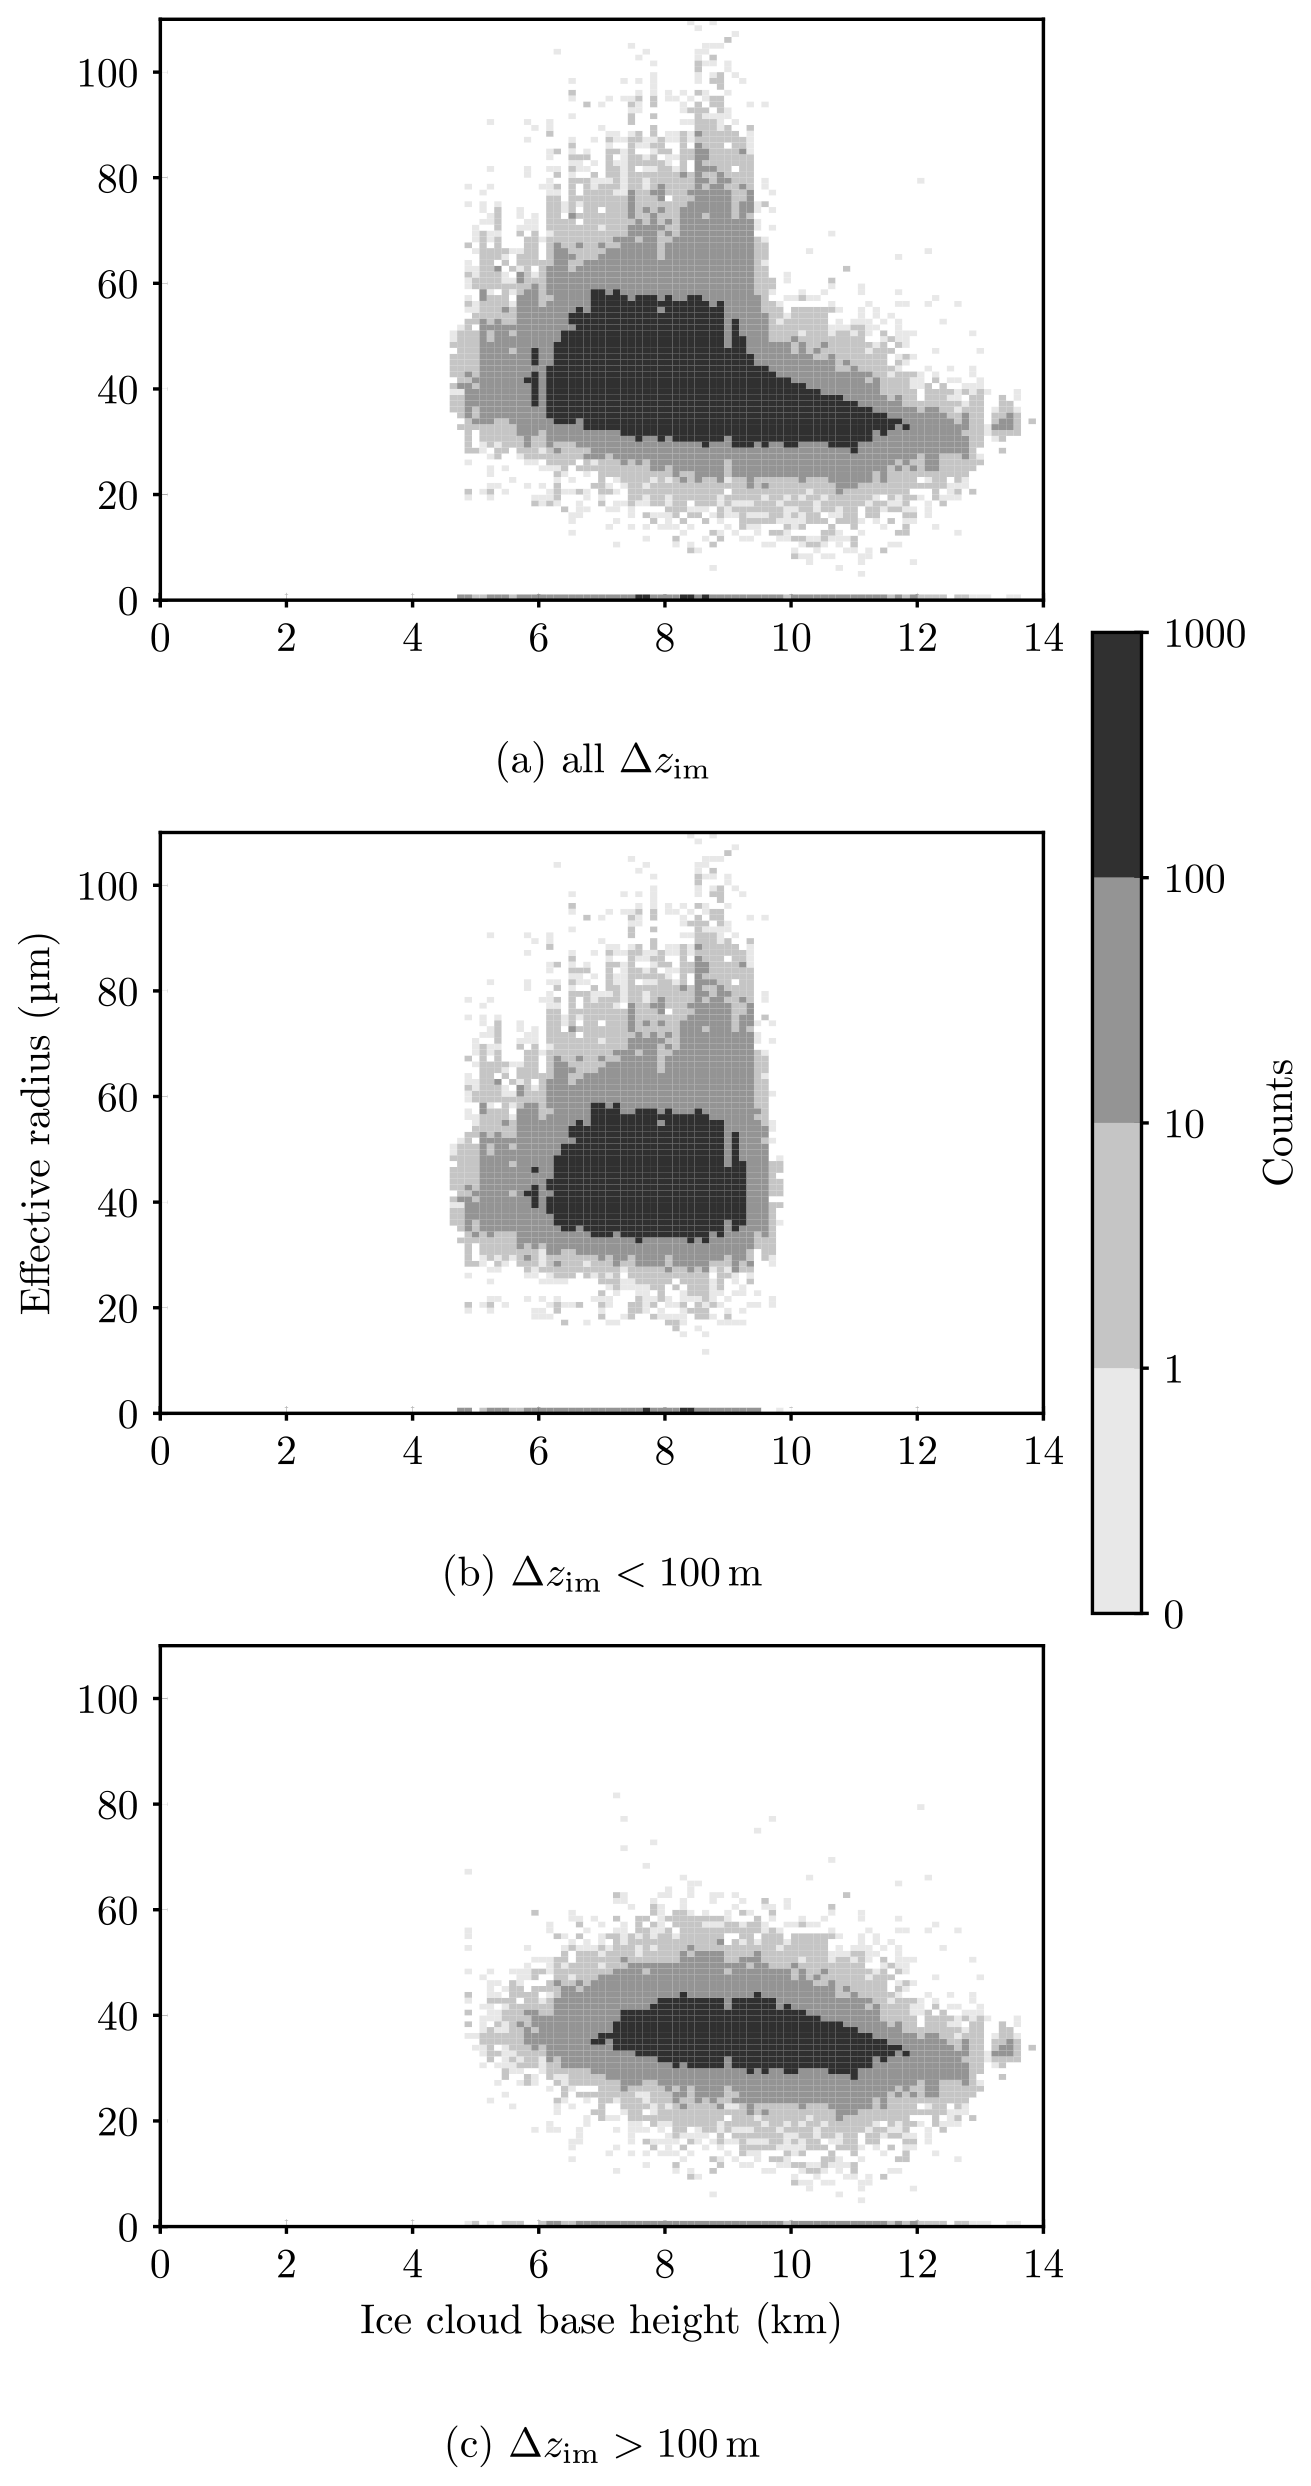
Figure 4Distribution of reff. (a) For all multi-layer clouds. (b) Only those data points with a distance <100 m to the next mixed-phase cloud top. (c) Only those data points with a distance >100 m to the next mixed-phase cloud top.
We split the dataset into one part with Δzim>100 m and one with Δzim<100 m as a proxy for the two cloud origins: in situ origin cirrus have large distances to the next underlying mixed-phase cloud, while liquid origin cirrus appear close to the −35 ∘C isotherm. This separation indeed produces two different modes, as can be seen in Fig. 4b and c. Figure 4b corresponds to liquid origin cirrus clouds. It displays larger ice crystals, from ≈35 to ≈90 µm at cirrus cloud base heights from 4500 to 9500 m, with an abrupt decrease in occurrence frequency at cirrus cloud base heights higher than 9500 m. The decrease at the maximum cirrus cloud base height is associated with Δzim<100 m (see Fig. B2). The in situ cirrus clouds in Fig. 4c display smaller crystals, from ≈30 to ≈60 µm, over a larger cirrus cloud height range, from roughly 6 to 13 km. Here, the trend of smaller ice crystals at larger cirrus cloud heights is obvious. Figure 4 confirms the distinction between liquid origin and in situ cirrus clouds as proposed, e.g. by Krämer et al. (2016). It also confirms the finding from Luebke et al. (2016) that liquid origin cirrus clouds are composed of larger ice crystals.
There are a few caveats to this result. First, by the construction of the classification algorithm, in situ cirrus clouds are sampled for the ice crystal radius at their base, while liquid origin clouds are sampled in the interior. However, this difference is expected to have the opposite effect of what we observed (larger ice crystals for liquid origin clouds). At the cloud bases, the ice crystals are expected to be larger than in their core (Miloshevich and Heymsfield, 1997; Heymsfield and Iaquinta, 2000), simply because of larger particles sedimenting further down within a cloud. Secondly, the classification scheme only has liquid origin clouds in the Δzim<100 m part, while liquid origin clouds that have been uplifted entirely to heights above the −35 ∘C isotherm are present in the second, in situ origin cirrus part of the dataset (Δzim>100 m), if such a lifting occurs. This erroneous classification has already been noted by Gasparini et al. (2018). However, Fig. 4c displays only one mode, missing any signal of the mode present in the Δzim<100 m part of the dataset (see Fig. 4b). This suggests that the influence of the liquid origin on the microphysical properties of the cirrus clouds is lost once the clouds are lifted, for example, because the large ice crystals sediment out, or that lifting of entire clouds above the −35 ∘C isotherm hardly ever occurs. Wernli et al. (2016), who investigated the frequency of the formation pathways in a trajectory-based analysis, noted that ice crystal sedimentation and cloud turbulence could “potentially alter the local cirrus characteristics and “confuse” the simple categorization”. However, the distinctively different ice crystal size distributions for the two modes in Fig. 4b and c suggest that liquid origin clouds are not altered by sedimentation so much that they are confused for in situ clouds. Instead, the data suggest that liquid origin clouds are hardly ever lifted entirely above the −35 ∘C isotherm, which is likely because of their large vertical extent.
In a broader context, the results in Fig. 4 show that satellite data, in particular the DARDAR dataset, are valid means to explore the classification of cirrus clouds into liquid and in situ origin further, as it has been called for by Wolf et al. (2019).
Note that the ice crystal radii, the cirrus cloud base heights and the Δzim values span a wide range of values (see Figs. 3 and 4). Therefore, sublimation calculations needed to be applied to each instance individually, as detailed in the next section.
3.2 Sublimation between cloud layers
As described in Sect. 2.2, the sublimation calculation was applied to each grid point within the DARDAR data that had a cirrus cloud present above a mixed-phase cloud layer, using DARDAR and ERA5 data as input. The sublimation height of the ice crystals was calculated three times, assuming spherical ice crystals, plates and bullet rosettes. If the sublimation height was lower than the mixed-phase cloud top, the case was marked as a seeder–feeder situation.

Figure 5Environmental conditions at cirrus cloud base. Absolute frequency of temperature as a function of relative humidity with respect to ice at cirrus cloud bases with Δzim>100 m and (a) where spherical ice crystals survive the sedimentation and seed the lower cloud, (b) where spherical ice crystals sublimate before reaching the mixed-phase cloud. The light blue line depicts saturation with respect to water. Absolute frequency of effective ice crystal radius at cirrus cloud base as a function of cirrus cloud height with Δzim>100 m and (c) where spherical ice crystals survive the sedimentation and seed the lower cloud, (d) where spherical ice crystals sublimate before reaching the mixed-phase cloud. The sum of panels (c) and (d) is displayed in Fig. 4c. For improved readability, the colour-bar label for bin 1 is not shown.
3.2.1 Variation of survival with environmental parameters
For the evaluation of the survival chance, only cases with Δzim>100 m were taken into account. Distances smaller than 100 m represent the in-cloud seeder–feeder mechanism, where ice crystals fall through saturated or supersaturated cloudy air only before interacting with other hydrometeors. Comparing Fig. 5a and b, one can see the effect of temperature and relative humidity: ice crystals only reach the lower cloud if RHi>90 %. Only those starting at temperatures warmer than −65 ∘C seed. At lower temperatures, the ice crystals sublimate, even if the air was supersaturated at the start of the sedimentation. Note that due to data storage constraints, we can only show the impact of the temperature and relative humidity at the starting cirrus cloud base height on the falling ice crystals. But height-resolved ERA5 data of temperature and relative humidity were used for the calculations. These starting values can be seen as proxies for the values during sedimentation, but for large sedimentation distances of up to about 5 km, the starting values are not representative. Vassel et al. (2019) conducted a sensitivity study with relative humidities varying by ±5 %, but this variation is rather small. In this, their resulting seeding fraction does not change substantially. However, the relative humidity variations over the distances travelled by ice crystals in our calculations can exceed 5 % substantially.
Figure 5c shows that ice crystals do not survive the fall from cirrus cloud base heights above 11 km. We attribute this to smaller ice crystals at these colder temperatures and to the fact that high cirrus cloud bases correspond to large distances to lower-lying mixed-phase clouds that ice crystals are less likely to survive. This also explains why ice crystals starting their sedimentation at colder temperatures sublimate more often before reaching a lower cloud than those sedimenting from warmer cloud bases, as the temperature limit of −65 ∘C corresponds to the height limit of 11 km (see Fig. 5). Both Hall and Pruppacher (1976) and Vassel et al. (2019) identified the ice crystal size as important determinant for ice crystal survival. Here, we find that ice crystals with radii smaller than 30 µm usually do not survive the sedimentation. On the other hand, also larger ice crystal sizes, above 50 µm, do not guarantee a successful seeding. Note that we only evaluate the mean ice crystal size is used in this study so that the large spread which occurs in ice crystal size distributions is not represented.
For the analysis of both environmental parameters and DARDAR variables on ice crystal survival, the results assuming ice crystals to be plates and bullet rosettes are similar to those presented in here. One marked difference is that crystals starting in a subsaturated environment with respect to ice sublimate and do not seed when assuming them to be plates or bullet rosettes (see Fig. B3).
A comparison to literature data is difficult because the assumptions vary greatly between studies. Hall and Pruppacher (1976) compute sublimation heights for ice particles with an initial radius of 160 µm, at fixed relative humidities with respect to ice between 30 % and 90 %. Their spherical ice particles sublimated at distances of 1 to 4 km from the starting altitude of about 9 km. The relative humidities that we find at the starting altitudes are similar to their range, as are our survival distances. Vassel et al. (2019) did not provide information on the distances between the cloud layers they studied. Preliminary work by Vassel (2018) contained the result of two exemplary sublimation calculations assuming constant temperature and relative humidity in the subsaturated layer. The result is in line with the results presented in Fig. 6, where about 42 %, 47 % or 64 % of cases with Δzim=500 m lead to successful seeding (for rosettes, plates and spheres, respectively).
3.2.2 Influence of the ice crystal shape
The fraction of Δzim with successful seeding is shown in Fig. 6 for plates, spherical ice crystals and bullet rosettes. For Δzim>5 km, there is a only a slight chance for ice crystals to survive the fall between the cirrus and the underlying mixed-phase cloud. For Δzim=2 km the survival rate of spherical ice crystals increases to 20 %. Survival chances increase linearly, until 81 % of the spherical ice crystals cause seeding at a falling distance of 200 m. Plate-like ice crystals experience a larger drag force and therefore fall slower than spheres. As they have more time to sublimate during their slower fall, they are less likely to survive at any of the distances. This was also found by Hall and Pruppacher (1976) and is even more pronounced for bullet rosettes. Combining this with the respective Δzim frequencies, Fig. 6 also displays the fraction of successful seedings in our measurements. In 14 % of the measurements, we see a seeder–feeder situation where plate-like ice crystals do not sublimate but can seed the lower-lying cloud after sedimentation (11 % for rosettes and 19 % for spheres).
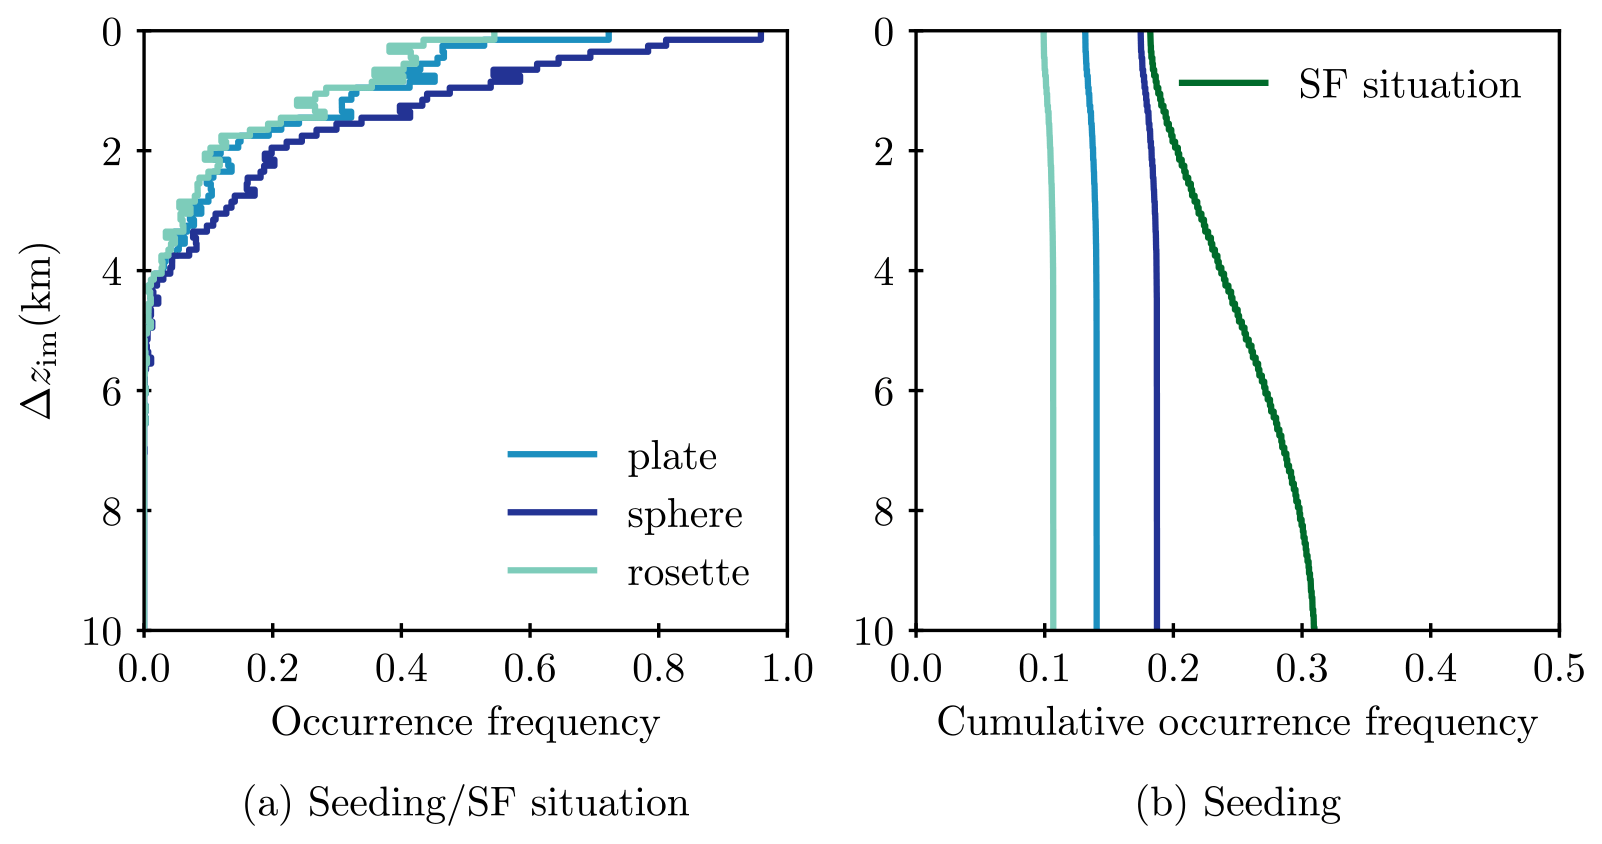
Figure 6(a) Seeding cases per seeder–feeder situation. (b) Cumulative occurrence frequency of possible seeder–feeder situations (SF situation, green) and successful seeding assuming plate-like spherical and bullet rosette ice crystals. Note that Δzim=0 m is at the base of the lowest cirrus cloud layer with ∘C.
A surprising result for all ice crystal shapes is that the survival fraction for Δzim<100 m is smaller than 1. As explained before, there is no subsaturated layer in this continuous cloud, so the sedimenting ice crystals should not sublimate at all. The reason for the discrepancy most likely lies in the usage of two independent datasets in the classification of cloud layers and the calculation of ice crystal survival: the distance between the two layers and the cloud heights are taken from the DARDAR dataset, while the relative humidity was taken from ERA5. For example, the temperature profile in ERA5 over Switzerland is about 5 ∘C colder than the one in the DARDAR data, which also originates from ECMWF. A reason for this discrepancy could not be found, and it is not thought to change our findings significantly, but the discrepancy between the datasets should be investigated further. One might correct for this by simply setting the survival fraction to 1 within the Δzim<100 m bin, i.e. within the cloud. However, we chose to leave the inconsistency as an estimate of the uncertainty associated with the seeding fractions given for larger distances.
In general, as stated before, the ice crystal radius and hence the survival fraction shown in Fig. 6 are conservative estimates. In particular, with the new DARDAR dataset (v3) (Cazenave et al., 2019), survival fractions are expected to be higher than shown here for DARDAR v2, since the effective ice crystal radii are larger in the former (see Sect. 2). In their sublimation calculations, Vassel et al. (2019) use larger ice crystal radii of 100 µm for cirrus clouds as well. Additionally, there is the possibility of seeding by pre-activated particles even after the macroscopic ice crystal has sublimated, as described in Marcolli (2017). Some ice in pores or shielded pockets of these particles could survive the subsaturated air in between cloud layers and initiate new ice crystal formation once the particle reaches the supersaturated air in the lower cloud layer.
With the results presented here, one can comment on the method used in Seifert et al. (2009) to filter out ice clouds that were seeded. They simply reclassified any cloud with an ice cloud less than 2 km above as a liquid cloud. Given that Fig. 6 shows that only 10 % to 20 % of ice crystals survive Δzim=2 km, it is likely that Seifert et al. (2009) find too many seeded clouds. Finally, comparing to observations, the case of a survival of Δzim=5 km, as the one case evaluated in Braham (1967), is rather unlikely according to our data.
This study uses satellite data and sublimation calculations to establish the occurrence frequency of seeder–feeder cases over Switzerland. The seeder–feeder mechanism here refers to ice crystals that fall from a cirrus cloud into a lower cloud, where they initiate the glaciation of clouds.
In the DARDAR data, we distinguish between two situations: in 13 % of all (including clear-sky) measurement cases, distances between the two cloud types are distributed uniformly between 100 m and 10 km. This is the classical external seeder–feeder situation, where the seeding ice crystals fall through clear air between two clouds. In-cloud seeder–feeder situations are found to occur in 18 % of all measurements. In total, seeder–feeder cloud situations were found to occur in 31 % of all measurements. As the estimate only includes cases with a cirrus cloud as the seeder cloud, it underestimates the total seeder–feeder cloud situation occurrence frequency. The frequency was found to not vary with the differing topography in Switzerland. Seasonally, winter nights exhibit the highest frequency of possible seeder–feeder situations due to an increased high cloud cover in winter and at night.
We find two modes for the ice crystals size at the base of cirrus clouds. These correspond to in situ and liquid origin cirrus clouds, which confirms the new classification scheme for cirrus clouds (Luebke et al., 2013, 2016; Krämer et al., 2016; Wernli et al., 2016; Gasparini et al., 2018; Wolf et al., 2018, 2019).
In sublimation calculations, we found that a significant number of ice crystals reached the lower cloud layers. In total, 20 % of ice crystals survived distances of 2 km when assuming that they were spherically shaped. Assuming plate-like crystals or bullet rosettes in the calculations, only about 10 % of them survived 2 km distances. On the one hand, this clearly shows that natural cloud seeding occurs regularly over Switzerland. On the other hand, it demonstrates that in these calculations, the distinction between ice crystal shapes is critical, in contrast to the small ice crystal shape impact found in Vassel et al. (2019).
We found that ice crystals only survive the fall between cloud layers when the relative humidity with respect to ice at cirrus cloud base is larger than 90 %, while temperature seems to be of secondary importance. In terms of the ice crystal radius, ice crystals with effective radii smaller than 30 µm mostly sublimate before reaching the lower cloud layer. On the other hand, larger ice crystal sizes, above 50 µm, do not guarantee a survival.
Taking a broader perspective, this study demonstrates that satellite data are a viable means to explore cloud distributions also in regional settings. It can be combined with time-stepping calculations to study processes on which the satellite data, which are merely a snapshot in time, provide no information on their own.
Of course the scope of this work could be broadened in the future. This study focuses on natural cloud seeding that originates from cirrus clouds, but seeding ice crystals can also sediment from mixed-phase clouds. Additionally, multi-layer clouds interact in other ways, for example, via radiation (Christensen et al., 2013; Vassel, 2018). Moreover, seeing that natural cloud seeding occurs over Switzerland, the global distributions of seeder–feeder cloud situations and the seeding frequency are an interesting next goal of study. Differences in the global distribution of multi-layer clouds have already been demonstrated (Mace et al., 2009), and Ansmann et al. (2009) observed an increase in in-cloud seeding frequency in their data from the tropics compared to data from the midlatitudes (Seifert et al., 2009), so a thorough study of global natural cloud seeding frequency promises to be interesting. The satellite data analysis within this study can easily be extended to a global dataset. Solely, the sublimation calculations could not be applied to each measurement point in such a large dataset, but instead the seeding situations could be classified and sublimation calculations could be applied to the classes in a representative fashion. Future work could sample the whole range in ice crystal size distributions instead of only using the mean size to represent the distribution, as done in this study.
We show that natural cloud seeding is a widespread phenomena over Switzerland. This hints at a large potential for natural cloud seeding to alter cloud properties and thereby influence Earth's radiative budget and water cycle, which should be investigated in future studies.
Here, we detail the equations used in the sublimation calculations. Additional variables and constants used are given in Tables A1 and A2. Where they differ, equations and constants used for the computations for hexagonal plates are given in Tables A3 and A4.
At each time step i+1, the barometric formula was applied to find the pressure corresponding to the height of the ice particle:
The density of the air surrounding the particle was calculated using the ideal gas law. The saturation vapour pressure of water with respect to ice and water was derived with the Magnus formula. And together with the relative humidity from the ERA5 data (given with respect to water), the supersaturation with respect to ice was calculated. The diffusivity of water vapour in air was calculated following Hall and Pruppacher (1976, Eq. 13):
From this, the growth factor was determined following Lamb and Verlinde (2011, p. 328):
Table A1Variables used in the sublimation height calculation (addition to Table 1).

which uses the latent heat of sublimation (valid between 236 and 273.16 K; Lohmann et al., 2016):
and the ventilation factor is given by (Pruppacher and Klett, 2010, Eq. 13.61):
where
(Lohmann et al., 2016, Eq. 7.36). Where the Reynolds number exceeded the scope of the parameterization, the value for the ventilation factor from the last time step was used. For the terminal velocity, U∞, v was used. The dynamic viscosity μ can be derived from Sutherland's formula (Chapman and Cowling, 1960, Eq. 12.32.2), which can be rewritten and expanded to
with .
(Seinfeld and Pandis, 2006, Table A.7, p. 1178)(Chapman and Cowling, 1960, Table 15)Table A2Constants used in the sublimation calculations for a sphere (addition to Table 2). Note that the parameterization for the velocity–mass relation for cloud droplets from Seifert and Beheng (2006) is used for spherical ice crystals here. Where the constants are different for a hexagonal plate, they are given in Table A4.
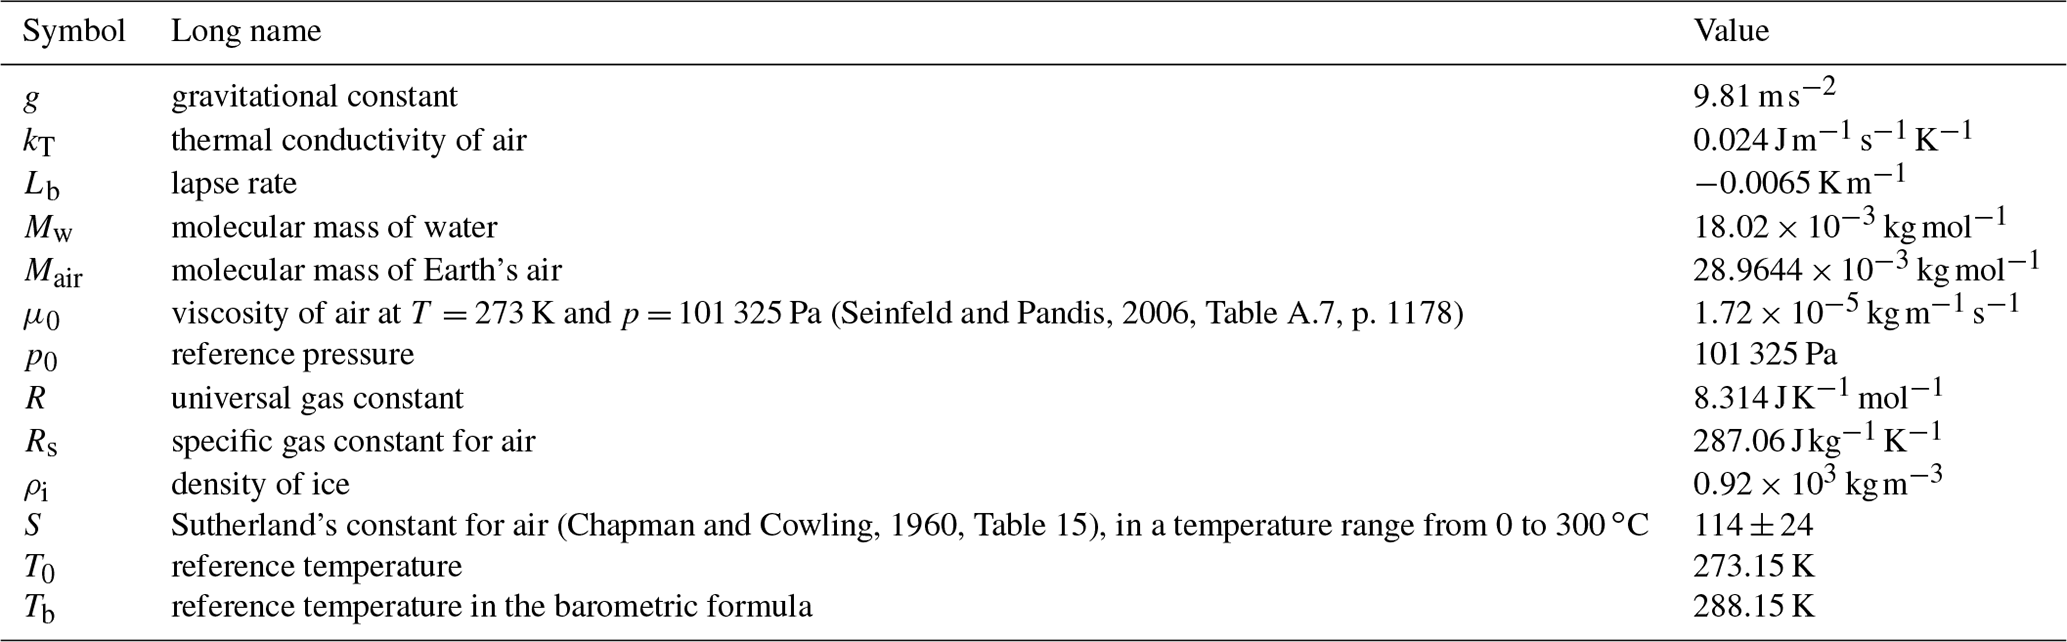
Table A3Equations used in the sublimation calculations for a hexagonal plate. The other equations used are the same as for a sphere and are given in the text.
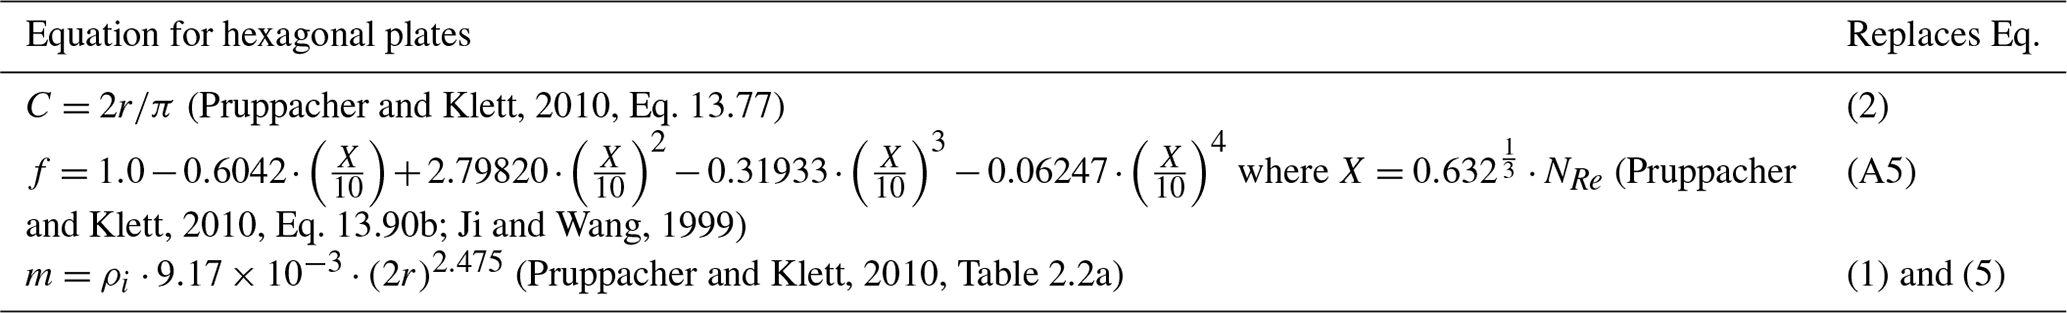
Table A4Same as Table 2 but for hexagonal plates. Only those constants that differ from Table 2 are shown.
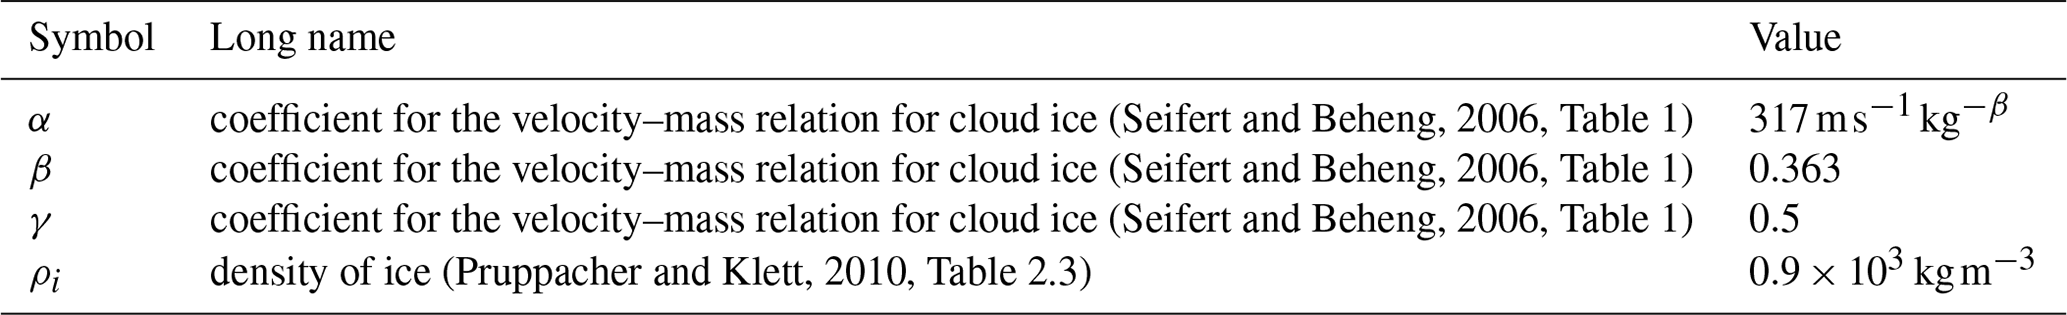
Table A5Equations used in the sublimation calculations for bullet rosettes. The other equations used are the same as for a sphere and are given in the text.
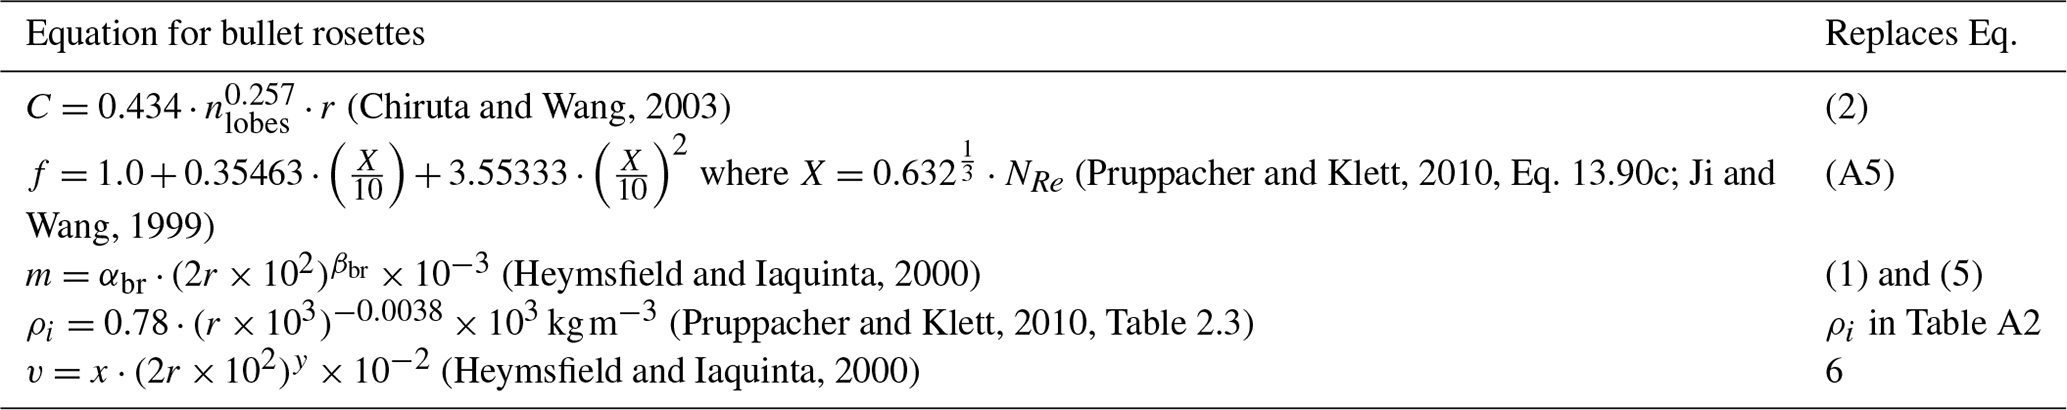
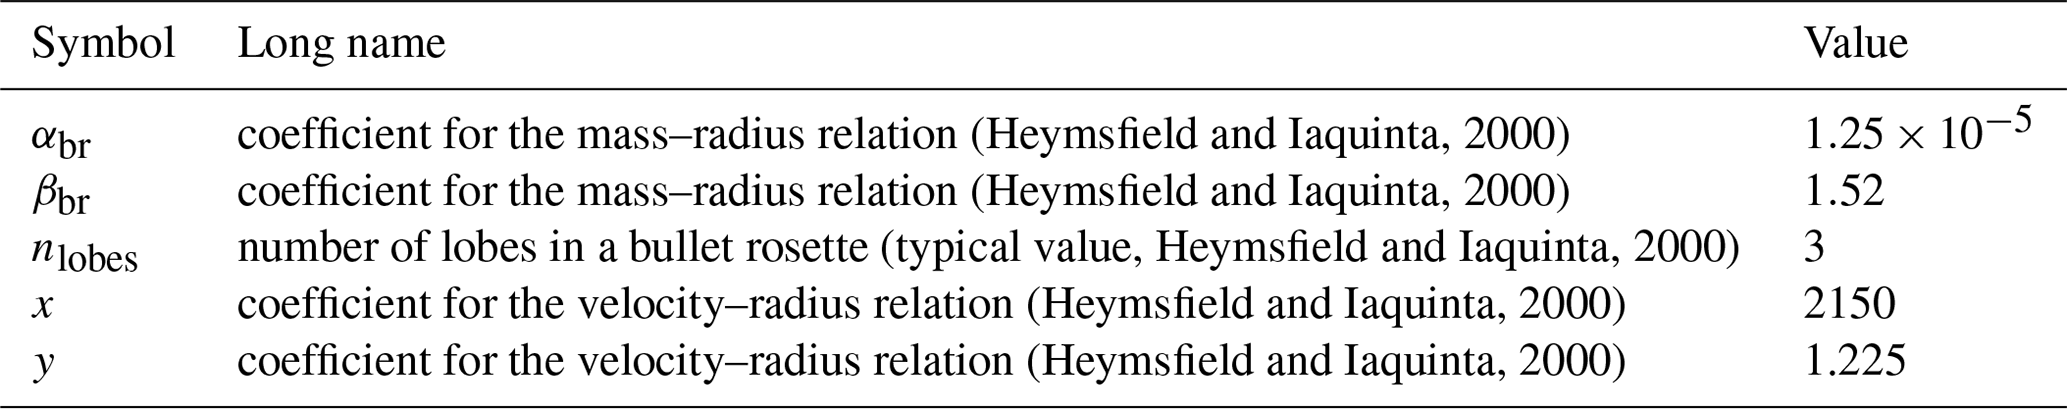
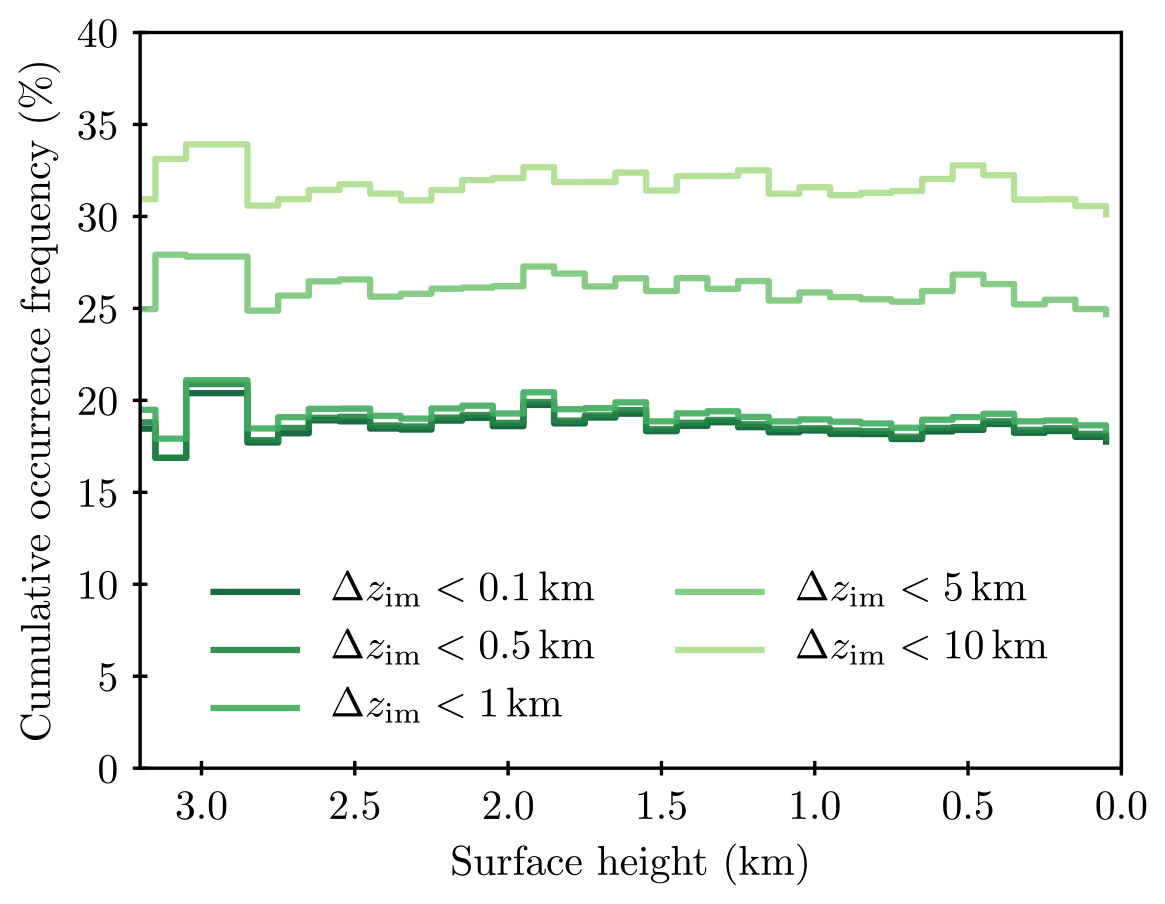
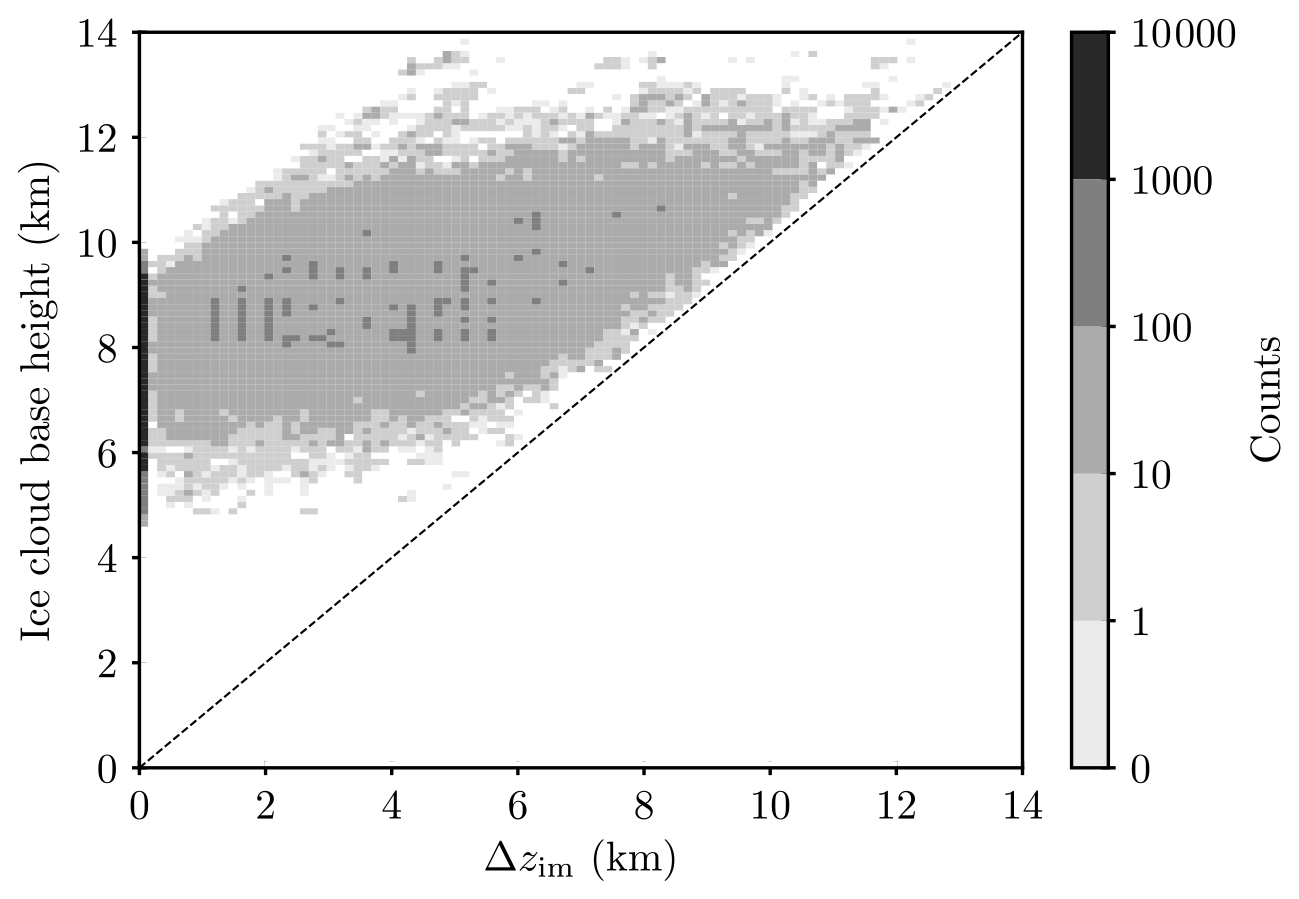
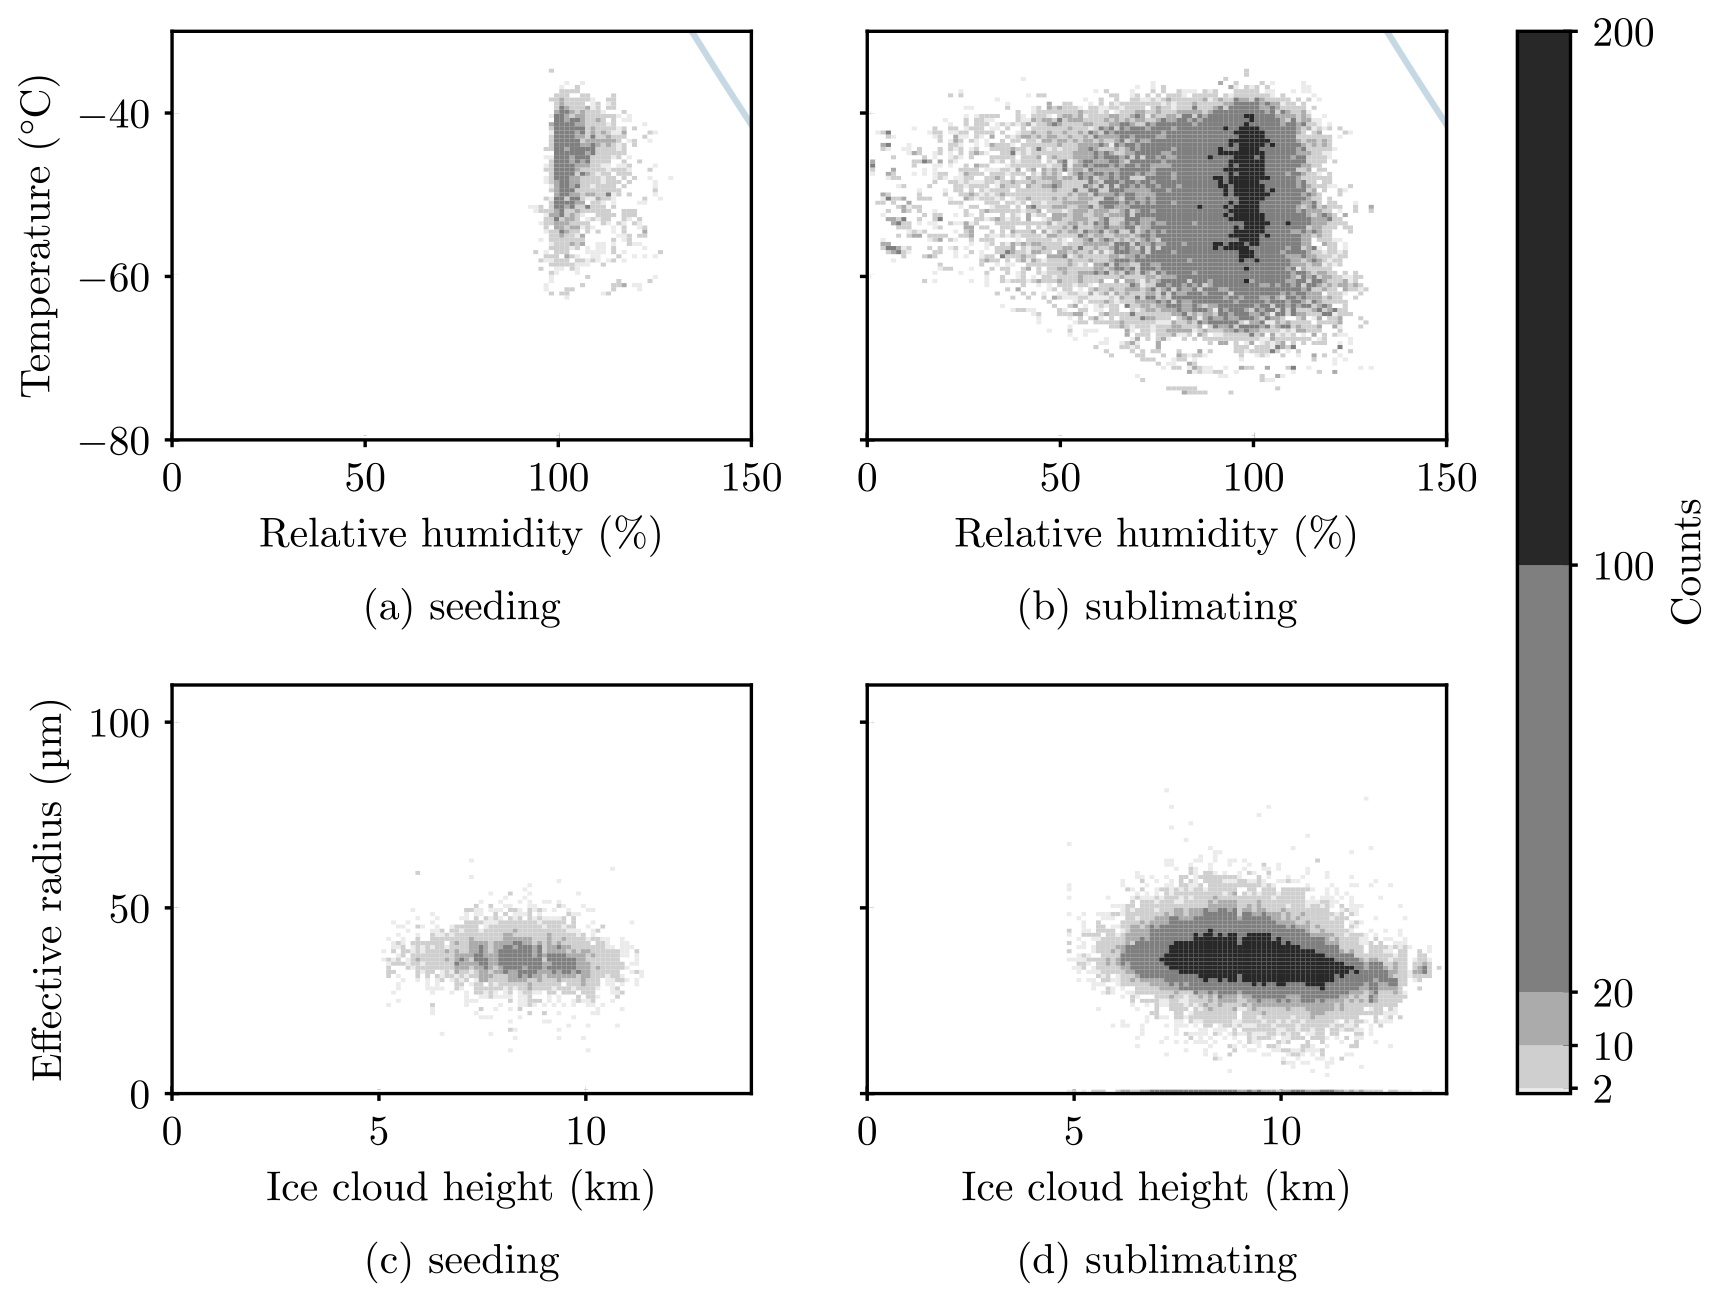
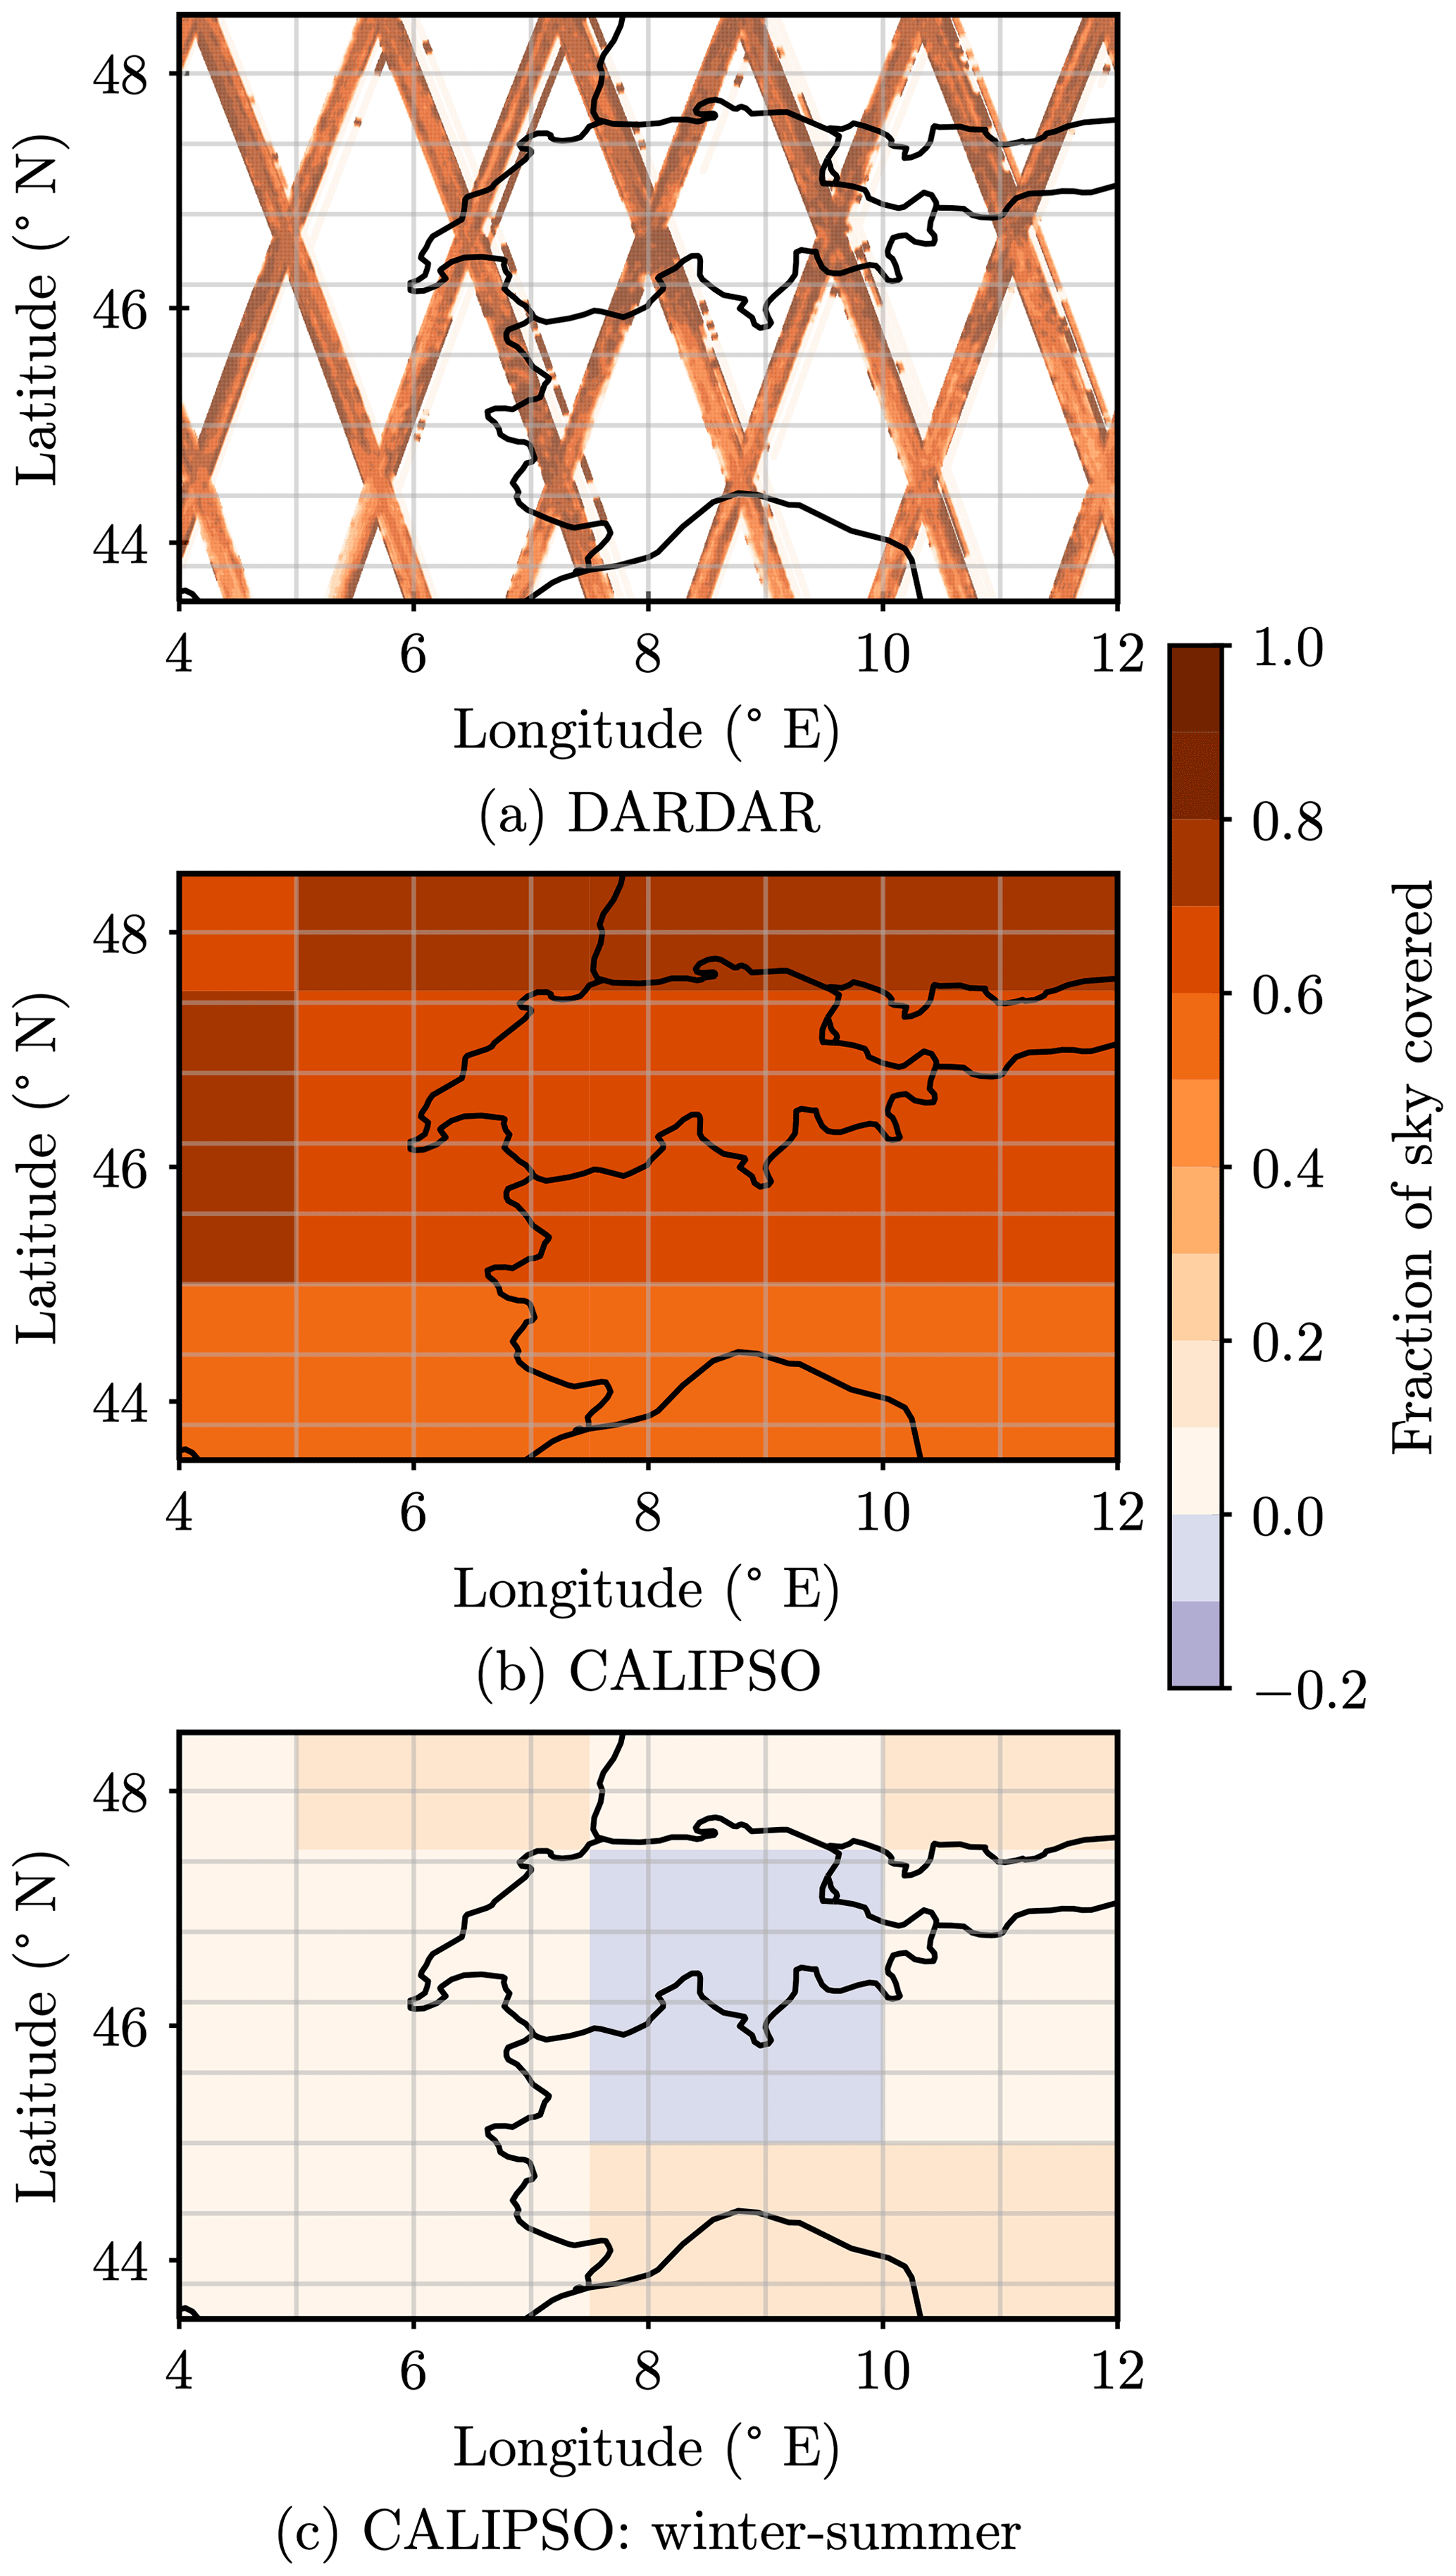
Figure C1Comparison between (a) cloud cover derived from the DARDAR satellite product in this study and (b) CALIPSO-GOCCP total fraction of sky covered (2006–2017) (Chepfer et al., 2010, 2013). For the DARDAR data, the cloud cover was calculated as the mean (over all tracks within 2006–2017) of the sum of all fractions of sky covered (sum of frac_cov at all temperatures) at each grid point. Sums that were larger than 1 were set to be 1. This method corresponds to the assumption of minimal overlap. (c) CALIPSO-GOCCP seasonal difference in total cloud cover. To allow for a visual comparison, DARDAR cloud cover data were filtered with a mean over 10×10 squares.
Analysis and plotting scripts are archived at https://doi.org/10.5281/zenodo.3987754 (Proske et al., 2021). Generated data are archived at https://doi.org/10.5281/zenodo.3987757 (Proske et al., 2020). DARDAR-CLOUD data can be obtained from the AERIS/ICARE Data and Services Center; ftp://ftp.icare.univ-lille1.fr/SPACEBORNE/MULTI_SENSOR/DARDAR_CLOUD/ (last access: 5 October 2020, login required). ERA5 data (fifth generation of ECMWF atmospheric reanalyses of the global climate) was obtained from the Copernicus Climate Change Service Climate Data Store (CDS, 2017, https://cds.climate.copernicus.eu/#!/home) on 7 November 2019.
UP conducted the data analysis and sublimation calculations, analysed the results and was the main author of the paper. VB developed the initial version of the data analysis and sublimation code. DN conceived the idea of the study. ZD, UL and DN contributed to the design of the study and the analysis of the results. All authors contributed to the writing of the study.
The authors declare that they have no conflict of interest.
We are grateful for insightful comments from three anonymous reviewers, which helped to clarify parts of the manuscript. We thank Maiken Vassel for her advice during the development of the sublimation calculations. We thank the AERIS/ICARE Data and Services Center for providing access to the data used in this study. Sublimation calculations were generated using Copernicus Climate Change Service Information. Throughout this study, the programming languages CDO (Schulzweida, 2018) and Python (Python Software Foundation, http://www.python.org, last access: 29 March 2021) were used to handle data and analyse them. The satellite data analysis and the sublimation calculations were conducted with Python as well.
This research has been supported by the European Commission, H2020 Research Infrastructures (FORCeS (grant no. 821205)).
This paper was edited by Pedro Jimenez-Guerrero and reviewed by three anonymous referees.
Ansmann, A., Tesche, M., Althausen, D., Müller, D., Seifert, P., Freudenthaler, V., Heese, B., Wiegner, M., Pisani, G., Knippertz, P., and Dubovik, O.: Influence of Saharan Dust on Cloud Glaciation in Southern Morocco during the Saharan Mineral Dust Experiment, J. Geophys. Res., 113, D04210, https://doi.org/10.1029/2007JD008785, 2008. a
Ansmann, A., Tesche, M., Seifert, P., Althausen, D., Engelmann, R., Fruntke, J., Wandinger, U., Mattis, I., and Müller, D.: Evolution of the Ice Phase in Tropical Altocumulus: SAMUM Lidar Observations over Cape Verde, J. Geophys. Res., 114, D17208, https://doi.org/10.1029/2008JD011659, 2009. a, b, c
Bergeron, T.: On the physics of cloud and precipitation: Mémoire présenté a L'association de Météorologie de L'U.G.G.I., Lisbonne, September 1933, Paris, France, Imprimerie Paul Dupont, 1935. a
Boucher, O., Randall, D., Artaxo, P., Bretherton, C., Feingold, G., Forster, P., Kerminen, V.-M., Kondo, Y., Liao, H., Lohmann, U., Rasch, P., Satheesh, S. K., Sherwood, S., Stevens, B., and Zhang, X. Y.: Clouds and Aerosols, in: Climate Change 2013: The Physical Science Basis. Contribution of Working Group I to the Fifth Assessment Report of the Intergovernmental Panel on Climate Change, Cambridge University Press, Cambridge, United Kingdom and New York, NY, USA, 2013. a
Braham, R. R.: Cirrus Cloud Seeding as a Trigger for Storm Development, J. Atmos. Sci., 24, 311–312, 1967. a, b, c
Carruthers, D. J. and Choularton, T. W.: A Model of the Feeder-Seeder Mechanism of Orographic Rain Including Stratification and Wind-Drift Effects, Q. J. Roy. Meteor. Soc., 109, 575–588, https://doi.org/10.1002/qj.49710946109, 1983. a
Cazenave, Q., Ceccaldi, M., Delanoë, J., Pelon, J., Groß, S., and Heymsfield, A.: Evolution of DARDAR-CLOUD ice cloud retrievals: new parameters and impacts on the retrieved microphysical properties, Atmos. Meas. Tech., 12, 2819–2835, https://doi.org/10.5194/amt-12-2819-2019, 2019. a, b
CDS (Copernicus Climate Change Service) (2017): ERA5: fifth generation of ECMWF atmospheric reanalyses of the global climate, Copernicus Climate Change Service Climate Data Store (CDS), available at: https://cds.climate.copernicus.eu/#!/home (last access: 7 November 2019), 2017. a
Ceccaldi, M., Delanoë, J., Hogan, R. J., Pounder, N. L., Protat, A., and Pelon, J.: From CloudSat-CALIPSO to EarthCare: Evolution of the DARDAR Cloud Classification and Its Comparison to Airborne Radar-Lidar Observations, J. Geophys. Res.-Atmos., 118, 7962–7981, https://doi.org/10.1002/jgrd.50579, 2013. a, b, c
Cess, R. D., Potter, G. L., Blanchet, J. P., Boer, G. J., Del Genio, A. D., Déqué, M., Dymnikov, V., Galin, V., Gates, W. L., Ghan, S. J., Kiehl, J. T., Lacis, A. A., Le Treut, H., Li, Z.-X., Liang, X.-Z., McAvaney, B. J., Meleshko, V. P., Mitchell, J. F. B., Morcrette, J.-J., Randall, D. A., Rikus, L., Roeckner, E., Royer, J. F., Schlese, U., Sheinin, D. A., Slingo, A., Sokolov, A. P., Taylor, K. E., Washington, W. M., Wetherald, R. T., Yagai, I., and Zhang, M.-H.: Intercomparison and Interpretation of Climate Feedback Processes in 19 Atmospheric General Circulation Models, J. Geophys. Res., 95, 16601–16615, https://doi.org/10.1029/JD095iD10p16601, 1990. a
Chan, M. A. and Comiso, J. C.: Cloud Features Detected by MODIS but Not by CloudSat and CALIOP: CLOUDS UNDETECTED BY CLOUDSAT AND CALIOP, Geophys. Res. Lett., 38, L24813, https://doi.org/10.1029/2011GL050063, 2011. a
Chapman, S. and Cowling, T. G.: The Mathematical Theory of Non-Uniform Gases: An Account of the Kinetic Theory of Viscosity, Thermal Conduction, and Diffusion in Gases, 2nd Edn., reprinted, University Press, Cambridge, 1960. a, b
Chen, Y.-S., Harrington, J. Y., Verlinde, J., Zhang, F., and Oue, M.: Dynamical Response of an Arctic Mixed-Phase Cloud to Ice Precipitation and Downwelling Longwave Radiation From an Upper-Level Cloud, J. Geophys. Res.-Atmos., 125, e2019JD031089, https://doi.org/10.1029/2019JD031089, 2020. a
Chepfer, H., Bony, S., Winker, D., Cesana, G., Dufresne, J. L., Minnis, P., Stubenrauch, C. J., and Zeng, S.: The GCM-Oriented CALIPSO Cloud Product (CALIPSO-GOCCP), J. Geophys. Res., 115, D00H16, https://doi.org/10.1029/2009JD012251, 2010. a, b
Chepfer, H., Cesana, G., Winker, D., Getzewich, B., Vaughan, M., and Liu, Z.: Comparison of Two Different Cloud Climatologies Derived from CALIOP-Attenuated Backscattered Measurements (Level 1): The CALIPSO-ST and the CALIPSO-GOCCP, J. Atmos. Ocean. Tech., 30, 725–744, https://doi.org/10.1175/JTECH-D-12-00057.1, 2013. a, b
Chiruta, M. and Wang, P. K.: The Capacitance of Rosette Ice Crystals, J. Atmos. Sci., 60, 836–846, 2003. a
Choularton, T. W. and Perry, S. J.: A Model of the Orographic Enhancement of Snowfall by the Seeder-Feeder Mechanism, Q. J. Roy. Meteor. Soc., 112, 335–345, https://doi.org/10.1002/qj.49711247204, 1986. a
Christensen, M. W., Carrió, G. G., Stephens, G. L., and Cotton, W. R.: Radiative Impacts of Free-Tropospheric Clouds on the Properties of Marine Stratocumulus, J. Atmos. Sci., 70, 3102–3118, https://doi.org/10.1175/JAS-D-12-0287.1, 2013. a
CloudSat radar status: CloudSat Radar Status, available at: https://cloudsat.atmos.colostate.edu/news/CloudSat_status, last access: 18 August 2020. a
Creamean, J. M., Suski, K. J., Rosenfeld, D., Cazorla, A., DeMott, P. J., Sullivan, R. C., White, A. B., Ralph, F. M., Minnis, P., Comstock, J. M., Tomlinson, J. M., and Prather, K. A.: Dust and Biological Aerosols from the Sahara and Asia Influence Precipitation in the Western U.S., Science, 339, 1572–1578, https://doi.org/10.1126/science.1227279, 2013. a
Das, S. K., Golhait, R., and Uma, K.: Clouds Vertical Properties over the Northern Hemisphere Monsoon Regions from CloudSat-CALIPSO Measurements, Atmos. Res., 183, 73–83, https://doi.org/10.1016/j.atmosres.2016.08.011, 2017. a
Delanoë, J. and Hogan, R.: DARDAR-CLOUD Documentation, ICARE Data and Services Center, Villeneuve d'Ascq, France, 2010a. a
Delanoë, J. and Hogan, R. J.: A Variational Scheme for Retrieving Ice Cloud Properties from Combined Radar, Lidar, and Infrared Radiometer, J. Geophys. Res., 113, D07204, https://doi.org/10.1029/2007JD009000, 2008. a
Delanoë, J. and Hogan, R. J.: Combined CloudSat-CALIPSO-MODIS Retrievals of the Properties of Ice Clouds, J. Geophys. Res., 115, D00H29, https://doi.org/10.1029/2009JD012346, 2010b. a, b
Dennis, A. S.: Initiation of Showers by Snow, J. Meteorol., 11, 157–162, 1954. a
Dore, A., Sobik, M., and Migala, K.: Patterns of Precipitation and Pollutant Deposition in the Western Sudete Mountains, Poland, Atmos. Environ., 33, 3301–3312, https://doi.org/10.1016/S1352-2310(98)00294-5, 1999. a
Fernández-González, S., Valero, F., Sánchez, J. L., Gascón, E., López, L., García-Ortega, E., and Merino, A.: Analysis of a Seeder-Feeder and Freezing Drizzle Event, J. Geophys. Res.-Atmos., 120, 3984–3999, https://doi.org/10.1002/2014JD022916, 2015. a
Findeisen, W.: Kolloid-Meteorologische Vorgänge Bei Neiderschlagsbildung, Meteorol. Z., 55, 121–133, 1938. a
Fleishauer, R. P., Larson, V. E., and Vonder Haar, T. H.: Observed Microphysical Structure of Midlevel, Mixed-Phase Clouds, J. Atmos. Sci., 59, 1779–1804, https://doi.org/10.1175/1520-0469(2002)059<1779:OMSOMM>2.0.CO;2, 2002. a
Gao, W., Sui, C.-H., and Hu, Z.: A Study of Macrophysical and Microphysical Properties of Warm Clouds over the Northern Hemisphere Using CloudSat/CALIPSO Data: Properties of Warm Clouds over NH, J. Geophys. Res.-Atmos., 119, 3268–3280, https://doi.org/10.1002/2013JD020948, 2014. a
Gasparini, B., Meyer, A., Neubauer, D., Münch, S., and Lohmann, U.: Cirrus Cloud Properties as Seen by the CALIPSO Satellite and ECHAM-HAM Global Climate Model, J. Climate, 31, 1983–2003, https://doi.org/10.1175/JCLI-D-16-0608.1, 2018. a, b, c, d
Grams, C. M., Beerli, R., Pfenninger, S., Staffell, I., and Wernli, H.: Balancing Europe's Wind-Power Output through Spatial Deployment Informed by Weather Regimes, Nat. Clim. Change, 7, 557–562, https://doi.org/10.1038/nclimate3338, 2017. a
Hall, W. D. and Pruppacher, H. R.: The Survival of Ice Particles Falling from Cirrus Clouds in Subsaturated Air, J. Atmos. Sci., 33, 1995–2006, https://doi.org/10.1175/1520-0469(1976)033<1995:TSOIPF>2.0.CO;2, 1976. a, b, c, d, e, f, g
Hallett, J. and Mossop, S. C.: Production of Secondary Ice Particles during the Riming Process, Nature, 249, 26–28, https://doi.org/10.1038/249026a0, 1974. a
Herbert, R. J., Murray, B. J., Dobbie, S. J., and Koop, T.: Sensitivity of Liquid Clouds to Homogenous Freezing Parameterizations, Geophys. Res. Lett., 42, 1599–1605, https://doi.org/10.1002/2014GL062729, 2015. a
Hersbach, H., Bell, B., Berrisford, P., Hirahara, S., Horányi, A., Muñoz-Sabater, J., Nicolas, J., Peubey, C., Radu, R., Schepers, D., Simmons, A., Soci, C., Abdalla, S., Abellan, X., Balsamo, G., Bechtold, P., Biavati, G., Bidlot, J., Bonavita, M., Chiara, G., Dahlgren, P., Dee, D., Diamantakis, M., Dragani, R., Flemming, J., Forbes, R., Fuentes, M., Geer, A., Haimberger, L., Healy, S., Hogan, R. J., Hólm, E., Janisková, M., Keeley, S., Laloyaux, P., Lopez, P., Lupu, C., Radnoti, G., Rosnay, P., Rozum, I., Vamborg, F., Villaume, S., and Thépaut, J.-N.: The ERA5 Global Reanalysis, Q. J. Roy. Meteor. Soc., 146, 1999–2049, https://doi.org/10.1002/qj.3803, 2020. a
Heymsfield, A. J. and Iaquinta, J.: Cirrus Crystal Terminal Velocities, J. Atmos. Sci., 57, 916–938, 2000. a, b, c, d, e, f, g, h, i, j
Heymsfield, A. J., Schmitt, C., and Bansemer, A.: Ice Cloud Particle Size Distributions and Pressure-Dependent Terminal Velocities from In Situ Observations at Temperatures from 0∘ to −86 ∘C, J. Atmos. Sci., 70, 4123–4154, https://doi.org/10.1175/JAS-D-12-0124.1, 2013. a
Hill, F. F., Browning, K. A., and Bader, M. J.: Radar and Raingauge Observations of Orographic Rain over South Wales, Q. J. Roy. Meteor. Soc., 107, 643–670, https://doi.org/10.1002/qj.49710745312, 2007. a
Hitschfeld, W.: Comments on “Cirrus Cloud Seeding as a Trigger for Storm Development”, J. Atmos. Sci., 25, 530–531, 1968. a
Hobbs, P. V., Matejka, T. J., Herzegh, P. H., Locatelli, J. D., and Houze, R. A.: The Mesoscale and Microscale Structure and Organization of Clouds and Precipitation in Midlatitude Cyclones. I: A Case Study of a Cold Front, J. Atmos. Sci., 37, 568–596, https://doi.org/10.1175/1520-0469(1980)037<0568:TMAMSA>2.0.CO;2, 1980. a, b
Hobbs, P. V., Lyons, J. H., Locatelli, J. D., Biswas, K. R., Radke, L. F., Weiss, R. R. S., and Rangno, A. L.: Radar Detection of Cloud-Seeding Effects, Science, 213, 1250–1252, https://doi.org/10.1126/science.213.4513.1250, 1981. a
Hobbs, P. V., Rangno, A. L., Shupe, M., and Uttal, T.: Airborne Studies of Cloud Structures over the Arctic Ocean and Comparisons with Retrievals from Ship-Based Remote Sensing Measurements, J. Geophys. Res.-Atmos., 106, 15029–15044, https://doi.org/10.1029/2000JD900323, 2001. a
Hong, Y. and Liu, G.: The Characteristics of Ice Cloud Properties Derived from CloudSat and CALIPSO Measurements, J. Climate, 28, 3880–3901, https://doi.org/10.1175/JCLI-D-14-00666.1, 2015. a, b, c
Ji, W. and Wang, P. K.: Ventilation Coefficients for Falling Ice Crystals in the Atmosphere at Low-Intermediate Reynolds Numbers, J. Atmos. Sci., 56, 829–836, 1999. a, b
Kanji, Z. A., Ladino, L. A., Wex, H., Boose, Y., Burkert-Kohn, M., Cziczo, D. J., and Krämer, M.: Overview of Ice Nucleating Particles, Meteor. Mon., 58, 1.1–1.33, https://doi.org/10.1175/AMSMONOGRAPHS-D-16-0006.1, 2017. a, b
Korolev, A. and Leisner, T.: Review of experimental studies of secondary ice production, Atmos. Chem. Phys., 20, 11767–11797, https://doi.org/10.5194/acp-20-11767-2020, 2020. a
Krämer, M., Schiller, C., Afchine, A., Bauer, R., Gensch, I., Mangold, A., Schlicht, S., Spelten, N., Sitnikov, N., Borrmann, S., de Reus, M., and Spichtinger, P.: Ice supersaturations and cirrus cloud crystal numbers, Atmos. Chem. Phys., 9, 3505–3522, https://doi.org/10.5194/acp-9-3505-2009, 2009. a
Krämer, M., Rolf, C., Luebke, A., Afchine, A., Spelten, N., Costa, A., Meyer, J., Zöger, M., Smith, J., Herman, R. L., Buchholz, B., Ebert, V., Baumgardner, D., Borrmann, S., Klingebiel, M., and Avallone, L.: A microphysics guide to cirrus clouds – Part 1: Cirrus types, Atmos. Chem. Phys., 16, 3463–3483, https://doi.org/10.5194/acp-16-3463-2016, 2016. a, b, c, d
Krämer, M., Rolf, C., Spelten, N., Afchine, A., Fahey, D., Jensen, E., Khaykin, S., Kuhn, T., Lawson, P., Lykov, A., Pan, L. L., Riese, M., Rollins, A., Stroh, F., Thornberry, T., Wolf, V., Woods, S., Spichtinger, P., Quaas, J., and Sourdeval, O.: A microphysics guide to cirrus – Part 2: Climatologies of clouds and humidity from observations, Atmos. Chem. Phys., 20, 12569–12608, https://doi.org/10.5194/acp-20-12569-2020, 2020. a, b
Lamb, D. and Verlinde, J.: Physics and Chemistry of Clouds, Cambridge University Press, Cambridge, https://doi.org/10.1017/CBO9780511976377, 2011. a, b
Lauber, A., Kiselev, A., Pander, T., Handmann, P., and Leisner, T.: Secondary Ice Formation during Freezing of Levitated Droplets, J. Atmos. Sci., 75, 2815–2826, https://doi.org/10.1175/JAS-D-18-0052.1, 2018. a
Lawson, R. P., Woods, S., Jensen, E., Erfani, E., Gurganus, C., Gallagher, M., Connolly, P., Whiteway, J., Baran, A. J., May, P., Heymsfield, A., Schmitt, C. G., McFarquhar, G., Um, J., Protat, A., Bailey, M., Lance, S., Muehlbauer, A., Stith, J., Korolev, A., Toon, O. B., and Krämer, M.: A Review of Ice Particle Shapes in Cirrus Formed In Situ and in Anvils, J. Geophys. Res.-Atmos., 124, 10049–10090, https://doi.org/10.1029/2018JD030122, 2019. a
Libbrecht, K. G.: The Physics of Snow Crystals, Rep. Prog. Phys., 68, 855–895, https://doi.org/10.1088/0034-4885/68/4/R03, 2005. a, b
Liu, D., Liu, Q., and Zhou, L.: Underestimation of Oceanic Warm Cloud Occurrences by the Cloud Profiling Radar Aboard CloudSat, J. Meteorol. Res., 29, 576–593, https://doi.org/10.1007/s13351-015-5027-5, 2015. a
Locatelli, J. D., Hobbs, P. V., and Biswas, K. R.: Precipitation from Stratocumulus Clouds Affected by Fallstreaks and Artificial Seeding, J. Clim. Appl. Meteorol., 22, 1393–1403, https://doi.org/10.1175/1520-0450(1983)022<1393:PFSCAB>2.0.CO;2, 1983. a, b
Lohmann, U. and Neubauer, D.: The importance of mixed-phase and ice clouds for climate sensitivity in the global aerosol–climate model ECHAM6-HAM2, Atmos. Chem. Phys., 18, 8807–8828, https://doi.org/10.5194/acp-18-8807-2018, 2018. a
Lohmann, U., Lüönd, F., and Mahrt, F.: An Introduction to Clouds: From the Microscale to Climate, Cambridge University Press, Cambridge, United Kingdom, 2016. a, b, c
Luebke, A. E., Avallone, L. M., Schiller, C., Meyer, J., Rolf, C., and Krämer, M.: Ice water content of Arctic, midlatitude, and tropical cirrus – Part 2: Extension of the database and new statistical analysis, Atmos. Chem. Phys., 13, 6447–6459, https://doi.org/10.5194/acp-13-6447-2013, 2013. a, b, c
Luebke, A. E., Afchine, A., Costa, A., Grooß, J.-U., Meyer, J., Rolf, C., Spelten, N., Avallone, L. M., Baumgardner, D., and Krämer, M.: The origin of midlatitude ice clouds and the resulting influence on their microphysical properties, Atmos. Chem. Phys., 16, 5793–5809, https://doi.org/10.5194/acp-16-5793-2016, 2016. a, b, c, d, e, f
Mace, G. G., Zhang, Q., Vaughan, M., Marchand, R., Stephens, G., Trepte, C., and Winker, D.: A Description of Hydrometeor Layer Occurrence Statistics Derived from the First Year of Merged Cloudsat and CALIPSO Data, J. Geophys. Res., 114, D00A26, https://doi.org/10.1029/2007JD009755, 2009. a, b, c, d, e, f, g, h, i, j, k
Marcolli, C.: Pre-activation of aerosol particles by ice preserved in pores, Atmos. Chem. Phys., 17, 1595–1622, https://doi.org/10.5194/acp-17-1595-2017, 2017. a
Matus, A. V. and L'Ecuyer, T. S.: The Role of Cloud Phase in Earth's Radiation Budget, J. Geophys. Res.-Atmos., 122, 2559–2578, https://doi.org/10.1002/2016JD025951, 2017. a, b, c, d
Miloshevich, L. M. and Heymsfield, A. J.: A Balloon-Borne Continuous Cloud Particle Replicator for Measuring Vertical Profiles of Cloud Microphysical Properties: Instrument Design, Performance, and Collectoin Efficiency Analysis, J. Atmos. Ocean. Tech., 14, 753–768, 1997. a
Mitchell, D. L.: Use of Mass- and Area-Dimensional Power Laws for Determining Precipitation Particle Terminal Velocities, J. Atmos. Sci., 53, 1710–1723, 1996. a
Mossop, S. C. and Hallett, J.: Ice Crystal Concentration in Cumulus Clouds: Influence of the Drop Spectrum, Science, 186, 632–634, https://doi.org/10.1126/science.186.4164.632, 1974. a
Mülmenstädt, J., Sourdeval, O., Delanoë, J., and Quaas, J.: Frequency of Occurrence of Rain from Liquid-, Mixed-, and Ice-Phase Clouds Derived from A-Train Satellite Retrievals: RAIN FROM LIQUID- AND ICE-PHASE CLOUDS, Geophys. Res. Lett., 42, 6502–6509, https://doi.org/10.1002/2015GL064604, 2015. a
Murray, B. J., Broadley, S. L., Wilson, T. W., Bull, S. J., Wills, R. H., Christenson, H. K., and Murray, E. J.: Kinetics of the Homogeneous Freezing of Water, Phys. Chem. Chem. Phys., 12, 10380–10387, https://doi.org/10.1039/c003297b, 2010. a
Naud, C. M., Posselt, D. J., and van den Heever, S. C.: A CloudSat–CALIPSO View of Cloud and Precipitation Properties across Cold Fronts over the Global Oceans, J. Climate, 28, 6743–6762, https://doi.org/10.1175/JCLI-D-15-0052.1, 2015. a
Nelson, J.: Sublimation of Ice Crystals, J. Atmos. Sci., 55, 910–919, 1998. a
Pasquier, J. T., Pfahl, S., and Grams, C. M.: Modulation of Atmospheric River Occurrence and Associated Precipitation Extremes in the North Atlantic Region by European Weather Regimes, Geophys. Res. Lett., 46, 1014–1023, https://doi.org/10.1029/2018GL081194, 2019. a
Pinto, J. O., Curry, J. A., and Intrieri, J. M.: Cloud-Aerosol Interactions during Autumn over Beaufort Sea, J. Geophys. Res.-Atmos., 106, 15077–15097, https://doi.org/10.1029/2000JD900267, 2001. a
Proske, U., Bessenbacher, V., Dedekind, Z., Lohmann, U., and Neubauer, D.: Data for the publication “How frequent is natural cloud seeding from ice cloud layers ( ∘C) over Switzerland?”, Zenodo, https://doi.org/10.5281/zenodo.3987757, 2020. a
Proske, U., Bessenbacher, V., Dedekind, Z., Lohmann, U., and Neubauer, D.: Scripts for the publication “How frequent is natural cloud seeding from ice cloud layers ( ∘C) over Switzerland?”, Zenodo, https://doi.org/10.5281/zenodo.3987754, 2021. a
Pruppacher, H. R. and Klett, J. D.: Microphysics of Clouds and Precipitation, vol. 18, Atmospheric and Oceanographic Sciences Library, Springer, Dordrecht, New York, 2010. a, b, c, d, e, f, g, h, i
Purdy, J. C., Austin, G. L., Seed, A. W., and Cluckie, I. D.: Radar Evidence of Orographic Enhancement Due to the Seeder Feeder Mechanism, Meteorol. Appl., 12, 199–206, https://doi.org/10.1017/S1350482705001672, 2005. a
Robichaud, A. J. and Austin, G. L.: On the Modelling of Warm Orographic Rain by the Seeder-Feeder Mechanism, Q. J. Roy. Meteor. Soc., 114, 967–988, https://doi.org/10.1002/qj.49711448207, 1988. a
Roe, G. H.: Orographic Precipitation, Annu. Rev. Earth Planet. Sc., 33, 645–671, https://doi.org/10.1146/annurev.earth.33.092203.122541, 2005. a
Rössler, O., Froidevaux, P., Börst, U., Rickli, R., Martius, O., and Weingartner, R.: Retrospective analysis of a nonforecasted rain-on-snow flood in the Alps – a matter of model limitations or unpredictable nature?, Hydrol. Earth Syst. Sci., 18, 2265–2285, https://doi.org/10.5194/hess-18-2265-2014, 2014. a
Rutledge, S. A. and Hobbs, P.: The Mesoscale and Microscale Structure and Organization of Clouds and Precipitation in Midlatitude Cyclones. VIII: A Model for the “Seeder-Feeder” Process in Warm-Frontal Rainbands, J. Atmos. Sci., 40, 1185–1206, https://doi.org/10.1175/1520-0469(1983)040<1185:TMAMSA>2.0.CO;2, 1983. a
Schulzweida, U.: CDO User Guide, MPI for Meteorology, Hamburg, Germany, 2018. a
Seifert, A. and Beheng, K. D.: A Two-Moment Cloud Microphysics Parameterization for Mixed-Phase Clouds. Part 1: Model Description, Meteorol. Atmos. Phys., 92, 45–66, https://doi.org/10.1007/s00703-005-0112-4, 2006. a, b, c, d, e, f, g, h, i, j
Seifert, P., Ansmann, A., Mattis, I., Althausen, D., and Tesche, M.: Lidar-Based Profiling of the Tropospheric Cloud-Ice Distribution to Study the Seeder-Feeder Mechanism and the Role of Saharan Dust as Ice Nuclei, in: Proceedings of the 8th International Symposium on Tropospheric Profiling, edited by: Apituley, A., Russchenberg, H. W. J., and Monna, W. A. A., p. 5, Delft, the Netherlands, Organizing Committee of the 8th International Symposium on Tropospheric Profiling, 2009. a, b, c, d
Seinfeld, J. H. and Pandis, S. N.: Atmospheric Chemistry and Physics: From Air Pollution to Climate Change, 2nd edn., J. Wiley, Hoboken, N.J., 2006. a
Soden, B. J. and Held, I. M.: An Assessment of Climate Feedbacks in Coupled Ocean-Atmosphere Models, J. Climate, 19, 3354–3360, https://doi.org/10.1175/JCLI3799.1, 2006. a
Stephens, G., Winker, D., Pelon, J., Trepte, C., Vane, D., Yuhas, C., L'Ecuyer, T., and Lebsock, M.: CloudSat and CALIPSO within the A-Train: Ten Years of Actively Observing the Earth System, B. Am. Meteorol. Soc., 99, 569–581, https://doi.org/10.1175/BAMS-D-16-0324.1, 2018. a
Stephens, G. L., Vane, D. G., Boain, R. J., Mace, G. G., Sassen, K., Wang, Z., Illingworth, A. J., O'connor, E. J., Rossow, W. B., Durden, S. L., Miller, S. D., Austin, R. T., Benedetti, A., Mitrescu, C., and the CloudSat Science Team: The CloudSat Mission and the A-Train: A New Dimension of Space-Based Observations of Clouds and Precipitation, B. Am. Meteorol. Soc., 83, 1771–1790, https://doi.org/10.1175/BAMS-83-12-1771, 2002. a
Stephens, G. L., Vane, D. G., Tanelli, S., Im, E., Durden, S., Rokey, M., Reinke, D., Partain, P., Mace, G. G., Austin, R., L'Ecuyer, T., Haynes, J., Lebsock, M., Suzuki, K., Waliser, D., Wu, D., Kay, J., Gettelman, A., Wang, Z., and Marchand, R.: CloudSat Mission: Performance and Early Science after the First Year of Operation, J. Geophys. Res., 113, D00A18, https://doi.org/10.1029/2008JD009982, 2008. a, b
Sullivan, S. C., Barthlott, C., Crosier, J., Zhukov, I., Nenes, A., and Hoose, C.: The effect of secondary ice production parameterization on the simulation of a cold frontal rainband, Atmos. Chem. Phys., 18, 16461–16480, https://doi.org/10.5194/acp-18-16461-2018, 2018. a
Sun, Z. and Shine, K. P.: Parameterization of Ice Cloud Radiative Properties and Its Application to the Potential Climatic Importance of Mixed-Phase Clouds, J. Climate, 8, 1874–1888, https://doi.org/10.1175/1520-0442(1995)008<1874:POICRP>2.0.CO;2, 1995. a
Tan, I., Storelvmo, T., and Zelinka, M. D.: Observational Constraints on Mixed-Phase Clouds Imply Higher Climate Sensitivity, Science, 352, 224–227, https://doi.org/10.1126/science.aad5300, 2016. a
Vassel, M.: Arctic Multilayer Clouds, Master Thesis, KIT, Karlsruhe, 2018. a, b, c, d, e
Vassel, M., Ickes, L., Maturilli, M., and Hoose, C.: Classification of Arctic multilayer clouds using radiosonde and radar data in Svalbard, Atmos. Chem. Phys., 19, 5111–5126, https://doi.org/10.5194/acp-19-5111-2019, 2019. a, b, c, d, e, f, g, h, i, j, k
Wang, J., Rossow, W. B., and Zhang, Y.: Cloud Vertical Structure and Its Variations from a 20-Yr Global Rawinsonde Dataset, J. Climate, 13, 3041–3056, 2000. a, b, c, d
Wegener, A.: Thermodynamik Der Atmosphäre, J. A. Barth, Leipzig, 1911. a
Wernli, H., Boettcher, M., Joos, H., Miltenberger, A. K., and Spichtinger, P.: A Trajectory-Based Classification of ERA-Interim Ice Clouds in the Region of the North Atlantic Storm Track, Geophys. Res. Lett., 43, 6657–6664, https://doi.org/10.1002/2016GL068922, 2016. a, b, c, d
Williams, K. D. and Tselioudis, G.: GCM Intercomparison of Global Cloud Regimes: Present-Day Evaluation and Climate Change Response, Clim. Dynam., 29, 231–250, https://doi.org/10.1007/s00382-007-0232-2, 2007. a
Winker, D. M., Pelon, J., Coakley Jr., J. A., Ackerman, S. A., Charlson, R. J., Colarco, P. R., Flamant, P., Fu, Q., Hoff, R. M., Kittaka, C., Kubar, T. L., Treut, H. L., Mccormick, M. P., Mégie, G., Poole, L., Powell, K., Trepte, C., Vaughan, M. A., and Wielicki, B. A.: The CALIPSO Mission: A Global 3D View of Aerosols and Clouds, B. Am. Meteorol. Soc., 91, 1211–1230, https://doi.org/10.1175/2010BAMS3009.1, 2010. a, b
Witkowski, M. M., Vane, D., and Livermore, T.: CloudSat – Life in Daylight Only Operations (DO-Op), in: 15th International Conference on Space Operations, American Institute of Aeronautics and Astronautics, Marseille, France, https://doi.org/10.2514/6.2018-2562, 2018. a, b
Wolf, V., Kuhn, T., Milz, M., Voelger, P., Krämer, M., and Rolf, C.: Arctic ice clouds over northern Sweden: microphysical properties studied with the Balloon-borne Ice Cloud particle Imager B-ICI, Atmos. Chem. Phys., 18, 17371–17386, https://doi.org/10.5194/acp-18-17371-2018, 2018. a, b, c, d
Wolf, V., Kuhn, T., and Krämer, M.: On the Dependence of Cirrus Parametrizations on the Cloud Origin, Geophys. Res. Lett., 46, 12565–12571, https://doi.org/10.1029/2019GL083841, 2019. a, b, c, d, e
- Abstract
- Introduction
- Methods and data
- Results and discussion
- Summary and conclusions
- Appendix A: Sublimation calculations
- Appendix B: Additional DARDAR analysis
- Appendix C: Cloud cover data comparison to CALIPSO
- Code and data availability
- Author contributions
- Competing interests
- Acknowledgements
- Financial support
- Review statement
- References