the Creative Commons Attribution 4.0 License.
the Creative Commons Attribution 4.0 License.
 | 01 Mar 2021
Elemental and water-insoluble organic carbon in Svalbard snow: a synthesis of observations during 2007–2018
Christian Zdanowicz
Jean-Charles Gallet
Mats P. Björkman
Catherine Larose
Thomas Schuler
Bartłomiej Luks
Krystyna Koziol
Andrea Spolaor
Elena Barbaro
Tõnu Martma
Ward van Pelt
Ulla Wideqvist
Johan Ström
Light-absorbing carbonaceous aerosols emitted by biomass or fossil fuel combustion can contribute to amplifying Arctic climate warming by lowering the albedo of snow. The Svalbard archipelago, being near to Europe and Russia, is particularly affected by these pollutants, and improved knowledge of their distribution in snow is needed to assess their impact. Here we present and synthesize new data obtained on Svalbard between 2007 and 2018, comprising measurements of elemental (EC) and water-insoluble organic carbon (WIOC) in snow from 37 separate sites. We used these data, combined with meteorological data and snowpack modeling, to investigate the variability of EC and WIOC deposition in Svalbard snow across latitude, longitude, elevation and time. Overall, EC concentrations () ranged from <1.0 to 266.6 ng g−1, while WIOC concentrations () ranged from <1 to 9426 ng g−1, with the highest values observed near Ny-Ålesund. Calculated snowpack loadings (, ) on glaciers surveyed in spring 2016 were 0.1 to 2.6 mg m−2 and 2 to 173 mg m−2, respectively. The median and the on those glaciers were close to or lower than those found in earlier (2007–2009), comparable surveys. Both and increased with elevation and snow accumulation, with dry deposition likely playing a minor role. Estimated area-averaged snowpack loads across Svalbard were 1.1 mg EC m−2 and 38.3 mg WIOC m−2 for the 2015–2016 winter. An ∼11-year long dataset of spring surface snow measurements from the central Brøgger Peninsula was used to quantify the interannual variability of EC and WIOC deposition in snow. In most years, and at Ny-Ålesund (50 m a.s.l.) were 2–5 times higher than on the nearby Austre Brøggerbreen glacier (456 m a.s.l.), and the median EC/WIOC in Ny-Ålesund was 6 times higher, suggesting a possible influence of local EC emission from Ny-Ålesund. While no long-term trends between 2011 and 2018 were found, and showed synchronous variations at Ny-Ålesund and Austre Brøggerbreen. When compared with data from other circum-Arctic sites obtained by comparable methods, the median on Svalbard falls between that found in central Greenland (lowest) and those in continental sectors of European Arctic (northern Scandinavia, Russia and Siberia; highest), which is consistent with large-scale patterns of BC in snow reported by surveys based on other methods.
- Article
(6236 KB) - Full-text XML
- Companion paper
-
Supplement
(1687 KB) - BibTeX
- EndNote


Light-absorbing black carbon (BC) aerosols that are transported to Arctic latitudes can lower the albedo of snow-/ice-covered surfaces on which they are deposited, thereby enacting a positive feedback that amplifies climate warming (Bond et al., 2013). The Svalbard archipelago, owing to its proximity to the European and Russian mainland, is particularly affected by BC emissions from fossil fuel combustion (FF; heating, gas flaring, etc.) and biomass burning (BB; e.g., agricultural or forest fires). Source attribution using carbon isotopes and atmospheric transport modeling indicates that BC associated with pollution haze events at the Zeppelin Observatory on Spitsbergen includes both BB and FF contributions, the latter being proportionally more important in winter than summer (Winiger et al., 2015, 2019). Quantifying the impact of BC deposition on the Arctic surface albedo requires knowledge of its concentrations, spatial distribution and variability in snow and ice. These data may also serve to verify the efficacy of ongoing and future measures to curb emissions of short-lived climate forcing aerosols, such as BC that impacts the Arctic (AMAP, 2015; Stohl et al., 2015). On Svalbard, reconnaissance surveys of BC in snow were carried out in 1984–1985 by Noone and Clark (1988) and in 2007 by Doherty et al. (2010). This was followed in 2007–2009 by more detailed investigations of the distribution of BC across the archipelago (Forsström et al., 2009, 2013). Localized studies have also been carried out near Longyearbyen (Aamaas et al., 2011; Khan et al., 2017) and Ny-Ålesund (Sihna et al., 2018; Jacobi et al., 2019). In addition, two ice cores recovered from the Lomonosovfonna and Holtedahlfonna ice fields (Spitsbergen) have provided insights into longer-term variations in BC deposition on Svalbard (Ruppel et al., 2014, 2017; Osmont et al., 2018).
Here we present and synthesize new observational data which document the variability of BC in snow across Svalbard in terms of latitude, longitude, altitude and time. These data were gathered through field investigations conducted between 2007 and 2018 on both Spitsbergen and Nordaustlandet (Fig. 1). The datasets were developed from surveys carried out on glaciers of Svalbard in springs 2016 and 2017 and from an 11-year long program of snow sampling for EC on the central Brøgger Peninsula on northwestern Spitsbergen. The spring 2016 survey included some of the sites previously visited in 2007–2009 by Forsström et al. (2009, 2013), thus allowing for comparisons after a ∼ decadal interval. All data presented in this study were obtained by the thermo-optical transmittance method (TOT), which quantifies separately the more refractory and volatile carbon mass fractions present in water-insoluble, particulate material filtered from melted snow (Cavalli et al., 2010; see below). Following Petzold et al. (2013), we designate the more refractory mass fraction as elemental carbon (EC; see Table 1 for a list of abbreviations used in this paper). The more volatile fraction represents carbon that evolved primarily from water-insoluble organic carbon (WIOC) but may also include some contributions from the oxidation of carbonate particles (carbonatic carbon; CC). While the WIOC data are not the main focus of our study, they are also presented, as such data are sparse for Arctic snow. We used our datasets in combination with meteorological snowpack modeling to (i) describe the spatial distribution of EC and WIOC deposited on Svalbard glaciers, (ii) estimate their mass loading in the winter snowpack and how it relates to spatial variations in snow accumulation, and (iii) describe the interannual variability of EC and WIOC concentration in snow on the Brøgger Peninsula between 2007 and 2018. Lastly, we place our findings in a broader pan-Arctic perspective by comparison with a compilation of published data obtained between 2002 and 2018 by comparable methods.
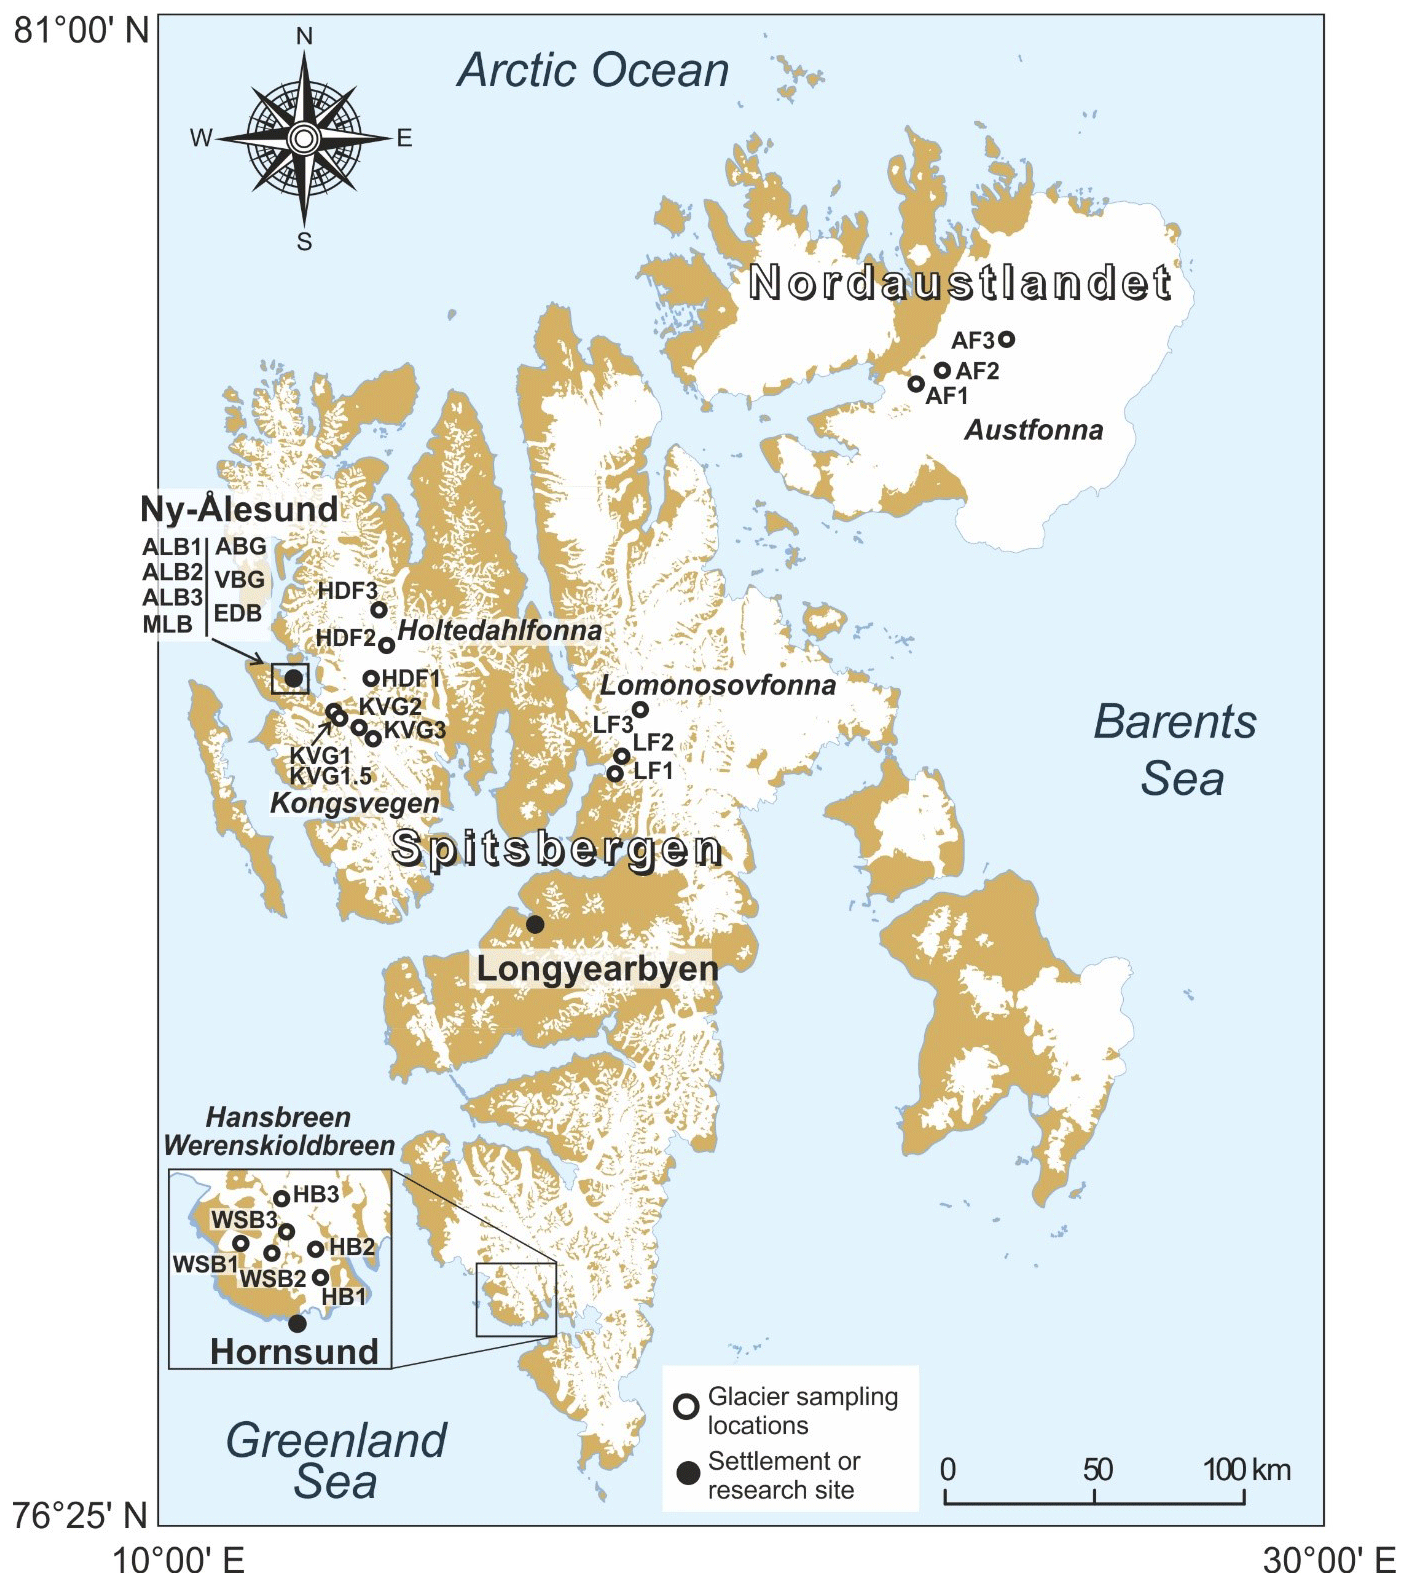
Figure 1Map of the Svalbard archipelago, showing the location of the snow sampling sites mentioned in this study (Table 2). Sampling sites on glaciers near Ny-Ålesund (framed area; sites ALB, MLB, ABG, VBG and EDB) are shown in an enlargement in Fig. S2.
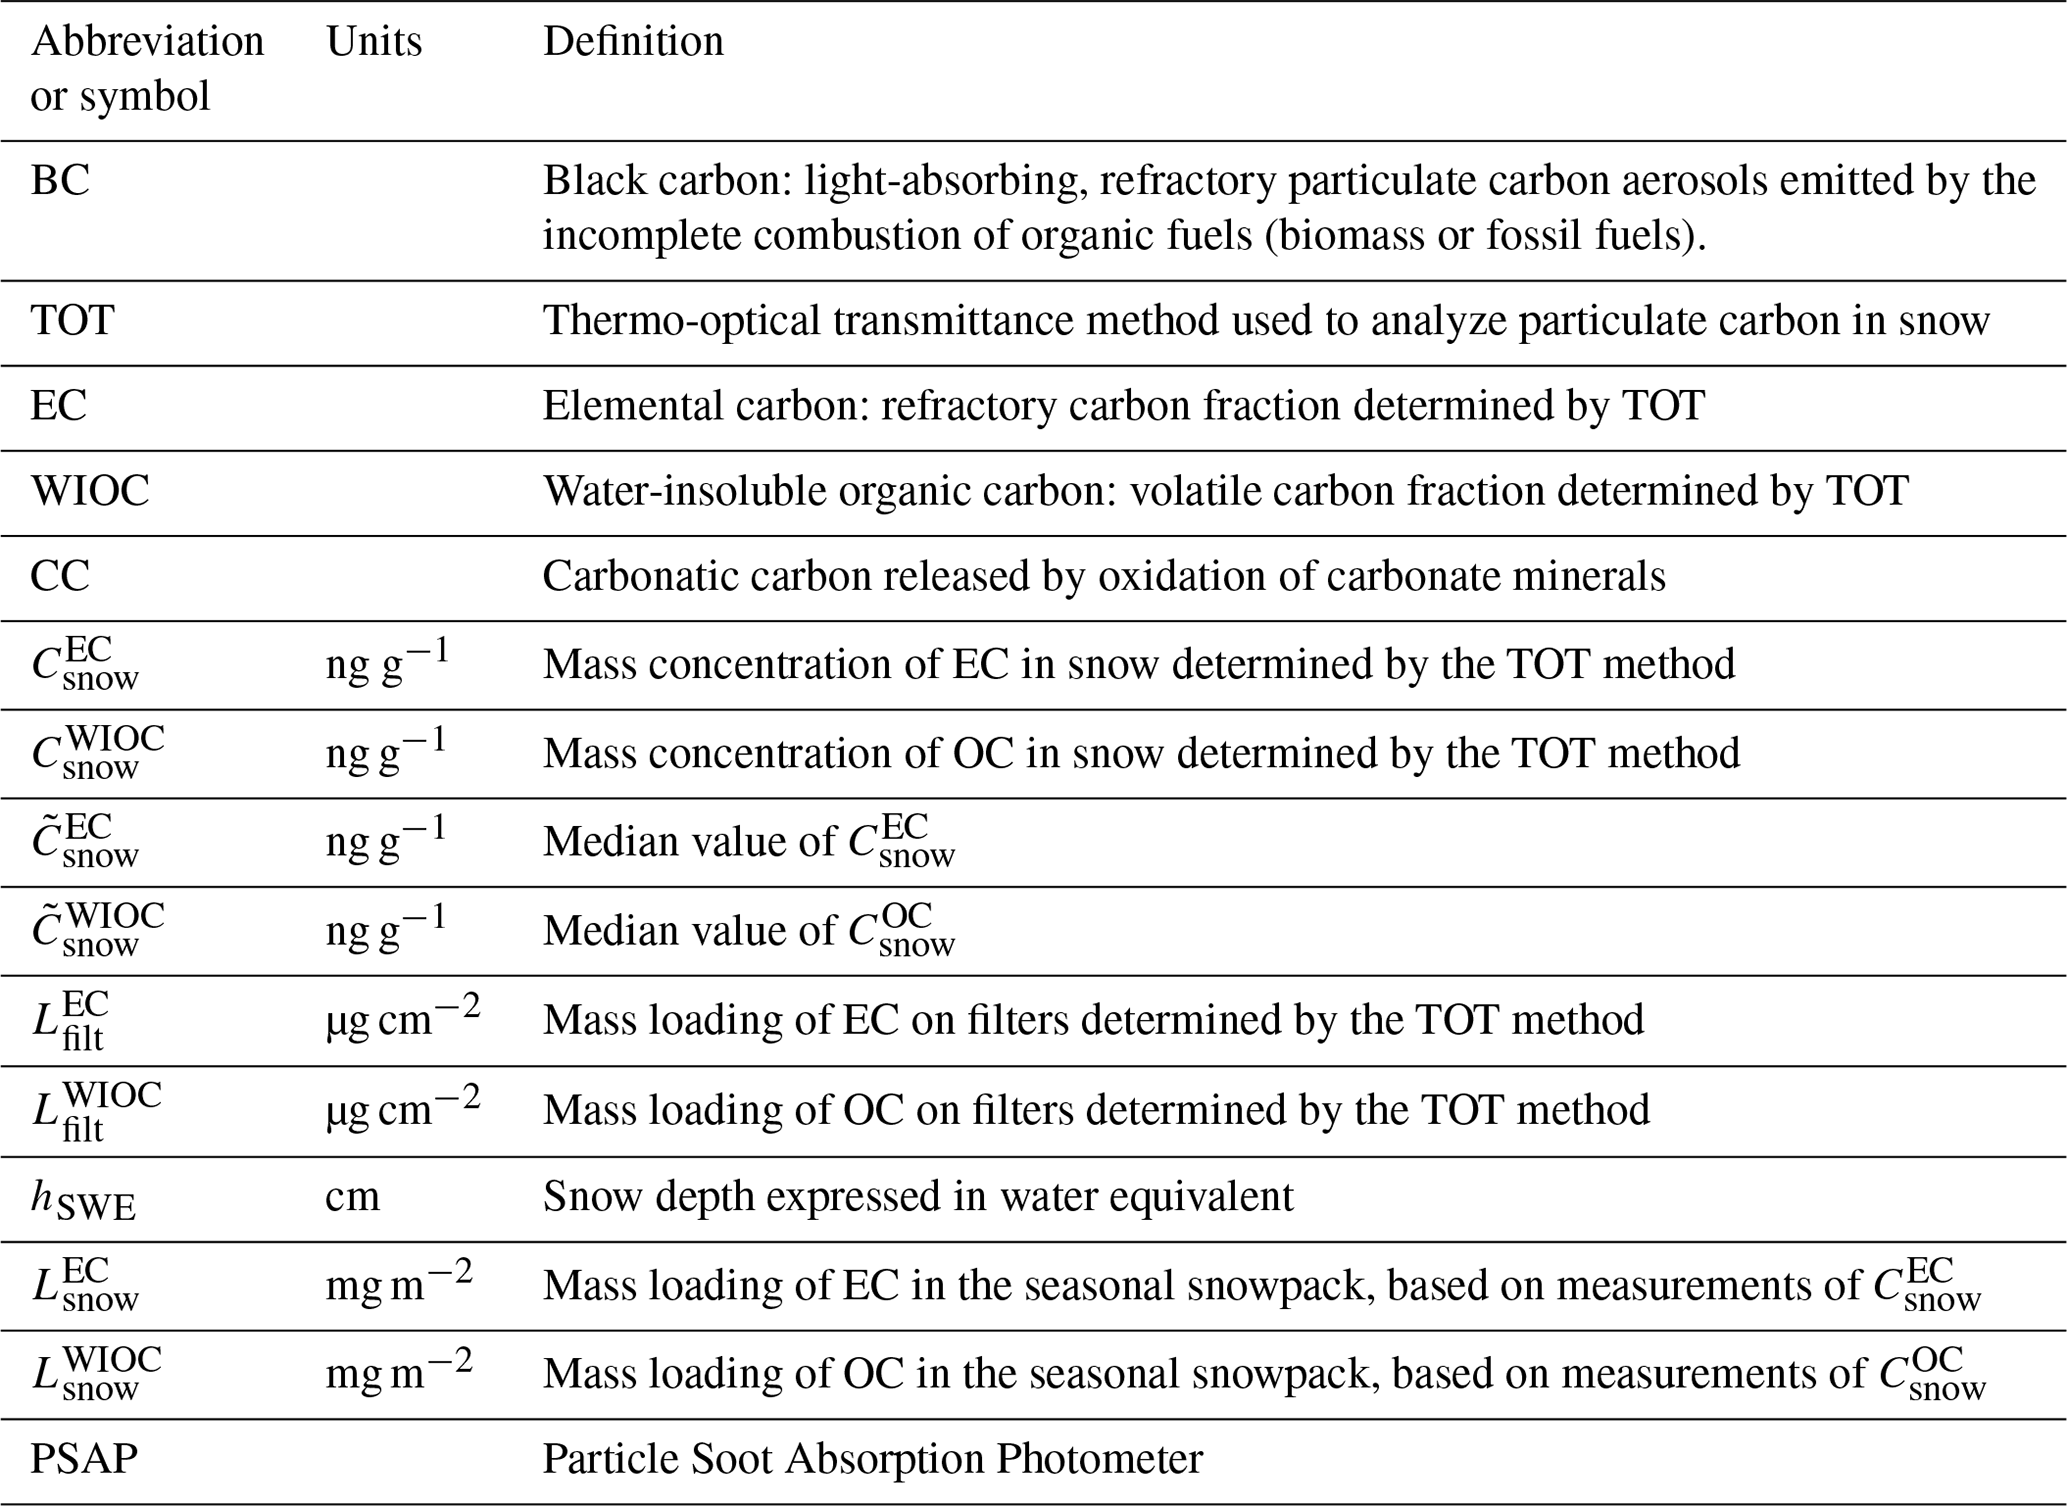
Table 1Main symbols and abbreviations used in this paper. The various terms for black carbon (BC, EC) are as defined in Petzold et al. (2013).
2.1 Field sampling
2.1.1 Spring 2016 glacier survey
Part of the dataset presented here was produced following a comprehensive, coordinated survey of the physical, chemical and microbiological properties of the Svalbard seasonal snowpack carried out at the end of the 2015–2016 winter by individuals from multiple institutions (see Acknowledgments). In total, 22 sites were sampled between 4 and 29 April 2016 on seven individual glaciers of Spitsbergen and Nordaustlandet (Fig. 1). Snowpits were sampled at three different elevations in the upper, middle and lower reaches of each glacier, the snow depth increasing with altitude (e.g., Pramanik et al., 2019). In the text and figures, specific snowpit locations are identified by a letter and number code, e.g., HB3 as Hansbreen glacier, snowpit no. 3 (Table 2, with additional details in Table S1 in the Supplement). Glacier sites were targeted partly for logistical reasons (ease of access by snowmobile), but also because sampling supraglacial snow avoided the heterogeneities in snow properties that may arise from interactions with vegetation and/or different substrates (e.g., wet vs. dry tundra soils). In addition, the selected glacier sites were at elevations of 102 to 1193 m a.s.l., which span ∼65 % of the maximum relief in Svalbard (1713 m; Fig. 2).
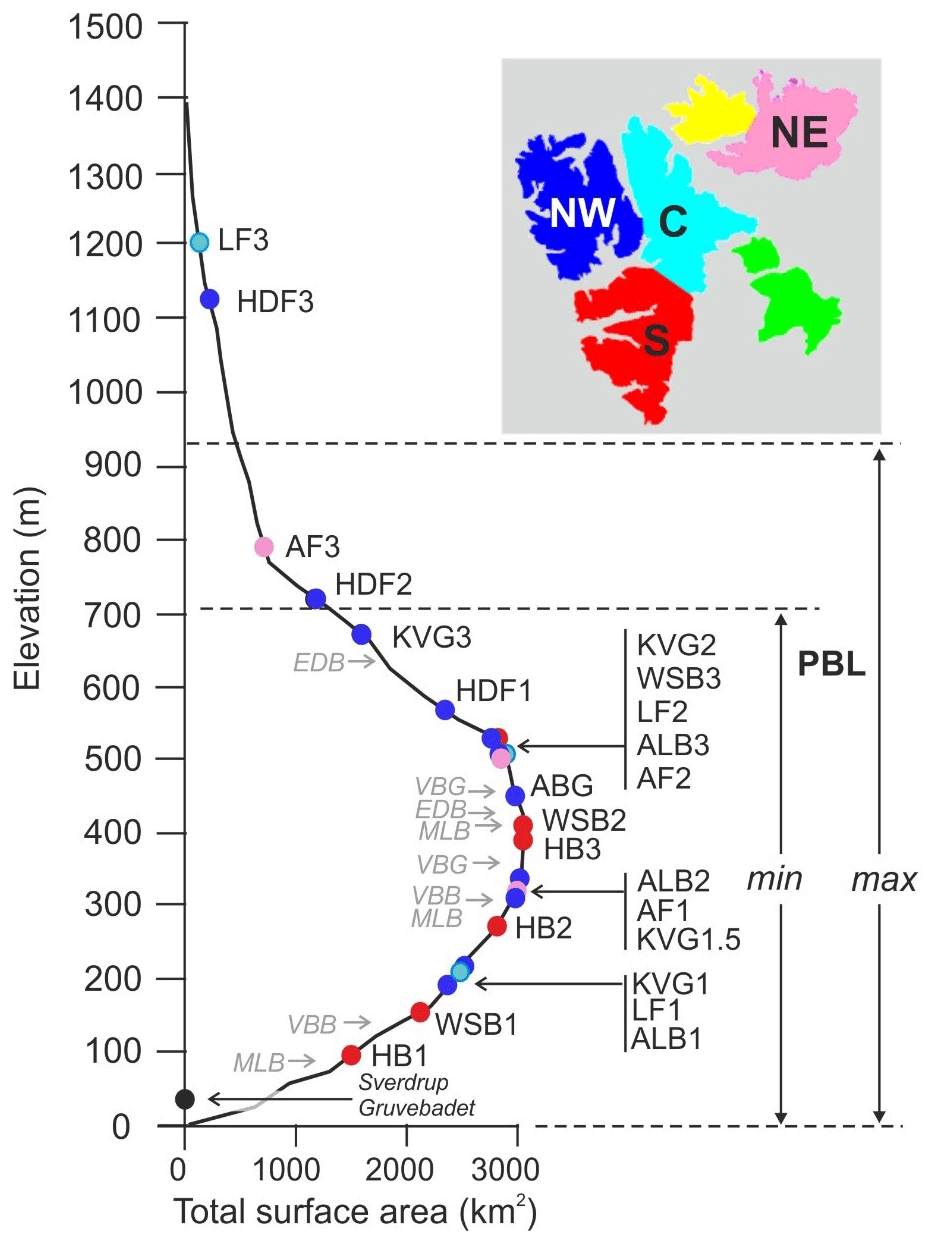
Figure 2Snow sampling sites visited during the spring 2016 glacier survey, plotted with respect to elevation and glacier surface hypsometry (black line; from James et al., 2012). Each circle corresponds to a sampling location, and those on glaciers are labeled as in Table 2 and color-coded per region (inset; from König et al., 2014). The grey arrows and symbols to the left of the hypsometric curve indicate elevations at which surface snow samples were collected during the spring 2017 survey. Also shown are the minimum (winter) and maximum (summer) thicknesses of the planetary boundary layer (PBL) in the maritime sector of the European Arctic, based on ERA-40 reanalysis over 1969–2001 (Esau and Sorokina, 2009).
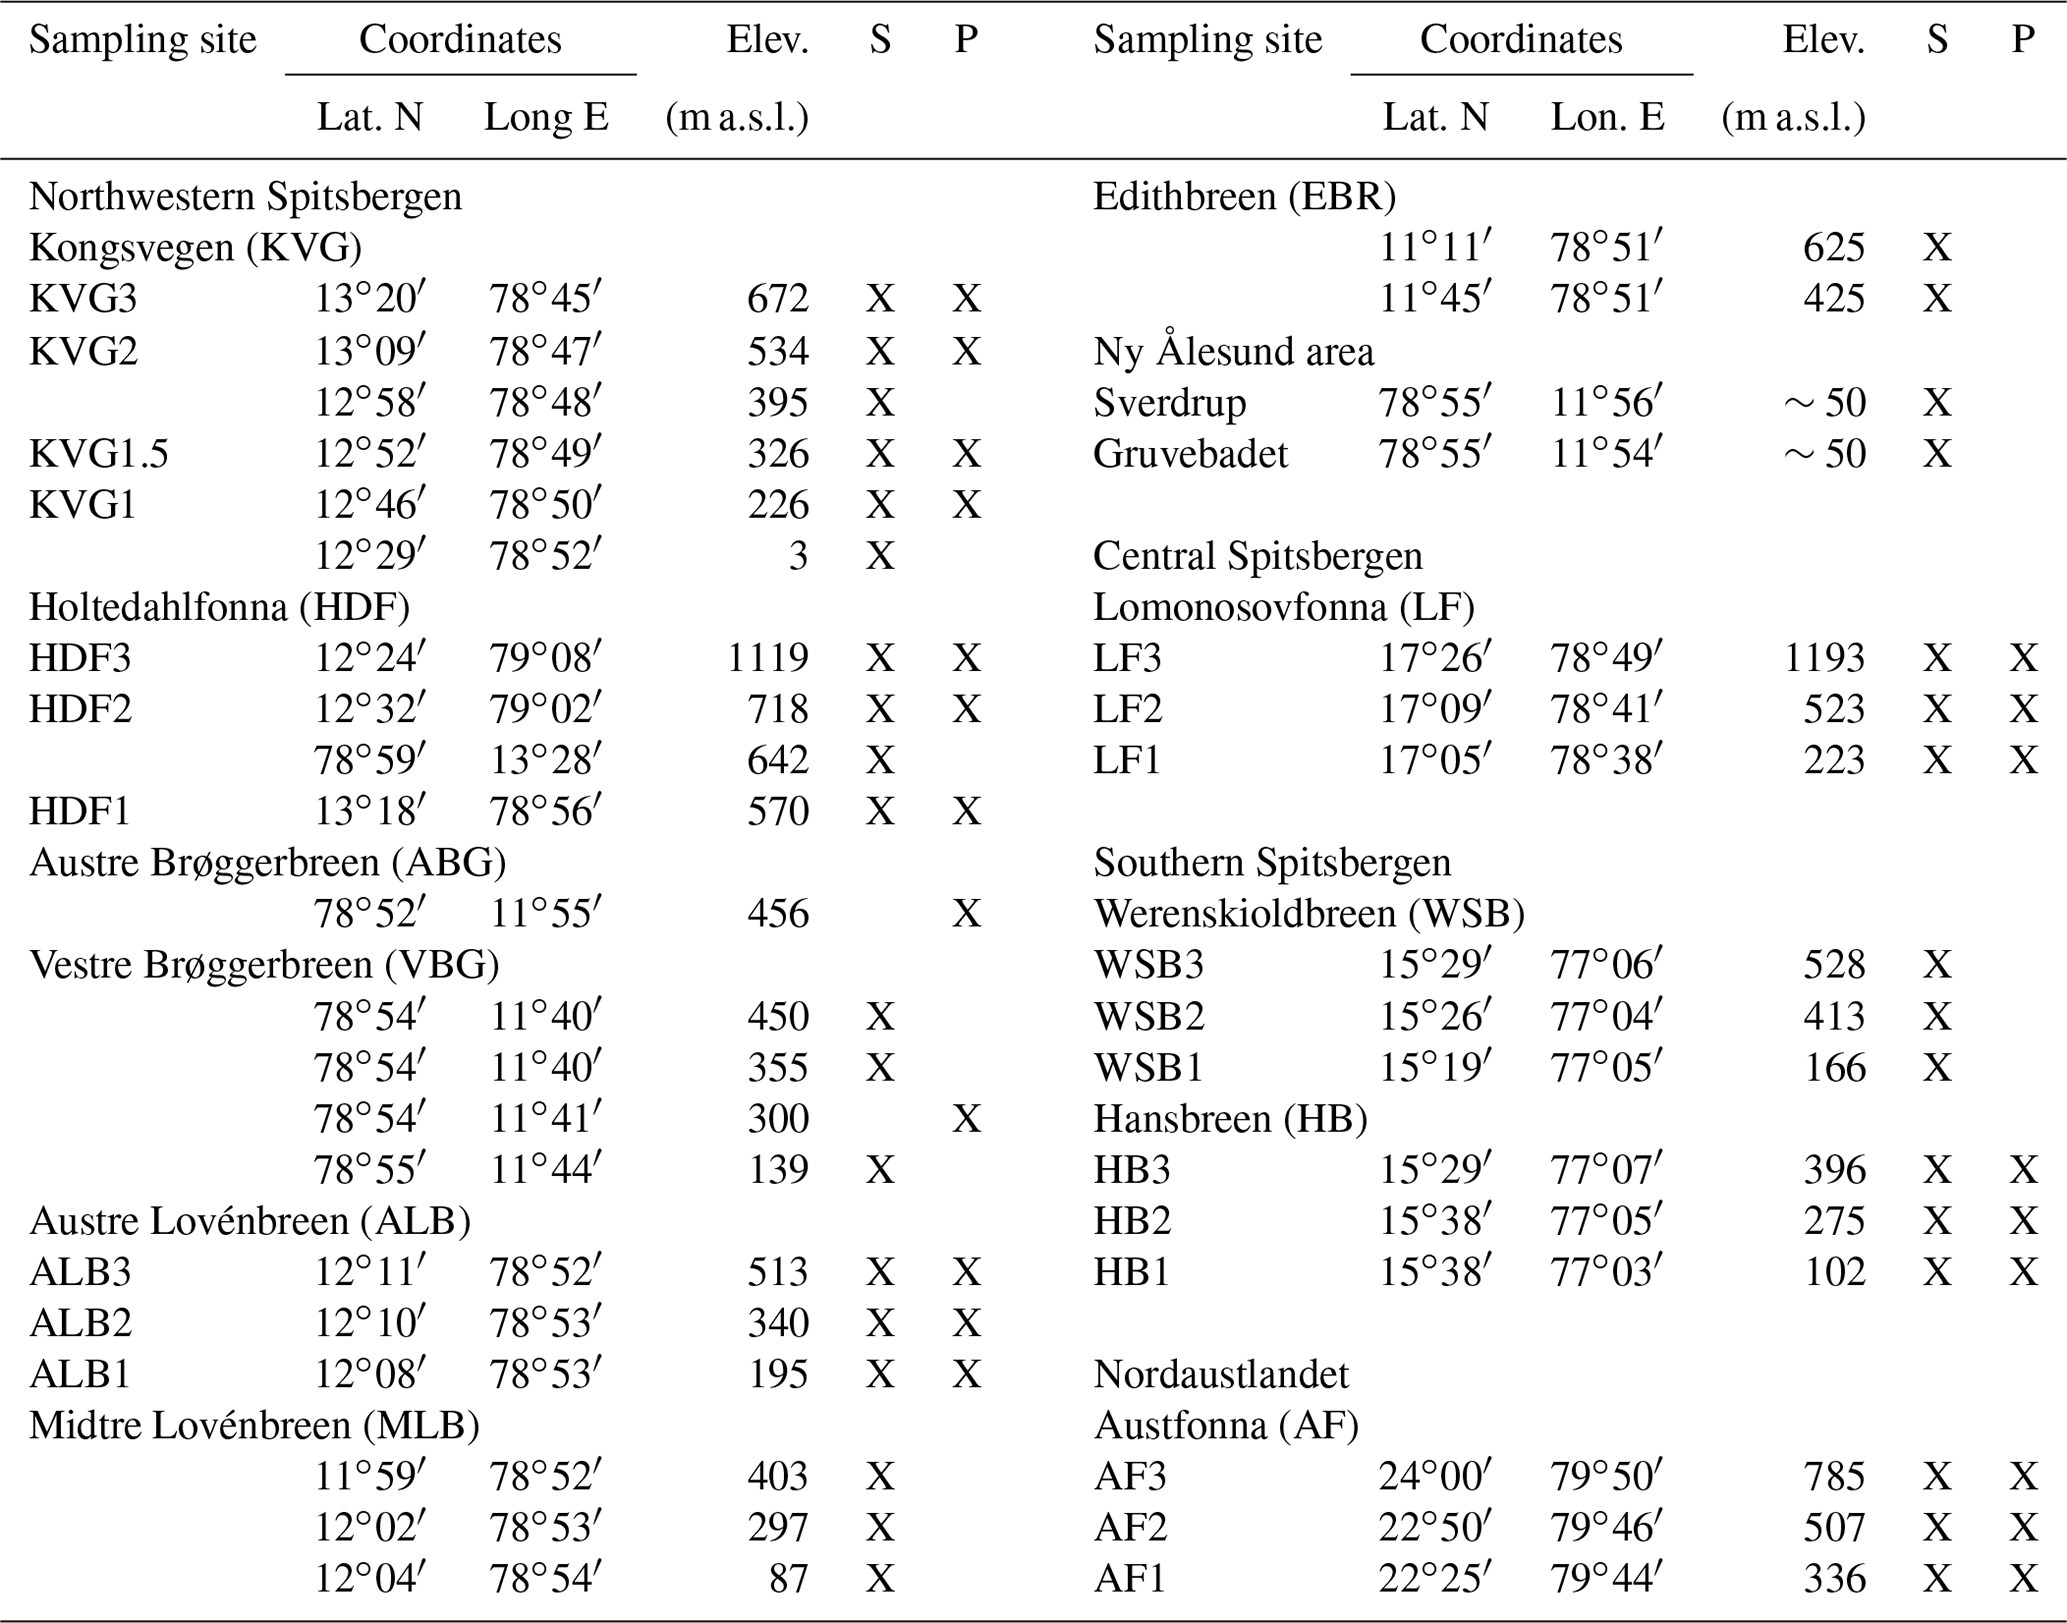
Table 2Snow sampling sites in Svalbard mentioned in this paper. Glacier site codes that include a number (e.g., KVG3) are those where samples were collected during the spring 2016 survey. The “x” symbols indicate whether samples were collected from surface layers (S) and/or in snowpits (P). A few samples from Austre Brøggerbreen (ABG) were collected below 456 m a.s.l. Further details on sampling sites are provided in Tables S1 and S2.
In advance of the field campaign, standardized protocols were developed for the measurement of important snow physical properties (e.g., density, temperature) and the collection of samples for a variety of analyses, including EC, WIOC, and stable oxygen isotope ratios (δ18O) in water. These protocols are documented in Gallet et al. (2018) and details relevant for this paper summarized hereafter. Snow sampling was performed in snowpits excavated down to the hard, icy firn surface representing the previous year's late summer ablation surface (in the accumulation zone of glaciers) or to the underlying bare ice surface (in the ablation zone). All snowpits were located well away from point sources of contamination (e.g., field camps), were accessed by foot from at least 100 m and personnel doing the sampling wore protective, non-particulating suits, gloves, and face masks, and employed pre-cleaned plastic or stainless steel tools. The snow accumulation of each snowpit (hSWE, in water equivalent; w.e.) was calculated from discrete density measurements. After recording the physical properties of snow strata, large-volume snow samples (∼5 L each) were collected from the top 5 cm of the snowpack, and, where snowpack depth allowed for it, at 50 cm depth intervals beneath. The surface samples were collected to quantify EC concentrations in snow () at depths where light absorption by carbonaceous particles has the largest impact on snow albedo (Marks and King, 2013). The deeper samples were used to estimate the total column mass loading of EC and WIOC (, ) in the seasonal snowpack. Quantification of (and, concurrently, of in layers from discrete snowfall events was not feasible, owing to the large snow volume required to achieve a sufficient particulate carbon mass for TOT analysis. All snow samples were double-bagged in sterile low-density polyethylene bags and returned frozen to a location where they were subsequently melted and filtered. Depending on logistics, this was done either at the Polish Polar Station Hornsund operated by the Polish Academy of Sciences or at the Norwegian Polar Institute (NPI) facilities in Ny-Ålesund (Sverdrup station), Longyearbyen (UNIS) or Tromsø. A total of 89 samples were obtained from all 22 glacier sites.
Analysis of downscaled climatological fields from the European Centre for Medium-Range Weather Forecasts (ERA-Interim; Dee et al., 2011) over Svalbard shows that surface temperatures in the 2015–2016 winter exceeded the 30-year climatological normals for the 1981–2010 period by 2 to 6 ∘C, with the largest anomalies observed in the northeastern part of the archipelago (Fig. S1a in the Supplement). Total winter precipitation also exceeded 1981–2010 normals by 0.2 to 0.7 m w.e. over much of central and northern Spitsbergen (Fig. S1b). These unusual conditions arose partly owing to an extreme winter warming and precipitation event associated with a southerly air intrusion over Spitsbergen that occurred in late December 2015 (Binder et al., 2017; Kim et al., 2017). The implications of these climatological circumstances for the interpretation of our snow survey data are discussed later.
2.1.2 Spring 2017 glacier survey
We also report additional and measurements in surface snow collected at 17 sites on five glaciers in northwestern Spitsbergen (n=26; see Table 2, with additional details in Table S2). These samples were collected by NPI staff during other field research activities but were handled and analyzed in the same manner as those of the spring 2016 glacier survey.
2.1.3 Surface snow monitoring (2007–2018), Brøgger Peninsula
Surface snow layers have been sampled for EC measurements by NPI staff at several sites on Brøgger Peninsula between 2007 and 2018 (Fig. 1; see enlargement in Fig. S2 for details). The first of these sites is in the accumulation zone of the glacier Austre Brøggerbreen (ABG; 78.87∘ N, 11.92∘ E; 456 m a.s.l.), which was accessed by snowmobile from Ny-Ålesund. The other sites are on the outskirts of Ny-Ålesund, one ∼80 m southeast of NPI's Sverdrup station (78.92∘ N, 11.93∘ E; ∼50 m a.s.l.) and the other near the Gruvebadet Atmospheric Laboratory (78.92∘ N, 11.89∘ E; ∼50 m a.s.l.). Sampling was carried out at approximately weekly intervals by the NPI permanent staff at Sverdrup station, whenever their work schedule made it possible and when safe snowmobile driving conditions (e.g., proper visibility, firm surface) allowed access to Austre Brøggerbreen. Because of these restrictions, the snow samples could not always be collected immediately after snowfall events. Over the ∼11-year period considered, a total of 201 samples were collected between February and June, 86 % of which were taken in the spring months (March–May), April being the most represented month (n=44). Methods for field sample collection were the same as those described above for the April 2016 survey. Sample collection was limited to the top 5 cm of the snowpack (occasionally deeper). These data provide long-term estimates of the interannual variability of and in Svalbard against which results of the April 2016 survey (and others) can be compared.
2.2 EC and WIOC analyses
2.2.1 Laboratory procedures
The snow samples collected routinely by NPI staff near Ny-Ålesund and on Austre Brøggerbreen were processed following the protocol described in Forsström et al. (2009). Briefly, snow was transferred into pre-cleaned, 1 L borosilicate glass beakers and melted in a microwave oven. At 800 W power, the typical melting time was ∼10 min kg−1. The meltwater was then filtered through pre-ashed, 47 mm diameter quartz microfiber filters (Fig. S3). For the spring 2016 and 2017 glacier surveys, the large number of samples obtained, combined with the need to process samples at various field stations (to avoid risky transport), made use of microwave ovens impractical. Instead, these samples were melted at room temperature inside their closed bags. Melting the 5 L samples took ∼24–36 h, depending on the exact volume and density of the material. The meltwater was drained periodically and filtered as it was being produced; i.e., filtration was done in steps, as the samples melted, so the total duration of melting does not equate the time any water was left standing in the bags. In the end, the bags were rinsed with Milli-Q water, the rinse water also filtered, and the added water volume accounted for.
All the filters produced from the snow samples were air-dried at room temperature overnight, stored in sterile petri dishes, and later sent to the Department of Environmental Science of Stockholm University. There, EC/WIOC analysis was performed using a Sunset Laboratory carbon aerosol analyzer (Sunset Laboratory Inc., Forest Grove, USA), following the European Supersites for Atmospheric Aerosol Research thermal evolution protocol (EUSAAR_2; Cavalli et al., 2010). One benefit of this protocol is that it minimizes biases in the EC-WIOC split that may be caused by charring and pyrolysis of organic compounds on filters (e.g., Cheng et al., 2014). On each day of measurements, filters prepared with standard sucrose solutions were used to calibrate the instrument for WIOC measurements (e.g., Pantedeliadis et al., 2015). There is presently no corresponding, widely accepted standard for calibration of EC by thermo-optical analysis. However, Svensson et al. (2018) showed, using the same instrument and with the same thermal protocol as used in our study, that predictable and reproducible results can be obtained for filters prepared from diluted aqueous suspensions of NIST-2975 diesel soot or from chimney soot.
For the measurements on our samples, a 1×1 cm2 square section was used from each filter to determine separately the particulate EC and WIOC mass density, or loading, on each filter (, ), from which their mass concentrations in snow (, ) were calculated based on the volume of meltwater filtered, following
where Afilt is the total area of the filter on which particulate matter was collected and Vmeltwater the volume of meltwater filtered.
Calculated values of and are reported in ng EC g−1 snow and ng WIOC g−1 snow, respectively. Blank filters (n=6) had particulate carbon loadings below the limit of detection (LOD) of the carbon analyzer, so no blank correction was applied to the data.
During the first three years of the NPI snow monitoring program in the Ny-Ålesund area and on the glacier Austre Brøggerbreen, the filters had been analyzed on the carbon aerosol analyzer using the NIOSH-5040 thermal protocol (Birch, 2003). Subsequent inter-comparison studies established that this protocol gave values of that were lower than those obtained by the EUSAAR-2 protocol by an average factor of 2 (Cavalli et al., 2010). Therefore, and as discussed earlier in Forsström et al. (2013), these data were later corrected by this factor to homogenize the results with those obtained by the EUSAAR-2 protocol. Since WIOC is hundreds of times more abundant than EC in snow, the correction has a negligible impact on those results, which were left uncorrected.
2.2.2 Methodological uncertainties
Several factors can contribute to uncertainties in TOT analyses of filters produced from melted snow. While some of these were previously investigated and quantified for EC (as discussed below), they remain largely unquantified for WIOC. In the absence of such information, we have used the same estimates of uncertainties pertaining to EC for WIOC, but our confidence in the latter is lower. Some uncertainties in EC quantification arise irrespective of particle composition. These include heterogeneous distribution of EC in the snowpack, loss of particles to container walls, undercatch during filtration, and uneven loading of particles on the filters. The natural variability of in snow at the meter scale due to snowpack heterogeneity (σsh) was previously estimated by Forsström et al. (2009) and by Svensson et al. (2013) in Arctic snow, and we therefore used their results here. The loss of EC particles to glass container walls was experimentally found by Forsström et al. (2009) to be negligible for storage times < 48 h (in a sample containing ∼35 ng g−1 EC). Here, we have assumed this to also be the case for the samples melted in bags, although we acknowledge that losses may occur, which would have a larger impact for samples with very low EC content. We used results from Amaas et al. (2011), Svensson et al. (2013) and Forsström et al. (2013) to estimate the possible effect of filtration undercatch, since these studies used the same methods as our own and were based on double filtration of real snow samples, rather than on “standards” (e.g., diesel soot), which may have properties different than those of actual snow particulates (Torres et al., 2014). The aforementioned studies gave estimates of undercatch that ranged between 18 % and 35 %, with a median of 22 %. Undercatch mostly affects the smallest particles, which contribute little to the total BC particle mass (Lim et al., 2014). Furthermore, the aggregation of particles (BC alone or BC-dust) as snow ages likely modifies their initial size distribution (Schwarz et al., 2012; Svensson et al., 2018). The snow samples analyzed in our study were variously aged and included relatively fresh, near-surface snow and subsurface snow layers which were affected by partial melting–refreezing during winter thaw events (a frequent occurrence on Svalbard). Since we could not quantify how these differences would affect filtration efficiency, we opted not to apply any systematic undercatch corrections to our EC (and WIOC) data.
The uncertainty in EC quantification arising from uneven filter loading (σf) was evaluated from paired measurements on separate 1 cm2 filter sections prepared from the spring 2016 snow survey samples (n=87). The coefficients of variation (CVs) between paired measurements of both and were found to scale up with the particle mass density on the filters. Based on these results, the median value for was 19 % (8 % for ), with an interquartile range of 7 % to 35 % (4 % to 19 % for ). These estimates also account for the carbon analyzer's precision, which contributes to the observed spread of results. By combining the various sources of uncertainty listed above, we estimated a median coefficient of variation (CV) of ∼40 % for both and .
2.2.3 Possible effects of dust in and
A total of 31 snow filters obtained from seven glaciers surveyed in spring 2016 (35 % of samples) were found to have faint to pronounced yellow-pink or grey-brown coloration, likely indicating the presence of k-feldspars and/or oxides which are commonly found in cryoconites, although carbonates may also be present in these filters (see notes in the Supplement dataset).
The presence of mineral dust particles can lead to biases in the separation of EC and WIOC by the thermo-optical method, owing to several competing effects: (a) CO2 released from CC and incorrectly detected as EC, (b) pyrolysis of organic carbon by oxide minerals, which may lead to EC underestimation, and (c) the formation of EC-dust aggregates, which is more likely to occur in aged sub-surface snow than in relatively fresh surface snow (Wang et al., 2012; Lim et al., 2014; Kuchiki et al., 2015).
There are, to our knowledge, no reliable data on the mineral dust content in Svalbard snow, but various published data on trace element analyses suggest typical values between a few tens of ppb (ng g−1) and a few ppm (µg kg−1) based on typical crustal proportions (Casey, 2012; Singh et al., 2015; Thomas et al., 2020). Carbonate minerals are only a minor dust constituent in the wintertime aerosol over Svalbard and thus unlikely to contribute much to deposition in snow (Weinbruch et al., 2012; Moroni et al, 2015). However, carbonates outcrop in many areas of Svalbard (e.g., central Spitsbergen, Brøgger Peninsula) are common constituents in some cryosols (4 % to 37 % mass; Szymański et al., 2015; Hanaka et al., 2019) and are found in cryoconites on at least some Spitsbergen glaciers (Hodson et al., 2010; Langford et al., 2011). Wind-blown dust deflated from local soils or sediments is therefore a potential source of carbonates and other mineral particles in Svalbard snow.
The EUSAAR-2 protocol used in this study minimizes the effect of carbonate minerals by causing CC to evolve into CO2 during the He mode of TOT analysis, thus being detected as WIOC rather than EC (Cavalli et al., 2010). Since WIOC is hundreds of times more abundant than EC, the effect on the measured WIOC concentrations is comparatively very small. Some authors have suggested pre-treatments to remove carbonates on filters (e.g., Evangeliou et al., 2018), but as discussed in Svensson et al. (2018), these treatments may actually raise more issues than they solve, and so they were not applied in our study. Furthermore, some snow samples that were collected early during the NPI snow monitoring program near Ny-Ålesund were tested at Stockholm University for the effect that carbonate removal by acid fumigation had on EC quantification by TOT, but the resulting changes in thermograms were judged to be too minor to justify applying this procedure routinely.
With regards to the effect of oxides, Lim et al. (2014) reported probable artifacts due to such minerals in TOT analyses of alpine snow samples containing 1–10 µg kg−1 of dust but did not give the magnitude of the associated errors in the measured EC and WIOC concentrations, nor did they find any systematic correlation between dust amounts and the presence or absence of such artifacts in TOT thermograms. Hence, at present, there are simply no firm grounds on which to base any error estimates or corrections. This will require dedicated research, which is outside the scope of our paper.
Concerning the effect of EC–dust aggregates, Wang et al. (2012) showed that in snow with >20 ng g−1 EC, the formation of aggregates can lead to underestimation of EC by the TOT method, unless samples are sonicated prior to filtration (sonication, however, may increase filtration undercatch). The largest underestimation found in that study, for a single sample, was 20 % (80 ng g−1 prior to sonication, 100 ng g−1 after). For EC < 20 ng g−1 (all other samples), the effect of sonication (hence, presumably, of aggregates) was negligible. In our own data, EC > 20 ng g−1 occurs in <3 % of glacier samples, but in ∼30 % of snow samples from near Ny-Ålesund (Sverdrup and Gruvebadet sites). The glacier snow samples that produced colored filters were typically found in layers near the base of snowpits, suggesting windblown dust dispersion and deposition in the summer or autumn when the ground is only partially snow-covered. In 11 of the colored filters, the measured was noticeably lower than in filters from snow layers immediately above, and in six filters the was < LOD. This might be due to the effect of dust on TOT measurements, but it is presently impossible to confirm.
2.2.4 Calculation of EC and WIOC loadings
For the snowpits excavated on glaciers in spring 2016, we computed mass loadings of EC () and WIOC () in the seasonal snowpack following
where and are in mg m−2, ρi is the mean density of snow layer i in kg m−3, zi is its thickness in meters, and n is the number of discrete layers. For samples which yielded ng g−1, we assigned a value of 0.5 ng g−1 (half the LOD) in order to compute snowpack loadings (see below). An estimated error on individual density measurements (σρ) of ±6 % was used (Conger and McClung, 2009; Proksch et al., 2016), and the meter-scale variability of snow layer density at spatial scales of 1 to 100 m2 was assumed to be on the order of 5 %, following Koenig et al. (2016). Combining uncertainties in and with these errors yields a median CV of ∼30 % for and (n=22 snowpits).
2.3 Determination of δ18O in snow meltwater
The stable isotope ratio of oxygen (18O:16O) in melted snowpit samples collected in April 2016 was used to detect evidence of warming events associated with large autumn or winter snowfalls, which could help to interpret the and data. The measurements were made at the Institute of Geology of Tallinn's University of Technology, Estonia, using a Picarro model L2120-i water isotope analyzer (Picarro Inc., Sunnyvale, USA) (Lis et al., 2008). Results are reported in the standard delta notation δ18O relative to the Vienna Standard Mean Ocean Water. The analytical precision was ±0.1 ‰.
2.4 Supporting data
2.4.1 Surface meteorological observations
Automated weather stations (AWS) were operated on six glaciers sampled during the April 2016 survey (Table S3). These stations were situated close to the estimated equilibrium line altitude (ELA) of the glaciers and provided hourly recordings of air temperature and ultrasonic soundings of snow surface height changes that were used to interpret snowpit stratigraphic data, in particular the timing of snow accumulation and of snowmelt events. Data from the AWSs were supplemented with records from Longyearbyen and the airport in Ny-Ålesund obtained from the Norwegian Meteorological Institute and from the Polish Polar Station Hornsund (77.00∘ N, 15.11∘ E; 9 m a.s.l.).
2.4.2 Snowpack modeling
Owing to the scarcity of direct precipitation measurements across Svalbard, reconstructing the snowpack accumulation history is challenging, and estimates from snowpits, probing and radar can only fill some of the spatial and temporal gaps. This difficulty can be partly circumvented by using the output of a snowpack model forced with meteorological observations (e.g., Jacobi et al., 2019). In this study, we use a coupled energy balance–snow model (van Pelt et al., 2012), which has recently been employed to investigate glacier and snow conditions across Svalbard (van Pelt et al., 2019). The model includes subroutines for the surface energy balance as well as internal snowpack processes (e.g., densification, melt–freeze events), which makes it possible to simulate the evolution of the seasonal snowpack (thickness and internal structure) for individual 1×1 km grid cells over Svalbard. The snow model routine simulates subsurface density, temperature and water content while accounting for vertical water transport, liquid water storage, refreezing and runoff (Marchenko et al., 2017; Van Pelt et al., 2019). Fresh snow density is described by a temperature- and wind-dependent function (Van Kampenhout et al., 2017), while snow densification is the sum of destructive metamorphism, compaction by overburden pressure and compaction by drifting snow (Vionnet et al., 2012). Snow scouring and redistribution by wind is not accounted for, however. Layered snow properties are modeled with a vertical resolution of 1 cm. The performance of the model was estimated by Van Pelt et al. (2012) by comparing the predicted winter surface mass balance bw with the water-equivalent snow accumulation (hSWE) measured over a network of reference stakes. Across all glaciers, the RMSE was between 0.12 and 0.33 m w.e. and averaged 0.23 m w.e., with a mean bias of zero.
In this paper, we used the model to (1) simulate the snowpack evolution at some of the glacier sites sampled during the spring 2016 survey and (2) quantify the variability of snowfall and snow cover over the Brøgger Peninsula for the period 2008–2018, during which surface snow was sampled for EC and WIOC. For the spring 2016 survey snowpits, simulations were limited to sites located close to or above the local equilibrium line altitude (identified in Table S1). As in van Pelt et al. (2019), the model was forced with downscaled, 3-hourly meteorological fields generated with the High Resolution Limited Area Model (HIRLAM, version 6.4.2; Reistad et al., 2009). Since our objective (1) was to estimate the relative timing of snow accumulation and not absolute snow depth, precipitation at all the modeled glacier sites was locally calibrated (scaled with a factor) to ensure matching between modeled and observed snow depths at the time of observation (April 2016). For objective (2), however, no such adjustments were made.
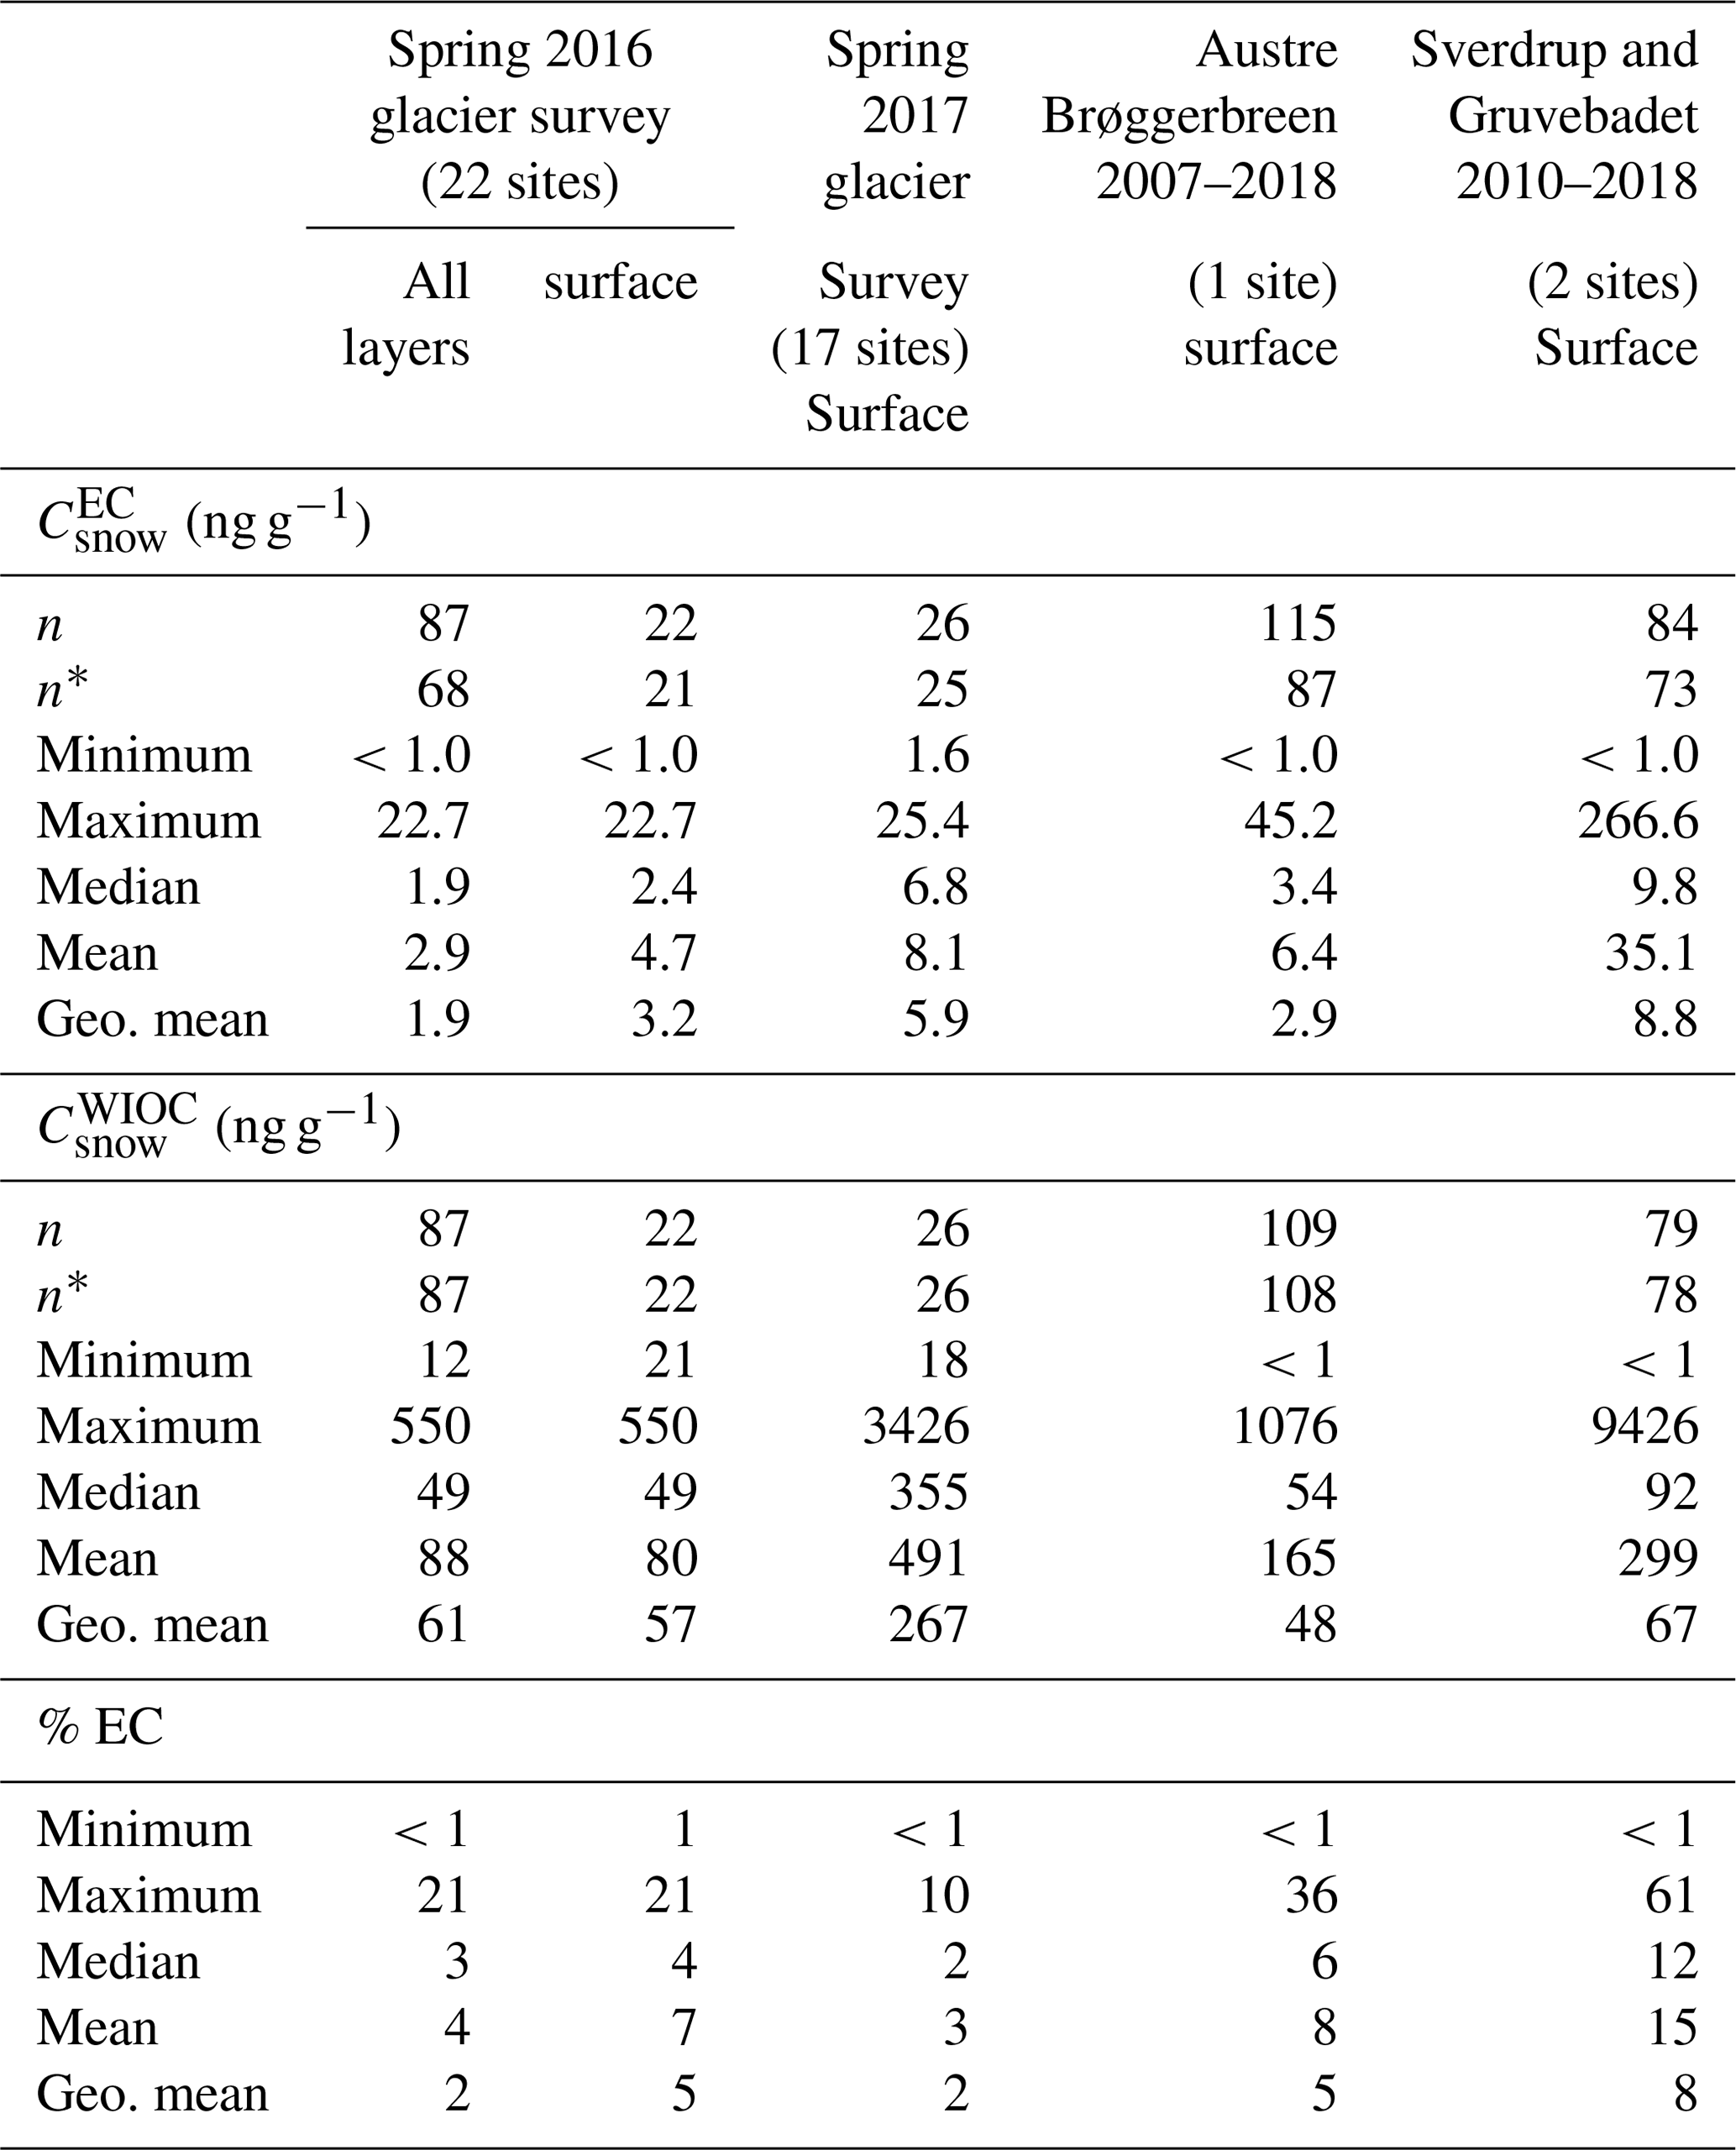
Descriptive statistics of and for all samples analyzed in this study are summarized in Table 3. The probability distributions of and are positively skewed (right-tailed); therefore, we use medians (, ) as measures of their central tendency but also report arithmetic and geometric means for comparisons with other published data. As both and are left-censored by the LOD, the median and mean were estimated by replacing values < 1 ng g−1 with 0.5 × LOD (0.5 ng g−1), following Hornung and Reed (1990), while the geometric mean was estimated by the beta factor method of Ganser and Hewett (2010). Values of and < LOD are, however, included in plots (see below) to provide as complete as possible a description of our data. Overall, ranged from <1.0 to 266.6 ng g−1, while ranged from <1 to 9426 ng g−1. The highest (>50 ng g−1) were measured in spring surface snow near Ny-Ålesund (Sverdrup and Gruvebadet sites). The at these two sites over the period 2007–2018 (9.8 ng g−1) was ∼1.4 to 4.0 times higher than in surface snow layers at glacier sites (2.4–6.8 ng g−1). At most sampling sites, EC accounted for <30 % (most typically, <5 %) of the total mass of particulate carbon (EC + WIOC) in snow, except near Ny-Ålesund, where it accounted for up to 61 %.
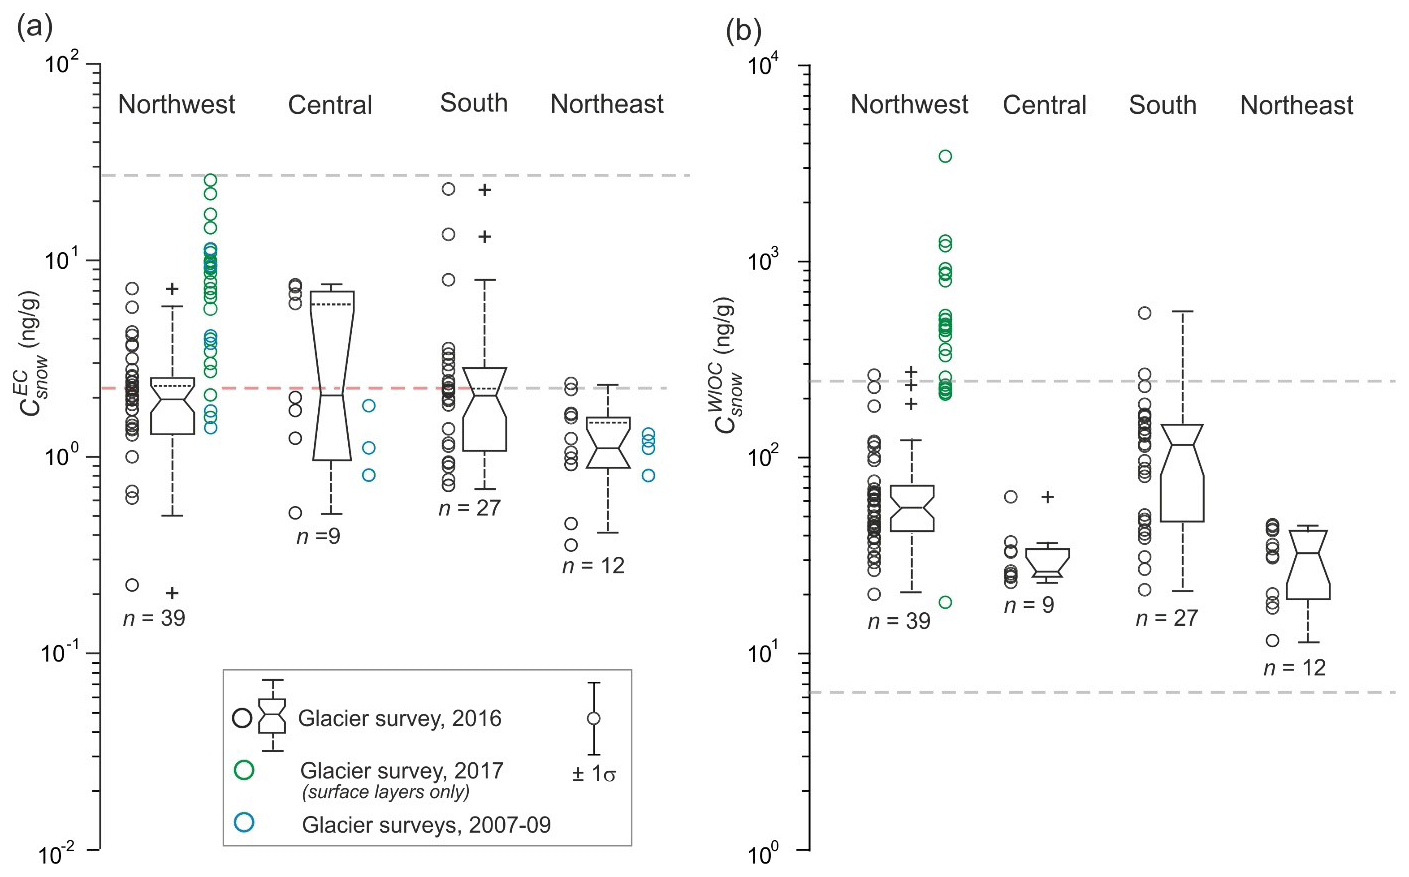
Figure 3Measurements of (a) and (b) on Svalbard glaciers, grouped by geographic sectors (defined in Fig. 2). The box–whisker plots only include measurements from snowpit samples taken on the glaciers surveyed in April 2016. Box heights give the interquartile range, and plus signs (“+”) are outliers. Notches bracket the 95 % confidence limits on the median. The ±1σ error bar in the legend box corresponds to a coefficient of variation of 40 % on individual or values. The dotted horizontal traits shown in some of the box plots are the estimated medians if values < 1 ng g−1 are excluded. Green circles are in surface snow layers sampled on glaciers of northwestern Spitsbergen in 2017 (Table S2), and blue circles are the median values of and in snowpit samples collected on glaciers in 2007–2009 (Forsström et al., 2013). The grey dashed lines bracket the interquartile range of and measured in surface snow layers on the glacier Austre Brøggerbreen, northwestern Spitsbergen, between 2007 and 2018 (this study).
Table 3Descriptive statistics for , and % EC in samples analyzed in this study. n* is the number of values > 1 ng g−1. Two outliers with ng g−1 were excluded from calculations.
3.1 Snow on glaciers, spring 2016 and 2017 surveys
The spatial variations of and across the glacier sites surveyed in spring 2016 are summarized in Figs. 3 and 4. Data from samples collected on glaciers of northwestern Spitsbergen in spring 2017 are shown in these plots for comparison but are limited to surface snow layers. In the spring 2016 snowpack (n=22 sites), ranged from <1.0 to 22.7 ng g−1, with ng g−1, while ranged from 12 to 550 ng g−1, with ng g−1. At nearly all the sites, the in surface layers (top 5–10 cm) was larger than the weighted mean for the whole snowpack (Fig. S4). This was not the case for , which showed no systematic enrichment in surface layers relative to the bulk of the snowpack. In the spring 2016 snowpack, ng g−1 were only found on glaciers of southern Spitsbergen (Hornsund, HB and Werenskioldbreen, WSB; max. 22.8 ng g−1). The snowpack on these two glaciers also had the most snow layers with ng g−1. Comparing the snow surface layers sampled on glaciers in northwestern Spitsbergen in the springs of 2016 (April) and 2017 (April and May) suggests higher springtime EC and WIOC deposition in 2017. On the glacier Kongsvegen (KVG), which was sampled in both years, the and were 4 and 12 times higher in 2017, respectively.
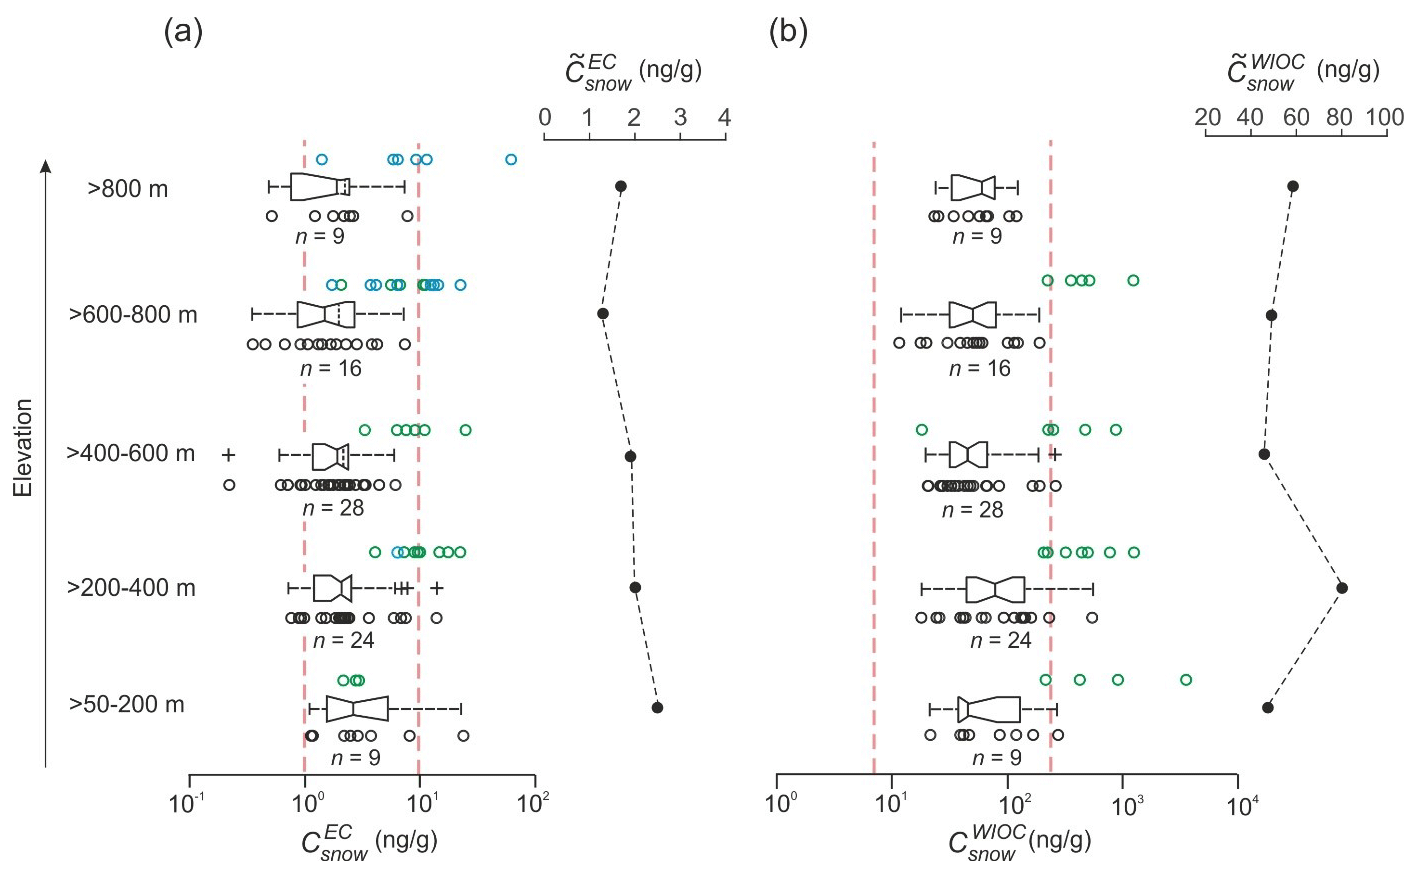
Figure 4Measurements of (a) and (b) on Svalbard glaciers, grouped into discrete elevation bins. Data symbols and box plots are defined as in Fig. 3. Altitudinal profiles of the median values of and (, ) are shown separately on linear scales. Note that the elevations on the latter plots are ordinal only, as and are computed from sample data collected at sites spanning a different range of altitudes within each bin.
No statistically meaningful differences in were found in the spring 2016 snowpack between the northwestern, central and southern sectors of Spitsbergen (Fig. 3, range: 1.1–2.4 ng g−1; Kruskal–Wallis test, p>0.1). However, the snowpack on Austfonna (AF) on the island of Nordaustlandet, northeastern Svalbard, had a significantly lower (1.1 ng g−1) than on glaciers of northwestern and southern Spitsbergen. This held true even if values of ng g−1 were excluded. The in the spring 2016 snowpack were generally lowest on Lomonosovfonna (LF; central Spitsbergen) and on Austfonna (AF) and highest on southern Spitsbergen glaciers (HB and WSB). Binning the 2016 snowpit data by elevation (Fig. 4; 200 m bins) showed no meaningful differences in (2.2–2.8 ng g−1) or (50.3–103.0 ng g−1) over the ∼1100 m altitude range of the 22 glacier sampling sites (Kruskal–Wallis test, p>0.1). The calculated in the spring 2016 snowpack were between 0.1 and 2.6 mg m−2 with a median of 0.7 mg m−2 (mean 0.9 mg m−2), while were between 1.7 and 173.2 mg m−2, with a median of 20.5 mg m−2 (mean 41.2 mg m−2). There were no discernible patterns of variation of or with respect to geographic location, but on most glaciers and/or increased with elevation along with hSWE (see Sect. 4.2.2).
3.2 Surface snow monitoring (2007–2018), Brøgger Peninsula
Variations of and measured in the surface snow of central Brøgger Peninsula between 2007 and 2018 are shown in Fig. 5. In most months, was between 1 and 100 ng g−1 and between 10 and 1000 ng g−1. For years in which snow samples from both the glacier Austre Brøggerbreen (ABG) and Ny-Ålesund were obtained, the range of variations at ABG (: ng g−1; : <1–1076.1 ng g−1) overlapped with that near Ny-Ålesund (: <1–266.5 ng g−1; : <1–7250.3 ng g−1; two outliers excluded; Fig. 5a and b). However, in most years, near Ny-Ålesund was 2–5 times greater than at ABG. Likewise, was frequently 2–3 times larger. There were significant interannual variations in springtime (range: 0.4–8.2 ng g−1) and (range: 1.8–691.4 ng g−1) between 2007 and 2018. The highest and occurred in the spring of 2017 and the lowest in the spring of 2014. Depending on the site, in 2017 was 23–27 times higher than in 2014, and was 146–217 times higher, the largest differences being observed in the snow near Ny-Ålesund. Furthermore, in years in which samples were obtained from both ABG and Ny-Ålesund, the variations were clearly synchronous and coherent at these two sites, which are separated by ∼5.5 km and ∼400 m in elevation (Fig. 5c). The ratio of between Ny-Ålesund and ABG tended to increase with at both sites, as did the ratio of between these sites with (Fig. 5d). The EC/WIOC in snow varied between 0.01 and 0.42, and, in years when the comparison was possible, the variations in springtime EC/WIOC on ABG (2007–2018 median: 0.08) tracked those at Ny-Ålesund (2010–2018 median: 0.10) (Fig. 5e).
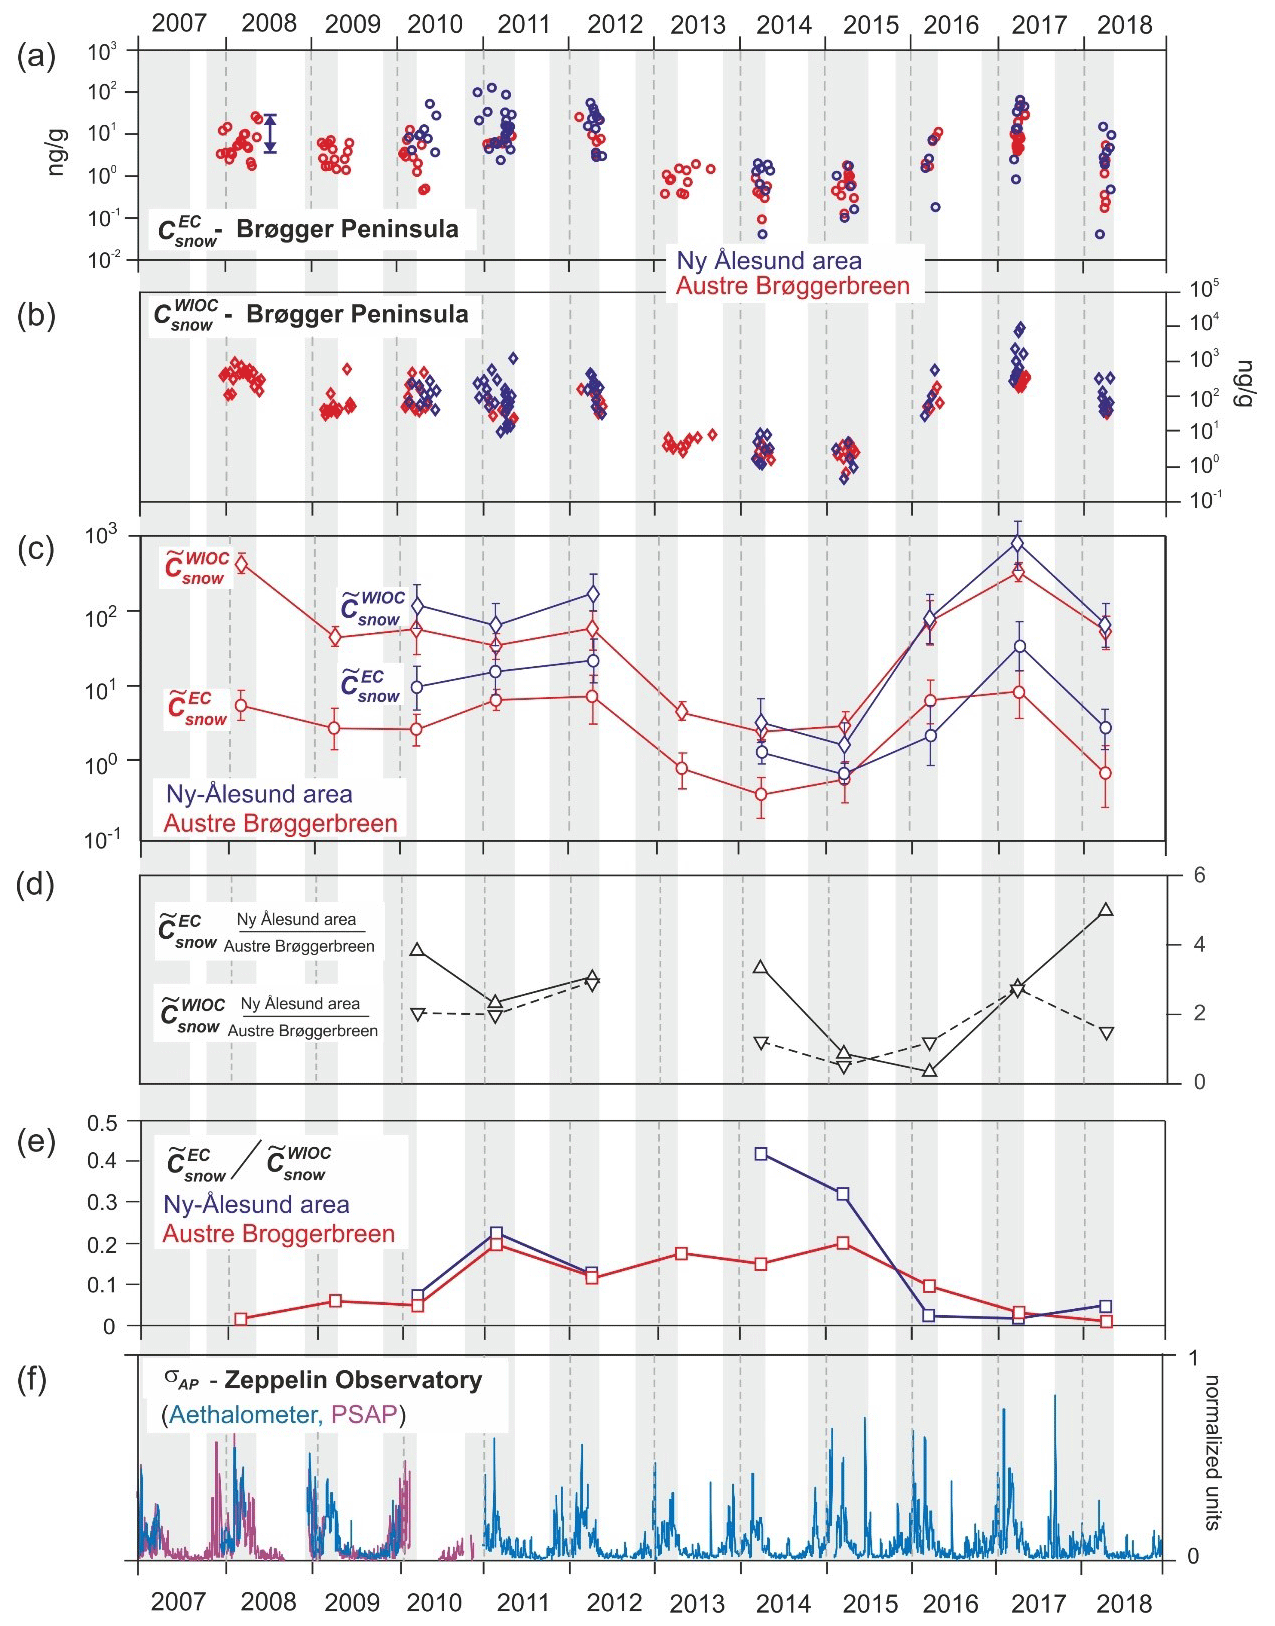
Figure 5(a) and (b) in surface layers on central Brøgger Peninsula, Svalbard, 2008–2018. The double-headed arrow in (a) is the interquartile range of measured near Ny-Ålesund in March 2008 by Aamaas et al. (2011). (c) Median values of the data (, ) near Ny-Ålesund and on Austre Brøggerbreen, with error bars representing 95 % confidence bounds (see text for details). (d) Ratio of (upright triangles) and of (inverted triangles) near Ny-Ålesund and on Austre Brøggerbreen. (e) Ratio between and at these sites. (f) Weekly averages of the BC aerosol absorption coefficient σAP measured by two methods at Zeppelin Observatory (normalized units; Eleftheriadis et al., 2009). The latter data are only shown here to highlight the timing of winter/spring maxima in BC aerosol mixing ratios in the study area.
4.1 Snow on glaciers, spring 2016 and 2017 surveys
4.1.1 Spatial patterns in or
The spring 2016 survey showed no discernible zonal or latitudinal gradient of or across Svalbard. As noted earlier, only on Austfonna (AF) was significantly lower than in some sectors of Spitsbergen. This contrasts with findings from surveys made in the springs of 2007–2009, in which on AF snow was either comparable to, or larger than, that in central or northwestern Spitsbergen (Forsström et al., 2009, 2013). Based on data from sites where direct comparisons with the 2007–2009 surveys are possible, in the seasonal snowpack varies, from year to year, by at least one order of magnitude, and sometimes more (Fig. 3). This was also evident for , but also for , in the surface snow layers sampled on KVG, northwestern Spitsbergen, in springs 2016 and 2017.
Our ability to detect possible spatial patterns in either or across Svalbard is presently limited by (1) the large variability in the observed data in both space and time (spread of individual observations), (2) differences in sampling density across geographic sectors of the archipelago, with central Spitsbergen being under-sampled due to its remoteness, and (3) uncertainties in the TOT method. Limitations due to (1) and (2) above can only be overcome through repeated surveys with a more even spatial coverage. We estimated the possible contribution of the methodological uncertainties to estimates of through a Monte Carlo approach in which surrogate data were generated from the measured in the spring 2016 survey, assuming that the latter have normal distributions of errors with a CV of ±40 %, as discussed above (Sect. 2.2.2). Results (Figs. S5 and S6) showed that in samples (groups of observations) for which the spread of individual measurements of is relatively small, for example that from northeastern Svalbard (Austfonna; AF), the uncertainty in arising from method-related uncertainties is nearly as large as that which results from the overall spread of individual observations (shown as the notches about medians in the boxplots in Fig. 3). In other samples, such as that from central Spitsbergen (Lomonosovfonna; LF), the spread of observations far exceeds the expected uncertainty due to method-related errors. The same result was obtained for , although, as stressed earlier, methodological uncertainties on these data are more poorly constrained than those for . Hence, while reducing methodological uncertainties in the TOT analyses is certainly desirable, it may not be sufficient to confidently detect spatial variations in (or ) across Svalbard without additional data, given the inherent large variability in the snowpack.
4.1.2 Spatial patterns in or
Comparing results of the spring 2016 glacier survey with the 2007–2009 survey results from Forsström et al. (2013) showed that the in the late winter snowpack across Svalbard can vary by at least 2 orders of magnitude between years. For example, at the summit of Holtedahlfonna in northwestern Spitsbergen (site HDF3; elev. 1119 m a.s.l.) was 1.1 mg m−2 in April 2016, which is 70 % lower than the 3.7 mg m−2 calculated in April 2008 at the same location (Forsström et al., 2013). For their part, Ruppel et al. (2017) estimated an annual mean of 10 mg m−2 using snow samples and a firn core from Holtedahlfonna (HDF) spanning ∼8 years (2006–2014). The corresponding mean in the late winter (end April) snowpack could be less than half of this value (∼5 mg m−2), but the high interannual variability in net snow accumulation at this site (Pramanik et al., 2019; Van Pelt and Kohler, 2015) and the uncertainty in the chronology of the firn core make such an estimate tentative at best. Differences between our estimates of and those from the 2007–2009 surveys probably reflect, to a large extent, the variability of atmospheric EC transport and deposition between years and seasons, but also in space (local scale; Svensson et al., 2013).
4.1.3 Variations of and on glaciers with elevation and snow accumulation
The estimated and in the spring 2016 snowpack were generally largest at higher elevations on glaciers, where snow accumulation is greater. For the winter 2015–2016 snowpack, we modeled the relationship between and hSWE across all snowpits by robust least-squares linear regression (Fig. 6a; R2=0.91; RMSE = 0.3). A linear model applied to against hSWE gave a poorer fit (Fig. 6b; R2=0.51; RMSE = 8), owing to the much greater scatter in the data. Total least-squares (“type-2”) regression models were also tested to account for the error in hSWE values arising from the snowpack model uncertainties, and the results were closely comparable. Our calculated for sites with low hSWE, such as those on the lower reaches of glaciers exposed to wintertime katabatic winds, likely underestimate both dry- and wet-deposited EC owing to wind scouring of the snowpack. Nevertheless, the intercept of our linear model for suggests that the contribution of dry deposition to the winter 2015–2016 EC mass accumulation on Svalbard glaciers was likely negligible. In this respect, our findings are consistent with those of Sinha et al. (2018) based on direct observations of BC deposition at Ny-Ålesund in winter 2012–2013, but they contrast with those of Jacobi et al. (2019), who postulated a ∼50 % contribution of BC dry deposition on the glacier Kongsvegen (our site KVG3, elev. 672 m a.s.l.) in spring 2012, using calculations of deposition fluxes constrained by measurements in melted snowpack.

Figure 6Scatterplot of (a) and (b) against hSWE based on measurements from Svalbard glacier snowpits from the April 2016 survey. The vertical error bars are ±1σ and take into account uncertainties in hSWE, , and . The horizontal error bars (±1σ) are based on the RMSE of the values of hSWE predicted by the snow model, relative to field observations (Table 2 in van Pelt et al., 2019). Weighted linear regression models fitted to the data are shown with 95 % confidence bounds.
We applied the linear models for and from Fig. 6 to a map of late winter (30 April) hSWE generated with the snowpack model in order to project the geographic pattern of EC and WIOC accumulation across the whole of Svalbard for the winters 2015–2016 (Fig. 7). The hSWE data used for this purpose were extracted from the output presented in Van Pelt et al. (2019). Summing the predicted values for and across the land grid provides estimates of the total particulate carbon mass that accumulated in the snowpack. The area-averaged loads were 1.1±0.1 mg EC m−2 and 38.3±0.2 mg WIOC m−2. These figures translate to monthly mean accumulation rates of ∼0.1 mg EC m−2 per month and ∼4.8 mg WIOC m−2 per month, respectively, over the period of snow accumulation from 1 September 2015 and 30 April 2016.
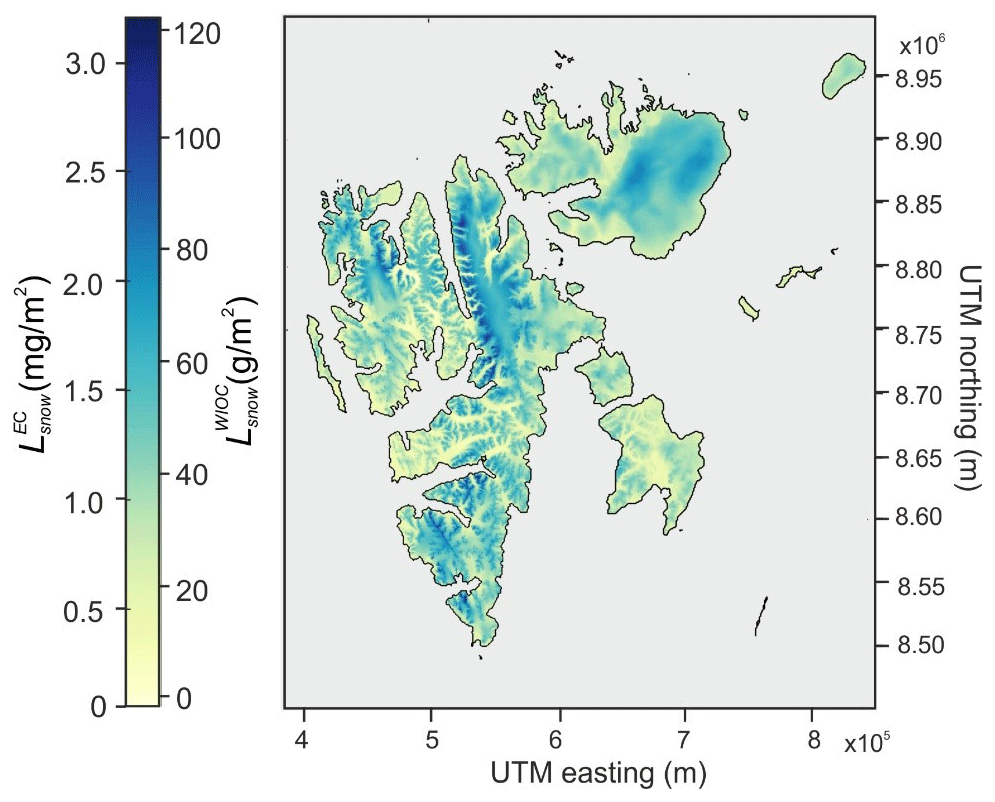
Figure 7Map of the estimated and in the late winter 2015–2016 snowpack over Svalbard, based on the empirical relationships shown in Fig. 6, applied to the map of hSWE between 1 September 2015 and 30 April 2016 generated using the snowpack model (Van Pelt et al., 2019). Note that these maps do not include EC or WIOC deposition in snow from local point sources of pollution around settlements such as Longyearbyen or Ny-Ålesund.
4.1.4 Relative timing of EC and WIOC accumulation on glaciers, winter 2015–2016
Using the snowpack model, we also estimated the relative contributions to and made by each of the snowpack layers sampled in the accumulation zone of the seven glaciers surveyed in spring 2016. The number of layers sampled varied from four on Austre Lovénbreen (ALB3) and Lomonosovfonna (LF3) to seven on Werenskioldbreen (WSB3). On-site surface height soundings by AWSs at several glaciers (Fig. S7) indicate that snow accumulation in the 2015–2016 winter was more or less equally divided between the autumn period, leading to the late December 2015 snowstorm, and the months that followed up to mid/late April 2016, when the snowpits were sampled. The snowpack model simulations, forced with downscaled HIRLAM precipitation data, gave similar results (Fig. 8). The AWSs also show that the December 2015 storm saw winter temperatures on nearly all glaciers rise above 0 ∘C for several days, the warming being largest in southern Spitsbergen. Clear evidence for this was found in a >0.2 m thick icy snow layer at mid depth in the snowpack on Hansbreen (site HB3). The depth of the layer is in good agreement with that predicted by the snowpack model at this site, showing that the simulation provides a reasonable estimate of local surface conditions. Icy layers also occurred in the lower half of the seasonal snowpack on other glaciers, but none of these could be unambiguously ascribed to the late December 2015 storm period.
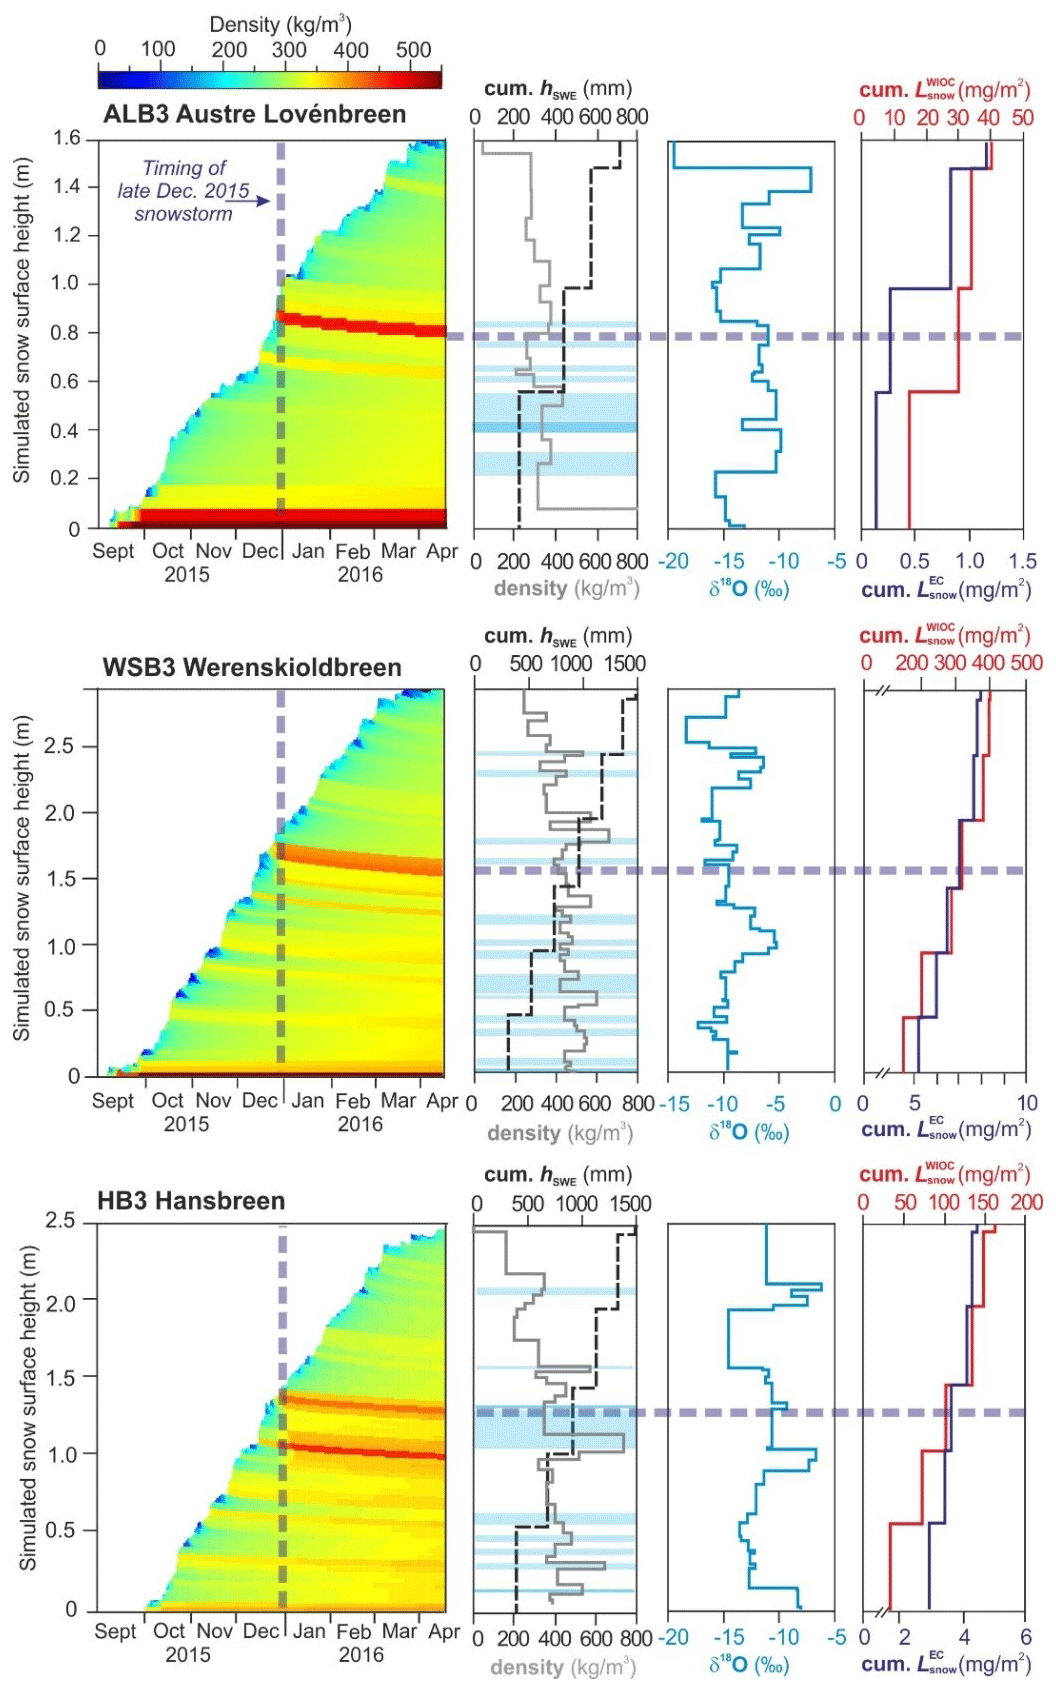
Figure 8Simulated evolution of the snowpack from September 2015 to April 2016 at three glacier sites on Spitsbergen, compared with measured profiles of density, cumulative hSWE, δ18O, as well as cumulative and in the snowpack. The hSWE over the EC and WIOC sampling intervals was computed using the discrete snow layer density data. Where density measurements were missing, values from comparable layers in other snowpits were used. Snow layers with ng g−1 were assigned a value of 0.5 ng g−1 for calculations. Icy snow and discrete ice layers are shown as pale and darker blue lines, respectively.
The relative timing of EC and WIOC accumulation, inferred from the snowpack model chronology, varied considerably between glaciers (Fig. 9). On Austfonna (AF), ∼80 % of the EC and WIOC was found in snow layers estimated to have been deposited in or after December 2015. On glaciers of northwestern and central Spitsbergen (ALB, KVG, HDF and LF), the accumulation sequence was more variable and differed between EC and WIOC. On the glaciers Hansbreen (HB) and Werenskioldbreen (WSB) in southern Spitsbergen, most of the EC and WIOC was contained in the deep layers of the seasonal snowpack, estimated to have been deposited prior to January 2016. Surface meteorological records from the Polish Polar Station Hornsund and from an AWS on WSB show that several large snowfall events occurred in this area during the autumn of 2015, as well as some thaw events (Fig. S7). The stratigraphy of snowpits excavated on HB and WSB in April 2016 also showed clear evidence of melt-freeze events in the early part of the 2015–2016 winter (e.g., site HB3; Fig. 8). Also visible in these snowpits were multiple positive excursions in δ18O (i.e., shifts to less negative values) indicative of snowfall events presumably associated with relatively moist and warm southerly air intrusions over Spitsbergen. Conceivably, the relatively elevated and in the deeper snowpack layers on HB and WSB might have resulted from a few large autumn or early winter snowfall events, as previously observed for wet deposition of , and WIOC on glaciers near Hornsund (Kühnel et al., 2013; Kozioł et al., 2019). Alternatively, or concurrently, meltwater percolation during surface thaws (or rain on snow) may have redistributed or concentrated some of the more hydrophilic EC and WIOC into snow layers near the base of the snowpack (Aamaas et al., 2011; Xu et al., 2012).
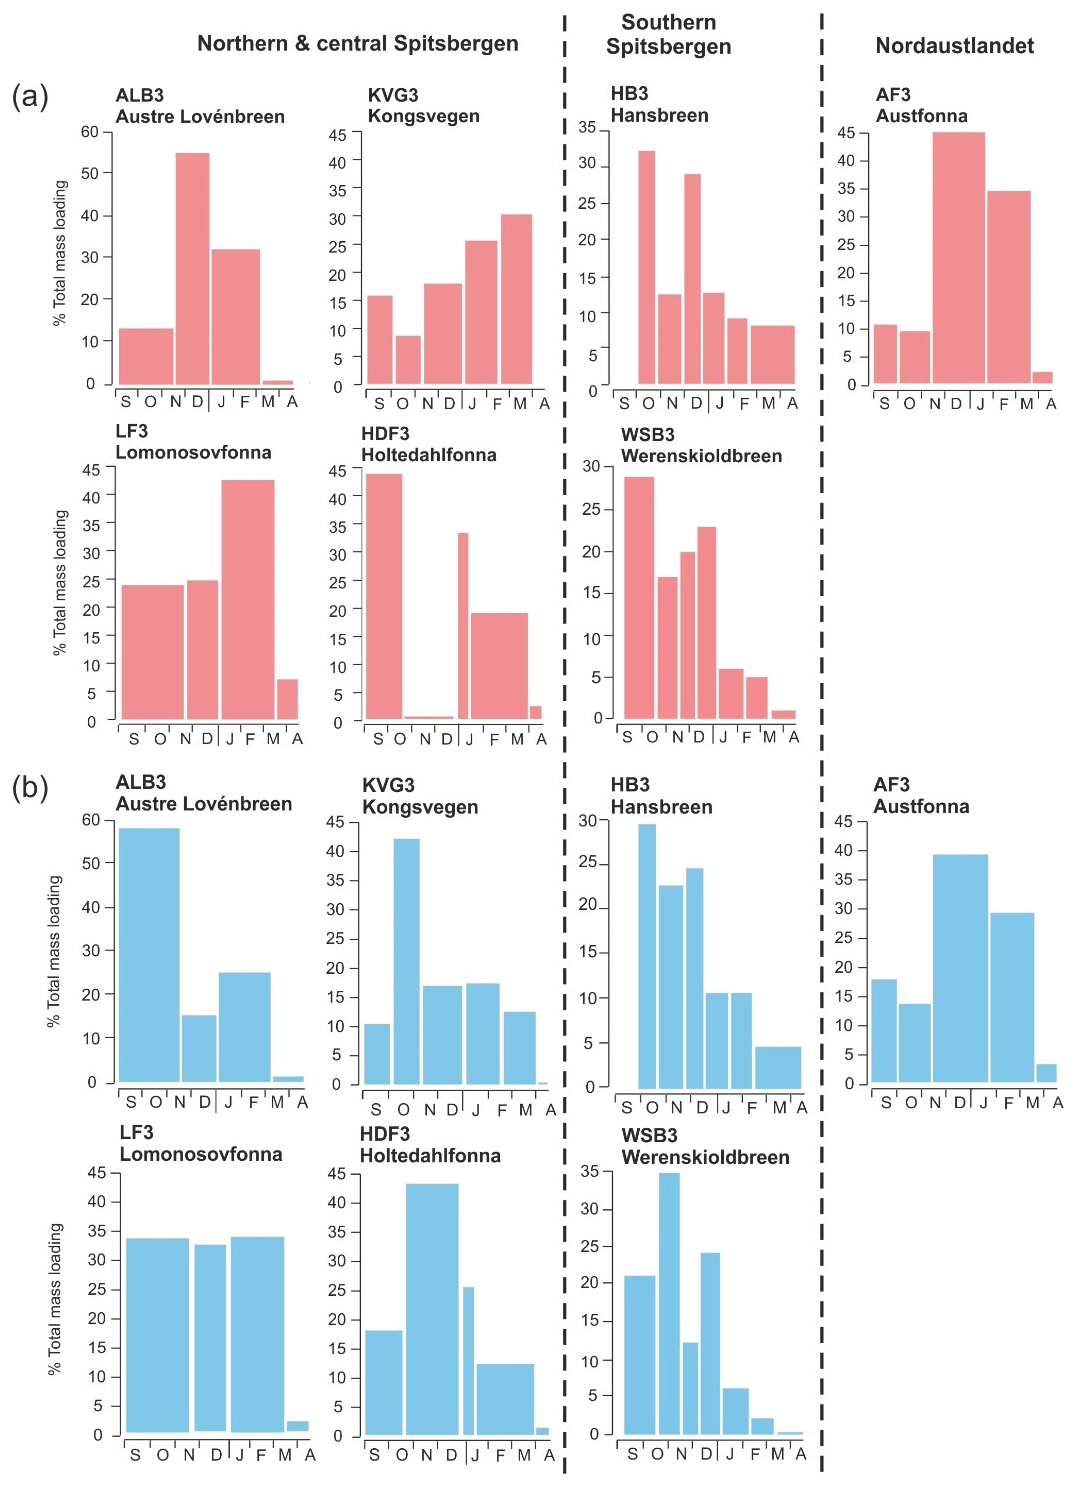
Figure 9Sub-seasonal increments of (a) (red) and (b) (blue) in the accumulation zone of Svalbard glaciers sampled in spring 2016, as estimated using the snowpack model (e.g., Fig. 8).
4.2 Surface snow monitoring (2007–2018), Brøgger Peninsula
Two features of the ∼11-year record of and from Ny-Ålesund and from Austre Brøggerbreen (ABG) (Fig. 5) are noteworthy, in that they reveal some spatio-temporal patterns in the data. One such feature is the mean difference in and between the two sites (as noted in Sect. 3.2); the other is the synchronous interannual variations in and at both sites. The generally higher and near Ny-Ålesund compared to ABG suggests that a gradient in atmospheric EC and WIOC deposition exists between these sites in late winter and spring, which may be a function of relative distance from the coast and/or elevation, Ny-Ålesund and ABG being separated by ∼5.5 horizontal kilometers and an altitude difference of ∼400 m. One plausible explanation for such a gradient is that, owing to its greater remoteness, the accumulation area of ABG is less influenced by local aerosol emissions from Ny-Ålesund (EC and WIOC) or from coastal waters (WIOC). This was in fact the rationale for the choice of Zeppelin Mountain (474 m a.s.l.) as the site for a permanent atmospheric observatory (Braathen et al., 1990). The diesel-fueled power plant in Ny-Ålesund is a candidate source of EC and semi-volatile organic compounds (precursors for WIOC), as is wintertime vehicular traffic of cars, snowmobiles, and aircrafts (Shears et al., 1998; Robinson et al., 2007; Dekhtyareva et al., 2016). In a previous survey in April 2008, Aamaas et al. (2011) could find no detectable local EC pollution in coastal snow within 20 km of Ny-Ålesund, although none was sampled downwind of the settlement. Our data, however, suggest that that winter/spring surface snow near Ny-Ålesund is commonly enriched in EC when compared to snow deposited higher up on ABG. If locally emitted dust (e.g., mobilized by road traffic in or near the town) caused under-estimation of EC in local snow due to dust-BC aggregates being formed, then the difference between the median EC in snow near Ny-Ålesund and that in snow at Austre Brøggerbreen may in fact be larger than we surmised. Ice-free open water areas or frost flowers on sea ice are also potential sources of particulate WIOC (e.g., microbes, diatoms, plankton, exopolymers from biofilms) during autumn and winter, some of which are likely deposited in snow by settling or through ice nucleation (Bowman and Deming, 2010; Campbell et al., 2018; Karl et al., 2019). Stable inversion layers established by strong surface radiative cooling could trap aerosols emitted from Ny-Ålesund itself or from nearby open waters or sea ice, leading to enhanced concentrations of these aerosols in coastal surface snow during these periods. The frequent occurrence of near-surface temperature inversions below ∼500 m in winter and spring months was previously shown to enhance the concentration of airborne sulfate aerosols (from fuel combustion and/or marine sources) in Ny-Ålesund relative to the Zeppelin Observatory (Dekhtyareva et al., 2018). It thus seems plausible that a similar effect may apply to EC and WIOC aerosols. If a gradient in EC and WIOC deposition to snow does exist between Ny-Ålesund and ABC, it would not necessarily persist in all winter or spring months. For example, Aamaas et al. (2011) measured a of 6.6 ng g−1 near Ny-Ålesund in March 2008, which was very close to the mean of 6.3 ng −1 on ABG snow during the same month.
Coherent interannual variations in and between Ny-Ålesund and the accumulation area of ABG (Fig. 5c) were described in Sect. 3.2. The amplitude of these variations was frequently larger than the uncertainty of medians for individual seasons (estimated using the same Monte Carlo approach described in Sect. 4.1.1). It thus seems unlikely that such a coherent pattern arose by chance alone, e.g., owing to random methodological errors. Several possible explanations could account for it. One is that year-to-year variations in springtime long-range transport and deposition of EC and WIOC aerosols in this part of the Brøgger Peninsula impact the surface snow chemistry in Ny-Ålesund and at ABG in a similar way. Another is that in some years, local meteorological conditions promote more efficient dispersion and/or scavenging of aerosols emitted from Ny-Ålesund (EC and WIOC) and nearby coastal waters (WIOC), such that deposition in surface snow layers is enhanced at both Ny-Ålesund and ABG simultaneously. These two explanations are not mutually exclusive. However, the mean springtime ratio of between Ny-Ålesund and ABG was observed to increase in years with relatively higher , as did the ratio of between the two sites in years with higher (Fig. 5d). This argues against the temporal variations being due to interannual changes in the mean thickness of the springtime atmospheric boundary layer, since if this were the case, one would expect the differences of and to decrease, not increase, in years when more aerosols from low-level sources reach up to ABG, as was clearly not the case.
The median EC/WIOC in snow at Ny-Ålesund and ABG was <0.10 prior to 2010 but rose to 0.43 and 0.20, respectively, in 2015, and declined after 2016 (Fig. 5e). The seasons with the highest median EC/WIOC (2013–2015) were also those with lowest and , which suggests that meteorological and/or other conditions prevailed in these seasons, which limited atmospheric deposition of WIOC and EC in snow, WIOC being more affected than EC. Possible causal factors include sea-ice cover or sea-surface winds, which partly modulate emissions of marine organic aerosol (e.g., Kirpes et al., 2019), or katabatic winds from Kongsfjorden, which can affect the thermal stratification of boundary layer air in winter months (Esau and Repina, 2012; Maturilli and Kayser, 2017).
Between 2008 and 2018 (the years in which snow sampling was most thorough), on the Brøgger Peninsula varied by up to 35 ng g−1 and by up to 689 ng g−1. However, there were no significant trends in either or over the whole period (Mann–Kendall test; p≫0.05). Data from the spring 2016 glacier survey (Fig. 6) as well as previous studies (Bourgeois and Bey, 2011; Browse et al., 2012) suggest that wet deposition is the predominant mode of BC deposition in Arctic snow. To investigate the possible role of snowfall in BC deposition on the Brøgger Peninsula, we compared in surface layers for March, April and May (MAM) 2008–2018 with simulated monthly snowfall anomalies over this region over the same period. However, no significant correlation was found.
4.3 Comparison of in a pan-Arctic perspective
Figure 10 shows the range of in winter/spring Svalbard snow measured in this study, compared with data from other circum-Arctic or subarctic sites sampled between 2005 and 2018 (see figure caption for data sources). All data in this comparison were obtained by thermo-optical measurements on snow filters using either the NIOSH-5040 or EUSAAR-2 protocols (Table S4). The data obtained by the NIOSH-5040 were multiplied by a factor of 2, as discussed earlier (Sect. 2.2.1). Laboratory-specific variations in the analytical protocols between studies could still account for some of the inter-site differences shown in Fig. 10. An indication of the possible spread of results that could arise from such variations is shown in the figure, based on method intercomparison studies by Panteliadis et al. (2015) and Bautista et al. (2015) for EC in aerosols.
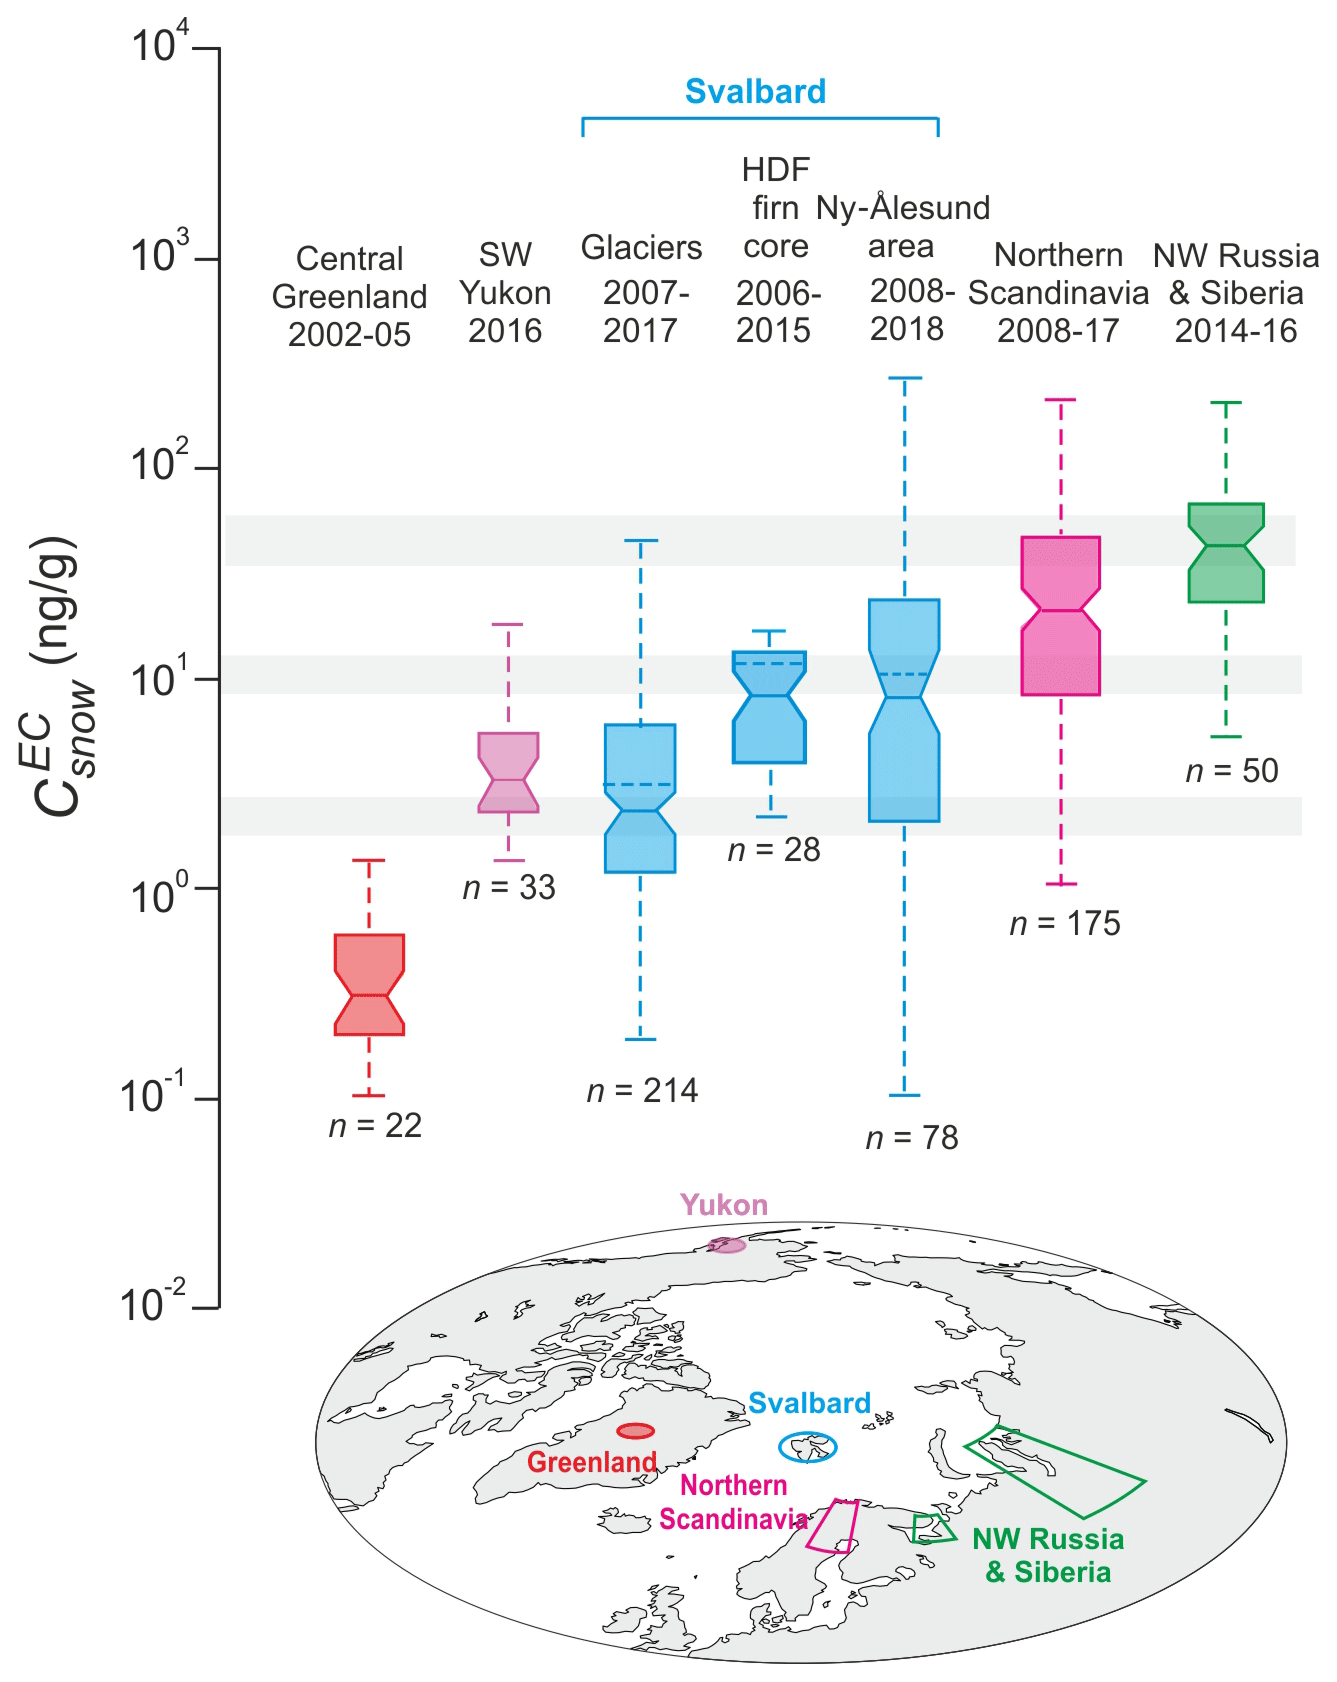
Figure 10Variations of in snow across circum-Arctic sites, color-coded by region. Only data obtained by thermo-optical analysis using either the NIOSH 5040 or EUSAAR_2 protocols are included (see Table S4). The box–whisker plots are as defined in Fig. 3, but outliers were removed for clarity. The plot “Glaciers 2007–2017” combines all glacier snowpack data from the present study as well as from earlier glacier surveys by Forsström et al. (2009, 2013). The plot “HDF firn core” is based on the analysis of a firn core from Holtedahlfonna (Ruppel et al., 2017), and the plot “Ny-Ålesund area” is based on the surface snow data presented in Fig. 5 of the present study. Other data sources are Greenland: Hagler et al. (2007); northern Scandinavia: Forsström et al. (2013), Ingvander et al. (2013), Meinander et al. (2013), Svensson et al. (2013, 2018), and unpublished data (Table S5); Russia and Siberia: Evangeliou et al. (2018); and Yukon: unpublished data (Table S5). Data from Greenland and the Yukon span 3–6 years of accumulation in snow, while the Holtedahlfonna firn core spans an estimated ∼8 years (2006–2014). The shaded grey bars indicate, for different median values of , the estimated spread (interquartile range) of results that might arise from methodological differences in the TOT analyses between studies.
The pattern of EC distribution in winter/spring snow across the circum-Arctic shows the lowest in central Greenland (<1 ng g−1) and the highest in northern mainland Scandinavia (∼15–30 ng g−1 depending on site) and in northwestern Russia and central Siberia (35–66 ng g−1). The in Svalbard snow fall within these extremes.
Previously, pan-Arctic-scale surveys of BC in snow were conducted between 2007 and 2009 (Doherty et al., 2010) and between 2012 and 2016 (Mori et al., 2019). In the 2007–2009 survey, the mass concentrations of BC in snow (denoted ) was estimated optically by absorption spectrophotometry performed on filters (integrating sphere/integrating sandwich method; Grenfell et al., 2011), while in the 2012–2016 surveys, the mass concentration of refractory BC (denoted CMBC) was measured by laser-induced incandescence using a Single Particle Soot Photometer (SP2; Stephens et al., 2003). An error analysis by Doherty et al. (2010) indicated that individual measurements of were subject to total uncertainties < 50 %, while Mori et al. (2019) estimated a mean uncertainty of ±20 % in individual values of CMBC, based on results of reproducibility tests. As in the present study, the uncertainty of reported median values for groups of samples in any given region are expected to be considerably less than that of individual measurements. Irrespective of the methods used, results from the 2007–2009 and 2012–2016 surveys both showed that the highest BC concentrations in Arctic snow were found in northwestern Russia and Siberia, followed by northern mainland Scandinavia, and the lowest occurred in central Greenland, while concentrations in Svalbard fell between those in these regions (see Fig. 1 in Mori et al., 2019, and Fig. 2 in Dou and Xiao, 2016). Thus, the spatial pattern of shown in our data compilation (Fig. 10) is in broad agreement with findings from earlier surveys made within the past 2 decades.
We have presented a large dataset of observations of atmospheric EC and WIOC deposited in snow on the archipelago of Svalbard, made between 2007 and 2018. These data will contribute to augment the existing body of observational data presently available for the validation of long-range transport and deposition models of BC in Arctic snow (Torseth et al., 2019). The spatial snow survey conducted across 22 glacier sites in spring 2016 was one of the most extensive and detailed carried out on Svalbard and allows direct comparisons with the surveys by Forsström et al. (2009, 2013), made nearly 10 years earlier. Across all glacier sites, in the snowpack ranged from <1.0 to 22.7 ng g−1 (median 1.9 ng g−1), while ranged from 12 to 550 ng g−1 (median 49 ng g−1). The calculated were between 0.1 and 2.6 mg m−2 (median 0.7 mg m−2), while were between 2 and 173 mg m−2 (median 20 mg m−2). The and in 2016 were comparable or lower than those found in spring 2007–2009 glacier snow, but no clear spatial gradients could be identified across the archipelago. Both and were found to increase with elevation and hSWE. Using these relationships, we estimated the area-averaged accumulation of EC and WIOC over the whole of Svalbard to be ∼0.1 mg EC m−2 and ∼3.8 mg WIOC m−2 for winter 2015–2016 (September to April). The relationship between and hSWE also points to dry EC deposition in snow being minor compared to wet deposition. The accumulation of EC and WIOC in the snowpack was inferred to be equally distributed over winter 2015–2016 at most glacier sites.
The set of EC and WIOC measurements made in surface snow on the Brøgger Peninsula in 2007–2018 is one of the longest such datasets available from the Arctic. During this period, the range of and near Ny-Ålesund (50 m a.s.l.) overlapped with that at Austre Brøggerbreen (456 m a.s.l.). However, and near Ny-Ålesund were, in most years, ∼2–5 times higher than on Austre Brøggerbreen, which suggests the existence of a seasonal gradient in EC and WIOC deposition between these sites. While no long-term trends were detected over the period 2007–2018, and showed synchronous interannual variations between the snow sampling sites, the largest ones occurring near Ny-Ålesund. Further investigations of winter/spring micro- to meso-scale meteorological conditions are needed to clarify what the apparent gradient and synchronous variations in and between Ny-Ålesund and Austre Brøggerbreen might imply about the dynamics of atmospheric EC and WIOC deposition in snow at these sites. Simultaneous measurements of BC in air and falling snow at both sites might also provide answers. Extending the surface snow monitoring program for EC and WIOC on Austre Brøggerbreen would allow us to test the robustness of the findings presented here. Finally, we note that the methodological uncertainties in the determination of remain poorly constrained compared to those for , and this needs to be addressed in future dedicated studies.
The data presented in this article can be downloaded from https://doi.org/10.1594/PANGAEA.918134 (Gallet et al., 2020).
The supplement related to this article is available online at: https://doi.org/10.5194/acp-21-3035-2021-supplement.
JCG, MB, CL, BL, TS, CZ and others initiated the April 2016 survey. JCG oversaw the snow sampling program on Brøgger Peninsula. UL and JC performed the EC and WIOC analyses and TM the δ18O analyses. WvP carried out the snow model simulations. CZ wrote the manuscript, with contributions from all the co-authors.
The authors declare that they have no conflict of interest.
Logistical support for fieldwork in 2016 was provided by NPI, the University of Oslo, the Swedish Research Council and the Swedish Polar Secretariat, the Ice and Climate and the Environment research group at Uppsala University, the Institute of Geophysics of the Polish Academy of Sciences (PAS) and the Centre for Polar Studies at the University of Silesia (USi). Aleksander Uszczyk (USi), Dariusz Ignatiuk (Svalbard Integrated Arctic Earth Observing System), Mariusz Grabiec and Daniel Kępski (PAS) participated in the snow sampling work near Hornsund.
The April 2016 survey on Svalbard was funded through a grant from the Svalbard Science Forum (RIS 10472) to Jean-Charles Gallet and others, and surface snow monitoring on Brøgger Peninsula was conducted by the Norwegian Polar Institute (NPI) with additional support from Svalbardmiljøfonds, the Swedish Research Council Formas project “Black and White” (grant 2006-00210 to Johan Ström and others), the Polish Ministry of Science and Higher Education (statutory activities 3841/E-41/S/2020), and the Institut Paul-Emile Victor (France). Planning and collaborative work between the study co-authors was facilitated by funds from the Swedish Strategic Research Area initiative “Biodiversity and Ecosystem services in a Changing Climate” through Gothenburg University, the Gothenburg Air and Climate Network and the International Arctic Science Committee.
This paper was edited by Andreas Petzold and reviewed by two anonymous referees.
Aamaas, B., Bøggild, C. E., Stordal, F., Berntsen, T., Holmén, K., and Ström, J.: Elemental carbon deposition to Svalbard snow from Norwegian settlements and long-range transport, Tellus B, 63, 340–351, https://doi.org/10.1111/j.1600-0889.2011.00531.x, 2011.
AMAP: AMAP Assessment 2015: Black carbon and ozone as Arctic climate forcers, AMAP – Arctic Monitoring and Assessment Programme, Oslo, Norway, vii + 116 pp., 2015.
Bautista VII, A. T., Pabroa, P. C. B., Santos, F. L., Quirit, L. L., Asis, J. L. B., Dy, M. A. K., and Martinez, J. P. G.: Intercomparison between NIOSH, IMPROVE_A, and EUSAAR_2 protocols: Finding an optimal thermal–optical protocol for Philippines OC/EC samples, Atmos. Poll. Res., 6, 334–342, https://doi.org/10.5094/APR.2015.037, 2015.
Binder, H., Boettcher, M., Grams, C. M., Joos, H., Pfahl, S., and Wernli, H.: Exceptional air mass transport and dynamical drivers of an extreme wintertime Arctic warm event, Geophys. Res. Lett., 44, 12028–12036, https://doi.org/10.1002/2017GL075841, 2017.
Birch, M. E.: Diesel particulate matter (as elemental carbon): Method 5040, NIOSH Man. Occup. Saf. Health, 3, 1–5, 2003.
Bond, T. C., Doherty, S. J., Fahey, D. W., Forster, P. M., Berntsen, T., DeAngelo, B. J., Flanner, M. G., Ghan, S., Kärcher, B., Koch, D., Kinne, S., Kondo, Y., Quinn, P. K., Sarofim, M. C., Schultz, M. G., Schulz, M., Venkataraman, C., Zhang, H., Zhang, S., Bellouin, N., Guttikunda, S. K., Hopke, P. K., Jacobson, M. Z., Kaiser, J. W., Klimont, Z., Lohmann, U., Schwarz, J. P., Shindell, D., Storelvmo, T., Warren, S. G., and Zender, C. S.: Bounding the role of black carbon in the climate system: A scientific assessment, J. Geophys. Res.-Atmos., 118, 5380–5552, https://doi.org/10.1002/jgrd.50171, 2013.
Bourgeois, Q. and Bey, I.: Pollution transport efficiency toward the Arctic: Sensitivity to aerosol scavenging and source regions, J. Geophys. Res., 116, D08213, https://doi.org/10.1029/2010JD015096, 2011.
Bowman, D. S. and Deming, J. W.: Elevated bacterial abundance and exopolymers in saline frost flowers and implications for atmospheric chemistry and microbial dispersal, Geophys. Res. Lett., 37, L13501, https://doi.org/10.1029/2010GL043020, 2010.
Braathen, G. O., Hov Ø., and Stordal, F: Arctic atmospheric research station on the Zeppelin mountain (474 m a.s.l.) near Ny-Ålesund on Svalbard (78∘54′29′′ N, 11∘52′53′′ E), Norwegian Institute for Air Research, Lillestrøm, 1990.
Browse, J., Carslaw, K. S., Arnold, S. R., Pringle, K., and Boucher, O.: The scavenging processes controlling the seasonal cycle in Arctic sulphate and black carbon aerosol, Atmos. Chem. Phys., 12, 6775–6798, https://doi.org/10.5194/acp-12-6775-2012, 2012.
Campbell, K., Muncy, C. J., Belzile, C., Delaforge, A., and Rysgaard, S.: Seasonal dynamics of algal and bacterial communities in Arctic sea ice under variable snow cover, Polar Biol., 41, 41–58, https://doi.org/10.1007/s00300-017-2168-2, 2018.
Casey, K. A.: Geochemical composition of surface snow, ice and debris from glaciers in Norway, Nepal and New Zealand, PANGAEA, https://doi.org/10.1594/PANGAEA.773951, 2012.
Cavalli, F., Viana, M., Yttri, K. E., Genberg, J., and Putaud, J.-P.: Toward a standardised thermal-optical protocol for measuring atmospheric organic and elemental carbon: the EUSAAR protocol, Atmos. Meas. Tech., 3, 79–89, https://doi.org/10.5194/amt-3-79-2010, 2010.
Cheng, Y., Hea, K.-B., Duana, F.-K., Du, Z.-L., Zheng, M., and Ma, Y.-L.: Ambient organic carbon to elemental carbon ratios: Influence of the thermal–optical temperature protocol and implications, Sci. Total Environ., 468–469, 1103–1111, https://doi.org/10.1016/j.scitotenv.2013.08.084, 2014.
Conger, S. M. and McClung, D. M.: Comparison of density cutters for snow profile observations, J. Glaciol., 55, 163–169, https://doi.org/10.3189/002214309788609038, 2009.
Dee, D. P., Uppala, S. M., Simmons, A. J., Berrisford, P., Poli, P., Kobayashi, S., Andrae, U., Balmaseda, M. A., Balsamo, G., Bauer, P., Bechtold, P., Beljaars, A. C. M., van de Berg, L., Bidlot, J., Bormann, N., Delsol, C., Dragani, R., Fuentes, M., Geer, A. J., Haimberger, L., Healy, S. B., Hersbach, H., Hólm, E. V., Isaksen, L., Kållberg, P., Köhler, M., Matricardi, M., McNally, A. P., Monge-Sanz, B. M., Morcrette, J.-J., Park, B.-K., Peubey, C., de Rosnay, P., Tavolato, C., Thépaut, J.-N., and Vitart, F.: The ERA-Interim reanalysis: configuration and performance of the data assimilation system, Q. J. Roy. Meteorol. Soc., 137, 553–597, https://doi.org/10.1002/qj.828, 2011.
Dekhtyareva, A., Edvardsen, K., Holmén, K., Hermansen, O., and Hansson, H.-C.: Influence of local and regional air pollution on atmospheric measurements In Ny-Ålesund, Int. J. Sustain. Dev. Plan., 11, 578–587, https://doi.org/10.2495/SDP-V11-N4-578-587, 2016.
Dekhtyareva, A., Holmén, K., Maturilli, M., Hermansend, O., and Graversen, R.: Effect of seasonal mesoscale and microscale meteorological conditions in Ny-Ålesund on results of monitoring of long-range transported pollution, Polar Res., 37, 1508196, https://doi.org/10.1080/17518369.2018.1508196, 2018.
Doherty, S. J., Warren, S. G., Grenfell, T. C., Clarke, A. D., and Brandt, R. E.: Light-absorbing impurities in Arctic snow, Atmos. Chem. Phys., 10, 11647–11680, https://doi.org/10.5194/acp-10-11647-2010, 2010.
Dou, T.-F. and Xiao, C.-D.: An overview of black carbon deposition and its radiative forcing over the Arctic, Adv. Clim. Change Res., 7, 115–122, https://doi.org/10.1016/j.accre.2016.10.003, 2016.
Eleftheriadis, K., Vratolis, S., and Nyeki, S.: Aerosol black carbon in the European Arctic: Measurements at Zeppelin station, Ny-Ålesund, Svalbard from 1998–2007, Geophys. Res. Lett., 36, L02809, https://doi.org/10.1029/2008GL035741, 2009.
Esau, I. and Repina, I.: Wind climate in Kongsfjorden, Svalbard, and attribution of leading wind driving mechanisms through turbulence-resolving simulations, Adv. Meteorol., 2012, 568454, https://doi.org/10.1155/2012/568454, 2012.
Esau, I. and Sorokina, S.: Climatology of the Arctic planetary boundary layer, in: Atmospheric Turbulence, Meteorological Modeling and Aerodynamics, edited by: Lang, P. R. and Lombargo, F. S., Nova Science Publishers, New York, 3–58, 2009.
Evangeliou, N., Shevchenko, V. P., Yttri, K. E., Eckhardt, S., Sollum, E., Pokrovsky, O. S., Kobelev, V. O., Korobov, V. B., Lobanov, A. A., Starodymova, D. P., Vorobiev, S. N., Thompson, R. L., and Stohl, A.: Origin of elemental carbon in snow from western Siberia and northwestern European Russia during winter–spring 2014, 2015 and 2016, Atmos. Chem. Phys., 18, 963–977, https://doi.org/10.5194/acp-18-963-2018, 2018.
Forsström, S., Ström, J., Pedersen, J. C. A., Isaksson, E., and Gerland, S.: Elemental carbon distribution in Svalbard snow, J. Geophys. Res.-Atmos. 114, D19112, https://doi.org/10.1029/2008JD011480, 2009.
Forsström, S., Isaksson, E., Skeie, R. B., Ström, J., Pedersen, C. A., Hudson, S. R., Berntsen, T. K., Lihavainen, H., Godtliebsen, F., and Gerland, S.: Elemental carbon measurements in European Arctic snow packs, J. Geophys. Res.-Atmos., 118, 13614–13627, https://doi.org/10.1002/2013JD019886, 2013.
Gallet, J. C., Björkman, M. P., Larose, C., Luks, B., Martma, T., and Zdanowicz, C.: Protocols and recommendations for the measurement of snow physical properties, and sampling of snow for black carbon, water isotopes, major ions and microorganisms, Short Report 46, Norwegian Polar Institute, Tromsø, p. 29, 2018.
Gallet, J.-C., Zdanowicz, C., Björkman, M. P, Larose, C., Schuler, T. V.. Luks, B., Koziol, K., Spolaor, A., Barbaro, E., Martma, T., Wideqvist, U., and Ström, J.: Particulate organic and elemental carbon in Svalbard snow, 2007–18, PANGAEA, https://doi.org/10.1594/PANGAEA.918134, 2020.
Ganser, G. H. and Hewett, P.: An accurate substitution method for analyzing censored data, J. Occup. Environ. Hyg., 7, 233–244, https://doi.org/10.1080/15459621003609713, 2010.
Grenfell, T. C., Doherty, S. J., Clarke, A. D., and Warren, S. G.: Light absorption from particulate impurities in snow and ice determined by spectrophotometric analysis of filters, Appl. Optics, 50, 2037–2048, https://doi.org/10.1364/AO.50.002037, 2011.
Hagler, G. S. W., Bergin, M. H., Smith, E. A., Dibb, J. E., Anderson, C., and Steig, E. J.: Particulate and water-soluble carbon measured in recent snow at Summit, Greenland, Geophys. Res. Lett., 34, L16505, https://doi.org/10.1029/2007GL030110, 2007.
Hanaka, A., Plak, A., Zagórski, P., Ozimek, E., Rysiak, A., Majewska, M., and Jaroszuk-Ściseł, J.: Relationships between the properties of Spitsbergen soil, number and biodiversity of rhizosphere microorganisms, and heavy metal concentration in selected plant species, Plant Soil, 436, 49–69, https://doi.org/10.1007/s11104-018-3871-7, 2019.
Hodson, A., Cameron, K., Bøggild, C., Irvine-Fynn, T., Langford, H., Pearce, D., and Banwart, S.: The structure, biological activity and biogeochemistry of cryoconite aggregates upon an Arctic valley glacier: Longyearbreen, Svalbard, J. Glaciol., 56, 349–362, https://doi.org/10.3189/002214310791968403, 2010.
Hornung, R. W. and Reed, L. D.: Estimation of average concentration in the presence of nondetectable values, Appl. Occup. Environ. Hyg., 5, 46–51, https://doi.org/10.1080/1047322X.1990.10389587, 1990.
Ingvander, S., Rosqvist, G., Svensson, J., and Dahlke, H. E.: Seasonal and interannual variability of elemental carbon in the snowpack of Storglaciären, northern Sweden, Ann. Glaciol., 54, 50–58, https://doi.org/10.3189/2013AoG62A229, 2013.
Jacobi, H.-W., Obleitner, F., Da Costa, S., Ginot, P., Eleftheriadis, K., Aas, W., and Zanatta, M.: Deposition of ionic species and black carbon to the Arctic snowpack: combining snow pit observations with modeling, Atmos. Chem. Phys., 19, 10361–10377, https://doi.org/10.5194/acp-19-10361-2019, 2019.
James, T. D., Murray, T., Barrand, N. E., Sykes, H. J., Fox, A. J., and King, M. A.: Observations of enhanced thinning in the upper reaches of Svalbard glaciers, The Cryosphere, 6, 1369–1381, https://doi.org/10.5194/tc-6-1369-2012, 2012.
Karl, M., Leck, C., Rad, F. M., Bäcklund, A., Lopez-Aparicio, S., and Heintzenberg, J.: New insights in sources of the sub-micrometre aerosol at Mt. Zeppelin observatory (Spitsbergen) in the year 2015, Tellus B, 71, 1613143, https://doi.org/10.1080/16000889.2019.1613143, 2019.
Khan, A. L., Dierssen, H., Schwarz, J. P., Schmitt, C., Chlus, A., Hermanson, M., Painter, T. H., and McKnight, D. M.: Impacts of coal dust from an active mine on the spectral reflectance of Arctic surface snow in Svalbard, Norway, J. Geophys. Res. Atmos., 122, 1767–1778, https://doi.org/10.1002/2016JD025757, 2017.
Kim, B., Hong, J., Jun, S. Zhang, X., Kwon, H., Kim, S., Kim, J., and Kim, H.: Major cause of unprecedented Arctic warming in January 2016: Critical role of an Atlantic windstorm, Sci. Rep., 7, 40051, https://doi.org/10.1038/srep40051, 2017.
Kirpes, R. M., Bonanno, D., May, N. W., Fraund, M., Barget, A. J., Moffet, R. C., Ault, A. P., and Pratt, K. A.: Wintertime Arctic sea spray aerosol composition controlled by sea ice mead microbiology, ACS Cent. Sci., 5, 1760–1767, https://doi.org/10.1021/acscentsci.9b00541, 2019.
Koenig, L. S., Ivanoff, A., Alexander, P. M., MacGregor, J. A., Fettweis, X., Panzer, B., Paden, J. D., Forster, R. R., Das, I., McConnell, J. R., Tedesco, M., Leuschen, C., and Gogineni, P.: Annual Greenland accumulation rates (2009–2012) from airborne snow radar, The Cryosphere, 10, 1739–1752, https://doi.org/10.5194/tc-10-1739-2016, 2016.
König, M., Nuth, C., Kohler, J., Moholdt, G., and Pettersson, R.: A digital glacier database for svalbard, in: Global Land Ice Measurements from Space, edited by: Kargel, J. S., Leonard, G. J., Bishop, M. P., Kääb, A., and Raup, B. H., Springer, Berlin, Heidelberg, 229–239, 2014.
Kozioł, K. A., Moggridge, H. L., Cook, J. M., and Hodson, A. J.: Organic carbon fluxes of a glacier surface: A case study of Foxfonna, a small Arctic glacier, Earth Surf. Proc. Land., 44, 405–416, https://doi.org/10.1002/esp.4501, 2019.
Kuchiki, K., Aoki, T., Niwano, M., Matoba, S., Kodama, Y., and Adachi, K.: Elemental carbon, organic carbon, and dust concentrations in snow measured with thermal optical and gravimetric methods: Variations during the 2007–2013 winters at Sapporo, Japan, J. Geophys. Res.-Atmos., 120, 868–882, https://doi.org/10.1002/2014JD022144, 2015.
Kühnel, R., Björkman, M. P., Vega, C. P., Hodson, A., Isaksson, E., and Ström, J.: Reactive nitrogen and sulphate wet deposition at Zeppelin Station, Ny-Ålesund, Svalbard, Polar Res., 32, 19136, https://doi.org/10.3402/polar.v32i0.19136, 2013.
Langford, H., Hodson, A., and Banwart, S.: Using FTIR spectroscopy to characterise the soil mineralogy and geochemistry of cryoconite from Aldegondabreen glacier, Svalbard, Appl. Geochem., 26, S206–S209, https://doi.org/10.1016/j.apgeochem.2011.03.105, 2011.
Lim, S., Faïn, X., Zanatta, M., Cozic, J., Jaffrezo, J.-L., Ginot, P., and Laj, P.: Refractory black carbon mass concentrations in snow and ice: method evaluation and inter-comparison with elemental carbon measurement, Atmos. Meas. Tech., 7, 3307–3324, https://doi.org/10.5194/amt-7-3307-2014, 2014.
Lis, G., Wassenenaar, L. I., and Hendy, M. J.: High-precision laser spectroscopy D/H and measurements of microliter natural water samples, Anal. Chem., 80, 287–293, https://doi.org/10.1021/ac701716q, 2008.
Marchenko, S., van Pelt, W. J. J., Claremar, B., Pohjola, V., Pettersson, R., Machguth, H., and Reijmer, C.: Parameterizing deep water percolation improves subsurface temperature simulations by a multilayer firn model, Front. Earth Sci., 5, 16, https://doi.org/10.3389/feart.2017.00016, 2017.
Marks, A. A. and King, M. D.: The effects of additional black carbon on the albedo of Arctic sea ice: variation with sea ice type and snow cover, The Cryosphere, 7, 1193–1204, https://doi.org/10.5194/tc-7-1193-2013, 2013.
Maturilli, M. Radiosonde measurements from station Ny-Ålesund (2011-01), Research Unit, Alfred Wegener Institute, Potsdam, PANGAEA, https://doi.org/10.1594/PANGAEA.757557, 2011.
Maturilli, M. and Kayser, M.: Arctic warming, moisture increase and circulation changes observed in the Ny-Ålesund homogenized radiosonde record, Theor. Appl. Climatol., 130, 1–17, https://doi.org/10.1007/s00704-016-1864-0, 2017.
Meinander, O., Kazadzis, S., Arola, A., Riihelä, A., Räisänen, P., Kivi, R., Kontu, A., Kouznetsov, R., Sofiev, M., Svensson, J., Suokanerva, H., Aaltonen, V., Manninen, T., Roujean, J.-L., and Hautecoeur, O.: Spectral albedo of seasonal snow during intensive melt period at Sodankylä, beyond the Arctic Circle, Atmos. Chem. Phys., 13, 3793–3810, https://doi.org/10.5194/acp-13-3793-2013, 2013.
Mori, T., Goto-Azuma, K., Kondo, Y., Ogawa-Tsukagawa, Y., Miura, K., Hirabayashi, M., Oshima, N., Koike, M., Kupiainen, K., Moteki, N., Ohata, S., Sinha, P. R., Sugiura, K., Aoki, T., Schneebeli, M., Steffen, K., Sato, A., Tsushima, A., Makarov, V., Omiya, S., Sugimoto, A., Takano, S., and Nagatsuka, N.: Black carbon and inorganic aerosols in Arctic snowpack, J. Geophys. Res.-Atmos., 124, 13325–13356, https://doi.org/10.1029/2019JD030623, 2019.
Moroni, B., Becagli, S., Bolzacchini, E., Busetto, M., Cappelletti, D., Crocchianti, S., Ferrero, L., Frosini, D., Lanconelli, C., Lupi, A., Maturilli, M., Mazzola, M., Perrone, M. G., Sangiorgi, G., Traversi, R., Udisti, R., Viola, A., and Vitale, V.: Vertical profiles and chemical properties of aerosol particles upon Ny-Ålesund (Svalbard islands), Adv. Meteorol., 2015, 292081, https://doi.org/10.1155/2015/292081, 2015.
Noone, K. J. and Clarke, A. D.: Soot scavenging measurement in Arctic snowfall, Atmos. Environ., 22, 2773–2778, https://doi.org/10.1016/0004-6981(88)90444-1, 1988.
Osmont, D., Wendl, I. A., Schmidely, L., Sigl, M., Vega, C. P., Isaksson, E., and Schwikowski, M.: An 800-year high-resolution black carbon ice core record from Lomonosovfonna, Svalbard, Atmos. Chem. Phys., 18, 12777–12795, https://doi.org/10.5194/acp-18-12777-2018, 2018.
Panteliadis, P., Hafkenscheid, T., Cary, B., Diapouli, E., Fischer, A., Favez, O., Quincey, P., Viana, M., Hitzenberger, R., Vecchi, R., Saraga, D., Sciare, J., Jaffrezo, J. L., John, A., Schwarz, J., Giannoni, M., Novak, J., Karanasiou, A., Fermo, P., and Maenhaut, W.: ECOC comparison exercise with identical thermal protocols after temperature offset correction – instrument diagnostics by in-depth evaluation of operational parameters, Atmos. Meas. Tech., 8, 779–792, https://doi.org/10.5194/amt-8-779-2015, 2015.
Petzold, A., Ogren, J. A., Fiebig, M., Laj, P., Li, S.-M., Baltensperger, U., Holzer-Popp, T., Kinne, S., Pappalardo, G., Sugimoto, N., Wehrli, C., Wiedensohler, A., and Zhang, X.-Y.: Recommendations for reporting “black carbon” measurements, Atmos. Chem. Phys., 13, 8365–8379, https://doi.org/10.5194/acp-13-8365-2013, 2013.
Pramanik, A., Kohler, J., Schuler, T. V., Van Pelt, W., and Cohen, L.: Comparison of snow accumulation events on two High-Arctic glaciers to model-derived and observed precipitation, Polar Res., 38, 3364, https://doi.org/10.33265/polar.v38.3364, 2019.
Proksch, M., Rutter, N., Fierz, C., and Schneebeli, M.: Intercomparison of snow density measurements: bias, precision, and vertical resolution, The Cryosphere, 10, 371–384, https://doi.org/10.5194/tc-10-371-2016, 2016.
Reistad, M., Breivik, Ø., Haakenstad, H., Aarnes, O. J., and Furevik, B. R.: A high-resolution hindcast of wind and waves for the North Sea, the Norwegian Sea and the Barents Sea, Tech. Rep. Met. Rep. No. 2009/14, Norwegian Meteorological Institute, Oslo, 2009.
Robinson, A. L., Donahue, N. M., Shrivastava, M. K., Weitkamp, E. A., Sage, A. M., Grieshop, A. P., Lane, T. E., Pierce, J. R., and Pandis, S. N.: Rethinking organic aerosols: semivolatile emissions and photochemical aging. Science, 315, 1259–1262, https://doi.org/10.1126/science.1133061, 2007.
Ruppel, M. M., Isaksson, E., Ström, J., Beaudon, E., Svensson, J., Pedersen, C. A., and Korhola, A.: Increase in elemental carbon values between 1970 and 2004 observed in a 300-year ice core from Holtedahlfonna (Svalbard), Atmos. Chem. Phys., 14, 11447–11460, https://doi.org/10.5194/acp-14-11447-2014, 2014.
Ruppel, M. M., Soares, J., Gallet, J.-C., Isaksson, E., Martma, T., Svensson, J., Kohler, J., Pedersen, C. A., Manninen, S., Korhola, A., and Ström, J.: Do contemporary (1980–2015) emissions determine the elemental carbon deposition trend at Holtedahlfonna glacier, Svalbard?, Atmos. Chem. Phys., 17, 12779–12795, https://doi.org/10.5194/acp-17-12779-2017, 2017.
Schwarz, J. P., Gao, R. S., Perring, A. E., Spackman, J. R., and Fahey, D. W.: Black carbon aerosol size in snow, Sci. Rep., 3, 1356, https://doi.org/10.1038/srep01356, 2012.
Shears, J., Theisen, F., Bjørdal, A., and Norris, S.: Environmental impact assessment, Ny-Ålesund international scientific research and monitoring station, Svalbard, Meddelelser no. 157, Norwegian Polar Institute, Tromsø, 1998.
Singh, S. M., Gawas-Sakhalkar, P., Naik, S., Ravindra, R., Sharma, J., Upadhyay, A. K., Mulik, R. U., and Bohare, P.: Elemental composition and bacterial incidence in firn-cores at Midre Lovénbreen glacier, Svalbard, Polar Record, 51, 39–48, https://doi.org/10.1017/S0032247413000533, 2015.
Sinha, P. R., Kondo, Y., Goto-Azuma, K., Tsukagawa, Y., Fukuda, K., Koike, M., Oshima, N., Førland, E. J., Irwin, M., Gallet, J.-C., and Pedersen, C. A.: Seasonal progression of the deposition of black carbon by snowfall at Ny-Ålesund, Spitsbergen, J. Geophys. Res.-Atmos., 123, 997–1016, https://doi.org/10.1002/2017JD028027, 2018.
Stephens, M., Turner, N., and Sandberg, J.: Particle identification by laser-induced incandescence in a solid-state laser cavity, Appl. Optics, 42, 3726–3736, https://doi.org/10.1364/AO.42.003726, 2003.
Stohl, A., Aamaas, B., Amann, M., Baker, L. H., Bellouin, N., Berntsen, T. K., Boucher, O., Cherian, R., Collins, W., Daskalakis, N., Dusinska, M., Eckhardt, S., Fuglestvedt, J. S., Harju, M., Heyes, C., Hodnebrog, Ø., Hao, J., Im, U., Kanakidou, M., Klimont, Z., Kupiainen, K., Law, K. S., Lund, M. T., Maas, R., MacIntosh, C. R., Myhre, G., Myriokefalitakis, S., Olivié, D., Quaas, J., Quennehen, B., Raut, J.-C., Rumbold, S. T., Samset, B. H., Schulz, M., Seland, Ø., Shine, K. P., Skeie, R. B., Wang, S., Yttri, K. E., and Zhu, T.: Evaluating the climate and air quality impacts of short-lived pollutants, Atmos. Chem. Phys., 15, 10529–10566, https://doi.org/10.5194/acp-15-10529-2015, 2015.
Svensson, J. Ström, J., Hansson, M., Lihavainen, H., and Kerminen, V.-M.: Observed metre scale horizontal variability of elemental carbon in surface snow, Environ. Res. Lett., 8, 034012, https://doi.org/10.1088/1748-9326/8/3/034012, 2013.
Svensson, J., Ström, J., Kivekäs, N., Dkhar, N. B., Tayal, S., Sharma, V. P., Jutila, A., Backman, J., Virkkula, A., Ruppel, M., Hyvärinen, A., Kontu, A., Hannula, H.-R., Leppäranta, M., Hooda, R. K., Korhola, A., Asmi, E., and Lihavainen, H.: Light-absorption of dust and elemental carbon in snow in the Indian Himalayas and the Finnish Arctic, Atmos. Meas. Tech., 11, 1403–1416, https://doi.org/10.5194/amt-11-1403-2018, 2018.
Szymański, W., Skiba, M., Wojtuń, B., and Drewnik, M.: Soil properties, micromorphology, and mineralogy of cryosols from sorted and unsorted patterned grounds in the Hornsund area, SW Spitsbergen, Geoderma, 253–254, 1–11, https://doi.org/10.1016/j.geoderma.2015.03.029, 2015.
Thomas, F. A., Sinha, R. K., and Krishnan, K. P.: Bacterial community structure of a glacio-marine system in the Arctic (Ny-Ålesund, Svalbard), Sci. Total Environ., 718, 135264, https://doi.org/10.1016/j.scitotenv.2019.135264, 2020.
Torres, A., Bond, T. C., Lehmann, C. M. B., Subramanian, R., and Hadley, O. L.: Measuring organic carbon and black carbon in rainwater: Evaluation of methods, Aerosol Sci. Tech., 48, 239–250, https://doi.org/10.1080/02786826.2013.868596, 2014.
Tørseth, K., Andrews, E., Asmi, E., Eleftheriadis, K., Fiebig, M., Herber, A., Huang, L., Kylling, A., Lupi, A., Massling, A., Mazzola, M., Nøjgaard, J. K., Popovicheva, O., Schichtel, B., Schmale, J., Sharma, S., Skov, H., Stebel, K., Vasel, B., Vitale, V., Whaley, C., Yttri, K. E., and Zanatta, M.: Review of Observation Capacities and Data Availability for Black Carbon in the Arctic Region, EU Action on Black Carbon in the Arctic – Technical Report 1, AMAP – Arctic Monitoring and Assessment Programme, Oslo, p. 35, 2019.
Van Kampenhout, L., Lenaerts, J. T. M., Lipscomb, W. H., Sacks, W. J., Lawrence, D. M., Slater, A. G., and van den Broeke, M. R.: Improving the representation of polar snow and firn in the Community Earth System Model, J. Adv. Model. Earth Syst., 9, 2583–2600, https://doi.org/10.1002/2017MS000988, 2017.
Van Pelt, W., Pohjola, V., Pettersson, R., Marchenko, S., Kohler, J., Luks, B., Ove Hagen, J. O., Schuler, T. V., Dunse, T., Noël, B., and Reijmer, C.: A long-term dataset of climatic mass balance, snow conditions, and runoff in Svalbard (1957–2018), The Cryosphere, 13, 2259–2280, https://doi.org/10.5194/tc-13-2259-2019, 2019.
Van Pelt, W. J. J. and Kohler, J.: Modelling the long-term mass balance and firn evolution of glaciers around Kongsfjorden, Svalbard, J. Glaciol., 61, 731–744, https://doi.org/10.3189/2015JoG14J223, 2015.
Van Pelt, W. J. J., Oerlemans, J., Reijmer, C. H., Pohjola, V. A., Pettersson, R., and van Angelen, J. H.: Simulating melt, runoff and refreezing on Nordenskiöldbreen, Svalbard, using a coupled snow and energy balance model, The Cryosphere, 6, 641–659, https://doi.org/10.5194/tc-6-641-2012, 2012.
Vionnet, V., Brun, E., Morin, S., Boone, A., Faroux, S., Le Moigne, P., Martin, E., and Willemet, J.-M.: The detailed snowpack scheme Crocus and its implementation in SURFEX v7.2, Geosci. Model Dev., 5, 773–791, https://doi.org/10.5194/gmd-5-773-2012, 2012.
Wang, M., Xu, B., Zhao, H., Cao, J., Joswiak, D., Wu, G., and Lin, S.: The influence of dust on quantitative measurements of black carbon in ice and snow when using a thermal optical method, Aerosol Sci. Tech., 46, 60–69, https://doi.org/10.1080/02786826.2011.605815, 2012.
Weinbruch, S., Wiesemann, D., Ebert, M., Schütze, K., Kallenborn, R., and Ström, J.: Chemical composition and sources of aerosol particles at Zeppelin Mountain (Ny-Ålesund, Svalbard): An electron microscopy study, Atmos. Environ., 49, 142–150, https://doi.org/10.1016/j.atmosenv.2011.12.008, 2012.
Winiger, P., Andersson, A., Yttri, K. E., Tunved, P., and Gutsfasson, Ö.: Isotope-based source apportionment of EC aerosol particles during winter high-pollution events at the Zeppelin Observatory, Svalbard, Environ. Sci. Technol., 49, 11959–11966, https://doi.org/10.1021/acs.est.5b02644, 2015.
Winiger, P., Barrett, T. E., Sheesley, R. J., Huang, L., Sharma, S., Barrie, L. A., Yttri, K. E., Evangeliou, N., Eckhardt, S., Stohl, A., Klimont, Z., Heyes, C., Semiletov, I. P., Dudarev, O. V., Charkin, A., Shakhova, N., Holmstrand, H., Andersson, A., and Gustafsson, Ö.: Source apportionment of circum-Arctic atmospheric black carbon from isotopes and modeling, Sci. Adv., 5, eaau8052, https://doi.org/10.1126/sciadv.aau8052, 2019.
Xu, B., Cao, J., Joswiak, D. R., Liu, X., Zhao, H., and He, J.: Postdepositional enrichment of black soot in snow-pack and accelerated melting of Tibetan glaciers, Environ. Res. Lett., 7, 014022, https://doi.org/10.1088/1748-9326/7/1/014022, 2012.