the Creative Commons Attribution 4.0 License.
the Creative Commons Attribution 4.0 License.
 | 02 Mar 2021
Measurement report: Spatial variations in ionic chemistry and water-stable isotopes in the snowpack on glaciers across Svalbard during the 2015–2016 snow accumulation season
Elena Barbaro
Krystyna Koziol
Mats P. Björkman
Carmen P. Vega
Christian Zdanowicz
Tonu Martma
Jean-Charles Gallet
Daniel Kępski
Catherine Larose
Bartłomiej Luks
Florian Tolle
Thomas V. Schuler
Aleksander Uszczyk
The Svalbard archipelago, located at the Arctic sea-ice edge between 74 and 81∘ N, is ∼60 % covered by glaciers. The region experiences rapid variations in atmospheric flow during the snow season (from late September to May) and can be affected by air advected from both lower and higher latitudes, which likely impact the chemical composition of snowfall. While long-term changes in Svalbard snow chemistry have been documented in ice cores drilled from two high-elevation glaciers, the spatial variability of the snowpack composition across Svalbard is comparatively poorly understood. Here, we report the results of the most comprehensive seasonal snow chemistry survey to date, carried out in April 2016 across 22 sites on seven glaciers across the archipelago. At each glacier, three snowpits were sampled along the altitudinal profiles and the collected samples were analysed for major ions (Ca2+, K+, Na+, Mg2+, , , Br−, Cl−, and ) and stable water isotopes (δ18O, δ2H). The main aims were to investigate the natural and anthropogenic processes influencing the snowpack and to better understand the influence of atmospheric aerosol transport and deposition patterns on the snow chemical composition. The snow deposited in the southern region of Svalbard is characterized by the highest total ionic loads, mainly attributed to sea-salt particles. Both and in the seasonal snowpack reflect secondary aerosol formation and post-depositional changes, resulting in very different spatial deposition patterns: has its highest loading in north-western Spitsbergen and in the south-west. The Br− enrichment in snow is highest in north-eastern glacier sites closest to areas of extensive sea-ice coverage. Spatial correlation patterns between Na+ and δ18O suggest that the influence of long-range transport of aerosols on snow chemistry is proportionally greater above 600–700 m a.s.l.
Please read the corrigendum first before continuing.
-
Notice on corrigendum
The requested paper has a corresponding corrigendum published. Please read the corrigendum first before downloading the article.
-
Article
(3789 KB)
- Corrigendum
- Companion paper
-
Supplement
(1445 KB)
-
The requested paper has a corresponding corrigendum published. Please read the corrigendum first before downloading the article.
- Article
(3789 KB) - Full-text XML
- Corrigendum
- Companion paper
-
Supplement
(1445 KB) - BibTeX
- EndNote


Svalbard is a region of the Arctic experiencing rapid climate change. The mean warming rate is +1.35 K per decade, much faster than the global average (Isaksen et al., 2016; Maturilli et al., 2013; Nordli et al., 2014). This archipelago is located at the southern edge of the perennial Arctic sea ice in the North Atlantic Ocean and is characterized by a maritime climate with large, rapid temperature variations during winter (Brage et al., 2014). South-westerly inflow of mild oceanic air, associated with a low-pressure system east of Iceland, often brings relatively warm and moist air in the winter months, while Arctic air intrusions from the north-east, driven by a high-pressure system over Greenland, result in much colder temperatures (Rinke et al., 2017). In addition to these synoptic fluctuations, intense autumn or winter cyclonic storms associated with anomalous warming events sometimes occur, transporting both heat and moisture from lower latitudes to Svalbard (Rinke et al., 2017).
The aforementioned meteorological conditions also favour long-range transport of aerosols to the archipelago, including pollutants from continental sources. Depending on the predominant air flow pattern at the time of snowfall, the archipelago may experience regionally different amounts of both snow accumulation (Eneroth et al., 2003; Forland et al., 2011) and chemical loads, the latter reflecting contrasting mixtures of aerosols, varying by source area (Aas et al., 2016; Forsström et al., 2009; Möller and Kohler, 2018). These regional differences are also associated with contrasts in sea-ice cover. While all Svalbard coasts are usually ice-free in summer, sea ice can form and cover large parts of the ocean surface in the eastern and northern parts of the archipelago. Contrastingly, the southern and western parts often remain ice-free (Dahlke et al., 2020) and therefore tend to experience greater snowfall owing to the proximity of open water. In addition, the West Spitsbergen Current, a branch of the Atlantic Meridional Overturning Circulation (AMOC) that flows to the west of the archipelago, causes markedly different regional climatic conditions between its eastern and western parts (van Pelt et al., 2019): the west exhibits higher temperatures and precipitation, while the east is less humid and cooler and has also experienced a stronger warming trend since 1957.
The seasonal snowpack contains a complex mixture of impurities that are either scavenged from the atmosphere during snowfall or directly received through dry deposition (Kuhn, 2001). On land, the majority of impurities found in seasonal snow are usually eluted during summer melt, influencing terrestrial and aquatic systems (Björkman et al., 2014; Brimblecombe et al., 1987). However, in the accumulation area of Arctic glaciers and ice caps, impurities can be retained within or below the seasonal snow layer (Björkman et al., 2014; Pohjola et al., 2002; Vega et al., 2016). For this reason, chemical impurities such as major ions (Ca2+, K+, Na+, Mg2+, , , Br−, Cl−, and ) in ice cores have been widely used to study the past trends of atmospheric and climatic conditions (Barbante et al., 2017; Isaksson et al., 2003; Thompson et al., 2002; Wolff et al., 2010). Previous studies in Svalbard (Isaksson et al., 2001; Matoba et al., 2002; Nawrot et al., 2016; Semb et al., 1984) have shown that the chemistry of the seasonal snowpack is dominated by sea-salt ions (Hodgkins and Tranter, 1998). However, the region is also a sink for atmospheric contaminants brought in by long-range transport (Vecchiato et al., 2018). Investigations of precipitation and snow cover chemistry have predominantly focused on the central and western parts of the archipelago (Kühnel et al., 2011; Nawrot et al., 2016; Vega et al., 2015; Virkkunen et al., 2007) due to the accessibility of research facilities in these sectors.
In general, stable water isotope measurements in different components of the water cycle are available in isotope databases, maintained and updated by the International Atomic Energy Agency (IAEA) but also by national or international organizations (West et al., 2010). Moreover, in Svalbard, stable water isotope investigations are performed in ice cores and surface snowpit samples because δ18O and δ2H are still the most common tools for finding the depth–time relationship in ice cores (Pohjola et al., 2017; Punning et al., 1986). The preservation of uninterrupted annual isotope cycles varies depending on the site: in sites such as central Greenland annual isotope cycles are well preserved, while in sites with high intra-seasonal variations or with different pre- and post-depositional processes the annual layers can be difficult to distinguish (Pohjola et al., 2002). To investigate to what degree δ18O in snow changes after accumulation, Igarashi et al. (2001) carried out the observation of the precipitation at Ny-Ålesund. These authors concluded that the fluctuation of δ18O could not be explained by changes in surface air temperature only but that the characteristics of the air masses also influenced the isotope signature of the precipitation (Igarashi et al., 2001). At the moment, there is a lack of data regarding the stable water isotope composition of surface snow from Svalbard, and this survey is a substantial contribution to fill that gap.
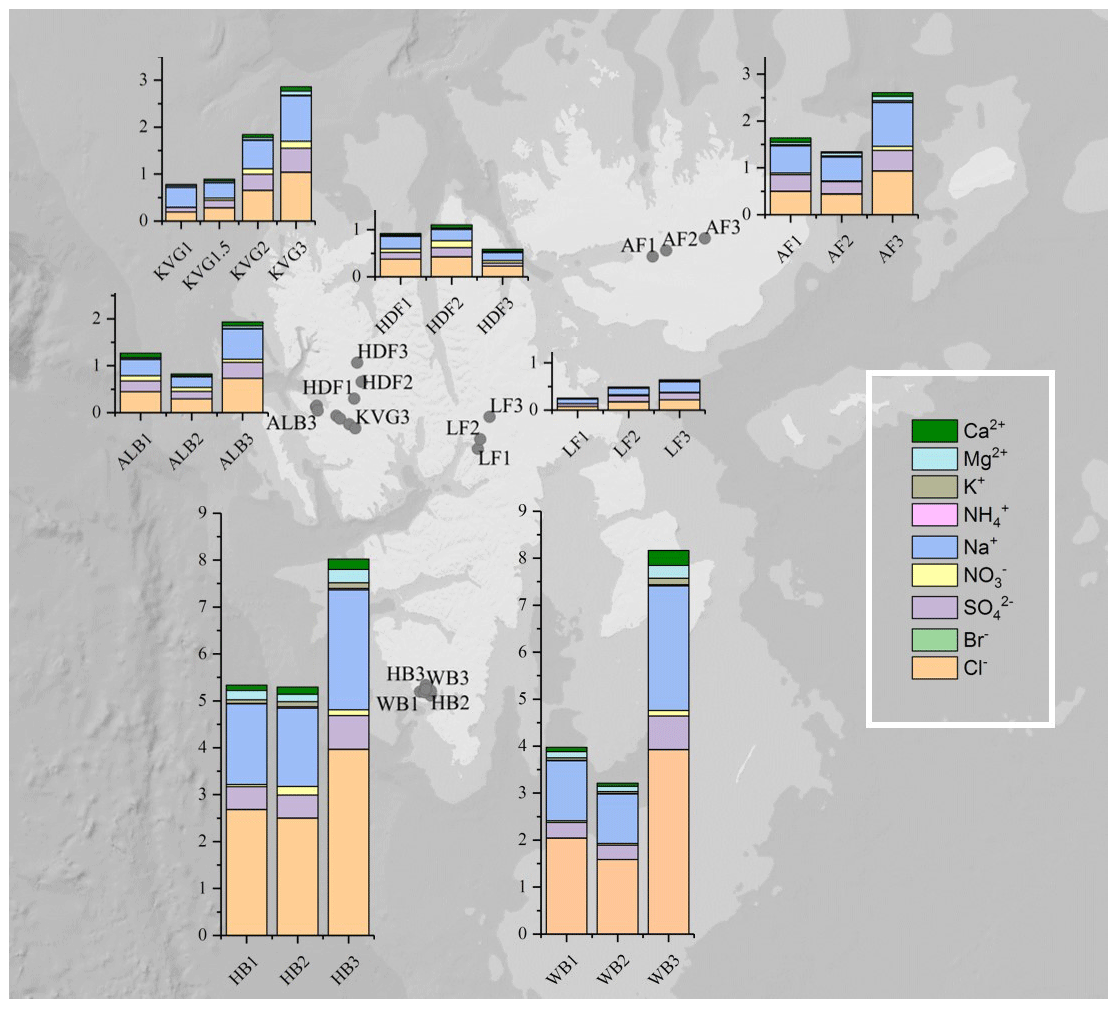
Figure 1Total snowpack loads (mg m−2) of major ions in 22 snowpits collected on glaciers during the C2S3 project. Seven glaciers were sampled in three snowpits in the lower ablation zone (1), near the equilibrium line (2), and in the upper accumulation zone (3), except on KVG glacier, where an extra snowpit was sampled within the ablation zone. Abbreviations: KVG=Kongsvegen, HDF=Holtedahlfonna, AF=Austfonna, ALB=Austre Lovénbreen, LF=Lomonosovfonna, HB=Hansbreen, WB=Werenskiöldbreen.
In the present study, the concentration, mass loading, spatial and altitudinal distribution of major ion species (Ca2+, K+, Na+, Mg2+, , , Br−, Cl−, and ) in snow, together with its stable oxygen and hydrogen isotope composition (δ18O and δ2H), were evaluated in the late winter snowpack at 22 glacier sites across Svalbard. Stable isotope ratios were used as supporting data to define the accumulation seasonality in the snowpack and to identify the moisture sources that feed snowfall, thereby providing clues as to the predominant air transport pathways to the snowpit sites (Gat et al., 2001). This study was part of the larger Community Coordinated Snow Study in Svalbard (C2S3) project and is the most comprehensive survey of seasonal snow chemistry in Svalbard to date. The snowpack survey, which was carried out by coordinated teams using a common sampling protocol (Gallet et al., 2018), aimed to map and characterize regional differences in the chemical composition and impurity load of the winter snowpack. We further interpret the observed differences in chemical loading in relation to meteorological and other environmental factors.
Thereby, we aim to identify the conditions controlling the chemistry of Svalbard snow that are susceptible to the variable climate warming impact across the region.
2.1 Sampling location and strategy
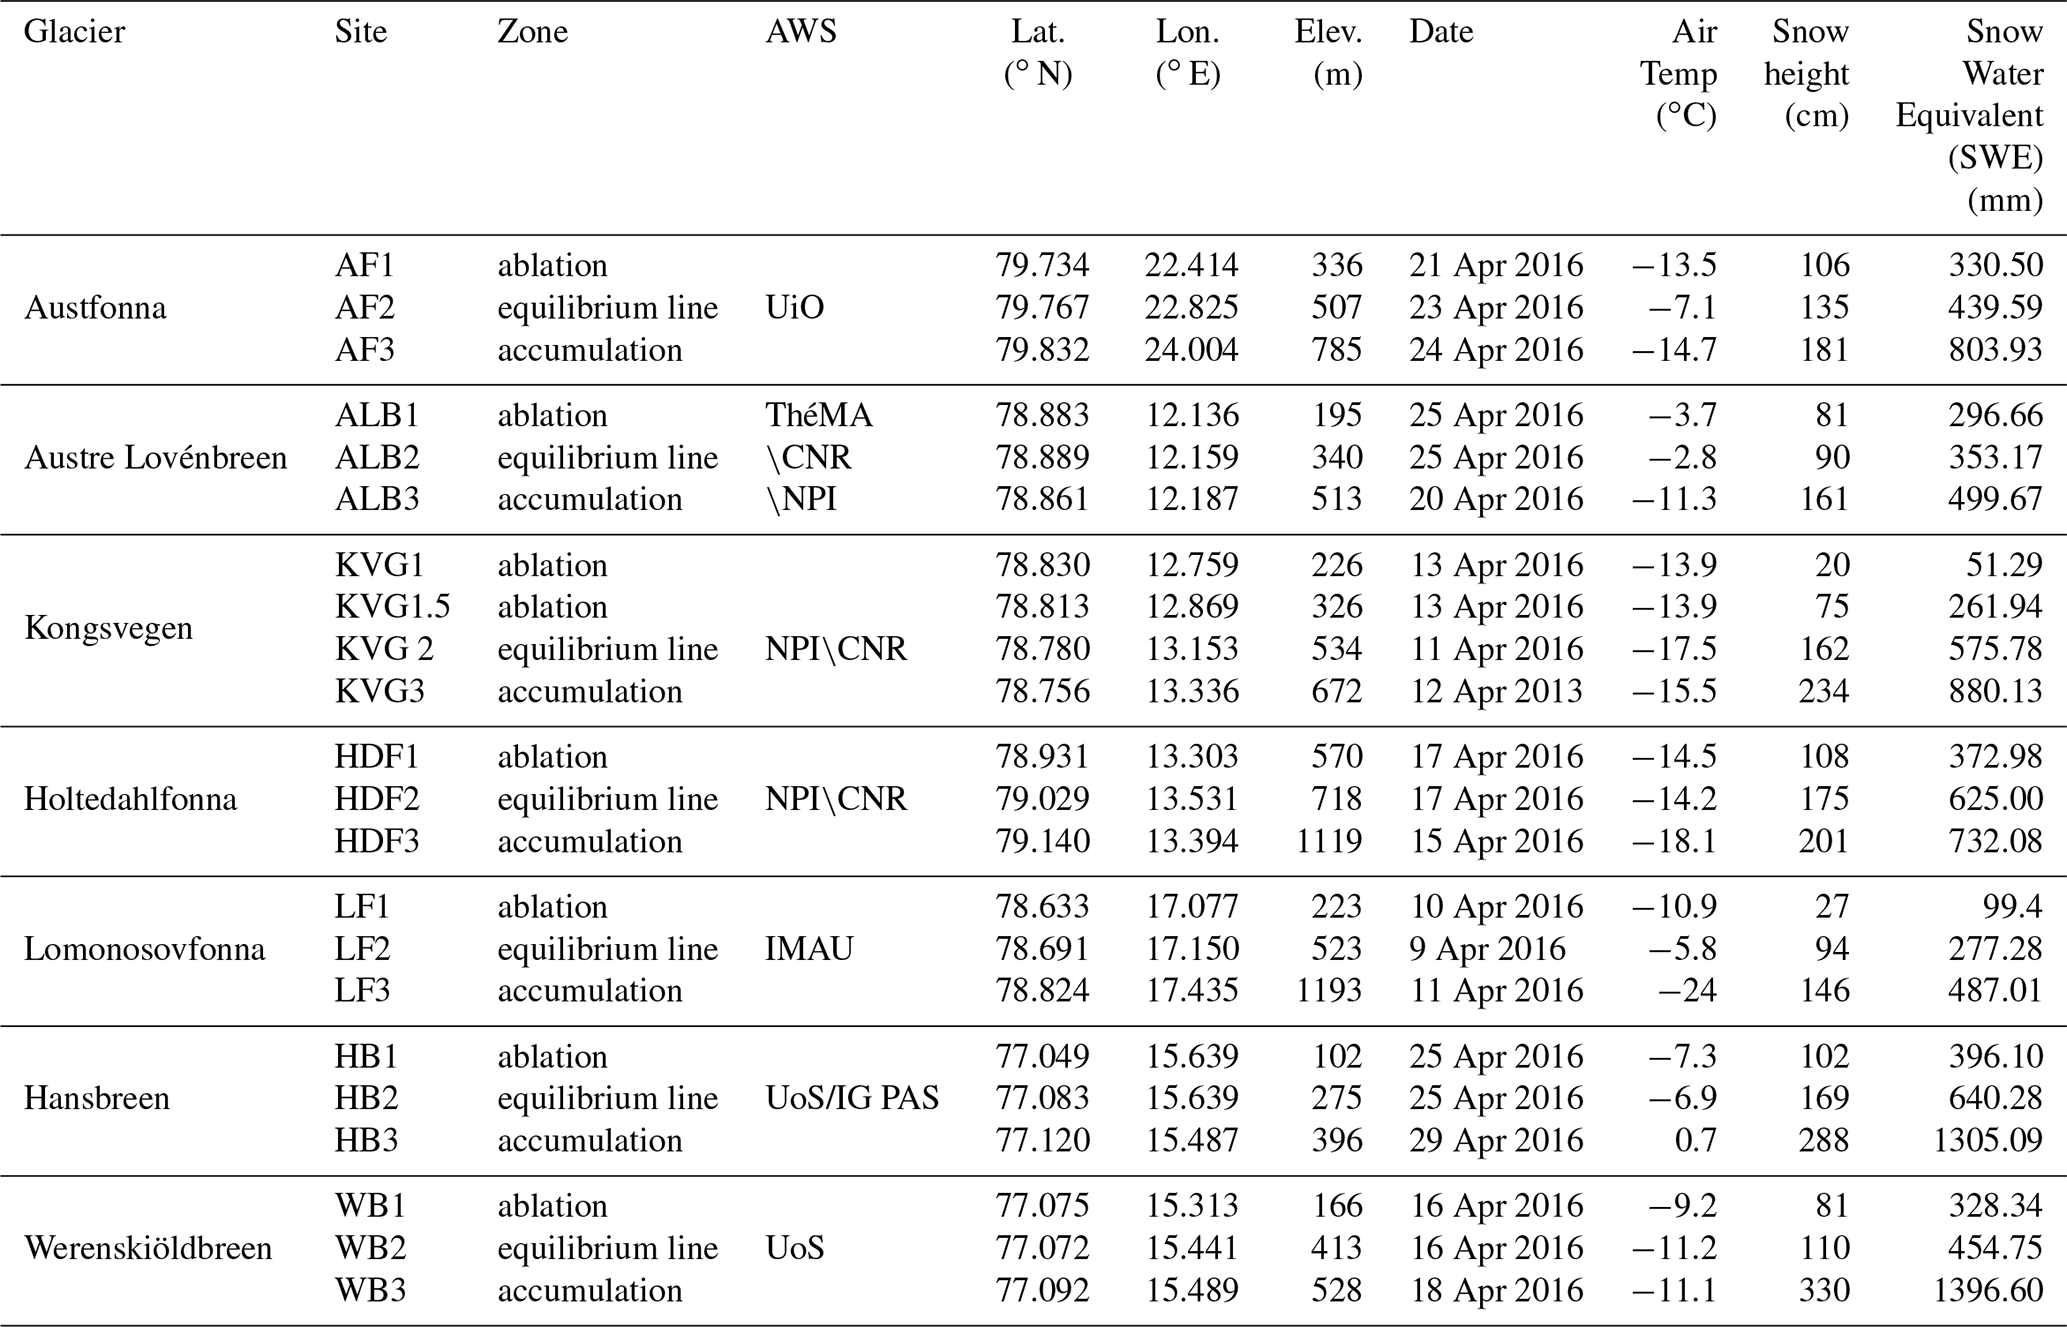
During April 2016, the seasonal snowpack was sampled at 22 sites on seven glaciers across Svalbard (Table 1 and Fig. 1). The glaciers are of different sizes and hypsometry. Wind fields for each glacier are not available. Indeed, the wind direction can change in concomitance with cyclonic events that could occur during the season and can act differently for each glacier.
Table 1Glaciers and sampling sites included in this study with their main characteristic. The air temperature was measured with a digital thermometer when the operators started to dig the snowpits. AWS: atmospheric weather station; UiO: University of Oslo; ThèMA: Thèoriser & Modèliser pour Amènager, University of Franche-Comté; NPI: Norwegian Polar Institute; IMAU: Institute for Marine and Atmospheric Research, Utrecht University; UoS: University of Silesia; IG PAS – Institute of Geophysics, Polish Academy of Sciences; CNR – Consiglio Nazionale delle Ricerche. Seven glaciers were considered at three different altitudes: (1) lower ablation zone; (2) ELA; (3) upper accumulation zone. Exceptionally, two snowpits (KVG 1 and KVG 1.5) were dug in the ablation zone of Kongsvegen glacier.
The first glacier considered in this study is Austfonna (AF), located on Nordaustlandet, the second largest island in Svalbard, with approximately 80 % of its area covered by ice. AF is the largest ice cap in Svalbard with a geographic area of 8357 km2 and has one main central dome of up to 600 m ice thickness feeding several drainage basins (Dallmann et al., 2015; Schuler et al., 2020).
The other six glaciers investigated here are located on Spitsbergen. In north-western Spitsbergen, we studied three glaciers near Ny-Ålesund: Austre Lovénbreen (ALB), Kongsvegen (KVG), and Holtedahlfonna (HDF). ALB is a small land-based valley glacier, 4 km long from south to north along the Brøgger Peninsula. The glacier area was 4.48 km2 in 2013 and its elevation ranges from 50 to 550 m a.s.l. The total catchment area spreads over 10 577 km2, taking into account an outlet where the main stream crosses a compact calcareous outcrop 400 m upstream from the coastline (Marlin et al., 2017). KVG is a north-west-flowing grounded glacier located about 20 km east of Ny-Ålesund (Melvold and Hagen, 1998), with an average ice thickness of 190 m and a maximum of 450 m (Lindbäck et al., 2018). It has a total length of ca. 24 km with an average 3.5 km width, has a maximum elevation of 800 m a.s.l., and flows from south-east to north-west (Spolaor et al., 2017). HDF glacier is the largest ice field (ca. 300 km2) on north-western Spitsbergen, about 40 km from the Ny-Ålesund station. It is distributed over an elevation range of 0–1241 m a.s.l. (Beaudon et al., 2017; Nuth et al., 2017).
Lomonosovfonna (LF) is one of the highest ice fields on Spitsbergen and is located in the central part of the island. The summit lies at 1250 m a.s.l. and has a pronounced cupola shape with an approximate radius of 500 m. The total accumulation area of the entire LF ice system was about 600 km2 at the beginning of the 21st century (Isaksson et al., 2001). Even though this is the highest point in our survey, the air temperature can pass above zero during the summer, resulting, although not significantly, in the relocation of ions (Pohjola et al., 2002; Vega et al., 2016). In southern Spitsbergen, two different glaciers were investigated, Hansbreen (HB) and Werenskiöldbreen (WB), close to the Hornsund station. The HB is a medium-sized (56 km2) tidewater glacier located in the southern part of Wedel Jarlsberg Land. The glacier is ∼16 km long, and its elevation extends up to 550 m a.s.l. The WSB glacier has an area of 27 km2, is a land-terminating valley glacier to the west of HB, and ranges in elevation from 50 to 600 m a.s.l. (Schuler et al., 2020).
Each glacier was sampled in the ablation zone, close to the equilibrium line altitude (ELA), and in the accumulation zone (Table 1). The ELA is the elevation at which the surface mass balance is zero, i.e. where the accumulation of snow is exactly balanced by ablation over a period of a year (Cogley et al., 2011). Although the exact elevation ranges of these zones (accumulation, ablation, and ELA) differ for each glacier, they share enough glaciological similarities to support intersite comparisons. All snowpits have been collected from the glacier central line in order to minimize the side accumulation effect due to orography.
2.2 Sampling procedure
Snowpit sampling was performed using a common protocol (Gallet et al., 2018) with pre-cleaned equipment (i.e. tubes, plastic scrapers, and plastic shovels cleaned with ultrapure water) and protective clothing (powder-free plastic gloves, clean suits, and face masks). This protocol allowed sampling and field data collection in a consistent manner, obtaining comparable datasets from different research sites.
Samples for ionic chemistry were taken from each discrete snowpit layer, according to the visible stratigraphy, and were directly filled into pre-cleaned 50 mL polypropylene “Falcon” centrifuge tubes. This type of sampling facilitates linking a snow layer (and its properties) to a specific weather event (i.e. precipitation or surface melt). Moreover, sampling by discrete layers makes it possible to correlate the intervals of snow accumulation between separate snowpits at different altitudes, as reported in this paper when we compare three different areas of the same glacier (ablation, ELA, and accumulation). It is also more accurate for chemical load calculations where ice layers occur in snowpits.
Samples for the isotopic composition of water were collected at a 5 cm resolution for sites in the Ny-Ålesund area and at a 10 cm or stratigraphic layer resolution for other sites. All sampling was conducted at a safe distance and upwind from potential local pollution sources, such as the snowmobiles used for transport by the sampling team.
2.3 Major ion analyses
Samples from glaciers in the Hornsund area (HB, WB) were analysed at the Polish Polar Station Hornsund (Institute of Geophysics, Polish Academy of Sciences), while samples from glaciers near Ny-Ålesund (KVG, ALB, HDF) were shipped frozen to the Institute of Polar Sciences (ISP-CNR) in Venice (Italy). Snow sampled in central Spitsbergen (AF, LF) was shipped frozen to the Department of Earth Sciences at Uppsala University (Sweden). Due to a temporary equipment malfunction in Uppsala, only cations could be analysed there, and the refrozen samples were forwarded to ISP-CNR for anion analysis. All samples and standards were handled and prepared under clean room conditions, wearing powder-free gloves. In all labs except at the Polish Polar Station Hornsund, laminar flow hoods (class 100) were used. Samples were melted immediately before analysis.
2.3.1 Hornsund
Samples were filtered through 0.45 µm mixed cellulose ester membranes (Merck Millipore S-pak®) prior to analysis. Ion concentrations were determined on a Metrohm 761 Compact IC ion chromatograph equipped with an autosampler (Metrohm, Herisau, Switzerland), with isocratic flow of 0.69 mL min−1 and chemical suppression for anions (column Metrosep A Supp S+Metrosep A Supp 4/5 Guard 4.0, eluent: ). Cations were determined without suppression (column Metrosep C4+Metrosep C4 Guard; mobile phase: acid (dipicolinic acid, DPA) 0.7 mmol L−1 at a flow rate of 0.9 mL min−1). Cation samples were acidified with 2 µL of 2 mM HNO3 per 10 mL sample prior to analysis. The injection volume was 20 µL in the anion system and 100 µL in the cation system. Nitric acid solutions were prepared from POCH S.A. (Poland) concentrated weighed amounts, while sodium carbonate and hydrogen carbonate as well as DPA were dissolved from the solid phase (Merck Millipore).
2.3.2 Uppsala
Samples were filtered using 0.22 µm polyethersulfone membranes (Minisart®, Sartorius) and cation determination was performed using a Metrohm ProfIC850 ion chromatograph (Metrohm, Herisau, Switzerland), equipped with an autosampler and a Metrosep C4 column. The mobile phase of 0.02 M DPA and 0.1 M HNO3 was run in an isocratic flow of 0.7 mL min−1. Very low detection limits (≤0.006 mg L−1) were achieved thanks to the sample injection volume of 500 µL.
2.3.3 Venice
Anion determination was performed using a DionexTM ICS-5000 ion chromatograph (ThermoScientificTM, Waltham, US) equipped with an anionic exchange column (Dionex IonPac AS11, 2×250 mm) and a guard column (Dionex IonPac AG11, 2×50 mm). Sodium hydroxide (NaOH), used as a mobile phase, was produced by an eluent generator (Dionex ICS 5000EG, Thermo Scientific). The gradient with a 0.25 mL min−1 flow rate was 0 min, 0.5 mM; 0–3.5 min, gradient from 0.5 to 5 mM; 3.5–5 min, gradient from 5 to 10 mM; 5–25 min, gradient from 10 to 38 mM; 25–30 min, column cleaning with 38 mM; and 30–35 min, equilibration at 0.5 mM. The injection volume was 100 µL. The IC was coupled to a single quadrupole mass spectrometer (MSQ PlusTM, Thermo ScientificTM) with an electrospray source (ESI) that operated in negative mode. All other details are reported by Barbaro et al. (2017).
To determine the cations, a capillary ion chromatograph (Thermo Scientific Dionex ICS-5000) equipped with a capillary cation exchange column (Dionex IonPac CS19-4 µm, 0.4×250 mm) and a guard column (Dionex IonPac CG19-4 µm, 0.4×50 mm) coupled to a conductivity detector was used. Methanesulfonic acid, produced by an eluent generator (Dionex ICS 5000EG, Thermo Scientific), was applied as the mobile phase. The gradient was 0–17.3 min: 1.5 mM; 17.3–21.9 min: from 1.5 to 11 mM; 21.9–30 min: equilibration at 1.5 mM. The injection volume was 0.4 µL and the flow rate was 13 µL min−1.
2.3.4 Instrumental performance of each laboratory
For all laboratories, calibrations for ions were evaluated using analytical standards (Merck/Sigma Aldrich). The calibrations in each lab delivered different linear ranges for each ion due to the different methods used (Table S1 in the Supplement). Good linearity was demonstrated in each lab and all calibration curves had R2>0.99. Samples that had ion concentrations beyond the calibration range were diluted with ultrapure water before re-analysis. Analytical blanks of ultrapure water (>18 MΩ cm) were included in the analysis at all three labs. The method detection limit (MDL) was set to 3 times the standard deviation of the blank values (Table S1). For Na+, Mg2+, Cl−, and , values <MDL occurred in less than 10 % of cases, and for Ca2+ and the <MDL concentrations were noted in 12 % and 17 % of all cases, respectively. However, K+ and Br− were detected only in 53 % and 46 % of all samples, respectively, while concentration exceeded the MDL only in 36 % of all measurements. For the calculation of the bulk ionic loading in snowpits, values <MDL were assumed to be equal to half the MDL.
Accuracy and precision are important parameters to be evaluated during method validation. Checks for accuracy were made using certified multi-element standard solutions for anions (F−, Cl−, Br−, , , no. 89886-50ML-F, Sigma Aldrich) and cations (Na+, K+, Mg2+, Ca2+, no. 89316-50ML-F, Sigma Aldrich) at a concentration of %. Accuracy is expressed as a relative error calculated as , where Q is the determined value and T is the “true” value. The accuracy for each ion in all labs was always %, except for Mg2+ measurements at the Hornsund laboratory. The analytical precision was quantified as the relative standard deviation (RSD) for replicates (n>3) of standard solutions and was always <10 % for each ion (Table S1).
2.4 Stable water isotopes
The determination of stable isotope ratios of O and H was performed at Tallinn University of Technology (Estonia). The isotopic ratios were determined by laser spectroscopy, using a Picarro model L2120-i water isotope analyser (Picarro Inc., Sunnyvale, USA), which allows for the simultaneous determination of and in H2O with a high-precision AO211 vaporizer. Results are reported in the standard delta notation as δ18O and δ2H relative to Vienna Standard Mean Ocean Water (VSMOW). Reproducibility was ±0.1 ‰ for δ18O and ±1 ‰ for δ2H, respectively. Seven injections were carried out for each sample, but only the last four injections (4 to 7) were used for calculations to minimize the memory effect. Laboratory standards TLN-A2 (−10.15; −77.5) and TLN-B2 (−21.95; −162.5) were regularly calibrated against international V-SMOW, GNIP, and V-SLAP standards. Standards (TLN-A2, TLN-B, and TLN-D4) were measured at the beginning, in the middle, and at the end of each set of measurements (54 bottles). Additionally, every seven samples, the laboratory standard TLN-D4 (−17.5; −133.0) was measured and used for drift correction if needed.
3.1 Spatial distribution of ionic species
To investigate differences in snowpack composition across all glaciers, we compared the total mass of ions that accumulated in snow at the different sampling sites. On average, the snow cover season on Svalbard lasts from early September to early May, but snow may also fall in summer months at high elevations. The snowpits in this study were sampled in early to late April 2016 and therefore might not contain the full annual ionic burden, since deposition can still occur before the beginning of the snowmelt season. Therefore, we report these data as ionic loads (mg m−2) rather than annual fluxes. In each snowpit, the total ionic load was calculated as the cumulative sum of the ionic loads in each discrete layer, i.e. ionic concentrations multiplied by the snow water equivalent of the layer (Table 2). On the other hand, to evaluate the transport processes of chemical species from other regions to Svalbard, we evaluate the volume-weighted mean concentrations of major ions in each snowpit. These values are calculated as the total ionic load of each snowpit divided by its total SWE (snow water equivalent) (Table 3). The snowpack chemical characteristics were then compared between glacier zones (ablation zone, ELA, and accumulation zone; Fig. 1).
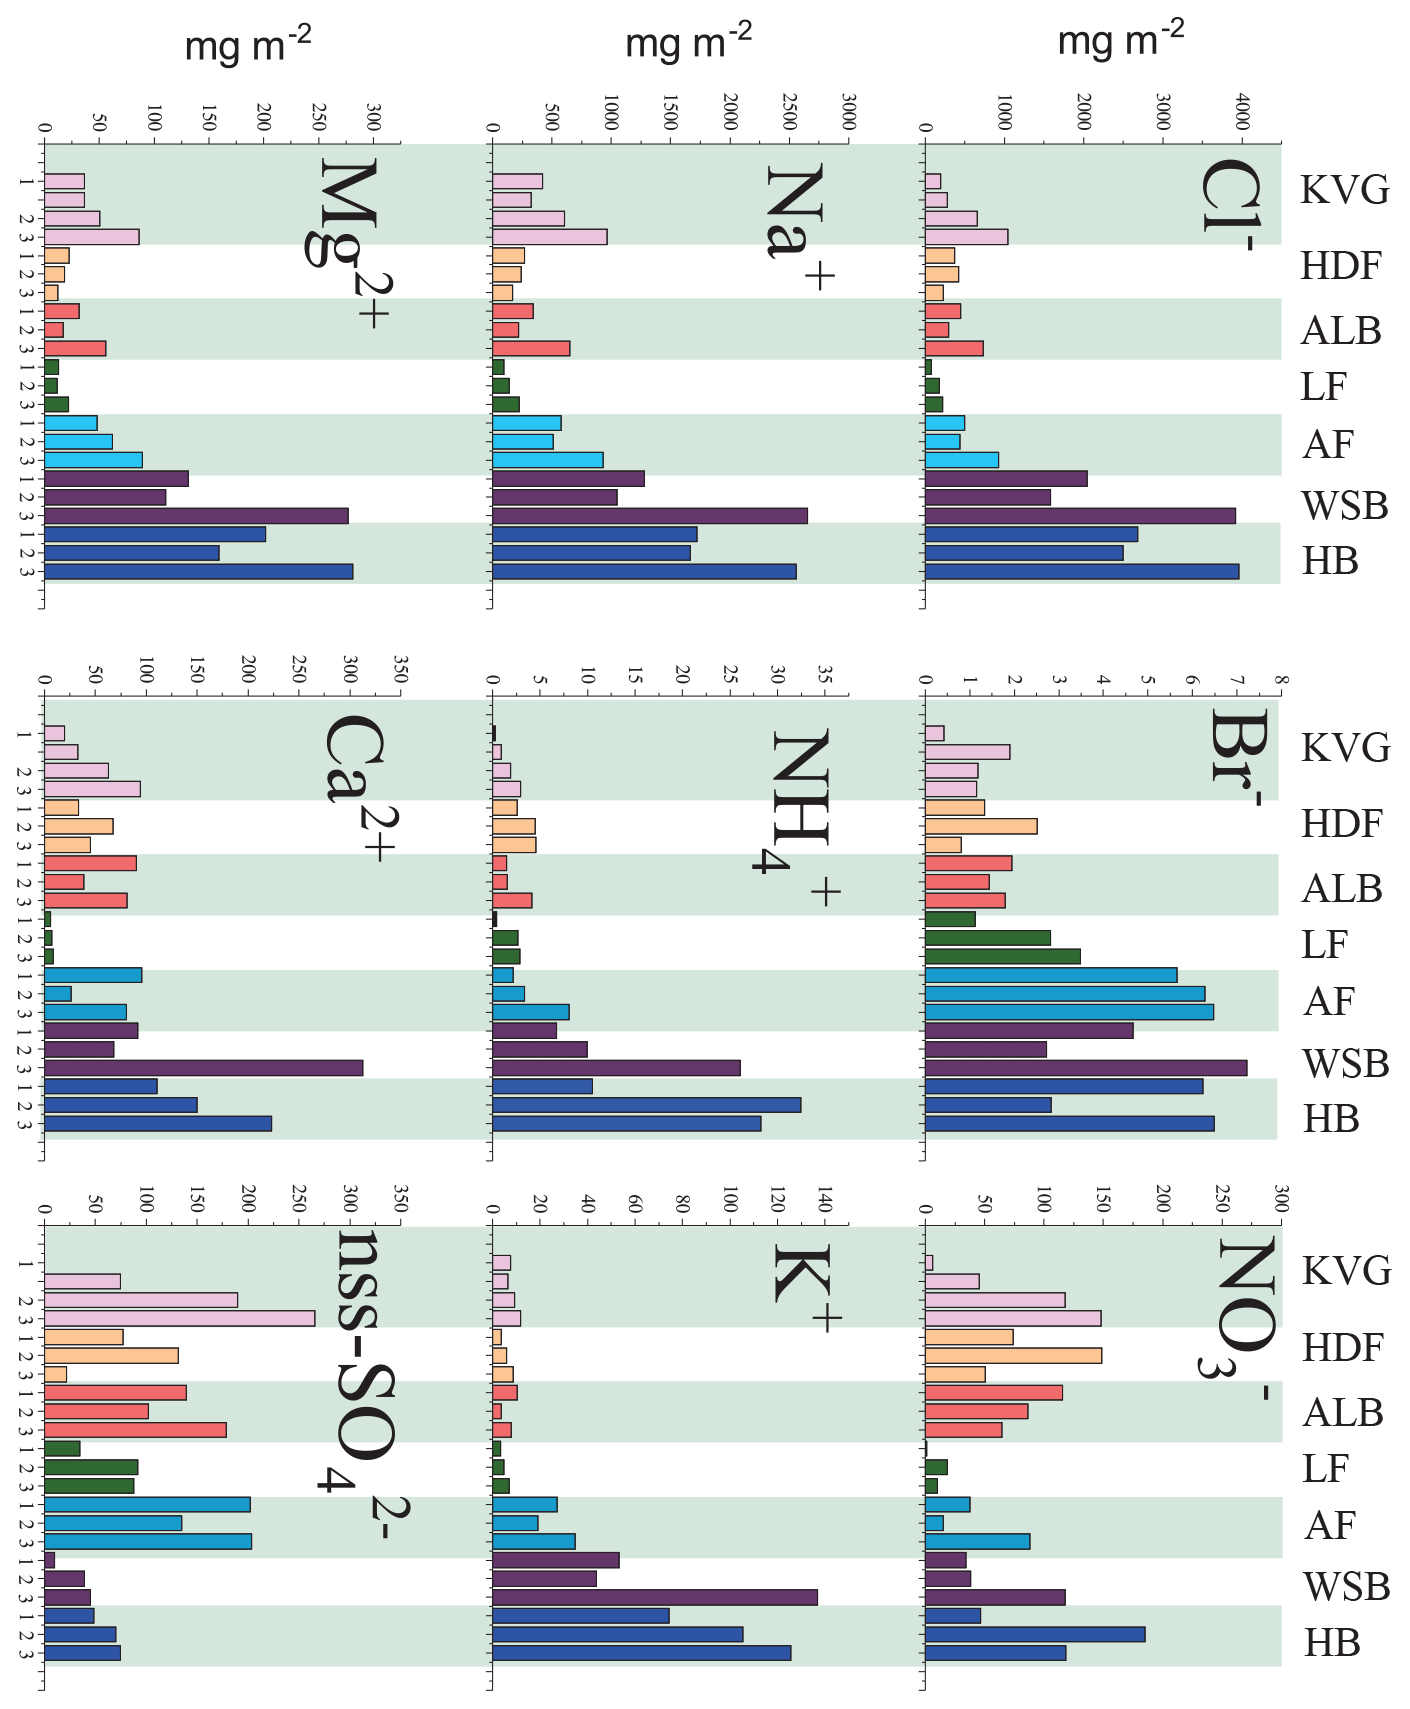
Figure 2Calculated ionic loads in the snowpack (mg m−2) at the seven glacier sites sampled during the C2S3 project. Snowpits for each glacier are marked with the same colour and ordered from lower (left) to higher altitudes (right). For the KVG another snowpit was dug between glacier zones 1 and 2. Abbreviations: KVG=Kongsvegen, HDF=Holtedahlfonna, AF=Austfonna, ALB=Austre Lovénbreen, LF=Lomonosovfonna, HB=Hansbreen, WB=Werenskiöldbreen.
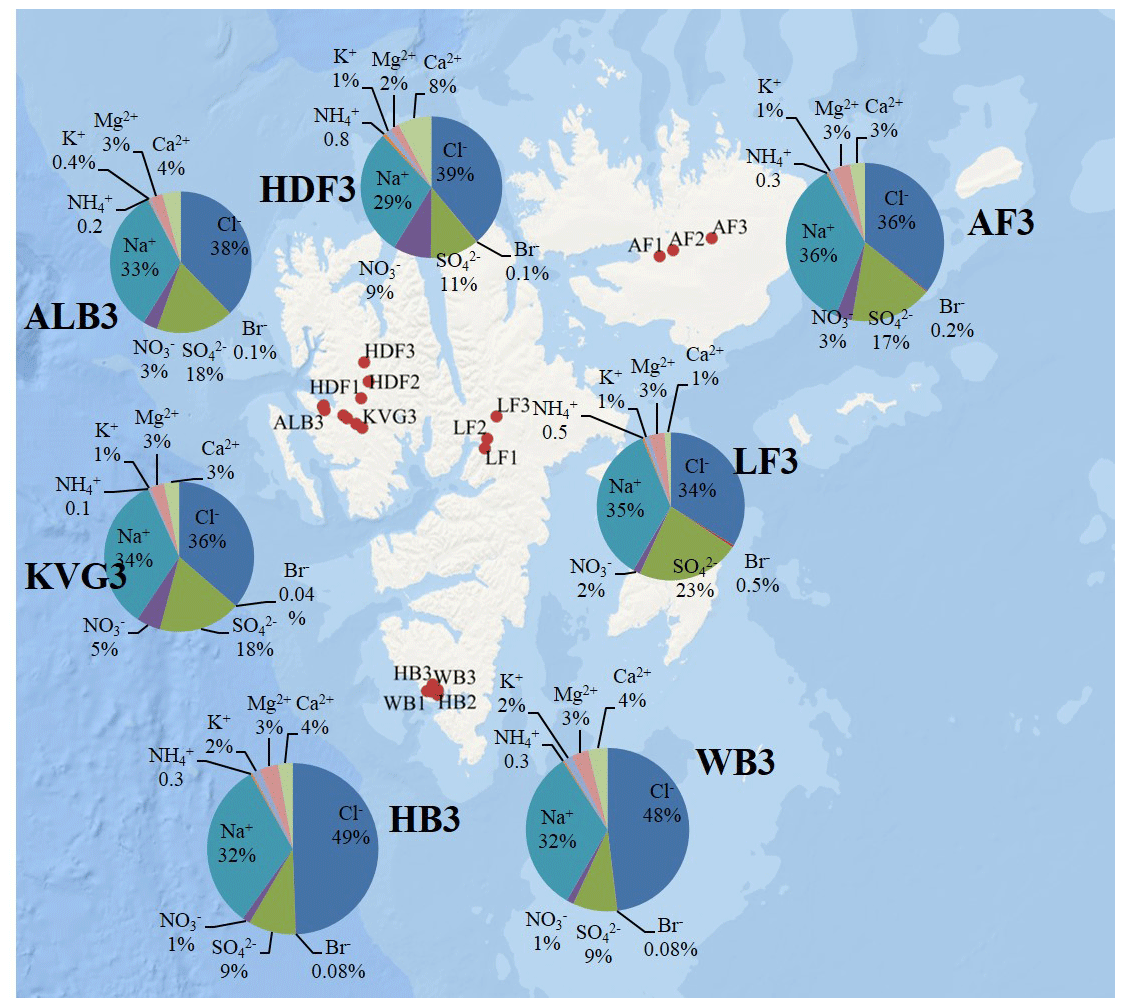
Figure 3Pie diagrams showing relative ionic composition in the snowpits dug in the accumulation zones of the studied glaciers.
Table 2Total load (mg m−2) of major ions, calculated as the sum of loads in all layers of each snowpit. Sea-salt sulfate (ss-) and non-sea-salt sulfate (nss-) are expressed as mg m−2, while chloride depletion () is given as a percentage and bromide enrichment (Brenr) refers to an enrichment compared to seawater composition.

Snowpit samples collected in the Hornsund area (HB and WB, southern Spitsbergen) show a markedly higher total load for all major ions (Figs. 1 and 2) than at all other sites. The samples collected in the accumulation zones of WB and HB have total ionic loads of 8161 and 8023 mg m−2, respectively, 4 times higher than those collected in the accumulation zone of KVG (2861), AF (2607), and ALB (1934) and 16 times higher than those sampled at LF (639) and HDF (583 mg m−2). Similar differences are observed for the snowpits collected at lower altitudes (Fig. 2).
In the accumulation zone of all glaciers (Fig. 3), Na+ and Cl− are generally the most abundant ionic species, with percentages ranging from 29 % (HDF) to 36 % (AF) for Na+ and from 34 % (LF) to 48 % (HB and WB) for Cl−, respectively. The snowpack on Hornsund glaciers (HB, WB) has higher Cl− percentages (48 %–49 %) compared to that of other glaciers (34 %–39 %), while conversely the percentage is lower there (9 %) than on other glaciers (11 %–23 %). The ionic loads are generally highest in the accumulation zone of glaciers and lowest in the ablation zone (Fig. 2), mostly due to the lower snow accumulation. This pattern holds true for Na+, Cl−, , K+, Ca2+, and Mg2+ at most glacier sites, except in the Hornsund area. The load of Br− is similar on glaciers of the Ny-Ålesund sector (ALB, HDF, KVG) and on LF but is higher in AF and Hornsund glaciers (HB, WB; Fig. 2). The load of is similar for all glaciers, except for LF, where very low loads are found. Unlike total , the non-sea-salt fraction of sulfate (nss-), calculated using a seawater mass ratio of 0.252 (Millero et al., 2008), shows lower loads on Hornsund glaciers (15–107 mg m−2) when compared to glaciers in other parts of the archipelago (Fig. 1, Table 2). The nss- loads vary between 22 and 131 at HDF and LF, between 75 and 266 at KVG and ALB, and between 153 and 206 mg m−2 at AF.
3.2 Stable water isotopes (δ18O and δ2H)
Our results provide the first picture of spatial variations in the mean stable water isotope composition of the seasonal snowpack across Svalbard (Table 3, Fig. 4). The SWE-weighted mean δ18O and δ2H are calculated using the formula , where δi are the δ values of each layer, SWEi are the SWE of each layer, and SWEt is the SWE of the entire snowpit. These SWE-weighted mean values decrease significantly from south to north (Spearman rank correlation ρ with latitude is −0.69 and −0.65 for δ18O and δ2H, with p<0.001 and p<0.01, respectively). The isotopically heaviest snow (least negative δ values) occurs on glaciers of the Hornsund area (δ18O: −11.25 ‰ to −9.54 ‰; δ2H: −77.62 ‰ to −63.64 ‰) and the isotopically lightest (most negative δ values) in AF (δ18O: −16.00 ‰ to −13.89 ‰; δ2H: −111.15 ‰ to −96.89 ‰). Glacier sites in north-western Spitsbergen (KVG, ALB, and HDF) and on LF have mean δ18O and δ2H values that fall within these ranges. On KVG, ALB, HDF, and LF, δ18O and δ2H values in snow decrease monotonically (becoming gradually more negative) with increasing elevation. On the other hand, on AF, WB, and HB there is no statistical difference between the mean δ18O and δ2H values of all snowpits (Fig. 4). A general significant anticorrelation with altitude is found for SWE-weighted mean δ2H (, p<0.01) and δ18O (, p<0.01).
Table 3Volume-weighted mean concentrations of major ions in each snowpit (calculated as the sum of loads in all layers divided by the total SWE of the snowpit): the nss (non-sea-salt) fractions have been calculated in each layer before the volume-weighting procedure. Average SWE-weighted stable water isotope ratios (δ18O and δ2H expressed as ‰) and average deuterium excess (d) are also reported.
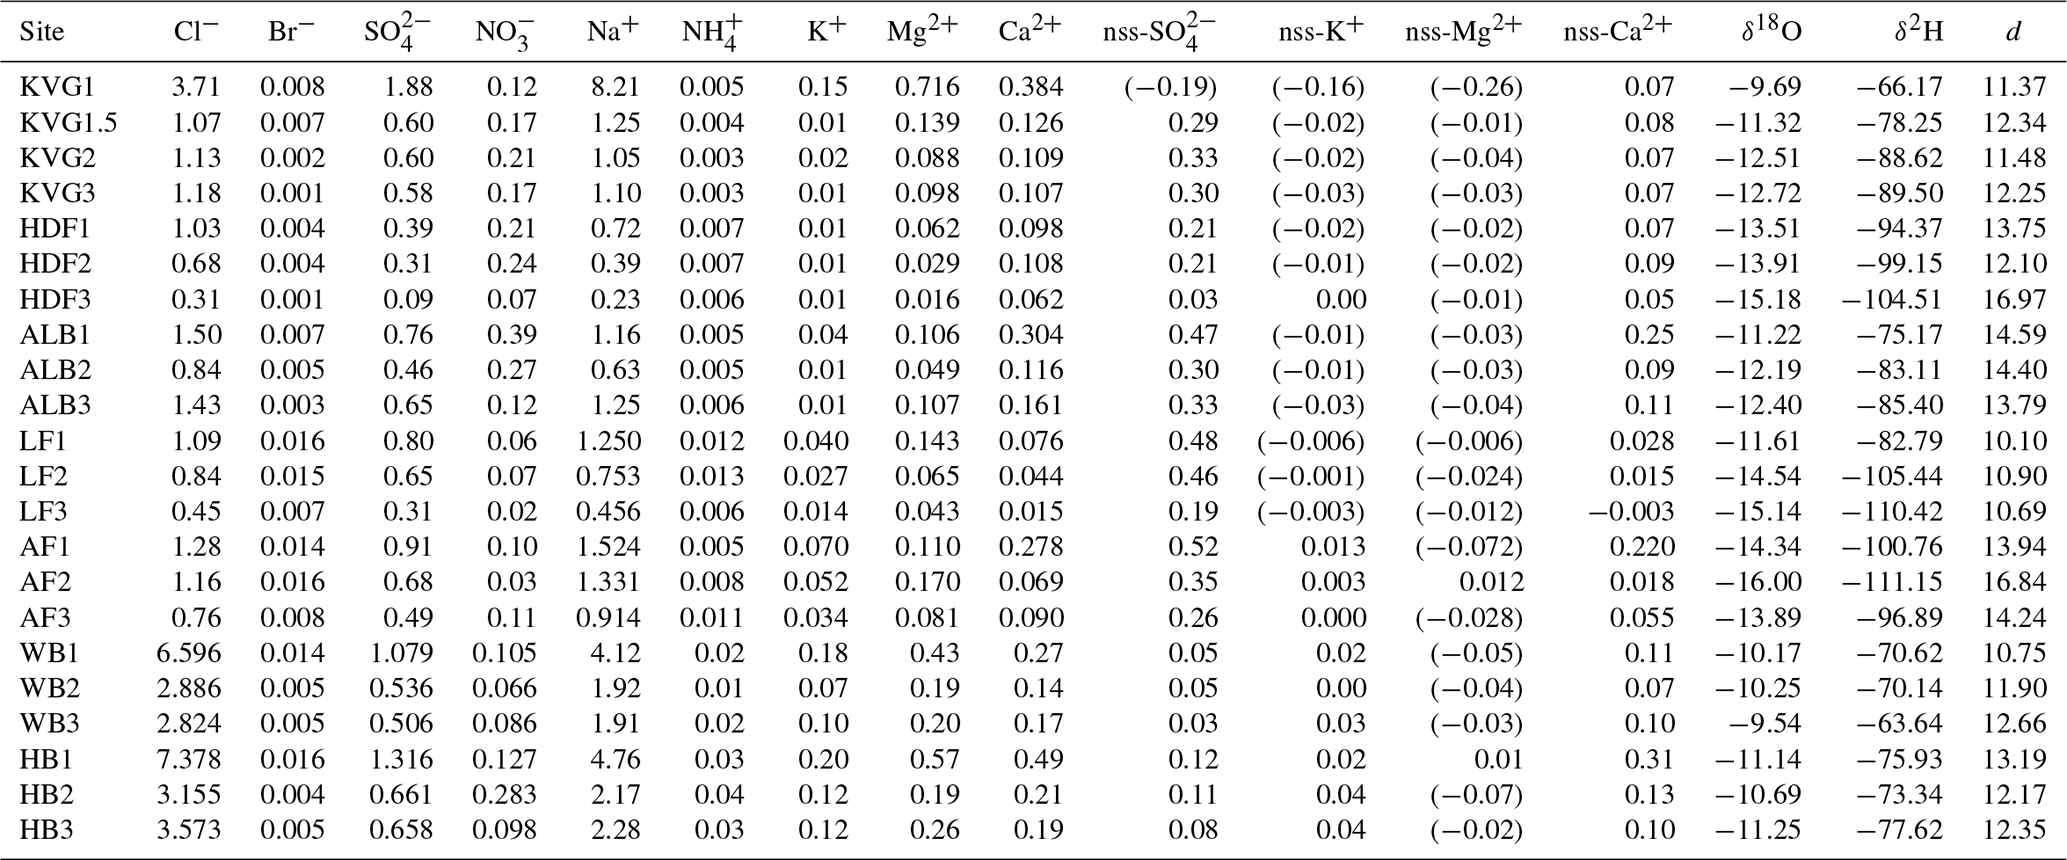
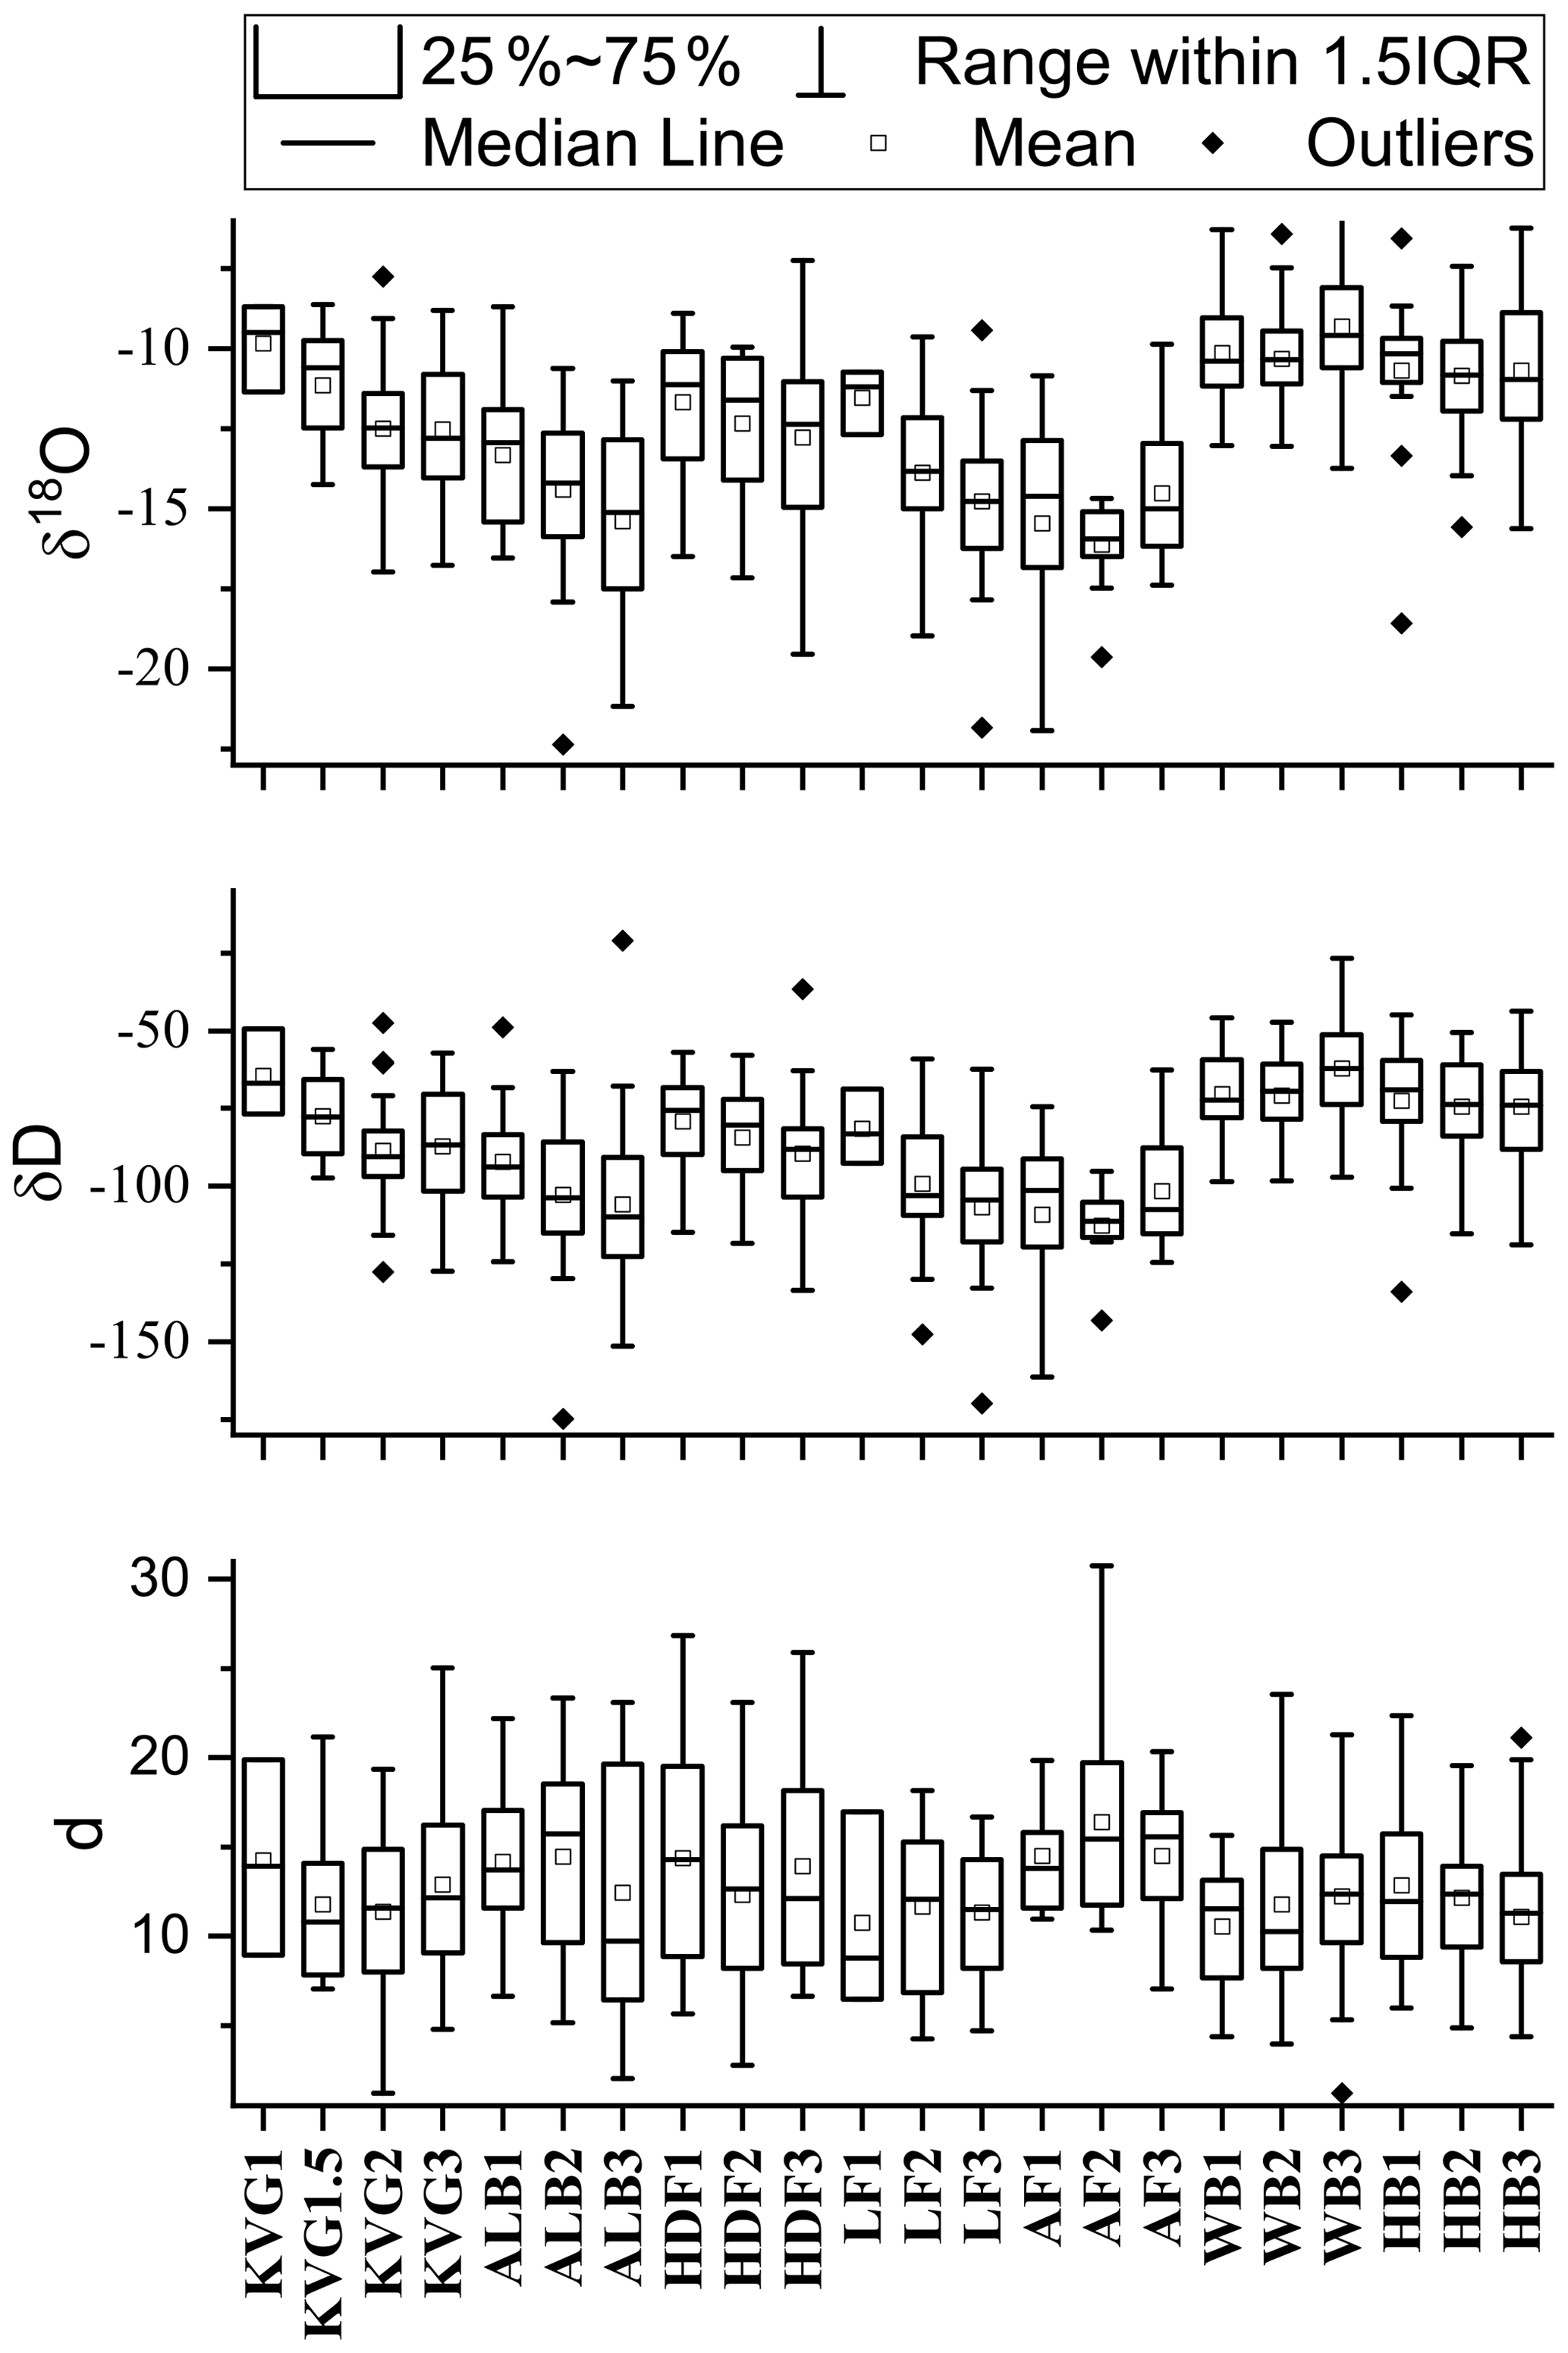
Figure 4Box plots of stable water isotopes (δ18O and δ2H) and deuterium excess (d) for each snowpit.
There have been few published studies on recent seasonal snow or firn chemistry in Svalbard, hence comparisons of our data with these earlier results are limited to a few sites. Virkkunen et al. (2007) and Vega et al. (2015) quantified the annual chemical loads of Na+, Ca2+, , and nss- at the Lomonosovfonna summit (LF3) from 2002 to 2011 using snow and firn cores. In Table 4, we also report the unpublished data of samples collected in 2009–2011 by C. Vega, obtained using the methods outlined in Sect. 2.2. Our study extends these data to 2016. The range of annual ionic loads at LF3 over the 15-year period is wide, and no clear temporal trend can be identified (Table 4). At the Holtedahlfonna summit (HDF3), firn core measurements by Spolaor et al. (2013) found a mean Na+ concentration of 110±73 ng g−1 over the period 2003–2012, while the mean concentration in the April 2016 snowpack (this study) was 191 ng g−1, hence within the range reported in earlier years.
Table 4Loads (mg m−2) of selected major ions from the 2016 sampling and from earlier studies at the Lomonosovfonna summit (LF3), corresponding to the concentrations given in Fig. 4.
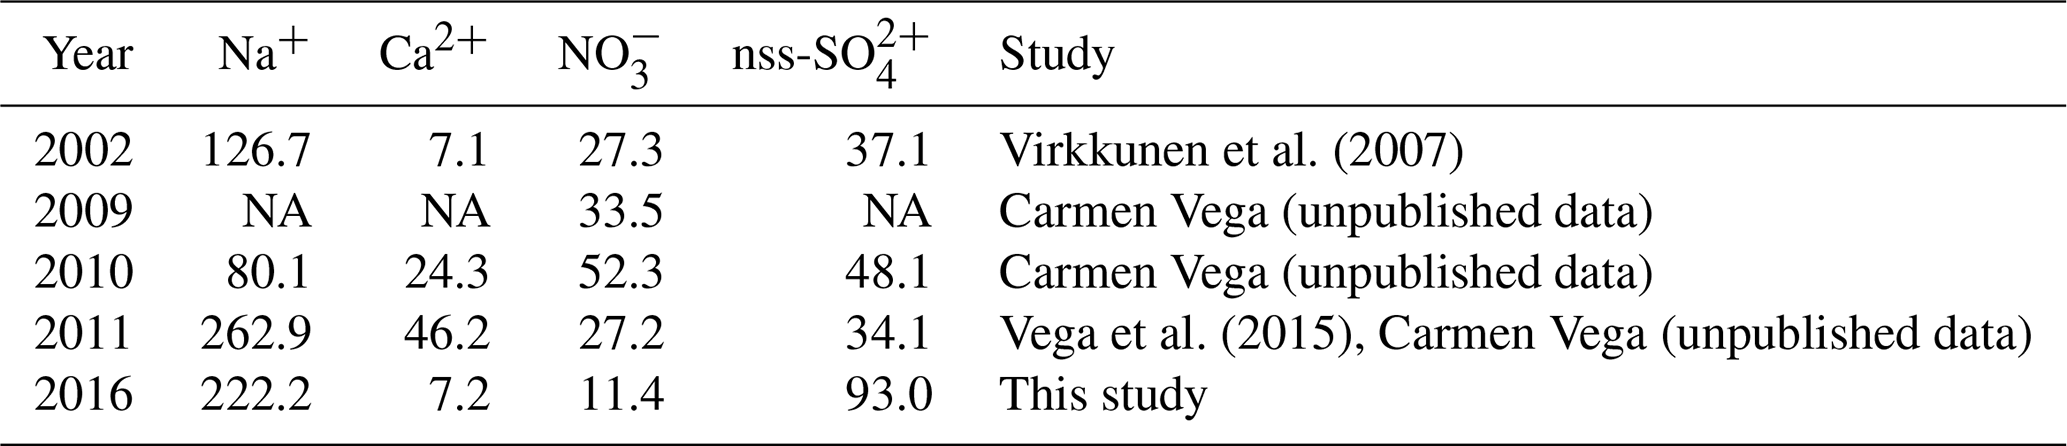
NA stands for not available.
4.1 The main ion sources in the seasonal snow of Svalbard
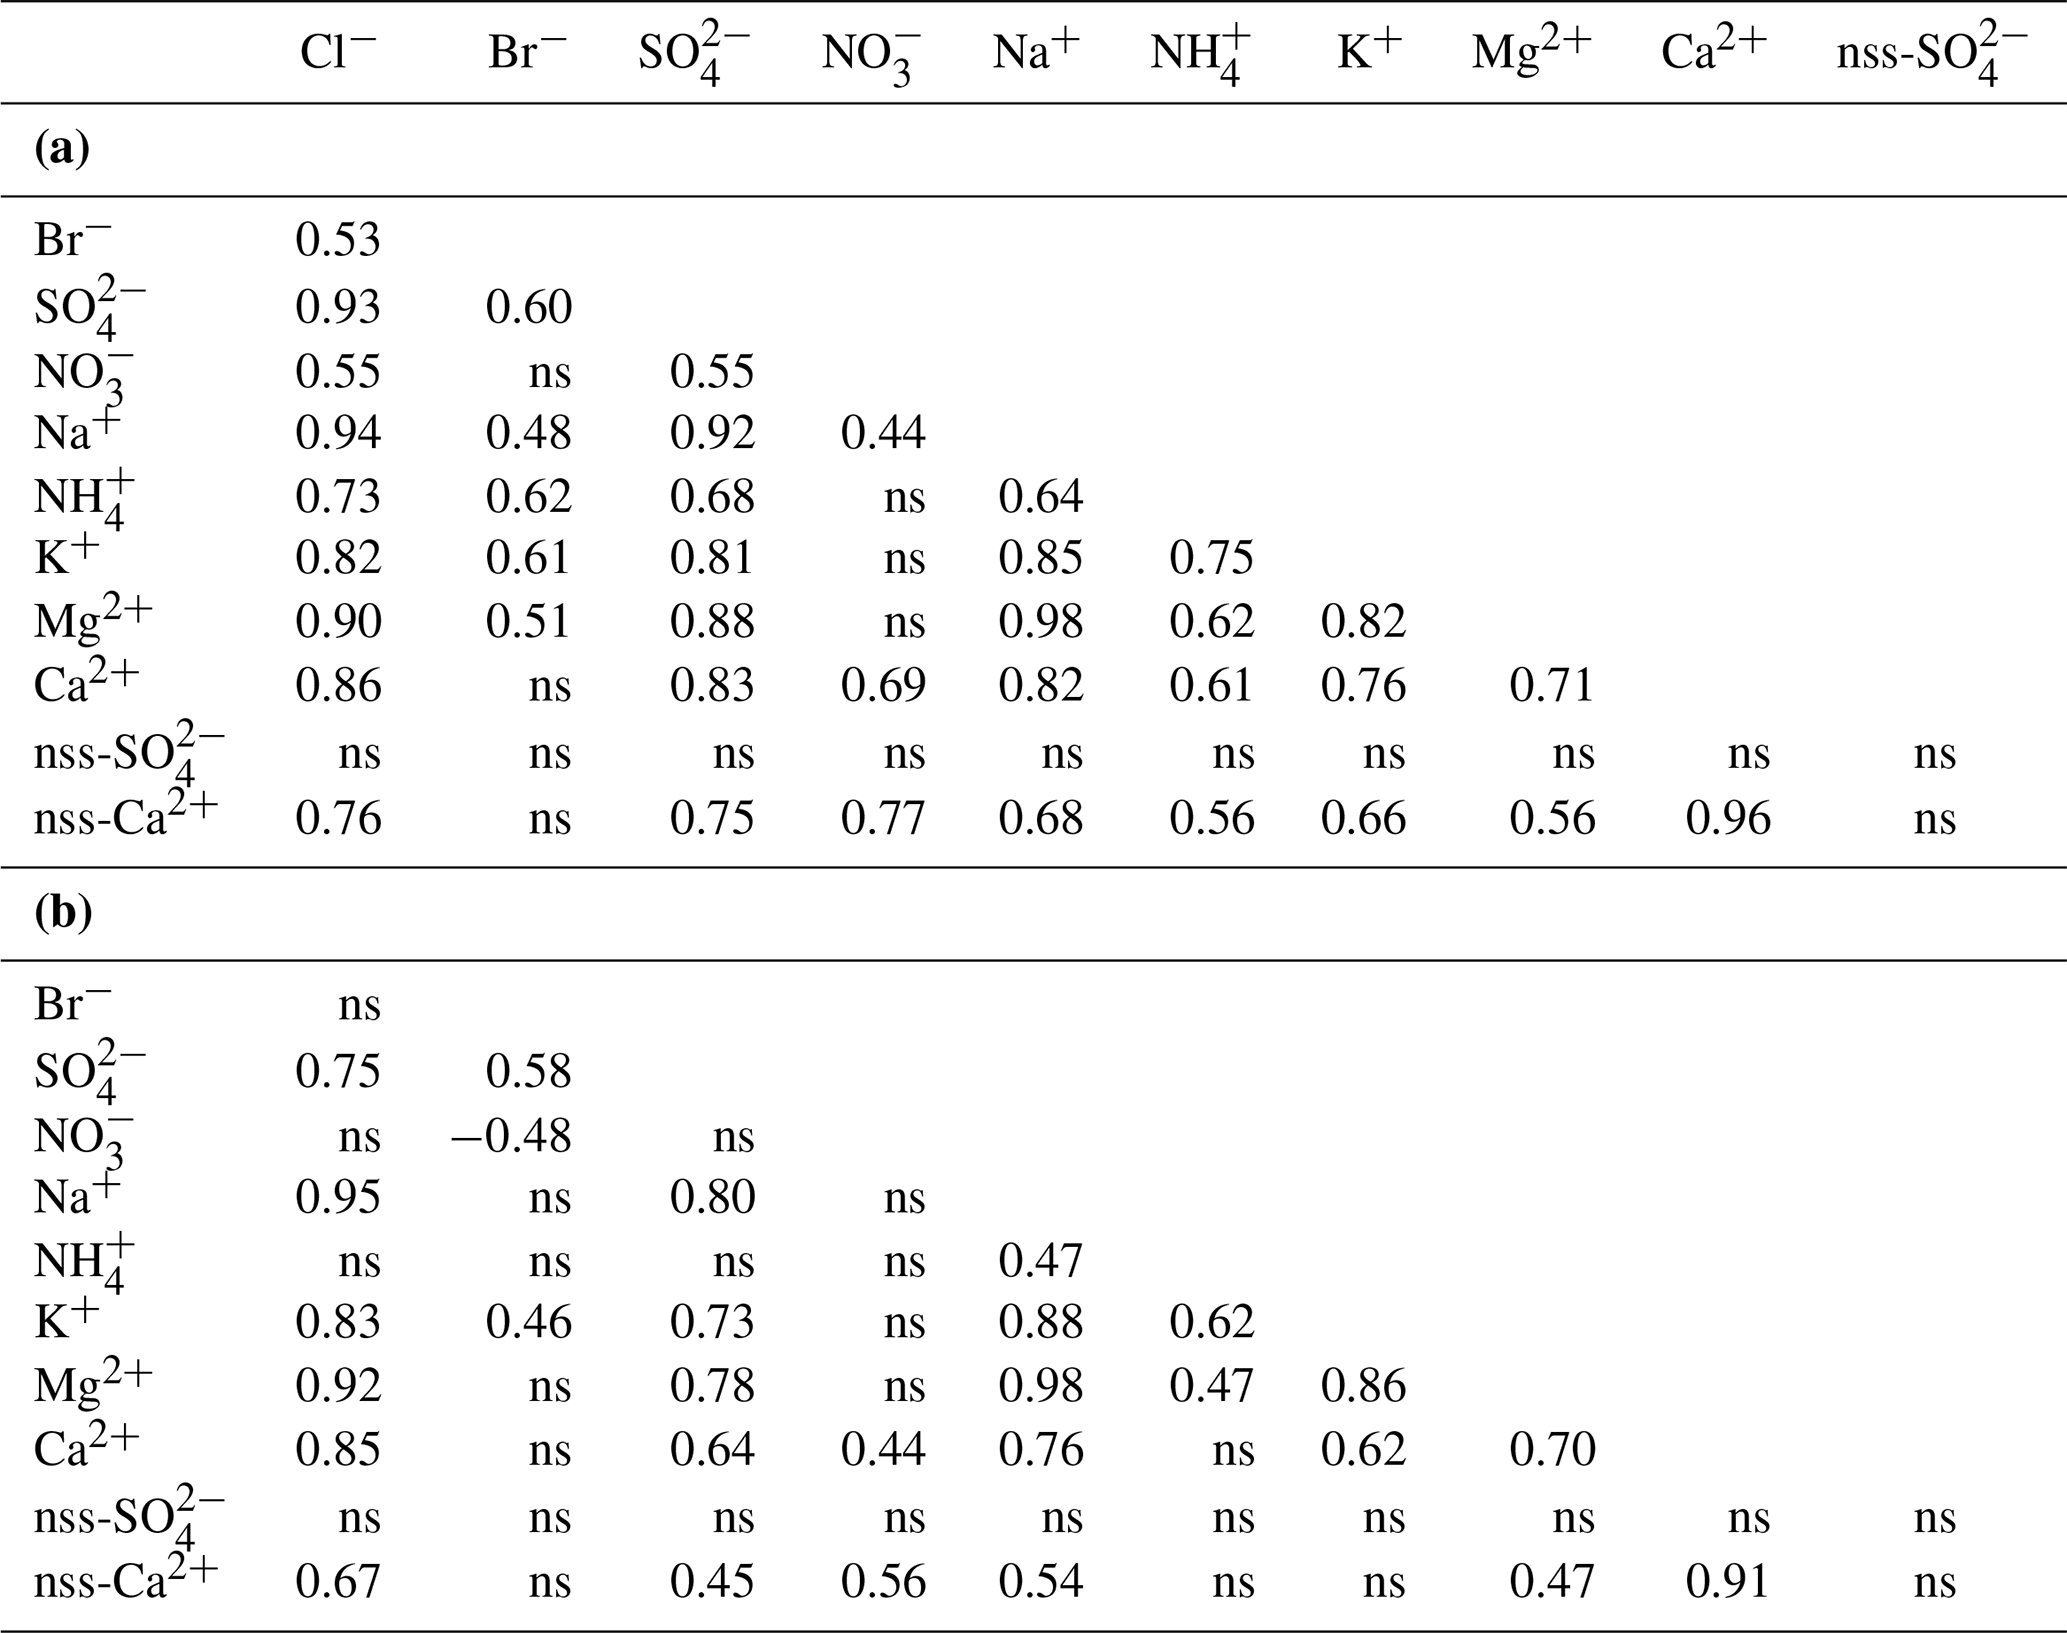
The composition of the Svalbard seasonal snowpack sampled during the C2S3 project clearly indicates that the ocean is the main source of ions in snow, as was shown by Hodgkins and Tranter (1998). At all sites, the dominant ions are Na+, Cl−, and , with comparatively minor amounts of K+, Ca2+, and Mg2+ (Fig. 3). To help clarify the possible sources and modes of deposition of ions in snow, we computed Spearman rank correlations between total ionic loads (ρload), as well as between volume-weighted mean ionic concentrations (ρconc), across all snowpits (n=22; Table 5). The chemical species that are predominantly wet-deposited, sharing common sources and not undergoing significant composition changes in transport should exhibit similar concentration patterns (high ρconc) (Schüpbach et al., 2018). The concentrations of Mg2+, K+, and Ca2+ are all positively correlated with those of Na+ and Cl−, indicating a common sea-spray source. Moreover, this input is the single significant source of K+ and Mg2+, as indicated by near-zero calculated values of nss-K+ and nss-Mg2+ in the sampled snowpits (Table 3). The ρload correlations are very similar for these ionic species, which points to both wet and dry deposition being a significant mechanism in their accumulation in the snowpack.
Table 5Spearman rank order correlations of (a) ionic loads (mg m−2) and (b) SWE-weighted mean concentrations of major ions across all seven glaciers (n=22 locations). ns: non-significant correlations (p value>0.05). Ionic loads were calculated from all snowpit layers, while SWE-weighted mean concentrations were calculated by dividing the total ionic loads in each snowpit by its total SWE. Non-sea-salt (nss) components were estimated based on seawater ratios: is 0.038, while is 0.252 (w w−1; Millero et al., 2008).
The concentrations of Mg2+ are positively and significantly correlated with both Ca2+ and nss-Ca2+ (ρconc=0.70 and 0.47, respectively; the latter coefficient is higher for loads at 0.56; Table 5), suggesting that they share some non-marine source(s). Furthermore, all glaciers have greater ratios than seawater (0.32; Fig. 5; Millero et al., 2008). It is likely that the excess Ca2+ and Mg2+ come from mineral particles, i.e. CaCO3 (calcite) and CaMg(CO3)2 (dolomite), derived from local rock (or soil) dust (Kekonen et al., 2005), especially limestone, dolostone, and marble, which are abundant in Svalbard (Dallmann, 1999). The presence of carbonate ions in the collected snow samples would explain the missing negative charge in the ionic balance (anion X−; Fig. S1 in the Supplement).
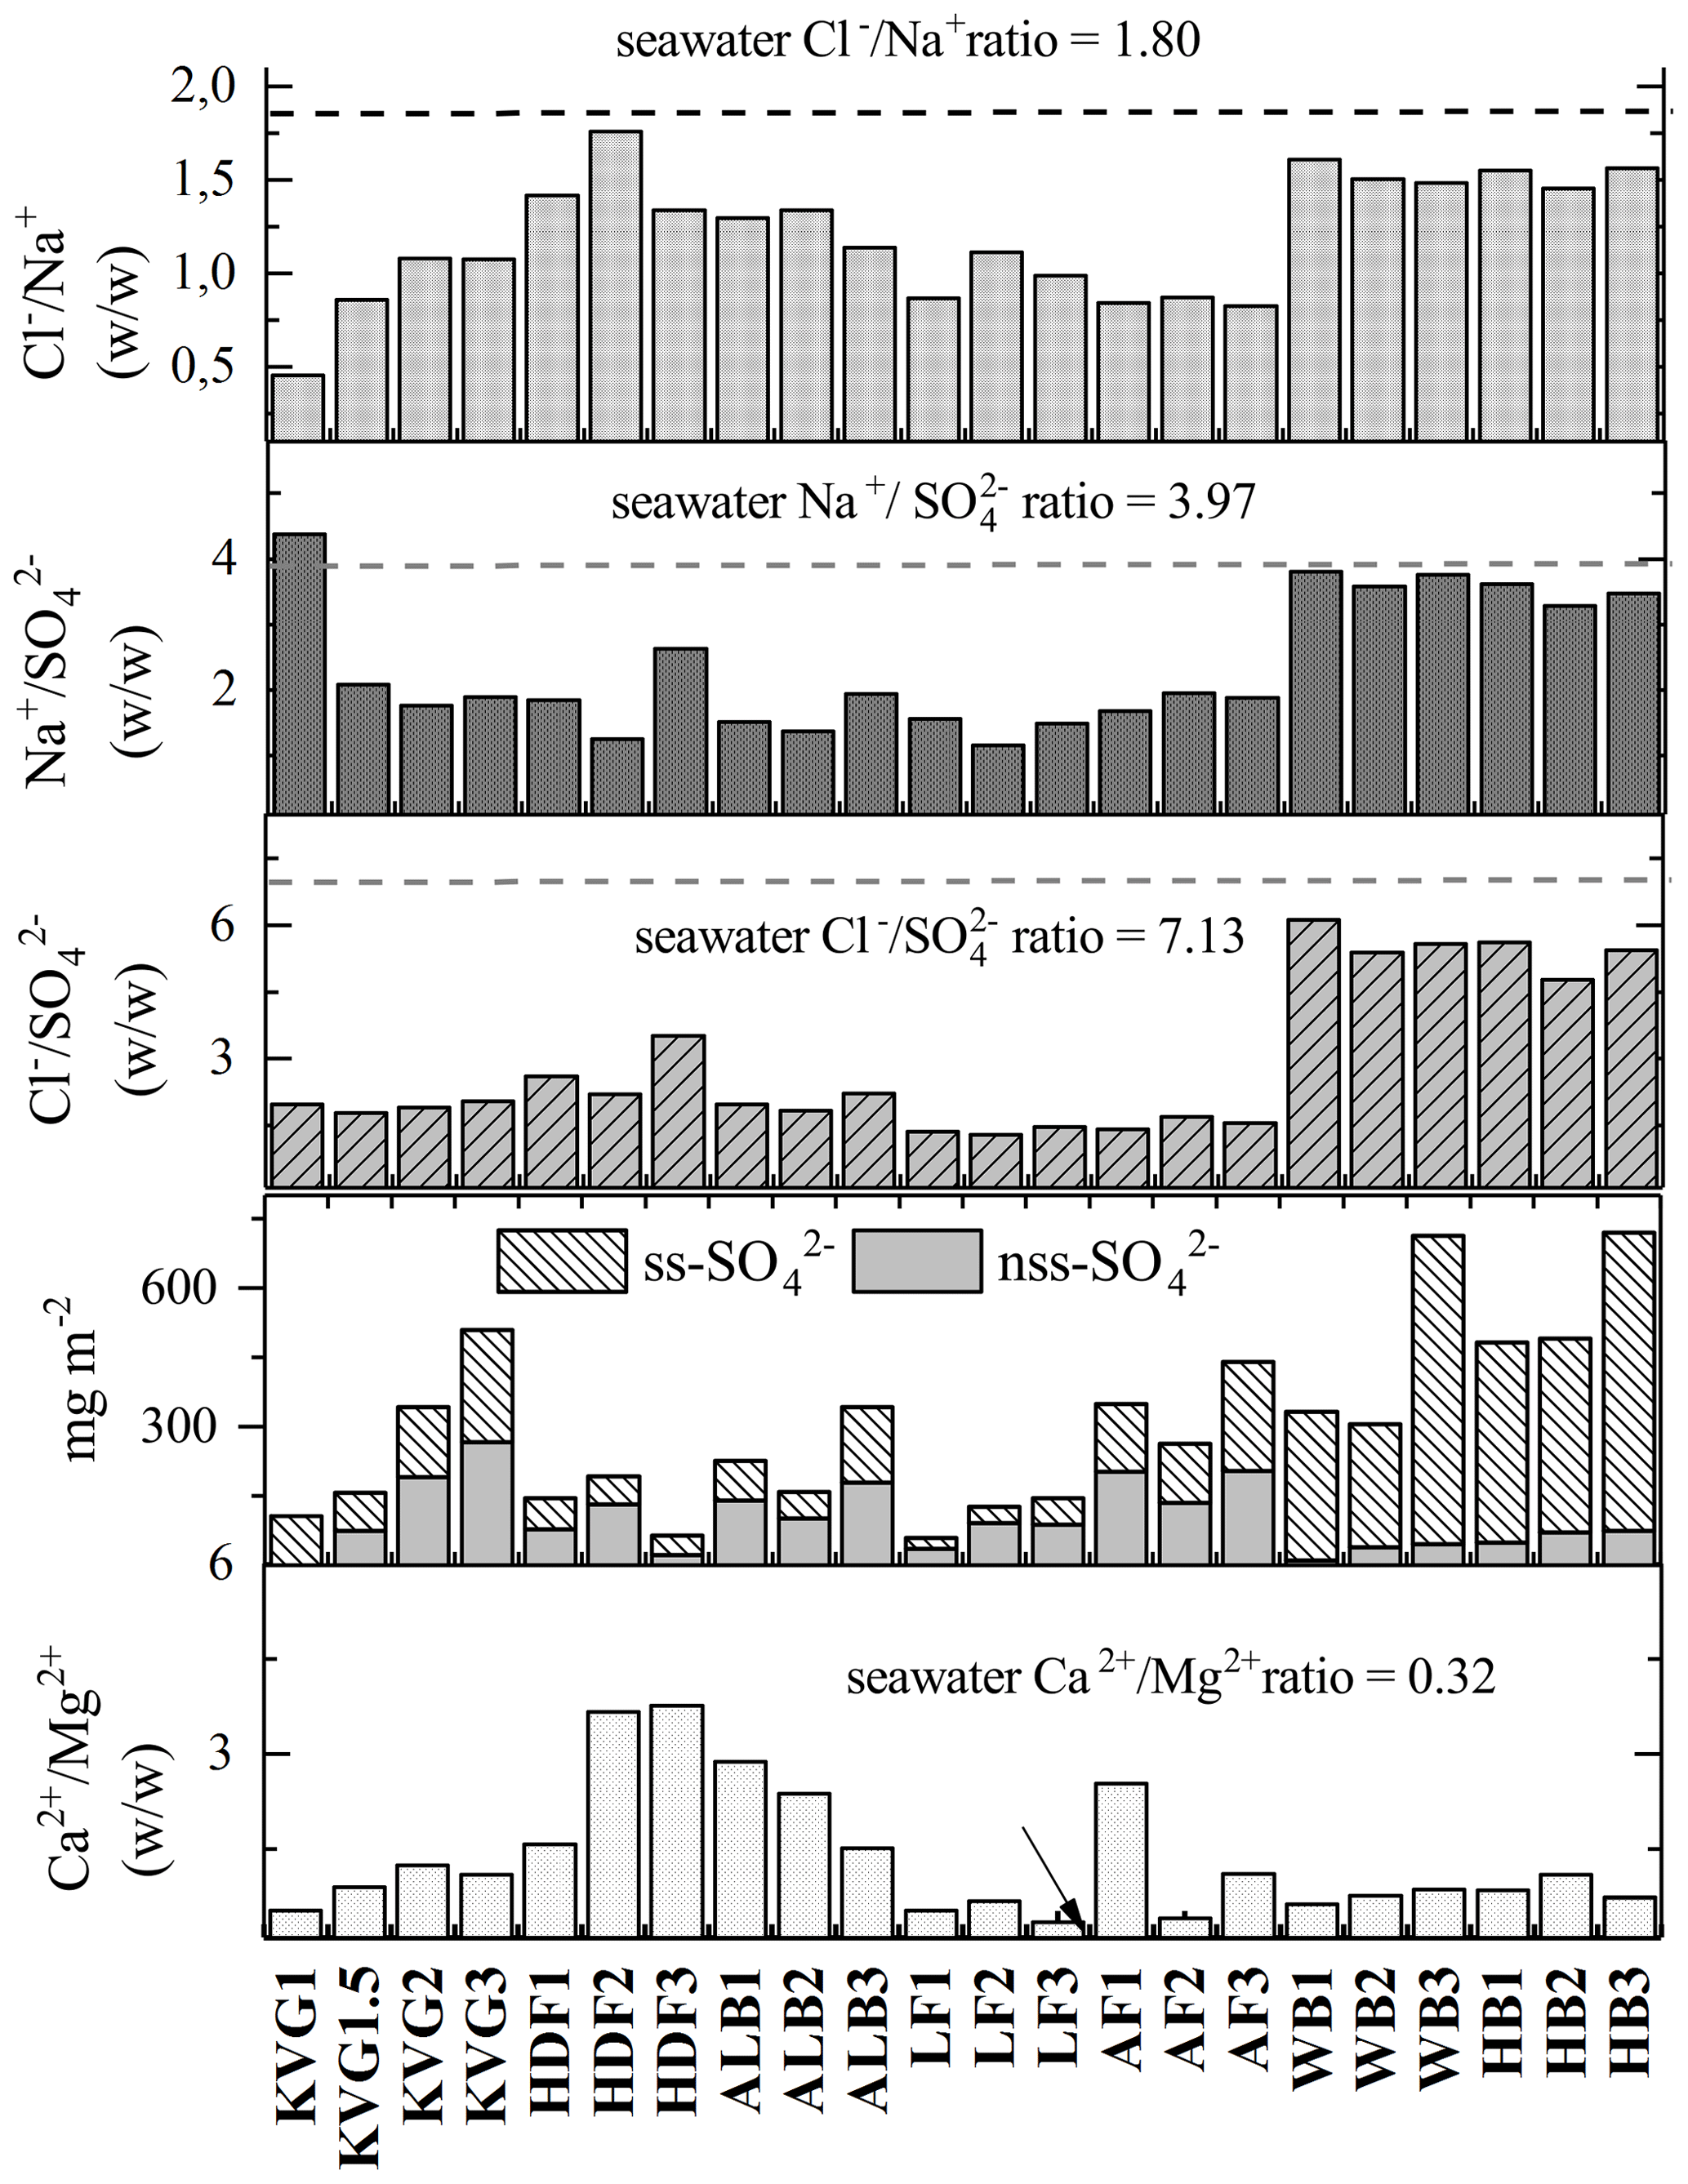
Figure 5Panels from top: (1) ; (2) ; (3) ; (4) the total loads of sea-salt sulfate (ss-) and non-sea-salt sulfate (nss-); and (5) for all glaciers investigated during the C2S3 project (in spring 2016).
Sulfate () is highly and significantly correlated (p<0.05) with both Na+ (ρload=0.92; ρconc=0.80) and Cl− (ρload=0.93; ρconc=0.75), indicating that sea spray is its main source (Table 5). However, and ratios are well below seawater values (Millero et al., 2008) on most glaciers except for those near Hornsund (WB and HB), suggesting input of nss- (Fig. 5). Biogenic nss- can occur in snow as an oxidized by-product of dimethyl sulfide (DMS) emitted by marine algal blooms (Gondwe et al., 2003), typically initiated in April but sometimes later (Ardyna et al., 2013). Another plausible source of nss- deposition in Svalbard is long-range atmospheric transport of secondary aerosols containing , such as ammonium sulfate. This sulfate can be formed by SOx emitted from coal combustion throughout the winter and biomass burning in the spring (Barrie, 1986; Law and Stohl, 2007; Nawrot et al., 2016). The nss- does not correlate significantly with other ionic species, suggesting a separate origin. However, we need to caution that in the southern region of Svalbard, the estimation of ss- is subject to higher uncertainty because of the higher amount of Na+ in the atmospheric deposition there.
Bulk ionic loads of in the snowpits are significantly and positively correlated with those of (ρload=0.55) and (ρload=0.68), but the correlations between weighted mean ionic concentrations are not significant, hinting at co-deposition (wet) rather than shared sources (Table 5). These species are known to form secondary aerosols (Karl et al., 2019; Schaap et al., 2004), and thus their proportions in aerosols may differ significantly from those in their source emissions. It is also possible that nitrogen species underwent further post-depositional photochemical reduction and evasion, thereby reducing their concentrations in snow (Curtis et al., 2018). Finally, we remark here that the snowpit sampling was done in April, earlier than the beginning of the oceanic algal bloom in the surrounding Svalbard basin, which could have led to an underrepresentation of biological emissions from late spring in our samples.
Spatial variations of ammonium load () across Svalbard glaciers mirror the pattern shown by sea-salt ions, with higher loads in the Hornsund area and lower loads in other areas. This is also reflected by significant correlations (Table 5) of the bulk loads of with those of Na+ and Cl− (ρload=0.64 and 0.73, respectively) and with Na+, K+, and Mg2+ by concentration (ρconc=0.47, 0.62, and 0.47, respectively). Ammonium has been linked to biogenic, forest fire, and anthropogenic agricultural emissions (Trachsel et al., 2019). The higher annual snowpack load of determined in the Hornsund area is more likely connected with biological sources than anthropogenic activities, although some contribution from biomass burning events cannot be excluded. The marine primary productivity in spring 2016 (April and May) was higher in the south-eastern ocean sector of the Svalbard archipelago (Fig. S2), which could partially explain the higher load. This would also explain the correlation between ammonium and sea-salt ions (Table 5). Locally, especially for HB, there may be extra emissions from bird colonies (Keslinka et al., 2019; Wojczulanis et al., 2008).
Unlike , the bulk loading of in snow is highest in north-western Spitsbergen (Ny-Ålesund area) when compared to other parts of Svalbard. Deposition of in Arctic snow is often associated with the long-range atmospheric transport of NOx and related N species from anthropogenic source regions at lower latitudes (Björkman et al., 2014; Fibiger et al., 2016; Vega et al., 2015). Differences in loads in snow in various parts of Svalbard might therefore reflect differences in the transport pathways of precipitating air masses, including the formation of secondary aerosols, or post-depositional processes, rather than local emissions. While local shipping routes and the settlement of Ny-Ålesund itself may contribute emissions (Winther et al., 2014), the highest share of the total ionic load of was found in the accumulation zone of HDF (9 % of the total ionic load; Fig. 3). Given that HDF is the most remote site from Ny-Ålesund relative to KVG or ALB, it should not capture a high share of local pollution. The highest correlation coefficient for , in terms of both concentrations and loads, was found with nss-Ca2+. This would support both the formation of calcium nitrate in the atmosphere (Gibson et al., 2006) or post-depositional processes removing the from layers poor in Ca2+, since calcium has been hypothesized to stabilize the nitrate in the snowpack against post-depositional losses (Kekonen et al., 2017).
4.2 Chlorine depletion
Although Na+ and Cl−, the main species of sea salt, are significantly correlated (ρconc=0.95, Table 5), the values of the ratio (1.8 w w−1) in snow are lower than that in seawater on most studied glaciers, except those near Hornsund (Fig. 5), suggesting a Cl− deficit at the more northerly sites. Whillow et al. (1992) found an opposite situation in the snowpack of Greenland, indicating values higher than the ratio of seawater. This Cl− enrichment relative to the ratio in seawater may reflect Cl derived from anthropogenic sources as well as from gas-phase chlorine transportation and deposition in central Greenland.
Contrastingly, a possible explanation of Cl− deficit in the Svalbard snowpack might be de-chlorination of the sea-spray aerosol during transport or, less likely, at the snow–atmosphere interface. This reaction occurs between sea-salt particles, containing NaCl, and HNO3, H2SO4, or organic acids to release gaseous HCl (Zhuang et al., 1999). We calculated the percentage of Cl− depletion () as , where , and and are the measured equivalent concentrations (Yao et al., 2003). Except for site HDF2 ( %), the lowest mean values were obtained for Hornsund glaciers (WB, HB: 10 %–19 %), while values at other glacier sites ranged between 21 % and 75 % (Table 2). This suggests that sea-salt aerosols travel along a route from southern to northern Svalbard, which gives more time for Cl− depletion in the ionic mixtures reaching more northerly locations.
4.3 Bromine enrichment
In addition to Cl−, snowfall can scavenge Br− (Peterson et al., 2019; Spolaor et al., 2019). Br− loads on Svalbard glaciers surveyed in April 2016 are positively and significantly correlated with those of primary sea-salt ions Na+ (ρload=0.48), Cl− (ρload=0.53), and Mg2+ (ρload=0.51) (Table 5). Correlations between weighted mean concentrations are not significant, however, suggesting departures of the Br− concentrations in snow from typical seawater ionic ratios at some glacier sites. A Br− enrichment factor (Brenr) can be calculated as , where 0.0065 is the seawater mass ratio (Maffezzoli et al., 2017). The Brenr reflects specific processes (in particular sea-ice Br emission) that affect the Br− concentration and load in the snowpack (Spolaor et al., 2014). Results of our calculations (Table 2, Fig. S3) show that for glaciers of the Hornsund area (HB and WB) and north-western Spitsbergen (KVG, ALB and HDF), the mean Brenr values are often <1, indicating some Br− depletion, in agreement with the findings of Jacobi et al. (2019) for glaciers in the Ny-Ålesund area. The depletion could be a result of snowpack Br re-emission, but this seems unlikely since field measurements near Ny-Ålesund found no evidence of such volatilization of snow-bound Br (Spolaor et al., 2019).
Alternatively, Br− depletion could occur through BrO loss from marine aerosols and subsequent deposition of these Br-depleted aerosols in snow. In contrast to southern and north-western Spitsbergen, glaciers in central Spitsbergen (LF) and in Nordaustlandet (AF) show Brenr values > 1. These glaciers lie relatively close to areas to the east of the archipelago that are often covered by first-year sea ice. Newly formed sea ice has been shown to release gas-phase Br into the polar atmosphere, thus supplying an extra Br source in addition to sea spray (Spolaor et al., 2016). The spatial distribution of the Br-enriched snowpit sites supports this; i.e. the sites closest to the areas covered by first-year sea ice have the largest Br enrichments and the latter decrease with greater distance from the eastern shores of Svalbard (Fig. S3). A survey of the average sea-ice coverage in the period March–May 2016, which is relevant to the Br enrichment phenomenon, confirms that the north-eastern and eastern shores of Svalbard were indeed covered much more frequently by close and open drift ice than the south or north-west (https://cryo.met.no/en/sea-ice, last access: 1 March 2021).
4.4 Distribution pattern of δ18O and δ2H
As described earlier, the SWE-weighted mean δ18O and δ2H values in glacier snowpits decrease significantly with increasing latitude across Svalbard, the least negative values occurring on glaciers of the Hornsund area and the most negative in Austfonna (Table 3). This pattern follows the climate gradient across the archipelago, milder in the south, colder in the north. Part of the south–north contrast in δ values can be explained by the lower mean altitude of glacier sites in the Hornsund area compared to some of the higher-elevation sites further north on Spitsbergen or on Austfonna. The relationship with elevation is similar for both isotopic ratios in the collected dataset, except that with AF the isotopic signals might be influenced by additional processes since it is an isolated ice cap mainly surrounded by ocean or sea ice in winter.
Deuterium excess () is mainly influenced by the source region of the precipitating moisture and in particular by the sea surface temperature, but also relative humidity and wind speed (Gat, 1996; Uemura et al., 2008). In addition, d is also influenced by the temperature gradient between the moisture source and precipitation area (Johnsen et al., 1989). The SWE-weighted mean d values in Svalbard snowpits vary within a relatively narrow range of 6.74 ‰ (from 10.10 ‰ to 16.84 ‰), and, similarly to δ18O, show no clear gradient with elevation or longitude (Table 3). Deuterium excess shows a significant correlation with latitude, at ρ=0.60 (p<0.01). A more detailed analysis of d by latitude shows that significantly different values are only obtained in snowpits sampled beyond 79.2∘ N, i.e. in Austfonna snowpits. This is confirmed by the Kruskal–Wallis test, i.e. rank-based ANOVA, calculated with two groups of d values divided by the latitude threshold 79.2∘ N (z=4.23, p<0.04). In fact, drawing the latitude threshold anywhere between 78.7 and 79.7∘ N, a statistically significant difference with p<0.05 is obtained. This is consistent with lower temperatures and evaporation rates in the more northern waters around Svalbard and suggests that snowfall on AF is at least partly affected by a different, more northerly moisture source than the rest of the archipelago.
4.5 Effect of elevation: a case study of Na
The glacier survey carried out during the C2S3 project afforded the opportunity to investigate the possible effect of elevation on the ionic composition of the snowpack. To do this, we compared the bulk load and SWE-weighted mean concentration of Na+ across all studied snowpits, ordered by elevation (Fig. 6). Overall, both Na+ load and concentration decrease with increasing altitude (, not significant; , p<0.05). This likely reflects greater local sea-spray aerosol deposition at lower compared to higher glacier sites. We then computed linear (Pearson) correlation coefficients (R, with associated p values) between log-transformed Na+ loading (log (Naload)) and δ18O for all snowpits in the accumulation zones of all seven glaciers (Fig. 7). The calculation was performed with all snow layers. The Na+ load was used as a sea-spray tracer, while the δ18O was assumed to vary with moisture source between discrete snowfall events. We find that the positive correlation between log (Naload) and δ18O increases with elevation from R=0.1 (HB3; 396 m a.s.l.) to R=0.65 (LF3; 1193 m a.s.l.) and reaches a 95 % threshold of significance (R>0.3) for glacier sites above 600 m a.s.l. (KVG, AF, LF, and HDF; Fig. 7). The average distance from the sea is a comparatively negligible factor in explaining the correlation between log (Naload) and δ18O.
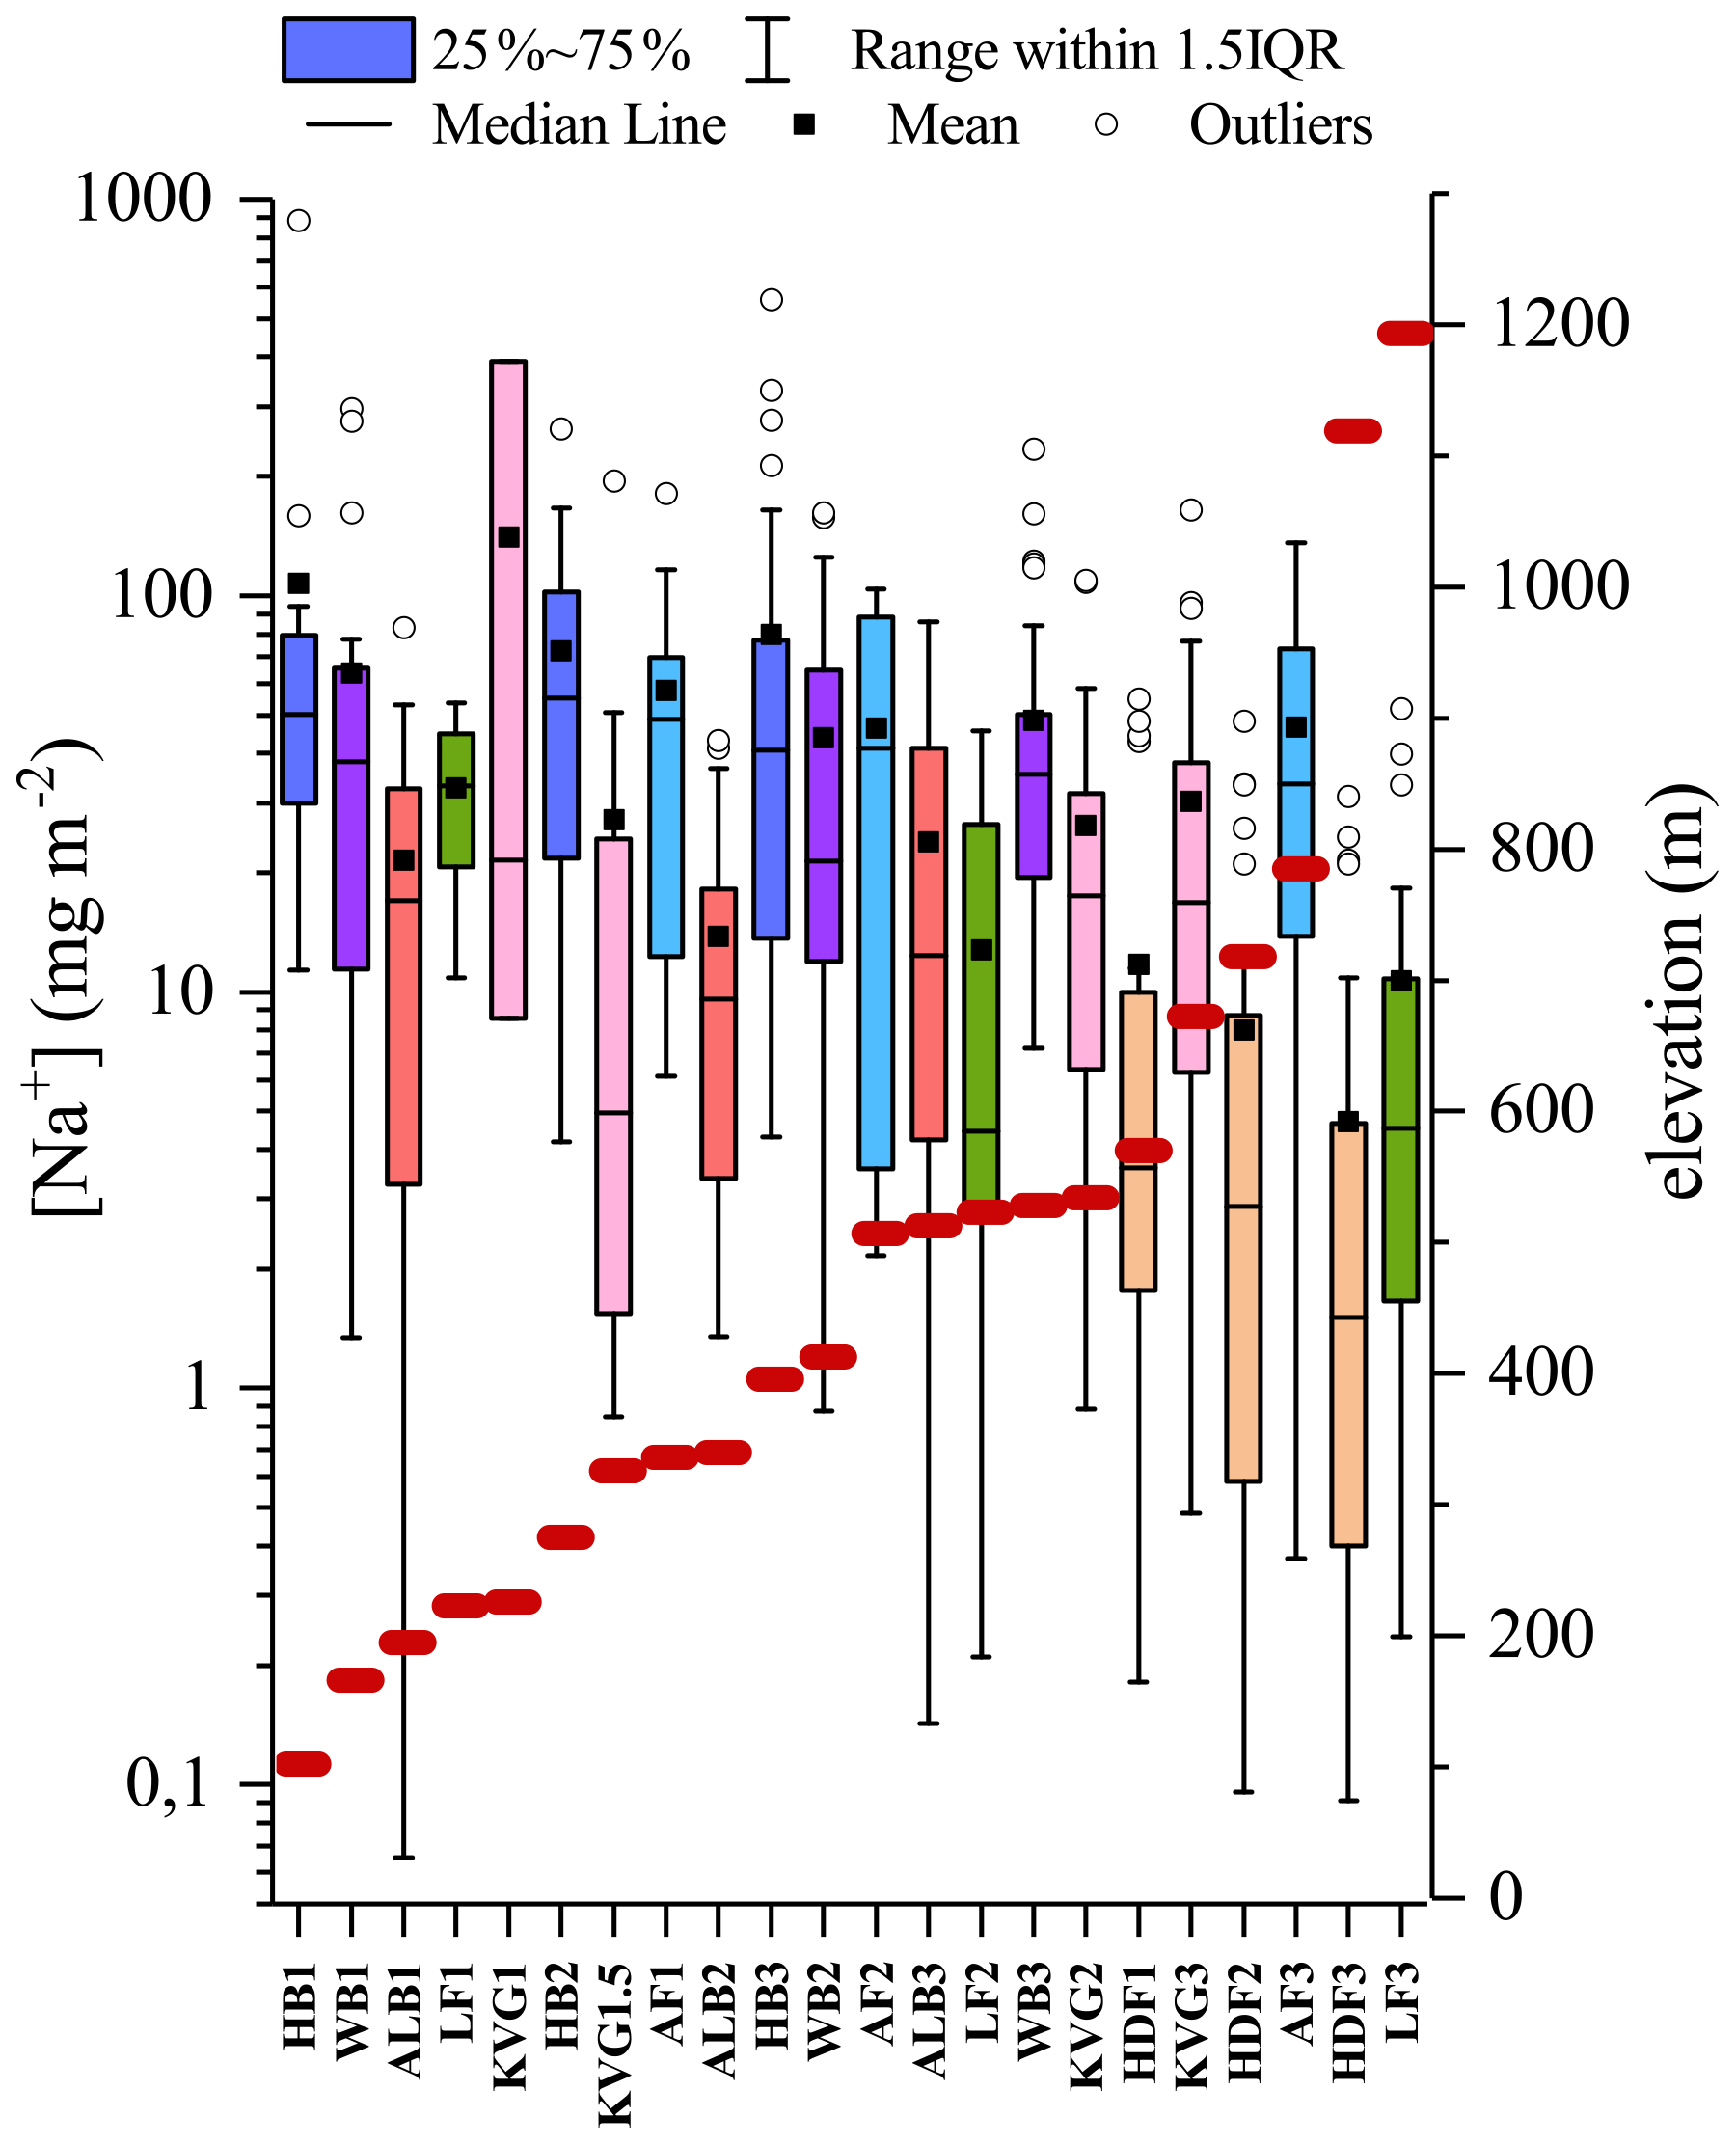
Figure 6Sodium load in snowpits ordered by increasing elevation in m a.s.l., indicated by the red lines. The colours identify areas where the snowpits have been excavated: each colour represents a separate glacier (HB – blue; WB – purple; ALB – red; LF – green; KVG – pink; AF – light blue; HDF – orange). IQR=inter-quartile range, i.e. the difference between the values of quartiles 3 and 1.
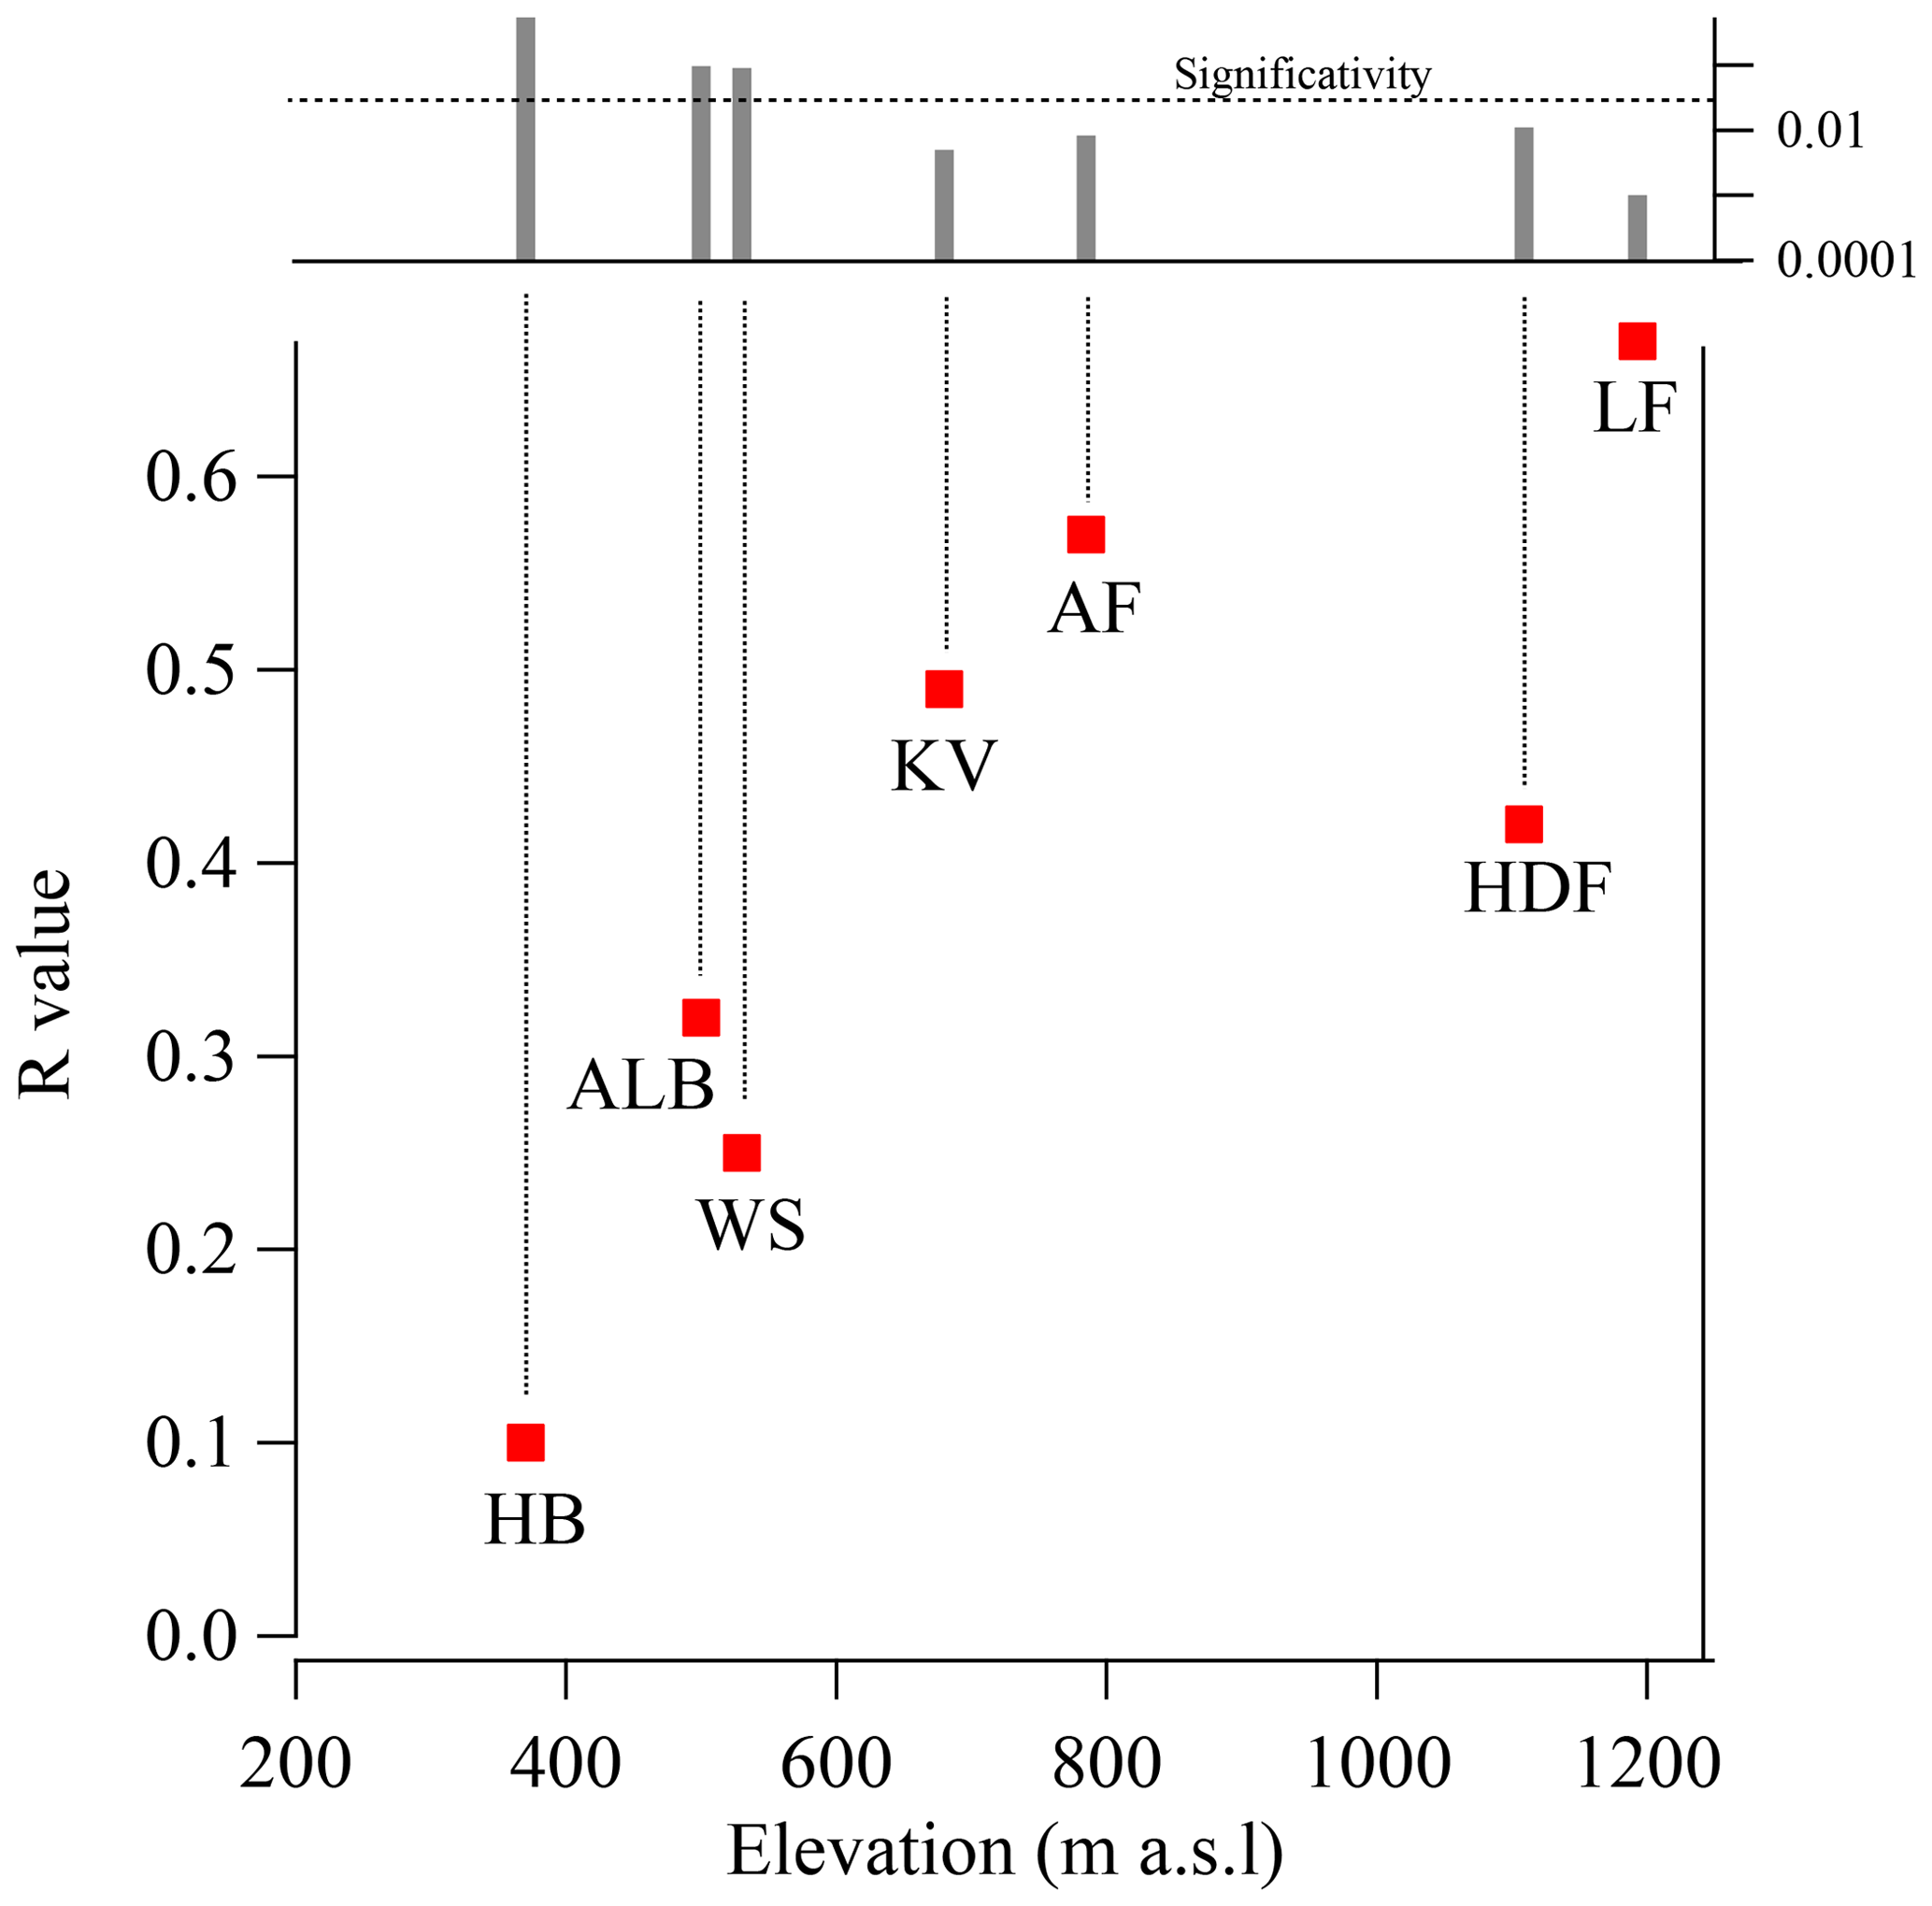
Figure 7The correlation coefficient between the oxygen isotope ratio (δ18O) and log (Naload) increases with elevation. The left axis represents the correlation coefficient (R) between log (Naload) and δ18O, using the entire dataset for each snowpit (i.e. all layers have been used for the statistical correlation). The x axis indicates the altitude of the snowpit. The upper panel shows the p value: correlations have been considered statistically significant if p<0.05.
The increase in strength and significance of the log (Naload)–δ18O correlation with altitude might be explained by different contributions of locally emitted ss-Na+ relative to those of Na+ from more distant sources. Sites located at lower altitudes are proportionally more affected by local sea-spray deposition, with or without snowfall. Conversely, sites at higher elevations likely receive a larger share of their ionic load from more distant sources and by wet deposition through snowfall. At the four sites (KVG, AF, LF, and HDF) where the log (Naload)–δ18O correlation is significant, increases in δ18O in snow layers are often associated with higher Na+ concentrations. It is rather difficult to propose a precise explanation for this association. However, we would indicate that the isotopically heavier (less negative) δ18O values suggest that the co-registered Na+ enhancements are associated with precipitation of a relatively warm air event, probably advected from lower latitudes. The snowfall associated with a warm event is able to wet scavenge the sea-spray aerosol present in the atmosphere. By contrast, when cold air masses (Arctic type) dominate, snowfall events are relatively limited due to the low air humidity causing a lower efficiency of wet scavenging. This results in lower δ18O and (likely) Na sodium loads, suggesting that wet deposition dominates the chemical load of the snowpack. Although this process should occur also at lower-elevation sites, the local emission and associated dry deposition are likely more important than wet deposition. More frequent melt–refreeze episodes at lower elevations would also mask the proposed relationship (as suggested by the vertical profiles of stratigraphy reported in Fig. S4).
Another possible explanation is that in the Arctic, air masses are transported from low- to high-elevation sites without any strong disturbance of the atmospheric conditions. In this case, isotopically heavier molecules and sea-spray particles are gradually scavenged from the air masses. If this was the main process, we should find the correlation across all studied sites, assuming that Na+ scavenged at a similar rate to that of isotopic fractionation. Since this has not been found, we propose that the correlation at higher elevation cannot be explained by atmospheric distillation alone. The possibility that the correlation is due to different sources of air masses seems unsupported due to the absence of a correlation between d-excess and sodium.
We have quantified and described, for the first time, the spatial distribution of major ion loads (Ca2+, K+, Na+, Mg2+, , , Br−, Cl− and ) and variations of δ18O and δ2H in the snowpack on glaciers across Svalbard for a single accumulation season (2015–2016). The highest total ionic loads are found in the southern region of Spitsbergen (Hornsund area) and exceed 8 g m−2. Conversely, the lowest total ionic loads (≤0.6 g m−2) are found at sites in central or north-western Spitsbergen (LF and HDF). Sea-salt ions (Cl−, Na+, and ) dominate the ionic loads at all sites, but their share is highest at sites near Hornsund for e.g. 48 % Cl− compared to only 29 % on Holtedahlfonna. Relatively elevated ratios in snow at all sites indicate non-sea-salt Ca2+ inputs, most likely in the form of carbonate dust. Unlike other ions, has the highest loads in glaciers of north-western Spitsbergen and the lowest at LF. The nitrogen species, and , show distinct spatial distribution patterns. The highest loads are found in the north-western part of Svalbard, while the highest loads are in the south-west. Bromide (Br−) is most enriched in snow relative to seawater at AF and LF, the glacier sites located closest to areas with first-year sea-ice cover. This supports first-year sea ice being an important source of non-sea-salt Br− in the polar atmosphere.
An increasing positive correlation between log (Naload) and δ18O as a function of elevation sites suggests that locations above 600–700 m a.s.l. are influenced by a proportionally higher share of ions from distant sources, while the lower sites are exposed to more local sources, especially sea spray. These findings confirm that the optimal sites to study the effects of long-range pollution deposition in Svalbard are those at higher elevations, such as the accumulation zones of HDF or LF, because they are the sites least impacted by local aerosol emissions. The current study gives the first picture of the ionic composition in the Svalbard snowpack in different regions across the archipelago, in the context of which processes are relevant in controlling the annual snowpack chemical composition, especially the influence of local and long-range transport.
The data used in this manuscript are available from Table 2 and upon request to the authors.
The supplement related to this article is available online at: https://doi.org/10.5194/acp-21-3163-2021-supplement.
EB, KK and AS wrote the manuscript, with contributions from all the co-authors. JCG, MB, CL, BL, TS, CZ, FL, DK, AS, EB, TM, KK and AU initiated the April 2016 survey. EB, KK, CPV and CZ performed the analytical measurements, TM the δ18O analyses.
The authors declare that they have no conflict of interest.
The work developed here was supported by the Gothenburg Centre of Advanced Studies, BECC – Biodiversity and Ecosystem Services in a Changing Climate, Gothenburg Air and Climate Centre, International Arctic Science Committee – the Cryosphere working group and the Norwegian Polar Institute. Part of the fieldwork was conducted thanks to the funds of the Leading National Research Centre (KNOW) in Poland, received by the Centre for Polar Studies for the period 2014–2018.
This research has been supported by the Svalbard Science Forum/Research Council of Norway (grant nos. 246731/E10 and 257636/E10), the Ministry of Science and Higher Education of Poland (grant no. 3841/E-41/S/2020), and the European Union's Horizon 2020 (grant no. 689443, iCUPE).
This paper was edited by Thorsten Bartels-Rausch and reviewed by two anonymous referees.
Aas, K. S., Dunse, T., Collier, E., Schuler, T. V., Berntsen, T. K., Kohler, J., and Luks, B.: The climatic mass balance of Svalbard glaciers: a 10-year simulation with a coupled atmosphere–glacier mass balance model, The Cryosphere, 10, 1089–1104, https://doi.org/10.5194/tc-10-1089-2016, 2016.
Ardyna, M., Babin, M., Gosselin, M., Devred, E., Bélanger, S., Matsuoka, A., and Tremblay, J.-É.: Parameterization of vertical chlorophyll a in the Arctic Ocean: impact of the subsurface chlorophyll maximum on regional, seasonal, and annual primary production estimates, Biogeosciences, 10, 4383–4404, https://doi.org/10.5194/bg-10-4383-2013, 2013.
Barbante, C., Spolaor, A., Cairns, W. R. L., and Boutron, C.: Man's footprint on the Arctic environment as revealed by analysis of ice and snow, Earth-Sci. Rev., 168, 218–231, 2017.
Barbaro, E., Padoan, S., Kirchgeorg, T., Zangrando, R., Toscano, G., Barbante, C., and Gambaro, A.: Particle size distribution of inorganic and organic ions in coastal and inland Antarctic aerosol, Environ. Sci. Pollut. Res., 24, 2724–2733, 2017.
Barrie, L. A.: Arctic air pollution: An overview of current knowledge, Atmos. Environ., 20, 643–663, 1986.
Beaudon, E., Moore, J. C., Martma, T., Pohjola, V. A., Van de Wal, R. S. W., Kohler, J., and Isaksson, E.: Lomonosovfonna and Holtedahlfonna ice cores reveal east–west disparities of the Spitsbergen environment since AD 1700, J. Glaciol., 59, 1069–1083, 2017.
Björkman, M. P., Vega, C. P., Kühnel, R., Spataro, F., Ianniello, A., Esposito, G., Kaiser, J., Marca, A., Hodson, A., Isaksson, E., and Roberts, T. J.: Nitrate postdeposition processes in Svalbard surface snow, J. Geophys. Res.-Atmos., 119, 12953–12976, https://doi.org/10.1002/2013JD021234., 2014.
Brage, B. H., Isaksen, K., Benestad, R. E., Kohler, J., Pedersen, Å. Ø., Loe, L. E., Coulson, S. J., Larsen, J. O., and Varpe., Ø.: Warmer and wetter winters: characteristics and implications of an extreme weather event in the High Arctic, Environ. Res. Lett., 9, 114021, https://doi.org/10.1088/1748-9326/9/11/114021, 2014.
Brimblecombe, P., Clegg, S. L., Davies, T. D., Shooter, D., and Tranter, M.: Observations of the preferential loss of major ions from melting snow and laboratory ice, Water Res., 21, 1279–1286, 1987.
Cogley, J. G., Hock, R., Rasmussen, L. A., Arendt, A. A., Bauder, A., Braithwaite, R. J., Jansson, P., Kaser, G., Möller, M., Nicholson, L., and Zemp, M.: Glossary of Glacier Mass Balance and Related Terms, IHP-VII Technical Documents in Hydrology, IACS Contribution No. 2, Unesco-IHP, Paris, 86 pp., 2011.
Curtis, C. J., Kaiser, J., Marca, A., Anderson, N. J., Simpson, G., Jones, V., and Whiteford, E.: Spatial variations in snowpack chemistry, isotopic composition of NO3- and nitrogen deposition from the ice sheet margin to the coast of western Greenland, Biogeosciences, 15, 529–550, https://doi.org/10.5194/bg-15-529-2018, 2018.
Dahlke, S., Hughes, N. E., Wagner, P. M., Gerland, S., Wawrzyniak, T., Ivanov, B., and Maturilli, M.: The observed recent surface air temperature development across Svalbard and concurring footprints in local sea ice cover, Int. J. Climatol., 40, 5246–5265, https://doi.org/10.1002/joc.6517, 2020.
Dallmann, W. K.: The geology of Svalbard, Norwegian Polar Institute, available at: https://www.npolar.no/en/themes/the-geology-of-svalbard/ (last access: 1 March 2021), 1999.
Dallmann, W. K., Atakan, K., Blomeier, D., Bond, D., Christiansen, H., Elvevold, S., Forwick, M., Gerland, S., Grundvåg, S.-A., Hagen, J.-O., Hormes, A., Jernas, P., Kohler, J., Laberg, J. S., Majka, J., Mørk, A., Nasuti, A., Nuth, C., Olaussen, S., Olesen, O., Ottemöller, L., Ottesen, R. T., Pavlov, V., Pavlova, O., Piepjohn, K., Reymert, P. K., Salvigsen, O., Sander, G., Storheim, B., Sundfjord, A., and Vorren, T.: Geoscience Atlas of Svalbard, Norwegian Polar Institute, available at: https://data.npolar.no/publication/cff6dee9-dd1b-4af0-9b85-4e07d7d14e4c (last access: 1 March 2021), 2015.
Eneroth, K., Kjellström, E., and Holmén, K.: A trajectory climatology for Svalbard; investigating how atmospheric flow patterns influence observed tracer concentrations, Phys. Chem. Earth, 28, 1191–1203, 2003.
Fibiger, D. L., Dibb, J. E., Chen, D., Thomas, J. L., Burkhart, J. F., Huey, L. G., and Hastings, M. G.: Analysis of nitrate in the snow and atmosphere at Summit, Greenland: Chemistry and transport, J. Geophys. Res.-Atmos., 121, 5010–5030, 2016.
Forland, E. J., Benestad, R., Hanssen-Bauer, I., Haugen, J. E., and Skaugen, T. E.: Temperature and Precipitation Development at Svalbard 1900–2100, Adv. Meteorol., 2011, 893790, https://doi.org/10.1155/2011/893790, 2011.
Forsström, S., Ström, J., Pedersen, C. A., Isaksson, E., and Gerland, S.: Elemental carbon distribution in Svalbard snow, J. Geophys. Res.-Atmos., 114, D19112, https://doi.org/10.1029/2008JD011480, 2009.
Gallet, J. C., Bjorkman, M. P., Larose, C., Luks, B., Martma, T., and Zdanowicz, C.: Protocols and recommendations for the measurement of snow physical properties, and sampling of snow for black carbon, water isotopes, major ions and microorganisms, Norsk. Polarinst. Skri. 46, Norwegian Polar Institute, Tromsø, ISBN 978-82-7666-415-7 (printed edition), 978-82-7666-416-4 (digital edition), ISSN 1504-3215 (printed edition), 2464-1308 (digital edition), 2018.
Gat, J. R.: Oxygen and Hydrogen Isotopes in the Hydrologic Cycle, Annu. Rev. Earth Planet. Sci., 24, 225–262, 1996.
Gat, J. R., Mook, W. G., and H. A. J., M.: Atmospheric Water, in: Environmental Isotopes in the Hydrological Cycle, Principle and Applications, International Atomic Energy Agency, Vienna, 2001.
Gibson, E. R., Hudson, P. K., and Grassian, V. H.: Physicochemical Properties of Nitrate Aerosols: Implications for the Atmosphere, J. Phys. Chem. A, 110, 11785–11799, 2006.
Gondwe, M., Krol, M., Gieskes, W., Klaassen, W., and de Baar, H.: The contribution of ocean-leaving DMS to the global atmospheric burdens of DMS, MSA, SO2, and NSS SO4=, Global Biogeochem. Cy., 17, 1056, https://doi.org/10.1029/2002GB001937, 2003.
Hodgkins, R. and Tranter, M.: Solute in high arctic glacier snow cover and its impact on runoff chemistry, Ann. Glaciol., 26, 156–160, 1998.
Igarashi, M., Kamiyama, K., and Watanabe, O.: Stable oxygen isotope ratio observed in the precipitation at Ny-Alesund, Svalbard, Mem. Natl Inst. Polar Res., 54, 69–182, 2001.
Isaksen, K., Nordli, Ø., Førland, E. J., Łupikasza, E., Eastwood, S., and Niedźwiedź, T.: Recent warming on Spitsbergen – Influence of atmospheric circulation and sea ice cover, J. Geophys. Res.-Atmos., 121, 11913–11931, https://doi.org/10.1002/2016JD025606, 2016.
Isaksson, E., Pohjola, V., Jauhiainen, T., Moore, J., Pinglot, J. F., Vaikmäe, R., van De Wal, R. S. W., Hagen, J. O., Ivask, J., Karlöf, L., Martma, T., Meijer, H. A. J., Mulvaney, R., Thomassen, M., and van den Broeke, M.: A new ice-core record from Lomonosovfonna, Svalbard: viewing the 1920–97 data in relation to present climate and environmental conditions, J. Glaciol., 47, 335–345, 2001.
Isaksson, E., Hermanson, M., Hicks, S., Igarashi, M., Kamiyama, K., Moore, J., Motoyama, H., Muir, D., Pohjola, V., Vaikmae, R., Van de Wal, R. S. W., and Watanabe, O.: Ice cores from Svalbard – useful archives of past climate and pollution history, Phys. Chem. Earth, 28, 1217–1228, https://doi.org/10.1016/j.pce.2003.08.053, 2003.
Jacobi, H.-W., Obleitner, F., Da Costa, S., Ginot, P., Eleftheriadis, K., Aas, W., and Zanatta, M.: Deposition of ionic species and black carbon to the Arctic snowpack: combining snow pit observations with modeling, Atmos. Chem. Phys., 19, 10361–10377, https://doi.org/10.5194/acp-19-10361-2019, 2019.
Johnsen, S. J., Dansgaard, W., and White, J. W. C.: The origin of Arctic precipitation under present and glacial conditions, Tellus B, 41, 452–468, 1989.
Karl, M., Leck, C., Mashayekhy Rad, F., Bäcklund, A., Lopez-Aparicio, S., and Heintzenberg, J.: New insights in sources of the sub-micrometre aerosol at Mt. Zeppelin observatory (Spitsbergen) in the year 2015, Tellus B, 71, 1613143, https://doi.org/10.1080/16000889.2019.1613143, 2019.
Kekonen, T., Moore, J., Perämäki, P., Mulvaney, R., Isaksson, E., Pohjola, V., and van de Wal, R. S. W.: The 800 year long ion record from the Lomonosovfonna (Svalbard) ice core, J. Geophys. Res.-Atmos., 110, D07304, https://doi.org/10.1029/2004JD005223, 2005.
Kekonen, T., Moore, J. C., Mulvaney, R., Isaksson, E., Pohjola, V., and van de Wal, R. S. W.: A 800 year record of nitrate from the Lomonosovfonna ice core, Svalbard, Ann. Glaciol., 35, 261–265, 2017.
Keslinka, L. K., Wojczulanis-Jakubas, K., Jakubas, D., and Neubauer, G.: Determinants of the little auk (Alle alle) breeding colony location and size in W and NW coast of Spitsbergen, PLOS One, 14, e0212668, https://doi.org/10.1371/journal.pone.0212668, 2019.
Kuhn, M.: The nutrient cycle through snow and ice, a review, Aquat. Sci., 63, 150–167, 2001.
Kühnel, R., Roberts, T. J., Björkman, M. P., Isaksson, E., Aas, W., Holmén, K., and Ström, J.: 20 year Climatology of NO3 and Wet Deposition at Ny-Alesund, Svalbard, Adv. Meteorol., 2011, 406508, https://doi.org/10.1155/2011/406508, 2011.
Law, K. S. and Stohl, A.: Arctic Air Pollution: Origins and Impacts, Science, 315, 1537–1540, https://doi.org/10.1126/science.1137695, 2007.
Lindbäck, K., Kohler, J., Pettersson, R., Nuth, C., Langley, K., Messerli, A., Vallot, D., Matsuoka, K., and Brandt, O.: Subglacial topography, ice thickness, and bathymetry of Kongsfjorden, northwestern Svalbard, Earth Syst. Sci. Data, 10, 1769–1781, https://doi.org/10.5194/essd-10-1769-2018, 2018.
Maffezzoli, N., Spolaor, A., Barbante, C., Bertò, M., Frezzotti, M., and Vallelonga, P.: Bromine, iodine and sodium in surface snow along the 2013 Talos Dome–GV7 traverse (northern Victoria Land, East Antarctica), The Cryosphere, 11, 693–705, https://doi.org/10.5194/tc-11-693-2017, 2017.
Marlin, C., Tolle, F., Griselin, M., Bernard, E., Saintenoy, A., Quenet, M., and Friedt, J.-M.: Change in geometry of a high Arctic glacier from 1948 to 2013 (Austre Lovénbreen, Svalbard), Geogr. Ann. A, 99, 115–138, 2017.
Matoba, S., Narita, H., Motoyama, H., Kamiyama, K., and Watanabe, O.: Ice core chemistry of Vestfonna Ice Cap in Svalbard, Norway, J. Geophys. Res.-Atmos., 107, ACH 19-11–ACH 19-17, 2002.
Maturilli, M., Herber, A., and König-Langlo, G.: Climatology and time series of surface meteorology in Ny-Älesund, Svalbard, Earth Syst. Sci. Data, 5, 155–163, https://doi.org/10.5194/essd-5-155-2013, 2013.
Melvold, K. and Hagen, J. O.: Evolution of a surge-type glacier in its quiescent phase: Kongsvegen, Spitsbergen, 1964–95, J. Glaciol., 44, 394–404, https://doi.org/10.3189/S0022143000002720, 1998.
Millero, F. J., Feistel, R., Wright, D. G., and McDougall, T. J.: The composition of Standard Seawater and the definition of the Reference-Composition Salinity Scale, Deep-Sea Res. Pt. I, 55, 50–72, 2008.
Möller, M. and Kohler, J.: Differing Climatic Mass Balance Evolution Across Svalbard Glacier Regions Over 1900–2010, Front. Earth Sci., 6, 128, https://doi.org/10.3389/feart.2018.00128, 2018.
Nawrot, A. P., Migała, K., Luks, B., Pakszys, P., and Głowacki, P.: Chemistry of snow cover and acidic snowfall during a season with a high level of air pollution on the Hans Glacier, Spitsbergen, Polar Sci., 10, 249–261, 2016.
Nordli, Ø., Przybylak, R., Ogilvie, A. E. J., and Isaksen, K.: Long-term temperature trends and variability on Spitsbergen: the extended Svalbard Airport temperature series, 1898–2012, Polar Res., 33, 21349, https://doi.org/10.3402/polar.v33.21349, 2014.
Nuth, C., Schuler, T. V., Kohler, J., Altena, B., and Hagen, J. O.: Estimating the long-term calving flux of Kronebreen, Svalbard, from geodetic elevation changes and mass-balance modeling, J. Glaciol., 58, 119–133, 2017.
Peterson, P. K., Hartwig, M., May, N. W., Schwartz, E., Rigor, I., Ermold, W., Steele, M., Morison, J. H., Nghiem, S. V., and Pratt, K. A.: Snowpack measurements suggest role for multi-year sea ice regions in Arctic atmospheric bromine and chlorine chemistry, Elem. Sci. Anth., 7, 14, https://doi.org/10.1525/elementa.352, 2019.
Pohjola, V. A., Moore, J. C., Isaksson, E., Jauhiainen, T., van de Wal, R. S. W., Martma, T., Meijer, H. A. J., and Vaikmäe, R.: Effect of periodic melting on geochemical and isotopic signals in an ice core from Lomonosovfonna, Svalbard, J. Geophys. Res.-Atmos., 107, ACL 1-1–ACL 1-14, 2002.
Pohjola, V. A., Martma, T. A., Meijer, H. A. J., Moore, J. C., Isaksson, E., Vaikmäe, R., and van de Wal, R. S. W.: Reconstruction of three centuries of annual accumulation rates based on the record of stable isotopes of water from Lomonosovfonna, Svalbard, Ann. Glaciol., 35, 57–62, 2017.
Punning, Y. M. K., Martma, T. A., Tyugu, K. E., Vaykmyae, R. A., Purshe, M., and Pinglo, F.: Stratification in an Ice core from Vestfonna, Nordaustlandet, Polar Geogr. Geol., 10, 39–43, 1986.
Rinke, A., Maturilli, M., Graham, R. M., Matthes, H., Handorf, D., Cohen, L., Hudson, S. R., and Moore, J. C.: Extreme cyclone events in the Arctic: Wintertime variability and trends, Environ. Res. Lett., 12, 094006, https://doi.org/10.1088/1748-9326/aa7def, 2017.
Schaap, M., van Loon, M., ten Brink, H. M., Dentener, F. J., and Builtjes, P. J. H.: Secondary inorganic aerosol simulations for Europe with special attention to nitrate, Atmos. Chem. Phys., 4, 857–874, https://doi.org/10.5194/acp-4-857-2004, 2004.
Schuler, T. V., Glazovsky, A., Hagen, J. O., Hodson, A., Jania, J., Kääb, A., Kohler, J., Luks, B., Malecki, J., Moholdt, G., Pohjola, V., and Pelt, W. V.: New data, new techniques and new challenges for updating the state of Svalbard glaciers (SvalGlac), Longyearbyen, SESS report 2019, Svalbard Integrated Arctic Earth Observing System, Longyearbyen, 108–134, 2020.
Schüpbach, S., Fischer, H., Bigler, M., Erhardt, T., Gfeller, G., Leuenberger, D., Mini, O., Mulvaney, R., Abram, N. J., Fleet, L., Frey, M. M., Thomas, E., Svensson, A., Dahl-Jensen, D., Kettner, E., Kjaer, H., Seierstad, I., Steffensen, J. P., Rasmussen, S. O., Vallelonga, P., Winstrup, M., Wegner, A., Twarloh, B., Wolff, K., Schmidt, K., Goto-Azuma, K., Kuramoto, T., Hirabayashi, M., Uetake, J., Zheng, J., Bourgeois, J., Fisher, D., Zhiheng, D., Xiao, C., Legrand, M., Spolaor, A., Gabrieli, J., Barbante, C., Kang, J. H., Hur, S. D., Hong, S. B., Hwang, H. J., Hong, S., Hansson, M., Iizuka, Y., Oyabu, I., Muscheler, R., Adolphi, F., Maselli, O., McConnell, J., and Wolff, E. W.: Greenland records of aerosol source and atmospheric lifetime changes from the Eemian to the Holocene, Nat. Commun., 9, 1476, https://doi.org/10.1038/s41467-018-03924-3, 2018.
Semb, A., Brækkan, R., and Joranger, E.: Major ions in Spitsbergen snow samples, Geophys. Res. Lett., 11, 445–448, 1984.
Spolaor, A., Gabrieli, J., Martma, T., Kohler, J., Björkman, M. B., Isaksson, E., Varin, C., Vallelonga, P., Plane, J. M. C., and Barbante, C.: Sea ice dynamics influence halogen deposition to Svalbard, The Cryosphere, 7, 1645–1658, https://doi.org/10.5194/tc-7-1645-2013, 2013.
Spolaor, A., Vallelonga, P., Gabrieli, J., Martma, T., Björkman, M. P., Isaksson, E., Cozzi, G., Turetta, C., Kjær, H. A., Curran, M. A. J., Moy, A. D., Schönhardt, A., Blechschmidt, A.-M., Burrows, J. P., Plane, J. M. C., and Barbante, C.: Seasonality of halogen deposition in polar snow and ice, Atmos. Chem. Phys., 14, 9613–9622, https://doi.org/10.5194/acp-14-9613-2014, 2014.
Spolaor, A., Barbaro, E., Christille, J. M., Kirchgeorg, T., Giardi, F., Cappelletti, D., Turetta, C., Bernagozzi, A., Björkman, M. P., Bertolini, E., and Barbante, C.: Evolution of the Svalbard annual snow layer during the melting phase, Rend. Lincei Sci. Fis. Nat., 27, 147–154, https://doi.org/10.1007/s12210-015-0500-8, 2016.
Spolaor, A., Barbaro, E., Mazzola, M., Viola, A. P., Lisok, J., Obleitner, F., Markowicz, K. M., and Cappelletti, D.: Determination of black carbon and nanoparticles along glaciers in the Spitsbergen (Svalbard) region exploiting a mobile platform, Atmos. Environ., 170, 184–196, 2017.
Spolaor, A., Barbaro, E., Cappelletti, D., Turetta, C., Mazzola, M., Giardi, F., Björkman, M. P., Lucchetta, F., Dallo, F., Pfaffhuber, K. A., Angot, H., Dommergue, A., Maturilli, M., Saiz-Lopez, A., Barbante, C., and Cairns, W. R. L.: Diurnal cycle of iodine, bromine, and mercury concentrations in Svalbard surface snow, Atmos. Chem. Phys., 19, 13325–13339, https://doi.org/10.5194/acp-19-13325-2019, 2019.
Thompson, L. G., Mosley-Thompson, E., Davis, M. E., Henderson, K. A., Brecher, H. H., Zagorodnov, V. S., Mashiotta, T. A., Lin, P.-N., Mikhalenko, V. N., Hardy, D. R., and Beer, J. R.: Kilimanjaro Ice Core Records: Evidence of Holocene Climate Change in Tropical Africa, Science, 298, 589–593, 2002.
Trachsel, J. C., Avak, S. E., Edebeli, J., Schneebeli, M., Bartels-Rausch, T., Bruetsch, S., and Eichler, A.: Microscale Rearrangement of Ammonium Induced by Snow Metamorphism, Front. Earth Sci., 7, 194, https://doi.org/10.3389/feart.2019.00194, 2019.
Uemura, R., Matsui, Y., Yoshimura, K., Motoyama, H., and Yoshida, N.: Evidence of deuterium excess in water vapor as an indicator of ocean surface conditions, J. Geophys. Res., 113, D19114, https://doi.org/10.1029/2008JD010209, 2008.
van Pelt, W., Pohjola, V., Pettersson, R., Marchenko, S., Kohler, J., Luks, B., Hagen, J. O., Schuler, T. V., Dunse, T., Noël, B., and Reijmer, C.: A long-term dataset of climatic mass balance, snow conditions, and runoff in Svalbard (1957–2018), The Cryosphere, 13, 2259–2280, https://doi.org/10.5194/tc-13-2259-2019, 2019.
Vecchiato, M., Barbaro, E., Spolaor, A., Burgay, F., Barbante, C., Piazza, R., and Gambaro, A.: Fragrances and PAHs in snow and seawater of Ny-Ålesund (Svalbard): Local and long-range contamination, Environ. Pollut., 242, 1740–1747, 2018.
Vega, C. P., Björkman, M. P., Pohjola, V. A., Isaksson, E., Pettersson, R., Martma, T., Marca, A., and Kaiser, J.: Nitrate stable isotopes in snow and ice samples from four Svalbard sites, Polar Res., 34, 23246, https://doi.org/10.3402/polar.v34.23246, 2015.
Vega, C. P., Pohjola, V. A., Beaudon, E., Claremar, B., van Pelt, W. J. J., Pettersson, R., Isaksson, E., Martma, T., Schwikowski, M., and Bøggild, C. E.: A synthetic ice core approach to estimate ion relocation in an ice field site experiencing periodical melt: a case study on Lomonosovfonna, Svalbard, The Cryosphere, 10, 961–976, https://doi.org/10.5194/tc-10-961-2016, 2016.
Virkkunen, K., Moore, J. C., Isaksson, E., Pohjola, V., Perämäki, P., Grinsted, A., and Kekonen, T.: Warm summers and ion concentrations in snow: comparison of present day with Medieval Warm Epoch from snow pits and an ice core from Lomonosovfonna, Svalbard, J. Glaciol., 53, 623–634, 2007.
West, J. B., Bowen, G. J., Dawson, T. E., and Tu., K. P.: Understanding movement, pattern, and process on Earth through isotope mapping, Springer, the Netherlands, ISBN 978-90-481-3353-6, https://doi.org/10.1007/978-90-481-3354-3, 2010.
Whitlow, S., Mayewski, P. A., and Dibb, J. E.: A comparison of major chemical species seasonal concentration and accumulation at the South Pole and summit, Greenland, Atmos. Environ. A, 26, 2045–2054, 1992.
Winther, M., Christensen, J. H., Plejdrup, M. S., Ravn, E. S., Eriksson, Ó. F., and Kristensen, H. O.: Emission inventories for ships in the arctic based on satellite sampled AIS data, Atmos. Environ., 91, 1–14, 2014.
Wojczulanis K., Jakubas D., and Stempniewicz, L.: Avifauna of Hornsund area, SW Spitsbergen:present state and recent changes, Pol. Polar Res., 29, 187–197, 2008.
Wolff, E. W., Barbante, C., Becagli, S., Bigler, M., Boutron, C. F., Castellano, E., De Angelis, M., Federer, U., Fischer, H., and Fundel, F.: Changes in environment over the last 800,000 years from chemical analysis of the EPICA Dome C ice core, Quaternary Sci. Rev., 29, 285-295, 2010.
Yao, X., Fang, M., and Chan, C. K.: The size dependence of chloride depletion in fine and coarse sea-salt particles, Atmos. Environ., 37.6, 743–751, https://doi.org/10.1016/S1352-2310(02)00955-X, 2003.
Zhuang, H., Chan, C. K., Fang, M., and Wexler, A. S.: Formation of nitrate and non-sea-salt sulfate on coarse particles, Atmos. Environ., 33, 4223–4233, 1999.
The requested paper has a corresponding corrigendum published. Please read the corrigendum first before downloading the article.
- Article
(3789 KB) - Full-text XML
- Corrigendum
- Companion paper
-
Supplement
(1445 KB) - BibTeX
- EndNote