the Creative Commons Attribution 4.0 License.
the Creative Commons Attribution 4.0 License.
 | 15 Feb 2021
Insights into particulate matter pollution in the North China Plain during wintertime: local contribution or regional transport?
Jiarui Wu
Naifang Bei
Yuan Wang
Xia Li
Suixin Liu
Lang Liu
Ruonan Wang
Jiaoyang Yu
Tianhao Le
Min Zuo
Zhenxing Shen
Junji Cao
Xuexi Tie
Guohui Li
Accurate identification and quantitative source apportionment of fine particulate matter (PM2.5) provide an important prerequisite for design and implementation of emission control strategies to reduce PM pollution. Therefore, a source-oriented version of the WRF-Chem model is developed in the study to conduct source apportionment of PM2.5 in the North China Plain (NCP). A persistent and heavy haze event that occurred in the NCP from 5 December 2015 to 4 January 2016 is simulated using the model as a case study to quantify PM2.5 contributions of local emissions and regional transport. Results show that local and nonlocal emissions contribute 36.3 % and 63.7 % of the PM2.5 mass in Beijing during the haze event on average. When Beijing's air quality is excellent or good in terms of hourly PM2.5 concentrations, local emissions dominate the PM2.5 mass, with contributions exceeding 50 %. However, when the air quality is severely polluted, the PM2.5 contribution of nonlocal emissions is around 75 %. Nonlocal emissions also dominate Tianjin's air quality, with average PM2.5 contributions exceeding 65 %. The PM2.5 level in Hebei and Shandong is generally controlled by local emissions, but in Henan, local and nonlocal emissions play an almost equivalent role in the PM2.5 level, except when the air quality is severely polluted, with nonlocal PM2.5 contributions of over 60 %. Additionally, the primary aerosol species are generally dominated by local emissions, with the average contribution exceeding 50 %. However, the source apportionment of secondary aerosols shows more evident regional characteristics. Therefore, except for cooperation with neighboring provinces to carry out strict emission mitigation measures, reducing primary aerosols is a priority to alleviate PM pollution in the NCP, especially in Beijing and Tianjin.
- Article
(19257 KB) - Full-text XML
-
Supplement
(18708 KB) - BibTeX
- EndNote


As the most polluted area in China, the North China Plain (NCP) has been suffering from severe particulate pollution in recent decades, particularly during wintertime, caused by a synergy of local emissions, trans-boundary transport, specific topography, and unfavorable meteorological situations (Long et al., 2016; Wu et al., 2017, 2020; An et al., 2019). In recent years, the Chinese government has carried out aggressive emission mitigation measures to reduce particulate matter (PM) pollution (Zheng et al., 2018; Zhang et al., 2019), but heavy haze with high PM2.5 (fine PM) concentrations still frequently engulfs the area. It is controversial as to whether whether local emissions or trans-boundary transport dominates the PM pollution in the NCP, especially in Beijing (Guo et al., 2014; Li et al., 2015; Zhang et al., 2015; Wu et al., 2017; Zamora et al., 2019). Therefore, accurate identification and quantitative source apportionment (SA) of PM2.5 are imperative to provide scientific reference for instituting air quality control strategies as well as constituting an important prerequisite to reduce PM pollution in the NCP.
The observation-based SA techniques, such as chemical mass balance (CMB) and positive matrix factorization (PMF) methods, are traditionally used to quantify the particle contribution of each source (Cooper and Watson, 1980; Paatero and Tapper, 1993), but they cannot identify the source contribution of secondary transformation to particulate matter. The brute force method (BFM) is the simplest model-based SA method using air quality models (AQMs) through zeroing out emissions from a specific source (Marmur et al., 2005). The BFM can assess the importance of each emission source but has flaws in quantifying the source contribution due to lack of consideration of the complicated nonlinear interaction between various sources (Zhang and Ying, 2011). At present, the most widely used SA technique based on AQMs is the reactive tracer method or the source-oriented AQMs (Marmur et al., 2006; Ying and Kleeman, 2006; Ying et al., 2008a, b; Zhang and Ying, 2010, 2011; Burr and Zhang, 2011; Zhang et al., 2014). The method adds reactive tracers or tagged species in AQMs to trace the atmospheric transport, transformation, and deposition of air pollutants emitted from specific sources and quantify the source contribution according to the mass conservation (Wagstrom et al., 2008; Wang et al., 2009).
The observation-based SA method or the BFM based on AQMs has been used to evaluate PM2.5 contributions of local emissions and trans-boundary transport in the NCP, especially in Beijing–Tianjin–Hebei (BTH). Chang et al. (2019) have investigated the contribution of trans-boundary transport to the PM2.5 concentration in 13 cities of the BTH, showing that Shandong province has a considerable PM2.5 contribution to most cities in BTH, followed by Henan among the four neighboring provinces. Dong et al. (2020) have also found that regional transport contributes about 32.5 %–68.4 % of PM2.5 concentrations in BTH in 2017. However, the contribution of local emissions or trans-boundary transport to Beijing's PM pollution still remains uncertain. Lang et al. (2013) have indicated that regional transport accounts for 54.6 % of PM2.5 concentrations during polluted episodes in Beijing, with an annual PM2.5 contribution of 42.4 % on average, using observations and MM5–CMAQ model results. Wu et al. (2017) have shown that non-Beijing emissions contribute 61.5 % of PM2.5 mass during haze events in summer. However, some studies have emphasized that severe haze formation that occurs in Beijing is mainly controlled by efficient local aerosol nucleation and growth, whereas the PM2.5 contribution of regional transport might not be significant (Guo et al., 2014; Zamora et al., 2019). Meng et al. (2020) found that regional transport from Hebei and Shandong plays an important role in the PM pollution in Tianjin, with an average PM2.5 contribution of 44 % during the wintertime, but the local contribution gradually dominates with continuous deterioration of the PM pollution. Wang et al. (2015) have concluded that regional transport plays a non-negligible role in the top three polluted cities in Hebei using the BFM method, with PM2.5 contributions of 27.9 % in Shijiazhuang, 46.6 % in Xingtai, and 40.4 % in Handan. However, Wang et al. (2019) have proposed that local emissions are the main contributor to the air pollution in Hebei. Liu et al. (2017) have emphasized that the contribution of regional transport to the PM pollution in Henan is significant during the wintertime, with an average PM2.5 contribution of 11.95 %, 11.69 %, 7.95 %, and 7.4 % from BTH, Anhui, Jiangsu, and Shandong, respectively. In summary, these studies suggest that there is uncertainty regarding whether local contribution or regional transport is dominant during PM pollution events in the NCP.
In this study, a source-oriented WRF-Chem model is developed to comprehensively quantify the contribution of local emissions and trans-boundary transport to the PM pollution in the NCP, including Beijing, Tianjin, Hebei, Henan, and Shandong, as well as the adjacent province in the west, Shanxi, under different pollution levels during wintertime in 2015. The model and methodology are described in Sect. 2. The results and discussions are presented in Sect. 3, and a summary and conclusions are given in Sect. 4.
2.1 WRF-Chem model and configurations
The source-oriented AQM used in this study is based on the WRF-Chem model (version 3.5) (Grell et al., 2005) with modifications by Li et al. (2010, 2011a, b). The modified WRF-Chem model includes a new flexible gas-phase chemical module that can be used with different chemical mechanisms and the CMAQ aerosol module (AERO5) developed by the US EPA (Binkowski and Roselle, 2003; Foley et al., 2010). The wet deposition is based on the method in the CMAQ module, and the dry deposition of chemical species follows Wesely (1989). The photolysis rates are calculated using the Fast Tropospheric Ultraviolet and Visible (FTUV) radiation model with the aerosol and cloud effects on photolysis (Li et al., 2005, 2011a). The inorganic aerosols are predicted using ISORROPIA version 1.7, calculating the composition and phase state of an ammonium–sulfate–nitrate–water inorganic aerosol in thermodynamic equilibrium with gas-phase precursors (Nenes et al., 1998). The secondary organic aerosols (SOAs) are calculated using the volatility basis set (VBS) modeling method, with contributions from glyoxal and methylglyoxal. Detailed information can be found in Li et al. (2010, 2011a, b). Figure 1 shows the simulation domain, and the detailed model configuration can be found in Table 1. It is worth noting that the emission inventory used in this study is developed by Zhang et al. (2009) and Li et al. (2017) with the base year of 2012. Considering great changes in the emission inventory due to implementation of the toughest ever clean air policy in China (Zhang et al., 2019), the emission inventory has been adjusted according to the trends from 2012 to 2015 proposed by Zheng et al. (2018).
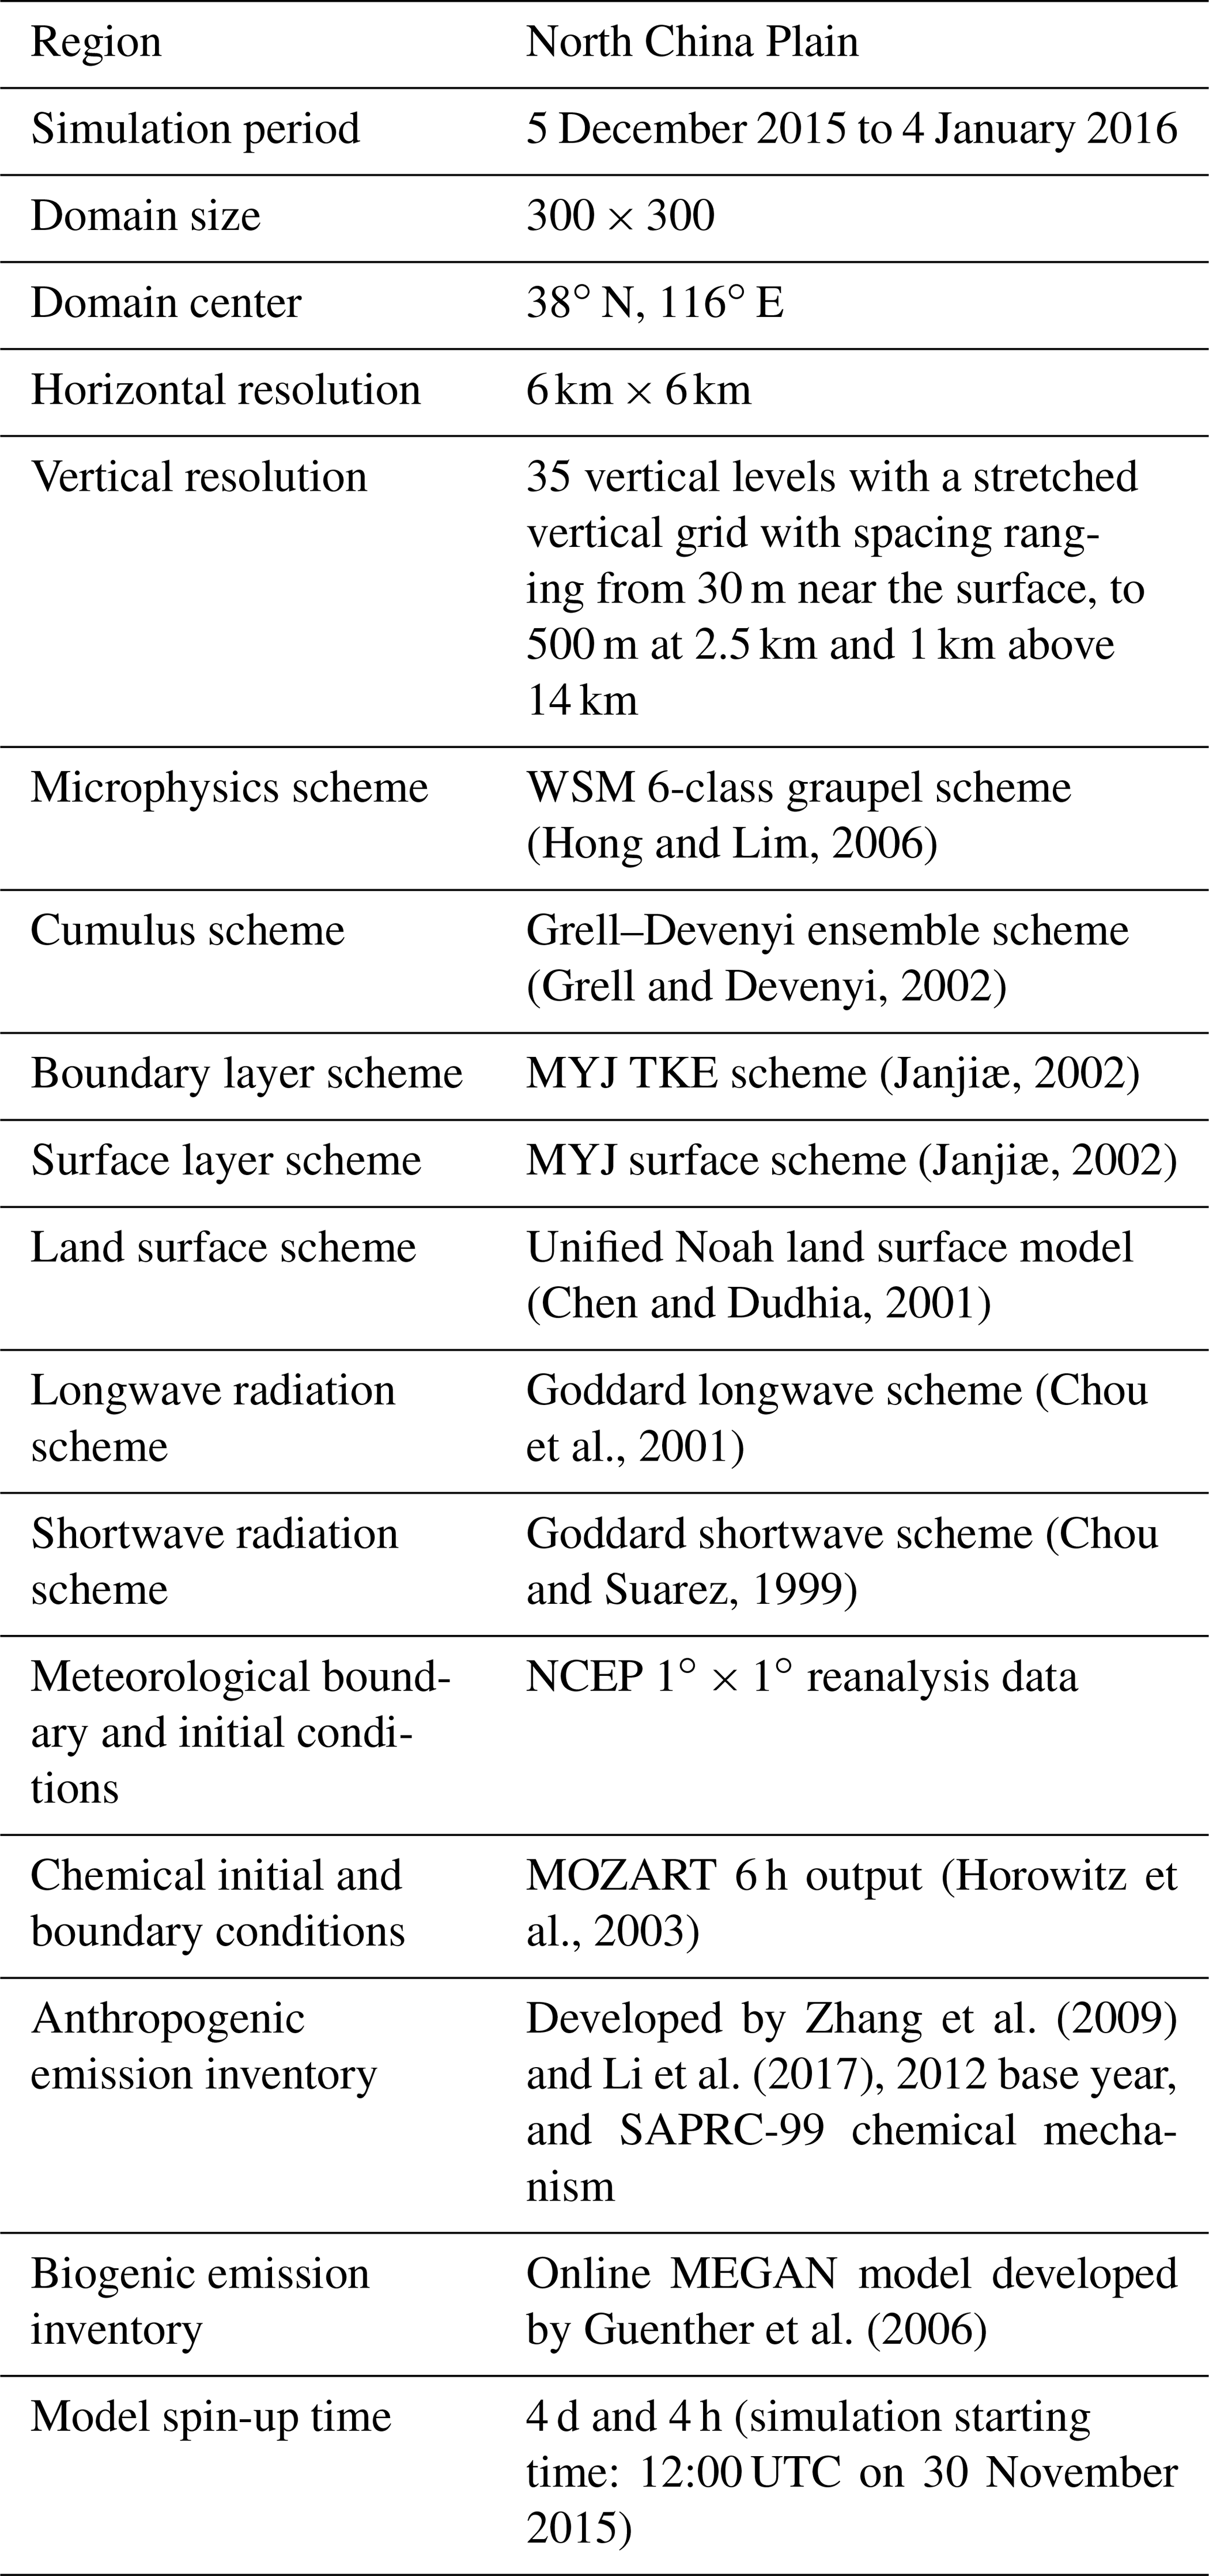
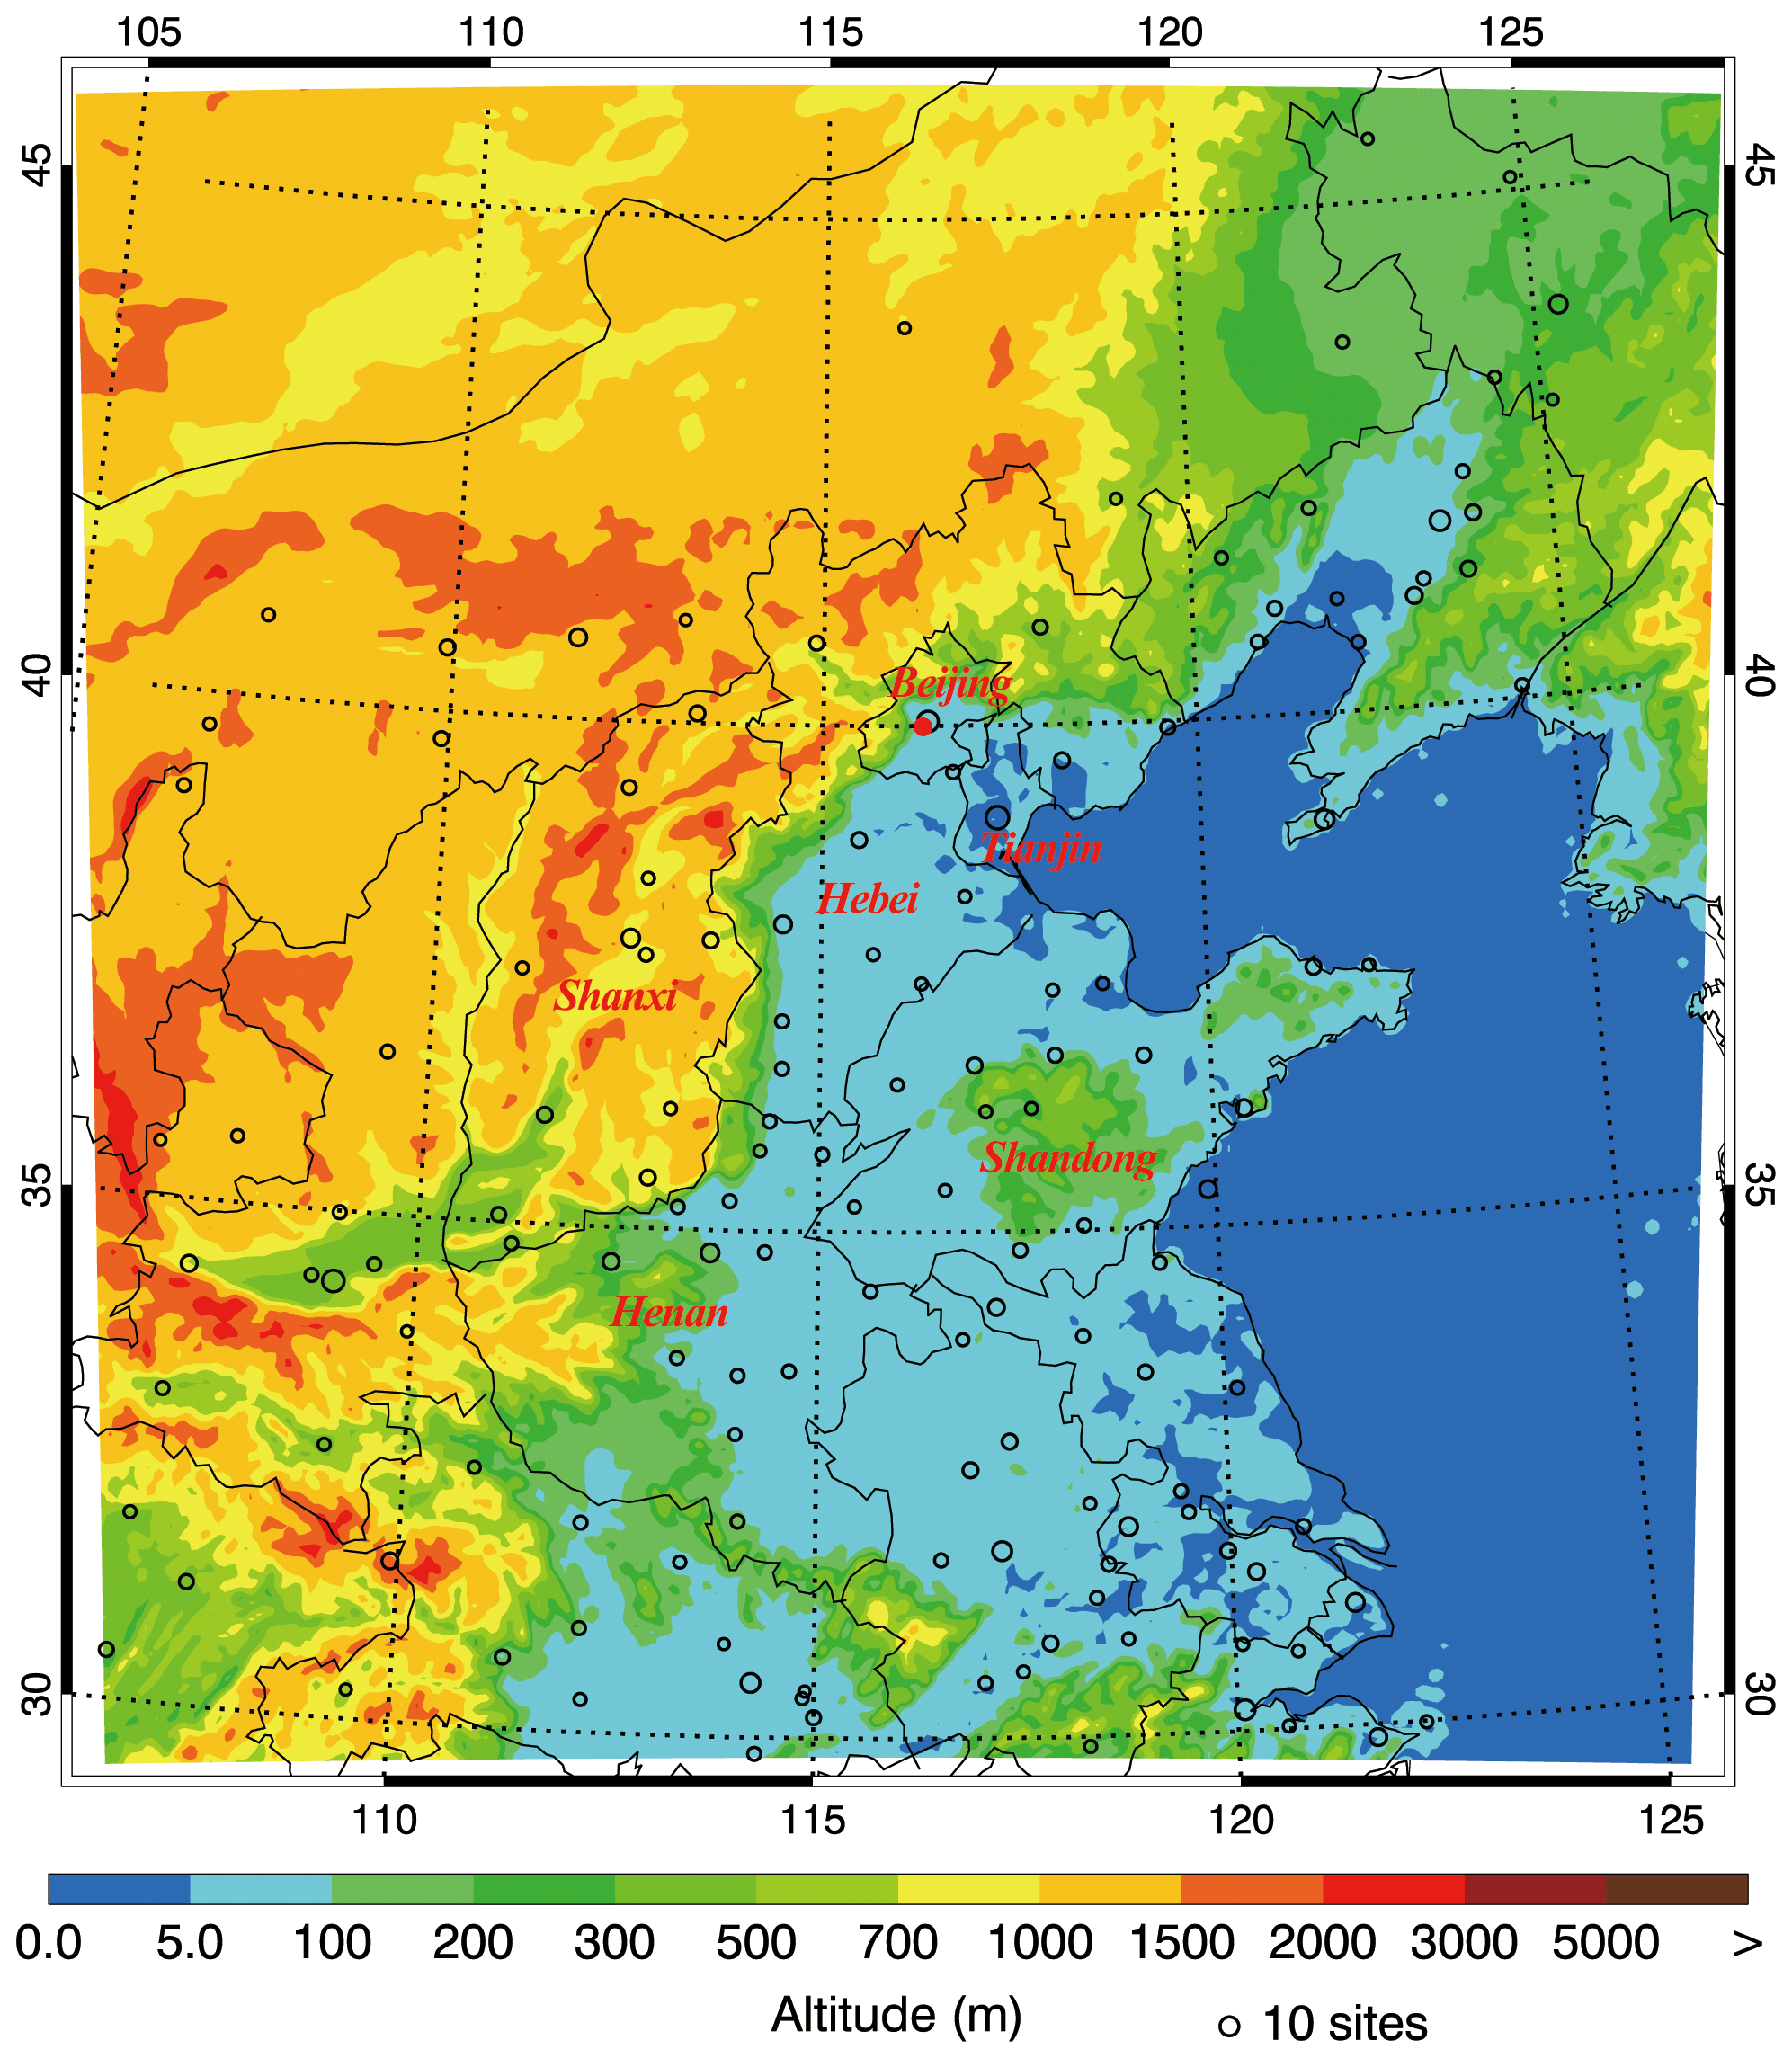
Figure 1WRF-Chem simulation domain with topography. The circles represent centers of cities with ambient monitoring sites, and the size of circles denotes the number of ambient monitoring sites of cities. The red circle denotes the observation site for aerosol species at the National Center for Nanoscience and Technology (NCNST), Chinese Academy of Sciences, Beijing.
2.2 Source-oriented WRF-Chem model
In the source-oriented WRF-Chem model, the SAPRC-99 photochemistry mechanism (Carter, 2010) and CMAQ aerosol module (AERO5) (Foley et al., 2010) are modified so that the precursors of aerosols from different sources and their corresponding reaction products are treated as different species and tracked independently in chemical, physical, and dynamical processes. It is worth noting that the tagged species have exactly identical physical and chemical properties to the original ones.
Black carbon (BC) and unspecified species (mainly mineral dust) from each source are tagged and only tracked in processes of transport, dispersion, and wet/dry deposition since they are not involved in photochemistry and gas-to-particle partitioning. For the inorganic aerosols (sulfate, nitrate, and ammonium) and organic aerosols (primary and secondary organic aerosols, i.e., POA and SOA), their precursors from each source and corresponding reaction products are treated as different species and simulated in the SAPRC-99 photochemistry mechanism and traced in processes of transport, dispersion, and wet/dry deposition, as well as gas-to-particle partitioning. A non-hardwired gas-phase chemical module is used to solve the SAPRC-99 photochemistry based on the Eulerian backward Gauss–Seidel iterative technique (Hess et al., 2000; Li et al., 2010). The module is flexible to include a new gas-phase species and its corresponding photochemical reactions.
The ISORROPIA model is used to distribute the NH3/ammonium, HNO3/nitrate, and water between the gas and aerosol phases as a function of total sulfate, total ammonia, total nitrate, relative humidity, and temperature (Nenes et al., 1998). Therefore, as a bulk method, the ISORROPIA model cannot be applied to separate the gas and aerosol phase for the inorganic aerosol from each source because of the interaction among various sources.
Except primary emissions, the SA for sulfate aerosols needs to be considered in the homogeneous and heterogeneous formation pathways. The sulfate growth from the gas-phase SO2 oxidation is contributed by the H2SO4 participating in nucleation and condensation, which are determined by the H2SO4 formation rate in the atmosphere. At time (t), after one integration time step (δt), the conceptual scheme of the source-oriented sulfate gas-phase formation is shown in Scheme 1a. In this study, a SO2 heterogeneous reaction parameterization associated with aerosol water is used, in which the SO2 oxidation in aerosol water by O2 catalyzed by Fe3+ is limited by mass transfer resistances in the gas phase and the gas–particle interface. Considering the effect of ionic strength and aerosol water acidity, the sulfate heterogeneous formation from SO2 is therefore parameterized as a first-order irreversible uptake by aerosols, with a reactive uptake coefficient of , assuming that there is enough alkalinity to maintain the high iron-catalyzed reaction rate (Li et al., 2017). The detailed description of the parameterization of the heterogeneous oxidation of SO2 involving aerosol water can be seen in the Supplement. Scheme 1b presents the sulfate SA for the heterogeneous formation. It is worth noting that, although there is a lack of precipitation during the simulated episode, the SA of sulfate formed in cloud water is also considered. The SO2 in cloud water is oxidized mainly by H2O2, O3, NO2, formic acid, and O2 catalyzed by Fe3+ and Mn2+. The SA for nitrate and ammonium aerosols follows the mass conversion of N(+VI) and N(−III) from each source, respectively, when the total ammonia and nitrate are distributed between the gas and aerosol phases by the ISORROPIA after one integration time step, as shown in Scheme 2.
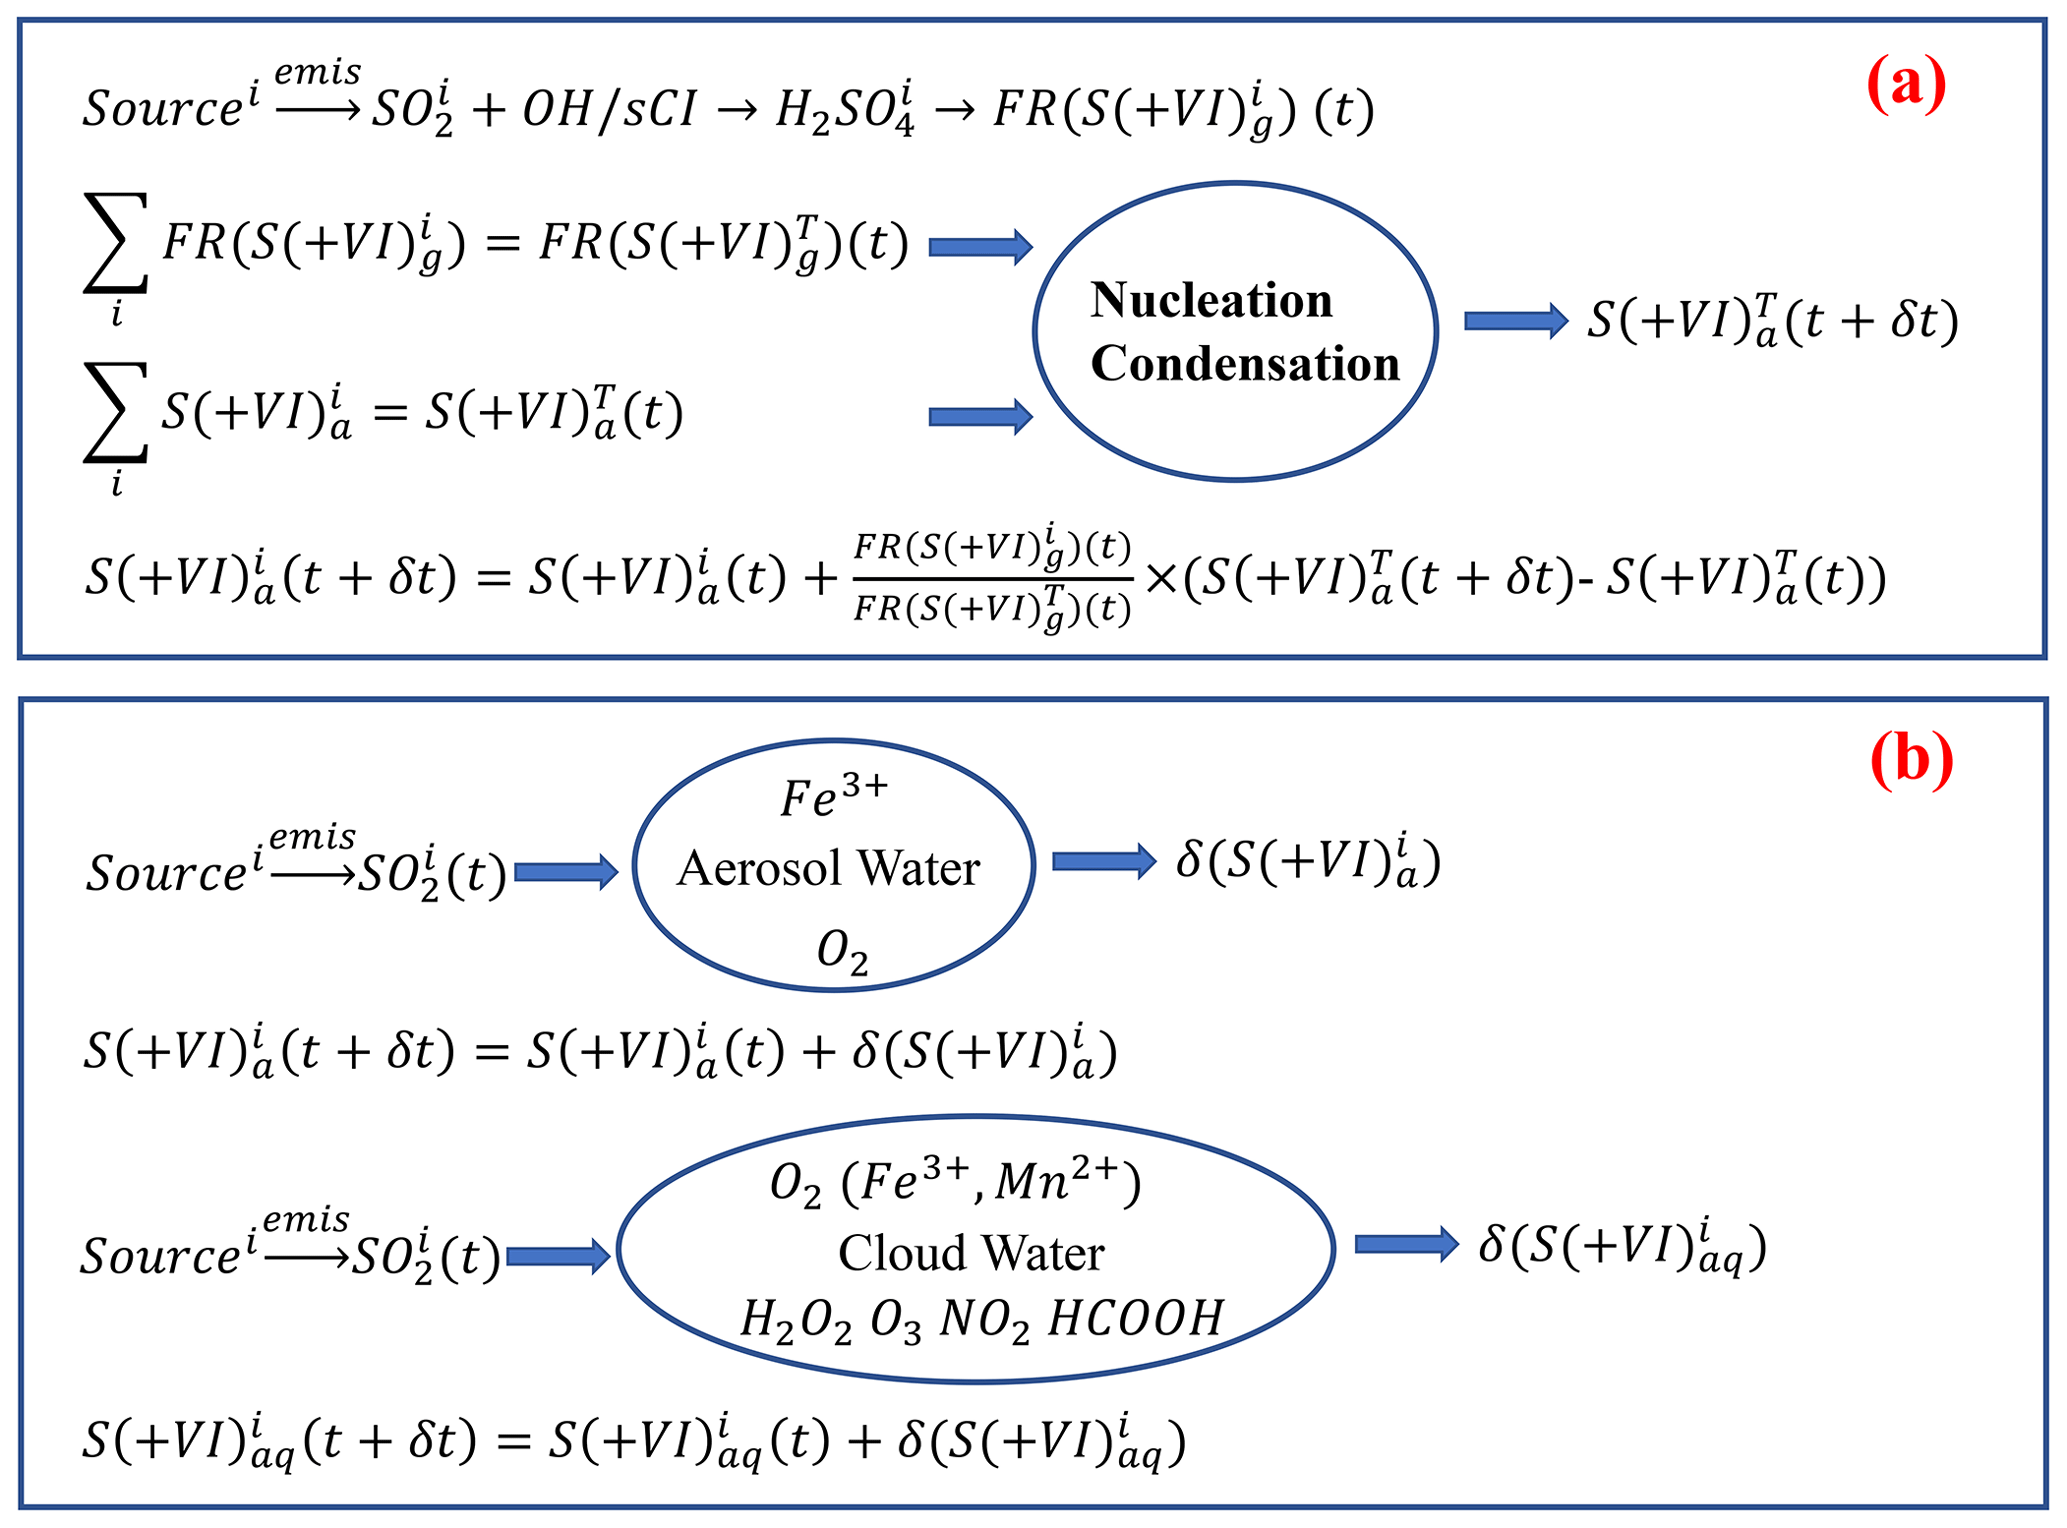
Scheme 1Conceptual scheme of source apportionment for sulfate aerosols formed from (a) homogeneous and (b) heterogeneous reactions. FR is the formation rate, superscript i the source number, superscript T the total, subscript g the gas phase, subscript a the aerosol phase, and subscript aq the aerosols in cloud water.
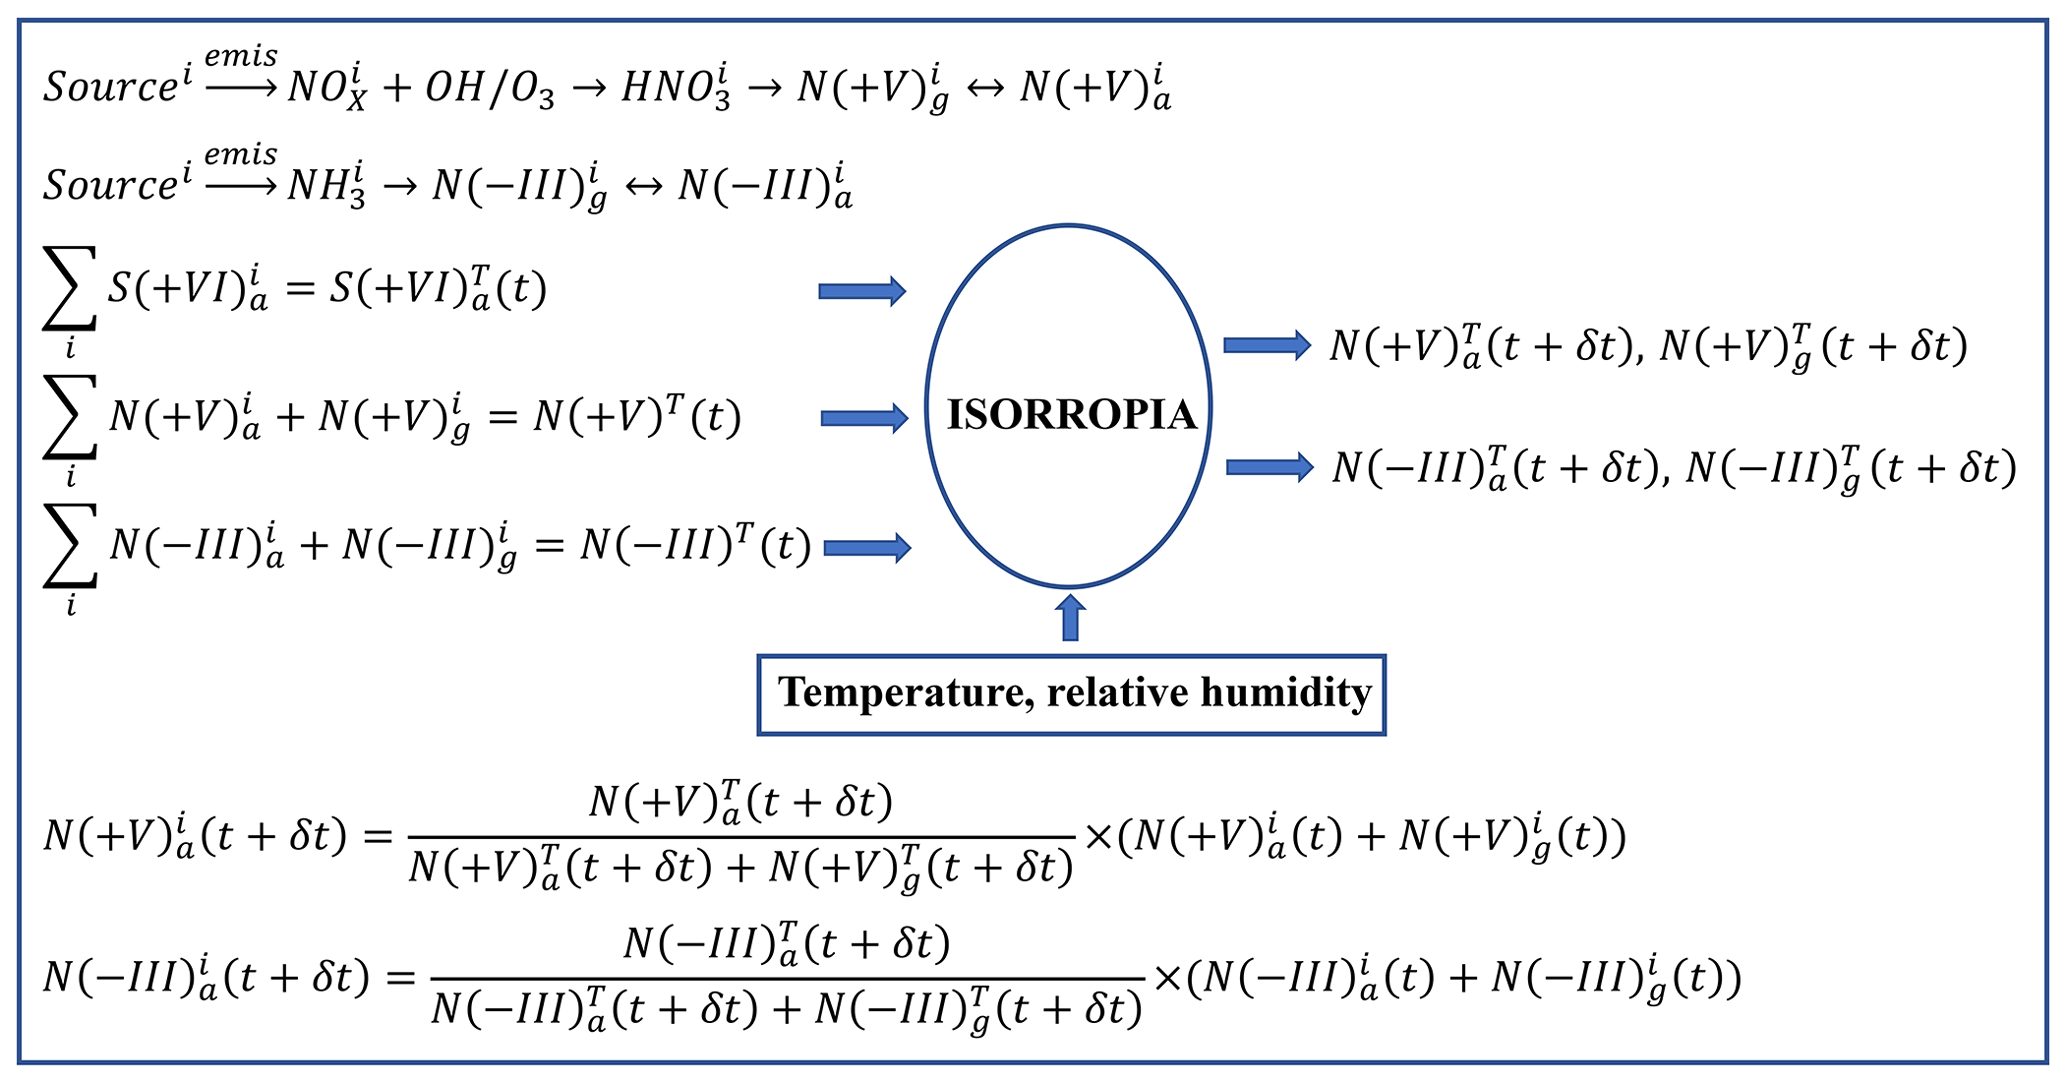
Scheme 2Conceptual scheme of source apportionment for nitrate and ammonium aerosols. Superscript i is the source number, superscript T the total, subscript g the gas phase, and subscript a the aerosol phase.
Organic aerosols are simulated using a non-traditional SOA module based on the volatility basis set (VBS) method, in which all primary species are treated as chemically reactive and distributed in logarithmically spaced volatility bins (Donahue et al., 2006; Robinson et al., 2007). Nine surrogate species with saturation concentration ranging from 10−2 to 106 µg m−3 at room temperature are considered to represent POA compositions (Shrivastava et al., 2008). The SOA formation from anthropogenic or biogenic precursors is predicted using four semi-volatile organic compounds (SVOCs), whose effective saturation concentrations at room temperature are 1, 10, 100, and 1000 µg m−3, respectively (Tsimpidi et al., 2010). The SOA formation includes the following pathways: (1) the oxidation of volatile organic compounds (VOCs), emitted from anthropogenic and biogenic sources; (2) intermediate VOCs (IVOCs), co-emitted with POA but never in the particle phase during the emissions process oxidized by OH; and (3) primary organic gases (POG), emitted or formed due to evaporation of POA and assumed to react with OH radicals to reduce their volatility and hence to partition between the gas and particle phase, forming SOA (Odum et al., 1996; Pankow, 1994; Lipsky and Robinson, 2006; Robinson et al., 2007; Shrivastava et al., 2006). The SOA yield from VOCs is NOx-dependent (Li et al., 2011a). The high-NOx and low-NOx yields are listed in the Table S1 in the Supplement, and parameters used to treat partitioning of POA emissions are listed in Table S2. The VBS method is in principle source-oriented, which can be used to trace the organic aerosol (OA) formation from various sources. Therefore, when considering SA for organic aerosols, we just need to treat all the SOA and POA, as well as their corresponding gas-phase organics from each emission source, as the VBS input, as shown in Scheme 3a. For the heterogeneous pathway, the SOA formation from glyoxal and methyglyoxal is parameterized as a first-order irreversible uptake on aerosol or cloud droplet surfaces, with a reactive uptake coefficient of (Volkamer et al., 2007; Zhao et al., 2006). The SA for heterogeneous SOA formation is shown in Scheme 3b, which is similar to that for heterogeneous sulfate formation.
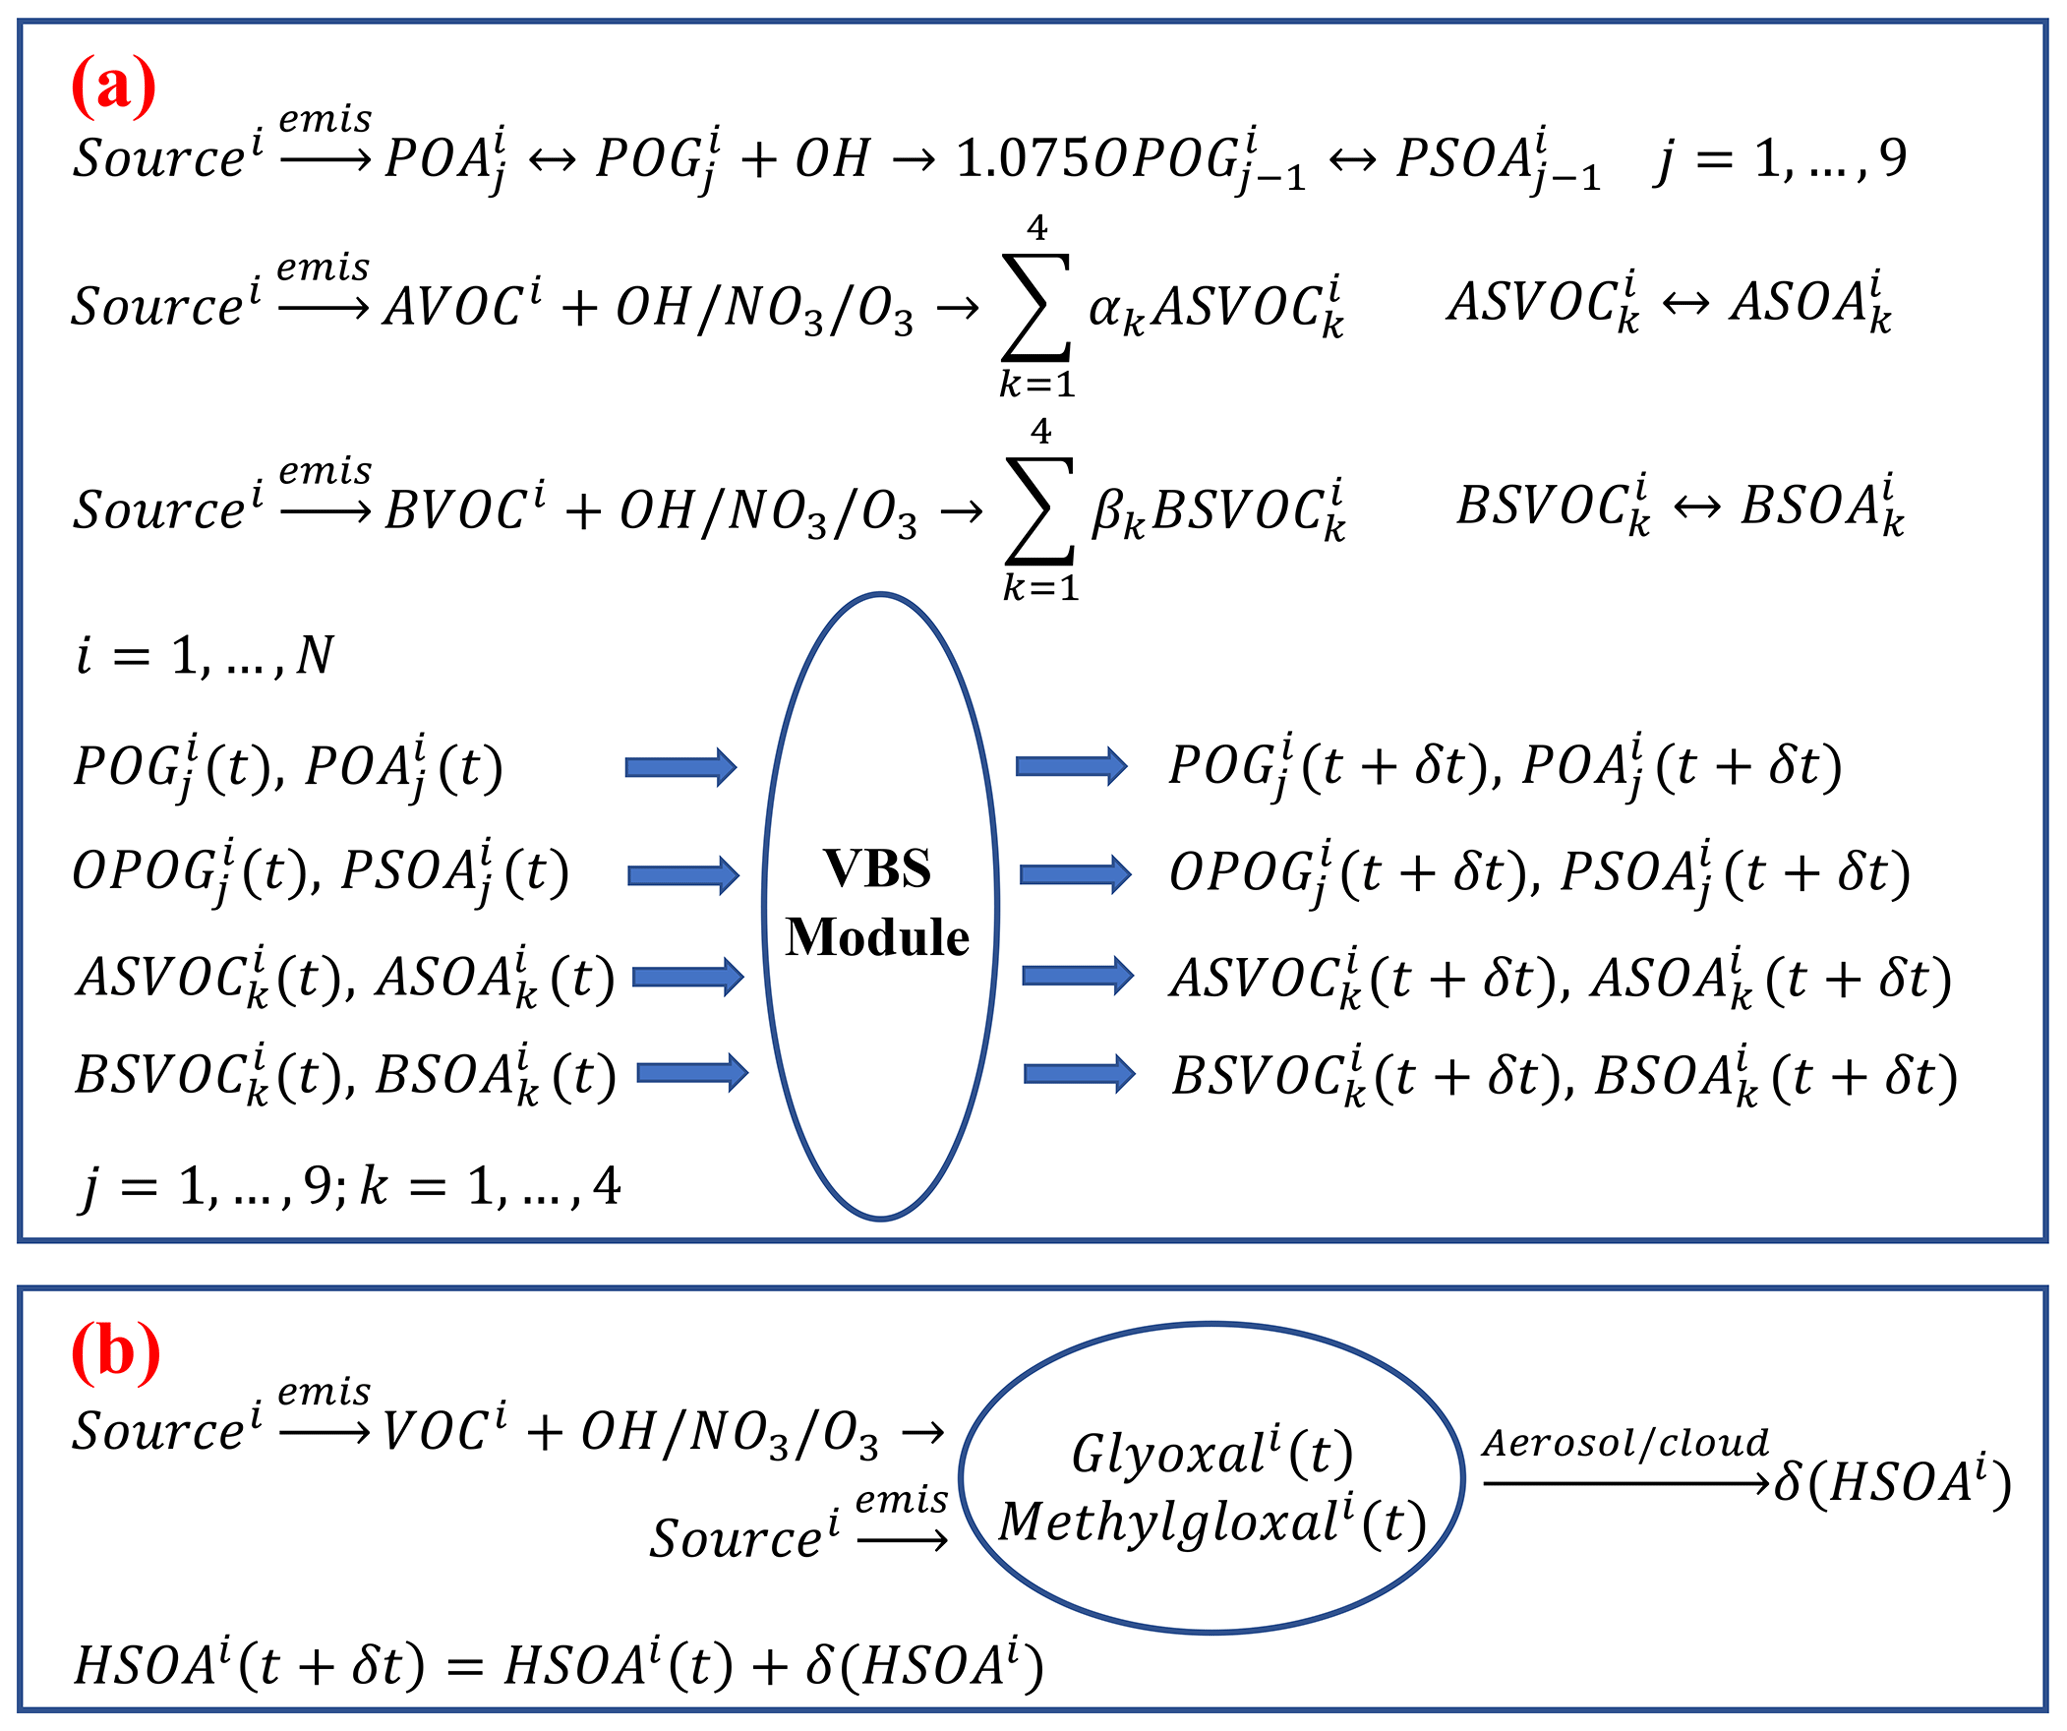
Scheme 3Conceptual scheme of source apportionment for organic aerosols formed from (a) homogeneous and (b) heterogeneous reactions. Superscript i is the source number, superscript T the total, subscripts j and k the volatility bin number, subscript g the gas phase, and subscript a the aerosol phase. AVOC and BVOC are the VOCs emitted from anthropogenic and biogenic sources; ASVOC and BSVOC are the SVOCs from the oxidation of AVOC and BVOC; OPOG is the oxidized POG. PSOA is the SOA from oxidation and partitioning of POA treated as semi-volatile; ASOA and BSOA are the SOA from the oxidation of anthropogenic and biogenic VOCs; and HSOA is the SOA from the irreversible uptake of glyoxal and methylglyoxal on aerosol and cloud surfaces.
2.3 Data and statistical methods for comparisons
The model performance in simulating PM2.5, O3, NO2, SO2, and CO is validated using the hourly observations released by the Ministry of Ecology and Environment of China (China MEP), with 389 observation sites in the NCP. In addition, the predicted submicron sulfate, nitrate, ammonium, and organic aerosols are compared to measurements by the Aerodyne Aerosol Chemical Speciation Monitor (ACSM), which is deployed at the National Center for Nanoscience and Technology (NCNST), Chinese Academy of Sciences, in Beijing (Fig. 1). POA and SOA concentrations are obtained from the ACSM measurements and analyzed using PMF. The meteorological parameters including surface pressure, temperature, wind speed, and wind direction with a 3 h interval are obtained from the website at http://www.meteomanz.com (last access: 23 December 2020), including the observation sites at Beijing, Tianjin, Shijiazhuang, Jinan, Zhengzhou, Hefei, and Nanjing (Fig. S1 in the Supplement). Furthermore, the reanalysis data from the European Centre for Medium-Range Weather Forecasts (ECMWF) are used to analyze the synoptic patterns during the study episode.
In the present study, the mean bias (MB), root mean square error (RMSE), and the index of agreement (IOA) are used as indicators to evaluate the performance of the WRF-Chem model. IOA describes the relative difference between the model and observations, ranging from 0 to 1, with 1 indicating perfect agreement.
where Pi and Oi are the predicted and observed pollutant concentrations, respectively. N is the total number of the predictions used for comparisons, and and represent the average of the prediction and observations, respectively.
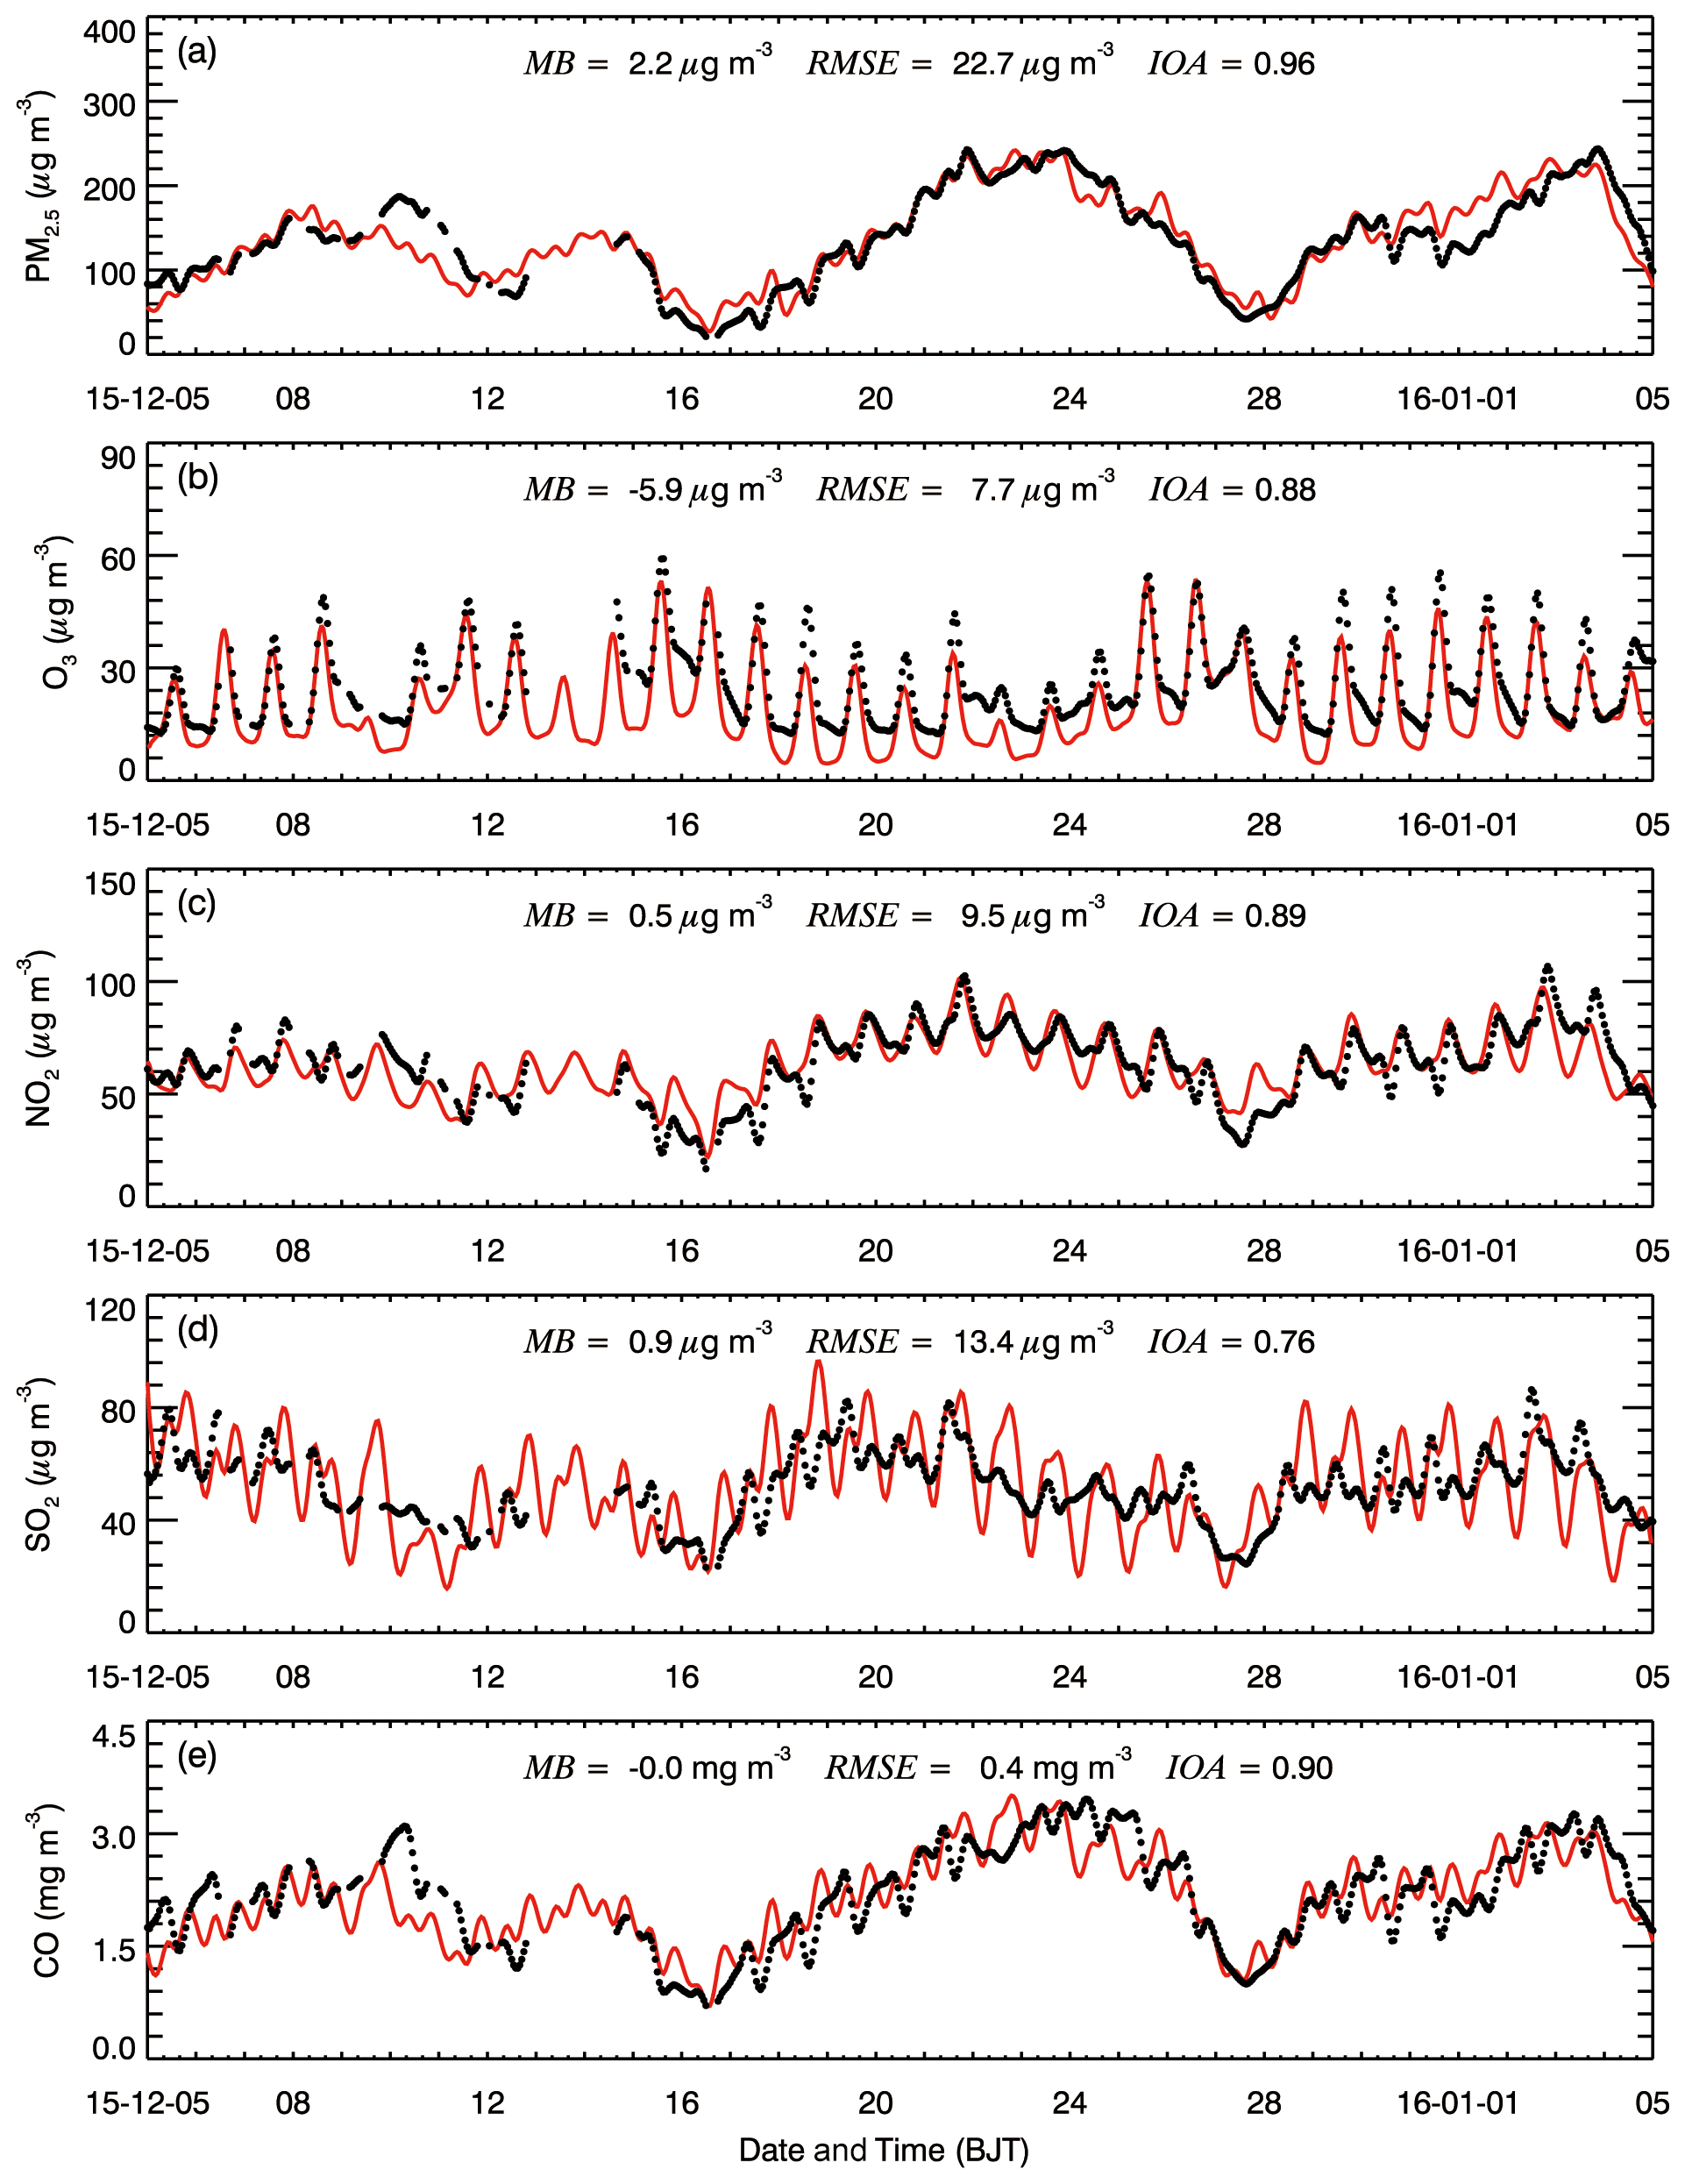
Figure 2Comparison of observed (black dots) and simulated (solid red lines) diurnal profiles of near-surface hourly mass concentrations of (a) PM2.5, (b) O3, (c) NO2, (d) SO2, and (d) CO averaged at monitoring sites in the NCP from 5 December 2015 to 4 January 2016.
3.1 Model performance
Figure 2 shows the diurnal profiles of observed and simulated near-surface PM2.5, O3, NO2, SO2, and CO concentrations averaged at monitoring sites in the NCP from 5 December 2015 to 4 January 2016. The model generally performs well in reproducing the temporal variation of PM2.5 concentrations in the NCP, with an IOA of 0.96, but slightly overestimates PM2.5 concentrations compared to measurements, with a MB of 2.2 µg m−3. The diurnal O3 variation is successfully replicated by the model, such as peak afternoon O3 concentrations caused by active photochemistry and low nighttime O3 concentrations due to the NOx titration, with an IOA of 0.88. However, the model tends to underestimate the O3 concentration compared to measurements, particularly during nighttime, with a MB of −5.9 µg m−3. The model also reproduces the NO2 diurnal profiles with peaks in the evening reasonably well, with an IOA of 0.89 and a MB of 0.5 µg m−3, but considerable overestimations or underestimations still exist. The model generally tracks the temporal variation of SO2 concentrations against observations reasonably well, with an IOA of 0.76. However, the biases for the SO2 simulation are also large, considering that SO2 is mainly emitted from point sources, and its simulations are more sensitive to wind field uncertainties (Bei et al., 2017). Compared with measurements, the temporal profile of the near-surface CO concentration in the NCP is well simulated, with an IOA and MB of 0.90 and 0.0 µg m−3, respectively. Generally, the accumulation and trans-boundary transport of air pollutants are mainly dependent on regional meteorological conditions. Figure S2 shows the average geopotential heights at 500 hPa and the mean sea level pressures with wind vectors during the study episode. During the simulated episode, the NCP is situated behind the trough at 500 hPa. The NCP is controlled by the high-pressure system at the surface on a large scale due to the upper level trough, ranging from 1026 to 1030 hPa, and the prevailing wind over the NCP is weak or calm, which is unfavorable for the dissipation of air pollutants. Figure S3 shows the diurnal profiles of observed and simulated near-surface pressure, temperature, wind speed, and wind direction averaged at monitoring sites in the NCP from 5 December 2015 to 4 January 2016. The WRF-Chem model performs well in reproducing the diurnal variability of near-surface pressure, surface temperature (TSFC), wind speed, and wind direction, with IOAs of 0.63, 0.84, 0.75, and 0.54, respectively. During the study episode, the simulated and observed near-surface pressures are 1024.0 and 1028.5 hPa, indicating that a high-pressure system controls the NCP (Fig. S2). The southerly wind prevails over the NCP during the study episode, with simulated and observed wind directions of 180.6 and 175.1∘. Moreover, the simulated and observed wind speeds are approximately 2 m s−1 over the NCP during the simulated episode. Therefore, the air pollutants are subject to being transported from south to north, and the weak or calm wind also appears in some regions, which is favorable for the accumulation of air pollutants. For example, from 16 to 24 December 2015, the wind speed in the NCP decreases and the wind direction turns to be southerly, facilitating the accumulation of air pollutants, and meanwhile a serious PM pollution episode with high PM2.5 concentrations occurs.
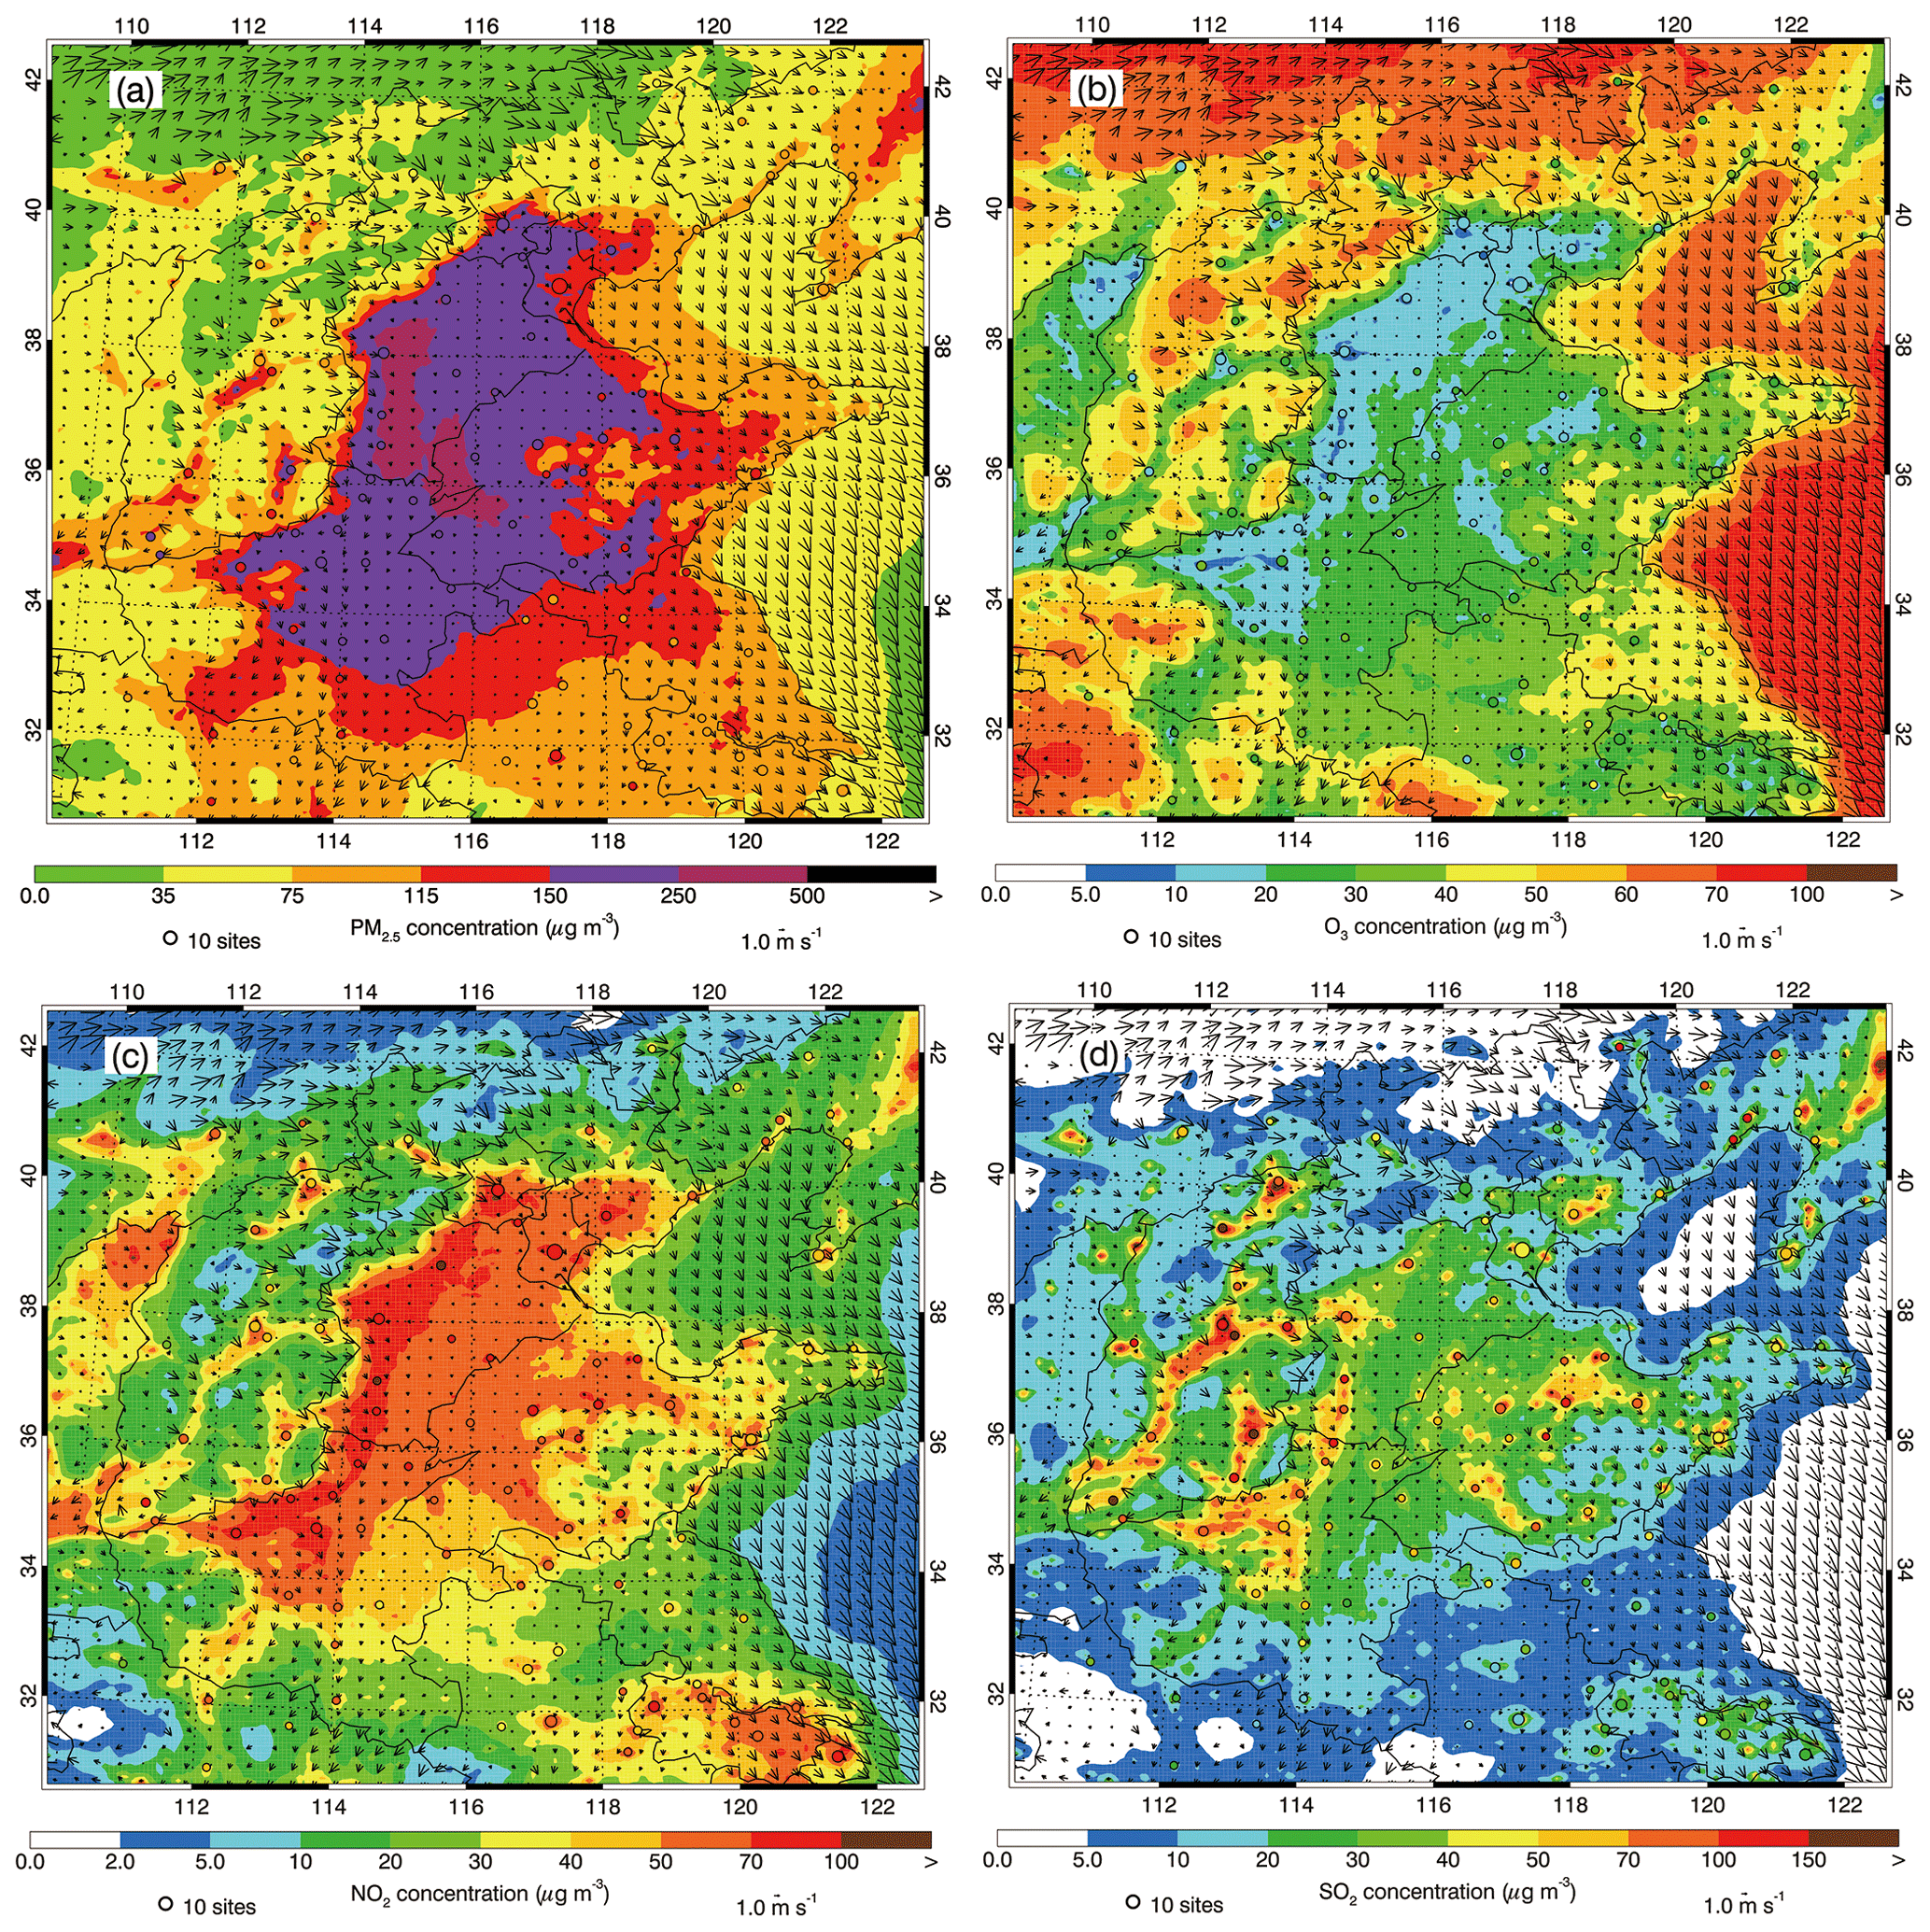
Figure 3Pattern comparisons of simulated (color contours) vs. observed (colored circles) near-surface mass concentrations of (a) PM2.5, (b) O3, (c) NO2, and (d) SO2 averaged from 5 December 2015 to 4 January 2016. The black arrows indicate simulated near-surface winds.
Figure 3 shows the spatial pattern of simulated and observed average near-surface concentrations of PM2.5, O3, NO2, and SO2 along with simulated winds during the episode in the NCP. The simulated air pollutant distributions are generally in good agreement with observations, although the model biases still exist. During the haze episode, the simulated weak or calm winds are favorable for the accumulation of air pollutants, leading to the occurrence of serious air pollution in the NCP. The simulated average near-surface PM2.5 concentrations during the episode are more than 115 µg m−3 in the NCP, which is consistent with observations. The simulated and observed average O3 concentrations during the episode are not high, generally less than 40 µg m−3. The low O3 concentration during the episode is chiefly caused by the slow photochemical activities due to weak wintertime insolation, which is further attenuated by clouds and aerosols and the resultant titration of high NOx emissions (Li et al., 2018). The observed and calculated average NO2 and SO2 concentrations are still high in the NCP, varying from 30 to 100 and 20 to 100 µg m−3, respectively, although strict emission mitigation measures have been carried out since 2013. Interestingly, the simulated SO2 concentrations in cities and their surrounding areas are very high, but the simulated NO2 concentrations present uniform distribution in the NCP, indicating the substantial contribution of NOx area sources. The diurnal variability in the spatial distribution of simulated and observed air pollutants is shown in Figs. S9 to S12. The spatial patterns of air pollutants at different times are generally similar to those of the episode average. The PM2.5 pollution in the NCP is more severe during nighttime and early morning, especially at 08:00 and 20:00 BJT due to rush hour.

Figure 4Comparison of measured (black dots) and simulated (black line) diurnal profiles of submicron aerosol species of (a) POA, (b) SOA, (c) sulfate, (d) nitrate, and (e) ammonium at the NCNST site in Beijing from 5 December 2015 to 4 January 2016.
Figure 4 provides the temporal variations of simulated and observed aerosol species at NCNST in Beijing during the episode. Generally, the model predicts the temporal variations of the aerosol species compared to the measurements reasonably. The model yields the major peaks of the POA concentration compared to observations in Beijing but frequently underestimates or overestimates the POA concentration, with an IOA of 0.80 and a MB of −2.0 µg m−3. As a primary species, the POA in Beijing is determined by local emissions and regional transport outside of Beijing during haze days, so uncertainties from emissions and meteorological fields have large potential to influence POA simulations (Bei et al., 2017). Although the VBS modeling method is used, and contributions from glyoxal and methylglyoxal are included in the study, the model still has difficulties in simulating the SOA concentrations, with an IOA and MB of 0.67 and −10.5 µg m−3, respectively. Except the SOA formation and transformation mechanism in the atmosphere, which remains elusive, many factors have the potential to affect the SOA simulation, such as meteorology, measurements, precursor emissions, and SOA treatments (Li et al., 2011a, b). The model reasonably reproduces the sulfate temporal variation compared to measurements, and the MB and IOA are −3.5 µg m−3 and 0.87, respectively. The model also performs well in simulating the nitrate and ammonium concentrations compared to measurements in Beijing, with IOAs of 0.92 and 0.88, respectively.
Generally, the model simulates the spatial distribution and temporal variation of air pollutants in the NCP well, and the predicted aerosol species are also consistent with the measurements in Beijing. Good model performance in simulating air pollutants and aerosol species provides a reliable basis for quantifying contributions of local and nonlocal emissions to the PM pollution in the NCP.
3.2 Source apportionment of the PM pollution in the NCP
We have marked the emitted precursors in six provinces, including Beijing, Tianjin, Hebei, Henan, Shandong, and Shanxi in simulations of the source-oriented WRF-Chem model (Fig. S1). Additionally, the boundary transport and emissions from areas not within the six provinces are taken as the background source. Therefore, PM2.5 contributions of the nonlocal emissions for each of the six provinces include those transported from the other five provinces and the background source.

Figure 5Spatial distribution of average PM2.5 contributions from (a) Beijing, (b) Tianjin, (c) Hebei, (d) Shandong, (e) Henan, and (f) Shanxi provinces from 5 December 2015 to 4 January 2016.
Figure 5 shows the average PM2.5 contribution of emissions from the six provinces during the study episode. Evidently, emissions from the six provinces influence the PM2.5 level in the whole NCP, showing the necessity of collaborative emission mitigation to reduce PM pollution. Emissions of Hebei, Henan, and Shandong not only significantly deteriorate the local PM pollution, with PM2.5 contributions ranging from 50 to over 100 µg m−3, but also considerably enhance the PM2.5 level in their surrounding areas by about 5–50 µg m−3. Emissions of Beijing and Tianjin increase the local PM2.5 concentrations by 10–100 µg m−3 and contribute about 3–10 µg m−3 PM2.5 to their surrounding areas. Due to blocking by the mountains, PM2.5 contributions of the Shanxi emissions to the NCP are not significant, ranging from 3 to 20 µg m−3. The diurnal variations in the spatial distribution of average PM2.5 contributions from the six provinces during the study episode are also shown in Figs. S14 to S19. There is no significant difference among the spatial distribution of PM2.5 contributions from the six provinces at different times, but the higher PM2.5 contribution of emissions from the source region generally occurs at 08:00 and 20:00 BJT.
Beijing is surrounded from the southwest to the northeast by the Taihang and Yanshan mountain ranges and is open to the NCP in the south and east. During haze events, southerly or easterly winds generally prevail in the NCP (Fig. S3), facilitating the transport of air pollutants emitted from the NCP to Beijing and further accumulation due to the mountain blocking (Long et al., 2016). During the study episode, the average simulated PM2.5 concentration in Beijing is around 125.3 µg m−3, of which the contribution of local emissions is 36.3 %. The remaining 63.7 % of PM2.5 concentrations in Beijing is accounted for by non-Beijing emissions, showing that Beijing's air quality is dominated by non-Beijing emissions during the PM pollution episode. The PM2.5 contribution of Hebei emissions to Beijing is 24.6 %, greater than that of Shandong (8.3 %), Tianjin (7.4 %), Henan (3.6 %), and Shanxi (3.3 %). The background source contributes about 16.5 % of the PM2.5 mass in Beijing on average. Overall, the contribution of emissions from Beijing's five surrounding provinces to the PM2.5 mass is 47.2 %, exceeding that of local emissions, indicating the importance of the trans-boundary transport of air pollutants in haze formation in Beijing. Adjacent to Beijing, Tianjin's air quality is also dominated by the trans-boundary transport of air pollutants. The average PM2.5 contribution of nonlocal emissions is 67.3 %, of which Hebei, Shandong, Beijing, Henan, and Shanxi account for 29.3 %, 11.7 %, 8.0 %, 4.0 %, and 3.0 %, respectively. The PM2.5 contribution of local emissions in Hebei, Henan, and Shanxi is almost as much as that of trans-boundary transport, with averages of 50.2 %, 45.7 %, and 49.2 %, respectively. The Shandong emissions play an important role in the air quality in Hebei and Henan, with PM2.5 contributions of about 15 %. Moreover, Shandong's air quality is primarily determined by local emissions, with an average PM2.5 contribution of 64.9 %. Emissions of Beijing, Tianjin, Hebei, Henan, and Shanxi contribute less than 8 % of the PM2.5 mass in Shandong. The background source makes up approximately 11.3 %, 11.4 %, 16.8 %, 11.4 %, and 21.8 % of the PM2.5 mass in Tianjin, Hebei, Henan, Shandong, and Shanxi, respectively. Figure S20 also provides the vertical profiles of the average PM2.5 contribution from local and nonlocal emissions in Beijing, Tianjin, Hebei, Henan, Shandong, and Shanxi during the episode. Generally, the PM2.5 contribution of local emissions in the six provinces in the NCP declines rapidly with altitude due to the efficient advection in the upper planetary boundary layer (PBL). The local contribution decreases to less than 20 % in the upper PBL in Beijing and Tianjin and is generally more than 25 % in the other four provinces. In Shandong, the PM2.5 concentration is mainly dominated by local emissions in the lower PBL, but the local contribution presents a significant decreasing trend in the upper PBL.
Previous studies have shown that there are large uncertainties in the contribution of local emissions or trans-boundary transport to Beijing's PM pollution (Guo et al., 2010, 2014; Li et al., 2015; Zhang et al., 2015; Wu et al., 2017). We further evaluate the contribution of local and nonlocal emissions to the PM2.5 mass in Beijing under different pollution levels, as well as in the other five provinces. The simulated hourly near-surface PM2.5 mass concentrations in Beijing during the whole episode are first subdivided into six bins based on the air quality standard in China for PM2.5, i.e., 0–35 (excellent), 35–75 (good), 75–115 (lightly polluted), 115–150 (moderately polluted), 150–250 (heavily polluted), and exceeding 250 µg m−3 (severely polluted) (Feng et al., 2016). PM2.5 contributions from local emissions and the other five provinces as well as the background source to Beijing are assembled separately as the bin PM2.5 concentrations following the grid cells, and an average of PM2.5 contributions from each source in each bin is calculated. The same method is also used for the other five provinces.
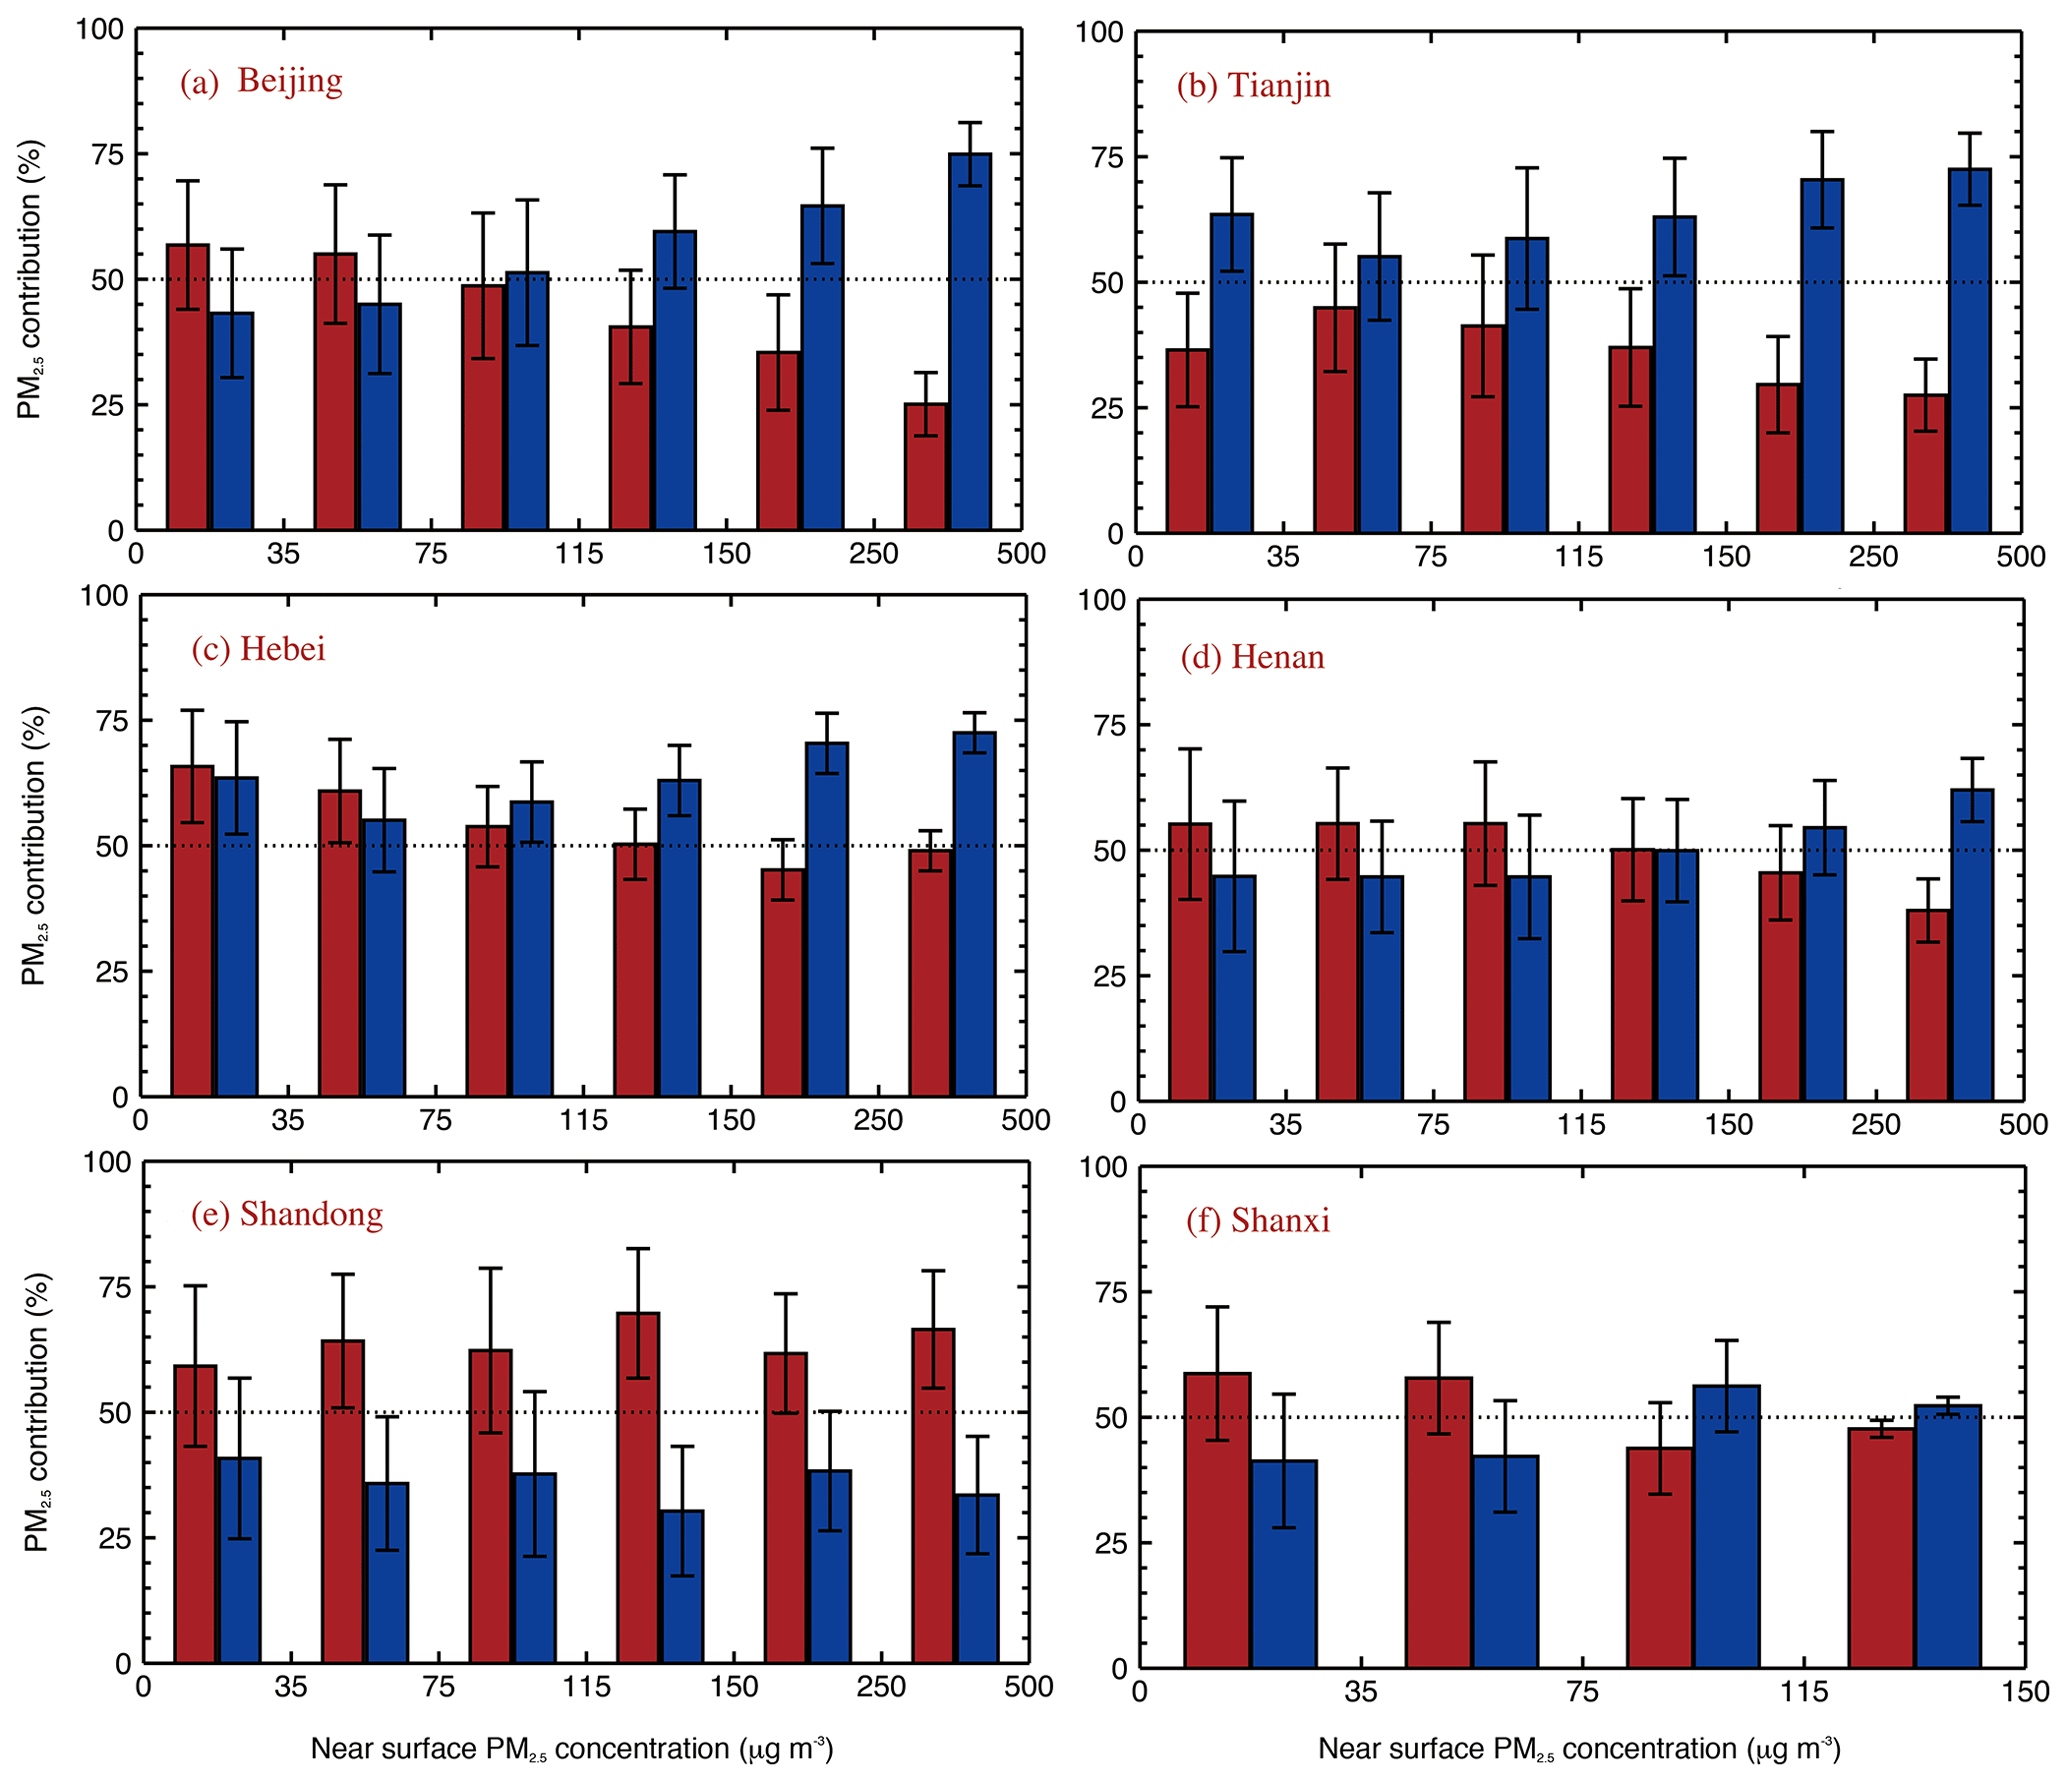
Figure 6Average PM2.5 contributions (%) in (a) Beijing, (b) Tianjin, (c) Hebei, (d) Henan, (e) Shandong, and (f) Shanxi from local (red) and nonlocal (blue) emissions from 5 December 2015 to 4 January 2016 under different pollution levels. Uncertainty is denoted by the error bars.
Tables 2 and 3 and Fig. 6 present the average percentage contribution of local and nonlocal emissions to the PM2.5 concentrations in Beijing, Tianjin, Hebei, Henan, Shandong, and Shanxi during the episode under different pollution levels. The local emission dominates the PM2.5 mass when the air quality is excellent and good in Beijing, with the average contribution of 56.8 % and 55.0 %, respectively. Moreover, the PM2.5 contribution of local emissions decreases with the deterioration of the air quality in Beijing, with an average contribution of 48.7 %, 40.5 %, 35.4 %, and 25.1 %, respectively, when the air quality is slightly, moderately, heavily, and severely polluted. Therefore, nonlocal emissions play a dominant role in Beijing's PM pollution; particularly when the air quality is severely polluted, nonlocal emissions contribute around 75 % of the PM2.5 mass in Beijing. With the excellent and good air quality in Beijing, the contribution of emissions from the other five provinces is 22.4 % and 29.5 %, respectively, much less than the contributions of local emissions. However, the contribution increases from 37.6 % to 54.3 % with deterioration of Beijing's air quality from being slightly to severely polluted. The result is consistent with that from Lang et al. (2013), reporting that regional transport accounts for 54.6 % of the PM2.5 mass in Beijing during a PM pollution episode. Additionally, Jiang et al. (2015) have concluded that the transport from the environs of Beijing contributes about 55 % of the peak PM2.5 concentration in the city during a severe PM pollution episode that occurred in December 2013. Wu et al. (2017) have also shown that 61.5 % of the PM2.5 mass in Beijing is contributed by regional transport during a summertime PM pollution episode. The contribution of Hebei emissions to the PM2.5 mass in Beijing is the most significant, exceeding 20 % when Beijing's air quality is not excellent. The contribution of emissions from Tianjin, Henan, Shandong, and Shanxi is generally less than 10 % under different pollution levels. However, when Beijing's air quality is severely polluted, the contribution of Shandong emissions is also significant, reaching 16.4 %. The background source contributes more than 20 % of the PM2.5 mass in Beijing when the air quality is excellent and severely polluted and between 12.8 % and 15.4 % under the other pollution levels.
Table 2Average PM2.5 contributions (%) in Beijing, Tianjin, and Hebei under different pollution levels from local sources, the other five provinces, and the background source from 5 December 2015 to 4 January 2016. The bold font indicates the local contribution.
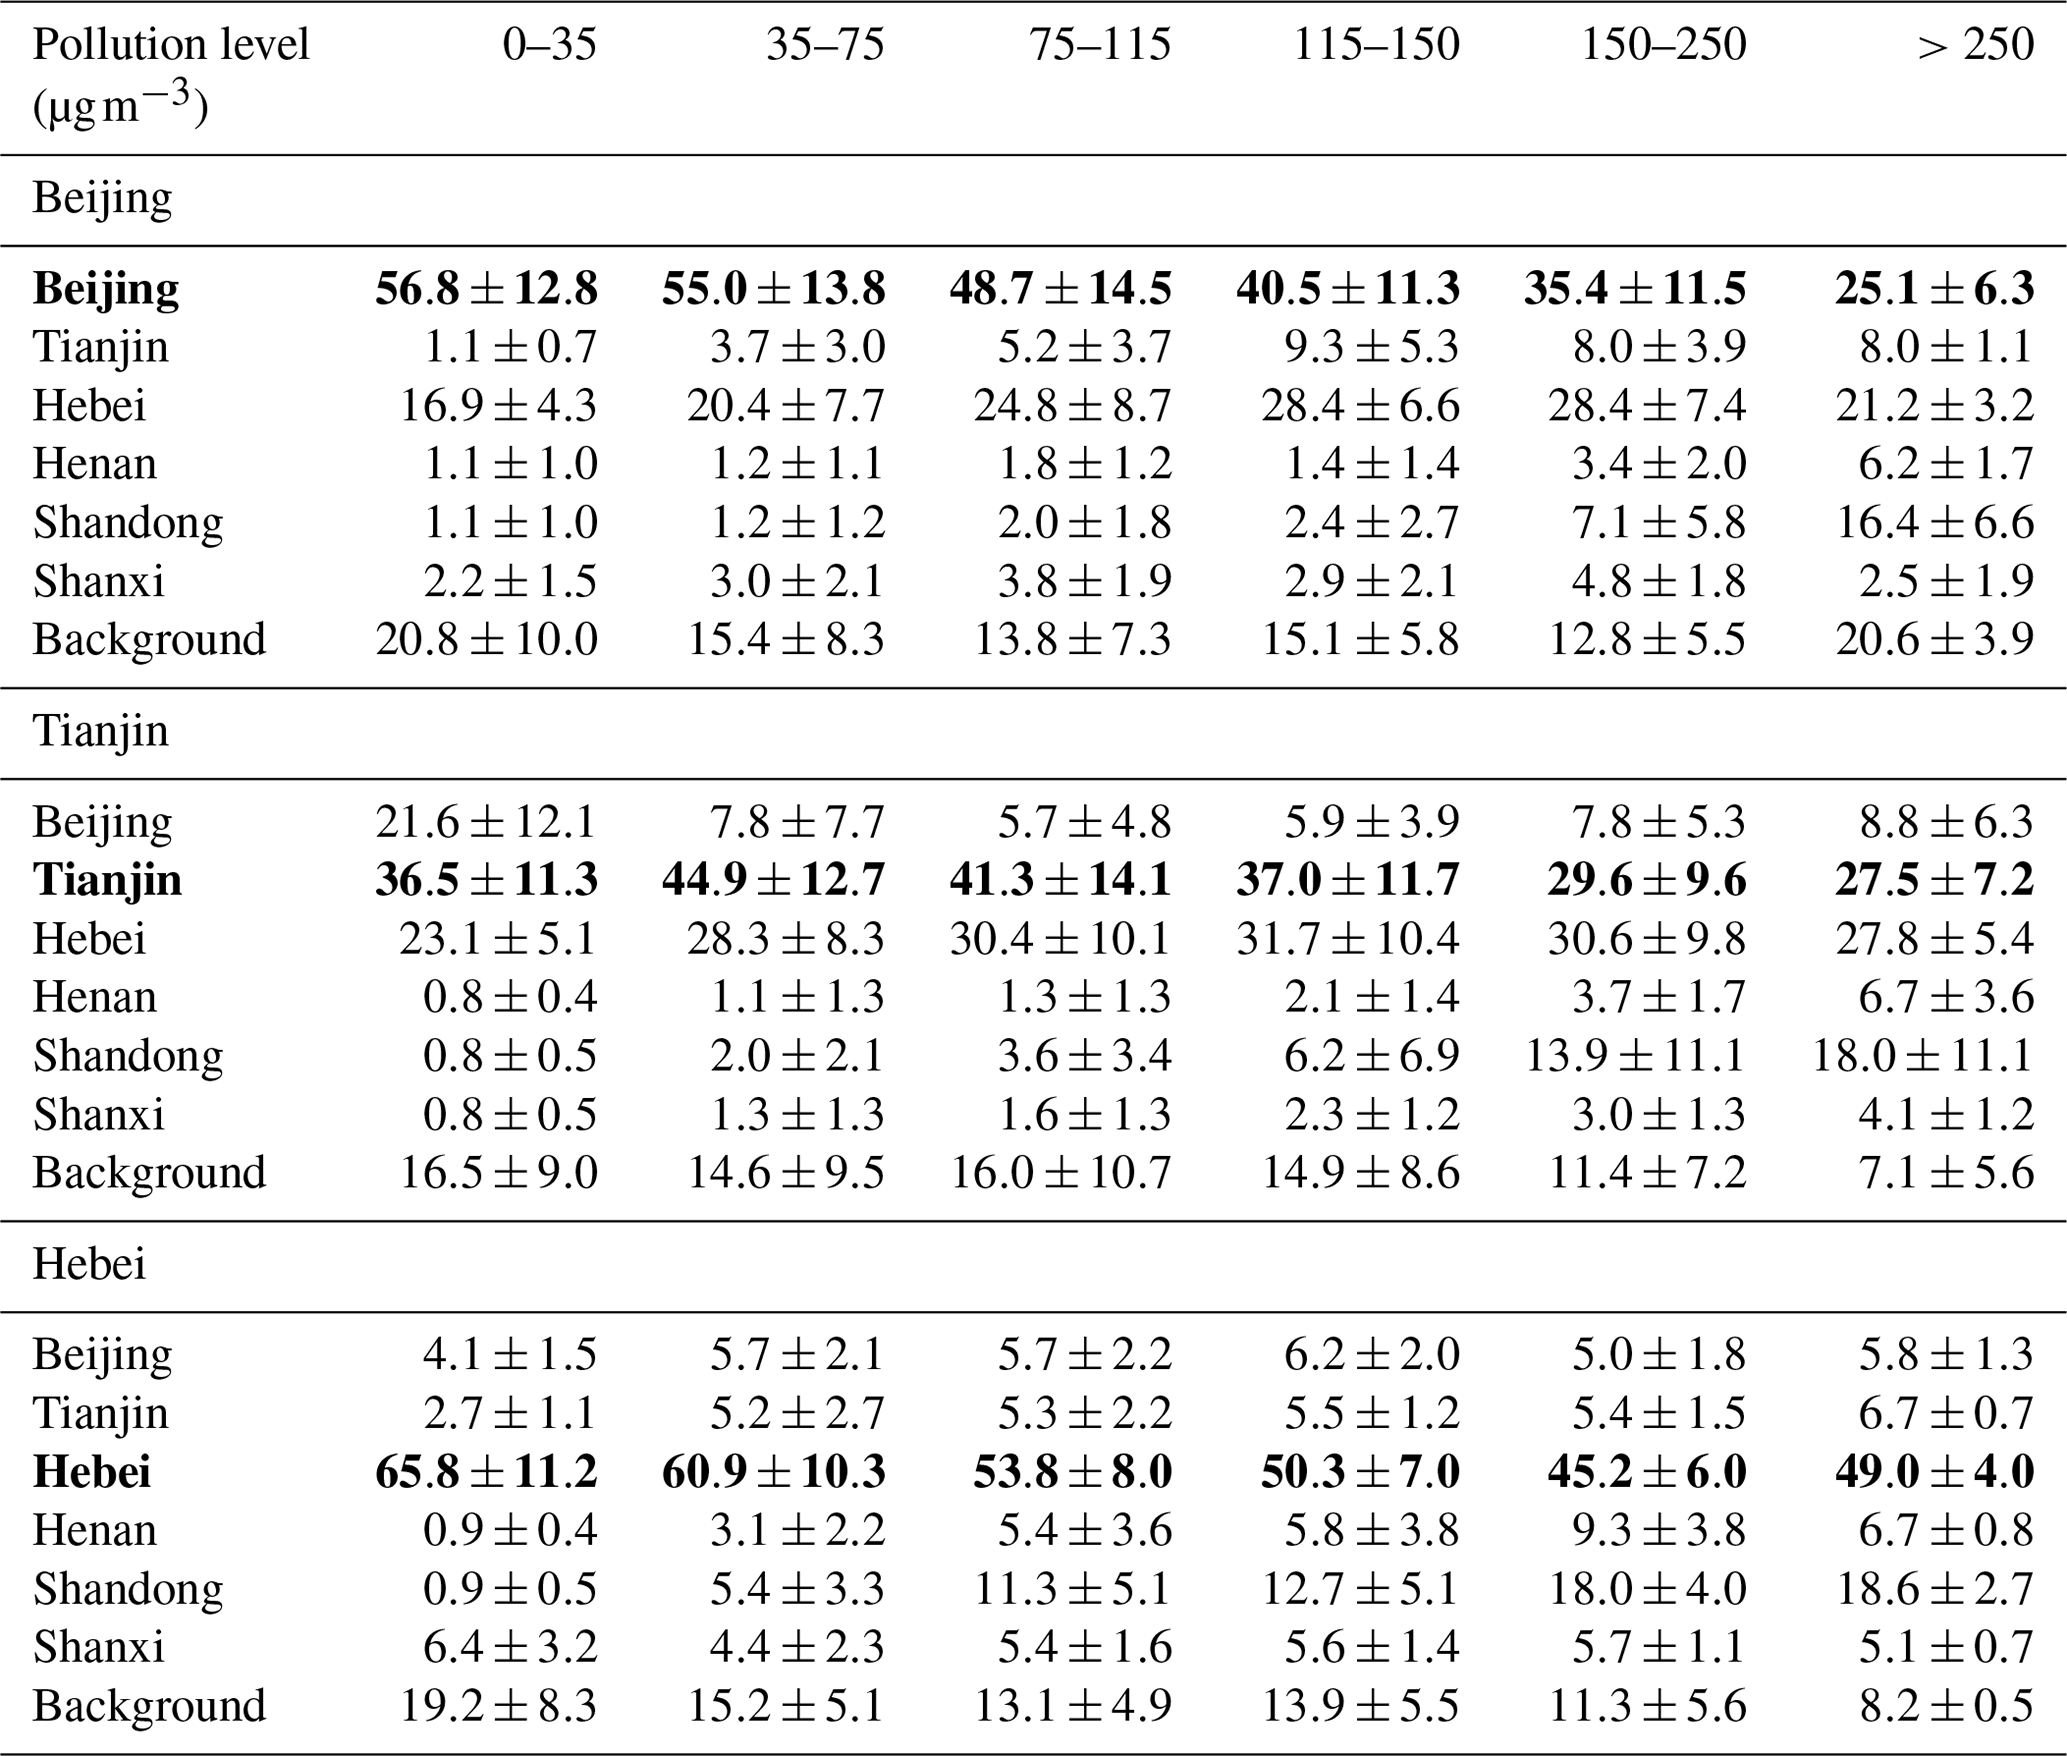
Table 3Same as Table 2 but for Henan, Shandong, and Shanxi. The bold font indicates the local contribution.
The air quality in Tianjin is dominated by the trans-boundary transport of air pollutants, with the nonlocal PM2.5 contribution generally higher than 55 %, which is higher than the average nonlocal contribution of 44 % reported by Meng et al. (2020). Particularly, the nonlocal PM2.5 contribution can be up to 70 % in Tianjin when the air quality is severely polluted. The PM2.5 contribution of local emissions decreases with the deterioration of the air quality in Tianjin, with average contributions of 44.9 %, 41.3 %, 37.0 %, and 29.6 %, respectively, when the air quality is good, slightly polluted, moderately polluted, and heavily polluted. The Hebei emissions play a significant role in the PM pollution in Tianjin, generally contributing more than 25 % of PM2.5 concentrations, except when the air quality is excellent. Meng et al. (2020) have emphasized the important contribution of Hebei emissions to PM2.5 concentrations in Tianjin. However, Meng et al. (2020) have suggested that the PM2.5 contribution of local emissions gradually increases with continuous deterioration of the PM pollution, which is different from that in this study. The PM2.5 contribution of the background source is between 11.4 % to 16.5 %, except when the air quality is severely polluted, with the contribution less than 10 %.
Hebei's air quality is obviously determined by local emissions when the air quality is excellent or good, with an average PM2.5 contribution of 65.8 % and 60.9 %, respectively. Additionally, the contribution of nonlocal emissions to the PM2.5 mass in Hebei is almost the same as that of local emissions, varying from 46.2 % to 54.8 % with PM2.5 concentrations exceeding 75 µg m−3. The PM2.5 contribution of emissions from Tianjin, Henan, and Shanxi is generally less than 10 % under different pollution levels. However, the Shandong emissions contribute more than 10 % of the PM2.5 mass in Hebei when the air quality becomes polluted. Obviously, with occurrence of severe PM pollution in BTH, the contribution of Shandong emissions to the PM2.5 mass in BTH becomes considerable, which has also been suggested by Chang et al. (2019). The PM2.5 contribution of the background source to Hebei decreases with deterioration of the air quality, ranging from 8.2 % to 19.2 % during the episode. Overall, in Hebei, local emissions generally dominate the PM2.5 level under different pollution levels, but nonlocal emissions play an increasingly important role in the deterioration of air quality, which is consistent with the findings of Wang et al. (2015, 2019).
The local and nonlocal emissions generally play an almost equivalent role in the air quality in Henan when severe PM pollution does not occur. However, when the air quality is severely polluted, the nonlocal emissions contribute about 62 % of the PM2.5 mass. The Shandong emissions generally contribute more PM2.5 mass than the other five provinces when the air quality is polluted, with the PM2.5 contribution exceeding 10 %. The background source accounts for more than 20 %, with the air quality being excellent or good. In Shandong, the local emissions dominate the air quality, generally contributing more than 60 % of the PM2.5 mass. The total PM2.5 contribution of emissions from Beijing, Tianjin, Hebei, Henan, and Shanxi is less than 30 %, and PM2.5 contributions of the background source range from 10 % to 15 % under different pollution levels. The air quality in Shanxi is mainly decided by local emissions, with PM2.5 contribution of 58.7 %, 57.8 %, 43.8 %, and 47.7 % when the air quality is excellent, good, slightly polluted, and moderately polluted, respectively. Hebei and Henan emissions contribute more than 10 % and 15 % of the PM2.5 mass in Shanxi, when the air quality is slightly and moderately polluted. The PM2.5 contribution of the background source is notable, generally exceeding 20 %.
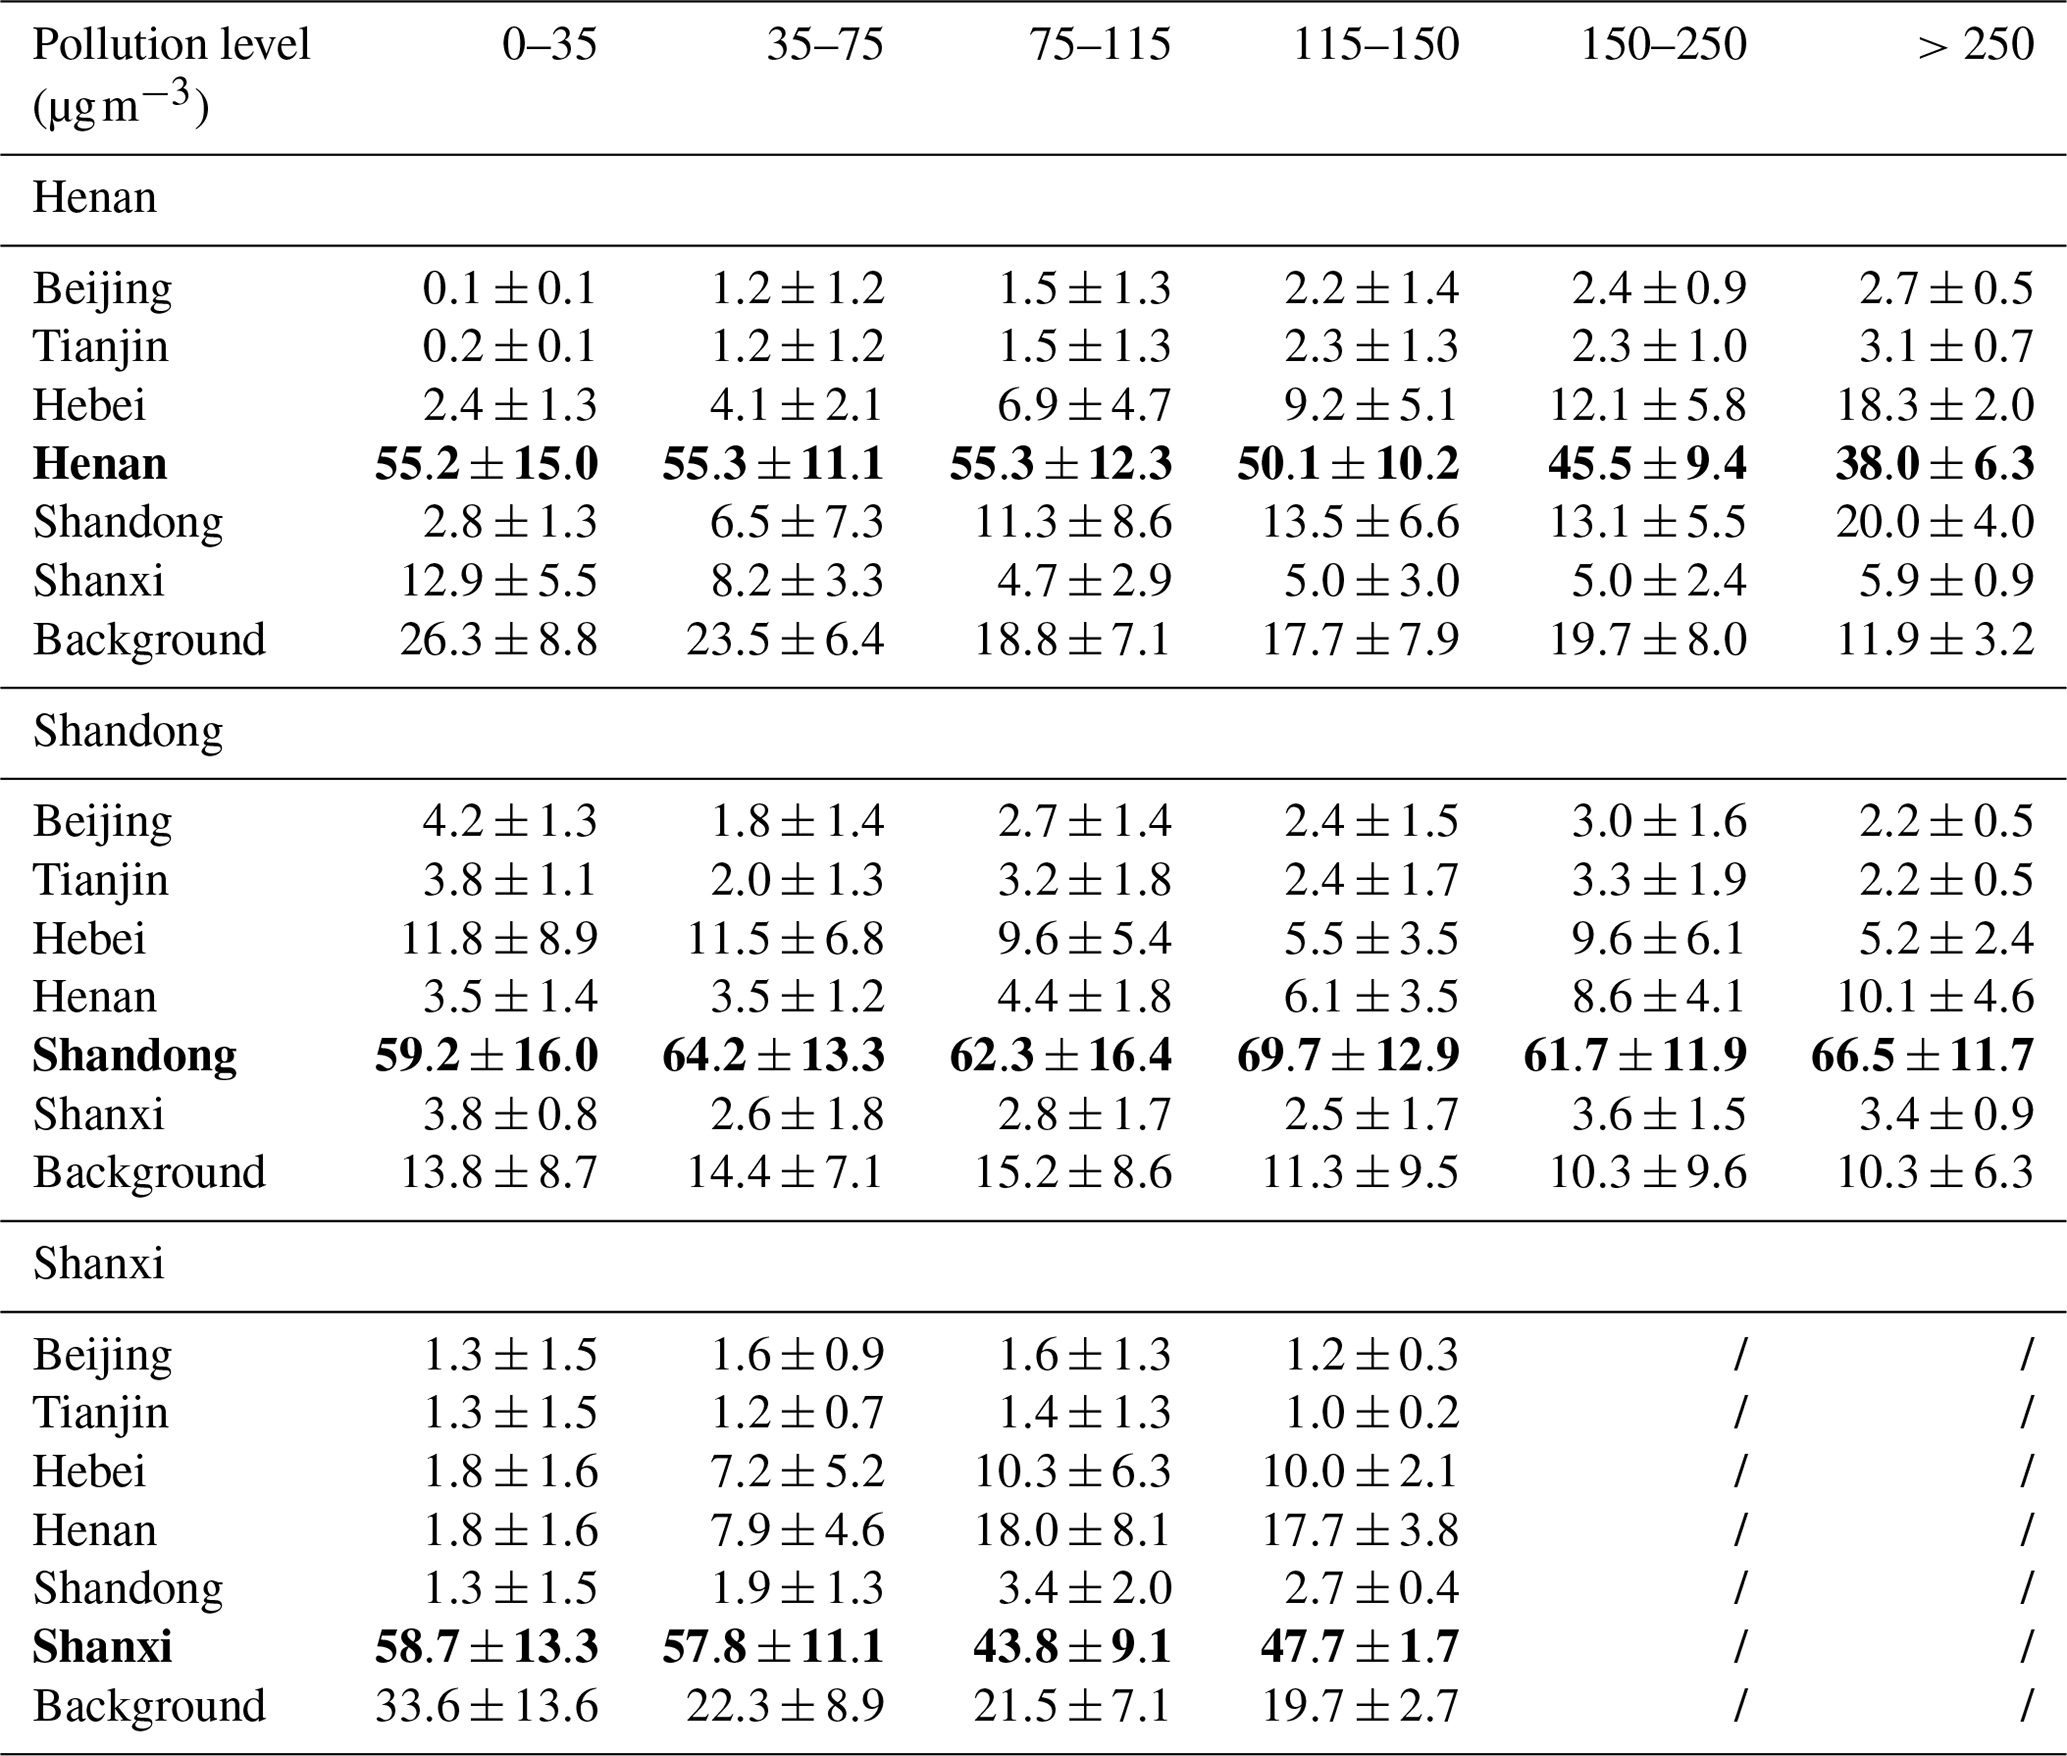
Figure 7Average aerosol constituent contributions (%) in (a) Beijing, (b) Tianjin, (c) Hebei, (d) Henan, (e) Shandong, and (f) Shanxi from local (red) and nonlocal (blue) emissions from 5 December 2015 to 4 January 2016. Uncertainty is denoted by the error bars.
Tables 4 and 5 and Fig. 7 further show the average contribution of local and nonlocal emissions to the aerosol species in Beijing, Tianjin, Hebei, Henan, Shandong, and Shanxi during the episode. Interestingly, local emissions dominate the elemental carbon (EC) and POA in Beijing, with a contribution of 61.1 % and 64.1 %. Hu et al. (2015) have also revealed that local emissions constitute the major source of POA in Beijing, particularly during wintertime. Additionally, local emissions also account for around 32 % of the SOA in Beijing, and the high organic aerosol contribution is likely caused by emissions of large numbers of vehicles in Beijing. Except for EC and POA, nonlocal emissions dominate the aerosol species concentration in Beijing, with contributions exceeding 60 %, especially sulfate and nitrate for which the contribution of nonlocal emissions is more than 90 % (Fig. 7). Ying et al. (2014) have shown that the inter-regional transport of air pollutants plays an important role in secondary aerosol formation during the polluted episode in China. Sun et al. (2016) have also demonstrated that secondary aerosol formed on a regional scale dominates the aerosol compositions during the haze episode, with an average of 67 %. Evidently, the impact of Hebei emissions on PM pollution in Beijing is the most significant, with the nitrate and ammonium contribution exceeding 40 % (Table 4). Except for EC and POA, contributions of the background source to the aerosol species in Beijing are generally more than 10 %. It is worth noting that the nitrate contribution of the background source is 32.1 %, which is caused by the slow oxidation of NO2 during wintertime.
Table 4Average aerosol constituent contributions (%) in Beijing, Tianjin, and Hebei from local sources, the other five provinces, and the background source from 5 December 2015 to 4 January 2016. The bold font indicates the local contribution.
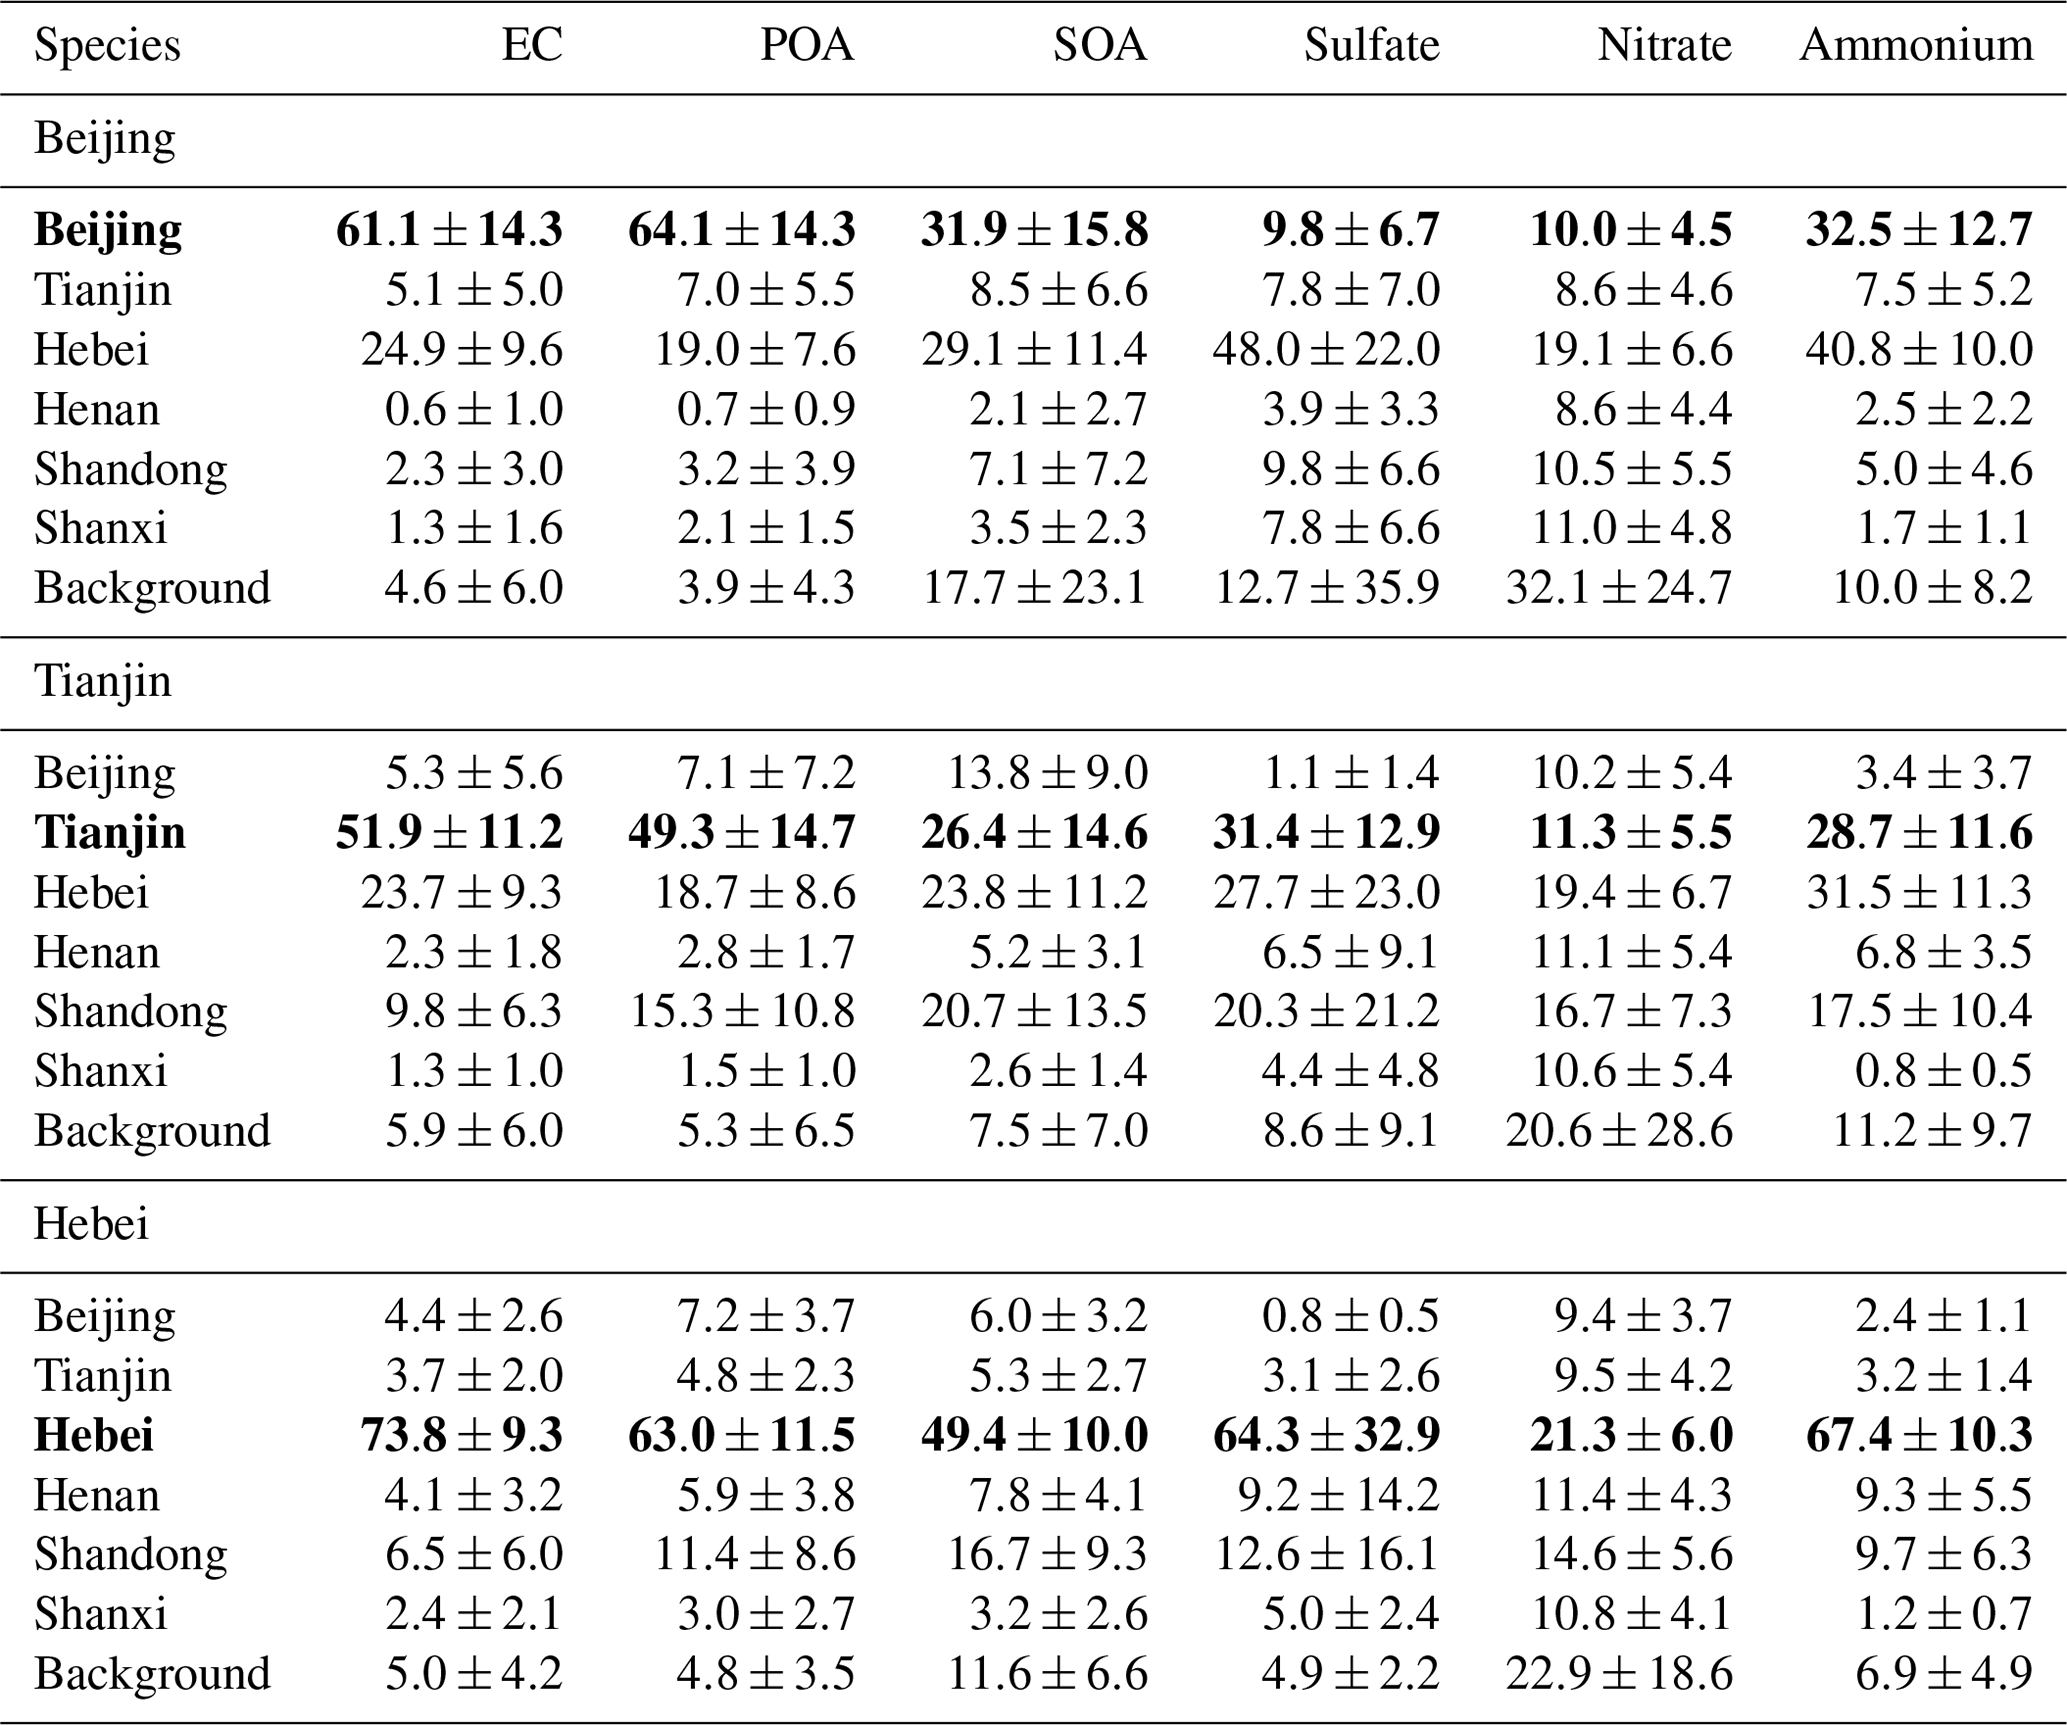
Table 5Same as Table 4 but for Henan, Shandong, and Shanxi. The bold font indicates the local contribution.
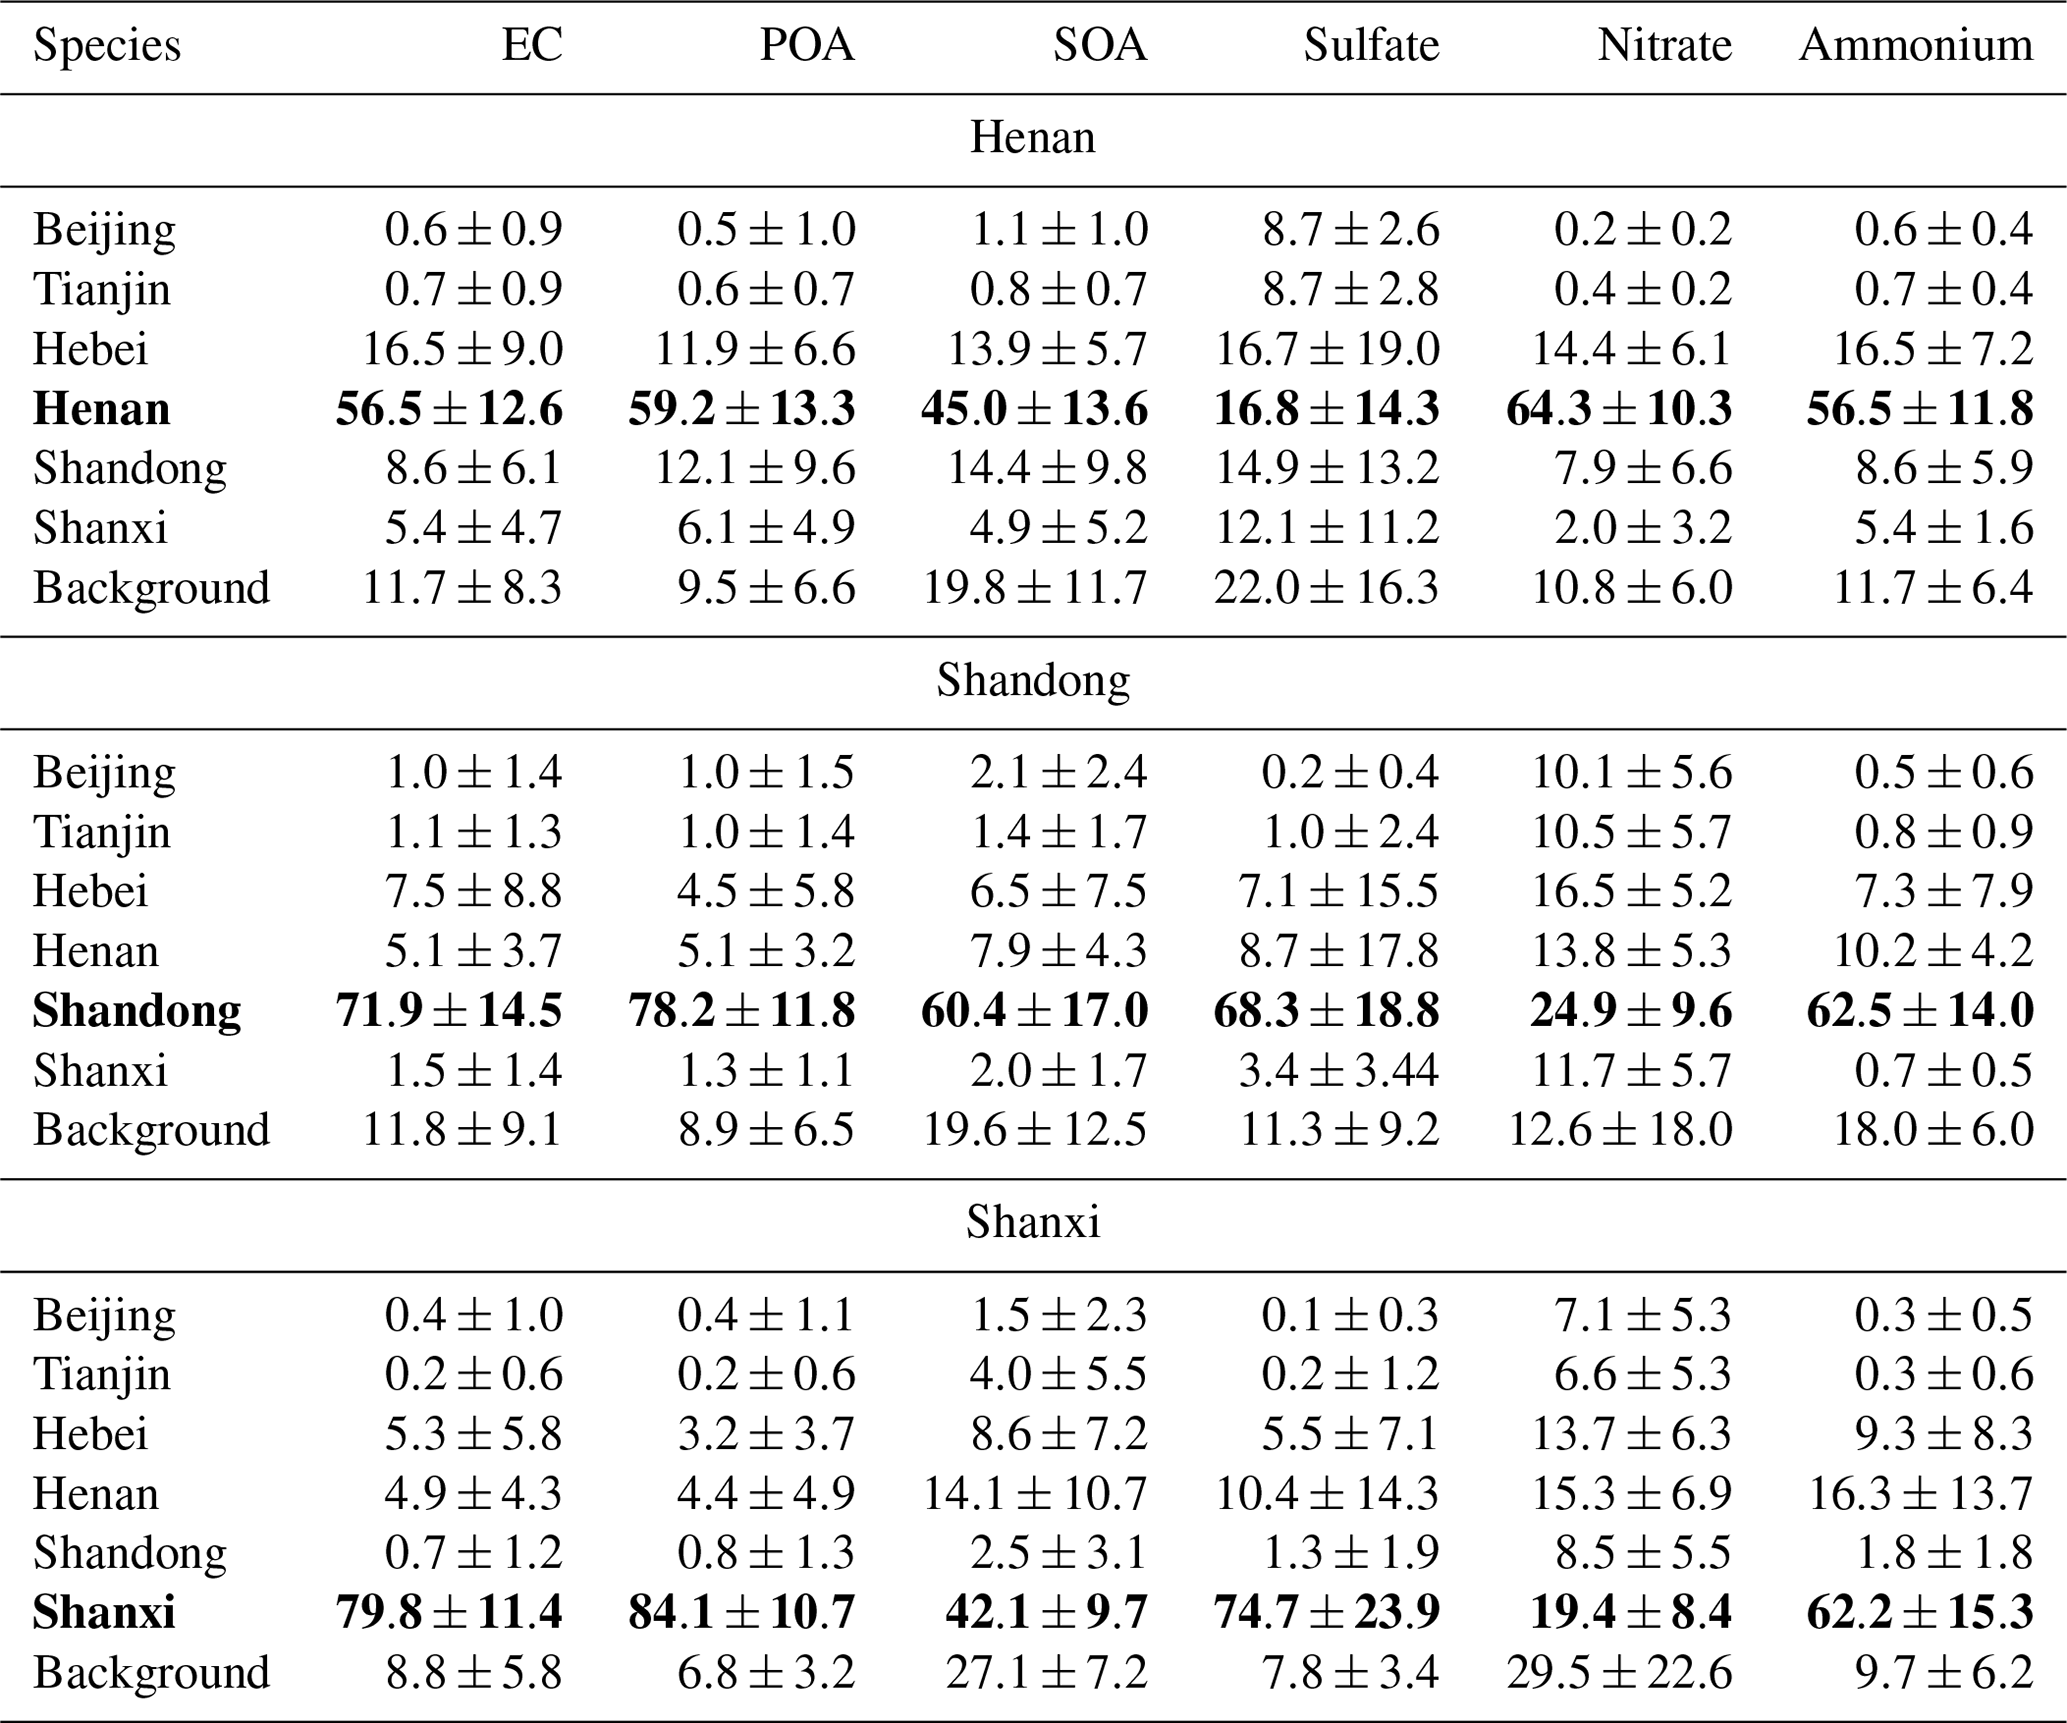
In Tianjin, the nonlocal emissions play a dominant role in concentrations SOA, sulfate, nitrate, and ammonium, with contributions of 73.6 %, 68.6 %, 88.7 %, and 71.3 %, and also account for 48.1 % and 50.7 % of the EC and POA mass, respectively. In general, Hebei emissions are the most important contributor of aerosol species in the nonlocal sources, followed by Shandong emissions. In Hebei, the local emissions determine the levels of EC, POA, sulfate, and ammonium, with contributions of 73.8 %, 63.0 %, 64.3 %, and 67.4 %, respectively. The SOA mass is mainly contributed by local (49.4 %) and Shandong (16.7 %) emissions and the background source (11.6 %). However, the nonlocal emissions dominate the nitrate mass in Hebei, with the contribution of 78.7 %, most of which is from Henan (11.4 %), Shandong (14.6 %), Shanxi (10.8 %), and the background source (22.9 %). Except for sulfate, the aerosol species in Henan are generally controlled by local emissions, with contributions varying from 45 % to 65 %. The sulfate contribution of nonlocal emissions is 83.2 %, mainly contributed by Hebei (16.7 %), Shandong (14.9 %), Shanxi (12.1 %), and background (22 %). Local emissions contribute about 60 %–80 % of the aerosol species mass in Shandong, except nitrate aerosols, which are dominated by nonlocal emissions, with a contribution of 75.1 %. More than 60 % of EC, POA, sulfate, and ammonium in Shanxi are formed from local emissions, but the nonlocal emissions are the dominant contributor to SOA and nitrate concentrations.
We have developed a source-oriented WRF-Chem model, treating the precursors of aerosols from different sources and their corresponding reaction products as different species and tracked independently in chemical, physical, and dynamic processes. The model is used to evaluate contributions of local and nonlocal emissions to the PM pollution in the NCP, including Beijing, Tianjin, Hebei, Henan, and Shandong, as well as the adjacent province in the west (Shanxi) during a persistent and severe haze episode from 5 December 2015 to 4 January 2016. The model exhibits good performance in predicting the temporal variation and spatial distribution of air pollutants in the NCP and also reasonably simulates the aerosol species compared to measurements in Beijing.
In this study, the source-oriented WRF-Chem model is also used to mark the precursors emitted from residential, transportation, industry, power, and agriculture sectors, respectively, to evaluate the contribution of anthropogenic emissions to the PM2.5 concentration in the NCP. The average contribution of residential emissions to the PM2.5 level is the most significant, with a maximum exceeding 100 µg m−3 during the study episode (Fig. S21). In addition, the contribution of industrial emissions to PM2.5 concentration in the NCP also varies from 10 from 100 µg m−3 during the study episode. Therefore, more attention should be paid to residential and industrial sectors to control the air pollution in a more cost-effective way. As two megacities in the NCP, Beijing and Tianjin have made great efforts to decrease local emissions of air pollutants since 2013, such as replacing residential coal use with gas and electricity, elevating vehicle emissions standards, and phasing out high-emitting industries (Zhang et al., 2019). However, heavy PM pollution events still occur in the two cities, which is mainly a result of the trans-boundary transport of air pollutants. Simulations of the source-oriented WRF-Chem model reveal that, on average, local and nonlocal emissions contribute 36.3 % and 63.7 % of the PM2.5 mass in Beijing during the episode. When the air quality is excellent or good in terms of hourly PM2.5 concentrations, local emissions contribute more than 50 % to the PM2.5 mass, dominating Beijing's air quality. However, with deterioration of Beijing's air quality from being slightly to severely polluted, the PM2.5 contribution of local emissions decreases from 48.7 % to 25.1 %, indicating the significant contribution of trans-boundary transport to the PM pollution in Beijing. The nonlocal emissions account for 67.3 % of the PM2.5 mass in Tianjin, and the contribution exceeds 70 % when the air quality is severely polluted. The PM2.5 concentrations in three industrialized provinces, Hebei, Shandong, and Henan in the NCP, are generally dominated by the local emissions under different pollution levels, particularly in Shandong, with the PM2.5 contribution of local emissions exceeding 60 %. The contribution of residential and industrial emissions to the PM2.5 concentration in Hebei, Shandong, and Henan is the most significant (Fig. S21). Therefore, efficient emission mitigation of air pollutants in the three provinces needs to be carried out continuously to lower PM levels. However, when severe PM pollution occurs, the PM2.5 contribution of local emissions in Hebei and Henan decreases considerably. The impact of Shanxi's emissions on PM2.5 concentrations in the NCP is generally not significant.
The primary aerosol species, such as EC and POA, are generally controlled by local emissions, with the average contribution ranging from about 50 % to 85 % in the six provinces. However, the SA of secondary aerosols shows large differences during the episode, with more evident regional characteristics. Local emissions contribute more than 60 % of the SOA mass in Shandong, 40 %–50 % in Hebei, Henan, and Shanxi, and around 30 % in Beijing and Tianjin. The sulfate contribution of local emissions is significant in Hebei, Shandong, and Shanxi, exceeding 60 %, but less than 10 % in Beijing. In Henan, local emissions do not play an important role in nitrate formation, with contributions less than 30 %, and most of the nitrate aerosols are produced during the trans-boundary transport of its precursors. Ammonium aerosols in Beijing and Tianjin are mainly determined by nonlocal emissions, with the contribution of around 70 %. Local emissions in the other four provinces account for around 60 % of the ammonium mass.
The developed source-oriented model is mainly used in this study to quantitatively evaluate the local and nonlocal contributions to the PM pollution in the NCP. A recent study (Huang et al., 2020) has demonstrated that absorption aerosols contributed by the cross-regional transport from the Yangtze River Delta (YRD) to the upper PBL in the NCP induce aerosol–PBL interaction and further lead to the suppressed PBL height, a notable reduction of temperature, and a substantial enhancement of relative humidity, favoring secondary aerosol production and aggravation of air pollution in the NCP. In this study, a sensitivity study without BC transported from the south of 32∘ N is conducted to analyze the contribution of the effect of cross-regional transport of air pollutants on local meteorological conditions during the selected simulated episode. The temperature and PBL height decreases in the NCP caused by the BC transported from the south are not significant, with a maximum of 0.04∘ and 1.6 %, and the increase of relative humidity just varies from −0.2 % to 0.1 % (Fig. S22). Therefore, the aerosol–PBL interaction induced by the trans-boundary transport of absorption aerosols can not be observed in this study. In the future, more typical air pollution episodes need to be simulated to quantify the impact of the regional transport of absorption aerosols on meteorological conditions.
In order to reduce PM pollution, cooperation to carry out strict emission mitigation measures is critical for all provinces, especially with regard to Beijing and Tianjin. In Beijing and Tianjin, reducing direct emissions of primary aerosols, such as EC and POA, is a priority, and more efforts need to be made to reduce local emissions of air pollutants in Hebei, Henan, Shandong, and Shanxi.
The real-time PM2.5, O3, NO2, SO2, and CO observations are publicly accessible at http://106.37.208.233:20035/ (last access: 24 November 2019) (China MEP, 2013a). One can also access the historic profile of observed ambient pollutants by visiting http://www.aqistudy.cn/ (last access: 24 November 2019) (China MEP, 2013b).
The supplement related to this article is available online at: https://doi.org/10.5194/acp-21-2229-2021-supplement.
GL, as the corresponding author, provided the ideas and financial support, developed the model code, verified the conclusions, and revised the paper. JW conducted research, designed the experiments, performed the simulation, processed the data, prepared the data visualization, and prepared the manuscript, with contributions from all authors. NB validated the model performance, analyzed the study data, and reviewed the manuscript. YW validated the model performance, verified the results, and provided the critical reviews. SL provided the data and primary data processing and reviewed the manuscript. XL, LL, RW, JY, TL, and MZ analyzed the initial simulation data, visualized the model results, and reviewed the paper. ZS, JC, and XT provided critical reviews in the pre-publication stage.
The authors declare that they have no conflict of interest.
We are deeply grateful to the editor and the anonymous reviewers for their constructive suggestions that helped to improve our paper.
This research has been supported by the Strategic Priority Research Program of the Chinese Academy of Sciences (grant no. XDB40030203), the National Key R&D Plan (Quantitative Relationship and Regulation Principle between Regional Oxidation Capacity of Atmospheric and Air Quality) (grant no. 2017YFC0210000), and the National Research Program for Key Issues in Air Pollution Control (grant no. DQGG0105).
This paper was edited by Xiaohong Liu and reviewed by three anonymous referees.
An, Z. S., Huang, R. J., Zhang, R. Y., Tie, X. X., Li, G. H., Cao, J. J., Zhou, W. J., Shi, Z. G., Han, Y. M., Gu, Z. L., and Ji, Y. M.: Severe haze in northern China: A synergy of anthropogenic emissions and atmospheric processes, P. Natl. Acad. Sci. USA, 116, 8657–8666, https://doi.org/10.1073/pnas.1900125116, 2019.
Bei, N., Wu, J., Elser, M., Feng, T., Cao, J., El-Haddad, I., Li, X., Huang, R., Li, Z., Long, X., Xing, L., Zhao, S., Tie, X., Prévôt, A. S. H., and Li, G.: Impacts of meteorological uncertainties on the haze formation in Beijing–Tianjin–Hebei (BTH) during wintertime: a case study, Atmos. Chem. Phys., 17, 14579–14591, https://doi.org/10.5194/acp-17-14579-2017, 2017.
Binkowski, F. S. and Roselle, S. J.: Models-3 community multiscale air quality (CMAQ) model aerosol component – 1. Model description, J. Geophys. Res.-Atmos., 108, 18, https://doi.org/10.1029/2001jd001409, 2003.
Burr, M. J. and Zhang, Y.: Source apportionment of fine particulate matter over the Eastern U.S. Part II: source apportionment simulations using CAMx/PSAT and comparisons with CMAQ source sensitivity simulations, Atmos. Pollut. Res., 2, 318–336, https://doi.org/10.5094/apr.2011.037, 2011.
Carter, W. P. L.: Development of the SAPRC-07 chemical mechanism, Atmos. Environ., 44, 5324–5335, https://doi.org/10.1016/j.atmosenv.2010.01.026, 2010.
Chang, X., Wang, S. X., Zhao, B., Xing, J., Liu, X. X., Wei, L., Song, Y., Wu, W. J., Cai, S. Y., Zheng, H. T., Ding, D., and Zheng, M.: Contributions of inter-city and regional transport to PM2.5 concentrations in the Beijing-Tianjin-Hebei region and its implications on regional joint air pollution control, Sci. Total Environ., 660, 1191–1200, https://doi.org/10.1016/j.scitotenv.2018.12.474, 2019.
Chen, F. and Dudhia, J.: Coupling an advanced land surface-hydrology model with the Penn State-NCAR MM5 modeling system. Part I: Model implementation and sensitivity, Mon. Weather Rev., 129, 569–585, https://doi.org/10.1175/1520-0493(2001)129<0569:caalsh>2.0.co;2, 2001.
China MEP (Ministry of Environmental Protection, China): Air Quality Observation Real-time Release Platform of MEP Data Center, available at: http://106.37.208.233:20035/ (last access: 24 November 2019), 2013a.
China MEP (Ministry of Environmental Protection, China): On-line Monitoring and Analysis Platform of China Air Quality, available at: http://www.aqistudy.cn/ (last access: 24 November 2019), 2013b.
Chou, M.-D. and Suarez M. J.: A solar radiation parameterization for atmospheric studies, Technical Report Series on Global Modeling and Data Assimilation, NASA/TM-1999-10460, 15, 52 pp., 1999.
Chou, M.-D., Suarez, M. J., Liang, X.-Z., and Yan, M. H.: A thermal infrared radiation parameterization for atmospheric studies, Technical Report Series on Global Modeling and Data Assimilation, NASA/TM-2001-104606, 19, 65 pp., 2001.
Cooper, J. A. and Watson, J. G.: Receptor oriented methods of air particulate source apportionment, J. Air. Pollut. Control. Assoc., 30, 1116–1125, https://doi.org/10.1080/00022470.1980.10465157, 1980.
Donahue, N. M., Robinson, A. L., Stanier, C. O., and Pandis, S. N.: Coupled partitioning, dilution, and chemical aging of semivolatile organics, Environ. Sci. Technol., 40, 2635–2643, https://doi.org/10.1021/es052297c, 2006.
Dong, Z., Wang, S., Xing, J., Chang, X., Ding, D., and Zheng, H.: Regional transport in Beijing-Tianjin-Hebei region and its changes during 2014–2017: The impacts of meteorology and emission reduction, Sci. Total Environ., 737, 139792, https://doi.org/10.1016/j.scitotenv.2020.139792, 2020.
Feng, T., Bei, N., Huang, R.-J., Cao, J., Zhang, Q., Zhou, W., Tie, X., Liu, S., Zhang, T., Su, X., Lei, W., Molina, L. T., and Li, G.: Summertime ozone formation in Xi'an and surrounding areas, China, Atmos. Chem. Phys., 16, 4323–4342, https://doi.org/10.5194/acp-16-4323-2016, 2016.
Foley, K. M., Roselle, S. J., Appel, K. W., Bhave, P. V., Pleim, J. E., Otte, T. L., Mathur, R., Sarwar, G., Young, J. O., Gilliam, R. C., Nolte, C. G., Kelly, J. T., Gilliland, A. B., and Bash, J. O.: Incremental testing of the Community Multiscale Air Quality (CMAQ) modeling system version 4.7, Geosci. Model Dev., 3, 205–226, https://doi.org/10.5194/gmd-3-205-2010, 2010.
Grell, G. A. and Devenyi, D.: A generalized approach to parameterizing convection combining ensemble and data assimilation techniques, Geophys. Res. Lett., 29, 4, https://doi.org/10.1029/2002gl015311, 2002.
Grell, G. A., Peckham, S. E., Schmitz, R., McKeen, S. A., Frost, G., Skamarock, W. C., and Eder, B.: Fully coupled “online” chemistry within the WRF model, Atmos. Environ., 39, 6957–6975, https://doi.org/10.1016/j.atmosenv.2005.04.027, 2005.
Guenther, A., Karl, T., Harley, P., Wiedinmyer, C., Palmer, P. I., and Geron, C.: Estimates of global terrestrial isoprene emissions using MEGAN (Model of Emissions of Gases and Aerosols from Nature), Atmos. Chem. Phys., 6, 3181–3210, https://doi.org/10.5194/acp-6-3181-2006, 2006.
Guo, S., Hu, M., Wang, Z. B., Slanina, J., and Zhao, Y. L.: Size-resolved aerosol water-soluble ionic compositions in the summer of Beijing: implication of regional secondary formation, Atmos. Chem. Phys., 10, 947–959, https://doi.org/10.5194/acp-10-947-2010, 2010.
Guo, S., Hu, M., Zamora, M. L., Peng, J. F., Shang, D. J., Zheng, J., Du, Z. F., Wu, Z., Shao, M., Zeng, L. M., Molina, M. J., and Zhang, R. Y.: Elucidating severe urban haze formation in China, P. Natl. Acad. Sci. USA, 111, 17373–17378, https://doi.org/10.1073/pnas.1419604111, 2014.
Huang, X., Ding, A., Wang, Z., Ding, K., and Fu, C.: Amplified transboundary transport of haze by aerosol–boundary layer interaction in China, Nat. Geosci., 13, 1–7, https://doi.org/10.1038/s41561-020-0583-4, 2020.
Hess, P. G., Flocke, S., Lamarque, J. F., Barth, M. C., and Madronich, S.: Episodic modeling of the chemical structure of the troposphere as revealed during the spring MLOPEX 2 intensive, J. Geophys. Res.-Atmos., 105, 26809–26839, https://doi.org/10.1029/2000jd900253, 2000.
Hong, S.-Y. and Lim, J.-O. J.: The WRF Single-Moment 6-Class Microphysics Scheme (WSM6), Asia-Pac. J. Atmos. Sci., 42, 129–151, 2006.
Horowitz, L. W., Walters, S., Mauzerall, D. L., Emmons, L. K., Rasch, P. J., Granier, C., Tie, X. X., Lamarque, J. F., Schultz, M. G., Tyndall, G. S., Orlando, J. J., and Brasseur, G. P.: A global simulation of tropospheric ozone and related tracers: Description and evaluation of MOZART, version 2, J. Geophys. Res.-Atmos., 108, 29, https://doi.org/10.1029/2002jd002853, 2003.
Hu, J. L., Wu, L., Zheng, B., Zhang, Q., He, K. B., Chang, Q., Li, X. H., Yang, F. M., Ying, Q., and Zhang, H. L.: Source contributions and regional transport of primary particulate matter in China, Environ. Pollut., 207, 31–42, https://doi.org/10.1016/j.envpol.2015.08.037, 2015.
Janjiæ, Z. I.: Nonsingular Implementation of the Mellor–Yamada Level 2.5 Scheme in the NCEP Meso Model, Ncep Office Note, 436, 2002.
Jiang, C., Wang, H., Zhao, T., Li, T., and Che, H.: Modeling study of PM2.5 pollutant transport across cities in China's Jing–Jin–Ji region during a severe haze episode in December 2013, Atmos. Chem. Phys., 15, 5803–5814, https://doi.org/10.5194/acp-15-5803-2015, 2015.
Lang, J. L., Cheng, S. Y., Li, J. B., Chen, D. S., Zhou, Y., Wei, X., Han, L. H., and Wang, H. Y.: A Monitoring and Modeling Study to Investigate Regional Transport and Characteristics of PM2.5 Pollution, Aerosol. Air Qual. Res., 13, 943–956, https://doi.org/10.4209/aaqr.2012.09.0242, 2013.
Li, G., Lei, W., Zavala, M., Volkamer, R., Dusanter, S., Stevens, P., and Molina, L. T.: Impacts of HONO sources on the photochemistry in Mexico City during the MCMA-2006/MILAGO Campaign, Atmos. Chem. Phys., 10, 6551–6567, https://doi.org/10.5194/acp-10-6551-2010, 2010.
Li, G., Bei, N., Tie, X., and Molina, L. T.: Aerosol effects on the photochemistry in Mexico City during MCMA-2006/MILAGRO campaign, Atmos. Chem. Phys., 11, 5169–5182, https://doi.org/10.5194/acp-11-5169-2011, 2011a.
Li, G., Zavala, M., Lei, W., Tsimpidi, A. P., Karydis, V. A., Pandis, S. N., Canagaratna, M. R., and Molina, L. T.: Simulations of organic aerosol concentrations in Mexico City using the WRF-CHEM model during the MCMA-2006/MILAGRO campaign, Atmos. Chem. Phys., 11, 3789–3809, https://doi.org/10.5194/acp-11-3789-2011, 2011b.
Li, G. H., Zhang, R. Y., Fan, J. W., and Tie, X. X.: Impacts of black carbon aerosol on photolysis and ozone, J. Geophys. Res.-Atmos., 110, 10, https://doi.org/10.1029/2005jd005898, 2005.
Li, G., Bei, N., Cao, J., Huang, R., Wu, J., Feng, T., Wang, Y., Liu, S., Zhang, Q., Tie, X., and Molina, L. T.: A possible pathway for rapid growth of sulfate during haze days in China, Atmos. Chem. Phys., 17, 3301–3316, https://doi.org/10.5194/acp-17-3301-2017, 2017.
Li, P. F., Yan, R. C., Yu, S. C., Wang, S., Liu, W. P., and Bao, H. M.: Reinstate regional transport of PM2.5 as a major cause of severe haze in Beijing, P. Natl. Acad. Sci. USA, 112, E2739–E2740, https://doi.org/10.1073/pnas.1502596112, 2015.
Li, X., Wu, J., Elser, M., Feng, T., Cao, J., El-Haddad, I., Huang, R., Tie, X., Prévôt, A. S. H., and Li, G.: Contributions of residential coal combustion to the air quality in Beijing–Tianjin–Hebei (BTH), China: a case study, Atmos. Chem. Phys., 18, 10675–10691, https://doi.org/10.5194/acp-18-10675-2018, 2018.
Lipsky, E. M. and Robinson, A. L.: Effects of dilution on fine particle mass and partitioning of semivolatile organics in diesel exhaust and wood smoke, Environ. Sci. Technol., 40, 155–162, https://doi.org/10.1021/es050319p, 2006.
Liu, L., Wang, L., Bai, Y., Yang, H., Lin, C., Kong, H., Ma, S., and Wang, J.: Simulation for the impacts of regional transport on winter particulate matter levels over Henan based on WRF/Chem model, Acta Sci. Circum., 37, 1843–1854, 2017.
Long, X., Tie, X., Cao, J., Huang, R., Feng, T., Li, N., Zhao, S., Tian, J., Li, G., and Zhang, Q.: Impact of crop field burning and mountains on heavy haze in the North China Plain: a case study, Atmos. Chem. Phys., 16, 9675–9691, https://doi.org/10.5194/acp-16-9675-2016, 2016.
Marmur, A., Unal, A., Mulholland, J. A., and Russell, A. G.: Optimization-based source apportionment of PM2.5 incorporating gas-to-particle ratios, Environ. Sci. Technol., 39, 3245–3254, https://doi.org/10.1021/es0490121, 2005.
Marmur, A., Park, S. K., Mulholland, J. A., Tolbert, P. E., and Russell, A. G.: Source apportionment of PM2.5 in the southeastern United States using receptor and emissions-based models: Conceptual differences and implications for time-series health studies, Atmos. Environ., 40, 2533–2551, https://doi.org/10.1016/j.atmosenv.2005.12.019, 2006.
Meng, L., Cai, Z., Li, Y., Hao, J., and Wang, X.: Spatial and Temporal Distributions and Source Simulation during Heavy Pollution of PM2.5 in Tianjin City, Res. Environ. Sci., 33, 9–17, 2020.
Nenes, A., Pandis, S. N., and Pilinis, C.: ISORROPIA: A new thermodynamic equilibrium model for multiphase multicomponent inorganic aerosols, Aquat. Geochem., 4, 123–152, https://doi.org/10.1023/a:1009604003981, 1998.
Odum, J. R., Hoffmann, T., Bowman, F., Collins, D., Flagan, R. C., and Seinfeld, J. H.: Gas/particle partitioning and secondary organic aerosol yields, Environ. Sci. Technol., 30, 2580–2585, https://doi.org/10.1021/es950943+, 1996.
Paatero, P. and Tapper, U.: Analysis of different modes of factor-analysis as least-squares fit problems, Chemometrics Intell. Lab. Syst., 18, 183–194, https://doi.org/10.1016/0169-7439(93)80055-m, 1993.
Pankow, J. F.: An absorption-model of the gas aerosol partitioning involved in the formation of secondary organic aerosol, Atmos. Environ., 28, 189–193, https://doi.org/10.1016/1352-2310(94)90094-9, 1994.
Robinson, A. L., Donahue, N. M., Shrivastava, M. K., Weitkamp, E. A., Sage, A. M., Grieshop, A. P., Lane, T. E., Pierce, J. R., and Pandis, S. N.: Rethinking organic aerosols: Semivolatile emissions and photochemical aging, Science, 315, 1259–1262, https://doi.org/10.1126/science.1133061, 2007.
Shrivastava, M. K., Lipsky, E. M., Stanier, C. O., and Robinson, A. L.: Modeling semivolatile organic aerosol mass emissions from combustion systems, Environ. Sci. Technol., 40, 2671–2677, https://doi.org/10.1021/es0522231, 2006.
Shrivastava, M. K., Lane, T. E., Donahue, N. M., Pandis, S. N., and Robinson, A. L.: Effects of gas particle partitioning and aging of primary emissions on urban and regional organic aerosol concentrations, J. Geophys. Res.-Atmos., 113, 16, https://doi.org/10.1029/2007jd009735, 2008.
Sun, Y. L., Chen, C., Zhang, Y. J., Xu, W. Q., Zhou, L. B., Cheng, X. L., Zheng, H. T., Ji, D. S., Li, J., Tang, X., Fu, P. Q., and Wang, Z. F.: Rapid formation and evolution of an extreme haze episode in Northern China during winter 2015, Sci. Rep., 6, 9, https://doi.org/10.1038/srep27151, 2016.
Tsimpidi, A. P., Karydis, V. A., Zavala, M., Lei, W., Molina, L., Ulbrich, I. M., Jimenez, J. L., and Pandis, S. N.: Evaluation of the volatility basis-set approach for the simulation of organic aerosol formation in the Mexico City metropolitan area, Atmos. Chem. Phys., 10, 525–546, https://doi.org/10.5194/acp-10-525-2010, 2010.
Volkamer, R., Martini, F. S., Molina, L. T., Salcedo, D., Jimenez, J. L., and Molina, M. J.: A missing sink for gas-phase glyoxal in Mexico City: Formation of secondary organic aerosol, Geophys. Res. Lett., 34, 5, https://doi.org/10.1029/2007gl030752, 2007.
Wagstrom, K. M., Pandis, S. N., Yarwood, G., Wilson, G. M., and Morris, R. E.: Development and application of a computationally efficient particulate matter apportionment algorithm in a three-dimensional chemical transport model, Atmos. Environ., 42, 5650–5659, https://doi.org/10.1016/j.atmosenv.2008.03.012, 2008.
Wang, L. T., Wei, Z., Wei, W., Fu, J. S., Meng, C. C., and Ma, S. M.: Source apportionment of PM2.5 in top polluted cities in Hebei, China using the CMAQ model, Atmos. Environ., 122, 723–736, https://doi.org/10.1016/j.atmosenv.2015.10.041, 2015.
Wang, Q., Luo, K., Fan, J. R., Gao, X., and Cen, K. F.: Spatial Distribution and Multiscale Transport Characteristics of PM2.5 in China, Aerosol Air Qual. Res., 19, 1993–2007, https://doi.org/10.4209/aaqr.2019.04.0202, 2019.
Wang, Z. S., Chien, C. J., and Tonnesen, G. S.: Development of a tagged species source apportionment algorithm to characterize three-dimensional transport and transformation of precursors and secondary pollutants, J. Geophys. Res.-Atmos., 114, 17, https://doi.org/10.1029/2008jd010846, 2009.
Wesely, M. L.: Parameterization of surface resistances to gaseous dry deposition in regional-scale numerical models, Atmos. Environ., 23, 1293–1304, 1989.
Wu, J. R., Li, G. H., Cao, J. J., Bei, N. F., Wang, Y. C., Feng, T., Huang, R. J., Liu, S. X., Zhang, Q., and Tie, X. X.: Contributions of trans-boundary transport to summertime air quality in Beijing, China, Atmos. Chem. Phys., 17, 2035–2051, https://doi.org/10.5194/acp-17-2035-2017, 2017.
Wu, J. R., Bei, N. F., Hu, B., Liu, S. X., Wang, Y., Shen, Z. X., Li, X., Liu, L., Wang, R. N., Liu, Z. R., Cao, J. J., Tie, X. X., Molina, L. T., and Li, G. H.: Aerosol-photolysis interaction reduces particulate matter during wintertime haze events, P. Natl. Acad. Sci. USA, 117, 9755–9761, https://doi.org/10.1073/pnas.1916775117, 2020.
Ying, Q. and Kleeman, M. J.: Source contributions to the regional distribution of secondary particulate matter in California, Atmos. Environ., 40, 736–752, https://doi.org/10.1016/j.atmosenv.2005.10.007, 2006.
Ying, Q., Lu, J., Allen, P., Livingstone, P., Kaduwela, A., and Kleeman, M.: Modeling air quality during the California Regional PM10PM2.5 Air Quality Study (CRPAQS) using the UCD/CIT source-oriented air quality model – Part I. Base case model results, Atmos. Environ., 42, 8954–8966, https://doi.org/10.1016/j.atmosenv.2008.05.064, 2008a.
Ying, Q., Lu, J., Kaduwela, A., and Kleeman, M.: Modeling air quality during the California Regional PM10PM2.5 Air Quality Study (CPRAQS) using the UCD/CIT Source Oriented Air Quality Model – Part II. Regional source apportionment of primary airborne particulate matter, Atmos. Environ., 42, 8967–8978, https://doi.org/10.1016/j.atmosenv.2008.05.065, 2008b.
Ying, Q., Wu, L., and Zhang, H. L.: Local and inter-regional contributions to PM2.5 nitrate and sulfate in China, Atmos. Environ., 94, 582–592, https://doi.org/10.1016/j.atmosenv.2014.05.078, 2014.
Zamora, M. L., Peng, J., Hu, M., Guo, S., Marrero-Ortiz, W., Shang, D., Zheng, J., Du, Z., Wu, Z., and Zhang, R.: Wintertime aerosol properties in Beijing, Atmos. Chem. Phys., 19, 14329–14338, https://doi.org/10.5194/acp-19-14329-2019, 2019.
Zhang, H., DeNero, S. P., Joe, D. K., Lee, H.-H., Chen, S.-H., Michalakes, J., and Kleeman, M. J.: Development of a source oriented version of the WRF/Chem model and its application to the California regional PM10/PM2.5 air quality study, Atmos. Chem. Phys., 14, 485–503, https://doi.org/10.5194/acp-14-485-2014, 2014.
Zhang, H. L. and Ying, Q.: Source apportionment of airborne particulate matter in Southeast Texas using a source-oriented 3D air quality model, Atmos. Environ., 44, 3547–3557, https://doi.org/10.1016/j.atmosenv.2010.06.004, 2010.
Zhang, H. L. and Ying, Q.: Secondary organic aerosol formation and source apportionment in Southeast Texas, Atmos. Environ., 45, 3217–3227, https://doi.org/10.1016/j.atmosenv.2011.03.046, 2011.
Zhang, Q., Streets, D. G., Carmichael, G. R., He, K. B., Huo, H., Kannari, A., Klimont, Z., Park, I. S., Reddy, S., Fu, J. S., Chen, D., Duan, L., Lei, Y., Wang, L. T., and Yao, Z. L.: Asian emissions in 2006 for the NASA INTEX-B mission, Atmos. Chem. Phys., 9, 5131–5153, https://doi.org/10.5194/acp-9-5131-2009, 2009.
Zhang, Q., Zheng, Y. X., Tong, D., Shao, M., Wang, S. X., Zhang, Y. H., Xu, X. D., Wang, J. N., He, H., Liu, W. Q., Ding, Y. H., Lei, Y., Li, J. H., Wang, Z. F., Zhang, X. Y., Wang, Y. S., Cheng, J., Liu, Y., Shi, Q. R., Yan, L., Geng, G. N., Hong, C. P., Li, M., Liu, F., Zheng, B., Cao, J. J., Ding, A. J., Gao, J., Fu, Q. Y., Huo, J. T., Liu, B. X., Liu, Z. R., Yang, F. M., He, K. B., and Hao, J. M.: Drivers of improved PM2.5 air quality in China from 2013 to 2017, P. Natl. Acad. Sci. USA, 116, 24463–24469, https://doi.org/10.1073/pnas.1907956116, 2019.
Zhang, R. Y., Guo, S., Zamora, M. L., and Hu, M.: Reply to Li et al.: Insufficient evidence for the contribution of regional transport to severe haze formation in Beijing, P. Natl. Acad. Sci. USA, 112, E2741–E2741, https://doi.org/10.1073/pnas.1503855112, 2015.
Zheng, B., Tong, D., Li, M., Liu, F., Hong, C., Geng, G., Li, H., Li, X., Peng, L., Qi, J., Yan, L., Zhang, Y., Zhao, H., Zheng, Y., He, K., and Zhang, Q.: Trends in China's anthropogenic emissions since 2010 as the consequence of clean air actions, Atmos. Chem. Phys., 18, 14095–14111, https://doi.org/10.5194/acp-18-14095-2018, 2018.
Zhao, J., Levitt, N. P., Zhang, R. Y., and Chen, J. M.: Heterogeneous reactions of methylglyoxal in acidic media: Implications for secondary organic aerosol formation, Environ. Sci. Technol., 40, 7682–7687, https://doi.org/10.1021/es060610k, 2006.