the Creative Commons Attribution 4.0 License.
the Creative Commons Attribution 4.0 License.
 | 30 Nov 2021
Exploring the uncertainties in the aviation soot–cirrus effect
Johannes Hendricks
Christof Gerhard Beer
A global aerosol–climate model, including a two-moment cloud microphysical scheme and a parametrization for aerosol-induced ice formation in cirrus clouds, is applied in order to quantify the impact of aviation soot on natural cirrus clouds. Several sensitivity experiments are performed to assess the uncertainties in this effect related to (i) the assumptions on the ice nucleation abilities of aviation soot, (ii) the representation of vertical updrafts in the model, and (iii) the use of reanalysis data to relax the model dynamics (the so-called nudging technique). Based on the results of the model simulations, a radiative forcing from the aviation soot–cirrus effect in the range of −35 to 13 mW m−2 is quantified, depending on the assumed critical saturation ratio for ice nucleation and active fraction of aviation soot but with a confidence level below 95 % in several cases. Simple idealized experiments with prescribed vertical velocities further show that the uncertainties on this aspect of the model dynamics are critical for the investigated effect and could potentially add a factor of about 2 of further uncertainty to the model estimates of the resulting radiative forcing. The use of the nudging technique to relax model dynamics is proved essential in order to identify a statistically significant signal from the model internal variability, while simulations performed in free-running mode and with prescribed sea-surface temperatures and sea-ice concentrations are shown to be unable to provide robust estimates of the investigated effect. A comparison with analogous model studies on the aviation soot–cirrus effect show a very large model diversity, with a conspicuous lack of consensus across the various estimates, which points to the need for more in-depth analyses on the roots of such discrepancies.
- Article
(7381 KB) - Full-text XML
-
Supplement
(13619 KB) - BibTeX
- EndNote


The aviation sector contributes about 2.4 % of the global anthropogenic CO2 and is one of the fastest growing anthropogenic sectors, which makes it one of the key targets for mitigating the anthropogenic impact on climate (Lee et al., 2010; Grewe et al., 2017; Lee et al., 2021). In the last decades, civil aviation has experienced a steady growth in activity, resulting in increasing CO2 emissions at an average rate of 2 % yr−1 between 1970 and 2012, further accelerating in recent years (2013–2018) to a rate of 5 % yr−1 (Lee et al., 2021). Most of the Shared Socioeconomic Pathways (SSPs; Riahi et al., 2017), developed in the context of the assessments by the Intergovernmental Panel for Climate Change (IPCC), project this growth in aviation emissions to continue until at least 2040 (Gidden et al., 2019), although the unexpected worldwide outbreak of the SARS-CoV-2 pandemic in the early months of 2020 temporarily reduced such an increase (e.g. Forster et al., 2020; Gettelman et al., 2021).
In addition to the well-understood impact of CO2 and the related mitigation measures (Fuglestvedt et al., 2008; Dahlmann et al., 2016), aircraft also emit a number of non-CO2 components, whose climate impact is still uncertain (Grewe et al., 2017). This concerns, for instance, the role of nitrogen oxides (), which control ozone formation and affect methane lifetime (Grewe et al., 2019), aerosol particles, and their interactions with clouds (e.g. Gettelman and Chen, 2013; Righi et al., 2013; Penner et al., 2018), as well as the formation and growth of contrails and contrail cirrus (Burkhardt and Kärcher, 2011; Chen and Gettelman, 2013; Bock and Burkhardt, 2016).
Among these various aviation effects, the impact of aviation soot on natural cirrus clouds has gained attention in recent years due to its potentially large climate impact, possibly exceeding the contribution of most of the aforementioned components, including CO2 (Hendricks et al., 2005; Penner et al., 2018). Cirrus clouds cover about 30 % of the globe and have an overall warming impact on the Earth radiative balance, as on average their longwave warming effect dominates over shortwave cooling (Hartmann et al., 1992; Hong et al., 2016; Chen et al., 2000; Gasparini and Lohmann, 2016; Heymsfield et al., 2017). The aerosol-induced formation of ice crystals (ICs) in cirrus clouds can occur either via homogeneous freezing of supercooled liquid solution aerosols or via heterogeneous freezing on the surface of a so-called ice-nucleating particle (INP; Vali et al., 2015). During the formation of cirrus clouds, both mechanisms can occur, and their competition for the available supersaturated water vapour has crucial effects on the microphysical structure of these clouds, since it controls the number concentration and the size of ICs and hence their optical and radiative properties (Kärcher, 2017). Several aerosol types have been shown to act as INPs at cirrus temperatures, including mineral dust and soot (Möhler et al., 2005; Hoose and Möhler, 2012; Cziczo et al., 2013; Kanji et al., 2017). Since aircraft soot emissions are directly released at cirrus altitudes (i.e. above ∼400 hPa), several studies focused on their impact on cirrus properties and the resulting climate effect (Hendricks et al., 2005, 2011; Liu et al., 2009; Penner et al., 2009; Gettelman and Chen, 2013; Zhou and Penner, 2014; Kärcher, 2017; Penner et al., 2018; Zhu and Penner, 2020; McGraw et al., 2020).
Nevertheless, the above-mentioned studies have indicated very large uncertainties on the magnitude, and even on the sign, of the impact of aviation soot on the radiative forcing (RF) exerted by natural cirrus. Part of these uncertainties derives from the assumptions on the still poorly understood ice-nucleating properties of aviation soot. This concerns in particular the critical saturation ratio (Scrit) at which soot can initiate freezing and the active fraction (fact) of the soot particle population that can act as INPs. Applying a global aerosol model coupled with a two-moment ice microphysical scheme (CAM3-IMPACT), Liu et al. (2009) estimated an aviation soot effect of −110 mW m−2, assuming a critical ice saturation ratio for soot nucleation Scrit=1.2–1.3 but a positive RF of 260 mW m−2 if soot is considered to be a worse INP with Scrit=1.4. In both cases, a very high active fraction fact=100 % was assumed for aviation soot. Using the same model, Penner et al. (2009) applied two different ice nucleation parametrizations (Kärcher and Lohmann, 2002; Liu and Penner, 2005) and quantified an aviation soot–cirrus RF of −161 and −124 mW m−2. In the first case, they assumed Scrit=1.3 for soot, while in the latter the occurrence of heterogeneous freezing on soot particles was determined as a function of temperature. In both cases, the whole soot population was assumed to act as INPs (i.e. fact=100 %). Using the ECHAM4 model and the Kärcher et al. (2006) parametrization for ice nucleation which is also applied in the present study, Hendricks et al. (2011) found no statistically significant climate effect when assuming that 10 % of aviation soot acts as INPs, with Scrit=1.2. No statistically significant effects were also reported by Gettelman and Chen (2013), who applied the CAM5 model with the assumption that soot has similar ice-nucleating properties as mineral dust (i.e. Scrit=1.2–1.3) but with lower (and presumably more realistic) active fractions. Zhou and Penner (2014) again used the CAM5 model with the Liu and Penner (2005) ice nucleation parametrization but provided an explicit calculation of the soot active fraction by considering its preprocessing in contrail cirrus. This resulted in 0.6 % of aviation soot being an efficient INP, leading to a RF quantified in the range of −350 to 90 mW m−2, depending on the assumptions on the background sulfate and dust concentrations, both competing with soot for the formation of ICs in cirrus clouds. Using the same model with the Kärcher et al. (2006) parametrization for ice nucleation and an improved scheme for subgrid-scale vertical updrafts, Penner et al. (2018) simulated an aircraft effect on cirrus clouds of −200 mW m−2, considering Scrit=1.35 and again fact=0.6 % as a result of soot preprocessing in contrails. A subsequent study, using the Community Earth System Model (CESM) featuring a hybrid ice nucleation scheme combining the best features of the Liu and Penner (2005) and Kärcher et al. (2006) parametrizations, updated this estimate to −140 mW m−2, also assuming Scrit=1.35 (Zhu and Penner, 2020). In the most recent work on this subject, McGraw et al. (2020) used the CESM2 with the cirrus nucleation scheme by Barahona and Nenes (2009) and found that aircraft soot can perturb cirrus clouds in the Northern Hemisphere, with effects both in the shortwave and in the longwave RF, but they were not able to extract a statistically significant signal from their model simulations.
This brief literature review shows that the existing quantifications of the aviation soot–cirrus effect obtained with different model approaches lead to very different results, ranging from statistically non-significant effects to potentially large RF values. The reason for this lack of consensus lies in the high complexity of the physical processes controlling this effect, which are hard to constrain by measurements and difficult to represent in global models (Kärcher, 2017). A few studies (Koehler et al., 2009; Mahrt et al., 2020) have shown that soot particles released by the combustion process in aircraft turbines could act as INPs at various ranges of atmospheric temperatures and ice supersaturations, but measurements are still limited. To further complicate this picture, ice formation in the cirrus regime is also crucially driven by atmospheric dynamics and depends on the occurrence of vertical updrafts and on their strength (Kärcher and Podglajen, 2019; Kärcher et al., 2019). In spite of recent progress on the modelling side (Podglajen et al., 2016), the representation of vertical updrafts in global models is still subject to considerable approximations and does not capture small-scale variability in sufficient detail.
In this work, we apply the EMAC model (ECHAM/MESSy Atmospheric Chemistry; Jöckel et al., 2010) with the aerosol submodel MADE3 (Modal Aerosol Dynamics for Europe, adapted for global applications, third generation; Kaiser et al., 2014, 2019) in a recently developed configuration (Righi et al., 2020) which includes a detailed parametrization for aerosol-induced ice formation in cirrus clouds (Kärcher et al., 2006; Kuebbeler et al., 2014). Rather than attempting to provide a single estimate of the aviation soot–cirrus effect, the goal of this study is to explore the uncertainties related to the microphysical and dynamic aspects of this effect, in order to provide a realistic, albeit broad, range of possible values for the resulting climate impact. The microphysical analysis focuses on the ice-nucleating properties of aviation soot, based on the results of the laboratory measurements reported in the literature. We show that the variation in both the critical saturation ratio Scrit for ice nucleation and the active fraction fact of aviation soot can have a significant impact not only on the magnitude, but also on the sign of the resulting RF. We attempt to relate these changes to the underlying physical processes as represented in the model. Furthermore, we analyse the role of the model's representation of vertical updraft by means of mechanistic studies in which a very simple representation of such updraft is implemented in order to explore the sensitivity of the relevant microphysics to the model dynamics. This parametric approach has proven useful in a previous climate impact study (Righi et al., 2013), where we analysed the uncertainties related to the assumptions on the size distribution of aerosol particles from different transport emission sources, including aviation. On a more general level, such parametric approaches were successfully used, for instance, to constrain the uncertainties on the microphysical properties of warm clouds (Lee et al., 2013) and on the aerosol indirect effect (Carslaw et al., 2013; Regayre et al., 2020).
This paper is organized as follows: in Sect. 2 the processes controlling the aviation soot–cirrus effect and its large uncertainties are discussed, and the results of available laboratory studies are summarized. The model setup, which is largely based on Righi et al. (2020) but has been further improved here, and the performed numerical experiments are described in Sect. 3. The results are presented and discussed in Sect. 4, and we summarize the main outcomes of this study in Sect. 5.
As mentioned in the introduction, aerosol-induced ice formation in the cirrus regime (C) can occur either via homogeneous freezing or by heterogeneous freezing on the surface of an INP. The latter process usually requires a lower critical supersaturation over ice and can therefore occur prior to the onset of homogeneous freezing, attenuating or even inhibiting the direct freezing of supercooled liquid solution aerosol. This has of course important consequences on the microphysical properties of cirrus, since it affects the number concentrations and size of ICs and, in turn, the lifetime and the radiative properties of the clouds. Cirrus clouds generally exert large RFs, both in the shortwave and in the longwave spectrum, with the latter being slightly larger, which results in an overall warming effect (Hartmann et al., 1992; Hong et al., 2016; Chen et al., 2000; Gasparini and Lohmann, 2016). If a cirrus cloud is dominated by homogeneous freezing, adding more INPs typically results in a decrease of IC number concentration (ICNC) and a corresponding increase in their size (the so-called negative Twomey effect; Kärcher and Lohmann, 2003). Adding INPs to a cirrus cloud where heterogeneous freezing already dominates, on the other hand, could result in a further increase of ICNC and a decrease in crystal sizes. As shown by previous studies (e.g. Zhang et al., 1999), an increasing IC size reduces the longwave cloud forcing (i.e. less warming) but also the shortwave cloud forcing in absolute terms (i.e. less cooling), and their combination can be either a net warming or a net cooling depending on the cloud ice water content. Other effects, such as a more efficient sedimentation of less abundant, larger ICs or an increased deposition of water vapour in the presence of more efficient INPs (dehydration; Jensen et al., 2001, 2013), add even more complexity to this picture and to the interpretation of the model results. For a reliable quantification of the effect of aviation soot on cirrus clouds and its climate impact, it is therefore essential not only to have a reliable estimate of the ice-nucleating properties of aviation soot, but also of the dynamic processes that control the background state of natural cirrus clouds in the model. Cirrus formed in slow (fast) updrafts are usually dominated by heterogeneous (homogeneous) nucleation, resulting in lower (higher) concentrations of ICs and larger (smaller) IC sizes (Kärcher and Lohmann, 2002; Krämer et al., 2016, 2020). Hence, the way aviation soot INPs can impact these clouds depends not only on their ice nucleation ability, but also on the dynamical background conditions. In the present study we therefore focus on both the microphysical and the dynamic aspects, by analysing the uncertainties related to the assumptions on aviation soot INP characteristics and exploring the impact of different (simplified) representations of the dynamic forcing in the model. We stress again that the main goal of this study is not to provide an updated estimate on the aviation soot–cirrus effect but to explore its sensitivity to aviation soot microphysics and, to some extent, to the underlying model dynamics.
Figure 1 summarizes the ice-nucleating properties of different soot types retrieved from the literature, including cloud-processed soot. These properties are given in terms of ice saturation ratio Sice and active fraction fact and are compared with the assumptions made in the modelling studies on the aviation soot–cirrus effect reviewed in the Introduction. Note that models usually assume a critical ice saturation ratio Scrit at which ice nucleation takes place, while in the laboratory measurement a wide spectrum of Sice values is explored. Furthermore, the experimental results show a clear temperature dependence of the soot ice-nucleating properties, which most of the model parametrizations do not take into account (an exception here is the Liu and Penner (2005) parametrization). The measurements mostly report medium to low ice nucleation efficiency by different soot types (Sice≳1.3) and activation fractions hardly above 10 %. The modelling studies, on the other hand, tend to represent soot as a better INP, especially in terms of critical supersaturation ratio. Recent laboratories studies (Marcolli, 2017; Mahrt et al., 2020) support indeed higher ice nucleation efficiency for soot particles which experienced cloud processing, for example in contrails, but this applies only to particles with diameters of about 400 nm, which implies that only a very low fraction of aviation soot can effectively be active as INPs in the upper troposphere. This was also the conclusion by Kärcher et al. (2021): in a recent process-oriented analysis using a high-resolution column model based on the parametrization by Marcolli et al. (2021), they suggested that less than 1 % of aviation soot particles can lead to the formation of ice crystals in competition with homogeneous freezing. To explore this parameter space in sufficient detail, also reproducing the assumptions of previous model studies, we therefore perform nine sensitivity simulations in this study, varying Scrit from 1.2 to 1.4 and fact from 0.1 % to 10 %. These assumptions are marked with the black star symbols in Fig. 1 and result in nine combinations of these two parameters. Values of Scrit>1.4 would mostly exceed the homogeneous freezing threshold at relevant cirrus temperatures and are therefore not worthy to be explored for the scope of the present study.
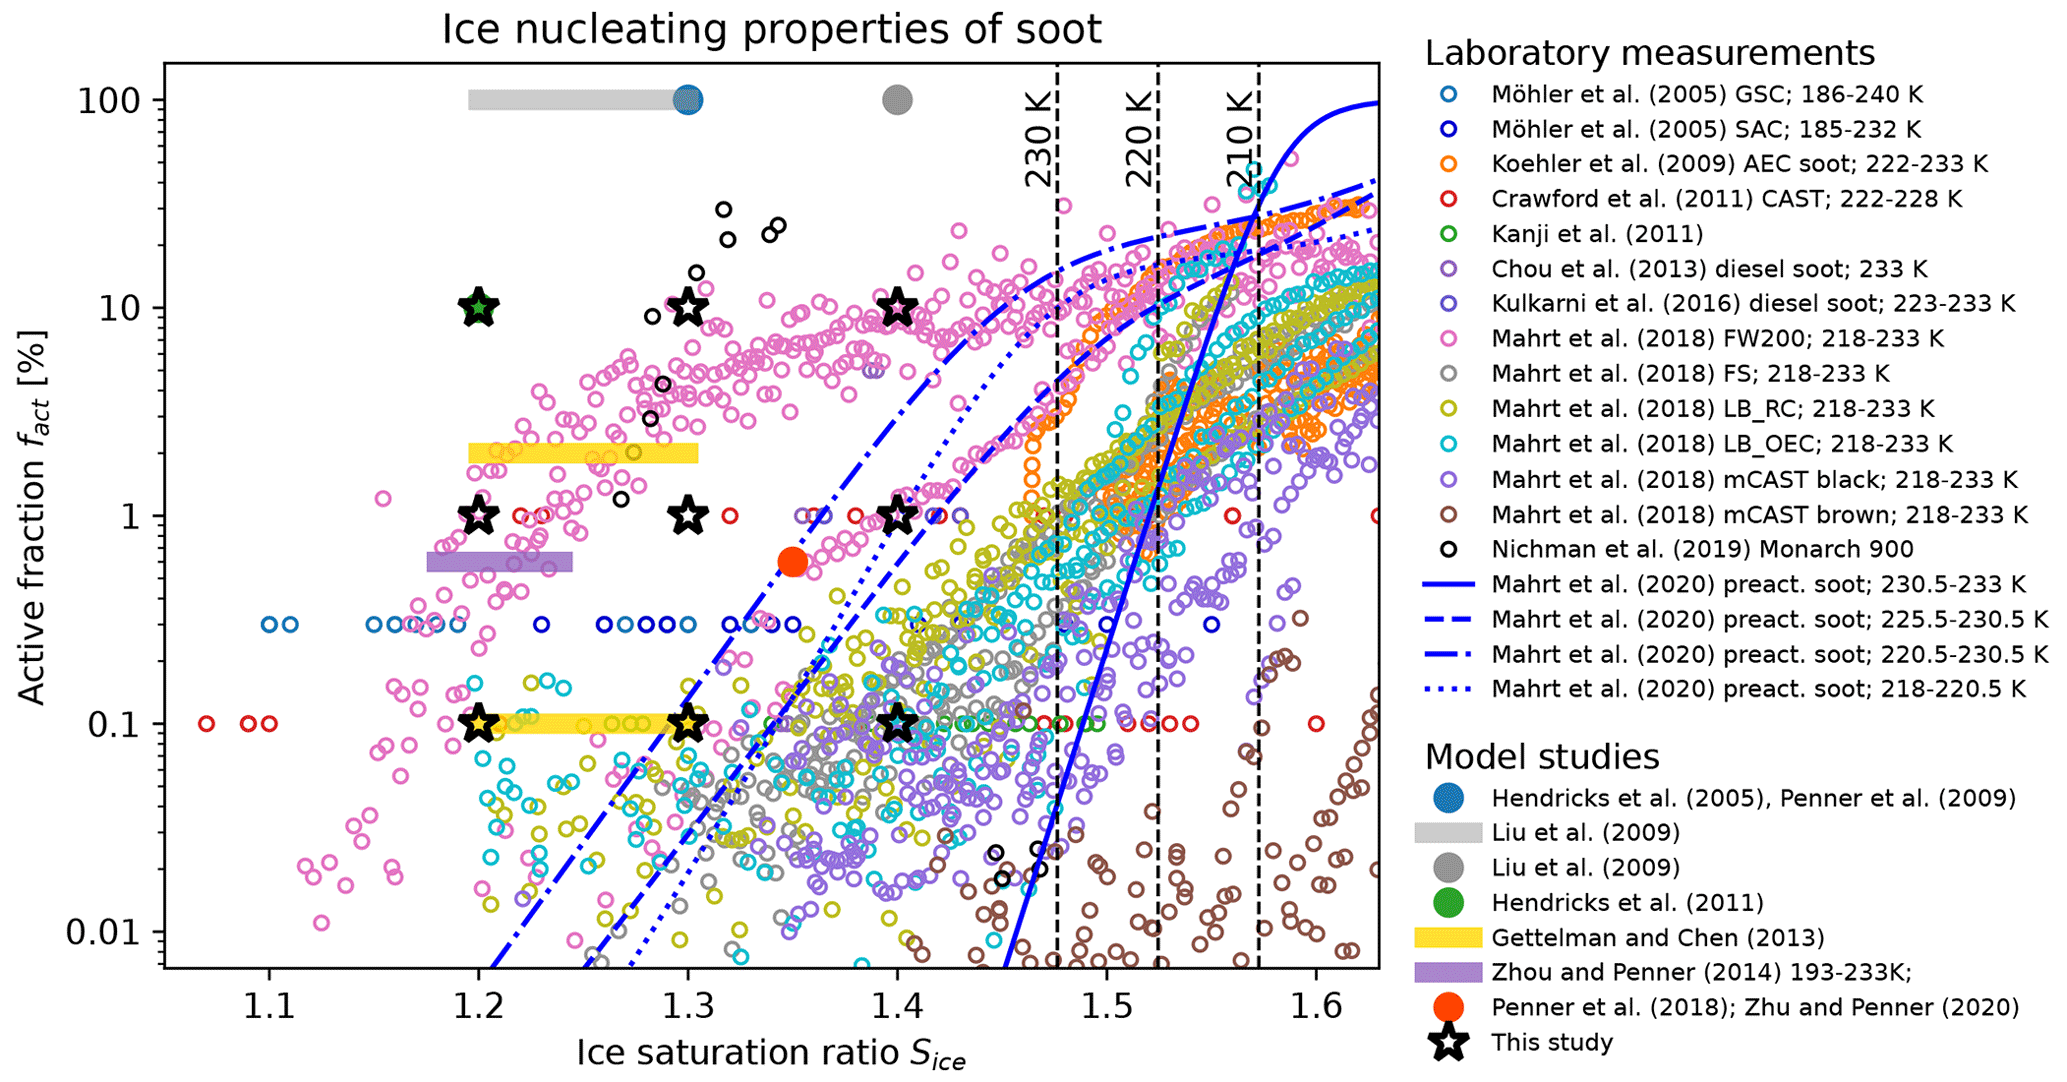
Figure 1Summary of ice-nucleating properties of soot measured in different laboratory studies (Möhler et al., 2005; Koehler et al., 2009; Crawford et al., 2011; Kanji et al., 2011; Chou et al., 2013; Kulkarni et al., 2016; Mahrt et al., 2018; Nichman et al., 2019; Mahrt et al., 2020) compared with the values assumed in model studies on the impact of aviation soot on cirrus (Hendricks et al., 2005; Penner et al., 2009; Liu et al., 2009; Hendricks et al., 2011; Gettelman and Chen, 2013; Zhou and Penner, 2014; Penner et al., 2018; Zhu and Penner, 2020). The parameters explored in this study are symbolized with stars. The vertical dashed lines show the homogeneous ice nucleation threshold at 210, 220, and 230 K.
All previous model-based investigations on the aviation soot–cirrus effect considered approximated representations of the vertical updraft and its subscale variability: a common approach uses the square root of the turbulent kinetic energy (TKE) as a proxy for such variability (Lohmann and Kärcher, 2002). Later studies (Kuebbeler et al., 2014) also included the contribution of orographic gravity waves generated on the lee of mountain ranges (Joos et al., 2008), while recent models (Penner et al., 2018) used methodologies based on measurements (Podglajen et al., 2016) to consider the contribution of gravity waves to the vertical velocity. In this study, the aviation soot–cirrus effect is quantified with the EMAC-MADE3 model (see Sect. 3), which follows the TKE approach for the subscale vertical velocity, also considering the impact of orographic waves in relevant regions. To further investigate how different cirrus regimes may react to the perturbation represented by aviation soot INPs, we also consider an idealized representation of the vertical velocity. We prescribe constant values of the vertical velocity in the range from 2 to 50 cm s−1, to explore the full range of possible updraft regimes, including both slow and fast updrafts (Kärcher et al., 2006; Krämer et al., 2020). While this approach is of course idealized, it offers the possibility to separate the microphysical from the dynamic effect by artificially introducing a spatially uniform dynamic regime, thus allowing the competition among the different INPs considered by the model to be interpreted purely in terms of their microphysical properties. Furthermore, it enables the investigation of INP effects under possible regimes, not covered by the TKE and orographic gravity wave approaches mentioned above.
The global aerosol model EMAC-MADE3 used in this study has been extensively evaluated in Kaiser et al. (2019), focusing in particular on the representation of aerosol particles and their global distribution. In this work, we apply an advanced version of the model, including couplings of the aerosol submodel MADE3 with the radiation and cloud schemes. The model includes a two-moment cloud microphysical scheme based on Kuebbeler et al. (2014), which features a parametrization for aerosol-driven ice formation in cirrus clouds following Kärcher et al. (2006). This parametrization considers the competition among the different ice formation processes in increasing order of critical saturation ratio, i.e. from the most efficient heterogeneous freezing process to homogeneous freezing. The increase of supersaturation driven by vertical updrafts proceeds until it is compensated by the loss of water vapour due to the growth of ice crystals (either freshly formed or pre-existing from the previous model time step). For large enough supersaturations, both heterogeneous and homogeneous freezing can take place, and their competition is accounted for in the model.
This configuration has been tuned and evaluated with respect to the main cloud and radiation variables in Righi et al. (2020). The work by Righi et al. (2020) demonstrated the overall ability of the model to reproduce the most important cirrus properties, like ice water content (IWC) and ICNC, when compared with in situ measurements (Krämer et al., 2016; Voigt et al., 2017; Krämer et al., 2020), a necessary requirement in the context of the present work.
With respect to the EMAC-MADE3 version documented in Righi et al. (2020), some technical changes and a few improvements specific to the application for this study have been introduced. In particular, the time integration of the cloud prognostic variables, including cloud droplet number concentration (CDNC) and ICNC, has been improved, to make it consistent with the approach used by the other submodels which are part of the EMAC model system. This change required a retuning of the model configuration, which now uses slightly different values for the tuning parameters with respect to the Righi et al. (2020) setup. More specifically, the enhancement factor γr for the rate of rain formation by autoconversion has been reduced from γr=8 to γr=4, and the minimum CDNC (a threshold introduced in the cloud scheme to avoid unrealistically low concentrations in pristine regions) has been increased from 20 to 50 cm−3. This value is close to the 40 cm−3 value used by Neubauer et al. (2019) in the ECHAM6 model and is supported by typical CDNC values measured by satellites in pristine regions (Bennartz and Rausch, 2017; Grosvenor and Wood, 2018). The overall model performance after this correction is similar to Righi et al. (2020), and the main conclusions of that study remain valid: the model provides a good representation of cloud cover, CDNC, precipitation, and cloud radiative effects, while it is still affected by a relatively high liquid water path (LWP; at the high end of the observed range). The cirrus specific quantities, IWC and ICNC, show a slight improvement. Furthermore, the model now simulates an effective RF due to the total anthropogenic aerosol effect of −1.16 W m−2, in better agreement with the recent assessment by Bellouin et al. (2020), who reported a range −1.6 to −0.6 W m−2 (68 % confidence interval). The tuned model is characterized by a radiative balance of 3.4 mW m−2 when run in nudged mode, i.e. by relaxing the meteorology towards reanalysis data. The same configuration in free-running mode has a radiative balance of 0.9 mW m−2 (see Righi et al., 2020, for a detailed discussion on the impact of nudging on the model radiative balance).
Another relevant improvement to the model configuration applied here is the introduction of an additional tracer BCtag to which the soot emissions from the aviation sector are assigned. The BCtag tracer is distributed into the same six modes as the standard BC tracer of MADE3, namely Aitken, accumulation, and coarse mode, each with insoluble and mixed states. The BC and BCtag tracers have the same physical properties and undergo exactly the same processes in the model but allow for different ice-nucleating properties between background and aviation soot in the cirrus parametrization. The ice-nucleating properties of mineral dust and background soot are the same as in Righi et al. (2020), namely with a temperature-dependent active fraction for mineral dust in the deposition mode, Scrit=1.3 and fact=5 % for mineral dust in the immersion mode (Kuebbeler et al., 2014), and Scrit=1.4 and fact=0.25 % for background soot (Hendricks et al., 2011). The Scrit and fact parameters for aviation (and in part also background) soot are explored in more detail in the dedicated sensitivity studies, as discussed in Sect. 2. To avoid confusion, we note here that the BC and BCtag tracers of MADE3 actually refer to black carbon, i.e. an aerosol type composed only of carbon, but we are using the term soot in this paper for consistency with most of the literature on aviation effects, although these definitions are not fully consistent (see Petzold et al., 2013, for a more detailed discussion on this terminology).
To calculate the number concentration of INPs for the different types, we use the same approach as Righi et al. (2020), while for the newly introduced BCtag tracer we derive the number concentration from the tracer mass, by assuming aviation soot to follow the bimodal size distribution measured by Petzold et al. (1999) in the plume of a B737-300 aircraft. This distribution is characterized by median diameters of 25 and 150 nm and geometric standard deviations of 1.55 and 1.65, for the Aitken and accumulation modes, respectively. The same size distribution parameters were used in Righi et al. (2013) to characterize particle number emissions from aviation. Introducing the BCtag tracer has the advantage that a lower number of simulations needs to be performed to isolate the impact of aviation soot on cirrus clouds, since only two experiments are required for that, i.e. with and without the effect of the BCtag INPs in the cirrus parametrization. The difference between these two experiments hence provides an estimate of the climate impact of aviation soot on natural cirrus clouds while excluding the effects of the interactions with clouds at lower levels (e.g. sulfate impact on liquid clouds). The statistical significance of this estimate is also improved with respect to an approach where no tagging of aviation soot is included, since in that case four experiments would be required (with and without aviation, with and without soot impact on cirrus) to isolate the effect. Another advantage of this tagging approach is that different ice nucleation abilities can be assumed for aviation soot and background soot, i.e. soot from background sources. The aviation soot–cirrus effect is estimated by calculating the difference between a given simulation and a baseline experiment (BASE), where aviation soot (i.e. the BCtag tracer) is not considered as INPs in the cirrus parametrization. A paired sample t test is applied to verify the null hypothesis that the annual mean values of a given quantity (e.g. RF) are identical in the two simulations (with and without aviation soot impact on cirrus). We express the response of the test in terms of confidence level, i.e. 100(1−p), where p is the p value. Unless otherwise specified, we regard the results as statistically significant when the null hypothesis can be rejected at a confidence level larger than 95 % (p<0.05).
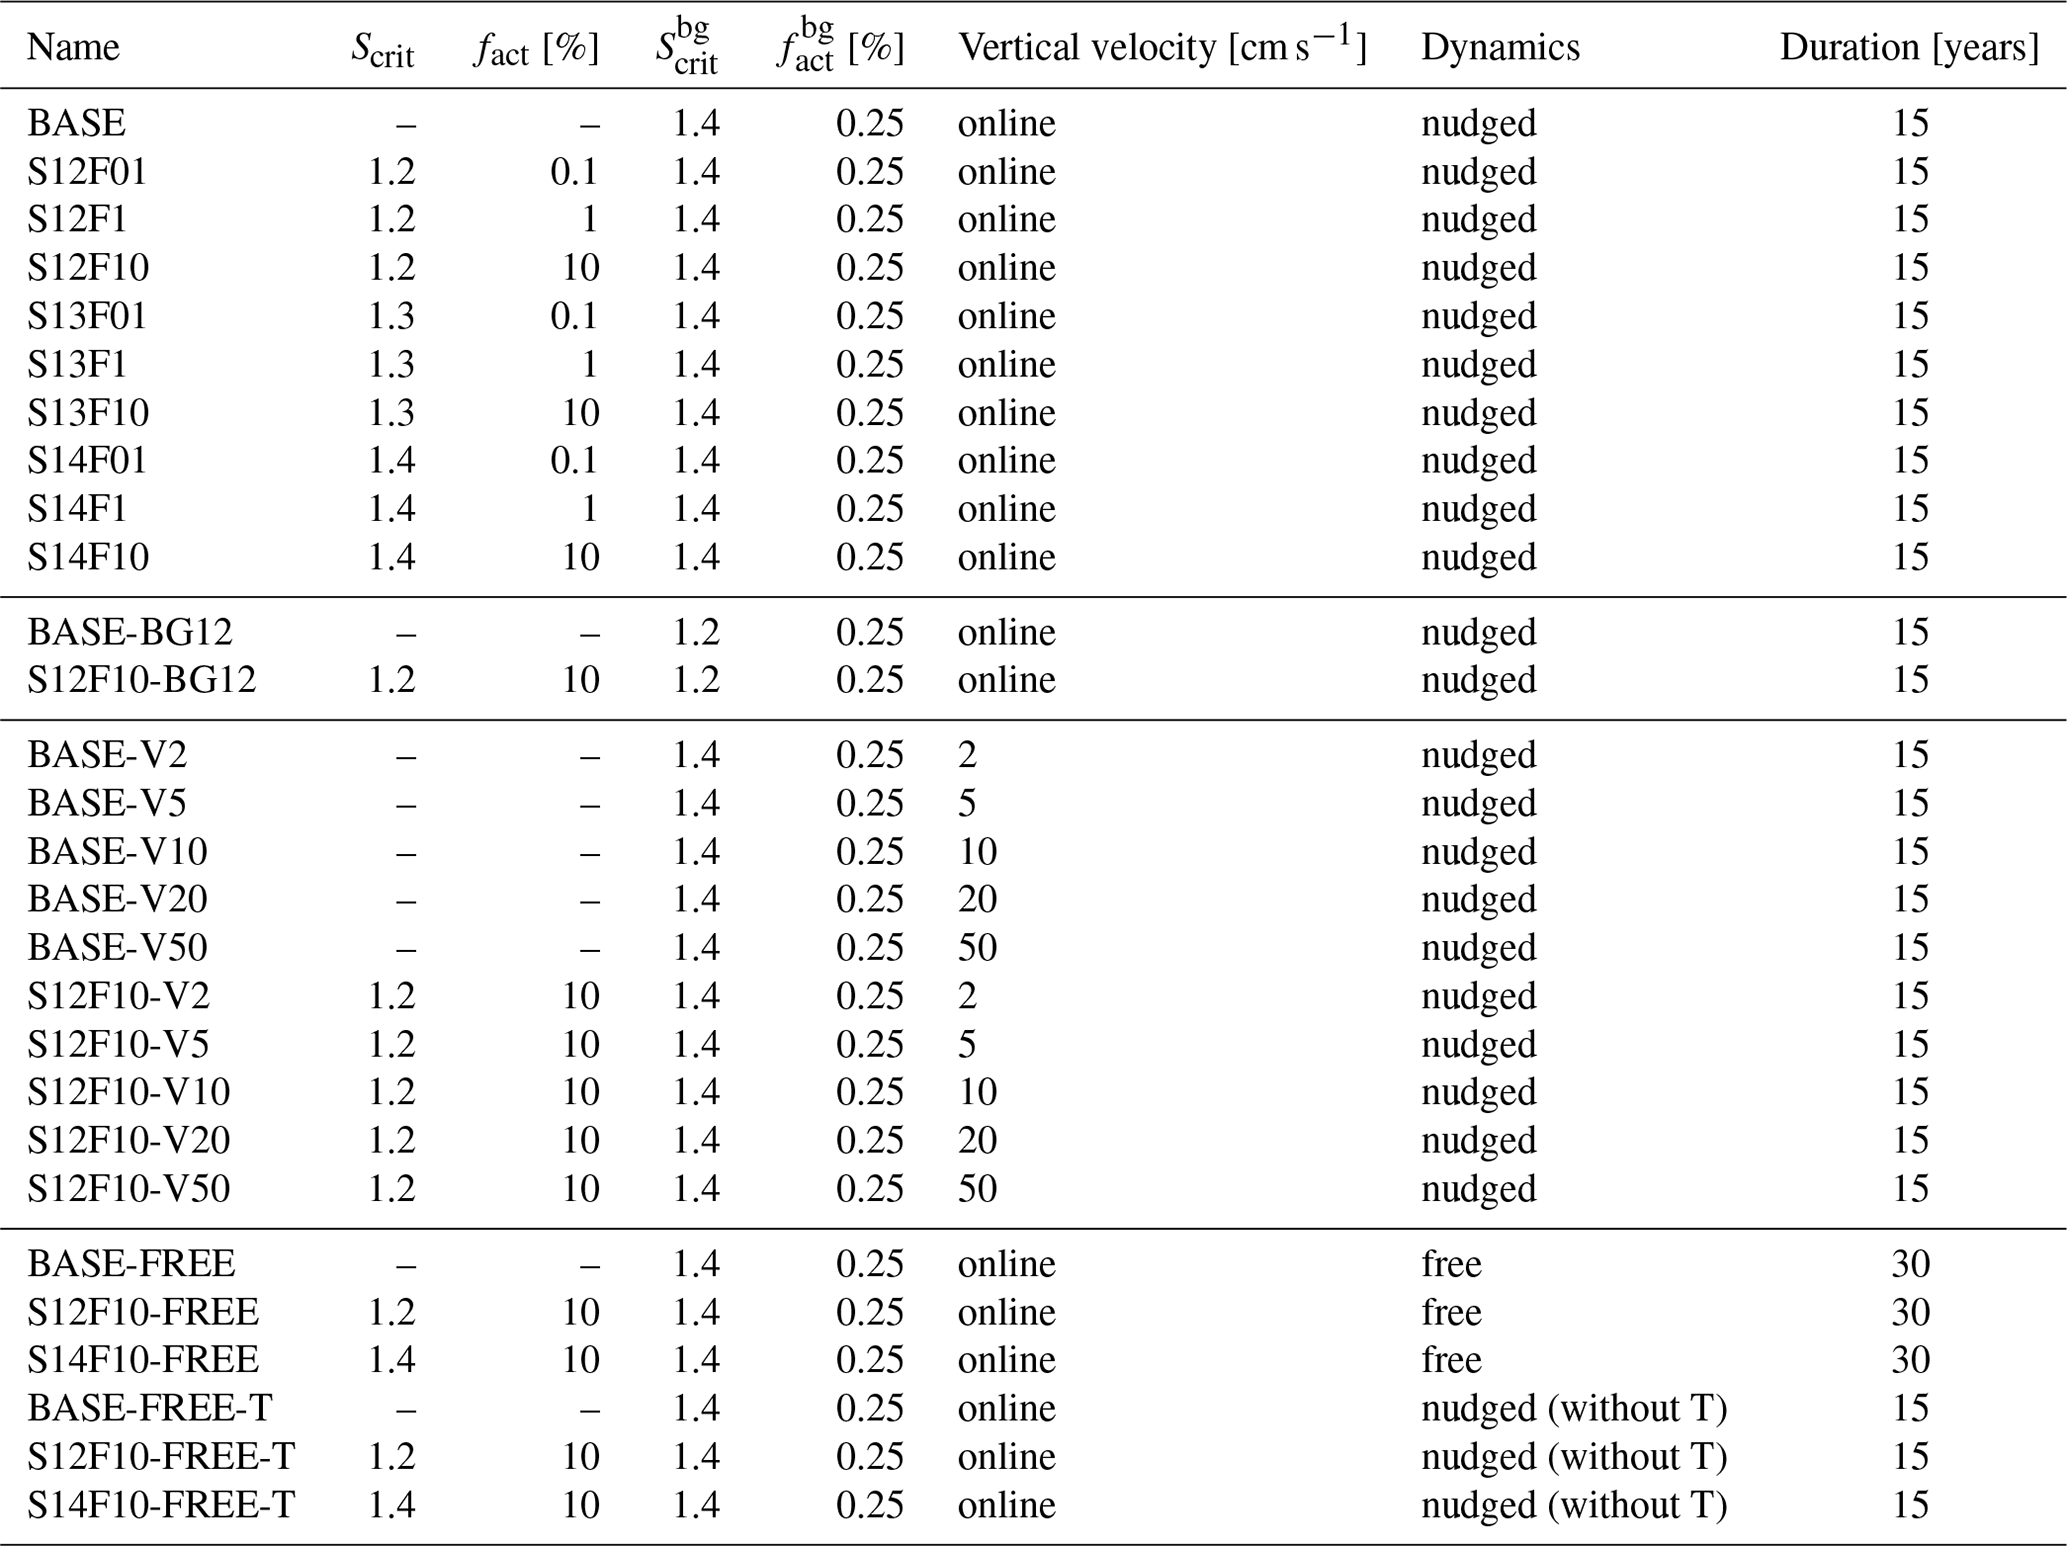
Finally, to provide estimates of the aviation effects closer to the present-day conditions, we updated the model emissions setup for anthropogenic and biomass burning (or open burning) sources of aerosol and aerosol precursor species to the recent CMIP6 inventory for the year 2014 (van Marle et al., 2017; Hoesly et al., 2018; Feng et al., 2020). Aviation BC emissions in this inventory amount to about 10.5 Gg in 2014. Natural emissions (e.g. mineral dust and volcanoes) are considered as in Righi et al. (2020), where mineral dust and sea spray emissions were calculated as a function of the local wind speed. For consistency, the prescribed mixing ratios of greenhouse gases used as input to the radiation scheme of EMAC (RAD; Dietmüller et al., 2016) are also updated to the 2014 values provided in Meinshausen et al. (2017) for the CMIP6 project, while for ozone we use the geographically resolved mixing ratios generated in support of CMIP6 by Hegglin et al. (in prep.; see also Hegglin et al., 2016) for the same year. The simulations performed in this study are summarized in Table 1. They are all characterized by a T42L41 configuration, corresponding to a horizontal resolution of about and 41 non-equidistant vertical layers. The simulated time period covers the years from 2000 to 2015, with the year 2000 as spin-up and not included in the analysis. Unless otherwise specified, the model meteorology (temperature, winds, and logarithm of the surface pressure) is nudged towards the ERA-Interim reanalysis data (Dee et al., 2011) of the European Centre for Medium-Range Weather Forecasts (ECMWF) for the same time period. The relaxation times for nudging are 6 h for wind vorticity, 24 h for surface pressure and temperature, and 48 h for wind divergency. Further sensitivity experiments are performed in free-running mode to analyse the effect of nudging on the results and cover a period of 30 years, using prescribed climatological mean (2000–2009) sea-surface temperature (SST) and sea-ice concentration (SIC) from the Met Office Hadley Centre dataset (HadISST; Rayner et al., 2003).
Table 1Summary of the EMAC-MADE3 simulations performed in this study. Scrit and fact refer to the ice-nucleating properties of aviation soot, while and indicate the ones of background soot (i.e. from other anthropogenic and biomass burning sources). Every simulation includes an extra spin-up year which is not considered for the analysis. The nudged simulations use meteorological reanalysis data for the period 2001–2015.
The model's representation of vertical velocity follows the approach of Kuebbeler et al. (2014) as described in Righi et al. (2020), but given its importance for the present study, we recall the main aspects here. The vertical velocity in the model is described as the sum of a large-scale and a subscale component. The latter is approximated according to Lohmann and Kärcher (2002) as , while in the vicinity of mountain ranges the subscale contribution of orographic waves to the vertical velocity is considered instead, following the parametrization of Joos et al. (2008). The vertical velocities from these three components, as simulated by EMAC-MADE3, are depicted in Fig. 2 for the BASE experiment, considering the 95th percentile of the vertical velocity distribution above 400 hPa. This allows the largest fluctuations in the vertical velocity distribution to be analysed for each component. The large-scale component (Fig. 2a) is usually characterized by small updrafts of the order of a few centimetres per second and with little spatial variation. The additional subscale contribution from the TKE (Fig. 2b) emerges mostly in the tropics, but it is generally below about 1 cm s−1, with the exception of the Himalayan and Andean mountain ranges, where spikes of a few tens of centimetres per second can be expected. In these and other mountain regions, however, the model accounts for the contribution of orographic waves (Fig. 2c), which can induce large vertical velocity fluctuations of about 50 cm s−1, mostly impacting the western side of North America, Europe, and large parts of Asia around the Himalayas, i.e. near the most prominent mountain ranges of the world. Such strong updrafts can induce large supersaturations, thus efficiently driving homogeneous freezing and enhancing cirrus formation.
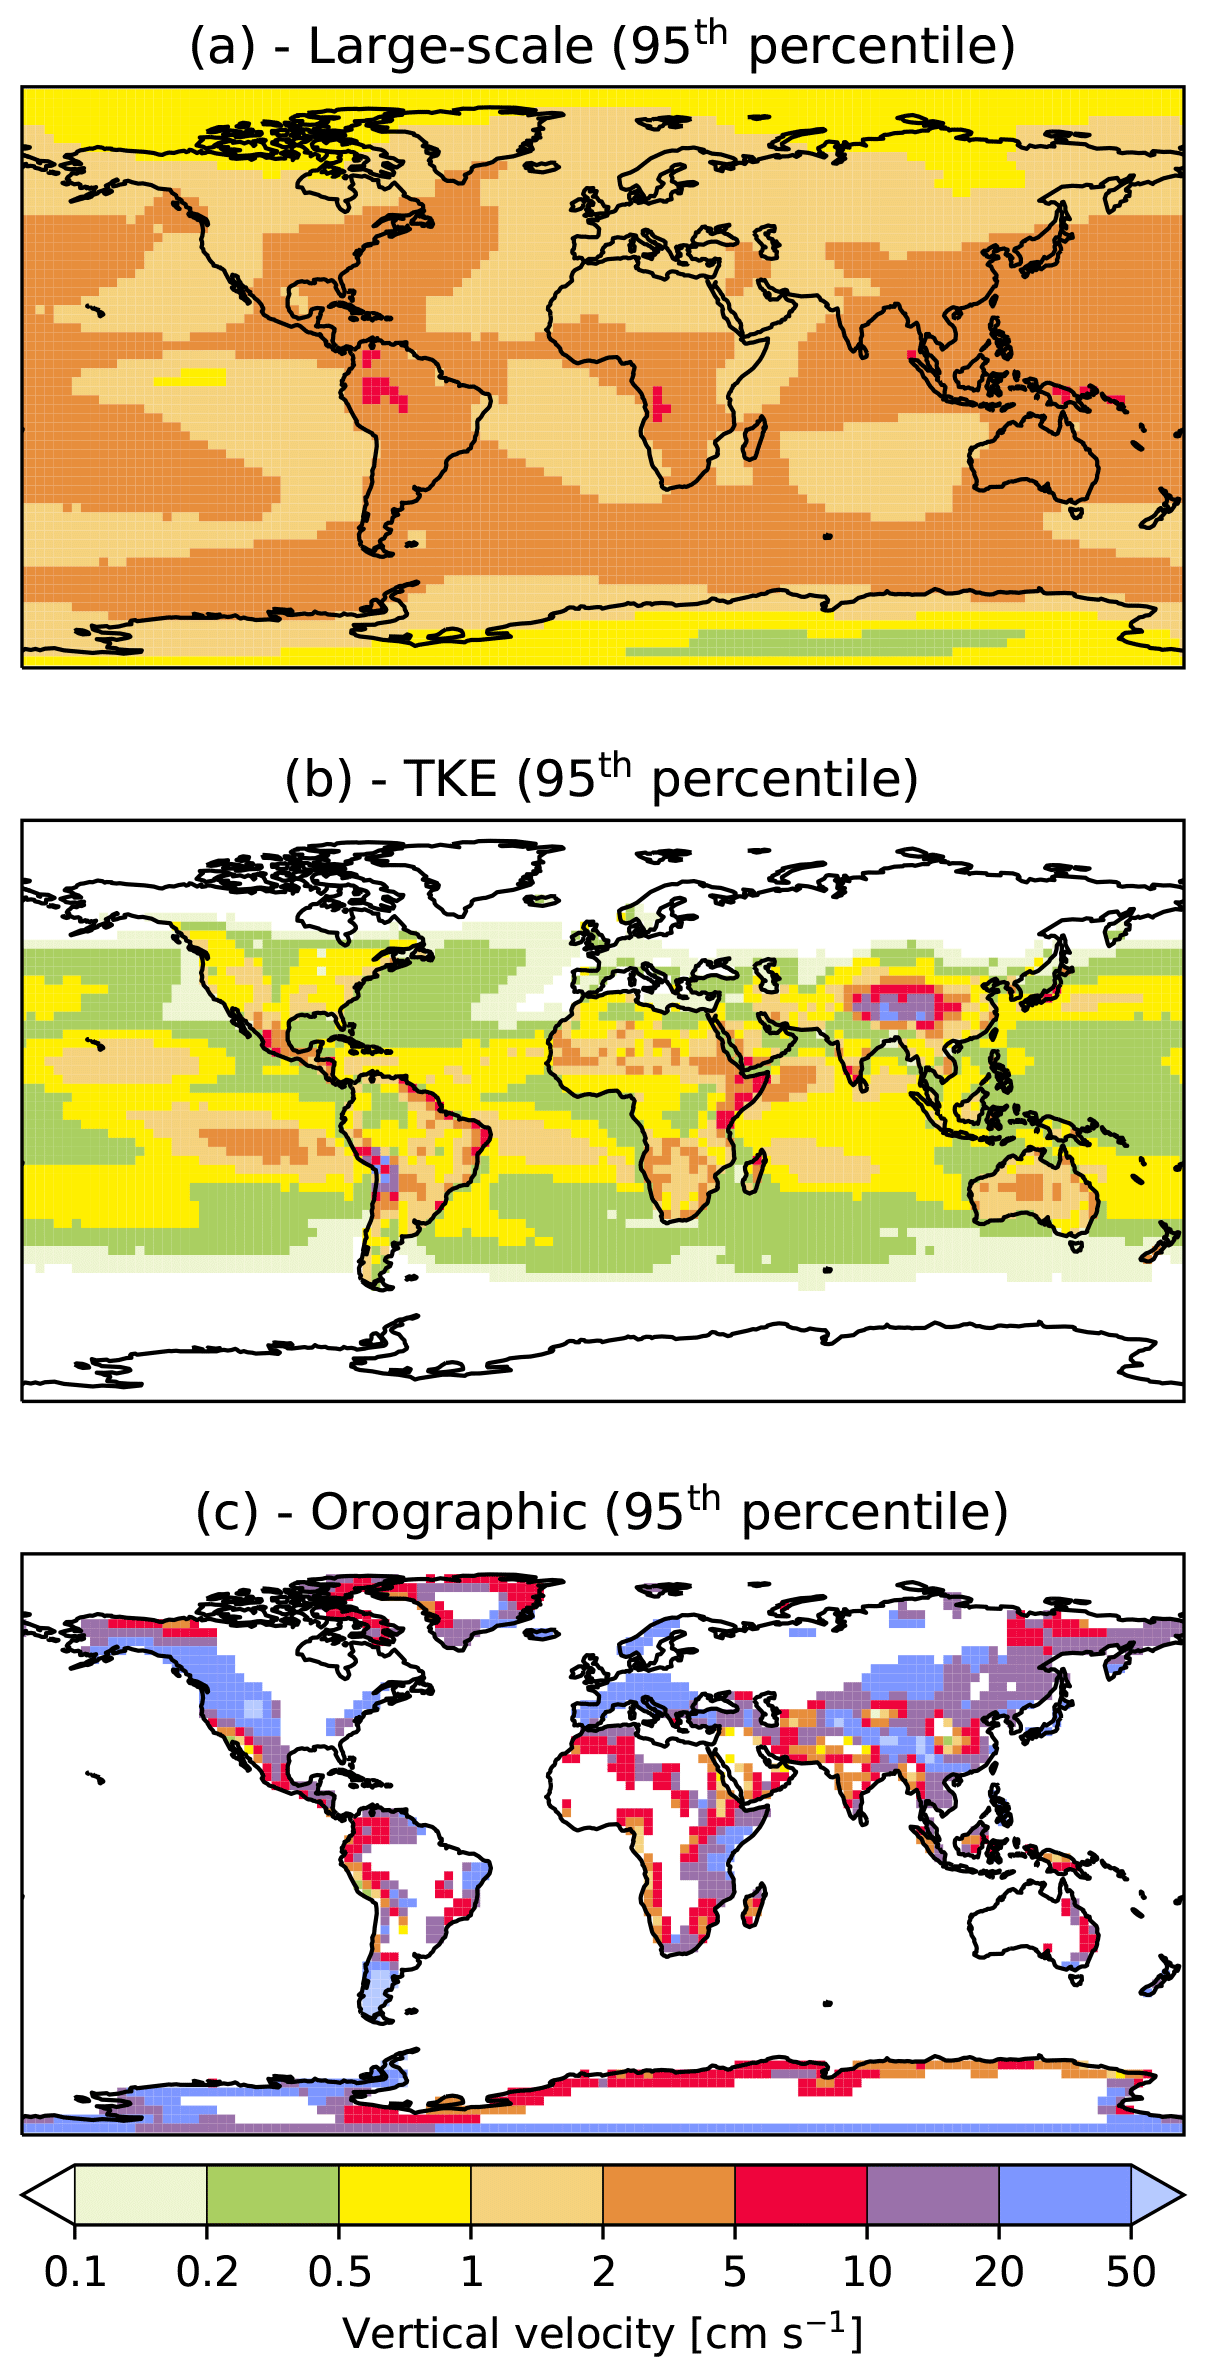
Figure 2The vertical velocity components considered by the model: (a) large-scale, (b) subscale using the turbulent kinetic energy (TKE) as proxy, and (c) subscale contribution of the orographic waves in the vicinity of mountain ranges. Each panel shows the 95th percentile of the vertical velocity distribution with respect to the time (over the 2001–2015 simulation period) and vertical (above 400 hPa) coordinates.
We further analyse the model mean state and, in particular, the impact of the vertical velocity on the ice formation processes in Fig. 3, depicting IWC and ICNC distributions in the BASE experiment, as well as the frequency of occurrence of homogeneous freezing events. The latter is estimated by considering the number concentration of homogeneously and heterogeneously formed ice crystals as diagnosed by the cirrus parametrization in the model. For each model grid box and output time step (11 h frequency; see Righi et al., 2020), we then assign a value 1 (0), where ICNC from homogeneous freezing is larger (smaller) than ICNC from heterogeneous freezing. By averaging this over the whole simulation time period (2001–2015), we obtain an estimate of the frequency of occurrence of homogeneous freezing events. IWC has its largest values (2–5 mg kg−1) along the tropopause at all latitudes (Fig. 3a), while at 250 hPa the maxima are mostly in the tropics (Fig. 3b). A similar pattern is followed by ICNC (Fig. 3c, d), with slightly higher concentrations (200–500 L−1) in the northern extra-tropics, possibly driven by anthropogenic and dust emissions contributing large concentration of INPs at these latitudes. The zonal mean profile of the homogeneous freezing fraction (Fig. 3e) shows a large contribution (≳50 %) of homogeneous freezing at lower levels in the polar regions and close to the tropopause at all latitudes, with larger values in the extra-tropics than in the tropics. As expected, the geographical distribution at 250 hPa (Fig. 3f) closely matches the pattern of vertical velocities; in particular the strong updrafts of several tens of centimetres per second induced by orographic waves (Fig. 2c) lead to enhanced homogeneous ice formation, with larger fractions found in the vicinity of the highest mountain ranges over the globe. Note that, due to the parametrization design, the analysis of the homogeneous freezing fraction only counts pristine crystals; hence it only applies to the formation process (disregarding for instance the different residence times of ice crystals of different sizes). The patterns depicted in Figs. 2 and 3 are important for the aviation effects investigated here and need to be taken into account for the interpretation of the results discussed in the next section.
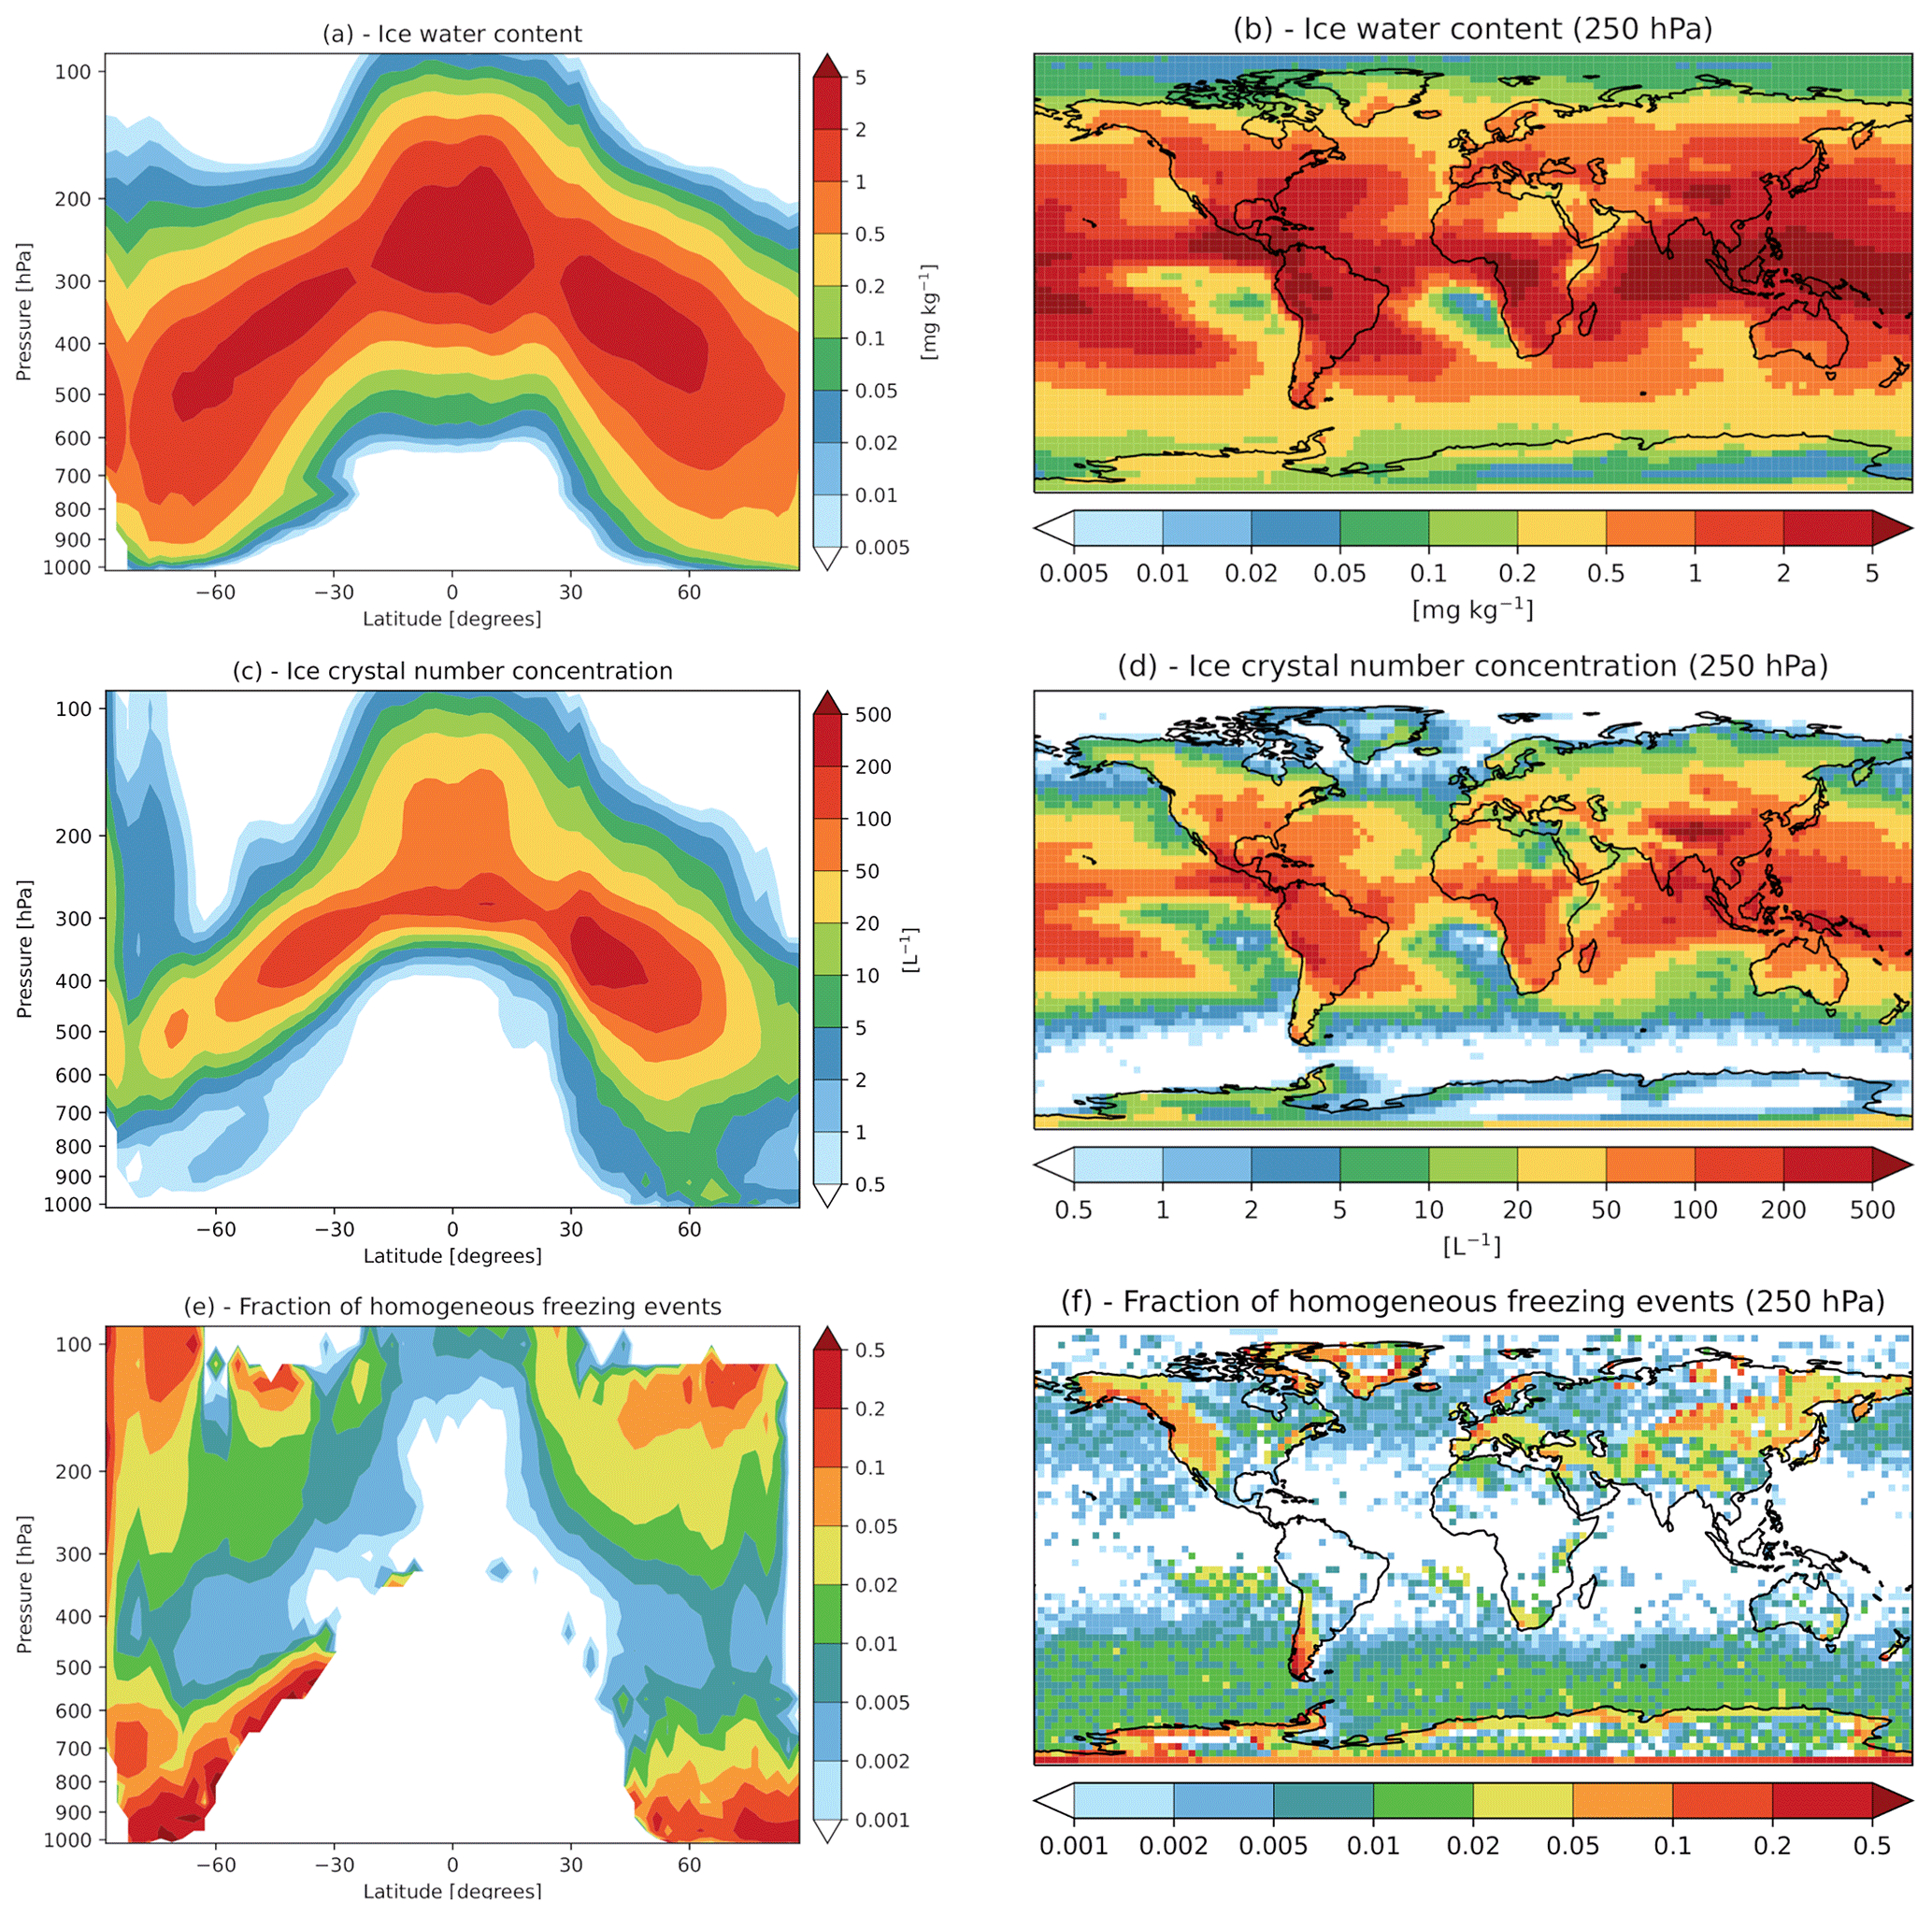
Figure 3Zonally averaged (a, c, e) and geographical distribution at 250 hPa (b, d, f) of IWC (a, b), ICNC (c, d), and the fraction of occurrence of homogeneous freezing events (e, f). All panels show results from the BASE experiment (see Table 1) and consider the multi-year average over the simulated period (2001–2015). IWC and ICNC include both cloudy and cloud-free model grid boxes.
4.1 Geographical distribution of aviation soot and INPs
Before analysing the aviation soot radiative effects, we present in Fig. 4 the geographical distribution of aviation soot emissions from the CMIP6 dataset used here, together with the simulated mass and number concentration of aviation soot. Note that only a fraction of this number concentration is actually effective as INPs in the model, depending on the fact fraction assumed in the different sensitivity experiments discussed above. We stress again that the aviation emissions are assigned to a tagged soot tracer in EMAC-MADE3, thus making it possible to track aviation soot in the model without the need for an extra sensitivity experiment with aviation emissions switched off, as in the standard perturbation approach applied, for example, in Righi et al. (2013). Not surprisingly, the aviation soot emissions are largest in the northern mid-latitudes (Fig. 4a), with maxima in the Northern Hemisphere at typical flight altitudes (200–250 hPa) and close to the surface, due to the climb and descent phases but also to the paths of short-range flights, which are mostly common over the continents. The geographical pattern at flight altitude (Fig. 4b) shows the major routes connecting the most populated areas of the world, in particular the North Atlantic flight corridor between Europe and the eastern United States, while the connections to eastern Asia are less marked in this inventory. The aviation soot mass concentration (Fig. 4c, d) follows a similar distribution, again with maxima at flight altitudes and close to the surface, with concentrations of the order of 0.2–0.5 ng m−3. Not surprisingly, much lower mass concentrations are found in the Southern Hemisphere, again with a maximum at flight altitudes of 0.05–0.1 ng m−3, at slightly higher level than in the Northern Hemisphere. This pattern is consistent with the results of a previous model study with the predecessor version of EMAC-MADE3 (Righi et al., 2013), where, however, lower concentrations of aviation soot were simulated. This could be due to the use of a different emission inventory (CMIP5 instead of CMIP6) and for earlier conditions (year 2000 vs. 2014) in that study but also to the introduction of the tagging method for aviation soot in the present work, which provides more accurate estimates. The difference in mass concentration between the Northern and Southern Hemisphere is evident in the geographical map at ∼250 hPa (Fig. 4d), where also a clear gradient from the tropics towards the polar regions is present. The number concentration of aviation soot particles (Fig. 4e, f) shows a similar pattern to the mass concentration, although with clearer features near the emission sources, such as the North Atlantic flight corridor, and the regions above central Europe and the eastern United States. Some flight corridors can also be identified in the Southern Hemisphere. The reason for such sharply structured patterns is that particles in the Aitken mode, which dominate total particle number, are characterized by a shorter lifetime due to particle–particle interactions, which effectively reduce their number concentration away from sources, while their mass is of course conserved. For comparison, Fig. S1 in the Supplement shows the number concentration of the other INPs considered by the model, namely mineral dust in the immersion and deposition mode, as well as background BC resulting from the other (non-aviation) emission sources.

Figure 4Aviation soot emissions from the CMIP6 dataset used for the model simulations in this work (a, b). The other panels show the mass concentration (c, d) and the number concentration (e, f) of aviation soot simulated by EMAC-MADE3 (BASE experiment; see Table 1). Panels (a), (c), and (e) show zonal means, whereas (b), (d), and (f) show the ∼250 hPa level. All panels consider the multi-year average over the simulated period (2001–2015). Note that the number concentration of aviation soot is further multiplied by the active fraction fact=0.1 %–10 % in the cirrus parametrization to obtain the number concentration of aviation soot INPs.
4.2 The aviation soot–cirrus effect
The RFs from the aviation soot–cirrus effect under the nine different assumptions for the ice-nucleating properties of aviation soot are presented in form of a matrix in Fig. 5. The EMAC-MADE3 simulations estimate this effect to be in the range of −35 to 13 mW m−2 but lacking sufficient statistical significance for Scrit=1.3 and Scrit=1.4. The effect is negative (cooling) for low critical saturation ratios (higher nucleation efficiencies) and tends to increase towards a positive (warming) effect for medium to high critical saturation ratios (medium to low nucleation efficiencies). The statistical insignificance of the RF for some combinations of the parameters, however, makes it difficult to draw general conclusions from these overall numbers alone.
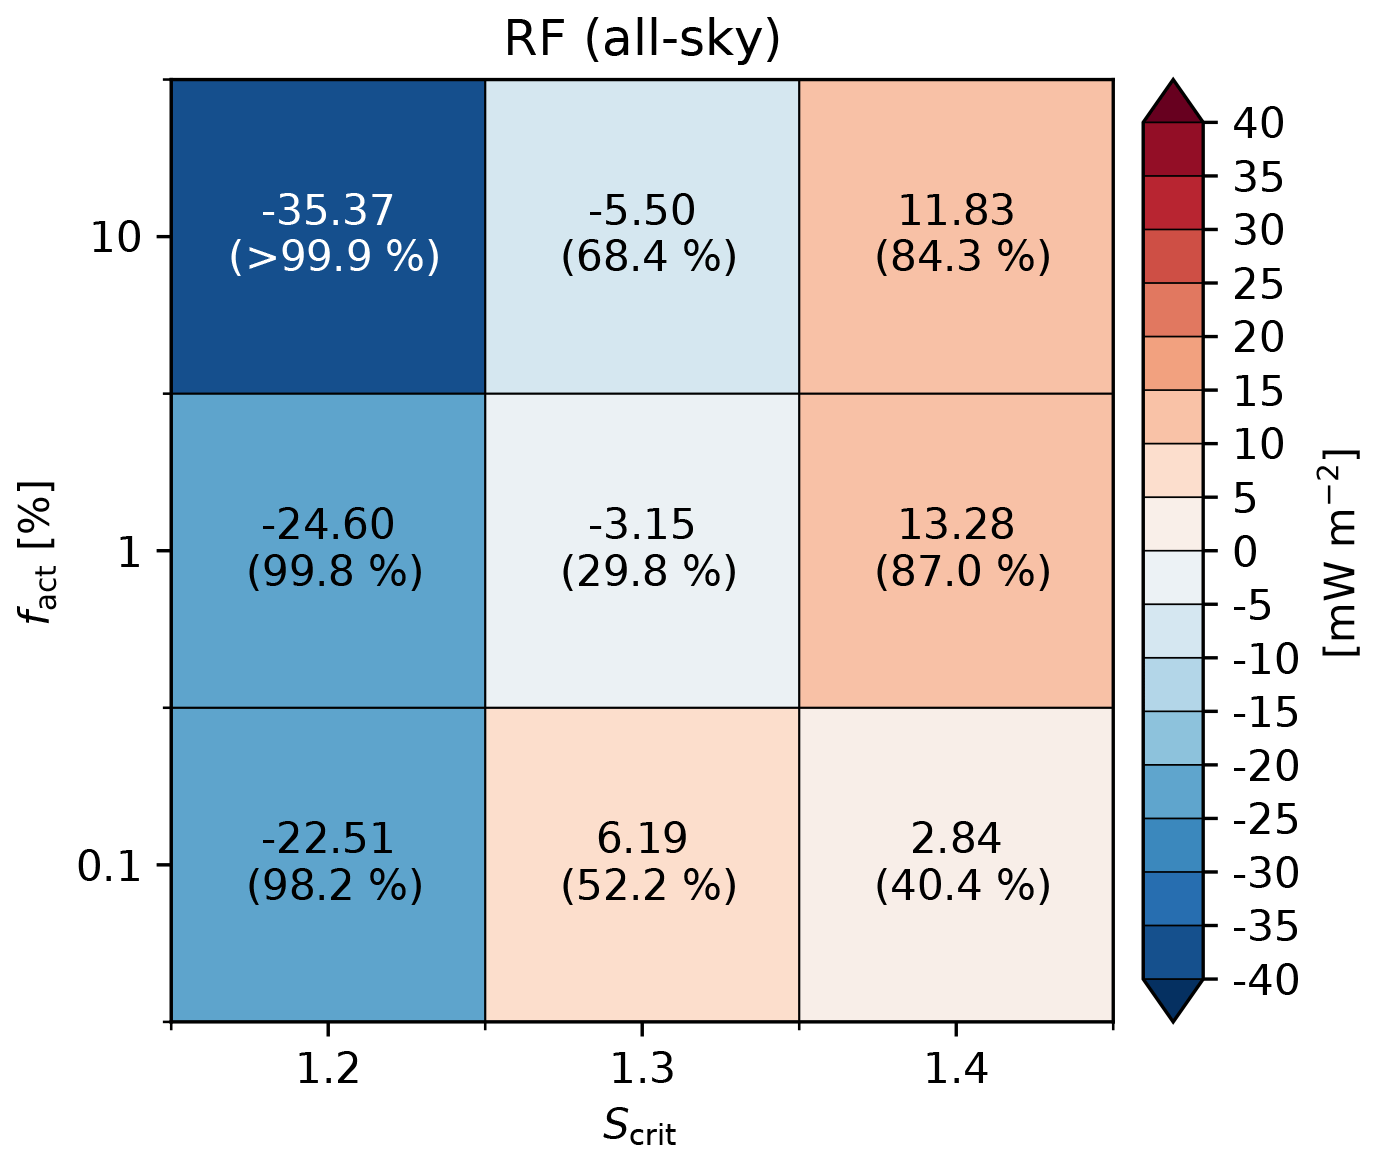
Figure 5Multi-year average (2001–2015) top-of-the-atmosphere all-sky RF due to the effect of aviation soot on natural cirrus clouds, under different assumptions for the ice nucleation efficiency of aviation soot INPs (Scrit and fact). The values in brackets within each box indicate the confidence level.
To facilitate the interpretation, we separate in Fig. 6a–d the different components of the RF, namely shortwave and longwave, all-sky and clear-sky. As expected, these graphs demonstrate how the aviation soot–cirrus effect actually results from the opposite changes in the shortwave (Fig. 6a) and longwave (Fig. 6b) all-sky RFs, which also have a much higher statistical significance than the total RF. The effect in the shortwave corresponds to a warming (i.e. a reduced cooling), meaning that aviation soot reduces the (background) cooling impact of natural cirrus clouds in the shortwave. This could be a manifestation of the negative Twomey effect (Kärcher and Lohmann, 2003): the additional INPs from aviation compete with homogeneous freezing for the available supersaturation and lead to the formation of fewer and larger ICs in these clouds, thereby decreasing their reflectivity and their shortwave cooling. This interpretation is consistent with the very small changes in the clear-sky part of the shortwave spectrum (Fig. 6c), and it is further supported by the general decrease in the homogeneous freezing fraction (Fig. 6e), although the changes in overall ICNC are very small and not statistically significant (Fig. 6f). The decrease in cloud frequency (Fig. 6h) could also contribute to these changes in the shortwave RF, especially at higher Scrit, where the competition between homogeneous and heterogeneous freezing which drives the negative Twomey effect can be expected to be less important (see again Fig. 6e). The warming effect in the shortwave spectrum is counteracted by a cooling (i.e. a reduced warming) in the longwave (Fig. 6b), due to the fact that larger ICs usually sediment more efficiently and reduce the lifetime of the cirrus clouds, resulting therefore in a decrease of their (background) warming effect and hence in a cooling. This is supported by the overall decrease in cloud frequency shown in Fig. 6h. The cooling (reduced warming) effect in the longwave is further enhanced when the nucleation efficiency of aviation soot is high (Scrit=1.2): in this case also the clear-sky RF (Fig. 6d) significantly contributes to the cooling. A possible aviation-induced (or aviation-enhanced) dehydration of the affected air masses is suggested here, resulting from the increased deposition of supersaturated water vapour on the very efficient INPs from aviation, which are then rapidly removed via sedimentation (Jensen et al., 2001, 2013). This reasoning is supported by the marked decrease in total water (sum of water vapour and ice water; Fig. 6g) and in cloud frequency (Fig. 6h): here small (≲1%) but statistically significant decreases in the simulations with Scrit=1.2 are evident. For lower ice nucleation efficiencies (Scrit≥1.3), the changes are about 1 order of magnitude smaller and mostly not statistically significant. We can therefore conclude that the aviation soot INPs can effectively enhance the dehydration of the upper troposphere and induce a statistically significant cooling effect when high nucleation efficiencies are assumed. For lower efficiencies (higher critical saturation ratios), the warming (reduced cooling) in the shortwave appears to be more important (possibly due to a reduction in cloud frequency; Fig. 6h) and leads to a slightly positive overall RF effect.
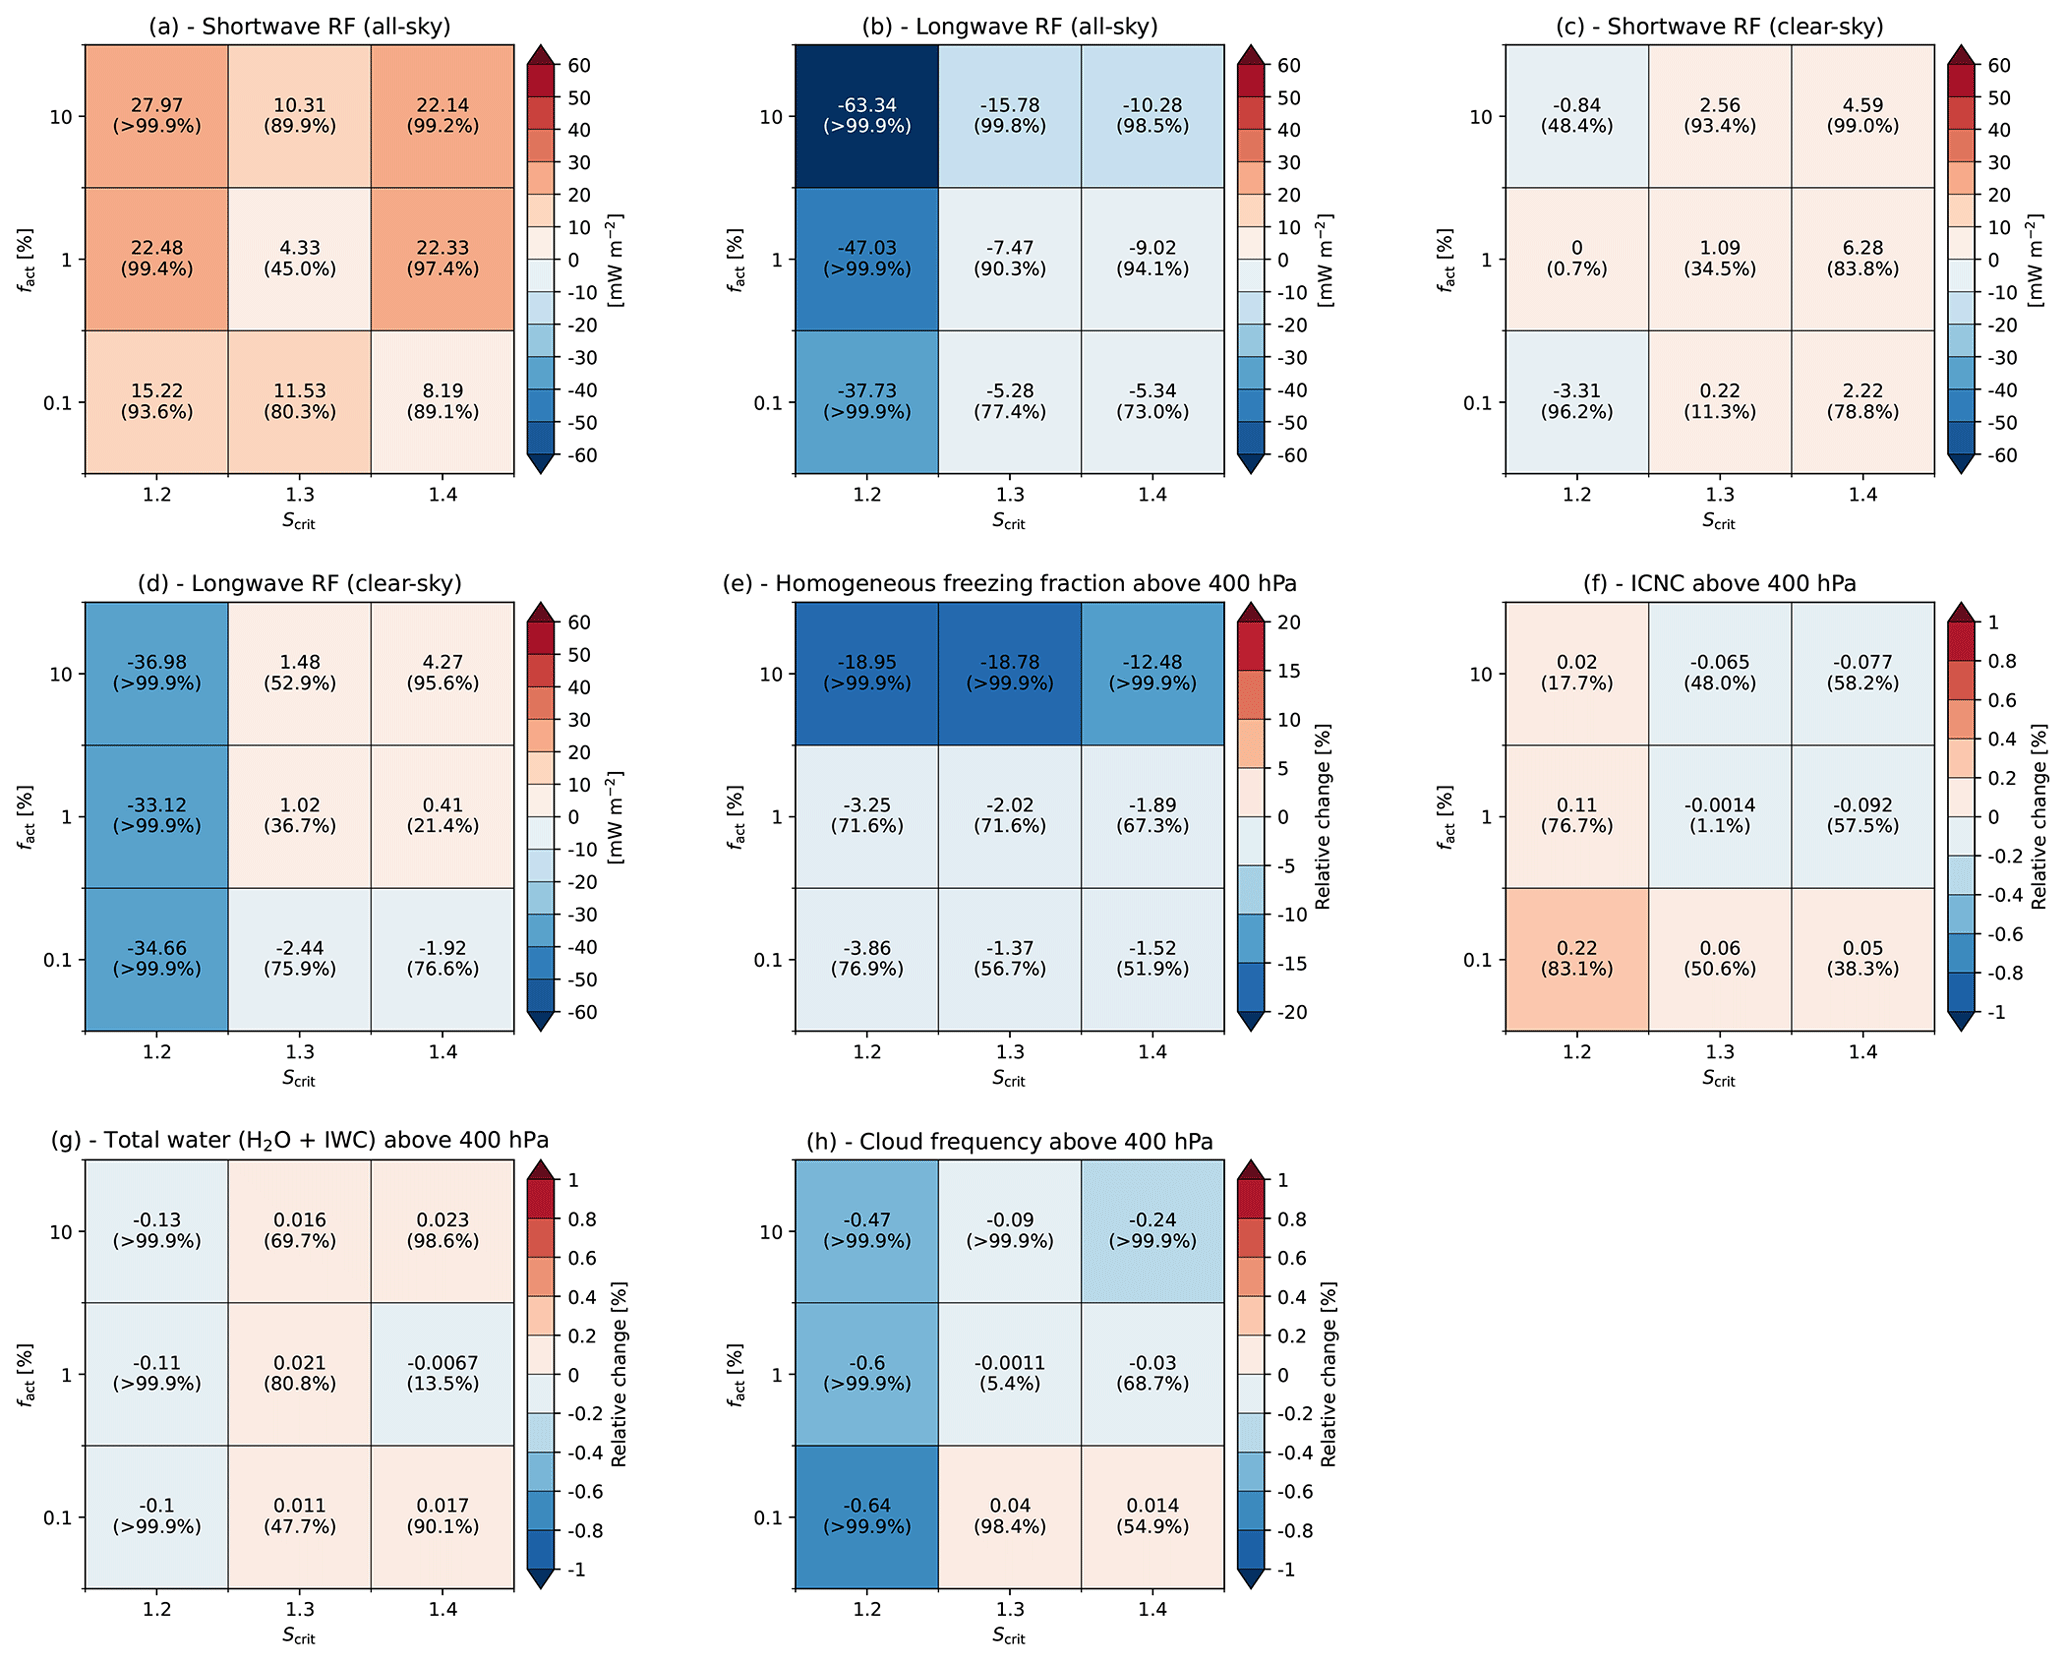
Figure 6As in Fig. 5 but for (a) all-sky shortwave, (b) all-sky longwave, (c) clear-sky shortwave, and (d) clear-sky longwave top-of-the-atmosphere RFs. Panels (e–h) depict the aviation-soot-induced relative changes in ICNC from homogeneous freezing, ICNC, total water (as the sum of water vapour and ice water), and cloud frequency, respectively, all spatially averaged above 400 hPa and over cloudy and cloud-free model grid boxes.
The above analysis is based on globally averaged values, but large regional variations can be expected. This is because of the uneven geographical distribution of aviation soot and other INPs (Figs. 4 and S1) and of cirrus clouds but also because of the large spatial variations in the vertical velocity simulated by the model, as shown in Fig. 2. As discussed above, the latter effect is particularly important, as it controls the prevalence of homogeneous over heterogeneous ice formation regimes (Fig. 3e, f) and therefore the properties of natural cirrus clouds. The regional variations of the aviation soot RF are depicted in Fig. 7, where the RF effect is separated into three different latitude bands, namely southern extra-tropics (SH-Ext, 30–90∘ S), tropics (Trop, 30∘ S–30∘ N), and northern extra-tropics (NH-Ext, 30–90∘ N), and compared to the global values as presented in Fig. 5. For high nucleation efficiencies (Scrit=1.2; Fig. 7a, d, g), the net cooling effect is common to all regions and particularly strong in the Northern Hemisphere, where the aviation traffic is most intense, and aviation soot shows the largest values of mass and number concentrations (Fig. 4). This cooling effect in the northern extra-tropics decreases gradually with decreasing ice nucleation efficiency Scrit. For low efficiencies (Scrit=1.4; Fig. 7c, f, i), the warming effect from the southern extra-tropics and tropics dominates and results in a global warming effect. A reason for this pattern could be the smaller mean vertical velocities and the relatively clean background compared to the Northern Hemisphere. The additional aviation-emitted soot in this region could lead to enhanced heterogeneous nucleation and, due to the smaller cooling rates, to less homogeneous freezing, thus strengthening the negative Twomey effect.
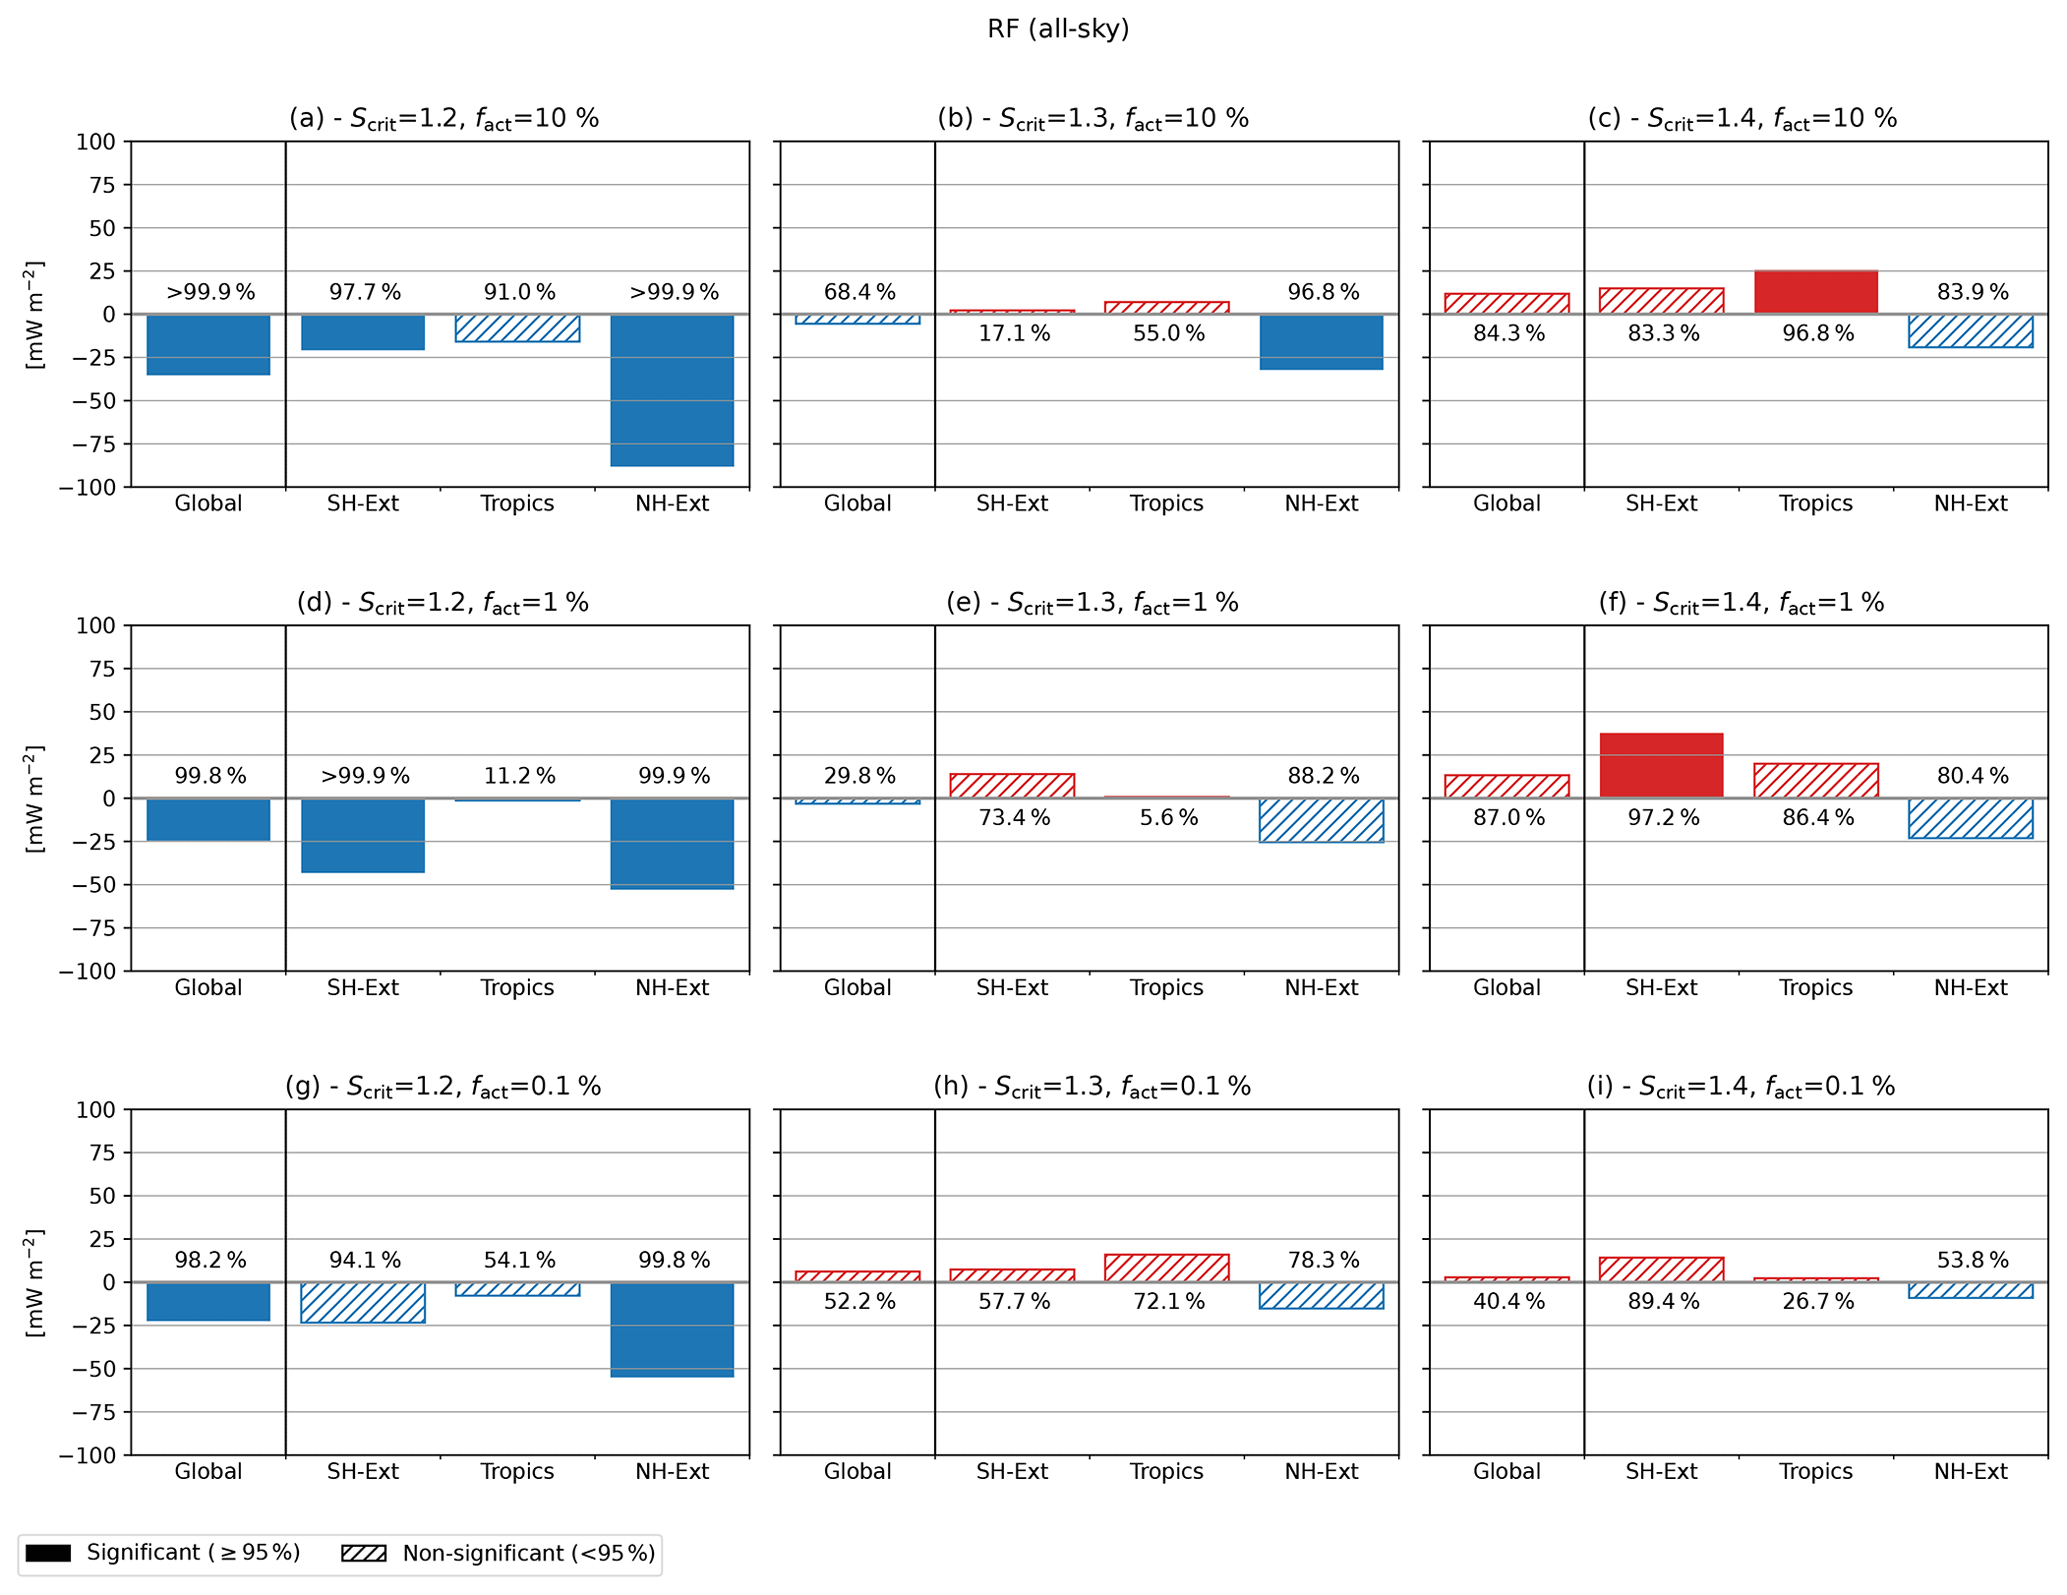
Figure 7As in Fig. 5 but averaged over different regions. Each of the panels (a–i) corresponds to a given assumption for ice nucleation efficiency of aviation soot particles (Scrit and fact) as shown on the top. The values above or below each bar indicate the confidence level. Significant and non-significant results are further marked using filled and hatched bars, respectively. To facilitate the comparison, the bar in the left box in each panel shows the global RF values as in Fig. 5.
As above, decomposing the RF effect into its different parts helps to disentangle the physical reasons for these aviation-induced effects on the RF. This is shown in Figs. S2–S6 in the Supplement. The warming effect in the shortwave (Fig. S2) is characterized by a very noisy pattern, with a prevalence of strong local warming effects especially in the northern extra-tropics, although the generally low confidence level (<90 %) of the results hampers the identification of coherent patterns. The low values of the clear-sky RF (Fig. S4) confirm the dominance of cloud effects in the shortwave. The longwave effect (Fig. S3) shows a distinct and strong cooling over the continental regions of the northern extra-tropics, especially at high fact, with a slight dependency on Scrit. This pattern very closely matches the one of the homogeneous freezing fraction (Fig. 3f): in these regions, homogeneous ice formation is therefore expected to dominate the total ICNC, while aviation soot can effectively compete against this process for the available water vapour. Its impact appears to be very effective regardless of the critical supersaturation, as long as the latter remains below the homogeneous freezing threshold, and a sufficient fraction (i.e. 10 %) of aviation soot particles can be active as INPs. The consequence of this is a marked decrease in the cloud frequency (Fig. S6), which then results in the reduced longwave warming. Of course, the shortwave radiation component (Fig. S2) is also affected and indeed shows a warming over the continents, but the signal is very noisy and not as evident as in the longwave. A possible explanation for this could be that other shortwave forcers like low-level clouds are contributing to the model variability, hence enhancing the noise, while in the longwave, the cloud radiative effects are mostly due to cirrus clouds only. At high nucleation efficiencies (Scrit=1.2), a significant cooling is also evident in the clear-sky longwave RF (Fig. S5), with a pretty uniform distribution in the extra-tropics, possibly due to a dehydration effect leading to a reduction in water vapour concentration and a resulting decrease in water-vapour-induced warming. The clear-sky longwave effect rapidly disappears at higher Scrit, and in the northern extra-tropics it turns to a warming, thus contributing to the decrease of the RF with Scrit in this region.
The results of our simulations show therefore that the largest (in absolute terms) and most statistically significant effect is simulated for large efficiencies of aviation soot, i.e. Scrit=1.2 and fact=10 %, resulting in a cooling effect of −35 mW m−2. Good nucleation abilities for aircraft soot (Scrit≃1.2) could be considered realistic for soot particles undergoing cloud preprocessing, for example, in contrails. Laboratory measurements (Mahrt et al., 2020) show, however, that only large soot particles with a diameter above ∼400 nm may gain improved ice nucleation abilities resulting from such a preprocessing effect, but particles of this size are rare in the upper troposphere. Considering the measured size distribution by Petzold et al. (1999) as in Sect. 3, one can estimate the fraction of particles with diameter larger than 400 nm to be of the order of 0.001 %, i.e. 2 orders of magnitude below the lowest fact considered in this study (0.1 %). The parameters measured by Petzold et al. (1999) refer to a young plume, so ageing processes and soot aggregation within contrails might contribute to the increase of the fraction of larger particles in the population, but it is unlikely that a significant fraction of aviation soot will end up in the size range where preprocessing is effective, as also confirmed by aircraft measurements of ice residuals in cirrus and contrail cirrus (Voigt et al., 2017).
Our results generally point towards a relatively small aviation soot–cirrus effect, of the order of tens of milliwatts per square metre (mW m−2; in absolute terms), with statistically non-significant figures in several cases. This is in contrast with the estimates by Zhou and Penner (2014), Penner et al. (2018), and Zhu and Penner (2020), who reported larger effects, of the order of hundreds of milliwatts per square metre (in absolute terms), also testing various assumptions on the ice nucleation abilities of aviation soot and experimenting with different parametrizations for ice nucleation. Due to the high complexity of the involved models and the coupling between their different components (aerosol, clouds, radiation, and dynamics), it is challenging to track down the reasons for this disagreement, which could be due not only to different models' schemes and parametrizations, but also to the diverse configurations and tuning approaches. For example, Gettelman and Chen (2013) used a similar model (CAM5) to the aforementioned studies but found no statistically significant effect of aviation soot on natural cirrus clouds, thus being more consistent with the results presented here. McGraw et al. (2020) used a model version from the same family (CESM2, which is based on CAM6 for the atmospheric component), also concluding that the impact of aviation soot is not statistically significant. This was also the case in Hendricks et al. (2011), who used an ECHAM-based global climate model (GCM) as the present one and the same cirrus cloud parametrization, albeit with different aerosol and cloud microphysical schemes. Kärcher et al. (2021) also argued against large RF effects from aviation soot–cirrus interactions, pointing to the limitations of global models in representing key processes as a possible reason for overestimated effects. In conclusion, a consensus among modelling groups on the aviation soot–cirrus effect is still lacking, and future research should consider working towards a concept for a model intercomparison study with common assumptions and detailed analyses of the differences among model configurations and tuning approaches.
We finally recall that the sensitivity experiments conducted in this section are focusing on the ice nucleation abilities of aviation soot, while the properties of background soot (i.e. soot originating from other anthropogenic and biomass burning sources) are not varied and are assumed to be Scrit=1.4 and fact=0.25 % as in Hendricks et al. (2011) (see also Sect. 3). As a further sensitivity study, we perform two simulations assuming Scrit=1.2 for background soot (simulations BASE-BG12 and S12F10-BG12; see Table 1). This experiment pair results in an aviation soot–cirrus effect of −25.7 mW m−2 (99.2 % confidence level), which is lower (in absolute term) than the corresponding case calculated above with Scrit=1.4 for background soot (and Scrit=1.2 for aviation soot in both cases). This was to be expected, since increasing the ice nucleation abilities of background soot enhances the competition with aviation soot and the other INPs for available water vapour, thus reducing the impact of aviation soot on natural cirrus clouds. The properties of background INPs could therefore be a further source of uncertainties for the aviation soot–cirrus effect and will be the subject of a companion study.
4.3 Dependency of the aviation soot–cirrus effect on the model representation of the vertical velocity
Besides the ice-nucleating properties of soot, another major source of uncertainties in model studies attempting to quantify the climate impact of aviation on cirrus clouds is the representation of vertical velocities. In the cirrus parametrization adopted here (Kärcher et al., 2006), the vertical velocity is a key parameter, as it controls the critical supersaturation, the competition between homogeneous and heterogeneous freezing (Fig. 3e, f), and the nucleation rate in cirrus clouds. Ice formation in cirrus clouds is strongly influenced by small-scale updrafts, of the order of 1–10 cm s−1 (Barahona et al., 2017), but due to their coarse spatial resolution, global models are not able to represent such phenomena in sufficient detail, and rough approximations are usually introduced to account for them. As explained in Sect. 3, in the EMAC-MADE3 configuration adopted here, the subscale vertical velocity is accounted for by adding an extra-term proportional to the square root of the turbulent kinetic energy to the large-scale, grid box mean, vertical velocity. In the vicinity of mountain ranges, this term is replaced by the contribution of orographic waves to small-scale fluctuations in the vertical velocity, based on the parametrization by Joos et al. (2008), which could lead to stronger updraft of the order of several tens of centimetres per second.
To further explore the limitations behind this approach and their possible impact on the estimated aviation-cirrus effects presented in Sect. 4.2, we perform an additional set of sensitivity experiments, prescribing a geographically uniform constant vertical velocity in the range from 2 to 50 cm s−1. Such an assumption is of course not realistic, but the goal here is not to provide a refined estimate on the aviation soot–cirrus effect but rather to understand the role of dynamic forcing in the results and hence to estimate the uncertainties associated with the RF effects quantified in the previous section. A prescribed constant uniform field allows, for example, regions of the world to be explored which could be important for the cirrus effect but where the model does not simulate a sufficiently strong updraft for ice formation to occur. Due to the large amount of computational resources required, we restrict this sensitivity analysis to a single pair of assumptions for the ice nucleation abilities of aviation soot. To facilitate the analysis, we select the case Scrit=1.2 and fact=10 %, which is more likely to return statistically significant results, as demonstrated in Fig. 5.
The simulated aviation soot–cirrus effect as a function of different prescribed vertical velocities is depicted in Fig. 8 (global averages) and Fig. 9 (zonal profiles) for RF (and its different components) and other relevant cloud properties, whereas Fig. S7 depicts the geographical distributions of the same quantities. The all-sky RF (Fig. 8a) remains negative for all explored values of the prescribed vertical velocity. The aviation soot–cirrus RF for a prescribed vertical velocity of 2 cm s−1 (simulation S12F10-V2) is −35.9 mW m−2, very close to the value of −35.4 mW m−2 obtained with the parametrized vertical velocity (simulation S12F10). This suggests that the aviation effect discussed in this study is mostly controlled by small updrafts of a few centimetres per second. The RF is significantly larger, around −60 mW m−2, for larger prescribed vertical velocities, except at 10 cm s−1, where a smaller value is simulated. This behaviour results from the combination of the shortwave (Fig. 8b) and longwave (Fig. 8c) all-sky RF, both increasing in absolute terms to a maximum value at 20 cm s−1 and significantly dropping above that value. This trend also characterizes the longwave clear-sky RF (Fig. 8e), which grows towards larger values with increasing vertical velocity and switches from cooling to warming at 20 cm s−1, while the shortwave clear-sky RF (Fig. 8d) is generally small across the explored range of vertical velocities. The zonal profiles (Fig. 9) reveal that the aviation effect is particularly large in the northern extra-tropics, consistent with the distribution of aviation soot particles (Fig. 4) and with the largest values above the North Atlantic, Europe, and the western United States, especially for larger vertical velocities (Fig. S7). The zonal profiles (in particular Fig. 9h) show that the change of sign in the longwave clear-sky RF for v>20 cm s−1 is driven by an increase in total water in the northern extra-tropics. Aviation-induced changes in ICNC (Fig. 9g) and cloud frequency (Fig. 9i) show a similar behaviour, with the strongest effects simulated at v=20 cm s−1. At larger vertical velocities, homogeneous freezing becomes very effective and rapidly consumes the available supersaturated water vapour, so that heterogeneously formed ice crystals have less time to grow to larger sizes, and the sedimentation process becomes less effective. As shown in Figs. 8f and 9f, the aviation-induced reduction of the homogeneous freezing fraction is significantly smaller at v≳20 cm s−1. As a consequence, in this somewhat extreme regime, the impact of aviation soot on the main cloud variables (Figs. 8f–i and 9f–i) loses importance and results in smaller aviation-induced changes in the radiative fluxes (Figs. 8b–e and 9b–e), although their combined effect remains large (Fig. 8a). For the same reason, also the dehydration effect, which we found to induce a pretty strong clear-sky cooling in the longwave (Sect. 4.2), becomes less effective at higher vertical velocities and explains the change of sign at v=20 cm s−1 in Fig. 8e.
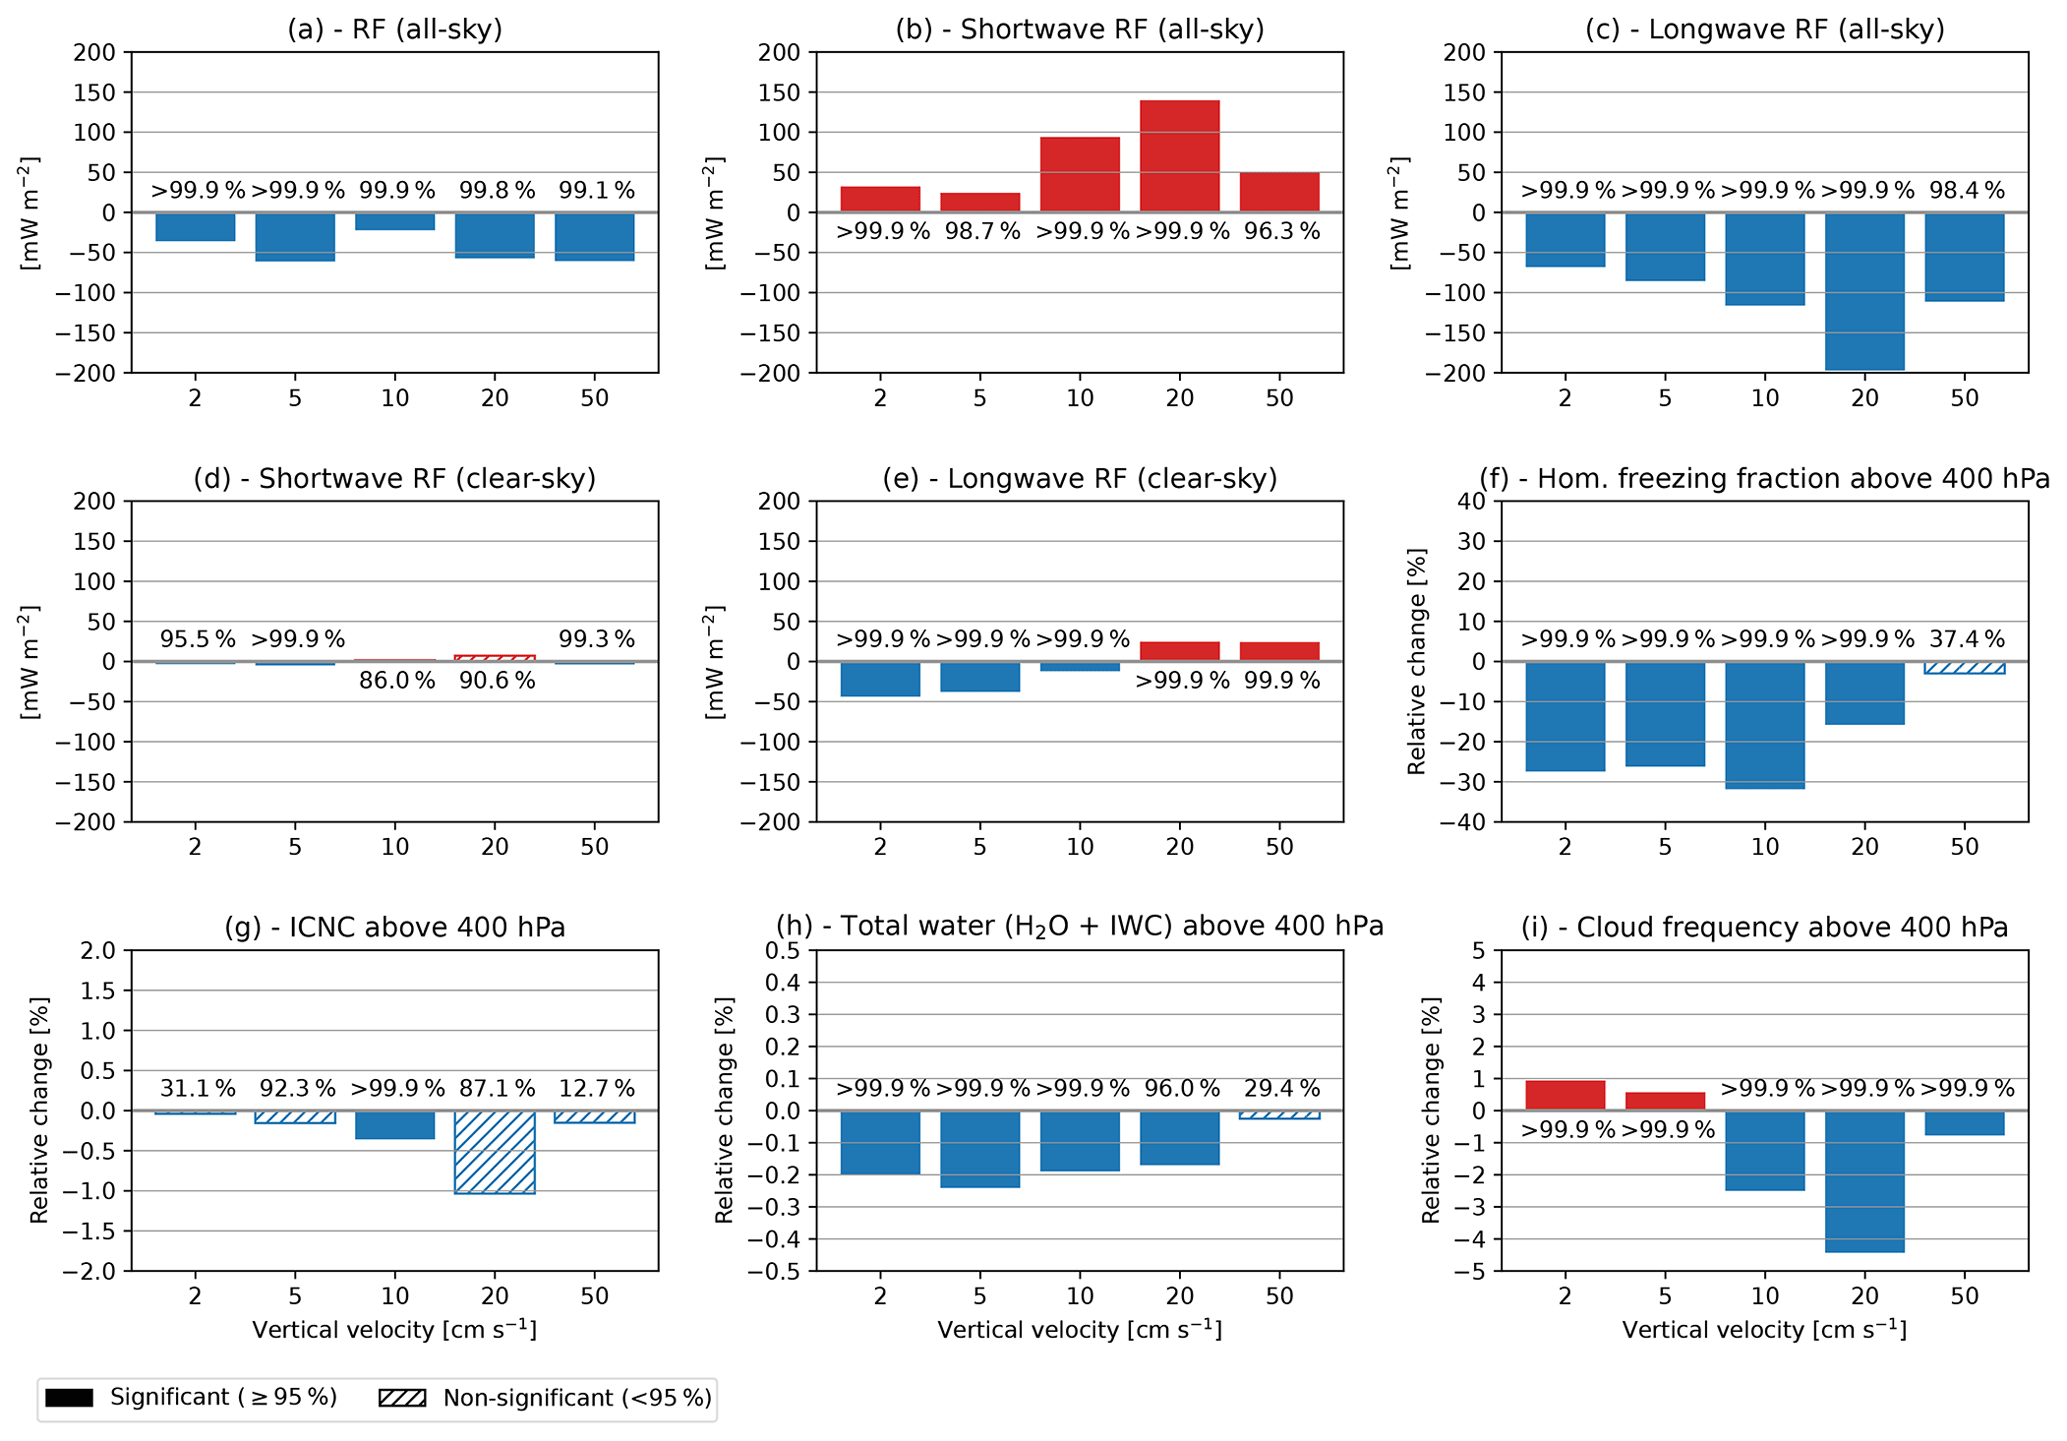
Figure 8Multi-year average (2005–2015) top-of-the-atmosphere (a) all-sky, (b) all-sky shortwave, (c) all-sky longwave, (d) clear-sky shortwave, and (e) clear-sky shortwave RF due to the effect of aviation soot on natural cirrus clouds, for different values of the vertical velocity. Panels (f–i) depict the aviation-soot-induced relative changes in ICNC from homogeneous freezing, ICNC, total water (as the sum of water vapour and ice water), and cloud frequency, respectively, all spatially averaged above 400 hPa and over cloudy and cloud-free model grid boxes. The values above or below each bar indicate the confidence level. Significant and non-significant results are further marked using filled and hatched bars, respectively.
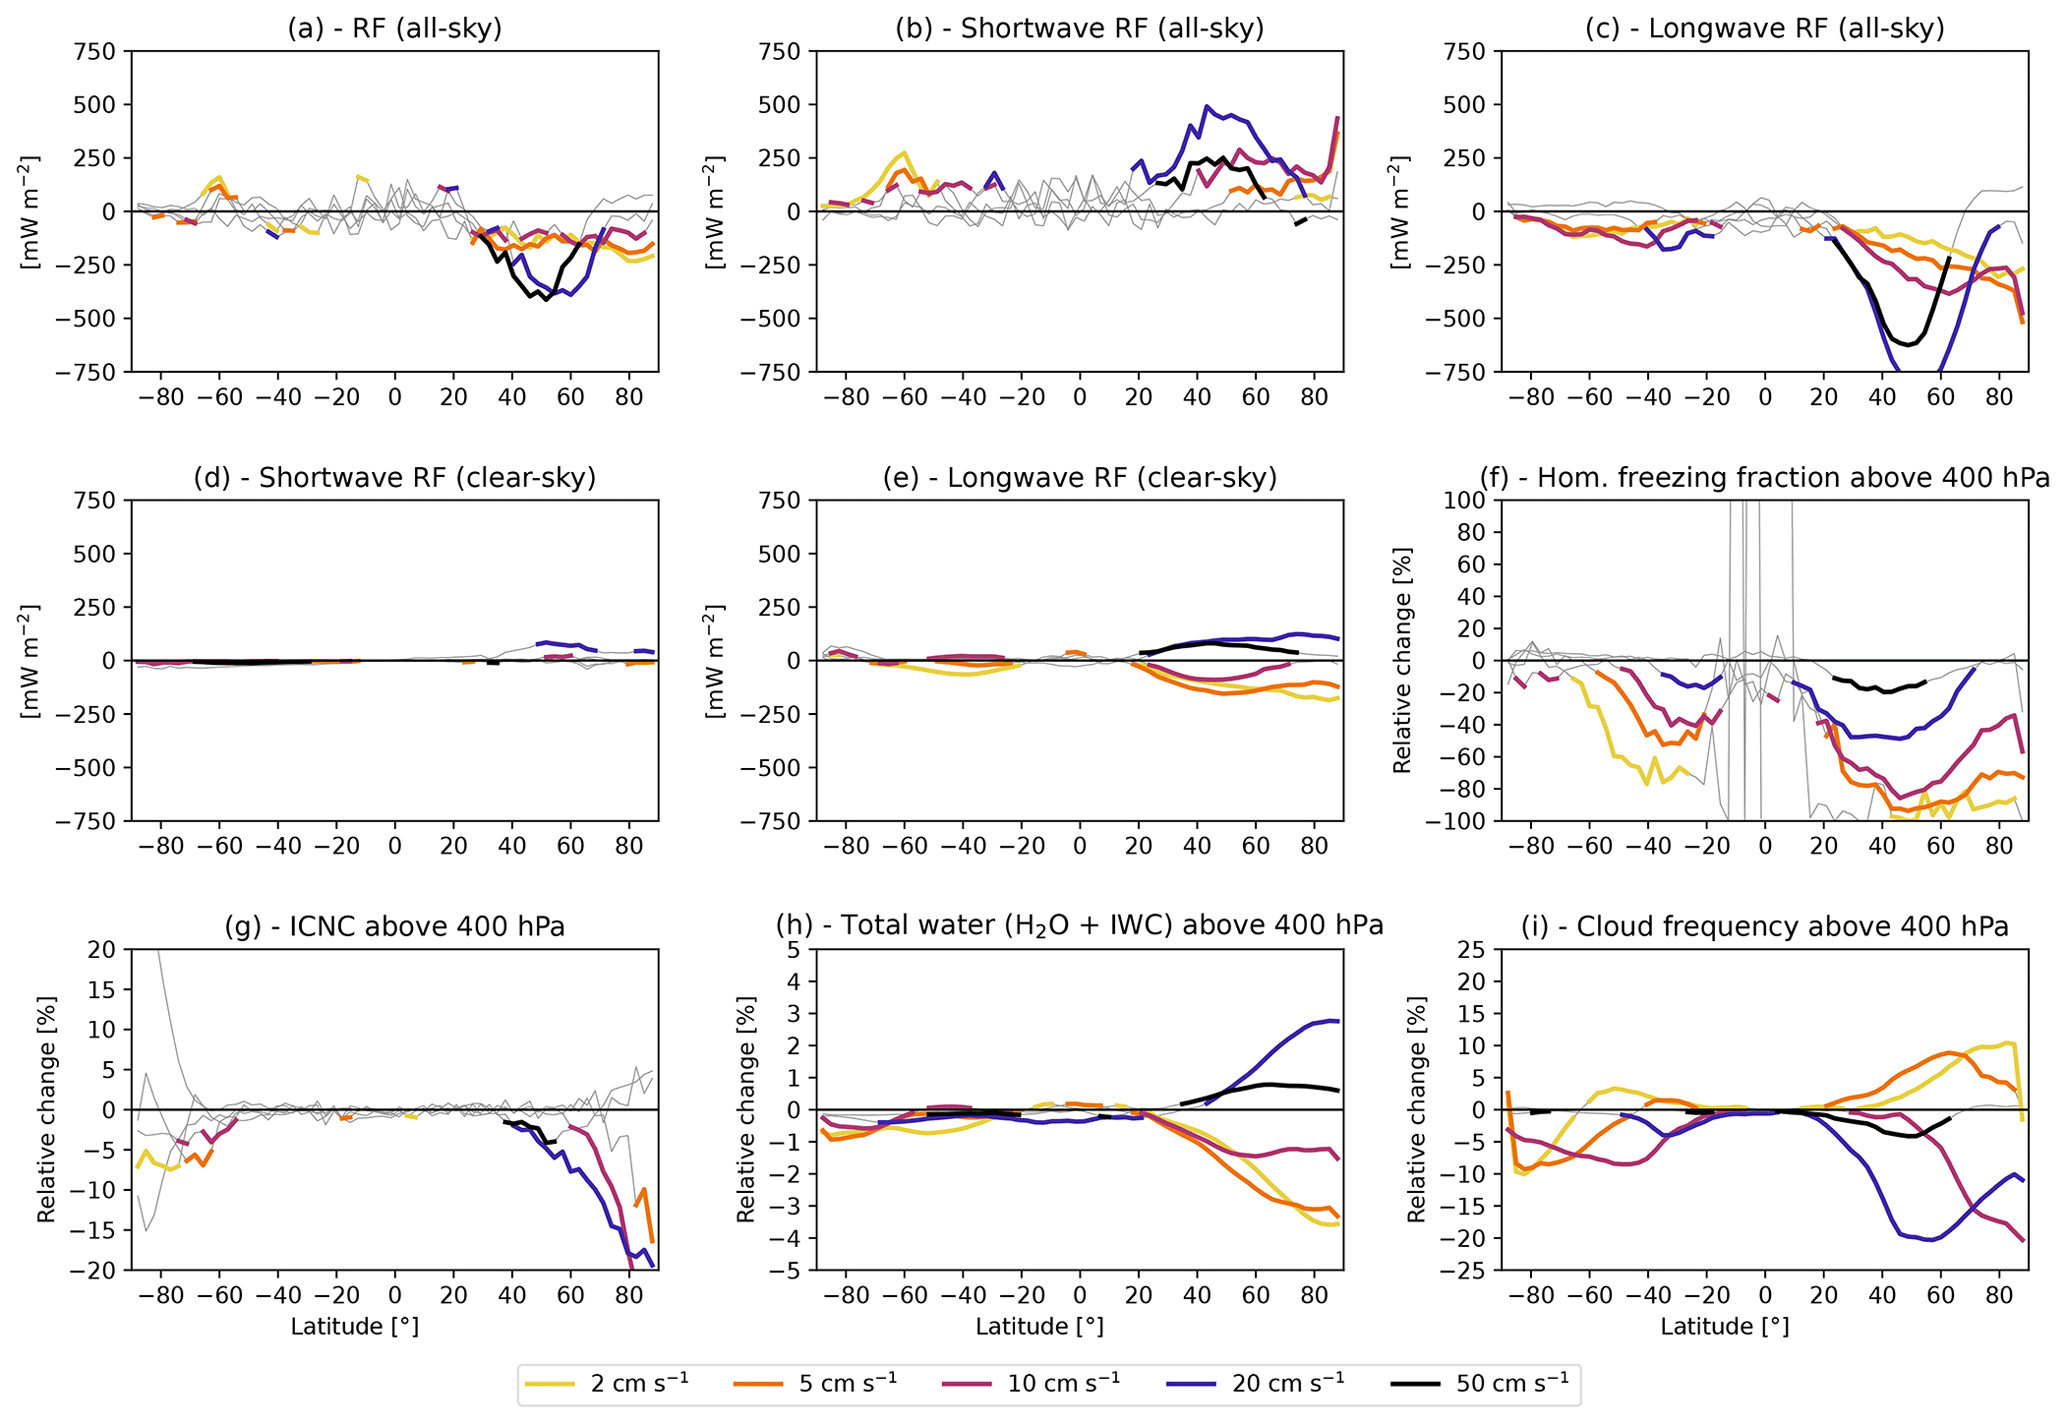
Figure 9As Fig. 8 but showing zonal averages. Values with a statistical significance below 95 % are drawn in grey.
The sensitivity simulations analysed in this subsection confirm that the model dynamics and the representation of the vertical velocity play an essential role in the microphysics of cirrus clouds. Even relatively small updrafts of a few centimetres per second can induce large changes in the properties of cirrus clouds perturbed by aviation emissions, and the resulting estimates on the climate impact are equally sensitive to the subscale fluctuations in the vertical velocity as to the ice-nucleating properties of aviation soot particles. Our sensitivity experiments further show that the vertical velocity mostly controls the magnitude of the aviation soot–cirrus effect, while the ice-nucleating properties of aviation soot also act on the sign. Both components still represent the largest source of uncertainties for all modelling studies attempting to estimate the climate impact of aviation soot on natural cirrus clouds.
4.4 Impact of nudging
All the results discussed so far refer to model simulations performed in nudged mode, i.e. relaxing meteorological variables (temperature, divergence, vorticity and surface pressure) towards reanalysis data. This approach has been chosen in order to maximize the chances to obtain statistically significant results for the small climate effects and RFs investigated here, and it is a common practice in this kind of study. This technique ensures that the simulations to be compared (in this case with and without aviation effect on cirrus) are characterized by a similar synoptic situation. Due to the chaotic nature of the climate system, this is not the case when running the model in free (climate) mode, as each experiment will develop its own meteorology, which hinders the isolation of the effect of a small perturbation such as the one represented by the impact of aviation soot on cirrus clouds. However, nudging is known to have an impact on simulated temperature profiles (Schultz et al., 2018), in turn affecting the heating rates and all kinds of radiative adjustments in the atmosphere, which implies a potential influence on the effective RF of the climate perturbation under consideration (e.g. Forster et al., 2016; Johnson et al., 2019). In an attempt to characterize the impact of nudging on our results, we repeat the BASE, S12F10, and S14F10 simulations in free-running mode (BASE-FREE, S12F10-FREE, and S14F10-FREE, respectively) and in nudged mode but without relaxing temperature (BASE-FREE-T, S12F10-FREE-T, and S14F10-FREE-T, respectively; see Table 1). In these simulations, short-term feedbacks on temperature (and in the FREE case on other dynamical quantities) can freely evolve. To establish climate conditions comparable to the years modelled in the nudged simulations, SST and SIC are prescribed in both sets: the FREE-T experiments use SST and SIC from the ERA-Interim reanalysis (i.e, the same dataset used for nudging winds and surface pressure), while in the FREE ones climatological means of the 2000–2009 period from the Met Office Hadley Centre dataset (HadISST; Rayner et al., 2003) are used. To increase the chance of obtaining a statistically significant result, the FREE simulations are performed on a longer time period (30 years), while the FREE-T ones cover the same 15-year period as the nudged case.
The resulting all-sky RFs from the aviation soot–cirrus effect are compared in Fig. 10 for the three configurations (nudged, nudged without temperature and free) and the two values of the Scrit parameter. As expected, the free-running simulations are characterized by a much larger statistical noise, which prevents any robust and statistically significant conclusion being drawn on the investigated effect and supports our choice for a nudged configuration. The results of the nudged experiments are, however, consistent with the free-running ones, since they lie within the uncertainty ranges. The two nudging methods (with and without temperature) are highly consistent for Scrit=1.2, which further supports the robustness of the results discussed in this work, although a feedback of temperature nudging on the dynamics cannot be excluded. For Scrit=1.4, the two nudging methods show RFs with opposite sign, although both are statistically non-significant at the 95 % confidence level; therefore no conclusions can be drawn in this case. Nevertheless, this sensitivity study confirms the main conclusions of this work, that large aviation soot–cirrus effects can be simulated only under the assumptions of good ice nucleation ability of aviation soot particles (Scrit=1.2).
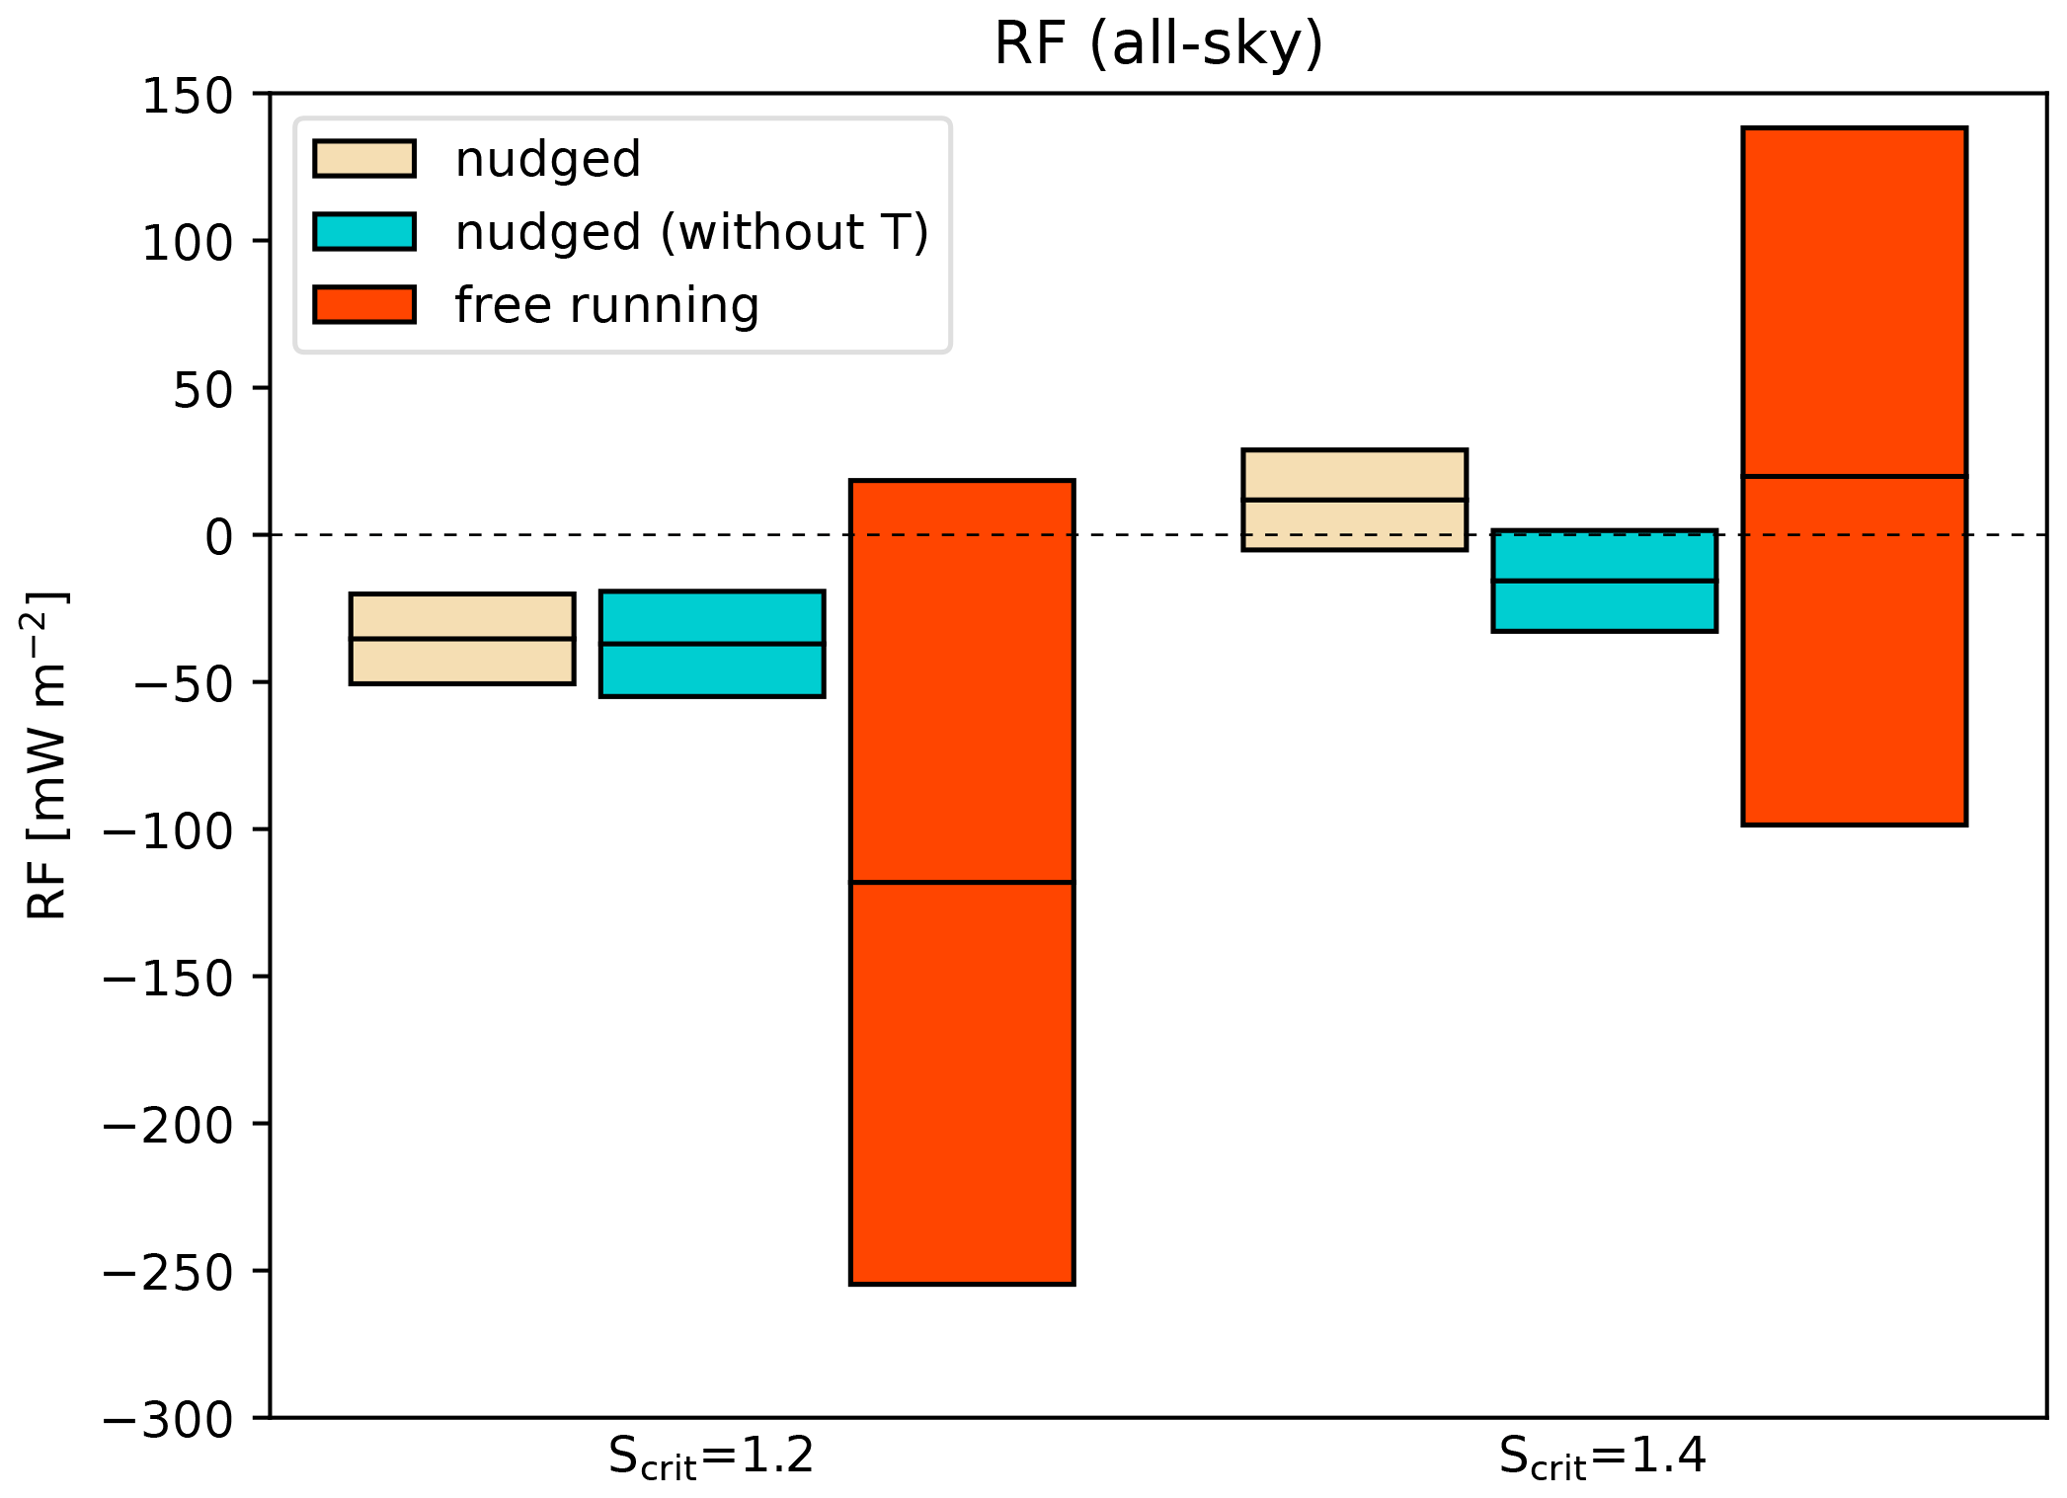
Figure 10Multi-year average top-of-the-atmosphere all-sky RF due to the effect of aviation soot on natural cirrus clouds, under different model configurations: nudged, nudged without relating temperature, and free-running. The latter configuration covers a period of 30 years, while the nudged ones cover 15 years. The horizontal line at the centre of each box is the average value, and each box spans the 95 % confidence interval. Values are shown for Scrit=1.2 and Scrit=1.4, in both cases assuming fact=10 %. Note that for the free-running experiments, the confidence levels are calculated using Welch's t test instead of a paired-sample t test as in the nudged ones.
In this work, we applied the EMAC-MADE3 global aerosol climate model coupled with a cloud microphysical scheme to quantify the impact of aviation soot on natural cirrus clouds and to estimate the uncertainties in this effect due to the assumptions on the ice-nucleating properties of aviation and background soot particles and on the representation of vertical updrafts in the model. According to our model simulations, the aviation soot–cirrus effect is in the range of −35 to 13 mW m−2 (with a confidence level >99.9 % and 87 %, respectively) depending on the assumptions on the critical ice saturation ratio and on the fraction of active INPs for aviation soot. Further sensitivity experiments performed with a prescribed, geographically uniform, vertical velocity suggest that the uncertainties in the model representation of vertical updrafts and the resulting cooling rates can add a factor of ≲2 to the estimated effect, although this has been tested only for a specific case corresponding to high nucleation efficiency of aviation soot (Scrit=1.2 and fact=10 %). For comparison, the estimated effective RFs of the main climate forcers from aviation reported in the recent assessment by Lee et al. (2021) are 34.3 mW m−2 (CO2), 57.3 mW m−2 (contrail cirrus), and 17.5 mW m−2 (NOx), with the total aviation effect amounting to 110.9 mW m−2. Therefore, the aviation soot–cirrus effect quantified here potentially represents an important contribution to the aviation climate impact.
Our results partly support the findings of Liu et al. (2009), who also reported a change of sign in the aviation soot–cirrus effect from negative to positive when increasing the critical saturation ratio from 1.2–1.3 to 1.4, although our RF values are considerably smaller, possibly due to the much lower active fraction assumed in this study: 0.1 %–10 % compared to 100 %. Systematically larger negative RFs are also found by the studies of Penner et al. (2009), Zhou and Penner (2014), Penner et al. (2018), and Zhu and Penner (2020), all assuming generally good ice nucleation abilities for aviation soot. Our study therefore agrees with these in terms of the sign of aviation soot effect, but there is a clear disagreement in the magnitude. This could be due to the details of the cloud microphysical parametrizations, to differences in the model setups (e.g. in the use of nudging), or to the representation of the vertical velocity, which can have a large impact on the resulting effects, as shown by our idealized sensitivity experiments. The model setup adopted here is very close to the one used in Hendricks et al. (2011), who used a similar base model (ECHAM4) and the same cirrus parametrization (Kärcher et al., 2006). They nevertheless found a non-significant impact of aviation soot on natural cirrus clouds, which can possibly be ascribed to the use of a free-running model setup in that study, while the nudging mode used here likely helped to extract a statistically significant information from the model. Non-significant results were also found by Gettelman and Chen (2013) and, more recently, by McGraw et al. (2020). We note that for RFs of the considered magnitude, a statistically significant signal quantification is only possible with simulations using the nudging technique, although it is not completely clear how strong this procedure may impact the resulting effective RF values.
This work helps to disentangle and quantify the main uncertainties in the aviation soot–cirrus effect, but its actual magnitude (and to a lesser extent also its sign) remain uncertain. Our model simulations show that a more precise characterization of the ice-nucleating properties of aviation soot could help to constrain at least the sign of the resulting RF. Further laboratory measurements are therefore needed, in particular concerning the role of cloud processing. In situ measurements are also essential, in order to characterize the microphysical properties of the population of aviation soot, like number and size. Recent advancements in the representation of soot-induced ice formation in cirrus clouds (Kärcher et al., 2021; Marcolli et al., 2021) should also be considered for implementation in global model parametrizations. Further on the modelling side, increasing the models intercomparability, for example, by performing commonly designed experiments in the context of an intercomparison exercise, would provide valuable insights on the results and could help interpret the model diversity in better detail. In addition to the CMIP activities (Eyring et al., 2016; Collins et al., 2017), notable examples of the advantages of such exercises are provided by the AeroCom community (e.g. Schulz et al., 2006; Quaas et al., 2009; Mann et al., 2014; Samset et al., 2014, see also https://aerocom.met.no/), last access: 26 November 2021.
The EMAC-MADE3 model adopted here was shown to provide a satisfactory representation of aerosol, aerosol-induced ice formation in cirrus, and overall cloud and radiation properties, but biases still exist. The model tends to overestimate the ice crystal number concentration in cirrus clouds at higher cirrus temperatures (≳225 K). Hence, the contribution of cirrus clouds formed in situ by heterogeneous and/or homogeneous ice nucleation and cirrus clouds resulting from transport of ice from the mixed phase (e.g. via detrainment from convective clouds) should be further explored. Moreover, the cirrus parametrization by Kärcher et al. (2006) implemented in EMAC-MADE3 has some known limitations which should be addressed in future versions of the model, for example, replacing critical supersaturation with an activation spectrum following the change in the active INP population with increasing supersaturation and considering the effects of particle size and coating on the soot nucleation process. The representation of background aerosol like soot and mineral dust was already demonstrated to be quite good by Kaiser et al. (2019), Righi et al. (2020), and Beer et al. (2020). Nevertheless, improvements are still possible, especially with the support of in situ measurements. The inclusion of additional background INP types, such as ammonium sulfate and glassy organics, in the model should also be considered, as this might change the outcome of the competition for available supersaturated water vapour among the different INPs, with possible impacts on the aviation soot effect estimated in this work.
MESSy is continuously developed and applied by a consortium of institutions. The usage of MESSy and access to the source code is licensed to all affiliates of institutions which are members of the MESSy Consortium. Institutions can become members of the MESSy Consortium by signing the MESSy Memorandum of Understanding. More information can be found on the MESSy Consortium website (http://www.messy-interface.org, last access: 3 March 2021) (MESSy, 2021). The model configuration discussed in this paper has been developed based on version 2.54 and will be part of the next EMAC release (version 2.55). The exact code version used to produce the result of this paper is archived at the German Climate Computing Centre (DKRZ) and can be made available to members of the MESSy community upon request. The output of the model simulations discussed in this work is available at https://doi.org/10.5281/zenodo.5146195 (Righi, 2021).
The supplement related to this article is available online at: https://doi.org/10.5194/acp-21-17267-2021-supplement.
MR conceived the study, designed and performed the simulations, analysed the data, and wrote the paper. JH conceived the study and contributed to the model configuration, to the interpretation, and to the text. CB contributed to parts of the model code and configuration, to the interpretation, and to the text.
The contact author has declared that neither they nor their co-authors have any competing interests.
Publisher’s note: Copernicus Publications remains neutral with regard to jurisdictional claims in published maps and institutional affiliations.
This article is part of the special issue “The Modular Earth Submodel System (MESSy) (ACP/GMD inter-journal SI)”. It is not associated with a conference.
We are grateful to Marius Bickel and Patrick Jöckel (DLR, Germany) for contributing to the model improvements in the EMAC version used for this study. This paper has greatly benefited from helpful discussions with Ulrike Burkhardt, Klaus Gierens, Michael Ponater (DLR, Germany), Ulrike Lohmann, and Colin Tully (ETH, Switzerland) and from the comments by Andrew Gettelmann (NCAR, USA) and an anonymous referee. The model simulations and data analysis for this work used the resources of the Deutsches Klimarechenzentrum (DKRZ) granted by its Scientific Steering Committee (WLA) under project ID bd0080.
This study was supported by the DLR aviation research
programme (Eco2Fly project), by the DLR transport research programme (TraK
project), by the DLR space research programme (MABAK project), and by the
European Commission via their Horizon 2020 Research and Innovation Programme (ACACIA project (grant no. 875036)).
The article processing charges for this open-access publication were covered by the German Aerospace Center (DLR).
This paper was edited by Xiaohong Liu and reviewed by Andrew Gettelman and two anonymous referees.
Barahona, D. and Nenes, A.: Parameterizing the competition between homogeneous and heterogeneous freezing in ice cloud formation – polydisperse ice nuclei, Atmos. Chem. Phys., 9, 5933–5948, https://doi.org/10.5194/acp-9-5933-2009, 2009. a
Barahona, D., Molod, A., and Kalesse, H.: Direct estimation of the global distribution of vertical velocity within cirrus clouds, Sci. Rep., 7, 1, https://doi.org/10.1038/s41598-017-07038-6, 2017. a
Beer, C. G., Hendricks, J., Righi, M., Heinold, B., Tegen, I., Groß, S., Sauer, D., Walser, A., and Weinzierl, B.: Modelling mineral dust emissions and atmospheric dispersion with MADE3 in EMAC v2.54, Geosci. Model Dev., 13, 4287–4303, https://doi.org/10.5194/gmd-13-4287-2020, 2020. a
Bellouin, N., Quaas, J., Gryspeerdt, E., Kinne, S., Stier, P., Watson-Parris, D., Boucher, O., Carslaw, K. S., Christensen, M., Daniau, A.-L., Dufresne, J.-L., Feingold, G., Fiedler, S., Forster, P., Gettelman, A., Haywood, J. M., Lohmann, U., Malavelle, F., Mauritsen, T., McCoy, D. T., Myhre, G., Mülmenstädt, J., Neubauer, D., Possner, A., Rugenstein, M., Sato, Y., Schulz, M., Schwartz, S. E., Sourdeval, O., Storelvmo, T., Toll, V., Winker, D., and Stevens, B.: Bounding Global Aerosol Radiative Forcing of Climate Change, Rev. Geophys., 58, 1, https://doi.org/10.1029/2019rg000660, 2020. a
Bennartz, R. and Rausch, J.: Global and regional estimates of warm cloud droplet number concentration based on 13 years of AQUA-MODIS observations, Atmos. Chem. Phys., 17, 9815–9836, https://doi.org/10.5194/acp-17-9815-2017, 2017. a
Bock, L. and Burkhardt, U.: The temporal evolution of a long-lived contrail cirrus cluster: Simulations with a global climate model, J. Geophys. Res.-Atmos., 121, 3548–3565, https://doi.org/10.1002/2015jd024475, 2016. a
Burkhardt, U. and Kärcher, B.: Global radiative forcing from contrail cirrus, Nat. Clim. Change, 1, 54–58, https://doi.org/10.1038/nclimate1068, 2011. a
Carslaw, K. S., Lee, L. A., Reddington, C. L., Pringle, K. J., Rap, A., Forster, P. M., Mann, G. W., Spracklen, D. V., Woodhouse, M. T., Regayre, L. A., and Pierce, J. R.: Large contribution of natural aerosols to uncertainty in indirect forcing, Nature, 503, 67–71, https://doi.org/10.1038/nature12674, 2013. a
Chen, C.-C. and Gettelman, A.: Simulated radiative forcing from contrails and contrail cirrus, Atmos. Chem. Phys., 13, 12525–12536, https://doi.org/10.5194/acp-13-12525-2013, 2013. a
Chen, T., Rossow, W. B., and Zhang, Y.: Radiative Effects of Cloud-Type Variations, J. Climate, 13, 264–286, https://doi.org/10.1175/1520-0442(2000)013<0264:reoctv>2.0.co;2, 2000. a, b
Chou, C., Kanji, Z. A., Stetzer, O., Tritscher, T., Chirico, R., Heringa, M. F., Weingartner, E., Prévôt, A. S. H., Baltensperger, U., and Lohmann, U.: Effect of photochemical ageing on the ice nucleation properties of diesel and wood burning particles, Atmos. Chem. Phys., 13, 761–772, https://doi.org/10.5194/acp-13-761-2013, 2013. a
Collins, W. J., Lamarque, J.-F., Schulz, M., Boucher, O., Eyring, V., Hegglin, M. I., Maycock, A., Myhre, G., Prather, M., Shindell, D., and Smith, S. J.: AerChemMIP: quantifying the effects of chemistry and aerosols in CMIP6, Geosci. Model Dev., 10, 585–607, https://doi.org/10.5194/gmd-10-585-2017, 2017. a
Crawford, I., Möhler, O., Schnaiter, M., Saathoff, H., Liu, D., McMeeking, G., Linke, C., Flynn, M., Bower, K. N., Connolly, P. J., Gallagher, M. W., and Coe, H.: Studies of propane flame soot acting as heterogeneous ice nuclei in conjunction with single particle soot photometer measurements, Atmos. Chem. Phys., 11, 9549–9561, https://doi.org/10.5194/acp-11-9549-2011, 2011. a
Cziczo, D. J., Froyd, K. D., Hoose, C., Jensen, E. J., Diao, M., Zondlo, M. A., Smith, J. B., Twohy, C. H., and Murphy, D. M.: Clarifying the Dominant Sources and Mechanisms of Cirrus Cloud Formation, Science, 340, 1320–1324, https://doi.org/10.1126/science.1234145, 2013. a
Dahlmann, K., Koch, A., Linke, F., Lührs, B., Grewe, V., Otten, T., Seider, D., Gollnick, V., and Schumann, U.: Climate-Compatible Air Transport System–Climate Impact Mitigation Potential for Actual and Future Aircraft, Aerospace, 3, 38, https://doi.org/10.3390/aerospace3040038, 2016. a
Dee, D. P., Uppala, S. M., Simmons, A. J., Berrisford, P., Poli, P., Kobayashi, S., Andrae, U., Balmaseda, M. A., Balsamo, G., Bauer, P., Bechtold, P., Beljaars, A. C. M., van de Berg, L., Bidlot, J., Bormann, N., Delsol, C., Dragani, R., Fuentes, M., Geer, A. J., Haimberger, L., Healy, S. B., Hersbach, H., Hólm, E. V., Isaksen, L., Kållberg, P., Köhler, M., Matricardi, M., McNally, A. P., Monge-Sanz, B. M., Morcrette, J.-J., Park, B.-K., Peubey, C., de Rosnay, P., Tavolato, C., Thépaut, J.-N., and Vitart, F.: The ERA-Interim reanalysis: configuration and performance of the data assimilation system, Q. J. Roy. Meteor. Soc., 137, 553–597, https://doi.org/10.1002/qj.828, 2011. a
Dietmüller, S., Jöckel, P., Tost, H., Kunze, M., Gellhorn, C., Brinkop, S., Frömming, C., Ponater, M., Steil, B., Lauer, A., and Hendricks, J.: A new radiation infrastructure for the Modular Earth Submodel System (MESSy, based on version 2.51), Geosci. Model Dev., 9, 2209–2222, https://doi.org/10.5194/gmd-9-2209-2016, 2016. a
Eyring, V., Righi, M., Lauer, A., Evaldsson, M., Wenzel, S., Jones, C., Anav, A., Andrews, O., Cionni, I., Davin, E. L., Deser, C., Ehbrecht, C., Friedlingstein, P., Gleckler, P., Gottschaldt, K.-D., Hagemann, S., Juckes, M., Kindermann, S., Krasting, J., Kunert, D., Levine, R., Loew, A., Mäkelä, J., Martin, G., Mason, E., Phillips, A. S., Read, S., Rio, C., Roehrig, R., Senftleben, D., Sterl, A., van Ulft, L. H., Walton, J., Wang, S., and Williams, K. D.: ESMValTool (v1.0) – a community diagnostic and performance metrics tool for routine evaluation of Earth system models in CMIP, Geosci. Model Dev., 9, 1747–1802, https://doi.org/10.5194/gmd-9-1747-2016, 2016. a
Feng, L., Smith, S. J., Braun, C., Crippa, M., Gidden, M. J., Hoesly, R., Klimont, Z., van Marle, M., van den Berg, M., and van der Werf, G. R.: The generation of gridded emissions data for CMIP6, Geosci. Model Dev., 13, 461–482, https://doi.org/10.5194/gmd-13-461-2020, 2020. a
Forster, P. M., Richardson, T., Maycock, A. C., Smith, C. J., Samset, B. H., Myhre, G., Andrews, T., Pincus, R., and Schulz, M.: Recommendations for diagnosing effective radiative forcing from climate models for CMIP6, J. Geophys. Res.-Atmos., 121, 12460–12475, https://doi.org/10.1002/2016jd025320, 2016. a
Forster, P. M., Forster, H. I., Evans, M. J., Gidden, M. J., Jones, C. D., Keller, C. A., Lamboll, R. D., Quéré, C. L., Rogelj, J., Rosen, D., Schleussner, C.-F., Richardson, T. B., Smith, C. J., and Turnock, S. T.: Current and future global climate impacts resulting from COVID-19, Nat. Clim. Change, 10, 913–919, https://doi.org/10.1038/s41558-020-0883-0, 2020. a
Fuglestvedt, J., Berntsen, T., Myhre, G., Rypdal, K., and Skeie, R. B.: Climate forcing from the transport sectors, P. Natl. Acad. Sci. USA, 105, 454–458, https://doi.org/10.1073/pnas.0702958104, 2008. a
Gasparini, B. and Lohmann, U.: Why cirrus cloud seeding cannot substantially cool the planet, J. Geophys. Res.-Atmos., 121, 4877–4893, https://doi.org/10.1002/2015jd024666, 2016. a, b
Gettelman, A. and Chen, C.: The climate impact of aviation aerosols, Geophys. Res. Lett., 40, 2785–2789, https://doi.org/10.1002/grl.50520, 2013. a, b, c, d, e, f
Gettelman, A., Chen, C.-C., and Bardeen, C. G.: The climate impact of COVID-19-induced contrail changes, Atmos. Chem. Phys., 21, 9405–9416, https://doi.org/10.5194/acp-21-9405-2021, 2021. a
Gidden, M. J., Riahi, K., Smith, S. J., Fujimori, S., Luderer, G., Kriegler, E., van Vuuren, D. P., van den Berg, M., Feng, L., Klein, D., Calvin, K., Doelman, J. C., Frank, S., Fricko, O., Harmsen, M., Hasegawa, T., Havlik, P., Hilaire, J., Hoesly, R., Horing, J., Popp, A., Stehfest, E., and Takahashi, K.: Global emissions pathways under different socioeconomic scenarios for use in CMIP6: a dataset of harmonized emissions trajectories through the end of the century, Geosci. Model Dev., 12, 1443–1475, https://doi.org/10.5194/gmd-12-1443-2019, 2019. a
Grewe, V., Dahlmann, K., Flink, J., Frömming, C., Ghosh, R., Gierens, K., Heller, R., Hendricks, J., Jöckel, P., Kaufmann, S., Kölker, K., Linke, F., Luchkova, T., Lührs, B., Manen, J. V., Matthes, S., Minikin, A., Niklaß, M., Plohr, M., Righi, M., Rosanka, S., Schmitt, A., Schumann, U., Terekhov, I., Unterstrasser, S., Vázquez-Navarro, M., Voigt, C., Wicke, K., Yamashita, H., Zahn, A., and Ziereis, H.: Mitigating the Climate Impact from Aviation: Achievements and Results of the DLR WeCare Project, Aerospace, 4, 34, https://doi.org/10.3390/aerospace4030034, 2017. a, b
Grewe, V., Matthes, S., and Dahlmann, K.: The contribution of aviation NOx emissions to climate change: are we ignoring methodological flaws?, Environ. Res. Lett., 14, 121003, https://doi.org/10.1088/1748-9326/ab5dd7, 2019. a
Grosvenor, D. and Wood, R.: Daily MODIS (MODerate Imaging Spectroradiometer) derived cloud droplet number concentration global dataset for 2003–2015, Centre for Environmental Data Analysis, available at: https://catalogue.ceda.ac.uk/uuid/cf97ccc802d348ec8a3b6f2995dfbbff, last access: 26 November 2021, 2018. a
Hartmann, D. L., Ockert-Bell, M. E., and Michelsen, M. L.: The Effect of Cloud Type on Earth's Energy Balance: Global Analysis, J. Climate, 5, 1281–1304, https://doi.org/10.1175/1520-0442(1992)005<1281:teocto>2.0.co;2, 1992. a, b
Hegglin, M., Kinnison, D., Lamarque, J.-F., and Plummer, D.: input4MIPs.CMIP6.CMIP.UReading, Version 20160711, Earth System Grid Federation, https://doi.org/10.22033/ESGF/INPUT4MIPS.10452, 2016. a
Hendricks, J., Kärcher, B., Lohmann, U., and Ponater, M.: Do aircraft black carbon emissions affect cirrus clouds on the global scale?, Geophys. Res. Lett., 32, 12, https://doi.org/10.1029/2005gl022740, 2005. a, b, c
Hendricks, J., Kärcher, B., and Lohmann, U.: Effects of ice nuclei on cirrus clouds in a global climate model, J. Geophys. Res.-Atmos., 116, D18, https://doi.org/10.1029/2010jd015302, 2011. a, b, c, d, e, f, g
Heymsfield, A. J., Krämer, M., Luebke, A., Brown, P., Cziczo, D. J., Franklin, C., Lawson, P., Lohmann, U., McFarquhar, G., Ulanowski, Z., and Tricht, K. V.: Cirrus Clouds, Meteor. Mon., 58, 2.1–2.26, https://doi.org/10.1175/amsmonographs-d-16-0010.1, 2017. a
Hoesly, R. M., Smith, S. J., Feng, L., Klimont, Z., Janssens-Maenhout, G., Pitkanen, T., Seibert, J. J., Vu, L., Andres, R. J., Bolt, R. M., Bond, T. C., Dawidowski, L., Kholod, N., Kurokawa, J.-I., Li, M., Liu, L., Lu, Z., Moura, M. C. P., O'Rourke, P. R., and Zhang, Q.: Historical (1750–2014) anthropogenic emissions of reactive gases and aerosols from the Community Emissions Data System (CEDS), Geosci. Model Dev., 11, 369–408, https://doi.org/10.5194/gmd-11-369-2018, 2018. a
Hong, Y., Liu, G., and Li, J.-L. F.: Assessing the Radiative Effects of Global Ice Clouds Based on CloudSat and CALIPSO Measurements, J. Climate, 29, 7651–7674, https://doi.org/10.1175/jcli-d-15-0799.1, 2016. a, b
Hoose, C. and Möhler, O.: Heterogeneous ice nucleation on atmospheric aerosols: a review of results from laboratory experiments, Atmos. Chem. Phys., 12, 9817–9854, https://doi.org/10.5194/acp-12-9817-2012, 2012. a
Jensen, E. J., Pfister, L., Ackerman, A. S., Tabazadeh, A., and Toon, O. B.: A conceptual model of the dehydration of air due to freeze-drying by optically thin, laminar cirrus rising slowly across the tropical tropopause, J. Geophys. Res.-Atmos., 106, 17237–17252, https://doi.org/10.1029/2000jd900649, 2001. a, b
Jensen, E. J., Diskin, G., Lawson, R. P., Lance, S., Bui, T. P., Hlavka, D., McGill, M., Pfister, L., Toon, O. B., and Gao, R.: Ice nucleation and dehydration in the Tropical Tropopause Layer, P. Natl. Acad. Sci. USA, 110, 2041–2046, https://doi.org/10.1073/pnas.1217104110, 2013. a, b
Johnson, B. T., Haywood, J. M., and Hawcroft, M. K.: Are Changes in Atmospheric Circulation Important for Black Carbon Aerosol Impacts on Clouds, Precipitation, and Radiation?, J. Geophys. Res.-Atmos., 124, 7930–7950, https://doi.org/10.1029/2019jd030568, 2019. a
Joos, H., Spichtinger, P., Lohmann, U., Gayet, J.-F., and Minikin, A.: Orographic cirrus in the global climate model ECHAM5, J. Geophys. Res.-Atmos., 113, D18, https://doi.org/10.1029/2007jd009605, 2008. a, b, c
Jöckel, P., Kerkweg, A., Pozzer, A., Sander, R., Tost, H., Riede, H., Baumgaertner, A., Gromov, S., and Kern, B.: Development cycle 2 of the Modular Earth Submodel System (MESSy2), Geosci. Model Dev., 3, 717–752, https://doi.org/10.5194/gmd-3-717-2010, 2010. a
Kaiser, J. C., Hendricks, J., Righi, M., Riemer, N., Zaveri, R. A., Metzger, S., and Aquila, V.: The MESSy aerosol submodel MADE3 (v2.0b): description and a box model test, Geosci. Model Dev., 7, 1137–1157, https://doi.org/10.5194/gmd-7-1137-2014, 2014. a
Kaiser, J. C., Hendricks, J., Righi, M., Jöckel, P., Tost, H., Kandler, K., Weinzierl, B., Sauer, D., Heimerl, K., Schwarz, J. P., Perring, A. E., and Popp, T.: Global aerosol modeling with MADE3 (v3.0) in EMAC (based on v2.53): model description and evaluation, Geosci. Model Dev., 12, 541–579, https://doi.org/10.5194/gmd-12-541-2019, 2019. a, b, c
Kanji, Z. A., DeMott, P. J., Möhler, O., and Abbatt, J. P. D.: Results from the University of Toronto continuous flow diffusion chamber at ICIS 2007: instrument intercomparison and ice onsets for different aerosol types, Atmos. Chem. Phys., 11, 31–41, https://doi.org/10.5194/acp-11-31-2011, 2011. a
Kanji, Z. A., Ladino, L. A., Wex, H., Boose, Y., Burkert-Kohn, M., Cziczo, D. J., and Krämer, M.: Overview of Ice Nucleating Particles, Meteor. Mon., 58, 1.1–1.33, https://doi.org/10.1175/amsmonographs-d-16-0006.1, 2017. a
Kärcher, B.: Cirrus Clouds and Their Response to Anthropogenic Activities, Curr. Clim. Change Rep., 3, 45–57, https://doi.org/10.1007/s40641-017-0060-3, 2017. a, b, c
Kärcher, B. and Lohmann, U.: A parameterization of cirrus cloud formation: Homogeneous freezing of supercooled aerosols, J. Geophys. Res.-Atmos., 107, D2, https://doi.org/10.1029/2001jd000470, 2002. a, b
Kärcher, B. and Lohmann, U.: A parameterization of cirrus cloud formation: Heterogeneous freezing, J. Geophys. Res.-Atmos., 108, D14, https://doi.org/10.1029/2002jd003220, 2003. a, b
Kärcher, B. and Podglajen, A.: A Stochastic Representation of Temperature Fluctuations Induced by Mesoscale Gravity Waves, J. Geophys. Res.-Atmos., 124, 11506–11529, https://doi.org/10.1029/2019jd030680, 2019. a
Kärcher, B., Hendricks, J., and Lohmann, U.: Physically based parameterization of cirrus cloud formation for use in global atmospheric models, J. Geophys. Res.-Atmos., 111, D1, https://doi.org/10.1029/2005jd006219, 2006. a, b, c, d, e, f, g, h, i
Kärcher, B., Jensen, E. J., and Lohmann, U.: The Impact of Mesoscale Gravity Waves on Homogeneous Ice Nucleation in Cirrus Clouds, Geophys. Res. Lett., 46, 5556–5565, https://doi.org/10.1029/2019gl082437, 2019. a
Kärcher, B., Mahrt, F., and Marcolli, C.: Process-oriented analysis of aircraft soot-cirrus interactions constrains the climate impact of aviation, Commun. Earth Environ., 2, 1, https://doi.org/10.1038/s43247-021-00175-x, 2021. a, b, c
Koehler, K. A., DeMott, P. J., Kreidenweis, S. M., Popovicheva, O. B., Petters, M. D., Carrico, C. M., Kireeva, E. D., Khokhlova, T. D., and Shonija, N. K.: Cloud condensation nuclei and ice nucleation activity of hydrophobic and hydrophilic soot particles, Phys. Chem. Chem. Phys., 11, 7906, https://doi.org/10.1039/b905334b, 2009. a, b
Krämer, M., Rolf, C., Luebke, A., Afchine, A., Spelten, N., Costa, A., Meyer, J., Zöger, M., Smith, J., Herman, R. L., Buchholz, B., Ebert, V., Baumgardner, D., Borrmann, S., Klingebiel, M., and Avallone, L.: A microphysics guide to cirrus clouds – Part 1: Cirrus types, Atmos. Chem. Phys., 16, 3463–3483, https://doi.org/10.5194/acp-16-3463-2016, 2016. a, b
Krämer, M., Rolf, C., Spelten, N., Afchine, A., Fahey, D., Jensen, E., Khaykin, S., Kuhn, T., Lawson, P., Lykov, A., Pan, L. L., Riese, M., Rollins, A., Stroh, F., Thornberry, T., Wolf, V., Woods, S., Spichtinger, P., Quaas, J., and Sourdeval, O.: A microphysics guide to cirrus – Part 2: Climatologies of clouds and humidity from observations, Atmos. Chem. Phys., 20, 12569–12608, https://doi.org/10.5194/acp-20-12569-2020, 2020. a, b, c
Kuebbeler, M., Lohmann, U., Hendricks, J., and Kärcher, B.: Dust ice nuclei effects on cirrus clouds, Atmos. Chem. Phys., 14, 3027–3046, https://doi.org/10.5194/acp-14-3027-2014, 2014. a, b, c, d, e
Kulkarni, G., China, S., Liu, S., Nandasiri, M., Sharma, N., Wilson, J., Aiken, A. C., Chand, D., Laskin, A., Mazzoleni, C., Pekour, M., Shilling, J., Shutthanandan, V., Zelenyuk, A., and Zaveri, R. A.: Ice nucleation activity of diesel soot particles at cirrus relevant temperature conditions: Effects of hydration, secondary organics coating, soot morphology, and coagulation, Geophys. Res. Lett., 43, 3580–3588, https://doi.org/10.1002/2016gl068707, 2016. a
Lee, D., Pitari, G., Grewe, V., Gierens, K., Penner, J., Petzold, A., Prather, M., Schumann, U., Bais, A., and Berntsen, T.: Transport impacts on atmosphere and climate: Aviation, Atmos. Environ., 44, 4678–4734, https://doi.org/10.1016/j.atmosenv.2009.06.005, 2010. a
Lee, L. A., Pringle, K. J., Reddington, C. L., Mann, G. W., Stier, P., Spracklen, D. V., Pierce, J. R., and Carslaw, K. S.: The magnitude and causes of uncertainty in global model simulations of cloud condensation nuclei, Atmos. Chem. Phys., 13, 8879–8914, https://doi.org/10.5194/acp-13-8879-2013, 2013. a
Lee, D., Fahey, D., Skowron, A., Allen, M., Burkhardt, U., Chen, Q., Doherty, S., Freeman, S., Forster, P., Fuglestvedt, J., Gettelman, A., León, R. D., Lim, L., Lund, M., Millar, R., Owen, B., Penner, J., Pitari, G., Prather, M., Sausen, R., and Wilcox, L.: The contribution of global aviation to anthropogenic climate forcing for 2000 to 2018, Atmos. Environ., 244, 117834, https://doi.org/10.1016/j.atmosenv.2020.117834, 2021. a, b, c
Liu, X. and Penner, J. E.: Ice nucleation parameterization for global models, Meteorol. Z., 14, 499–514, https://doi.org/10.1127/0941-2948/2005/0059, 2005. a, b, c, d
Liu, X., Penner, J. E., and Wang, M.: Influence of anthropogenic sulfate and black carbon on upper tropospheric clouds in the NCAR CAM3 model coupled to the IMPACT global aerosol model, J. Geophys. Res.-Atmos., 114, D3, https://doi.org/10.1029/2008jd010492, 2009. a, b, c, d
Lohmann, U. and Kärcher, B.: First interactive simulations of cirrus clouds formed by homogeneous freezing in the ECHAM general circulation model, J. Geophys. Res.-Atmos., 107, D10, https://doi.org/10.1029/2001jd000767, 2002. a, b
Mahrt, F., Marcolli, C., David, R. O., Grönquist, P., Barthazy Meier, E. J., Lohmann, U., and Kanji, Z. A.: Ice nucleation abilities of soot particles determined with the Horizontal Ice Nucleation Chamber, Atmos. Chem. Phys., 18, 13363–13392, https://doi.org/10.5194/acp-18-13363-2018, 2018. a
Mahrt, F., Kilchhofer, K., Marcolli, C., Grönquist, P., David, R. O., Rösch, M., Lohmann, U., and Kanji, Z. A.: The Impact of Cloud Processing on the Ice Nucleation Abilities of Soot Particles at Cirrus Temperatures, J. Geophys. Res.-Atmos., 125, 3, https://doi.org/10.1029/2019jd030922, 2020. a, b, c, d
Mann, G. W., Carslaw, K. S., Reddington, C. L., Pringle, K. J., Schulz, M., Asmi, A., Spracklen, D. V., Ridley, D. A., Woodhouse, M. T., Lee, L. A., Zhang, K., Ghan, S. J., Easter, R. C., Liu, X., Stier, P., Lee, Y. H., Adams, P. J., Tost, H., Lelieveld, J., Bauer, S. E., Tsigaridis, K., van Noije, T. P. C., Strunk, A., Vignati, E., Bellouin, N., Dalvi, M., Johnson, C. E., Bergman, T., Kokkola, H., von Salzen, K., Yu, F., Luo, G., Petzold, A., Heintzenberg, J., Clarke, A., Ogren, J. A., Gras, J., Baltensperger, U., Kaminski, U., Jennings, S. G., O'Dowd, C. D., Harrison, R. M., Beddows, D. C. S., Kulmala, M., Viisanen, Y., Ulevicius, V., Mihalopoulos, N., Zdimal, V., Fiebig, M., Hansson, H.-C., Swietlicki, E., and Henzing, J. S.: Intercomparison and evaluation of global aerosol microphysical properties among AeroCom models of a range of complexity, Atmos. Chem. Phys., 14, 4679–4713, https://doi.org/10.5194/acp-14-4679-2014, 2014. a
Marcolli, C.: Pre-activation of aerosol particles by ice preserved in pores, Atmos. Chem. Phys., 17, 1595–1622, https://doi.org/10.5194/acp-17-1595-2017, 2017. a
Marcolli, C., Mahrt, F., and Kärcher, B.: Soot PCF: pore condensation and freezing framework for soot aggregates, Atmos. Chem. Phys., 21, 7791–7843, https://doi.org/10.5194/acp-21-7791-2021, 2021. a, b
McGraw, Z., Storelvmo, T., Samset, B. H., and Stjern, C. W.: Global Radiative Impacts of Black Carbon Acting as Ice Nucleating Particles, Geophys. Res. Lett., 47, 20, https://doi.org/10.1029/2020gl089056, 2020. a, b, c, d
Meinshausen, M., Vogel, E., Nauels, A., Lorbacher, K., Meinshausen, N., Etheridge, D. M., Fraser, P. J., Montzka, S. A., Rayner, P. J., Trudinger, C. M., Krummel, P. B., Beyerle, U., Canadell, J. G., Daniel, J. S., Enting, I. G., Law, R. M., Lunder, C. R., O'Doherty, S., Prinn, R. G., Reimann, S., Rubino, M., Velders, G. J. M., Vollmer, M. K., Wang, R. H. J., and Weiss, R.: Historical greenhouse gas concentrations for climate modelling (CMIP6), Geosci. Model Dev., 10, 2057–2116, https://doi.org/10.5194/gmd-10-2057-2017, 2017. a
MESSy: Modular Earth Submodel System, available at: http://www.messy-interface.org, last access: 3 March 2021. a
Möhler, O., Büttner, S., Linke, C., Schnaiter, M., Saathoff, H., Stetzer, O., Wagner, R., Krämer, M., Mangold, A., Ebert, V., and Schurath, U.: Effect of sulfuric acid coating on heterogeneous ice nucleation by soot aerosol particles, J. Geophys. Res.-Atmos., 110, D11, https://doi.org/10.1029/2004jd005169, 2005. a, b
Neubauer, D., Ferrachat, S., Siegenthaler-Le Drian, C., Stier, P., Partridge, D. G., Tegen, I., Bey, I., Stanelle, T., Kokkola, H., and Lohmann, U.: The global aerosol–climate model ECHAM6.3–HAM2.3 – Part 2: Cloud evaluation, aerosol radiative forcing, and climate sensitivity, Geosci. Model Dev., 12, 3609–3639, https://doi.org/10.5194/gmd-12-3609-2019, 2019. a
Nichman, L., Wolf, M., Davidovits, P., Onasch, T. B., Zhang, Y., Worsnop, D. R., Bhandari, J., Mazzoleni, C., and Cziczo, D. J.: Laboratory study of the heterogeneous ice nucleation on black-carbon-containing aerosol, Atmos. Chem. Phys., 19, 12175–12194, https://doi.org/10.5194/acp-19-12175-2019, 2019. a
Penner, J. E., Chen, Y., Wang, M., and Liu, X.: Possible influence of anthropogenic aerosols on cirrus clouds and anthropogenic forcing, Atmos. Chem. Phys., 9, 879–896, https://doi.org/10.5194/acp-9-879-2009, 2009. a, b, c, d
Penner, J. E., Zhou, C., Garnier, A., and Mitchell, D. L.: Anthropogenic Aerosol Indirect Effects in Cirrus Clouds, J. Geophys. Res.-Atmos., 123, 11652–11677, https://doi.org/10.1029/2018jd029204, 2018. a, b, c, d, e, f, g, h
Petzold, A., Döpelheuer, A., Brock, C. A., and Schröder, F.: In situ observations and model calculations of black carbon emission by aircraft at cruise altitude, J. Geophys. Res.-Atmos., 104, 22171–22181, https://doi.org/10.1029/1999jd900460, 1999. a, b, c
Petzold, A., Ogren, J. A., Fiebig, M., Laj, P., Li, S.-M., Baltensperger, U., Holzer-Popp, T., Kinne, S., Pappalardo, G., Sugimoto, N., Wehrli, C., Wiedensohler, A., and Zhang, X.-Y.: Recommendations for reporting “black carbon” measurements, Atmos. Chem. Phys., 13, 8365–8379, https://doi.org/10.5194/acp-13-8365-2013, 2013. a
Podglajen, A., Hertzog, A., Plougonven, R., and Legras, B.: Lagrangian temperature and vertical velocity fluctuations due to gravity waves in the lower stratosphere, Geophys. Res. Lett., 43, 3543–3553, https://doi.org/10.1002/2016gl068148, 2016. a, b
Quaas, J., Ming, Y., Menon, S., Takemura, T., Wang, M., Penner, J. E., Gettelman, A., Lohmann, U., Bellouin, N., Boucher, O., Sayer, A. M., Thomas, G. E., McComiskey, A., Feingold, G., Hoose, C., Kristjánsson, J. E., Liu, X., Balkanski, Y., Donner, L. J., Ginoux, P. A., Stier, P., Grandey, B., Feichter, J., Sednev, I., Bauer, S. E., Koch, D., Grainger, R. G., Kirkevåg, A., Iversen, T., Seland, Ø., Easter, R., Ghan, S. J., Rasch, P. J., Morrison, H., Lamarque, J.-F., Iacono, M. J., Kinne, S., and Schulz, M.: Aerosol indirect effects – general circulation model intercomparison and evaluation with satellite data, Atmos. Chem. Phys., 9, 8697–8717, https://doi.org/10.5194/acp-9-8697-2009, 2009. a
Rayner, N. A., Parker, D. E., Horton, E. B., Folland, C. K., Alexander, L. V., Rowell, D. P., Kent, E. C., and Kaplan, A.: Global analyses of sea surface temperature, sea ice, and night marine air temperature since the late nineteenth century, J. Geophys. Res.-Atmos., 108, D14, https://doi.org/10.1029/2002jd002670, 2003. a, b
Regayre, L. A., Schmale, J., Johnson, J. S., Tatzelt, C., Baccarini, A., Henning, S., Yoshioka, M., Stratmann, F., Gysel-Beer, M., Grosvenor, D. P., and Carslaw, K. S.: The value of remote marine aerosol measurements for constraining radiative forcing uncertainty, Atmos. Chem. Phys., 20, 10063–10072, https://doi.org/10.5194/acp-20-10063-2020, 2020. a
Riahi, K., van Vuuren, D. P., Kriegler, E., Edmonds, J., O'Neill, B. C., Fujimori, S., Bauer, N., Calvin, K., Dellink, R., Fricko, O., Lutz, W., Popp, A., Cuaresma, J. C., K.-C, S., Leimbach, M., Jiang, L., Kram, T., Rao, S., Emmerling, J., Ebi, K., Hasegawa, T., Havlik, P., Humpenöder, F., Silva, L. A. D., Smith, S., Stehfest, E., Bosetti, V., Eom, J., Gernaat, D., Masui, T., Rogelj, J., Strefler, J., Drouet, L., Krey, V., Luderer, G., Harmsen, M., Takahashi, K., Baumstark, L., Doelman, J. C., Kainuma, M., Klimont, Z., Marangoni, G., Lotze-Campen, H., Obersteiner, M., Tabeau, A., and Tavoni, M.: The Shared Socioeconomic Pathways and their energy, land use, and greenhouse gas emissions implications: An overview, Global Environ. Change, 42, 153–168, https://doi.org/10.1016/j.gloenvcha.2016.05.009, 2017. a
Righi, M.: Model simulation data used in “Exploring the uncertainties in the aviation soot-cirrus effect” (Righi et al., Atmos. Chem. Phys., 2021), Zenodo [data set], https://doi.org/10.5281/zenodo.5146195, 2021. a
Righi, M., Hendricks, J., and Sausen, R.: The global impact of the transport sectors on atmospheric aerosol: simulations for year 2000 emissions, Atmos. Chem. Phys., 13, 9939–9970, https://doi.org/10.5194/acp-13-9939-2013, 2013. a, b, c, d, e
Righi, M., Hendricks, J., Lohmann, U., Beer, C. G., Hahn, V., Heinold, B., Heller, R., Krämer, M., Ponater, M., Rolf, C., Tegen, I., and Voigt, C.: Coupling aerosols to (cirrus) clouds in the global EMAC-MADE3 aerosol–climate model, Geosci. Model Dev., 13, 1635–1661, https://doi.org/10.5194/gmd-13-1635-2020, 2020. a, b, c, d, e, f, g, h, i, j, k, l, m, n
Samset, B. H., Myhre, G., Herber, A., Kondo, Y., Li, S.-M., Moteki, N., Koike, M., Oshima, N., Schwarz, J. P., Balkanski, Y., Bauer, S. E., Bellouin, N., Berntsen, T. K., Bian, H., Chin, M., Diehl, T., Easter, R. C., Ghan, S. J., Iversen, T., Kirkevåg, A., Lamarque, J.-F., Lin, G., Liu, X., Penner, J. E., Schulz, M., Seland, Ø., Skeie, R. B., Stier, P., Takemura, T., Tsigaridis, K., and Zhang, K.: Modelled black carbon radiative forcing and atmospheric lifetime in AeroCom Phase II constrained by aircraft observations, Atmos. Chem. Phys., 14, 12465–12477, https://doi.org/10.5194/acp-14-12465-2014, 2014. a
Schulz, M., Textor, C., Kinne, S., Balkanski, Y., Bauer, S., Berntsen, T., Berglen, T., Boucher, O., Dentener, F., Guibert, S., Isaksen, I. S. A., Iversen, T., Koch, D., Kirkevåg, A., Liu, X., Montanaro, V., Myhre, G., Penner, J. E., Pitari, G., Reddy, S., Seland, Ø., Stier, P., and Takemura, T.: Radiative forcing by aerosols as derived from the AeroCom present-day and pre-industrial simulations, Atmos. Chem. Phys., 6, 5225–5246, https://doi.org/10.5194/acp-6-5225-2006, 2006. a
Schultz, M. G., Stadtler, S., Schröder, S., Taraborrelli, D., Franco, B., Krefting, J., Henrot, A., Ferrachat, S., Lohmann, U., Neubauer, D., Siegenthaler-Le Drian, C., Wahl, S., Kokkola, H., Kühn, T., Rast, S., Schmidt, H., Stier, P., Kinnison, D., Tyndall, G. S., Orlando, J. J., and Wespes, C.: The chemistry–climate model ECHAM6.3-HAM2.3-MOZ1.0, Geosci. Model Dev., 11, 1695–1723, https://doi.org/10.5194/gmd-11-1695-2018, 2018. a
Vali, G., DeMott, P. J., Möhler, O., and Whale, T. F.: Technical Note: A proposal for ice nucleation terminology, Atmos. Chem. Phys., 15, 10263–10270, https://doi.org/10.5194/acp-15-10263-2015, 2015. a
van Marle, M. J. E., Kloster, S., Magi, B. I., Marlon, J. R., Daniau, A.-L., Field, R. D., Arneth, A., Forrest, M., Hantson, S., Kehrwald, N. M., Knorr, W., Lasslop, G., Li, F., Mangeon, S., Yue, C., Kaiser, J. W., and van der Werf, G. R.: Historic global biomass burning emissions for CMIP6 (BB4CMIP) based on merging satellite observations with proxies and fire models (1750–2015), Geosci. Model Dev., 10, 3329–3357, https://doi.org/10.5194/gmd-10-3329-2017, 2017. a
Voigt, C., Schumann, U., Minikin, A., Abdelmonem, A., Afchine, A., Borrmann, S., Boettcher, M., Buchholz, B., Bugliaro, L., Costa, A., Curtius, J., Dollner, M., Dörnbrack, A., Dreiling, V., Ebert, V., Ehrlich, A., Fix, A., Forster, L., Frank, F., Fütterer, D., Giez, A., Graf, K., Grooß, J.-U., Groß, S., Heimerl, K., Heinold, B., Hüneke, T., Järvinen, E., Jurkat, T., Kaufmann, S., Kenntner, M., Klingebiel, M., Klimach, T., Kohl, R., Krämer, M., Krisna, T. C., Luebke, A., Mayer, B., Mertes, S., Molleker, S., Petzold, A., Pfeilsticker, K., Port, M., Rapp, M., Reutter, P., Rolf, C., Rose, D., Sauer, D., Schäfler, A., Schlage, R., Schnaiter, M., Schneider, J., Spelten, N., Spichtinger, P., Stock, P., Walser, A., Weigel, R., Weinzierl, B., Wendisch, M., Werner, F., Wernli, H., Wirth, M., Zahn, A., Ziereis, H., and Zöger, M.: ML-CIRRUS: The Airborne Experiment on Natural Cirrus and Contrail Cirrus with the High-Altitude Long-Range Research Aircraft HALO, B. Am. Meteorol. Soc., 98, 271–288, https://doi.org/10.1175/bams-d-15-00213.1, 2017. a, b
Zhang, Y., Macke, A., and Albers, F.: Effect of crystal size spectrum and crystal shape on stratiform cirrus radiative forcing, Atmos. Res., 52, 59–75, https://doi.org/10.1016/s0169-8095(99)00026-5, 1999. a
Zhou, C. and Penner, J. E.: Aircraft soot indirect effect on large-scale cirrus clouds: Is the indirect forcing by aircraft soot positive or negative?, J. Geophys. Res.-Atmos., 119, 11303–11320, https://doi.org/10.1002/2014jd021914, 2014. a, b, c, d, e
Zhu, J. and Penner, J. E.: Radiative forcing of anthropogenic aerosols on cirrus clouds using a hybrid ice nucleation scheme, Atmos. Chem. Phys., 20, 7801–7827, https://doi.org/10.5194/acp-20-7801-2020, 2020. a, b, c, d, e
- Abstract
- Introduction
- Uncertainties in the soot–cirrus effect
- Model description and simulations
- Results and discussion
- Conclusions and outlook
- Code and data availability
- Author contributions
- Competing interests
- Disclaimer
- Special issue statement
- Acknowledgements
- Financial support
- Review statement
- References
- Supplement