the Creative Commons Attribution 4.0 License.
the Creative Commons Attribution 4.0 License.
 | 08 Nov 2021
Spatiotemporal variability in the oxidative potential of ambient fine particulate matter in the Midwestern United States
Haoran Yu
Joseph Varghese Puthussery
Yixiang Wang
Vishal Verma
We assessed the oxidative potential (OP) of both water-soluble and methanol-soluble fractions of ambient fine particulate matter (PM2.5) in the Midwestern United States. A large set of PM2.5 samples (N=241) was collected from five sites set up in different environments, i.e., urban, rural, and roadside, in Illinois, Indiana, and Missouri during May 2018–May 2019. Five acellular OP endpoints, including the consumption rate of ascorbic acid and glutathione in a surrogate lung fluid (SLF) (OPAA and OPGSH, respectively), dithiothreitol (DTT) depletion rate (OPDTT), and •OH generation rate in SLF and DTT (OPOH−SLF and OPOH−DTT, respectively), were measured for all PM2.5 samples. PM2.5 mass concentrations in the Midwestern US as obtained from these samples were spatially homogeneously distributed, while most OP endpoints showed significant spatiotemporal heterogeneity. Seasonally, higher activities occurred in summer for most OP endpoints for both water- and methanol-soluble extracts. Spatially, the roadside site showed the highest activities for most OP endpoints in the water-soluble extracts, while only occasional peaks were observed at urban sites in the methanol-soluble OP. Most OP endpoints showed similar spatiotemporal trends between mass- and volume-normalized activities across different sites and seasons. Comparisons between two solvents (i.e., water and methanol) showed that methanol-soluble OP generally had higher activity levels than corresponding water-soluble OP. Site-to-site comparisons of OP showed stronger correlations for methanol-soluble OP compared to water-soluble OP, indicating a better extraction of water-insoluble redox-active compounds from various emission sources into methanol. We found a weak correlation and inconsistent slope values between PM2.5 mass and most OP endpoints. Moreover, the poor to moderate intercorrelations among different OP endpoints indicate different mechanisms of OP represented by these endpoints and thus demonstrate the rationale for analyzing multiple acellular endpoints for a better and more comprehensive assessment of OP.
- Article
(13270 KB) - Full-text XML
-
Supplement
(2969 KB) - BibTeX
- EndNote


Oxidative stress induced by ambient fine particulate matter (PM2.5; particulate matter with size less than 2.5 µm) has been widely recognized as a biological pathway for fine particles to exert adverse health effects in humans (Sørensen et al., 2003; Risom et al., 2005; Garçon et al., 2006; Wessels et al., 2010; Cachon et al., 2014; Haberzettl et al., 2016; Feng et al., 2016; Rao et al., 2018; Mudway et al., 2020). A variety of chemical species in ambient particles, such as transition metals and aromatic organic species, possess redox cycling capability and can catalyze electron transfer from cellular reductants (e.g., NADPH) to molecular oxygen (O2), which subsequently forms highly reactive radicals (e.g., the superoxide radical – •O – and the hydroxyl radical – •OH) and non-radical oxidants (e.g., hydrogen peroxide – H2O2) (Kampfrath et al., 2011; Qin et al., 2018; Kumagai et al., 2002; Lee et al., 2016). These oxygen-containing species with high redox activity and short lifetimes are collectively defined as reactive oxygen species (ROS). Several antioxidants (e.g., ascorbic acid – AA, reduced glutathione – GSH, and uric acid – UA) that are present in human respiratory tract lining fluid (RTLF) can counteract ROS under normal conditions by donating extra electrons, thus forming less oxidative species and oxidized antioxidants (Kelly, 2003; Li and Nel, 2006; Allan et al., 2010; Zuo et al., 2013; Poljšak and Fink, 2014). However, excessively produced ROS might penetrate the antioxidant barrier and induce oxidative stress (Xing et al., 2016; Rao et al., 2018), leading to a cascade of detrimental biological effects such as oxidation of DNA, lipids, and proteins (Rossner et al., 2008; Franco et al., 2008; Grevendonk et al., 2016), tissue injury (Feng et al., 2016; Gurgueira et al., 2002; Sun et al., 2020), and eventually cardiopulmonary impairment (Li et al., 2018; Kodavanti et al., 2000; Kampfrath et al., 2011). The capability of particulate matter (PM) to catalyze the generation of ROS and/or the depletion of antioxidants is defined as the oxidative potential (OP) of PM (Bates et al., 2019).
The assessment of PM2.5-induced oxidative stress is conventionally carried out through biological tests, including both in vitro (Becker et al., 2005; Zhang et al., 2008; Oh et al., 2011; Yan et al., 2016; Abbas et al., 2016; Deng et al., 2013) and in vivo designs (Kleinman et al., 2005; Riva et al., 2011; Pei et al., 2016; Araujo et al., 2008; Xu et al., 2011; Sancini et al., 2014). Although these biological tests are highly relevant in terms of representing health effects in humans, the time- and labor-intensive protocols as well as the cost of experimental materials generally limit their application to only small sample sizes. Various acellular chemical assays which assess the OP by replicating intrinsic biological mechanisms were therefore developed as alternatives. These assays are generally divided into two categories. The OP analysis approaches in the first category directly probe the generation of ROS during redox cycling reactions in the presence of PM, such as the measurement of H2O2 and •OH production in surrogate lung fluid (SLF) (Vidrio et al., 2009; Shen et al., 2011; Charrier et al., 2014; Ma et al., 2015), as well as H2O2 and •OH production in dithiothreitol (DTT) (Yu et al., 2018; Xiong et al., 2017; Chung et al., 2006; Kumagai et al., 2002). The assays in second category utilize the consumption of antioxidants such as AA (Visentin et al., 2016; S. A. Weichenthal et al., 2016) and GSH (Künzli et al., 2006; Szigeti et al., 2016) or surrogates for cellular reductants such as DTT (Verma et al., 2014; Cho et al., 2005), as the OP indicator. Analyzing each PM sample for all of these chemical assays is also time-consuming. To address this concern, we have previously developed an automated OP analysis instrument named SAMERA – the Semi-Automated Multi-Endpoint ROS-activity Analyzer – that can measure the five most commonly used OP endpoints (i.e., the consumption rate of AA and GSH in SLF, OPAA, and OPGSH; the consumption rate of DTT and OPDTT and the generation rate of •OH in SLF, DTT, OPOH−SLF, and OPOH−DTT) for a PM extract in less than 3 h (Yu et al., 2020). Many of these acellular endpoints have been widely implemented by various researchers to assess the oxidative properties of PM. Calas et al. (2018) compared the responses of several OP endpoints (i.e., OPDTT, OPAA, OPGSH, and electron spin resonance – OPESR) on PM10 samples, with N=98, collected from Chamonix, France. Yang et al. (2014) also used four OP endpoints (OPAA, OPDTT, OPESR, and reductive acridinium triggering – OPCRAT) to investigate the effect of different extraction solvents and filter types on OP responses using the PM2.5 samples (N=20) collected from two cities (Rotterdam and Amsterdam) in the Netherlands. The comparison of OPAA, OPDTT, and OPGSH has been shown in two studies (Fang et al., 2016; Gao et al., 2020a), both from the southeastern US. We are not aware of any study which has compared •OH generation in SLF or DTT with other endpoints based on antioxidant consumption (e.g., AA or GSH consumption). Clearly, studies systematically comparing the responses of these different endpoints on a large sample set collected from an extensive spatial scale, particularly in the United States, are very limited.
Although OP is proposed as an integrative PM2.5 property, purportedly combining the individual and synergistic actions of its many active components, there have been limited attempts to integrate it into large-scale epidemiological studies. This is because, unlike other PM properties such as mass, sulfate, and nitrate, OP measurements in different geographical regions have been relatively sparse. Moreover, before integrating OP into epidemiological studies, it is important that we investigate the differences of its spatiotemporal distribution with other commonly measured PM properties such as mass. An understanding of the temporal variation of OP in a specific environment could be helpful in time series studies of short-term effects, while the spatial variation of OP can aid in studying the long-term health effects of PM2.5 exposure among different regions (Yang et al., 2015a). Globally, spatiotemporal profiles of OP have been characterized for some geographical regions such as the Los Angeles Basin (Saffari et al., 2014, 2013), Denver (Zhang et al., 2008), and Atlanta (Fang et al., 2016; Verma et al., 2014) in the US, Ontario (Canada) (Jeong et al., 2020; S. Weichenthal et al., 2019, 2016), France (Borlaza et al., 2021; Calas et al., 2019; Weber et al., 2018, 2021), Italy (Cesari et al., 2019; Perrone et al., 2019; Pietrogrande et al., 2018), Athens in Greece (Paraskevopoulou et al., 2019), the Netherlands (Yang et al., 2015a, b), and some coastal cities near Bohai (Jinzhou, Tianjin and Yantai; Liu et al., 2018) and Beijing (Yu et al., 2019; Liu et al., 2014) in China. Some of these studies have substantially contributed to enhancing our understanding of the role of OP in PM-induced health effects (Fang et al., 2016; Tuet et al., 2016; Abrams et al., 2017; S. Weichenthal et al., 2016; Yang et al., 2016; Bates et al., 2015). However, despite including many cities ranked high in terms of air pollution (e.g., Indianapolis – Rosenthal et al., 2008; Chicago – Dominici et al., 2003; St. Louis – Sarnat et al., 2015; Detroit – Zhou et al., 2011; Cincinnati – Kaufman et al., 2019; and Cleveland – Kumar et al., 2013), the midwestern region of the United States is an understudied region in terms of assessing the oxidative levels of ambient PM2.5.
Here, we investigate the detailed spatiotemporal profiles of ambient PM2.5 mass concentrations and OP in the Midwestern United States. Simultaneous ambient PM2.5 samples were collected from five different sites in the Midwestern US. The automated instrument SAMERA facilitated the measurement of OP on our large bulk of PM2.5 samples (N=241) collected from all the sites, which were extracted in both water and methanol separately. The goal of this analysis is to compare the spatiotemporal distribution of PM2.5 OP with that of the mass concentrations. We also want to investigate if different measures of OP; i.e., OPAA, OPGSH, OPOH−SLF, OPDTT, and OPOH−DTT show different spatiotemporal trends or are correlated with each other. Correlations of OP with PM chemical composition and source apportionment analysis of PM2.5 OP will be presented in our subsequent publications. Our paper presents the results from probably one of the most comprehensive OP analysis campaigns so far, combining five different acellular OP endpoints measured on both water- and organic-soluble extracts.
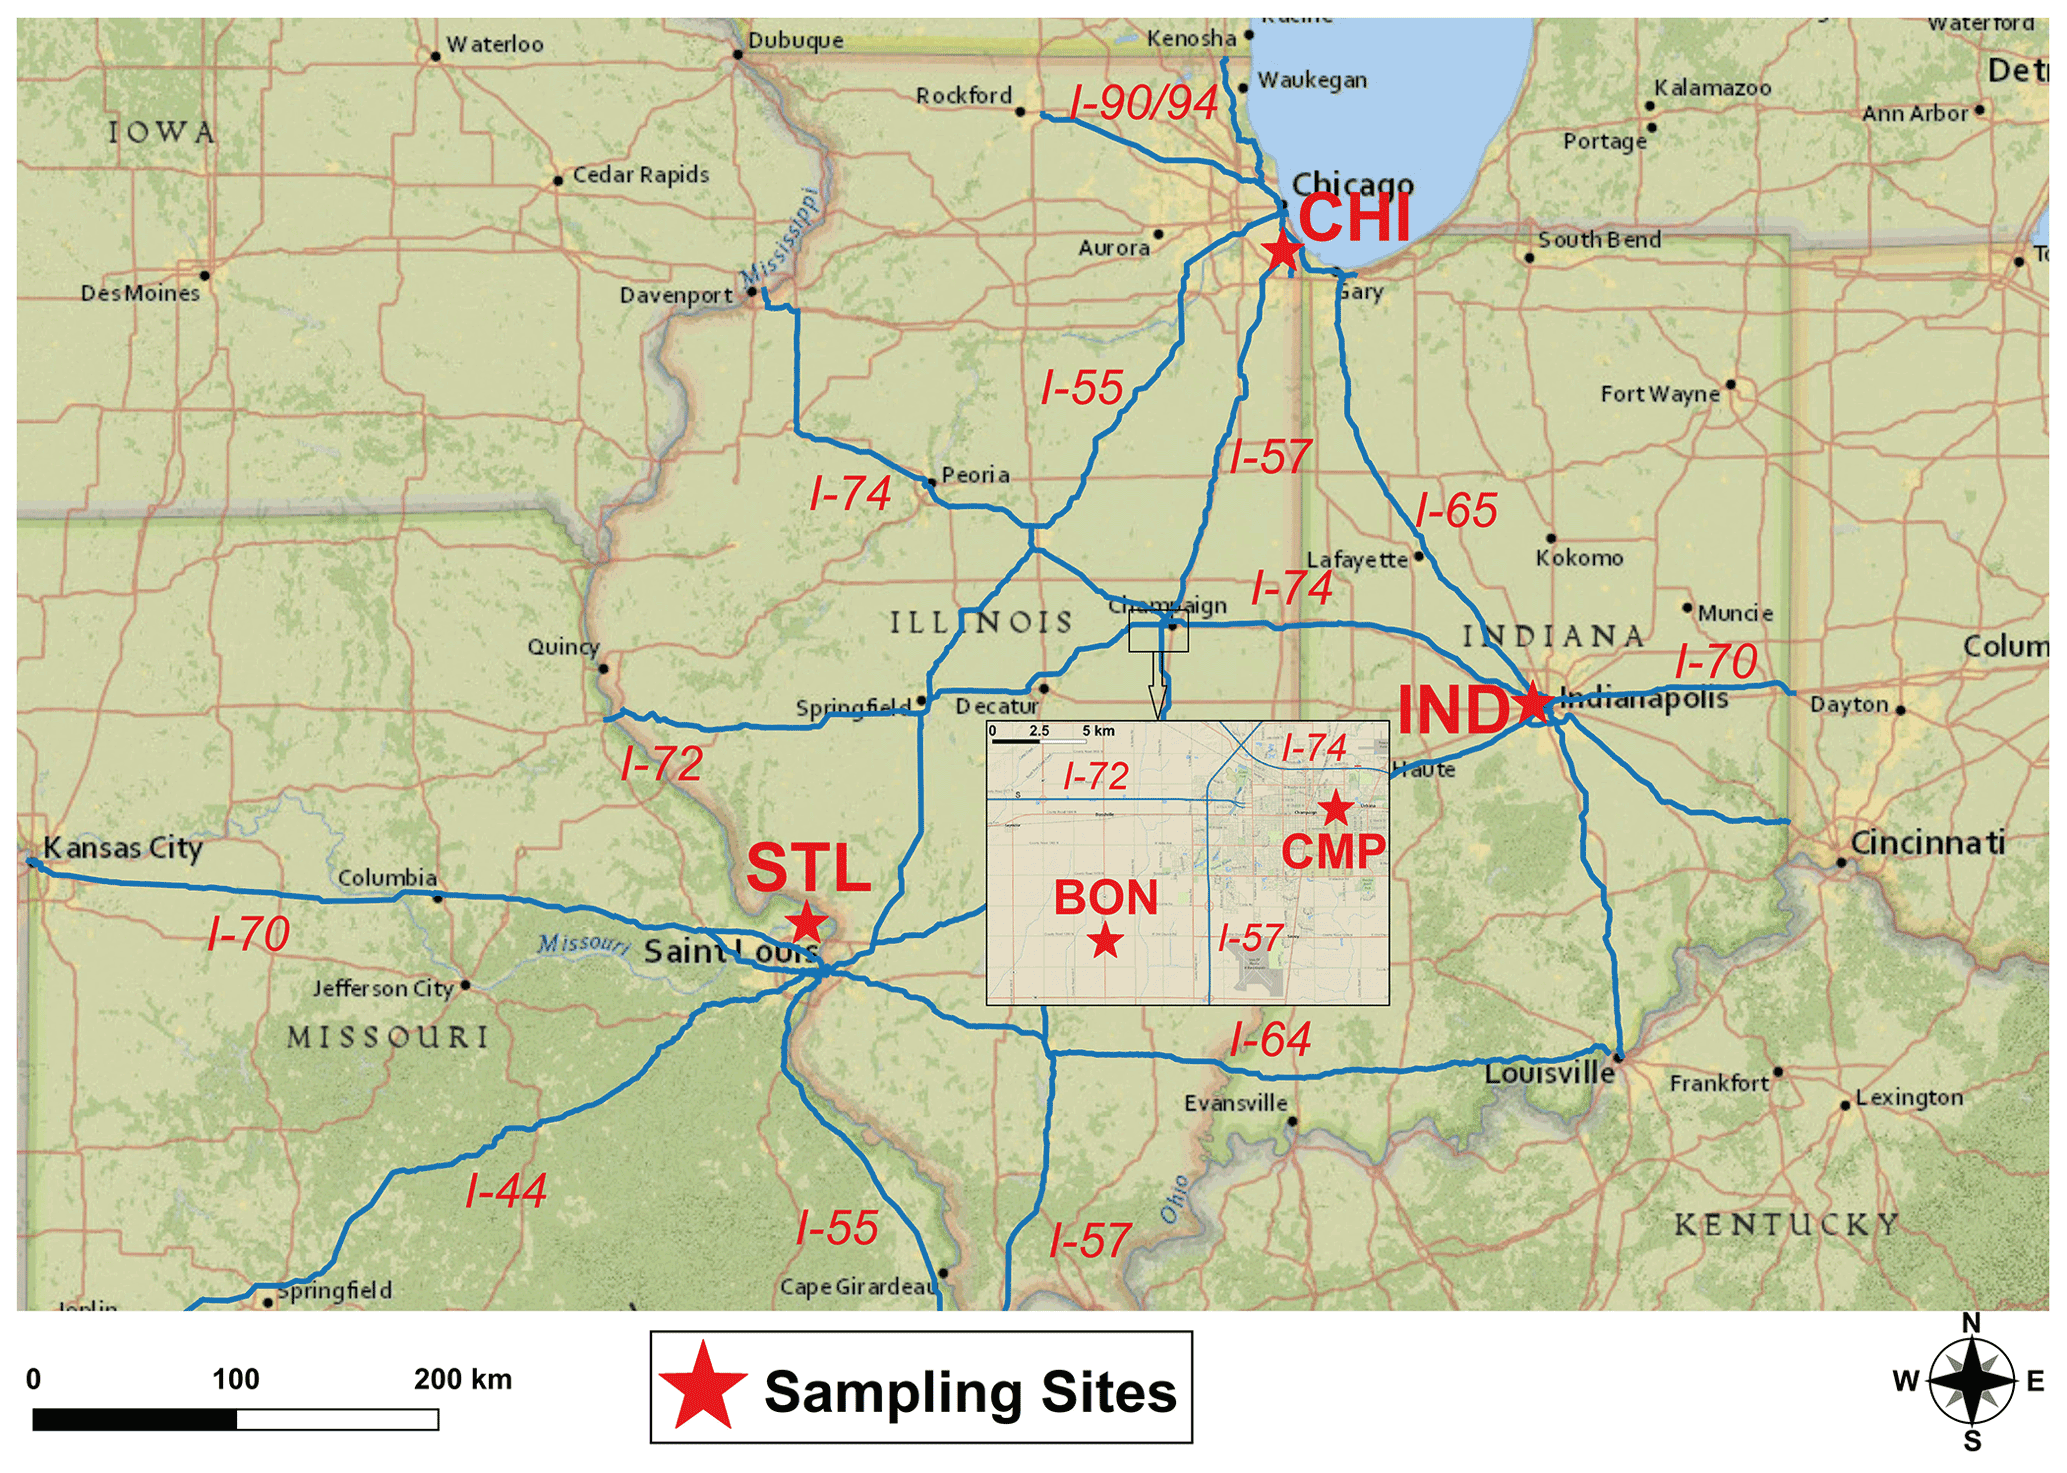
Figure 1Map for our five sampling sites in the Midwestern US.
2.1 Sampling campaign
Simultaneous sampling in five different sites spread across three states (i.e., Illinois, Indiana, and Missouri) was conducted every week for this project in the Midwestern US. The locations of the sampling sites are shown in Fig. 1. The Champaign (CMP) and Bondville (BON) sites are paired sites representing the urban (roadside) and rural environment of Champaign County, IL, respectively, while three major city sites (i.e., Chicago – CHI, Indianapolis – IND, and St. Louis – STL) are representatives of urban background regions in these respective cities.
CMP is located on top of a parking garage on the campus of the University of Illinois at Urbana–Champaign and is adjacent to a two-lane (both ways) road (i.e., University Avenue). This site is surrounded by the university facilities and is impacted by traffic emissions from the adjacent road. The site is about 1 km from downtown Champaign and is surrounded by dense housing and business development.
BON is a rural site, 15 km west of downtown Champaign, and is also a part of the IMPROVE (Interagency Monitoring of Protected Visual Environments) monitoring program. The station is managed by the Illinois State Water Survey and is surrounded by intensively managed agricultural fields. The major highways (I-57 and I-74) are at least 6 km north and east of this site, respectively.
The CHI site is located on a dormitory building – Carman Hall on the Illinois Institute of Technology (IIT) campus in Chicago, IL. This site is ∼500 m away from a two-way six-lane (including an emergency lane) interstate highway (I-90/94), 1.5 km west of Lake Michigan, and 5 km south of downtown Chicago. The highway I-90/94 has an annual average daily traffic flow of 300 000 vehicles per day, and heavy-duty vehicles account for ∼10 % of the traffic (Xiang et al., 2019). The site is situated in the mixed commercial and residential area of Chicago, and therefore emissions from traffic mixed with residential and commercial activities are expected.
The IND site is located inside the campus of the School of Public Health, Indiana University–Purdue University Indianapolis (IUPUI). This site is close to downtown Indianapolis (2 km southeast of the IND site) and a two-way four-lane interstate highway I-65 (1 km northeast of the IND site). The site is surrounded by miscellaneous facilities of IUPUI and Riley Hospital; therefore, the sources of ambient aerosols at the IND site may include vehicular emissions from the highway and emissions from residential and commercial activities related to miscellaneous university and hospital operations.
The STL site is located 3 km north of downtown St. Louis, MO. This site is 230 m west of the interstate I-44/70 and 1.2 km west of the Mississippi River. It is also surrounded by several industries for steel processing, zinc smelting, and copper production (Lee et al., 2006). Therefore, a significant portion of metals in PM at this site is assumed to be from industrial emissions. The urban activities in downtown St. Louis and traffic emissions from highway vehicles and river boating are also potential sources of PM2.5 at this site.
The sampling period involved four seasons starting from 22 May 2018 to 30 May 2019. Integrated ambient PM2.5 samples were collected simultaneously for 3 continuous days from all the sites. Each site was instrumented with a high-volume (hi-vol) air sampler equipped with a PM2.5 inlet (flow rate =1.13 m3 min−1; Tisch Environmental; Cleves, OH). Both before and after the sampling campaign, we did a comparison of various samplers by running them in parallel to collect PM2.5 samples and analyzing them for OPDTT (see Sect. S1 of the Supplement). All the samplers were equipped with a timer to enable automatic start of the sampling each Tuesday at 00:00 CT and turn-off each Friday at 00:00 CT (CT: Central Time). After the sampled filters were collected on Friday (before noon), new filters were loaded in the filter holder to start the next run of sampling. All five samplers were monthly-calibrated for the flow rate by using a variable-flow calibration kit (Tisch Environmental), and the flow rate was measured every week before and after the sampling. We used quartz filters (Pall TissuquartzTM, 8) for collecting PM2.5. The filters were prebaked at 550 ∘C for 24 h before sampling. A total of 241 filters were collected during the whole campaign (44 from CHI, 47 from STL, 54 from IND, 51 from CMP, and 45 from BON). We also collected field blank filters (N=10 from each site) once every 5 weeks by placing a blank quartz filter in the filter holder of the sampler for 1 h but without running the pump.
All filters were weighed before and after sampling using a lab-scale digital balance (0.2 mg readability, Sartorius A120S, Göttingen, Germany) for determining the PM2.5 mass loading on each filter. Prior to each weighing, filters were equilibrated in a room with constant temperature (24 ∘C) and relative humidity (50 %) for 24 h. After sampling, the filters were individually wrapped in prebaked (550 ∘C) aluminum foils and stored in a freezer at −20 ∘C before analysis. More information on sampling, including the exact dates of sampling, is provided in Table S1 in the Supplement.
2.2 Sample extraction protocol
The sample extraction protocol for OP analysis was determined by the requirement to keep a relatively constant concentration of PM2.5 in the liquid extracts. This is due to the nonlinear response of certain OP endpoints with PM2.5 mass in the extracts (Charrier et al., 2016). Thus, the fraction of the filter and the volume of water used for extraction were varied depending on the PM2.5 mass loading on each hi-vol filter. For the analyses of water-soluble OP, a few (usually three to five) circular sections (16–25 mm diameter) were punched from the filter and immersed into 15–20 mL of deionized Milli-Q water (DI, resistivity = 18.2 MΩ cm−1). The volume of water was adjusted to achieve ∼100 µg of total PM2.5 per milliliter of DI. The vials containing filter sections suspended in the DI were sonicated in an ultrasonic water bath for 1 h (Cole-Palmer, Vernon Hills, IL, US). These suspensions were then filtered through a 0.45 µm PTFE syringe filter to remove all water-insoluble components including filter fibers. 10.5 mL of these filtered extracts was separated and diluted with DI to 15 mL. These diluted extracts were then kept in the sample queue of SAMERA for OP analyses. SAMERA withdraws a different volume of these extracts into reaction vials (RVs) for each OP measurement, i.e., 3.5 mL for OPAA, OPGSH, and OPOH−SLF and 2.1 mL for OPDTT and OPOH−DTT measurements, all of which were further diluted to 5 mL in the RVs. Thus, the concentrations of PM2.5 in RVs for SLF-based (i.e., OPAA, OPGSH, and OPOH−SLF) and DTT-based (i.e., OPDTT and OPOH−DTT) assays were maintained constant at 50 and 30 µg mL−1 (±1 %), respectively.
For methanol-soluble OP measurements, another fraction from each filter having the same area as used for the water-soluble PM2.5 extraction was punched and extracted in 10 mL of methanol. After sonication for 1 h, the suspensions were filtered through the 0.45 µm PTFE syringe filter. The filtered extracts were then concentrated to less than 50 µL using a nitrogen dryer to evaporate methanol and were subsequently reconstituted in DI to the exact same volume as the water-soluble extracts. Reconstituted methanol extracts were vigorously shaken on an analog vortex mixer (VWR International, Batavia, IL, US) for at least 60 s at 3200 rpm to ensure a thorough flushing of the components probably deposited along the wall of the vials during evaporation. These methanol-soluble extracts were then analyzed for OP in the same way as water-soluble extracts.
2.3 OP analysis
OP activities of PM2.5 extracts were analyzed using SAMERA. The setup and operation protocol of SAMERA have been discussed in detail in Yu et al. (2020). Briefly, the analysis of all OP endpoints for each extract was conducted in two stages: SLF-based endpoints were analyzed first, while DTT-based assays were conducted in the second stage. For measuring OPAA and OPGSH, 3.5 mL of the extract was mixed with 0.5 mL SLF and 1 mL of 0.5 M potassium phosphate buffer (K-PB) in an RV. SLF was made following the protocol of Yu et al. (2020), i.e., by mixing equal volumes (1 mL each) of four antioxidant stock solutions – 20 mM AA, 10 mM GSH, 30 mM citric acid (CA), and 10 mM UA – and diluting the mixture with DI to 10 mL. Final concentrations of the antioxidants in the RV used for incubating the sample were 200 µM AA, 100 µM GSH, 300 µM CA, and 100 µM UA. At certain time intervals (i.e., 5, 24, 43, 62, and 81 min), two small aliquots of the reaction mixture were withdrawn and dispensed into two measurement vials (MV1 and MV2) separately. The mixture in MV1 was diluted by DI and was directly injected into a liquid waveguide capillary cell (LWCC-3100; World Precision Instruments, Inc., Sarasota, FL, USA) coupled to an online spectrophotometer (Ocean Optics, Inc., Dunedin, FL, USA), which measured the absorbance at 265 nm (signal from AA) and 600 nm (background) for determining the concentration of AA. 1.6 mL of o-phthalaldehyde (OPA) was added into the reaction mixture contained in MV2 to react with GSH, which forms a fluorescent product. The final mixture in MV2 was then pushed through a flow cell equipped in a Horiba Fluoromax-4 spectrofluorometer (Horiba Scientific, Edison, NJ, USA), and the fluorescence was measured at an excitation–emission wavelength of 310 427 nm. Simultaneously with the preparation of the reaction mixture for OPAA and OPGSH analyses, 3.5 mL of the extract was mixed with 0.5 mL SLF and 1 mL of 50 mM K-PB buffered disodium terephthalate (TPT) (pH = 7.4) in another RV2. TPT captures •OH generated in the reaction and forms another fluorescent product: 2-hydroxyterephthalic acid (2-OHTA). Small aliquots of this reaction mixture were withdrawn into MV2 at selected time intervals (10, 29, 48, 67, and 86 min), diluted by DI, and injected into the flow cell of the spectrofluorometer for measuring fluorescence at the same wavelengths as used for GSH measurement (i.e., 310 nm excitation and 427 nm emission). The concentration of 2-OHTA was determined by calibrating various concentrations (10–500 nM) of 2-OHTA standards, and the generation rate of •OH was determined as the formation rate of 2-OHTA divided by a yield factor (0.35) (Son et al., 2015).
Both RVs and MVs were flushed with DI after all SLF-based endpoints were analyzed, and DTT-based assays started immediately after this cleaning. Similar to the first step of the SLF assay, 2.1 mL of the diluted PM2.5 extract was mixed with 1 mL of 50 mM TPT, 1.4 mL of DI, and 0.5 mL of 1 mM DTT in an RV. At certain time intervals (i.e., 5, 17, 29, 41, and 53 min), two small aliquots of this reaction mixture were withdrawn and diluted with DI in MV1 and MV2 separately for the measurement of DTT and •OH, respectively. DTNB was added into MV1 to capture residual DTT. The final mixture in MV1 was pushed through LWCC to measure the absorbance at 412 nm, while the mixture in MV2 was pushed through the flow cell of the spectrofluorometer for fluorescence measurement (310 nm excitation and 427 nm emission). The system was again cleaned by flushing DI to RVs, MVs, LWCC, and the flow cell of the spectrofluorometer for the next run. Once a week, we conducted a thorough cleaning of the entire system by replacing all chemicals and samples first with methanol, followed by DI, and running the program script 10 times with each solvent.
2.4 Quality control and quality assurance
One field blank filter extract along with a DI blank were used as the negative controls for each set of PM2.5 samples analyzed in a batch (usually ∼10). Selected metals and organic compounds that are known to be sensitive for different OP endpoints, i.e., Cu(II) for OPAA and OPGSH, Fe(II) for OPOH−SLF, phenanthraquinone (PQ) for OPDTT, and 5-hydroxy-1,4-naphthoquinone (5-H-1,4-NQ) for OPOH−DTT, were used as the positive control and were analyzed weekly with PM2.5 samples to ensure the stability of SAMERA and correct for any possible drift.
Table 1Averages (± standard deviation) of OP from various control groups (N=10) analyzed by SAMERA.
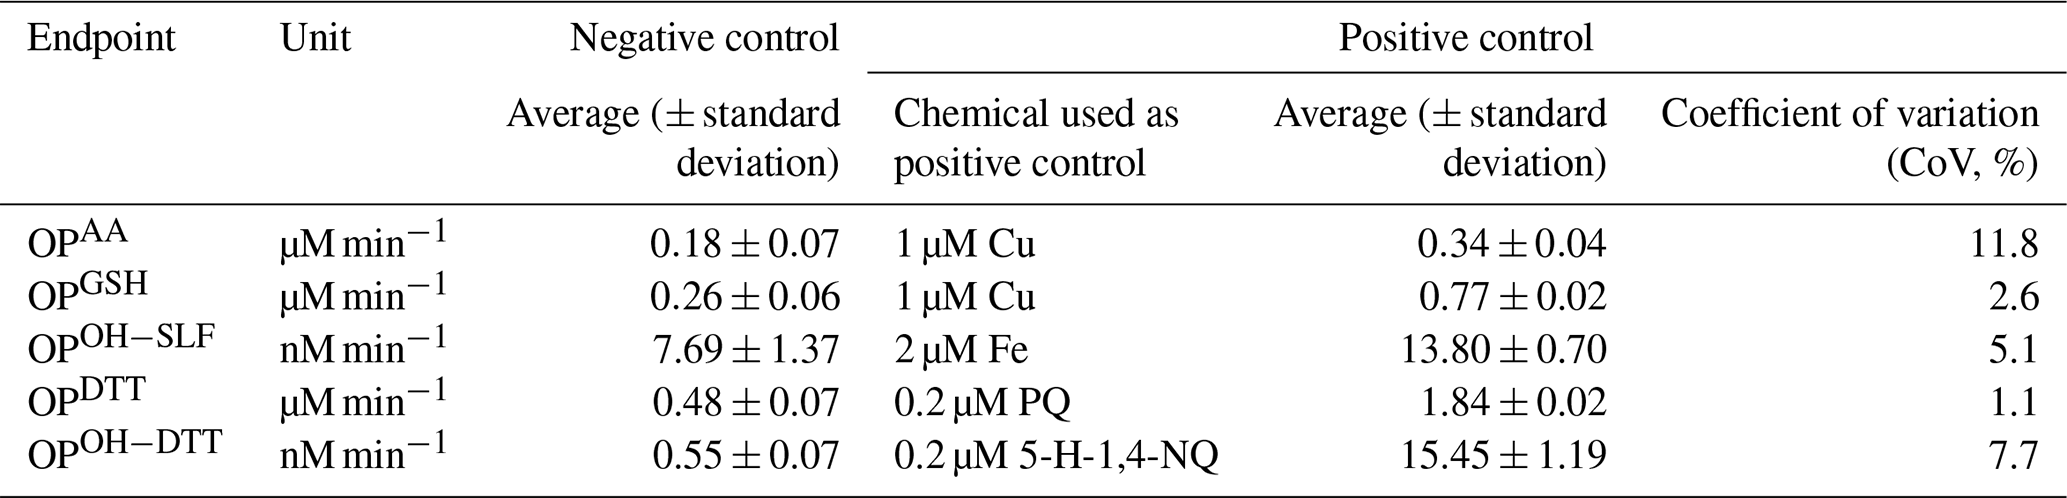
The average and standard deviation of OP for negative and positive controls are shown in Table 1. Our previous study on the development of SAMERA (Yu et al., 2020) reported the values of OP for negative controls as 0.17±0.07 µM min−1 for OPAA, 0.37±0.06 µM min−1 for OPGSH, 4.57±1.21 nM min−1 for OPOH−SLF, 0.65±0.02 µM min−1 for OPDTT, and µM min−1 for OPOH−DTT, which are consistent with the values reported in Table 1. The precision of SAMERA was previously assessed using water-soluble extracts, and the coefficient of variations (CoVs) were reported to be less than 14 % (7.9 %–13.3 %) for all OP endpoints (Yu et al., 2020). We also assessed the precision using methanol-soluble extracts and found similar levels of CoVs, i.e., 8.9 %–14.5 % for all OP endpoints (see Table S2). Consistency of our current results for negative controls with those reported earlier, and the low CoVs obtained for the positive controls (1.1 %–11.8 %) and PM2.5 extracts, ensured good quality assurance for the overall OP analysis. We blank-corrected all OP values of ambient samples by subtracting the averaged field blank measurements. After blank correction, the OP values below the detection limit were replaced with half of the detection limits for the corresponding OP endpoint. The mass-normalized (intrinsic, OPm) and volume-normalized (extrinsic, OPv) OP levels were obtained by dividing the blank-corrected OP activities by the extracted PM2.5 mass (for OPm) and by the volume of air collected on the extracted fractions of filters (for OPv), respectively. The detailed calculations of OPm and OPv have been previously described in Yu et al. (2020).
2.5 Statistical analysis
To assess spatiotemporal variability in both OP and PM2.5 mass, we compared their differences among all sites and seasons using a one-way analysis of variance (ANOVA) test, and different pairs (i.e., pairs of different sites or seasons) were compared by Fisher's least significant difference (LSD) post hoc test. The significant and highly significant differences were considered by one-way ANOVA when P<0.05 and P<0.01, respectively. Pearson's correlation coefficient (r) for single linear regression was computed to determine the correlation of OP between different sites, between water-soluble and methanol-soluble OP, and between OP and PM2.5, as well as the intercorrelation among different endpoints for each site. All PM2.5 samples were assessed for spatiotemporal variability. However, since several OP endpoints (e.g., OPAA, OPGSH, and OPDTT) were abnormally elevated in the week of 4 July (Independence Day celebration; discussed in Sect. 3.2), we removed this week's sample from our regression analysis to avoid any bias caused by this episodic event. Site-to-site comparisons were performed by calculating the coefficient of divergence (COD) of mass concentration and volume-normalized OP (i.e., OPv) for all site pairs as follows:
where cij and cik are the PM2.5 mass or OPv measured in the same week i at sites j and k, respectively, and N is the number of comparable sample pairs for sites j and k. COD ranges from 0 to 1. A larger COD (closer to 1) indicates more spatial heterogeneity between the sites, while a smaller COD (closer to 0) implies spatial homogeneity. A one-way ANOVA test was conducted in MATLAB R2019a, while other statistical analyses were carried out using Excel.
Table 2Seasonal averages (± standard deviation) of PM2.5 mass concentrations (unit: µg m−3) at our sampling sites.
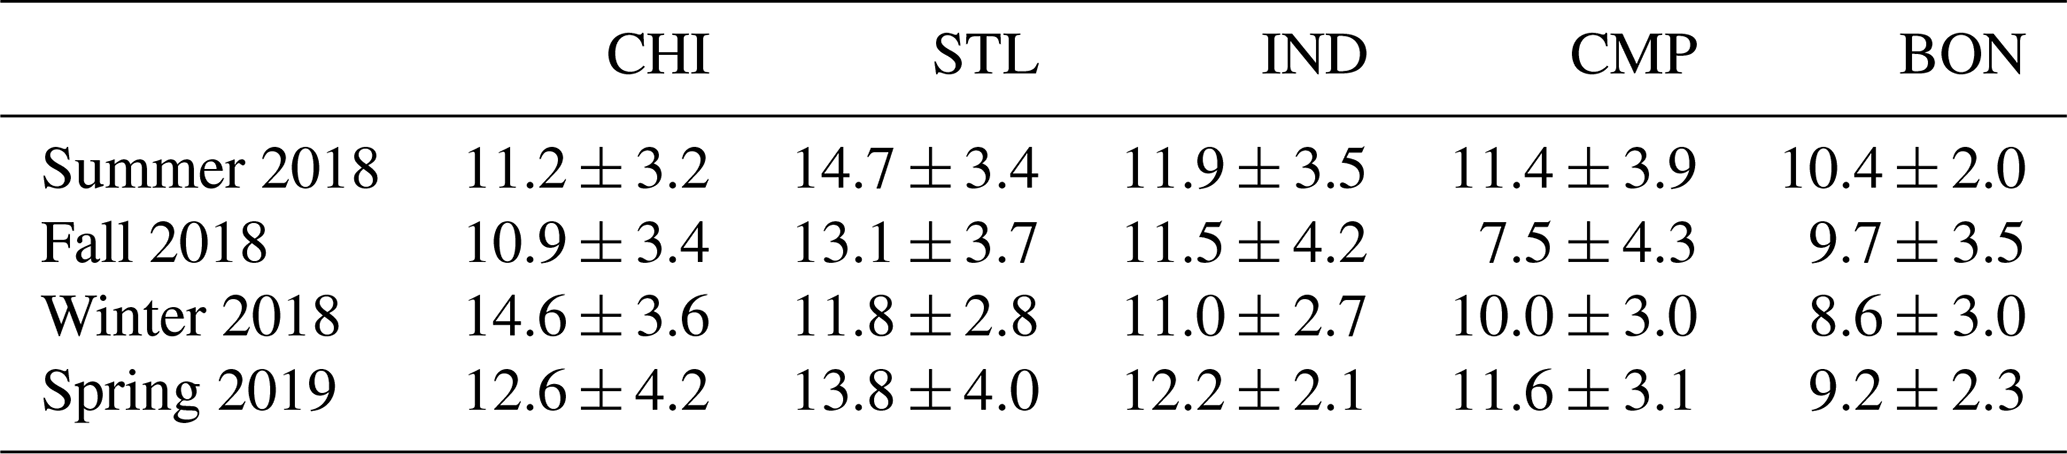
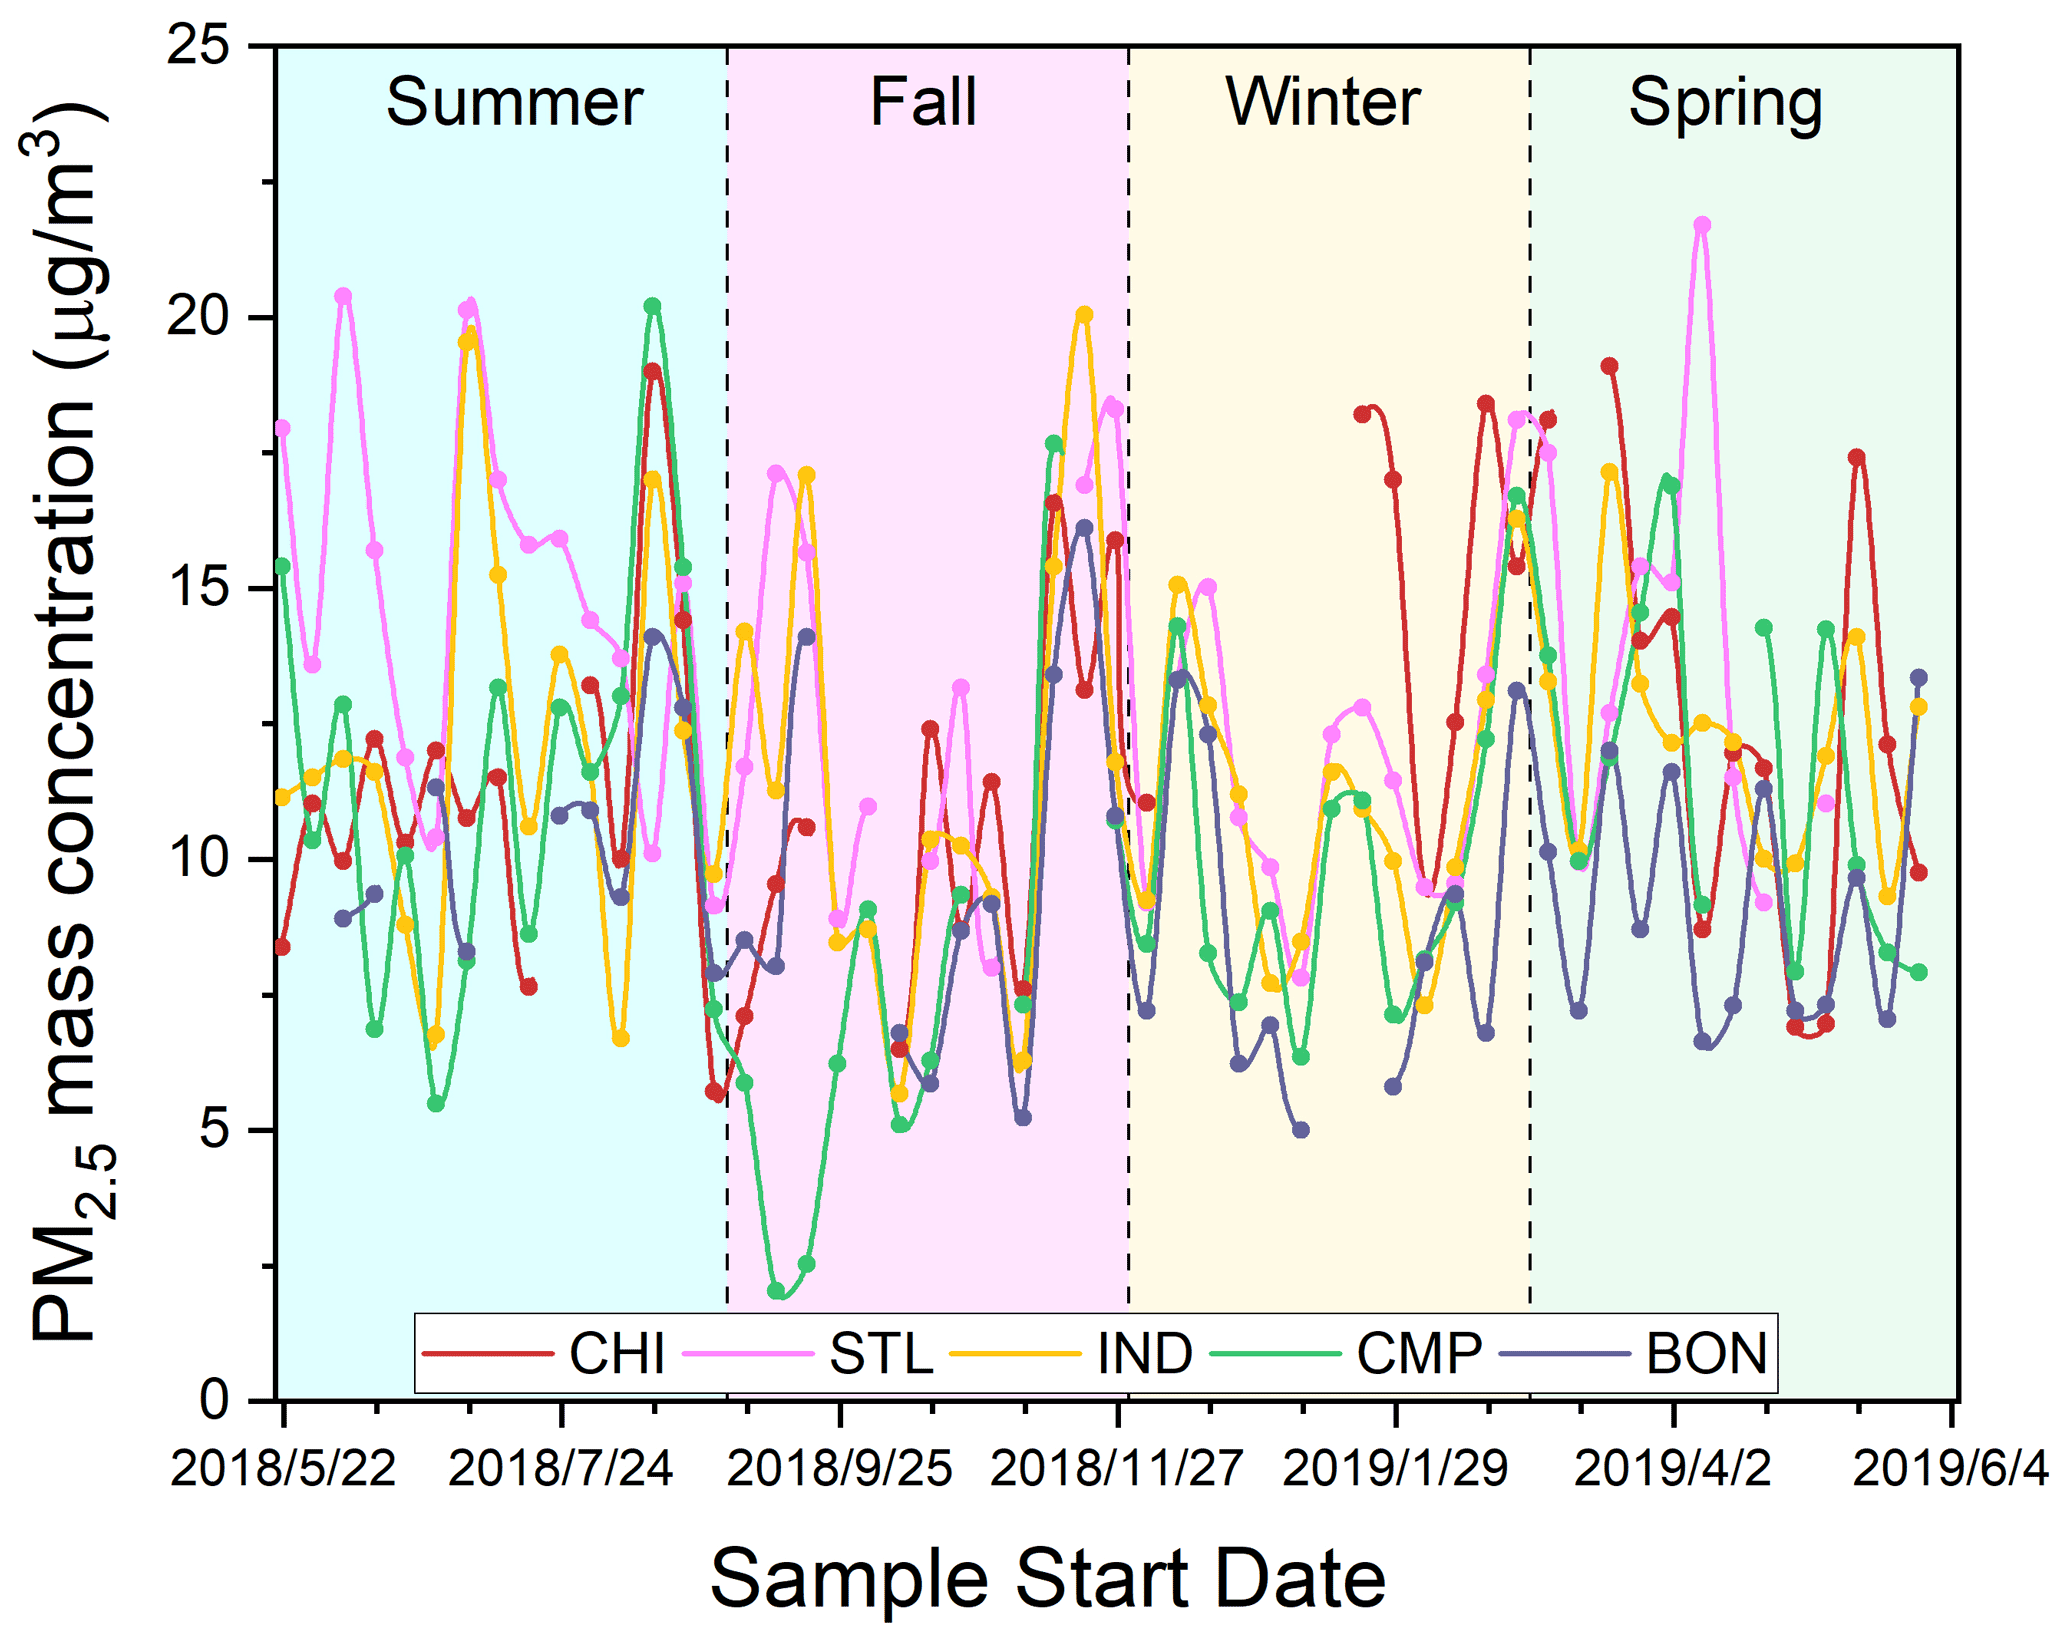
Figure 2Time series of PM2.5 mass concentrations at our sampling sites in the Midwestern US.
3.1 PM2.5 mass concentration
Figure 2 shows the time series of 3 d averaged PM2.5 mass concentration at five sampling sites, while the seasonal averages are shown in Table 2. The mass concentrations ranged from 2.0 to 21.7 µg m−3 across all sites, and the median was 11.0 µg m−3. These results are comparable with the typical ranges of PM2.5 in Midwestern US cities (2.1–48.6 µg m−3), e.g., St. Louis (Lee et al., 2006), Chicago (Milando et al., 2016), Detroit (Gildemeister et al., 2007), Bondville, and selected cities in Iowa (e.g., Cedar Rapids, Des Moines, and Davenport) (Kundu and Stone, 2014), as measured in several previous studies. Generally, the more urbanized sites of our study (i.e., CHI, STL, and IND) showed slightly higher mass concentrations (5.7–21.7 µg m−3; median: 11.8 µg m−3) compared to the smaller cities like CMP and its rural component (i.e., BON) (2.0–20.2 µg m−3; median: 9.2 µg m−3). The highest mass concentrations were recorded at CHI during winter (P<0.01; Table S3) and STL during summer (P<0.05), while BON exhibited the lowest concentrations in all seasons, except fall when the mass concentrations were lowest at CMP (P<0.05). Other than these minor variations, the PM2.5 mass concentrations are both spatially and temporally homogeneous in the Midwestern US with no significant seasonal differences (P>0.05 at most sites).
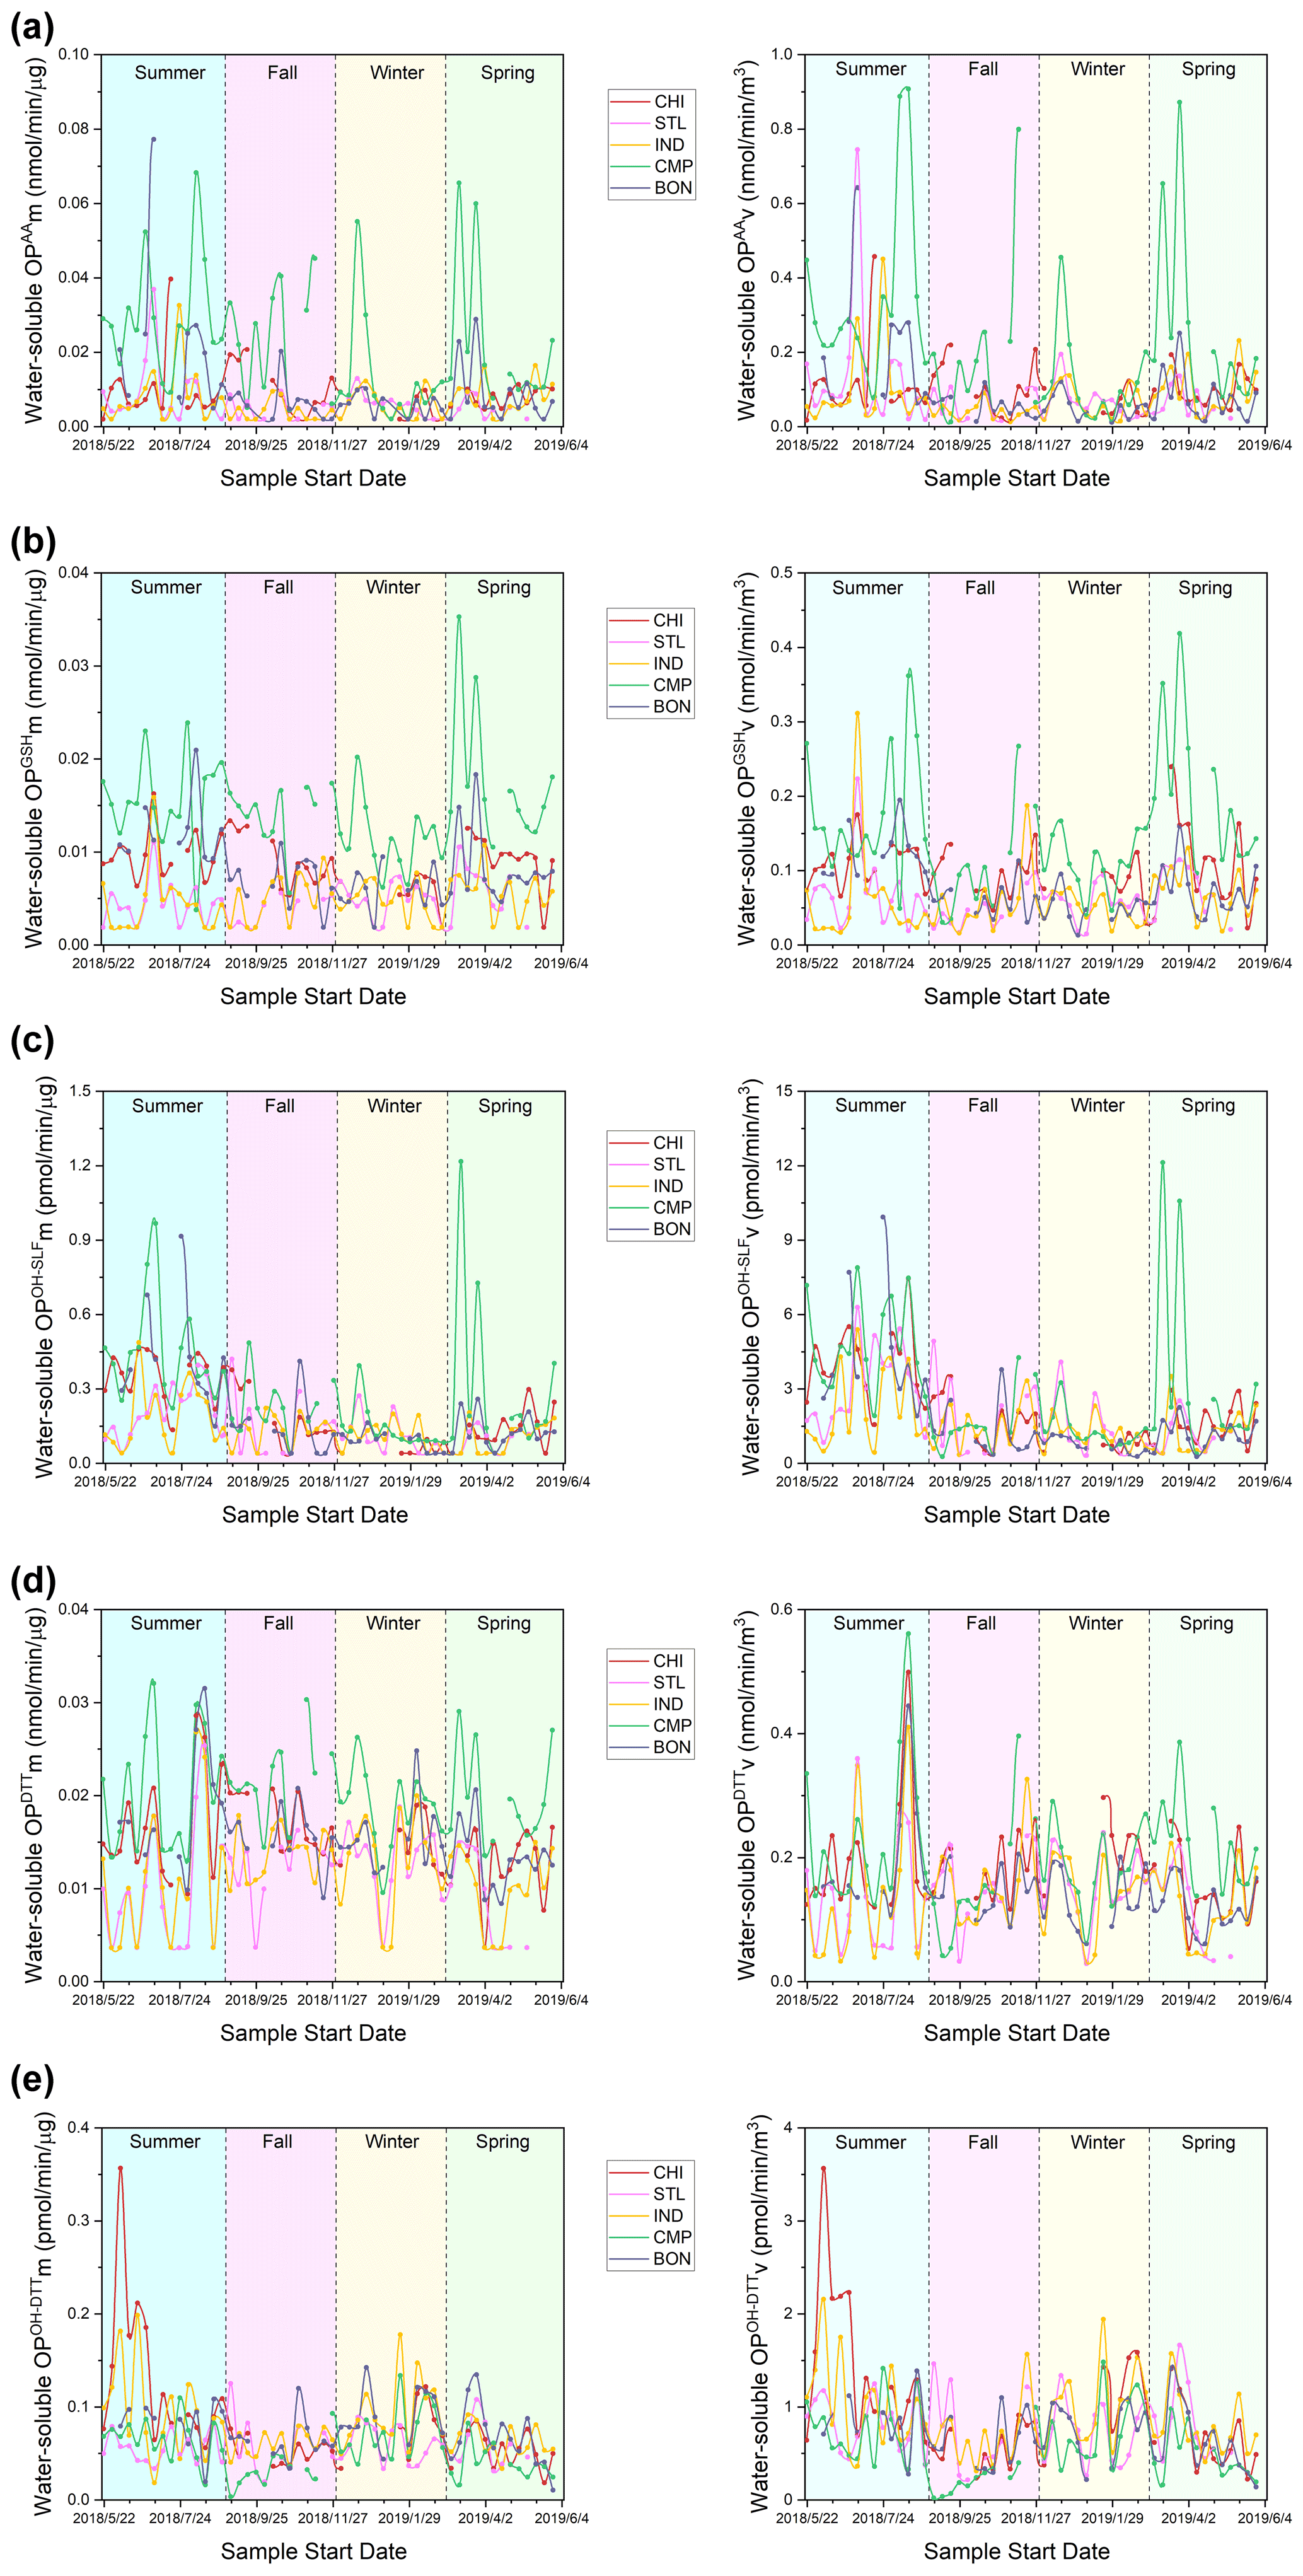
Figure 3Time series of mass-normalized (left) and volume-normalized (right) water-soluble OP activities for (a) OPAA, (b) OPGSH, (c) OPOH−SLF, (d) OPDTT, and (e) OPOH−DTT at our sampling sites.
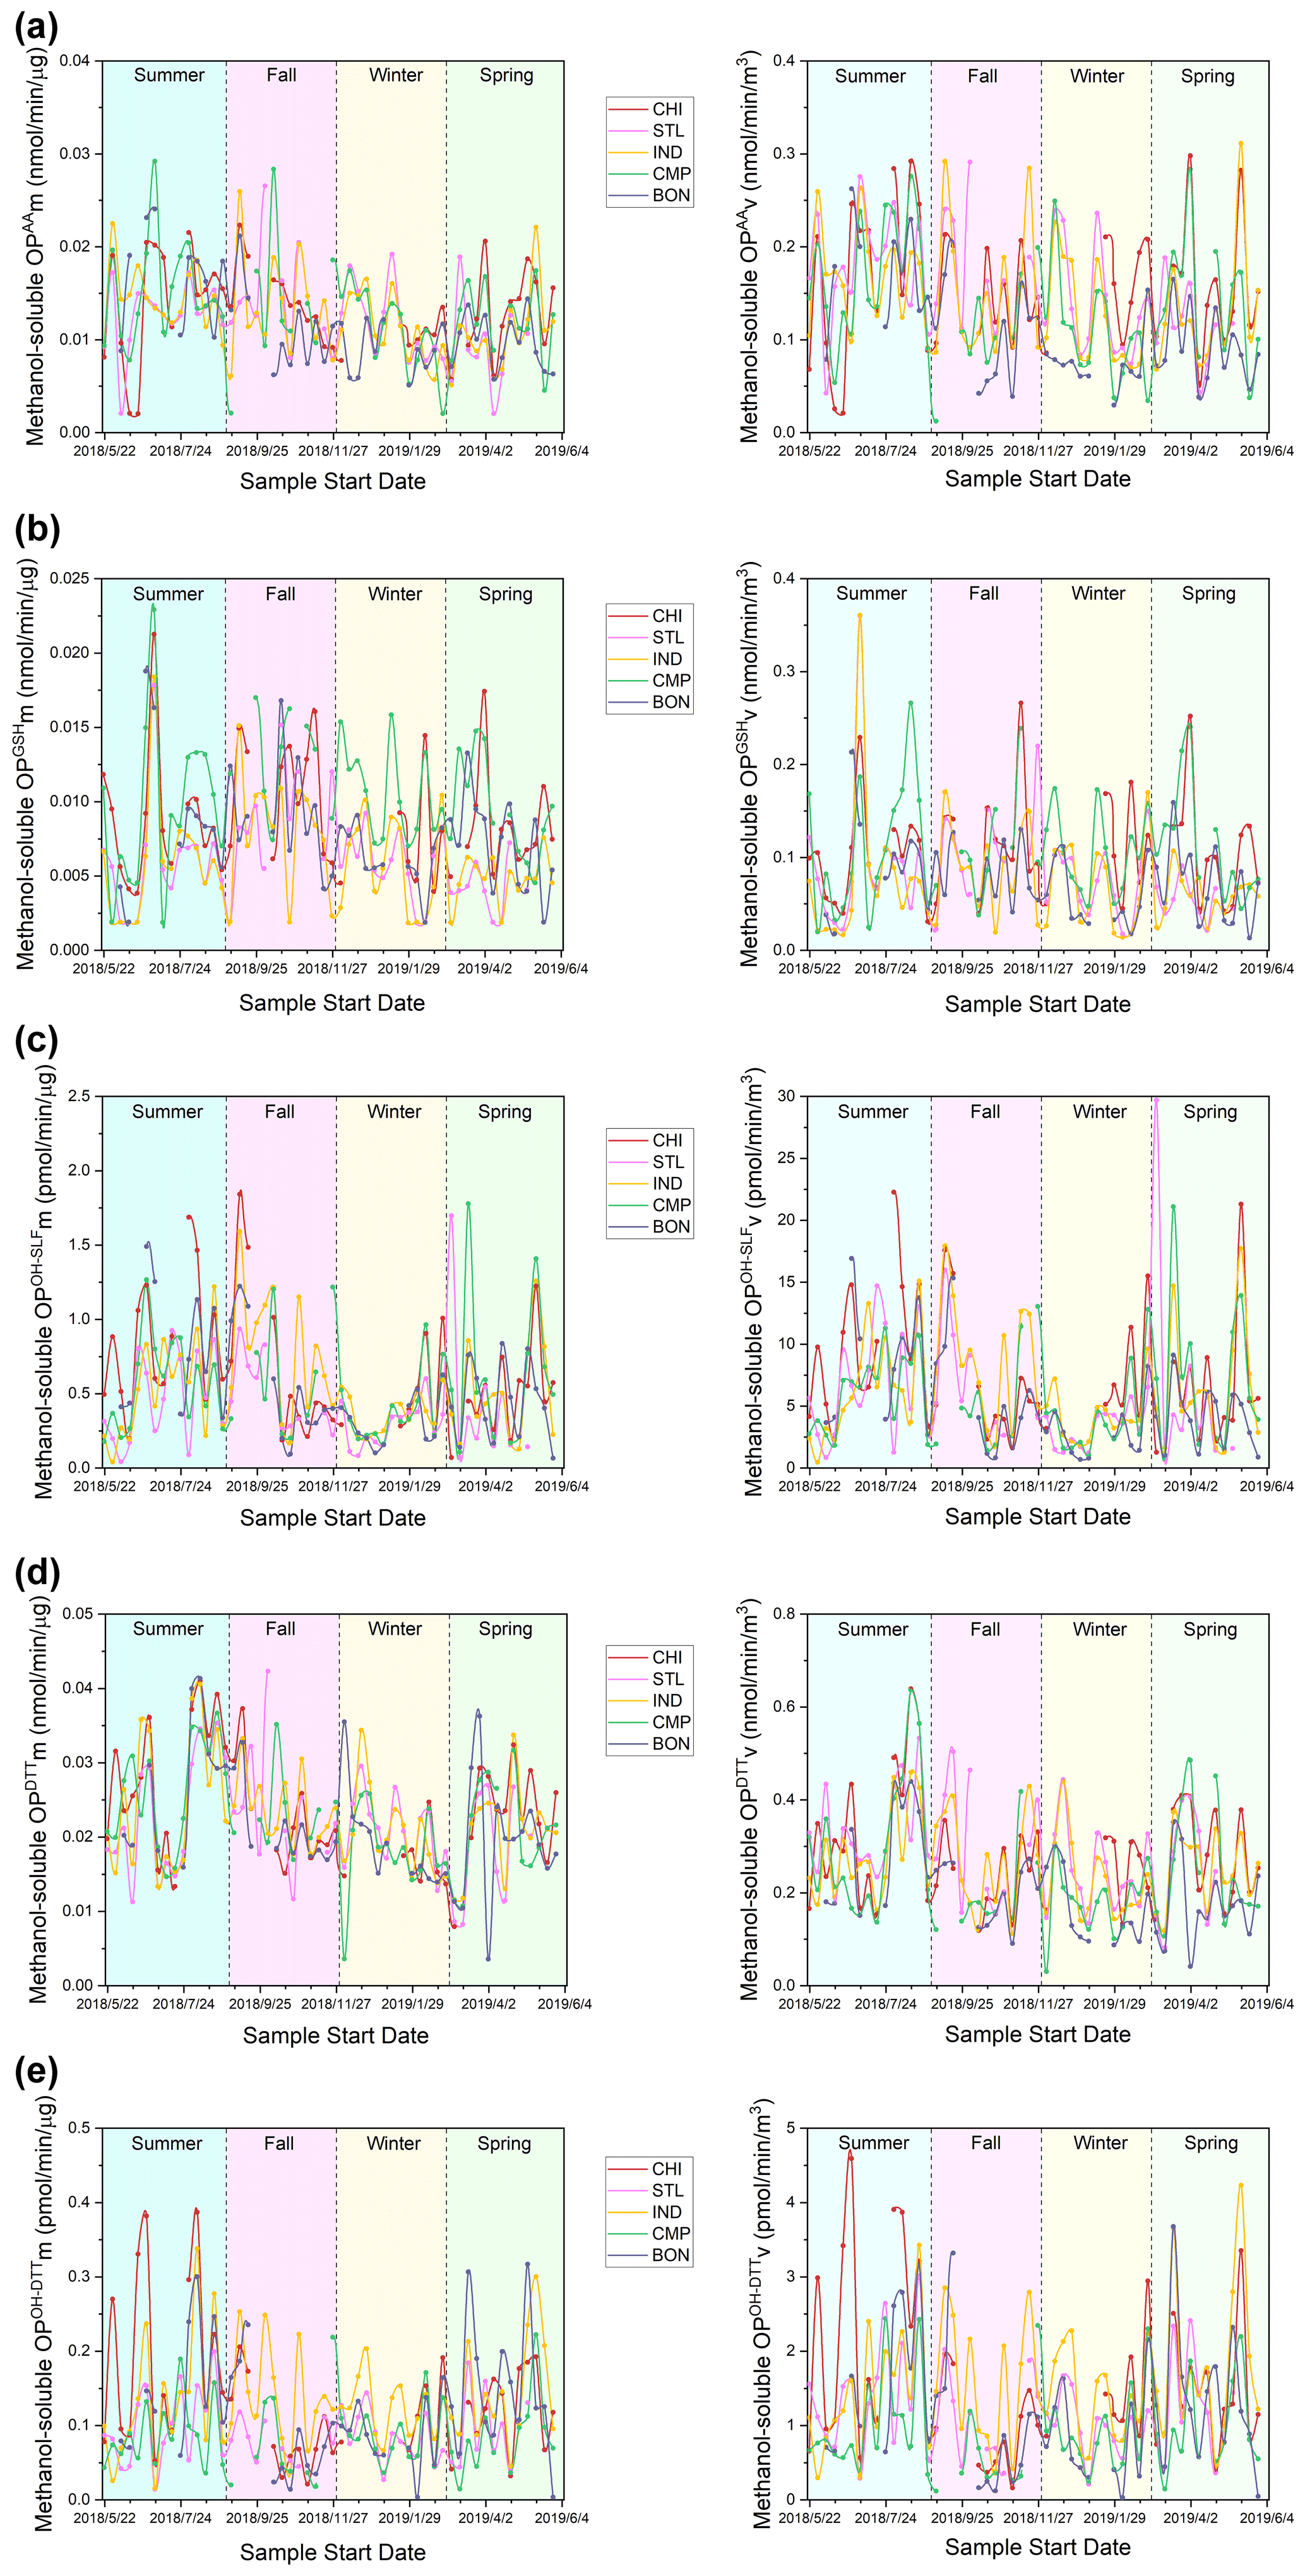
Figure 4Time series of mass-normalized (left) and volume-normalized (right) methanol-soluble OP activities for (a) OPAA, (b) OPGSH, (c) OPOH−SLF, (d) OPDTT, and (e) OPOH−DTT at our sampling sites.
3.2 Spatiotemporal variation in PM2.5 OP
Time series of both mass- and volume-normalized OP (OPm and OPv, respectively) at all the sites are shown in Fig. 3 (water-soluble OP) and Fig. 4 (methanol-soluble OP). Seasonally averaged OPm and OPv of water-soluble and methanol-soluble PM2.5 are also shown in Figs. 5 and 6, respectively. Differences in both OPm and OPv among different seasons or sites were determined by one-way ANOVA, and the results are listed in the Supplement in Table S4 (water-soluble OP) and Table S5 (methanol-soluble OP). Generally, OP showed much more spatiotemporal variability than the PM2.5 mass in the Midwestern US.
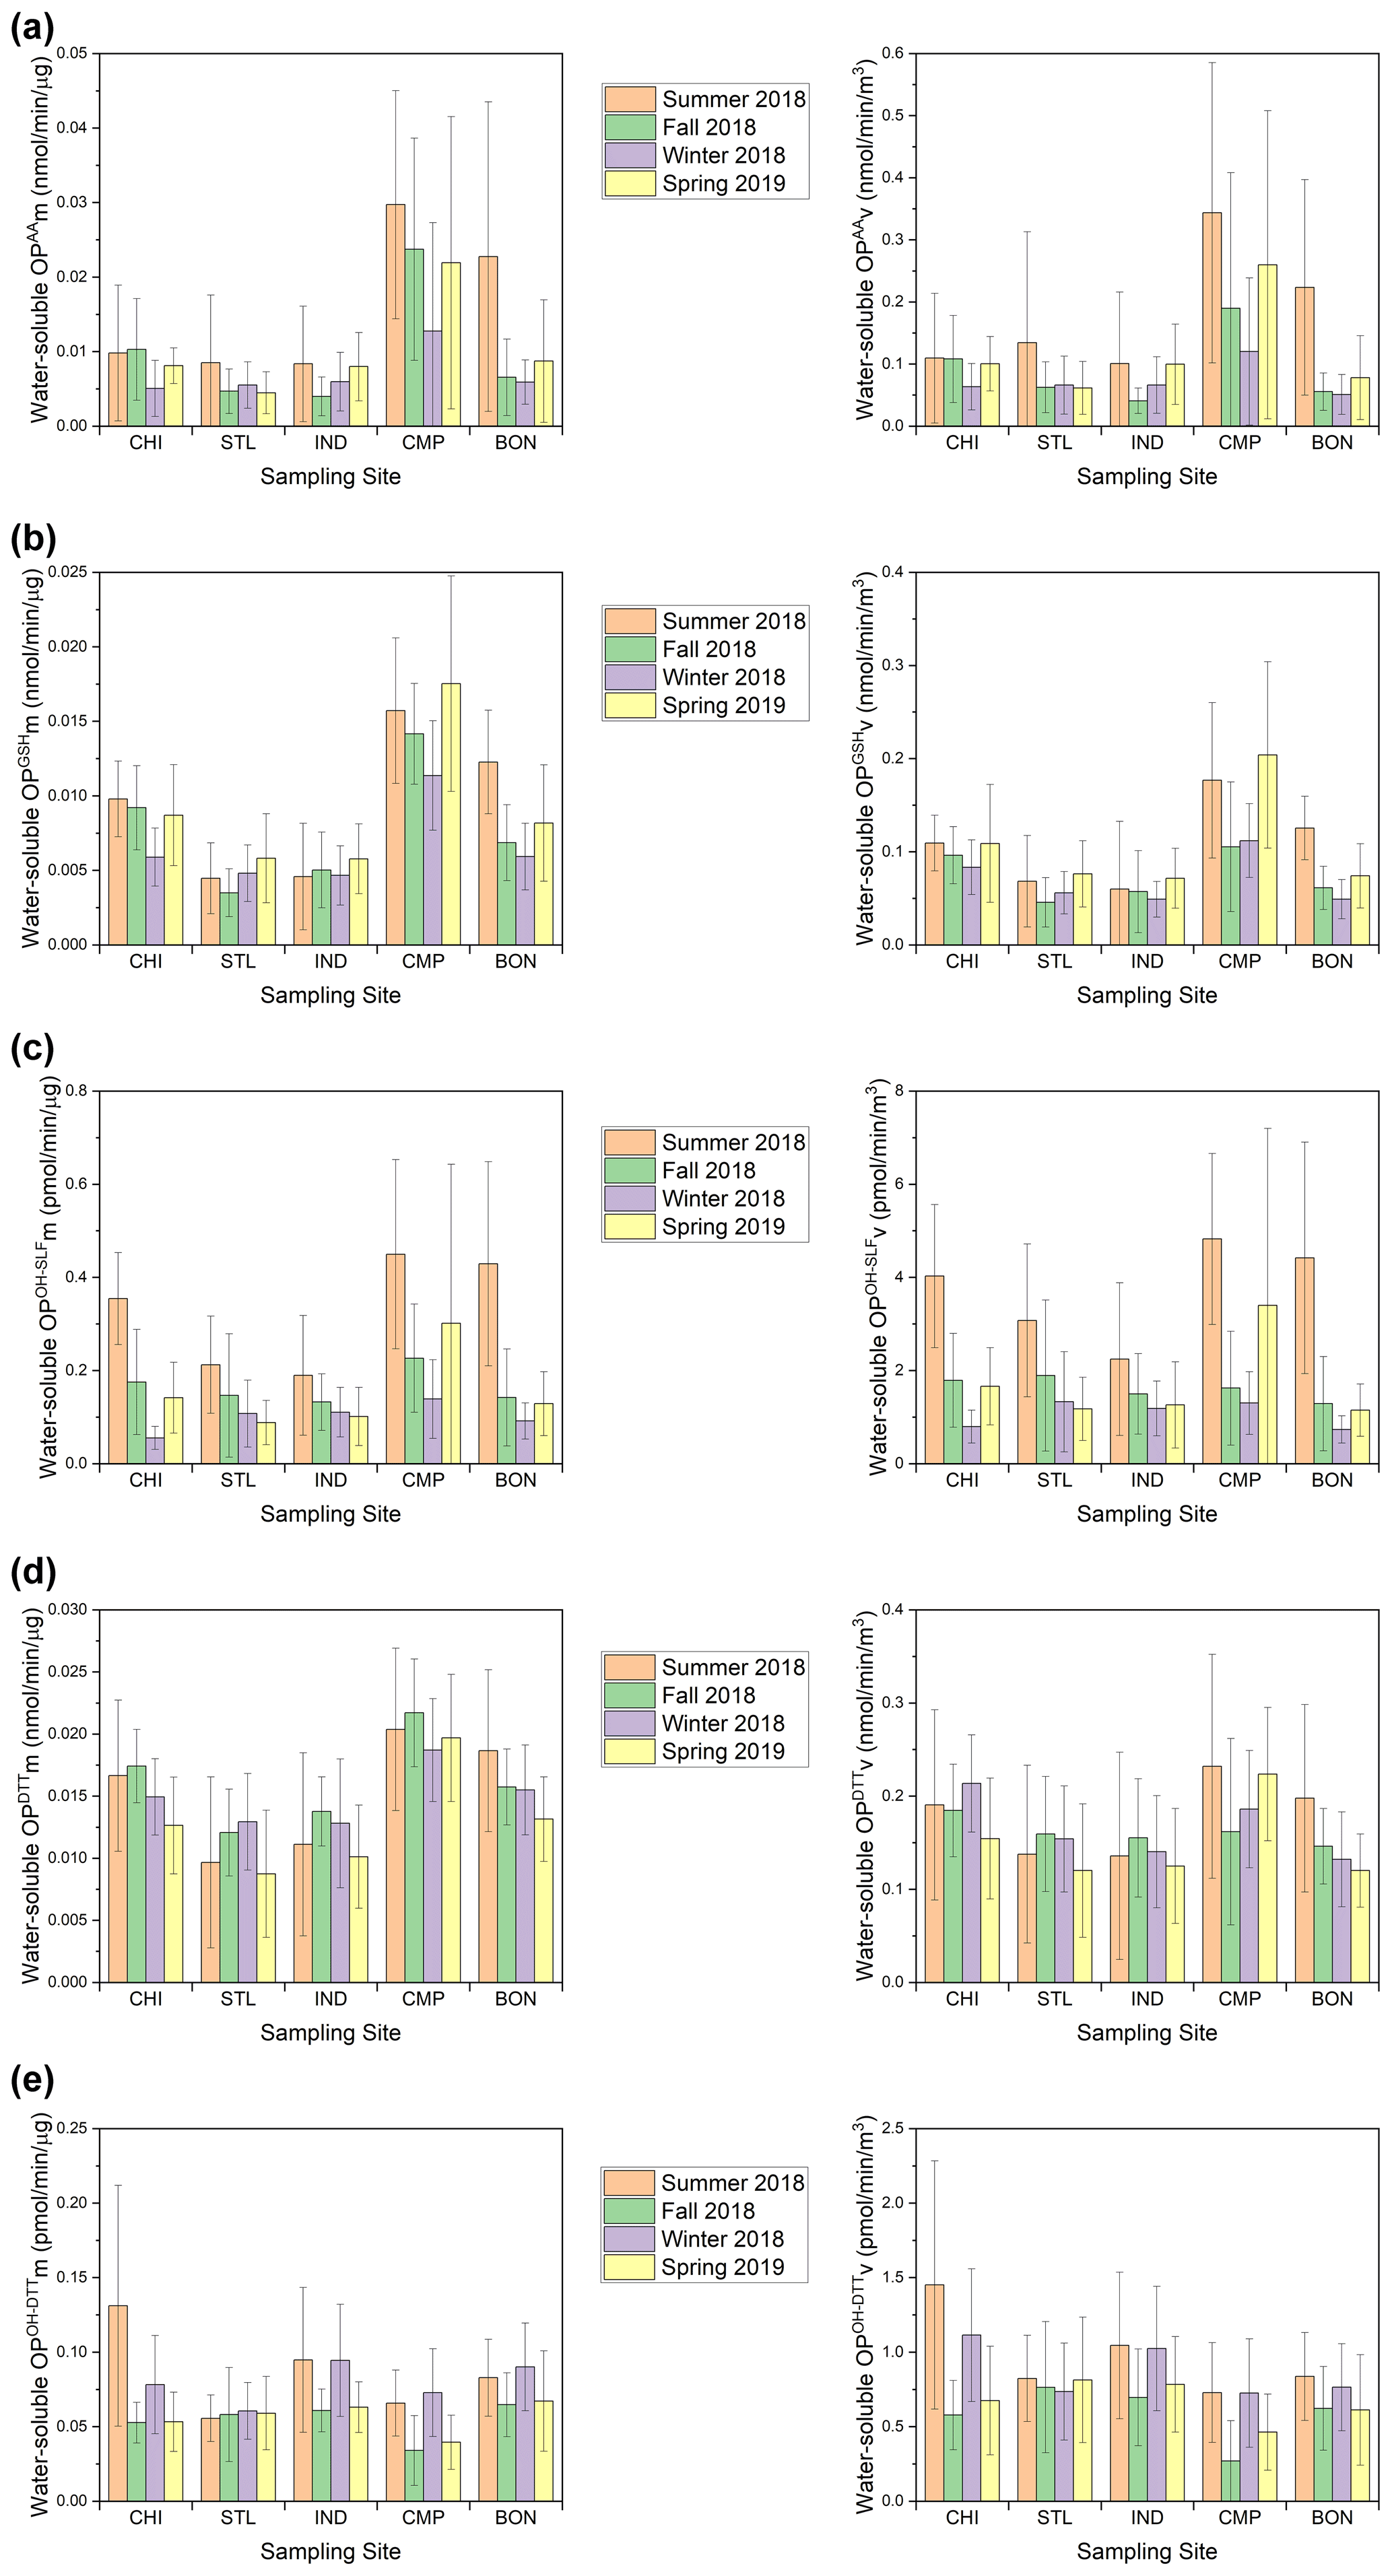
Figure 5Seasonal averages of mass-normalized (left) and volume-normalized (right) water-soluble OP activities for (a) OPAA, (b) OPGSH, (c) OPOH−SLF, (d) OPDTT, and (e) OPOH−DTT at our sampling sites.
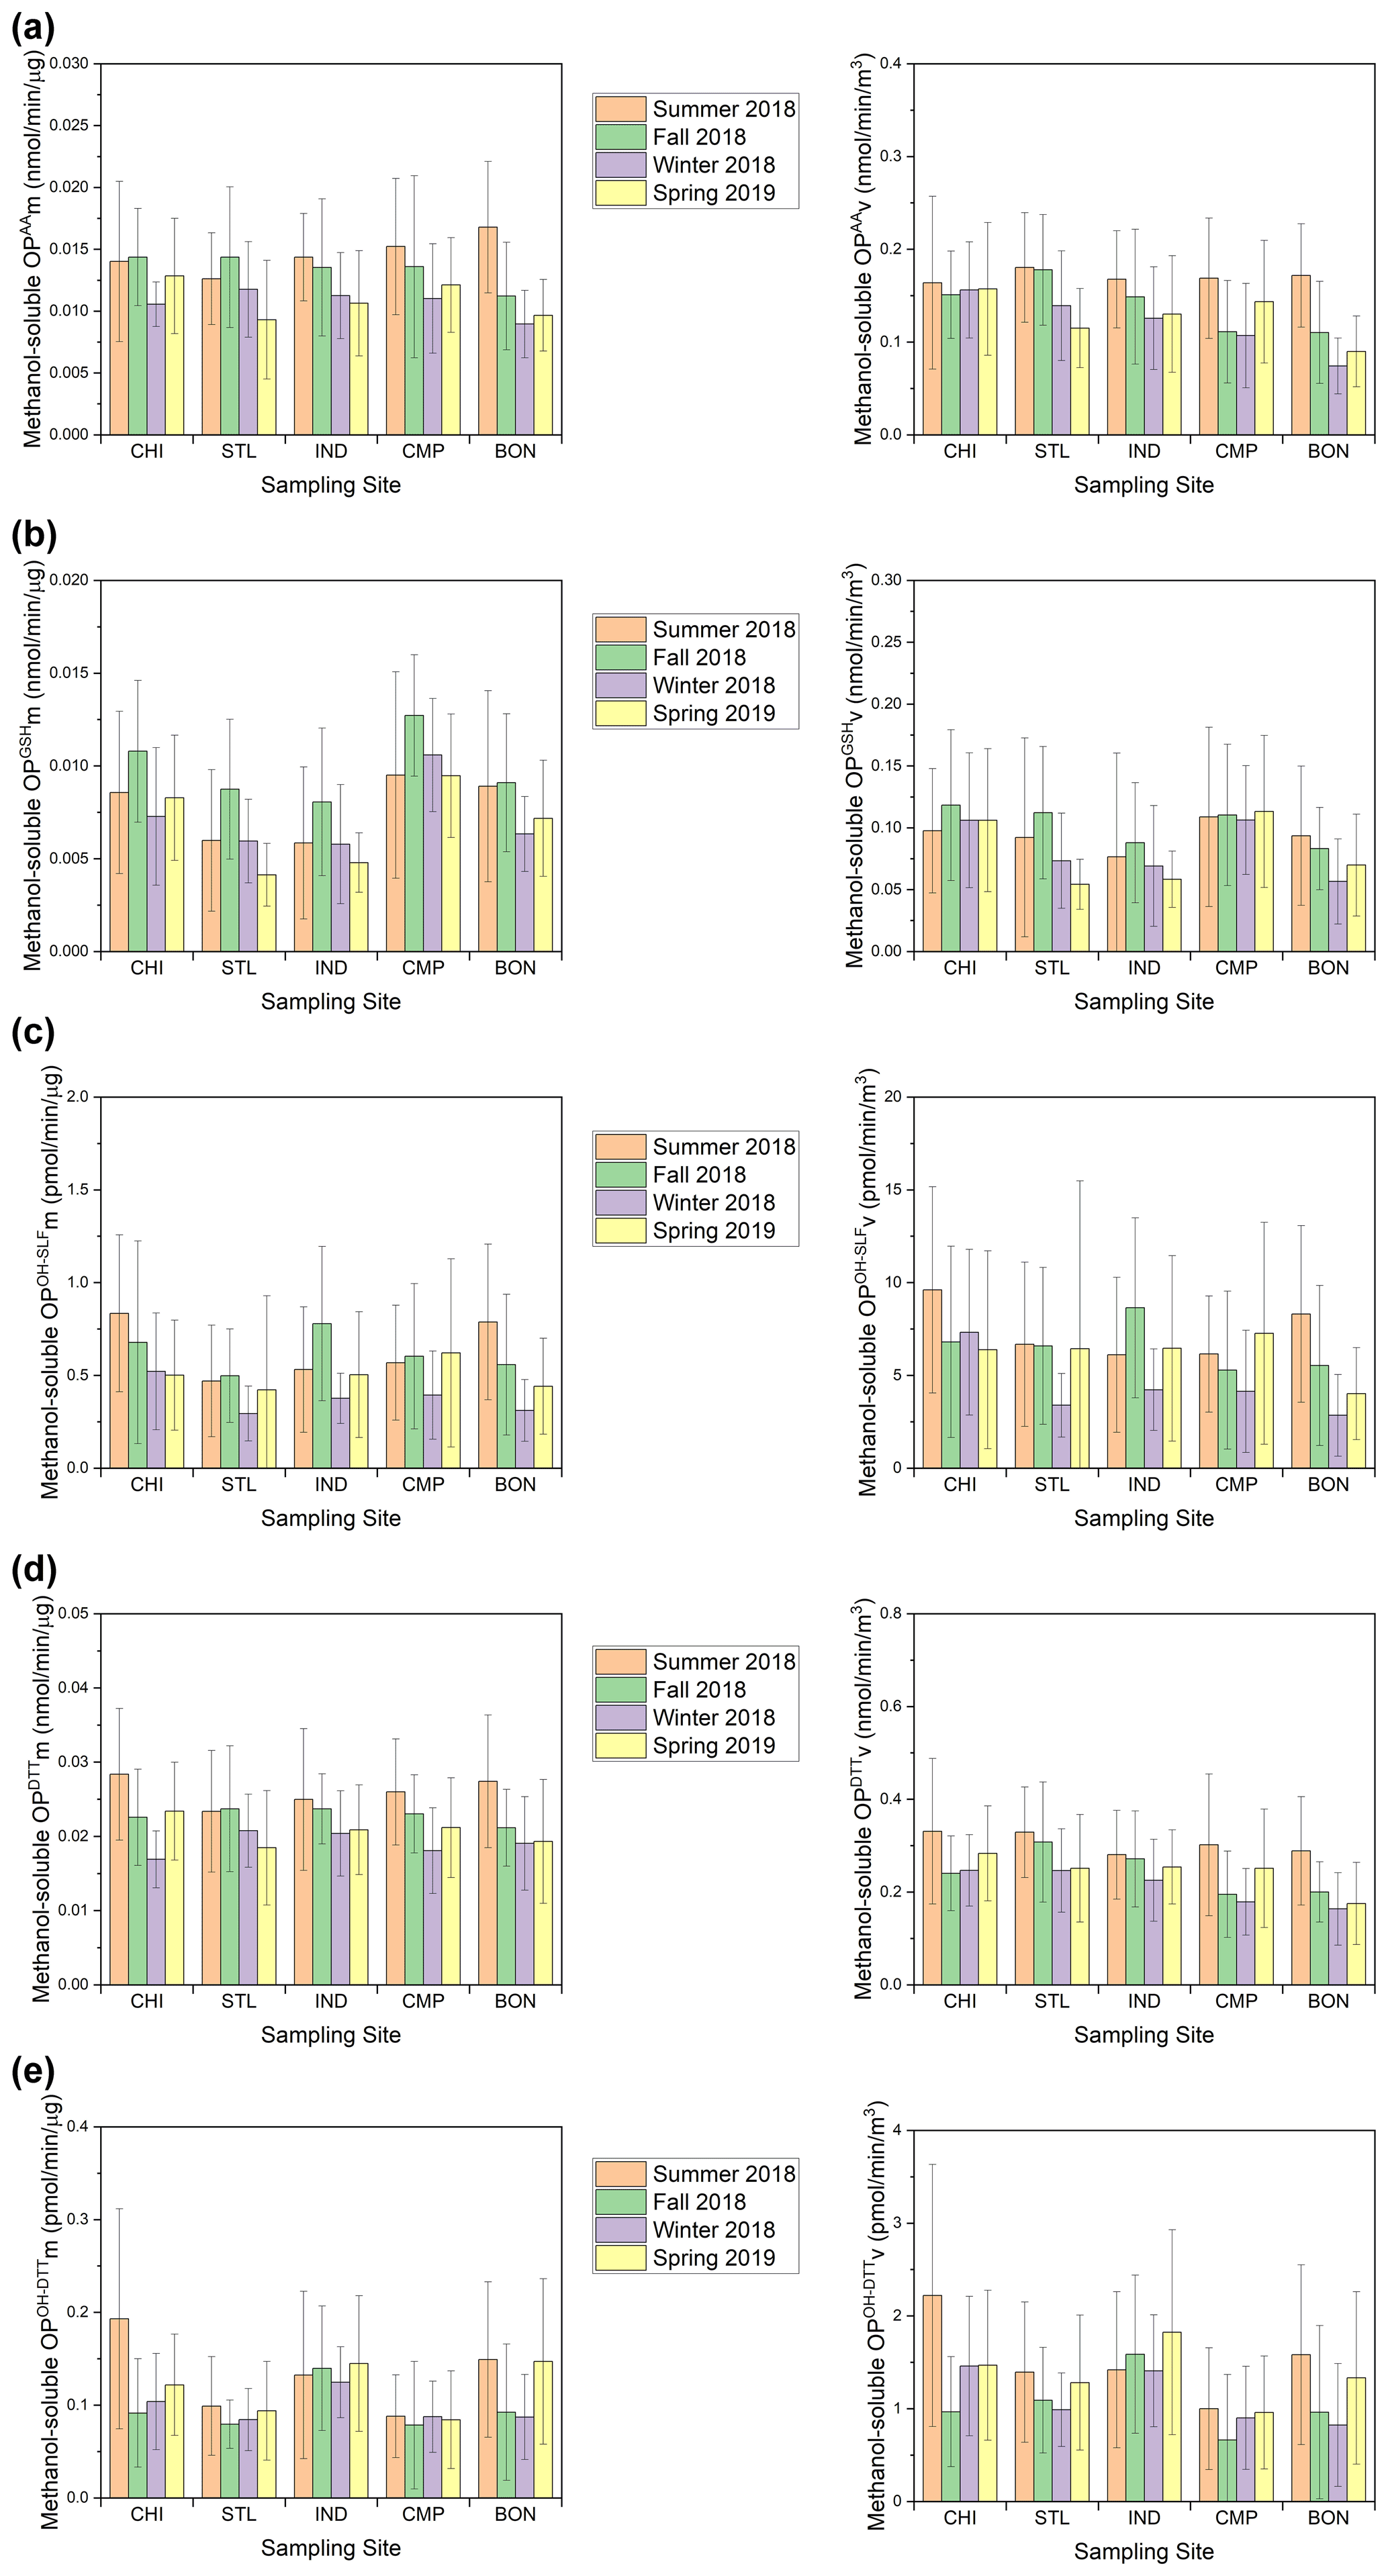
Figure 6Seasonal averages of mass-normalized (left) and volume-normalized (right) methanol-soluble OP activities for (a) OPAA, (b) OPGSH, (c) OPOH−SLF, (d) OPDTT, and (e) OPOH−DTT at our sampling sites.
3.2.1 Water-soluble PM2.5 OP
Figures 3 and 5 (time series and seasonal averages of water-soluble OP) show significant spatial variability for SLF-based endpoints, particularly OPAA and OPGSH, in comparison to DTT-based OP (i.e., OPDTT and OPOH−DTT) for both mass- and volume-normalized results. The highest OPAA and OPGSH activities (both mass- and volume-normalized) occurred at CMP (P<0.01) in most seasons. OPOH−SLF was more spatially uniformly distributed than OPAA and OPGSH; significantly higher OPOH−SLFm and OPOH−SLFv were observed at CMP only in summer and spring (P<0.05). For the DTT-based endpoints, OPDTTv was only marginally higher at CHI in winter and at CMP in summer and spring. Other than that, no significant differences were observed for OPDTTv among various sites. The spatially uniform pattern for OPDTTv is consistent with Verma et al. (2014), who found limited spatial variation for OPDTTv in the southeastern US. In contrast, there was a significant variation in the OPDTTm, with elevated levels at CMP (P<0.01) in all seasons. Interestingly, the OPOH−DTT endpoint showed more spatial variability and was generally lowest at CMP (P<0.05) – the site which showed the highest levels for other OP endpoints. It implies that although OPDTT and OPOH−DTT endpoints are measured in the same DTT assay, different chemical components play differential roles in these endpoints. We found very similar spatial patterns of mass- and volume-normalized OP activities for most endpoints, indicating only a marginal role of PM2.5 mass concentrations in causing the spatial variability in OP levels.
Seasonally, the highest OP activities were generally observed in summer, while the lowest activities usually occurred in winter (Fig. 5). An exception to this trend was OPDTT, which exhibited limited temporal variation at most sites, with only slightly higher OPDTT observed in summer at BON (P<0.05). The temporal uniformity of OPDTT in this study does not correspond to previous studies conducted in the southwestern and southeastern US. For the southeastern US, Verma et al. (2014) found significantly higher OPDTTv in winter (December 2012) compared to summer (June to August 2012), and this difference was even more pronounced in mass-normalized OP. Saffari et al. (2014) also observed higher OPDTT activities of quasi-ultrafine particles (PM0.25) in the fall and winter seasons for the southwestern US (Los Angeles Basin) and attributed this trend to the partitioning of redox-active semi-volatile organic compounds to the particle phase in colder seasons. However, the trend of OPAA in our study is in agreement with another study in the southeastern US (Fang et al., 2016), which showed higher OPAA in warmer seasons (i.e., summer and fall) than in winter. The seasonal trends of mass- and volume-normalized activities were nearly identical for all endpoints, again indicating a marginal effect of PM2.5 mass concentration on the temporal variation of OP.
Significant temporal variation was observed for CMP, with several spikes in the OP activities throughout the year, most prominently for OPAA (Fig. 3). These spikes might be attributed to the traffic, as CMP is the only site adjacent (<10 m) to a major urban road and located on the roof of a parking garage. One of our previous studies, Wang et al. (2018), reported large variations in several redox-active metals (e.g., Cu, Fe, Mn, Pb, and Zn), which have been known to be related to vehicular emissions (Hulskotte et al., 2007; Garg et al., 2000; Gietl et al., 2010; Apeagyei et al., 2011; Councell et al., 2004), at the same CMP site. Since SLF-based endpoints have been shown to be highly sensitive to metals (Ayres et al., 2008; Calas et al., 2018; Fang et al., 2016; Moreno et al., 2017; Charrier and Anastasio, 2015; Wei et al., 2018), the temporal variation in traffic intensity probably contributes to the spikes observed at CMP. The peaks in the week of 3 July were observed for multiple endpoints (e.g., OPAA, OPGSH, and OPDTT) at most sites, which is attributed to the emissions from firecrackers at Independence Day (4 July) celebrations (Yu et al., 2020; Puthussery et al., 2018).
3.2.2 Methanol-soluble PM2.5 OP
Compared to water-soluble OP, most OP endpoints in the methanol-soluble extracts showed weaker seasonal variations (Figs. 4 and 6), as also confirmed by relatively lower F values (median of F=1.61 shown in Table S5a compared to 2.71 for the water-soluble OP endpoints shown Table S4a). Similar to water-soluble OP, the highest activities for the methanol-soluble OP were generally observed in summer (Fig. 6). The spatial variations in OP were also weaker for the methanol-soluble extracts in comparison to water-soluble extracts (median of F=1.96 shown in Table S5b compared to 4.52 for the water-soluble OP endpoints shown in Table S4b). However, some significantly higher OP levels were observed at certain sites in different seasons, e.g., OPAAv at CHI in winter and spring, OPGSHv at CHI and CMP during winter and spring, OPGSHm at CMP in all seasons, OPOH−SLF at CHI in summer and winter, and OPOH−DTTm and OPOH−DTTv at CHI in summer (P<0.05). Other than these few cases, the spatiotemporal trends were again largely similar between mass- and volume-normalized methanol-soluble OP activities.
3.2.3 Comparison of OP in the Midwestern US with previous investigations
A comparison of the ranges of OP endpoints measured in our study with those reported in previous studies is provided in Table S6. The purpose of this comparison is to validate our measurements and present a larger perspective on the general levels of OP in the Midwestern US in comparison to other regions of the world. For water-soluble PM2.5 in our study, OPAAm ranged from 0.002 to 0.077 nmol min−1 µg−1, which is within the ranges reported from previous studies conducted in Europe (Künzli et al., 2006; Szigeti et al., 2016; Godri et al., 2011; Perrone et al., 2019) and India (Mudway et al., 2005). Our range of OPAAv (0.012–0.908 nmol min−1 m−3) is comparable with Gao et al. (2020a) (0.023–0.126 nmol min−1 m−3) but is much lower than that reported by Fang et al. (2016) (0.2–5.2 nmol min−1 m−3) and Yang et al. (2014) (0.8–35.0 nmol s−1 m−3), probably because of a different protocol used in those studies, both of which involved only AA in the assay. The median of water-soluble OPGSHm (0.007 nmol min−1 µg−1) is also comparable with the average of those reported (0.0041–0.0083 nmol min−1 µg−1) in previous studies (Mudway et al., 2005; Künzli et al., 2006; Godri et al., 2011). Similarly, the median of OPOH−SLFm (0.142 pmol min−1 µg−1) is comparable to the averages reported by Vidrio et al. (2009) and Ma et al. (2015) (0.092–0.253 pmol min−1 µg−1). The median of OPDTTm (0.014 nmol min−1 µg−1) of our samples is significantly lower than the medians or averages reported from most studies conducted in the US (Cho et al., 2005; Charrier and Anastasio, 2012; Gao et al., 2020b; Hu et al., 2008; Fang et al., 2015) and Greece (0.019–0.041 nmol min−1 µg−1) (Paraskevopoulou et al., 2019) but is closer to the averages reported from studies conducted in Italy (0.010–0.012 nmol min−1 µg−1) (Cesari et al., 2019; Perrone et al., 2019). Similarly, the median of our OPDTTv (0.150 nmol min−1 m−3) is lower compared to several studies in the southeastern US and Europe (0.19–0.33 nmol min−1 m−3) (Fang et al., 2015; Gao et al., 2017, 2020a, b; Paraskevopoulou et al., 2019; Perrone et al., 2019; Cesari et al., 2019) but closer to one study conducted in the southwestern US (0.14 nmol min−1 m−3) (Hu et al., 2008). The range of water-soluble OPOH−DTTv of our samples is quite large (0.004–3.565 pmol min−1 m−3); however, there are no previous data to compare to other than those reported in the studies conducted by our own group (Xiong et al., 2017; Yu et al., 2018), which were based on a much smaller sample size (N=10) and limited spatial extent (single site), thus resulting in a much narrower range (0.2–1.1 pmol min−1 m−3). Compared to water, only a handful of studies on OPAA and OPDTT have used methanol as the PM extraction solvent, while no previous literature is available on the OP of methanol-soluble PM for other endpoints. Similar to the water-soluble OP results, the level of methanol-soluble OPAAv in our study (0.030–0.311 nmol min−1 m−3) was lower than that reported by Yang et al. (2014) (2.2–43.5 nmol s−1 m−3), probably due to different measurement protocols (only AA in comparison to SLF in our approach). The medians of our methanol-soluble OPDTTm (0.021 nmol min−1 µg−1) and OPDTTv (0.234 nmol min−1 m−3) are slightly lower than the medians or averages reported in previous studies in the southeastern US (0.027–0.034 nmol min−1 µg−1 and 0.28–0.30 nmol min−1 m−3, respectively, for OPDTTm and OPDTTv) (Verma et al., 2012; Gao et al., 2017, 2020b), which is consistent with the trend for water-soluble OPDTT (i.e., lower levels of our samples than previously reported at other sites).
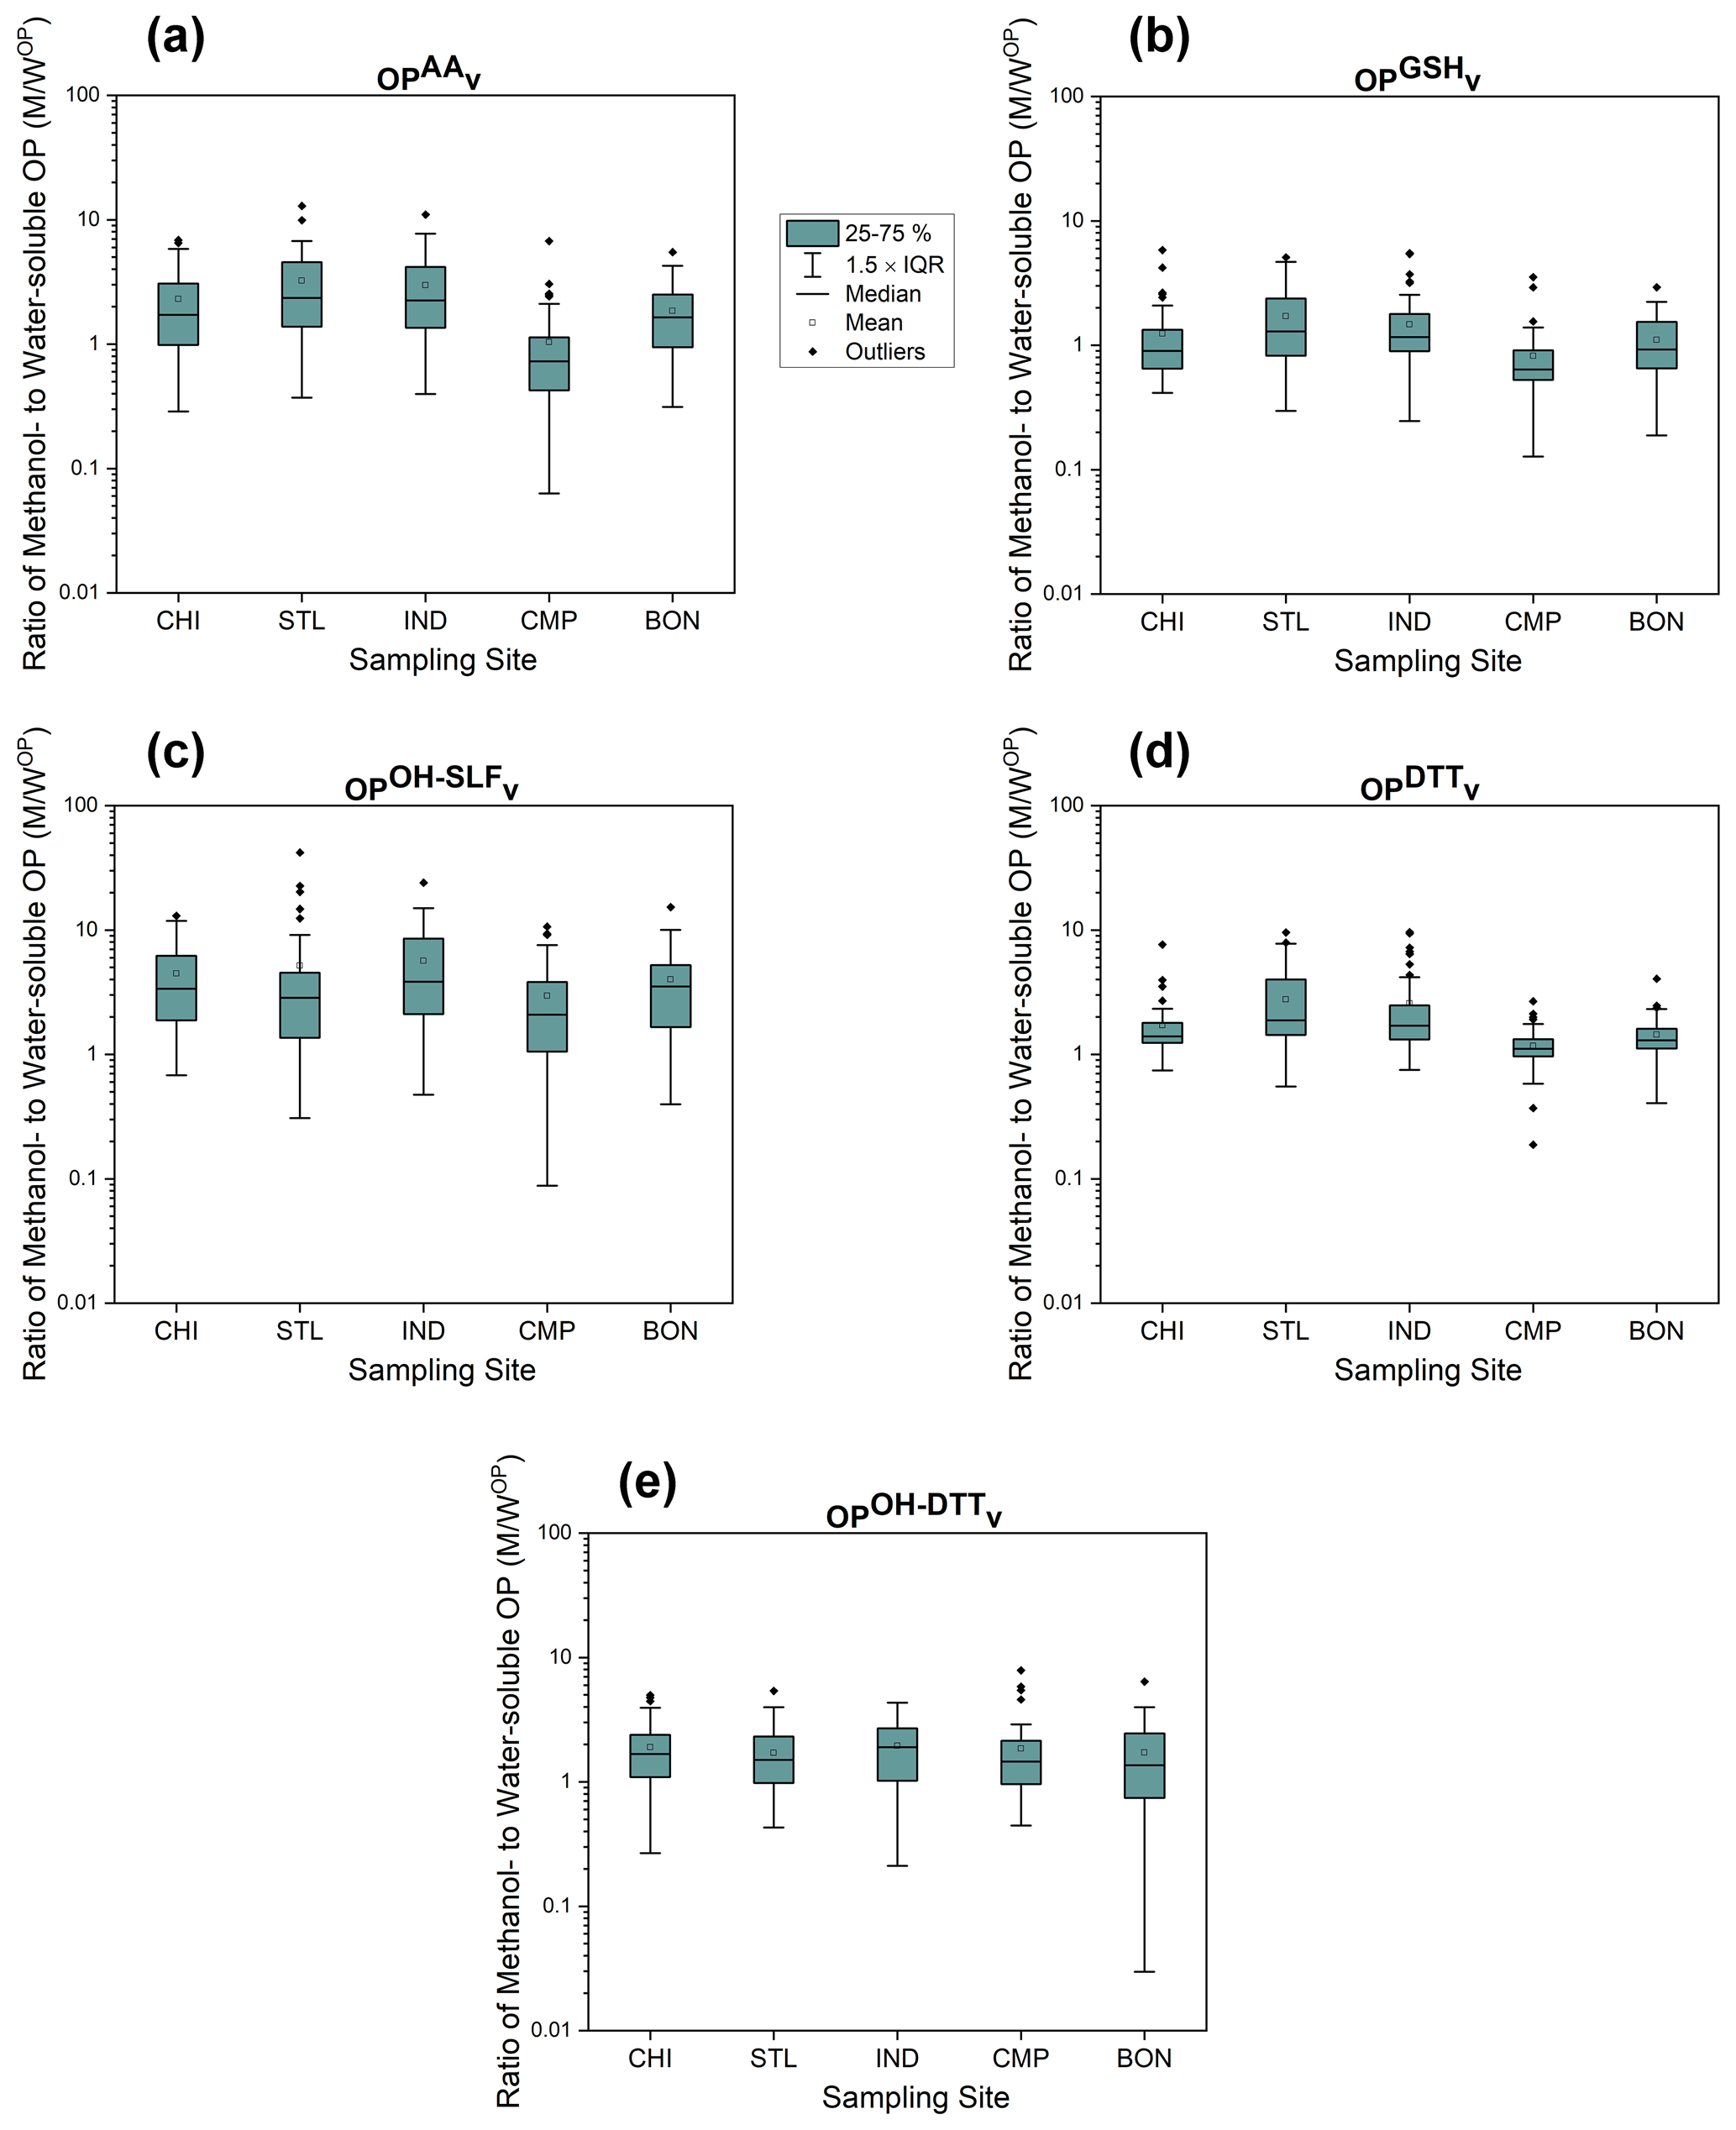
Figure 7Ratio of methanol-soluble OPv to water-soluble OPv (M WOP) for (a) OPAAv, (b) OPGSHv, (c) OPOH−SLFv, (d) OPDTTv, and (e) OPOH−DTTv at five sampling sites.
3.3 Comparison of water-soluble and methanol-soluble OP
To assess the effect of solvent on the OP response, we computed the ratio of methanol-soluble OPv to water-soluble OPv (M WOP) for all samples and plotted it for the individual sites in Fig. 7. As shown in the figure, methanol-soluble extracts generally showed a greater response for most of the OP endpoints than the water-soluble extracts, with medians of M WOP being either close to or greater than 1. The medians for M WOP for OPGSHv and OPDTTv were closer to 1 at many sites, while they were significantly greater than 1 for the other three endpoints (OPAAv, OPOH−SLFv, and OPOH−DTTv). The only exception to this trend was for OPAAv at CMP, where significantly lower levels of methanol-soluble OP than water-soluble OP were observed (median of M WOP=0.7 for OPAAv at CMP). Our previous studies analyzing the chemical composition of PM collected at CMP have shown an elevated level of Cu (up to 60 ng m−3) at this site (Wang et al., 2018; Puthussery et al., 2018) compared to the typical range (4–20 ng m−3) at most urban sites in the US (Buzcu-Guven et al., 2007; Kundu and Stone, 2014; Lee and Hopke, 2006; Hammond et al., 2008; Baumann et al., 2008; Milando et al., 2016). Although water-soluble Cu has been shown to be the most important contributor to OPAA (Fang et al., 2016; Ayres et al., 2008; Visentin et al., 2016), Lin and Yu (2020) reported a strong antagonistic interaction of Cu with imidazole and pyridine, both of which are alkaloid compounds (i.e., reduced organic nitrogen compounds), for oxidizing AA. The unprotonated nitrogen atom in alkaloids tends to chelate Cu, thus reducing its reactivity with AA. The antagonistic effects of Cu have been reported with other organic compounds (e.g., citric acid) as well (Pietrogrande et al., 2019). Thus, apparently lower levels of methanol-soluble OPAA compared to the water-soluble OPAA at CMP might be associated with the chelation of Cu by these alkaloids or other organic species, which could be more efficiently extracted in methanol.
The medians of M WOP were very high (1.4–3.8) for both •OH-based endpoints (i.e., OPOH−SLF and OPOH−DTTv), indicating that methanol is able to more efficiently extract the redox-active components driving the response of these OP endpoints. In addition to •OH-active organic species, e.g., quinones (Charrier and Anastasio, 2015; Xiong et al., 2017; Yu et al., 2018), which are more soluble in methanol, we suspect that one such component could be organic-complexed Fe. As a Fenton reagent, Fe can catalyze the transfer of electrons from H2O2 to •OH (Held et al., 1996). The generation of •OH is further enhanced by the complexation of Fe with organic species (Wei et al., 2018; Gonzalez et al., 2017; Xiong et al., 2017; Yu et al., 2018). In a previous study conducted at our CMP site, Wei et al. (2018) found a significant fraction of Fe complexed with hydrophobic organic species (28±22 %). That study also reported a substantially higher ratio of Fe concentration in 50 % methanol to that in water (1.42±0.19), which showed some seasonality (1.97±0.17 during winter and 1.33±0.20 in summer). This seasonal pattern of Fe solubility in methanol versus water is consistent with the time series of M WOP for OPOH−SLFv at most sites (showing higher values in winter than summer; Table S7), which further corroborated the fact that Fe complexed with the hydrophobic organic fraction of PM2.5 could be majorly responsible for the OPOH−SLFv and OPOH−DTTv in the methanol extracts. However, detailed chemical characterization will be needed to confirm these hypotheses, which will be explored in our subsequent publications.
Table 3Pearson's correlation coefficient (r) between water-soluble and methanol-soluble OPv for different endpoints at five sampling sites. Correlations with r>0.60 are shown in bold. Single asterisks ∗ and double asterisks indicate significant (P<0.05) and highly significant (P<0.01) correlations, respectively.
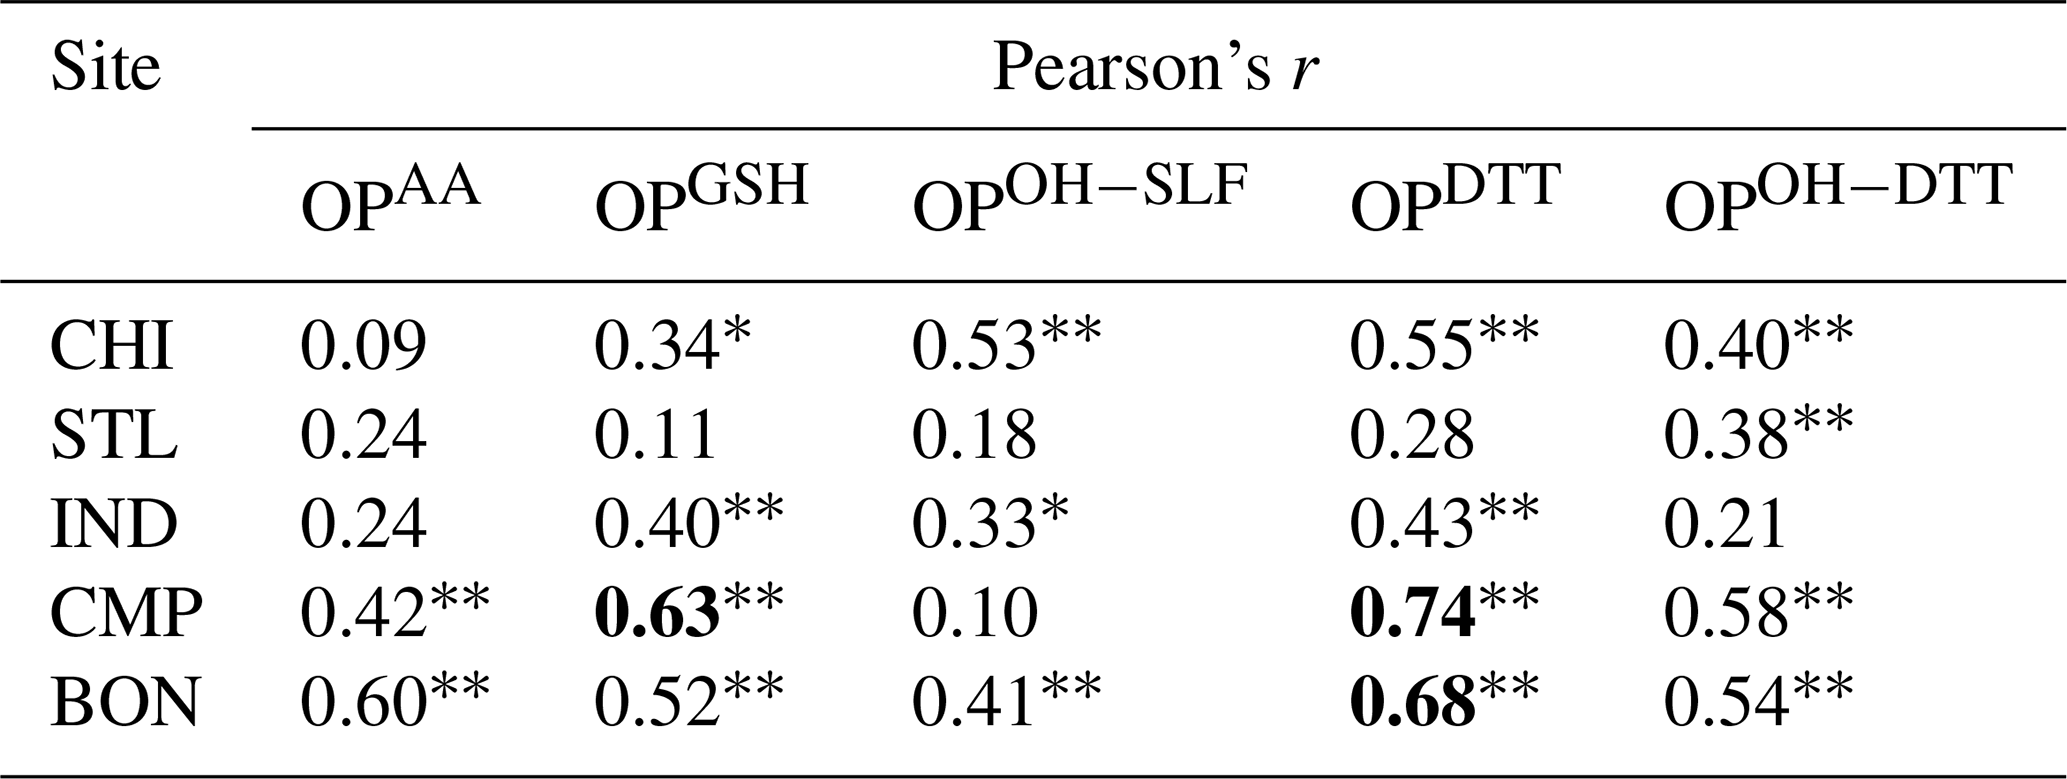
We also calculated Pearson's r for the regression between respective water-soluble and methanol-soluble OP endpoints for individual sites, which are shown in Table 3. OPDTTv showed some good correlation between two extraction protocols (r=0.43–0.74 except at STL), while correlations were generally poor (r<0.60) for the other four endpoints (i.e., OPAAv, OPGSHv, OPOH−SLFv, and OPOH−DTTv). It indicates that the components driving the response of OPDTT could be more uniformly extracted in both water and methanol. However, there are additional water-insoluble species driving the response of OPAAv, OPGSHv, OPOH−SLFv, and OPOH−DTTv, which are more efficiently extracted in methanol than water.

Figure 8Coefficient of divergence (CoD) and Pearson's r for site-to-site comparison of (a) PM2.5 mass and water-soluble OP activities: (b) OPAAv, (c) OPGSHv, (d) OPOH−SLFv, (e) OPDTTv, and (f) OPOH−DTTv. Single asterisks ∗ and double asterisks on the bars of Pearson's r indicate significant (P<0.05) and very significant (P<0.01) correlations, respectively. Note: r values for the correlations of OPAAv between CHI and CMP and for the correlations of OPGSHv between IND and BON were negative (−0.14 and −0.06, respectively).

Figure 9Coefficient of divergence (CoD) and Pearson's r for site-to-site comparison of methanol-soluble OP activities: (a) OPAAv, (b) OPGSHv, (c) OPOH−SLFv, (d) OPDTTv ,and (e) OPOH−DTTv. Single asterisks ∗ and double asterisks on the bars of Pearson's r indicate significant (P<0.05) and very significant (P<0.01) correlations, respectively.
3.4 Site-to-site comparison of OP and mass concentration of PM2.5
To further evaluate the spatial trend of OP across the Midwestern US region, we calculated both COD and correlation coefficients (Pearson's r) for different site pairs, which are shown in Fig. 8 (mass concentrations and water-soluble OP of PM2.5) and Fig. 9 (methanol-soluble PM2.5 OP).
3.4.1 PM2.5 mass concentration and water-soluble PM2.5 OP
PM2.5 mass concentrations showed low levels of CODs (0.13–0.25, median: 0.20), confirming a spatially homogeneous distribution of PM2.5 as indicated earlier (Fig. 8a). Conversely, we observed generally higher CODs (median = 0.27–0.43) for all water-soluble OPv endpoints (Fig. 8b–f). Our results, showing stronger spatial variability in OP than PM mass, are largely in agreement with a recent study (Daellenbach et al., 2020) analyzing a comprehensive dataset for OP in Europe, which showed that both OPv (measured by DTT, 2′,7′-dichlorofluorescin diacetate and AA assays) and PM10 mass concentrations were elevated in urban environments (e.g., Paris and the Po Valley), but PM10 was more regionally distributed than OPv.
Interestingly, we found poor correlations for PM2.5 among all site pairs (r<0.60), except IND and BON (r=0.63). It implies that despite a homogeneous spatial distribution, emission sources of the chemical species composing PM2.5 are different at different sites. The correlations were also weak (r<0.60 for most cases) for the OP endpoints showing high CODs, i.e., OPAA, OPGSH, OPOH−SLF, and OPOH−DTT, which indicates a more pronounced effect of local point sources on these OP endpoints compared to the regional sources. In contrast, OPDTTv showed stronger correlation (r=0.48–0.76, median: 0.62) for most site pairs. Higher correlations for the DTT activity combined with lower CODs suggests that regional sources such as long-range transport or atmospheric processing could have a larger influence on OPDTT than local sources.
3.4.2 Methanol-soluble PM2.5 OP
In comparison to water-soluble PM2.5 OP, CODs for the methanol-soluble OP were generally lower (median: 0.21–0.35; Fig. 9), indicating higher spatial homogeneity of methanol-soluble PM chemical components that are sensitive to OP. Similar to water-soluble OPDTTv, the methanol-soluble OPDTTv showed the lowest COD (0.14–0.26, median: 0.21) among five endpoints (Fig. 9d), which was consistent with Gao et al. (2017), showing a rather low COD (less than 0.23) for both water-soluble and methanol-soluble OPDTT in the southeastern US. Overall, higher correlation coefficients were observed for the methanol-soluble OP (median: 0.41–0.67 for different endpoints) than the corresponding water-soluble endpoints (median: 0.13–0.62). The correlation coefficients were more elevated for certain endpoints such as OPAAv (r=0.38–0.62, median: 0.46) and OPGSHv (r=0.23–0.65, median: 0.41) than others. It is possible that methanol is able to extract more redox-active PM components coming from regional emission sources, e.g., biomass burning or secondary organic aerosols, present at these sites. The components originating from these common sources could mask the effect of other components originating from local sources having a narrower range of solubilities, thus yielding overall lower spatiotemporal variability and better correlation among different sites.
Table 4Pearson's r and slope for simple linear regression of water-soluble OPv versus PM2.5 mass concentration at five sampling sites. Correlations with r>0.60 are shown in bold. All slope values are in italic. Single asterisks ∗ and double asterisks indicate significant (P<0.05) and highly significant (P<0.01) correlations, respectively.
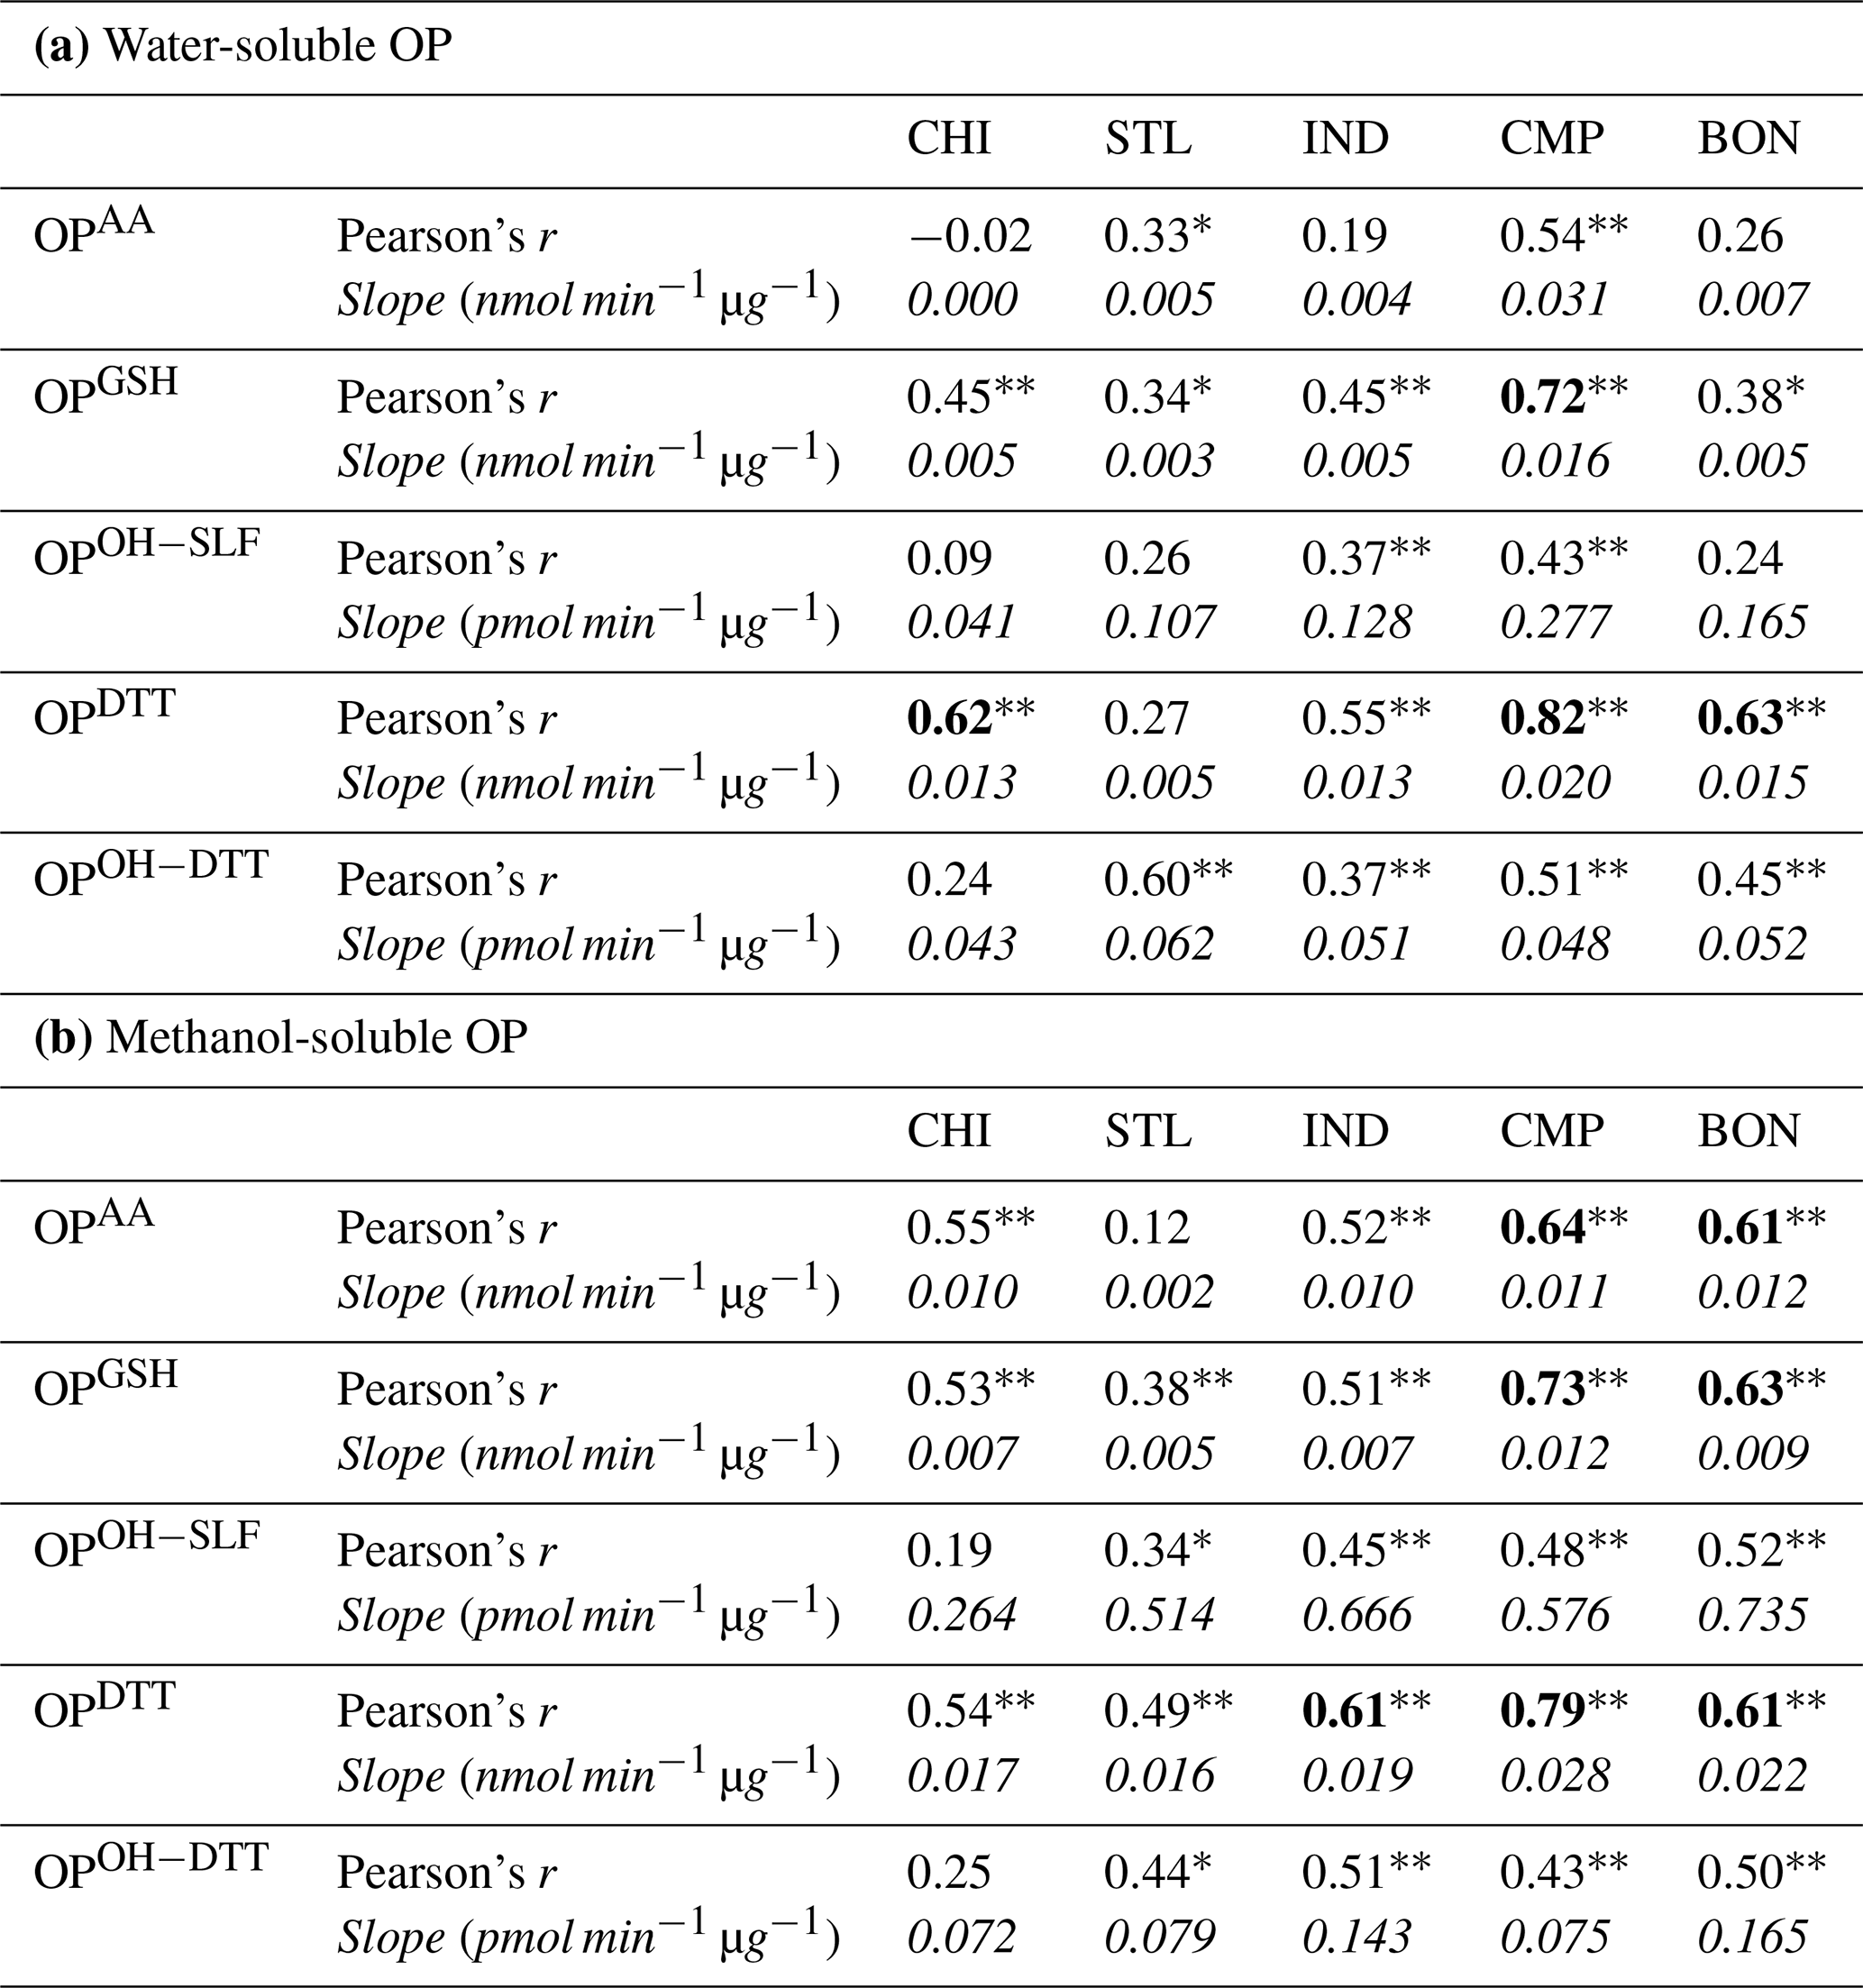
3.5 Correlations of OP with PM2.5 mass concentration
Pearson's r and the slope for simple linear regression of volume-normalized OP activities versus PM2.5 mass concentrations were computed for each individual site and are listed in Table 4. For both water-soluble and methanol-soluble OP, the endpoints of OPAAv, OPOH−SLFv, and OPOH−DTTv were poorly correlated with PM2.5 mass (r<0.60 in most cases), while OPGSHv and OPDTTv were moderately to strongly correlated with PM2.5 mass (r=0.38–0.73 for OPGSHv and 0.54–0.82 for OPDTTv, except at STL). The lower correlation of OPAA and higher correlation of OPDTT are consistent with multiple previous studies comparing these endpoints (Visentin et al., 2016; Yang et al., 2014; Janssen et al., 2014). Decent correlations for OPGSHv and OPDTTv showed that PM mass concentrations can drive these endpoints to some extent at a few locations. However, it is important to note that despite these good correlations, the slope of regression for OP vs. PM2.5 mass varied a lot among five sampling sites (range for OPGSHv is 0.003–0.016 nmol min−1 µg−1 and 0.005–0.028 nmol min−1 µg−1 for OPDTTv), indicating substantial spatiotemporal heterogeneity in the intrinsic potency of the particles to generate ROS at these sites. This is further corroborated by the spatiotemporal variability of OPGSHm and OPDTTm at different sites, as shown in Figs. 5 and 6. Thus, PM2.5 mass concentrations have only a limited role in determining the oxidative levels of the PM2.5 at these sites, and OP seems to be largely driven by the PM chemical composition. Given that the current air quality standards across the world focus only on the mass concentration of PM2.5, these results point towards the inadequacy of this mass-centered approach.
Table 5Pearson's correlation coefficient (r) among various endpoints of OPv measured at five sampling sites. The values below the diagonal are for water-soluble OPv, while those above are for methanol-soluble OPv. Correlations with r>0.60 are shown in bold. Single asterisks ∗ and double asterisks indicate significant (P<0.05) and highly significant (P<0.01) correlations, respectively.
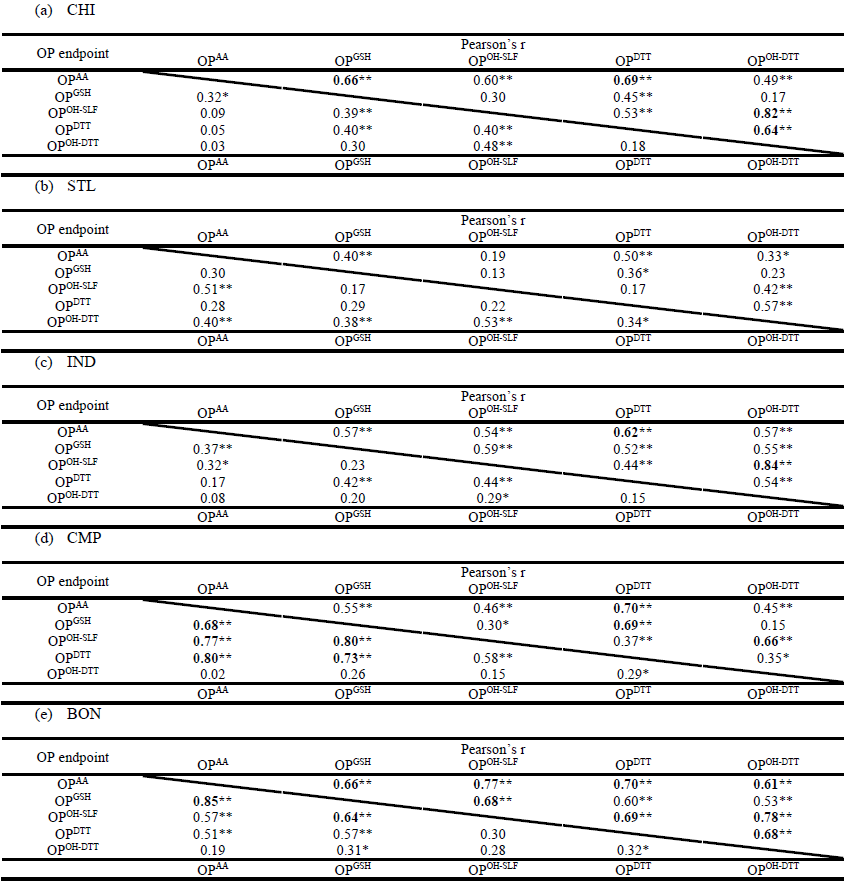
3.6 Intercorrelation among different OP endpoints
We also calculated the correlation coefficient (Pearson's r) for all pairs of different OPv endpoints at each site, which are listed in Table 5. A high correlation coefficient indicates a common source (or a common pool of chemical components) driving the response of those OP endpoints. For water-soluble OP, the intercorrelations among different endpoints were generally poor at urban sites, i.e., CHI, STL, and IND (r<0.60). Correlations were also poor for nearly all pairs of methanol-soluble OP at STL and IND, but CHI showed significantly elevated r values among different OP endpoints (r=0.59–0.82). Compared to more urbanized sites, the correlations were generally higher at the local sites, i.e., CMP and BON, with r>0.60 for many pairs of both water-soluble and methanol-soluble OPv. Since both of these sites are located in smaller cities, the sources of redox-active components probably have less complexity compared to the major city sites, which have multiple and more complex emission sources. As discussed in Sect. 3.2, CMP is largely impacted by vehicular emissions owing to its location adjacent to a major road. Similarly, BON, being a rural site, is largely impacted by agricultural emissions with a marginal impact from vehicular emissions and other sources such as long-range transport from surrounding cities (Kim et al., 2005; Buzcu-Guven et al., 2007). Thus, a lack of other major sources contributing to components, which can drive these endpoints in different directions through their interactions (i.e., synergistic or antagonistic), leads to the similarity of their responses and hence a good correlation among them at these two sites. Among all OP endpoints, OPOH−DTTv showed the poorest correlations with other endpoints except OPOH−SLFv, with which it was correlated at most sites (i.e., CHI, IND, CMP, and BON) for the methanol-soluble extracts (r=0.66–0.84). Since both of these endpoints measure the rate of generation of •OH, it probably indicates a synergistic role of metals with organic compounds (e.g., Fe with humic-like substances – HULIS, as shown in many previous studies; Yu et al., 2018; Charrier and Anastasio, 2015; Gonzalez et al., 2017; Wei et al., 2018; Ma et al., 2015) in partly driving the response of both of these endpoints. Note that OPOH−DTT is a relatively newly developed assay, and there is hardly any previous literature on its comparison with other OP endpoints.
Overall, a poor to moderate and inconstant intercorrelation trend among different endpoints of both water-soluble and methanol-soluble OP at most sites indicates that all these assays could be less than ideal, and measuring a single endpoint is not enough to represent the overall OP activity. Although the OP endpoints used in our study have covered some of the well-known and important pathways of the in vivo oxidative stress caused by PM2.5, there are other endpoints (e.g., consumption of cysteine, formation of H2O2), and more assays can be developed in the future. We suggest that a collection of a diverse range of OP endpoints, measured separately as done in our study, could better capture the role of different PM components and their interactions via different pathways for driving the oxidative levels of the PM in a region. However, it should be noted that our study is not designed to assess and rank the biological relevance of these acellular endpoints, which will require an integration of these and possibly other novel assays involving different routes of oxidative stress in either toxicological or epidemiological studies.
We analyzed both water-soluble and methanol-soluble OP of ambient PM2.5 in the Midwestern US using five different acellular endpoints, including OPAA, OPGSH, OPOH−SLF, OPDTT, and OPOH−DTT. The spatiotemporal profiles of all OP endpoints and PM2.5 mass concentrations were investigated for a 1-year timescale from May 2018 to May 2019 using hi-vol filter samples collected from five Midwestern US sites located in urban, rural, and roadside environments. Compared to homogeneously distributed PM2.5 mass, all OP endpoints showed significant spatiotemporal variations among different seasons and sites. Seasonally, most OP endpoints generally peaked in summer for both water-soluble and methanol-soluble OP. Spatially, the roadside site showed the highest OP levels for most OP endpoints in water-soluble extracts, while there were occasional peaks in methanol-soluble extracts at other urban sites. Our results showed very limited differences in the spatiotemporal profiles between OPm and OPv for most endpoints, indicating a marginal role of PM2.5 mass in causing the spatiotemporal variability of OP.
Comparing the OP for water- and methanol-soluble extracts, we observed significantly higher OP levels in methanol extracts than the corresponding water-soluble OP activities. This trend was much stronger for •OH generation endpoints (i.e., OPOH−SLF and OPOH−DTT), indicating a substantial contribution of Fe and its organic complexes, which could be more efficiently extracted in methanol. In comparison to water-soluble OP, methanol-soluble OP showed lower spatial heterogeneity and higher intercorrelations among different endpoints, which is probably attributed to a more efficient extraction of water-insoluble redox-active species in methanol originating from various emission sources at different sites.
The correlations of OP with PM2.5 mass showed a diverse range, with certain endpoints such as OPAA, OPOH−SLF, and OPOH−DTT showing a poor correlation, while other endpoints (i.e., OPGSH and OPDTT) showed a moderate to strong correlation. Despite these occasional strong correlations, the sensitivity of all OP endpoints to mass, indicated by the slope of OP vs. PM2.5 mass and the intrinsic OP (OPm), varied substantially for all OP endpoints across different sites and seasons, showing only a marginal effect of mass concentrations in controlling the oxidative levels of PM2.5. Moreover, relatively poor and inconsistent correlations among different OP endpoints reflected different pathways of various ROS-active PM2.5 components for exerting oxidative stress. Since our study cannot comment on the biological relevance of these different pathways, we recommend integrating all these and other assays in toxicological or epidemiological studies to assess their relative utilities.
Collectively, the results obtained through our study provide a strong rationale to recommend that the different endpoints of OP provide more useful additional information than the mass concentrations, which could be relevant to assess the public health impacts associated with ambient PM2.5. Our future studies will explore the contribution of different chemical components and their emission sources in determining the oxidative levels of ambient PM2.5 in the Midwestern US.
The data on OP and mass concentration of ambient PM2.5 samples collected in the Midwestern US are available upon request from the corresponding author.
The supplement related to this article is available online at: https://doi.org/10.5194/acp-21-16363-2021-supplement.
HY was responsible for collection of PM2.5 samples, measurement of OP, data analysis, and paper organization and writing. JVP was responsible for collection of PM2.5 samples as well as paper editing and revision. YW was responsible for collection of PM2.5 samples, as well as paper editing and revision. VV was responsible for the conceptualization of study design and methodology, paper organization and editing, and overall project supervision.
The contact author has declared that neither they nor their co-authors have any competing interests.
Publisher's note: Copernicus Publications remains neutral with regard to jurisdictional claims in published maps and institutional affiliations.
This material is based upon work supported by the National Science Foundation under grant no. CBET-1847237. We acknowledge support from Brent Stephens, Yi Wang, and Will Wetherell for providing us with access to the sites in Chicago, Indianapolis, and St. Louis, respectively.
This research has been supported by the National Science Foundation, Directorate for Engineering (grant no. CBET-1847237).
This paper was edited by Timothy Bertram and reviewed by two anonymous referees.
Abbas, I., Verdin, A., Escande, F., Saint-Georges, F., Cazier, F., Mulliez, P., Courcot, D., Shirali, P., Gosset, P., and Garçon, G.: In vitro short-term exposure to air pollution PM2.5−0.3 induced cell cycle alterations and genetic instability in a human lung cell coculture model, Environ. Res., 147, 146–158, 2016.
Abrams, J. Y., Weber, R. J., Klein, M., Samat, S. E., Chang, H. H., Strickland, M. J., Verma, V., Fang, T., Bates, J. T., and Mulholland, J. A.: Associations between ambient fine particulate oxidative potential and cardiorespiratory emergency department visits, Environ. Health Persp., 125, 107008, https://doi.org/10.1289/ehp1545, 2017.
Allan, K., Kelly, F., and Devereux, G.: Antioxidants and allergic disease: a case of too little or too much?, Clin. Exp. Allerg., 40, 370–380, 2010.
Apeagyei, E., Bank, M. S., and Spengler, J. D.: Distribution of heavy metals in road dust along an urban-rural gradient in Massachusetts, Atmos. Environ., 45, 2310–2323, https://doi.org/10.1016/j.atmosenv.2010.11.015, 2011.
Araujo, J. A., Barajas, B., Kleinman, M., Wang, X., Bennett, B. J., Gong, K. W., Navab, M., Harkema, J., Sioutas, C., and Lusis, A. J.: Ambient particulate pollutants in the ultrafine range promote early atherosclerosis and systemic oxidative stress, Circ. Res., 102, 589–596, 2008.
Ayres, J. G., Borm, P., Cassee, F. R., Castranova, V., Donaldson, K., Ghio, A., Harrison, R. M., Hider, R., Kelly, F., and Kooter, I. M.: Evaluating the toxicity of airborne particulate matter and nanoparticles by measuring oxidative stress potential – a workshop report and consensus statement, Inhal. Toxicol., 20, 75–99, https://doi.org/10.1080/08958370701665517, 2008.
Bates, J. T., Weber, R. J., Abrams, J., Verma, V., Fang, T., Klein, M., Strickland, M. J., Sarnat, S. E., Chang, H. H., and Mulholland, J. A.: Reactive oxygen species generation linked to sources of atmospheric particulate matter and cardiorespiratory effects, Environ. Sci. Technol., 49, 13605–13612, https://doi.org/10.1021/acs.est.5b02967, 2015.
Bates, J. T., Fang, T., Verma, V., Zeng, L., Weber, R. J., Tolbert, P. E., Abrams, J. Y., Sarnat, S. E., Klein, M., and Mulholland, J. A.: Review of acellular assays of ambient particulate matter oxidative potential: Methods and relationships with composition, sources, and health effects, Environ. Sci. Technol., 53, 4003–4019, 2019.
Baumann, K., Jayanty, R., and Flanagan, J. B.: Fine particulate matter source apportionment for the chemical speciation trends network site at Birmingham, Alabama, using positive matrix factorization, J. Air Waste Manage. Assoc., 58, 27–44, 2008.
Becker, S., Dailey, L. A., Soukup, J. M., Grambow, S. C., Devlin, R. B., and Huang, Y.-C. T.: Seasonal variations in air pollution particle-induced inflammatory mediator release and oxidative stress, Environ. Health Persp., 113, 1032–1038, https://doi.org/10.1289/ehp.7996, 2005.
Borlaza, L. J. S., Weber, S., Jaffrezo, J.-L., Houdier, S., Slama, R., Rieux, C., Albinet, A., Micallef, S., Trébluchon, C., and Uzu, G.: Disparities in particulate matter (PM10) origins and oxidative potential at a city scale (Grenoble, France) – Part 2: Sources of PM10 oxidative potential using multiple linear regression analysis and the predictive applicability of multilayer perceptron neural network analysis, Atmos. Chem. Phys., 21, 9719–9739, https://doi.org/10.5194/acp-21-9719-2021, 2021.
Buzcu-Guven, B., Brown, S. G., Frankel, A., Hafner, H. R., and Roberts, P. T.: Analysis and apportionment of organic carbon and fine particulate matter sources at multiple sites in the midwestern United States, J. Air Waste Manage. Assoc., 57, 606–619, 2007.
Cachon, B. F., Firmin, S., Verdin, A., Ayi-Fanou, L., Billet, S., Cazier, F., Martin, P. J., Aissi, F., Courcot, D., and Sanni, A.: Proinflammatory effects and oxidative stress within human bronchial epithelial cells exposed to atmospheric particulate matter (PM2.5 and PM>2.5) collected from Cotonou, Benin, Environ. Pollut., 185, 340–351, 2014.
Calas, A., Uzu, G., Kelly, F. J., Houdier, S., Martins, J. M. F., Thomas, F., Molton, F., Charron, A., Dunster, C., Oliete, A., Jacob, V., Besombes, J.-L., Chevrier, F., and Jaffrezo, J.-L.: Comparison between five acellular oxidative potential measurement assays performed with detailed chemistry on PM10 samples from the city of Chamonix (France), Atmos. Chem. Phys., 18, 7863–7875, https://doi.org/10.5194/acp-18-7863-2018, 2018.
Calas, A., Uzu, G., Besombes, J.-L., Martins, J. M., Redaelli, M., Weber, S., Charron, A., Albinet, A., Chevrier, F., and Brulfert, G.: Seasonal variations and chemical predictors of oxidative potential (OP) of particulate matter (PM), for seven urban French sites, Atmosphere, 10, 698, https://doi.org/10.3390/atmos10110698, 2019.
Cesari, D., Merico, E., Grasso, F. M., Decesari, S., Belosi, F., Manarini, F., De Nuntiis, P., Rinaldi, M., Volpi, F., and Gambaro, A.: Source apportionment of PM2.5 and of its oxidative potential in an industrial suburban site in South Italy, Atmosphere, 10, 758, https://doi.org/10.3390/atmos10120758, 2019.
Charrier, J. G. and Anastasio, C.: On dithiothreitol (DTT) as a measure of oxidative potential for ambient particles: evidence for the importance of soluble transition metals, Atmos. Chem. Phys., 12, 9321–9333, https://doi.org/10.5194/acp-12-9321-2012, 2012.
Charrier, J. G. and Anastasio, C.: Rates of hydroxyl radical production from transition metals and quinones in a surrogate lung fluid, Environ. Sci. Technol., 49, 9317–9325, https://doi.org/10.1021/acs.est.5b01606, 2015.
Charrier, J. G., McFall, A. S., Richards-Henderson, N. K., and Anastasio, C.: Hydrogen peroxide formation in a surrogate lung fluid by transition metals and quinones present in particulate matter, Environ. Sci. Technol., 48, 7010–7017, https://doi.org/10.1021/es501011w, 2014.
Charrier, J. G., McFall, A. S., Vu, K. K., Baroi, J., Olea, C., Hasson, A., and Anastasio, C.: A bias in the “mass-normalized” DTT response – An effect of non-linear concentration-response curves for copper and manganese, Atmos. Environ., 144, 325–334, https://doi.org/10.1016/j.atmosenv.2016.08.071, 2016.
Cho, A. K., Sioutas, C., Miguel, A. H., Kumagai, Y., Schmitz, D. A., Singh, M., Eiguren-Fernandez, A., and Froines, J. R.: Redox activity of airborne particulate matter at different sites in the Los Angeles Basin, Environ. Res., 99, 40–47, https://doi.org/10.1016/j.envres.2005.01.003, 2005.
Chung, M. Y., Lazaro, R. A., Lim, D., Jackson, J., Lyon, J., Rendulic, D., and Hasson, A. S.: Aerosol-borne quinones and reactive oxygen species generation by particulate matter extracts, Environ. Sci. Technol., 40, 4880–4886, 2006.
Councell, T. B., Duckenfield, K. U., Landa, E. R., and Callender, E.: Tire-wear particles as a source of zinc to the environment, Environ. Sci. Technol., 38, 4206–4214, 2004.
Daellenbach, K. R., Uzu, G., Jiang, J., Cassagnes, L.-E., Leni, Z., Vlachou, A., Stefenelli, G., Canonaco, F., Weber, S., and Segers, A.: Sources of particulate-matter air pollution and its oxidative potential in Europe, Nature, 587, 414–419, 2020.
Deng, X., Zhang, F., Rui, W., Long, F., Wang, L., Feng, Z., Chen, D., and Ding, W.: PM2.5-induced oxidative stress triggers autophagy in human lung epithelial A549 cells, Toxicol. Vitro, 27, 1762–1770, 2013.
Dominici, F., McDermott, A., Zeger, S. L., and Samet, J. M.: Airborne particulate matter and mortality: timescale effects in four US cities, Am. J. Epidemiol., 157, 1055–1065, 2003.
Fang, T., Verma, V., Guo, H., King, L. E., Edgerton, E. S., and Weber, R. J.: A semi-automated system for quantifying the oxidative potential of ambient particles in aqueous extracts using the dithiothreitol (DTT) assay: results from the Southeastern Center for Air Pollution and Epidemiology (SCAPE), Atmos. Meas. Tech., 8, 471–482, https://doi.org/10.5194/amt-8-471-2015, 2015.
Fang, T., Verma, V., Bates, J. T., Abrams, J., Klein, M., Strickland, M. J., Sarnat, S. E., Chang, H. H., Mulholland, J. A., Tolbert, P. E., Russell, A. G., and Weber, R. J.: Oxidative potential of ambient water-soluble PM2.5 in the southeastern United States: contrasts in sources and health associations between ascorbic acid (AA) and dithiothreitol (DTT) assays, Atmos. Chem. Phys., 16, 3865–3879, https://doi.org/10.5194/acp-16-3865-2016, 2016.
Feng, S., Gao, D., Liao, F., Zhou, F., and Wang, X.: The health effects of ambient PM2.5 and potential mechanisms, Ecotoxicol. Environ. Safe., 128, 67–74, https://doi.org/10.1016/j.ecoenv.2016.01.030, 2016.
Franco, R., Schoneveld, O., Georgakilas, A. G., and Panayiotidis, M. I.: Oxidative stress, DNA methylation and carcinogenesis, Cancer Lett., 266, 6–11, https://doi.org/10.1016/j.canlet.2008.02.026, 2008.
Gao, D., Fang, T., Verma, V., Zeng, L., and Weber, R. J.: A method for measuring total aerosol oxidative potential (OP) with the dithiothreitol (DTT) assay and comparisons between an urban and roadside site of water-soluble and total OP, Atmos. Meas. Tech., 10, 2821–2835, https://doi.org/10.5194/amt-10-2821-2017, 2017.
Gao, D., Godri Pollitt, K. J., Mulholland, J. A., Russell, A. G., and Weber, R. J.: Characterization and comparison of PM2.5 oxidative potential assessed by two acellular assays, Atmos. Chem. Phys., 20, 5197–5210, https://doi.org/10.5194/acp-20-5197-2020, 2020a.
Gao, D., Mulholland, J. A., Russell, A. G., and Weber, R. J.: Characterization of water-insoluble oxidative potential of PM2.5 using the dithiothreitol assay, Atmos. Environ., 224, 117327, https://doi.org/10.1016/j.atmosenv.2020.117327, 2020b.
Garçon, G., Dagher, Z., Zerimech, F., Ledoux, F., Courcot, D., Aboukais, A., Puskaric, E., and Shirali, P.: Dunkerque City air pollution particulate matter-induced cytotoxicity, oxidative stress and inflammation in human epithelial lung cells (L132) in culture, Toxicol. in vitro, 20, 519–528, 2006.
Garg, B. D., Cadle, S. H., Mulawa, P. A., Groblicki, P. J., Laroo, C., and Parr, G. A.: Brake Wear Particulate Matter Emissions, Environ. Sci. Technol., 34, 4463–4469, https://doi.org/10.1021/es001108h, 2000.
Gietl, J. K., Lawrence, R., Thorpe, A. J., and Harrison, R. M.: Identification of brake wear particles and derivation of a quantitative tracer for brake dust at a major road, Atmos. Environ., 44, 141–146, 2010.
Gildemeister, A. E., Hopke, P. K., and Kim, E.: Sources of fine urban particulate matter in Detroit, MI, Chemosphere, 69, 1064–1074, https://doi.org/10.1016/j.chemosphere.2007.04.027, 2007.
Godri, K. J., Harrison, R. M., Evans, T., Baker, T., Dunster, C., Mudway, I. S., and Kelly, F. J.: Increased oxidative burden associated with traffic component of ambient particulate matter at roadside and urban background schools sites in London, PloS One, 6, e21961, https://doi.org/10.1371/journal.pone.0021961, 2011.
Gonzalez, D. H., Cala, C. K., Peng, Q., and Paulson, S. E.: HULIS enhancement of hydroxyl radical formation from Fe (II): kinetics of fulvic acid-Fe (II) complexes in the presence of lung antioxidants, Environ. Sci. Technol., 51, 7676–7685, 2017.
Grevendonk, L., Janssen, B. G., Vanpoucke, C., Lefebvre, W., Hoxha, M., Bollati, V., and Nawrot, T. S.: Mitochondrial oxidative DNA damage and exposure to particulate air pollution in mother-newborn pairs, Environ. Health, 15, 1–8, 2016.
Gurgueira, S. A., Lawrence, J., Coull, B., Murthy, G. K., and González-Flecha, B.: Rapid increases in the steady-state concentration of reactive oxygen species in the lungs and heart after particulate air pollution inhalation, Environ. Health Persp., 110, 749–755, 2002.
Haberzettl, P., O'Toole, T. E., Bhatnagar, A., and Conklin, D. J.: Exposure to fine particulate air pollution causes vascular insulin resistance by inducing pulmonary oxidative stress, Environ. Health Persp., 124, 1830–1839, 2016.
Hammond, D. M., Dvonch, J. T., Keeler, G. J., Parker, E. A., Kamal, A. S., Barres, J. A., Yip, F. Y., and Brakefield-Caldwell, W.: Sources of ambient fine particulate matter at two community sites in Detroit, Michigan, Atmos. Environ., 42, 720–732, 2008.
Held, K. D., Sylvester, F. C., Hopcia, K. L., and Biaglow, J. E.: Role of Fenton chemistry in thiol-induced toxicity and apoptosis, Radiat. Res., 145, 542–553, https://doi.org/10.2307/3579272, 1996.
Hu, S., Polidori, A., Arhami, M., Shafer, M. M., Schauer, J. J., Cho, A., and Sioutas, C.: Redox activity and chemical speciation of size fractioned PM in the communities of the Los Angeles-Long Beach harbor, Atmos. Chem. Phys., 8, 6439–6451, https://doi.org/10.5194/acp-8-6439-2008, 2008.
Hulskotte, J., Denier van der Gon, H., Visschedijk, A., and Schaap, M.: Brake wear from vehicles as an important source of diffuse copper pollution, Water Sci. Technol., 56, 223–231, https://doi.org/10.2166/wst.2007.456, 2007.
Janssen, N. A., Yang, A., Strak, M., Steenhof, M., Hellack, B., Gerlofs-Nijland, M. E., Kuhlbusch, T., Kelly, F., Harrison, R., and Brunekreef, B.: Oxidative potential of particulate matter collected at sites with different source characteristics, Sci. Total Environ., 472, 572–581, https://doi.org/10.1016/j.scitotenv.2013.11.099, 2014.
Jeong, C.-H., Traub, A., Huang, A., Hilker, N., Wang, J. M., Herod, D., Dabek-Zlotorzynska, E., Celo, V., and Evans, G. J.: Long-term analysis of PM2.5 from 2004 to 2017 in Toronto: Composition, sources, and oxidative potential, Environ. Pollut., 263, 114652, https://doi.org/10.1016/j.envpol.2020.114652, 2020.
Kampfrath, T., Maiseyeu, A., Ying, Z., Shah, Z., Deiuliis, J. A., Xu, X., Kherada, N., Brook, R. D., Reddy, K. M., and Padture, N. P.: Chronic fine particulate matter exposure induces systemic vascular dysfunction via NADPH oxidase and TLR4 pathways, Circulation Res., 108, 716–726, 2011.
Kaufman, J. A., Wright, J. M., Rice, G., Connolly, N., Bowers, K., and Anixt, J.: Ambient ozone and fine particulate matter exposures and autism spectrum disorder in metropolitan Cincinnati, Ohio, Environ. Res., 171, 218–227, https://doi.org/10.1016/j.envres.2019.01.013, 2019.
Kelly, F. J.: Oxidative stress: its role in air pollution and adverse health effects, Occup. Environ. Med., 60, 612–616, 2003.
Kim, E., Hopke, P. K., Kenski, D. M., and Koerber, M.: Sources of fine particles in a rural midwestern U.S. Area, Environ. Sci. Technol., 39, 4953–4960, https://doi.org/10.1021/es0490774, 2005.
Kleinman, M. T., Hamade, A., Meacher, D., Oldham, M., Sioutas, C., Chakrabarti, B., Stram, D., Froines, J. R., and Cho, A. K.: Inhalation of concentrated ambient particulate matter near a heavily trafficked road stimulates antigen-induced airway responses in mice, J. Air Waste Manage. Assoc., 55, 1277–1288, 2005.
Kodavanti, U. P., Schladweiler, M. C., Ledbetter, A. D., Watkinson, W. P., Campen, M. J., Winsett, D. W., Richards, J. R., Crissman, K. M., Hatch, G. E., and Costa, D. L.: The spontaneously hypertensive rat as a model of human cardiovascular disease: evidence of exacerbated cardiopulmonary injury and oxidative stress from inhaled emission particulate matter, Toxicol. Appl. Pharmacol., 164, 250–263, https://doi.org/10.1006/taap.2000.8899, 2000.
Kumagai, Y., Koide, S., Taguchi, K., Endo, A., Nakai, Y., Yoshikawa, T., and Shimojo, N.: Oxidation of proximal protein sulfhydryls by phenanthraquinone, a component of diesel exhaust particles, Chem. Res. Toxicol., 15, 483–489, 2002.
Kumar, N., Liang, D., Comellas, A., Chu, A. D., and Abrams, T.: Satellite-based PM concentrations and their application to COPD in Cleveland, OH, J. Exp. Sci. Env. Epid., 23, 637–646, 2013.
Kundu, S., and Stone, E. A.: Composition and sources of fine particulate matter across urban and rural sites in the Midwestern United States, Environ. Sci.-Processes & Impacts, 16, 1360–1370, 2014.
Künzli, N., Mudway, I. S., Götschi, T., Shi, T., Kelly, F. J., Cook, S., Burney, P., Forsberg, B., Gauderman, J. W., and Hazenkamp, M. E.: Comparison of oxidative properties, light absorbance, and total and elemental mass concentration of ambient PM2.5 collected at 20 European sites, Environ. Health Persp., 114, 684–690, https://doi.org/10.1289/ehp.8584, 2006.
Lee, C.-W., Lin, Z.-C., Hu, S. C.-S., Chiang, Y.-C., Hsu, L.-F., Lin, Y.-C., Lee, I. T., Tsai, M.-H., and Fang, J.-Y.: Urban particulate matter down-regulates filaggrin via COX2 expression/PGE2 production leading to skin barrier dysfunction, Sci. Rep.-UK, 6, 27995, https://doi.org/10.1038/srep27995, 2016.
Lee, J. H. and Hopke, P. K.: Apportioning sources of PM2.5 in St. Louis, MO using speciation trends network data, Atmos. Environ., 40, 360–377, 2006.
Lee, J. H., Hopke, P. K., and Turner, J. R.: Source identification of airborne PM2.5 at the St. Louis-Midwest Supersite, J. Geophys. Res.-Atmos, 111, D10S10, https://doi.org/10.1029/2005JD006329, 2006.
Li, N. and Nel, A. E.: Role of the Nrf2-mediated signaling pathway as a negative regulator of inflammation: implications for the impact of particulate pollutants on asthma, Antioxid. Redox Sign., 8, 88–98, 2006.
Li, Y., Fu, S., Li, E., Sun, X., Xu, H., Meng, Y., Wang, X., Chen, Y., Xie, C., and Geng, S.: Modulation of autophagy in the protective effect of resveratrol on PM2.5-induced pulmonary oxidative injury in mice, Phytother. Res., 32, 2480–2486, 2018.
Lin, M. and Yu, J. Z.: Assessment of interactions between transition metals and atmospheric organics: ascorbic acid depletion and hydroxyl radical formation in organic-metal mixtures, Environ. Sci. Technol., 54, 1431–1442, https://doi.org/10.1021/acs.est.9b07478, 2020.
Liu, Q., Baumgartner, J., Zhang, Y., Liu, Y., Sun, Y., and Zhang, M.: Oxidative potential and inflammatory impacts of source apportioned ambient air pollution in Beijing, Environ. Sci. Technol., 48, 12920–12929, 2014.
Liu, W., Xu, Y., Liu, W., Liu, Q., Yu, S., Liu, Y., Wang, X., and Tao, S.: Oxidative potential of ambient PM2.5 in the coastal cities of the Bohai Sea, northern China: Seasonal variation and source apportionment, Environ. Pollut., 236, 514–528, 2018.
Ma, S., Ren, K., Liu, X., Chen, L., Li, M., Li, X., Yang, J., Huang, B., Zheng, M., and Xu, Z.: Production of hydroxyl radicals from Fe-containing fine particles in Guangzhou, China, Atmos. Environ., 123, 72–78, https://doi.org/10.1016/j.atmosenv.2015.10.057, 2015.
Milando, C., Huang, L., and Batterman, S.: Trends in PM2.5 emissions, concentrations and apportionments in Detroit and Chicago, Atmos. Environ., 129, 197–209, 2016.
Moreno, T., Kelly, F. J., Dunster, C., Oliete, A., Martins, V., Reche, C., Minguillón, M. C., Amato, F., Capdevila, M., and de Miguel, E.: Oxidative potential of subway PM2. 5, Atmos. Environ., 148, 230–238, 2017.
Mudway, I., Kelly, F., and Holgate, S.: Oxidative stress in air pollution research, Free Radical Bio. Med., 151, 2–6, https://doi.org/10.1016/j.freeradbiomed.2020.04.031, 2020.
Mudway, I. S., Duggan, S. T., Venkataraman, C., Habib, G., Kelly, F. J., and Grigg, J.: Combustion of dried animal dung as biofuel results in the generation of highly redox active fine particulates, Part. Fibre Toxicol., 2, 6, https://doi.org/10.1186/1743-8977-2-6, 2005.
Oh, S. M., Kim, H. R., Park, Y. J., Lee, S. Y., and Chung, K. H.: Organic extracts of urban air pollution particulate matter (PM2.5)-induced genotoxicity and oxidative stress in human lung bronchial epithelial cells (BEAS-2B cells), Mutat. Res.-Gen. Tox. En., 723, 142–151, https://doi.org/10.1016/j.mrgentox.2011.04.003, 2011.
Paraskevopoulou, D., Bougiatioti, A., Stavroulas, I., Fang, T., Lianou, M., Liakakou, E., Gerasopoulos, E., Weber, R., Nenes, A., and Mihalopoulos, N.: Yearlong variability of oxidative potential of particulate matter in an urban Mediterranean environment, Atmos. Environ., 206, 183–196, 2019.
Pei, Y., Jiang, R., Zou, Y., Wang, Y., Zhang, S., Wang, G., Zhao, J., and Song, W.: Effects of Fine Particulate Matter (PM2.5) on Systemic Oxidative Stress and Cardiac Function in ApoE-/- Mice, Int. J. Environ. Res. Pub. Health, 13, 484, https://doi.org/10.3390/ijerph13050484, 2016.
Perrone, M. R., Bertoli, I., Romano, S., Russo, M., Rispoli, G., and Pietrogrande, M. C.: PM2.5 and PM10 oxidative potential at a Central Mediterranean Site: Contrasts between dithiothreitol-and ascorbic acid-measured values in relation with particle size and chemical composition, Atmos. Environ., 210, 143–155, 2019.
Pietrogrande, M. C., Perrone, M. R., Manarini, F., Romano, S., Udisti, R., and Becagli, S.: PM10 oxidative potential at a Central Mediterranean Site: Association with chemical composition and meteorological parameters, Atmos. Environ., 188, 97–111, 2018.
Pietrogrande, M. C., Bertoli, I., Manarini, F., and Russo, M.: Ascorbate assay as a measure of oxidative potential for ambient particles: Evidence for the importance of cell-free surrogate lung fluid composition, Atmos. Environ., 211, 103–112, https://doi.org/10.1016/j.atmosenv.2019.05.012, 2019.
Poljšak, B. and Fink, R.: The protective role of antioxidants in the defence against ROS/RNS-mediated environmental pollution, Oxidative Medicine and Cellular Longevity, 2014, 671539, https://doi.org/10.1155/2014/671539, 2014.
Puthussery, J. V., Zhang, C., and Verma, V.: Development and field testing of an online instrument for measuring the real-time oxidative potential of ambient particulate matter based on dithiothreitol assay, Atmos. Meas. Tech., 11, 5767–5780, https://doi.org/10.5194/amt-11-5767-2018, 2018.
Qin, G., Xia, J., Zhang, Y., Guo, L., Chen, R., and Sang, N.: Ambient fine particulate matter exposure induces reversible cardiac dysfunction and fibrosis in juvenile and older female mice, Part. Fibre Toxicol., 15, 1–14, 2018.
Rao, X., Zhong, J., Brook, R. D., and Rajagopalan, S.: Effect of particulate matter air pollution on cardiovascular oxidative stress pathways, Antioxid. Redox Sign., 28, 797–818, 2018.
Risom, L., Møller, P., and Loft, S.: Oxidative stress-induced DNA damage by particulate air pollution, Mutat. Res.-Fund. Mol. M., 592, 119–137, 2005.
Riva, D. R., Magalhães, C. B., Lopes, A. A., Lanças, T., Mauad, T., Malm, O., Valença, S. S., Saldiva, P. H., Faffe, D. S., and Zin, W. A.: Low dose of fine particulate matter (PM2.5) can induce acute oxidative stress, inflammation and pulmonary impairment in healthy mice, Inhalat. Toxicol., 23, 257–267, https://doi.org/10.3109/08958378.2011.566290, 2011.
Rosenthal, F. S., Carney, J. P., and Olinger, M. L.: Out-of-hospital cardiac arrest and airborne fine particulate matter: a case–crossover analysis of emergency medical services data in Indianapolis, Indiana, Environ. Health Persp., 116, 631–636, 2008.
Rossner, P., Svecova, V., Milcova, A., Lnenickova, Z., Solansky, I., and Sram, R. J.: Seasonal variability of oxidative stress markers in city bus drivers: Part II. Oxidative damage to lipids and proteins, Mutat. Res.-Fund. Mol. M., 642, 21–27, https://doi.org/10.1016/j.mrfmmm.2008.03.004, 2008.
Sørensen, M., Daneshvar, B., Hansen, M., Dragsted, L. O., Hertel, O., Knudsen, L., and Loft, S.: Personal PM2.5 exposure and markers of oxidative stress in blood, Environ. Health Persp., 111, 161–166, 2003.
Saffari, A., Daher, N., Shafer, M. M., Schauer, J. J., and Sioutas, C.: Seasonal and spatial variation in reactive oxygen species activity of quasi-ultrafine particles (PM0.25) in the Los Angeles metropolitan area and its association with chemical composition, Atmos. Environ., 79, 566–575, 2013.
Saffari, A., Daher, N., Shafer, M. M., Schauer, J. J., and Sioutas, C.: Seasonal and spatial variation in dithiothreitol (DTT) activity of quasi-ultrafine particles in the Los Angeles Basin and its association with chemical species, J. Environ. Sci. Heal. A, 49, 441–451, https://doi.org/10.1080/10934529.2014.854677, 2014.
Sancini, G., Farina, F., Battaglia, C., Cifola, I., Mangano, E., Mantecca, P., Camatini, M., and Palestini, P.: Health risk assessment for air pollutants: alterations in lung and cardiac gene expression in mice exposed to Milano winter fine particulate matter (PM2.5), PLoS One, 9, e109685, https://doi.org/10.1371/journal.pone.0109685, 2014.
Sarnat, S. E., Winquist, A., Schauer, J. J., Turner, J. R., and Sarnat, J. A.: Fine particulate matter components and emergency department visits for cardiovascular and respiratory diseases in the St. Louis, Missouri–Illinois, metropolitan area, Environ. Health Persp., 123, 437–444, 2015.
Shen, H., Barakat, A. I., and Anastasio, C.: Generation of hydrogen peroxide from San Joaquin Valley particles in a cell-free solution, Atmos. Chem. Phys., 11, 753–765, https://doi.org/10.5194/acp-11-753-2011, 2011.
Son, Y., Mishin, V., Welsh, W., Lu, S.-E., Laskin, J. D., Kipen, H., and Meng, Q.: A novel high-throughput approach to measure hydroxyl radicals induced by airborne particulate matter, Int. J. Environ. Res. Publ. Health, 12, 13678–13695, https://doi.org/10.3390/ijerph121113678, 2015.
Sun, B., Shi, Y., Li, Y., Jiang, J., Liang, S., Duan, J., and Sun, Z.: Short-term PM2.5 exposure induces sustained pulmonary fibrosis development during post-exposure period in rats, J. Hazardous Mat., 385, 121566, https://doi.org/10.1016/j.jhazmat.2019.121566, 2020.
Szigeti, T., Dunster, C., Cattaneo, A., Cavallo, D., Spinazzè, A., Saraga, D. E., Sakellaris, I. A., de Kluizenaar, Y., Cornelissen, E. J., and Hänninen, O.: Oxidative potential and chemical composition of PM2.5 in office buildings across Europe – The OFFICAIR study, Environ. Int., 92, 324–333, https://doi.org/10.1016/j.envint.2016.04.015, 2016.
Tuet, W. Y., Fok, S., Verma, V., Rodriguez, M. S. T., Grosberg, A., Champion, J. A., and Ng, N. L.: Dose-dependent intracellular reactive oxygen and nitrogen species (ROS/RNS) production from particulate matter exposure: comparison to oxidative potential and chemical composition, Atmos. Environ., 144, 335–344, 2016.
Verma, V., Rico-Martinez, R., Kotra, N., King, L., Liu, J., Snell, T. W., and Weber, R. J.: Contribution of water-soluble and insoluble components and their hydrophobic/hydrophilic subfractions to the reactive oxygen species-generating potential of fine ambient aerosols, Environ. Sci. Technol., 46, 11384–11392, https://doi.org/10.1021/es302484r, 2012.
Verma, V., Fang, T., Guo, H., King, L., Bates, J. T., Peltier, R. E., Edgerton, E., Russell, A. G., and Weber, R. J.: Reactive oxygen species associated with water-soluble PM2.5 in the southeastern United States: spatiotemporal trends and source apportionment, Atmos. Chem. Phys., 14, 12915–12930, https://doi.org/10.5194/acp-14-12915-2014, 2014.
Vidrio, E., Phuah, C. H., Dillner, A. M., and Anastasio, C.: Generation of hydroxyl radicals from ambient fine particles in a surrogate lung fluid solution, Environ. Sci. Technol., 43, 922–927, https://doi.org/10.1021/es801653u, 2009.
Visentin, M., Pagnoni, A., Sarti, E., and Pietrogrande, M. C.: Urban PM2.5 oxidative potential: Importance of chemical species and comparison of two spectrophotometric cell-free assays, Environ. Pollut., 219, 72–79, https://doi.org/10.1016/j.envpol.2016.09.047, 2016.
Wang, Y., Plewa, M. J., Mukherjee, U. K., and Verma, V.: Assessing the cytotoxicity of ambient particulate matter (PM) using Chinese hamster ovary (CHO) cells and its relationship with the PM chemical composition and oxidative potential, Atmos. Environ., 179, 132–141, https://doi.org/10.1016/j.atmosenv.2018.02.025, 2018.
Weber, S., Uzu, G., Calas, A., Chevrier, F., Besombes, J.-L., Charron, A., Salameh, D., Ježek, I., Močnik, G., and Jaffrezo, J.-L.: An apportionment method for the oxidative potential of atmospheric particulate matter sources: application to a one-year study in Chamonix, France, Atmos. Chem. Phys., 18, 9617–9629, https://doi.org/10.5194/acp-18-9617-2018, 2018.
Weber, S., Uzu, G., Favez, O., Borlaza, L. J. S., Calas, A., Salameh, D., Chevrier, F., Allard, J., Besombes, J.-L., Albinet, A., Pontet, S., Mesbah, B., Gille, G., Zhang, S., Pallares, C., Leoz-Garziandia, E., and Jaffrezo, J.-L.: Source apportionment of atmospheric PM10 oxidative potential: synthesis of 15 year-round urban datasets in France, Atmos. Chem. Phys., 21, 11353–11378, https://doi.org/10.5194/acp-21-11353-2021, 2021.
Wei, J., Yu, H., Wang, Y., and Verma, V.: Complexation of iron and copper in ambient particulate matter and its effect on the oxidative potential measured in a surrogate lung fluid, Environ. Sci. Technol., 53, 1661–1671, 2018.
Weichenthal, S., Lavigne, E., Evans, G., Pollitt, K., and Burnett, R. T.: Ambient PM2.5 and risk of emergency room visits for myocardial infarction: impact of regional PM2.5 oxidative potential: a case-crossover study, Environ. Health, 15, 46, https://doi.org/10.1186/s12940-016-0129-9, 2016.
Weichenthal, S., Shekarrizfard, M., Traub, A., Kulka, R., Al-Rijleh, K., Anowar, S., Evans, G., and Hatzopoulou, M.: Within-city spatial variations in multiple measures of PM2.5 oxidative potential in Toronto, Canada, Environ. Sci. Technol., 53, 2799–2810, https://doi.org/10.1186/s12940-016-0129-9, 2019.
Weichenthal, S. A., Lavigne, E., Evans, G. J., Godri Pollitt, K. J., and Burnett, R. T.: Fine particulate matter and emergency room visits for respiratory illness. Effect modification by oxidative potential, Am. J. Resp. Crit. Care, 194, https://doi.org/10.1164/rccm.201512-2434OC, 577–586, 2016.
Wessels, A., Birmili, W., Albrecht, C., Hellack, B., Jermann, E., Wick, G., Harrison, R. M., and Schins, R. P.: Oxidant generation and toxicity of size-fractionated ambient particles in human lung epithelial cells, Environ. Sci. Technol., 44, 3539–3545,, 2010.
Xiang, S., Yu, Y. T., Hu, Z., and Noll, K. E.: Characterization of dispersion and ultrafine-particle emission factors based on near-roadway monitoring Part II: Heavy duty vehicles, Aerosol Air Quality Res., 19, 2421–2431, 2019.
Xing, Y.-F., Xu, Y.-H., Shi, M.-H., and Lian, Y.-X.: The impact of PM2.5 on the human respiratory system, J. Thor. Dis., 8, E69–E74, 2016.
Xiong, Q., Yu, H., Wang, R., Wei, J., and Verma, V.: Rethinking the dithiothreitol-based particulate matter oxidative potential: measuring dithiothreitol consumption versus reactive oxygen species generation, Environ. Sci. Technol., 51, 6507–6514, https://doi.org/10.1021/acs.est.7b01272, 2017.
Xu, Z., Xu, X., Zhong, M., Hotchkiss, I. P., Lewandowski, R. P., Wagner, J. G., Bramble, L. A., Yang, Y., Wang, A., and Harkema, J. R.: Ambient particulate air pollution induces oxidative stress and alterations of mitochondria and gene expression in brown and white adipose tissues, Part. Fibre Toxicol., 8, 1–14, 2011.
Yan, Z., Wang, J., Li, J., Jiang, N., Zhang, R., Yang, W., Yao, W., and Wu, W.: Oxidative stress and endocytosis are involved in upregulation of interleukin-8 expression in airway cells exposed to PM2.5, Environ. Toxicol., 31, 1869–1878, https://doi.org/10.1002/tox.22188, 2016.
Yang, A., Jedynska, A., Hellack, B., Kooter, I., Hoek, G., Brunekreef, B., Kuhlbusch, T. A., Cassee, F. R., and Janssen, N. A.: Measurement of the oxidative potential of PM2.5 and its constituents: The effect of extraction solvent and filter type, Atmos. Environ., 83, 35–42, https://doi.org/10.1016/j.atmosenv.2013.10.049, 2014.
Yang, A., Hellack, B., Leseman, D., Brunekreef, B., Kuhlbusch, T. A., Cassee, F. R., Hoek, G., and Janssen, N. A.: Temporal and spatial variation of the metal-related oxidative potential of PM2.5 and its relation to PM2.5 mass and elemental composition, Atmos. Environ., 102, 62–69, 2015a.
Yang, A., Wang, M., Eeftens, M., Beelen, R., Dons, E., Leseman, D. L., Brunekreef, B., Cassee, F. R., Janssen, N. A., and Hoek, G.: Spatial variation and land use regression modeling of the oxidative potential of fine particles, Environ. Health Persp., 123, 1187–1192, 2015b.
Yang, A., Janssen, N. A., Brunekreef, B., Cassee, F. R., Hoek, G., and Gehring, U.: Children's respiratory health and oxidative potential of PM2.5: the PIAMA birth cohort study, Occup. Environ. Med., 73, 154–160, https://doi.org/10.1136/oemed-2015-103175, 2016.
Yu, H., Wei, J., Cheng, Y., Subedi, K., and Verma, V.: Synergistic and antagonistic interactions among the particulate matter components in generating reactive oxygen species based on the dithiothreitol assay, Environ. Sci. Technol., 52, 2261–2270, https://doi.org/10.1021/acs.est.7b04261, 2018.
Yu, H., Puthussery, J. V., and Verma, V.: A semi-automated multi-endpoint reactive oxygen species activity analyzer (SAMERA) for measuring the oxidative potential of ambient PM2.5 aqueous extracts, Aerosol Sci. Technol., 54, 304–320, 2020.
Yu, S., Liu, W., Xu, Y., Yi, K., Zhou, M., Tao, S., and Liu, W.: Characteristics and oxidative potential of atmospheric PM2.5 in Beijing: Source apportionment and seasonal variation, Sci. Total Environ., 650, 277–287, 2019.
Zhang, Y., Schauer, J. J., Shafer, M. M., Hannigan, M. P., and Dutton, S. J.: Source apportionment of in vitro reactive oxygen species bioassay activity from atmospheric particulate matter, Environ. Sci. Technol., 42, 7502–7509, https://doi.org/10.1021/es800126y, 2008.
Zhou, J., Ito, K., Lall, R., Lippmann, M., and Thurston, G.: Time-series analysis of mortality effects of fine particulate matter components in Detroit and Seattle, Environ. Health Persp., 119, 461–466, 2011.
Zuo, L., Otenbaker, N. P., Rose, B. A., and Salisbury, K. S.: Molecular mechanisms of reactive oxygen species-related pulmonary inflammation and asthma, Molec. Immunol., 56, 57–63, https://doi.org/10.1016/j.molimm.2013.04.002, 2013.