the Creative Commons Attribution 4.0 License.
the Creative Commons Attribution 4.0 License.
 | 13 Oct 2021
Characterization of ambient volatile organic compounds, source apportionment, and the ozone–NOx–VOC sensitivities in a heavily polluted megacity of central China: effect of sporting events and emission reductions
Shijie Yu
Fangcheng Su
Shasha Yin
Shenbo Wang
Ruixin Xu
Bing He
Xiangge Fan
Minghao Yuan
Ruiqin Zhang
The implementation of strict emission control during the 11th National Minority Games (NMG) in September 2019 provided a valuable opportunity to assess the impact of such emission controls on the characteristics of VOCs and other air pollutants. Here, we investigated the characteristics of VOCs and the O3–NOx–VOC sensitivity comprehensively in Zhengzhou before, during, and after the NMG by delivering field measurements combined with WRF-CMAQ (Weather Research and Forecasting Community Multiscale Air Quality) model simulations. The average mixing ratios of VOCs during the control periods were 121 ± 55 µg m−3 and decreased by about 19 % and 11 % before and after emission reduction. The ozone precursors (NOx) also decreased significantly during the control period; however, the ozone pollution was severe during the entire observation period. Positive matrix factorization analysis indicated seven major sources of ambient VOCs, including coal combustion, biomass burning, vehicle exhausts, industrial processes, biogenic emissions, solvent utilization, and liquefied petroleum gas (LPG). The results show that the major source emissions, such as coal combustion and solvent utilization, were significantly reduced during the control period. As for ozone formation potential (OFP), the value during the control period was 183 ± 115 µg m−3, which was 0.23 and 0.17 times lower than before and after the control period, respectively. Solvent utilization and combustion controls were the most important measures taken to reduce OFP during the NMG period. Control policies can effectively reduce carcinogenic risk. However, non-cancer risks of ambient VOC exposures were all exceeding the safe level (hazard quotient = 1) during the sampling periods, and emphasis on the reduction of acrolein emissions was needed. In addition, the WRF-CMAQ model simulation indicated that O3 formation was controlled by VOCs in Zhengzhou. The results of the Empirical Kinetic Modeling Approach showed that the NOx reduction in Zhengzhou might lead to higher ozone pollution. It is suggested that reduction ratios of the precursors (VOCs : NOx) should be more than 2, which can effectively alleviate ozone pollution.
- Article
(1926 KB) - Full-text XML
-
Supplement
(2994 KB) - BibTeX
- EndNote


Volatile organic compounds (VOCs), important precursors for the generation of near-surface ozone (O3) and secondary organic aerosols (SOAs), have received widespread attention in the world (Baudic et al., 2016; Sahu et al., 2017; Xiong and Du, 2020; Yadav et al., 2019; Yang et al., 2019a; Zeng et al., 2018; Zhang et al., 2015). Moreover, some VOCs have adverse impacts on human health, which induce cancer directly and are associated with increased long-term health risks (Hu et al., 2018; Jaars et al., 2018). Since the beginning of the 21st century, heavy air pollution events have frequently occurred in China, characterized by regional and complex air pollution (R. Li et al., 2019; Ma et al., 2019). Therefore, the improvement of air quality has become a hot issue, especially for large-scale activities held in megacities, and how to ensure air quality has become the key to success of the activities.
Air quality assurance refers to the systematic emission reduction and control measures of pollution sources to ensure air quality during special activities. Temporarily enhanced control measures could provide a scenario to analyze the response relationship between emission sources of pollutants and ambient air quality. Many scholars have carried out research on pollutant characteristics and their source apportionment under different control measures for a variety of special activities. Those studies included the 2008 Beijing Olympic Games (Schleicher et al., 2012; Wang et al., 2009), the 2010 World Expo in Shanghai (Chan et al., 2015; Wang et al., 2014), the 2014 Asia-Pacific Economic Cooperation Summit in Beijing (Li et al., 2015, 2017), the 70th China Victory Day Parade anniversary (Huang et al., 2018; Ren et al., 2019), and the G20 summit in Hangzhou (H. Li et al., 2019; Zhang et al., 2020). These studies all suggested that enhanced emission-reduction strategies had significant effects on improving air quality. O3 pollution might not be improved and even worsen during the control period (Xu et al., 2019). The relationship between O3 and its precursors is nonlinear, and unreasonable reduction of O3 precursors might not necessarily alleviate O3 pollution. Hence, it is necessary to achieve an in-depth understanding of the mechanisms involved in O3 formation, especially under the emission-reduction scenario. However, studies on these special events have mostly focused on particulate matter and its components and to a much lesser degree on ozone and VOCs. In particular, the discussion on O3 sensitivity and implications for control strategies through the combination of model- and observation-based methods is still lacking. Furthermore, these studies mainly focused on a few metropolises in China, especially in the three most developed regions, the Beijing–Tianjin–Hebei (BTH) region, the Yangtze River Delta (YRD) region, and the Pearl River Delta (PRD) region.
From 8–16 September 2019, the 11th National Minority Games (NMG) was held in Zhengzhou, China. As the host city, Zhengzhou took emergency pollution control measures in the city and neighboring regions from 26 August to 18 September for enhancing air quality during the NMG period. Considering the ozone pollution is the main type of pollution in the region in September (Yu et al., 2020), the Zhengzhou municipal government focused on the emission reduction of VOCs and NOx to alleviate O3 pollution. Based on the bottom-up emission inventories and observation-based source apportionment, major anthropogenic sources of VOCs in the area include vehicular exhaust, liquefied petroleum gas (LPG) evaporation, solvent usage, and industrial emissions (Bai et al., 2020; B. Li et al., 2019). Thus, they were the target emission sources when temporary invention measures were adopted for controlling air pollution during the NMG period. A detailed description of the control measures is shown in Table S1 in the Supplement. It is an excellent opportunity to determine the effects of emission control policies using the real atmosphere as a natural laboratory. Therefore, it is necessary to investigate VOC characteristics and sources, as well as their effects on ozone production before, during, and after the control period.
This study measured 106 VOC species using an online gas chromatograph–mass spectrometer with a flame ionization detector (GC-MS/FID). Meanwhile, the Weather Research and Forecasting Community Multiscale Air Quality (WRF-CMAQ) model was used to investigate the nonlinearity of O3 response to precursor reductions. The main objectives of this study are to (1) analyze the effects of emergent emission-reduction strategies on the VOC characteristics; (2) identify the crucial sources of VOCs in Zhengzhou and their changes during the NMG period; (3) investigate the contribution to ozone formation and risk assessment under control measures; and (4) assess the O3–NOx–VOC sensitivity and propose control strategies for ozone episodes.
2.1 Site description and chemical analysis
The sampling site is located on the rooftop of a four-story building at the municipal environmental monitoring station (MEM; 113.61∘ E, 34.75∘ N), about 6.6 km away from the Zhengzhou Olympic Sports Center (Fig. S1 in the Supplement). The surrounding area of the sampling site is mainly a commercial and residential district, and the station is 300 m west of Qinling Road and 200 m south of Zhongyuan Road. No significant industrial sources were present around the sampling sites. The above-mentioned two roads carry very heavy traffic. Accordingly, mobile sources may contribute more to the VOC concentrations of the site.
VOC samples were collected from 6 August to 30 September 2019 and were divided into three periods, including the pre-NMG period (6–25 August), the NMG period (26 August to 18 September), and the post-NMG period (19–30 September). By comparing the characteristics of VOC pollution during the three periods, the effects of control policies by government can clearly be identified and assessed.
It should be pointed out that the MEM station is located in the air monitoring network operated by Zhengzhou environmental monitoring center. The meteorological parameters (temperature, relative humidity, atmospheric pressure, wind direction, and wind speed) and trace gases (O3, NO, and NOx) were observed at the sampling site simultaneously. Information detailing relevant equipment was described by B. Li et al. (2019).
Ambient VOCs were collected and analyzed continuously using an online GC-MS/FID, and the time resolution is 1 h (TH-PKU 300B, Wuhan Tianhong Instrument Co. China). This measurement was described by Li et al. (2018). Briefly, this system has two gas channels and dual detectors, in which the C2–C5 non-methane hydrocarbons (NMHCs) were separated on a PLOT Al2O3 column (15 m × 0.32 mm × 6.0 µm, Dikma Technologies, Beijing, China) and quantified by FID, while the other species were separated on a DB-624 column (60 m × 0.25 mm × 1.4 µm, Agilent Technologies, Santa Clara, CA, USA) and detected by a mass selective detector with a Deans switch.
To ensure the validity and reliability of observation data, these chemical analyses were subjected to quality assurance and quality control procedures. We used external and internal standard methods to quantify the C2–C5 and C5–C12 compounds, respectively. Before monitoring, the standard curves of five concentrations (0.4–8 ppbv) were made using PAMS (photochemical assessment monitoring stations) standard gas, TO-15 Calibration Standards (US EPA, 1999), and four internal standards, including bromochloromethane, 1,4-difluorobenzene, chlorobenzene-d5, and bromofluorobenzene. The above standard gases and internal standard gases were provided by Apel Riemer Environmental, USA. In addition, we input 4 ppbv PAMS+TO-15 standard gas at 00:00 LST (local standard time) every day to calibrate the data and check the stability. The coefficients of determination (R2) of calibration curves were mostly above 0.99, and the method detection limit (MDL) ranged from 0.004 to 0.36 µg m−3 for each species. A total of 106 VOC species were detected, including alkanes (29), alkenes (11), aromatics (17), halocarbons (35), oxygenated VOCs (OVOCs) (12), acetylene, and carbon disulfide (Table S2 in the Supplement).
2.2 WRF-CMAQ model
The WRF-CMAQ modeling system was applied to simulate ozone concentration and investigate O3 sensitivity in this study. The modeling system has been widely used for regional-scale air quality studies (Byun et al., 1999; Chemel et al.,2014), and more details can be found at http://cmascenter.org/cmaq/ (last access: 10 October 2021).
In this paper, the simulation period was from 00:00 LST on 5 August 2019 to 23:00 LST on 30 September 2019, which corresponded to the NMG sampling periods. To eliminate the impact of the initial conditions, a 5 d spin-up period was set in the simulation. We applied a four-nested domain with a grid resolution of 36 km × 36 km, 12 km × 12 km, 4 km × 4 km, and 1 km × 1 km, respectively (as shown in Fig. S2 in the Supplement). The gridded anthropogenic emission inventory by Tsinghua University was applied in CMAQ, and the local emission inventory of Henan Province was also input into the model (Bai et al., 2020). These modeling systems have been successfully used in previous simulations by Zhang et al. (2014) and N. Wang et al. (2019). The results of WRF-CMAQ model evaluation in Zhangzhou were reported in our previous studies (Su et al., 2021).
The CMAQ developed by the US EPA was used to simulate the ozone pollution processes in Zhengzhou in August and September 2019. The sensitivity of emission sources to ozone pollution in Zhengzhou was analyzed using the DDM-3D source sensitivity identification tool (Hakami et al., 2007).
2.3 Source apportionment using the PMF model
Positive matrix factorization (PMF) analysis of VOCs was performed with the US EPA PMF 5.0 program; this receptor model is widely used for source analysis. Detailed information about this method is described in the user manual and related literature (Norris et al., 2014; Xiong and Du, 2020; Yenisoy-Karakas et al., 2020).
It must be said that not all of the VOC species were used in the PMF analysis. According to previous studies, the principles for VOC species choice are listed as follows (Hui et al., 2019): (1) species with more than 25 % data missing or that fell below the MDLs were rejected; (2) species with a signal-to-noise ratio lower than 1.5 were excluded; and (3) species with representative source tracers of emission sources were retained. Eventually, a total of 42 VOC species were selected for the source apportionment analysis. In this study, a seven-factor solution was chosen in the PMF analysis based on two parameters (Ulbrich et al., 2009): (1) Qtrue/Qrobust values and (2) Qtrue/Qtheoretical values (Fig. S3 in the Supplement).
2.4 Potential source contribution function (PSCF)
The potential source contribution function (PSCF) is a function with conditional probability for calculating backward trajectories and identifying potential source regions. The detailed descriptions of this method were described by Bressi et al. (2014) and Waked et al. (2014). Briefly, PSCF analysis is normally used to identify possible source areas of pollutants, such as ozone, NOx, and VOCs. PSCF calculates the probability that a source is located at latitude i and longitude j as
where nij is the number of times that the trajectories passed through the cell (i,j), and mij is the number of times that a source concentration was high when the trajectories passed through the cell (i,j) (C. Song et al., 2019). In order to reduce the uncertainty caused by decreasing a small nij value, a Wij function was used in this study as calculated by Eq. (2):
In this study, the PSCFs were calculated by applying the TrajStat plugins on MeteInfoMap software version 1.4.4. The 48 h backward trajectories arriving at Zhengzhou with a trajectory height of 200 m were calculated every hour (00:00–23:00 LT, local time). The studied domain was in the range of 15 to 65∘ N and 85 to 145∘ E in a grid of 0.1∘ × 0.1∘ cells, which contains almost all regions overlaid with entire airflow transport pathways.
2.5 Calculation of O3 formation potential
To understand the impact of the VOC species on ozone formation, ozone formation potential (OFP) was used, employing the following equation (Carter, 2010a):
where [VOC]i is the mass concentration of each VOC, with units of milligrams per cubic meter (mg m−3), and MIR is the maximum incremental reactivity (g O3 per gram of VOC); the MIR value of each VOC is obtained from Carter (1994).
2.6 Health risk assessment
The risk assessment derived from the guidelines proposed by the US EPA (2009) was used to evaluate the adverse health effects of each identified VOC in ambient air to human health and evaluate the impact of emission reduction on health risks. In this paper, the carcinogenic and non-carcinogenic risks were calculated to assess the impacts of VOCs on human health, using Eqs. (4)–(7).
where IUR is the estimated unit risk value (m3 µg−1); EC is the exposure concentration (mg m−3); CA is the environmental concentration (µg m−3); ET is the exposure time (h d−1); EF is the exposure frequency (d yr−1); ED is the exposure time (years); AT is the average time (h); RfC is the reference concentration (mg m−3); HQ is the non-cancer inhalation hazard quotient; and HI is the hazard index. Risk probability values, including RfC and IUR, were obtained through the risk model calculator established by the University of Tennessee (RAIS, 2016) and are listed in Table S3 in the Supplement.
Out of all measured species in this paper, only 46 VOC species with known toxicity values were considered, including 44 noncarcinogenic species and 21 carcinogenic species. Target VOCs and associated toxicity values of health risk assessment are presented in Table S4 in the Supplement.

3.1 Overall observations
3.1.1 Characteristics of O3 and other pollution gases
Figure 1 shows the temporal trends of the O3 and other pollutant mixing ratios during the sampling period. During the pre-NMG period, the highest O3 hourly concentration was 252 µg m−3 at 15:00 LST on 23 August; meanwhile the max 8 h O3 value also appeared on this day (219 µg m−3). In addition, max 8 h O3 concentrations were present on a total of 7 d, exceeding the ambient air quality standard (GB 3095-2012) Grade II standard of 160 µg m−3. At this stage, the ozone pollution cause concern as the days exceeding the standard accounted for 50 %. The highest hourly concentrations of VOCs and NOx were 1017 and 357 µg m−3, with a mean concentration of 150 ± 93 and 49 ± 46 µg m−3, respectively. Higher O3 precursor concentrations were observed, which may be an important factor leading to serious photochemistry pollution.
During the control period, the O3 precursor concentrations showed a decreasing trend, with a mean concentration of 121 ± 55 µg m−3 VOCs and 39 ± 26 µg m−3 NOx. However, the ozone pollution was not dramatically alleviated; and mild and moderate O3 pollution levels accounted for 52 % and 10 %, respectively, during the NMG period according to GB 3095-2012. The phenomenon has been reported that photochemistry is still severe under emergency emission-reduction strategies (R. Li et al., 2019). Due to the highly nonlinear relationships between ozone and its precursors, it is not straightforward to mitigate ozone pollution by reducing the emissions of VOCs and NOx (Tan et al., 2018; S. Wang et al., 2019). A special phenomenon needs to be pointed out that the ozone concentration during the evening peak is much higher than that in the pre-NMG period. The weak titration effect may be the main reason for the phenomena above (Chi et al., 2018; Zou et al., 2019). At the end of the control period, the concentration of precursors increased rapidly, and NOx concentration increased by nearly 1.6 times compared with the control stage. At the same time, the ozone pollution was still severe; the proportions of mild and moderate pollution days were 83 % and 8 %, respectively.
On the whole, the concentration of ozone precursors decreased during the control period (as shown in Fig.S4), and the ozone pollution was severe during the entire observation period. It should be noted that the maximum value of max 8 h O3 concentrations in the NMG period is a high of 235 µg m−3.
3.1.2 Meteorological conditions
Meteorological conditions can significantly influence pollutant concentrations, which makes it difficult to evaluate the emission reduction brought by emission control. In this paper, the meteorological data throughout the three periods in Zhengzhou were compared, including temperature (T), precipitation, relative humidity (RH), wind speed (WS), and visibility. As shown in Table S5 in the Supplement, the meteorological parameters rarely changed during the three periods (T, 27.4 ± 1.2, 24.2 ± 3.3, and 22.3 ± 1.5∘ for the pre-NMG period, the NMG period, and the post-NMG period, respectively; visibility, 16.7 ± 5.5, 14.1 ± 7.0 and 13.0 ± 2.7 km; WS, 1.7 ± 0.3, 1.7 ± 0.4, and 1.5 ± 0.3 m s−1). However, the precipitation during the pre-control period (236.9 mm) was much higher than during the control (39.8 mm) and post-control periods (1.6 mm). In addition, the RH in the first stage is higher, which is conducive to the dissolving of the air pollutants in water vapor, condensation, and settlement, thereby reducing the concentration of pollutants.
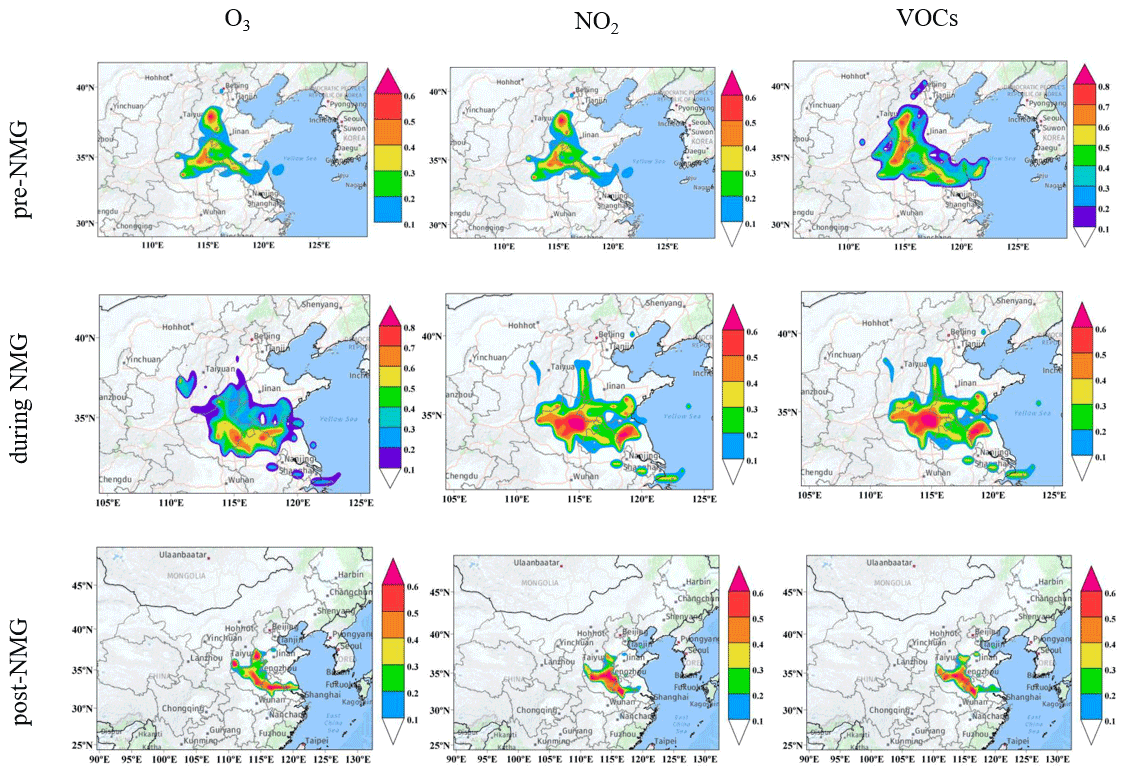
Figure 2The average weighted PSCF maps for O3, NO2, and VOCs in Zhengzhou during the three periods.
Meteorological conditions can influence the transmission and circulation of regional air pollutants (Ren et al., 2019). In this paper, the air clusters were analyzed using the Hybrid Single-Particle Lagrangian Integrated Trajectory model (HYSPLIT) to distinguish the differences of potential source contributions in the three periods. In previous studies, it is shown that regional transport has an important influence on Zhengzhou's air quality, especially the air mass from the BTH region (Jiang et al., 2019; P. Wang et al., 2019). Figure S4 shows the 48 h backward trajectory results during the sampling period. The dominant trajectory was from the east or southeast of Zhengzhou in the three periods. For the pre- and post-NMG periods, Zhengzhou is greatly affected by the air mass from the BTH region, where there are high concentrations of air pollutants from anthropogenic emissions. Based on the PSCF results in Fig. 2, the high PSCF values for pollutants (including O3, NO2, and VOCs) were distributed significantly at the southeast of Zhengzhou and near the Zhengzhou area. Therefore, the potential source regions for pollutants during the sampling period were mainly from the southeast of Zhengzhou and local sources within the city. For the record, high PSCF values were also present within northern Hebei Province during the pre-NMG period; this region is a major industrialized area in the BTH. To summarize, in addition to air pollution control measures, changes of meteorological conditions may contribute to the improvement of air quality during the NMG period.
3.2 Characteristic of VOCs during the three periods
3.2.1 Mixing ratios and chemical speciation
As illustrated in Fig. 1, the mixing ratios of hourly total VOCs (TVOCs) show an average value of 150 ± 93 µg m−3, ranging from 41 to 1017 µg m−3, before the control period. During control, this reduced to an average of 121 ± 55 µg m−3, with a range from 37 to 333 µg m−3. After the control period, the average VOC concentration increased to 136 ± 60 µg m−3. Overall, it is clear that the emission control policies were beneficial in reducing VOC concentration, decreasing by about 19 % and 11 % before and after emission reduction.
The percentage distributions of VOC groups were similar in the three sampling periods (Fig. S6 in the Supplement). Alkanes were the dominant group, accounting for 37 %, 35 %, and 33 % of the total VOC concentration for the three periods, respectively, followed by halocarbons. Notably, OVOCs slightly decreased in the entire sampling period, comprising 17 %, 16 %, and 15 %, respectively. However, the active components of aromatics increased over time. In addition to the impact of emission sources, meteorological conditions and transport might be key factors that can influence VOC compositions (Su et al., 2021).
Table 1Concentrations of the 20 most abundant species in Zhengzhou (unit: µg m−3).
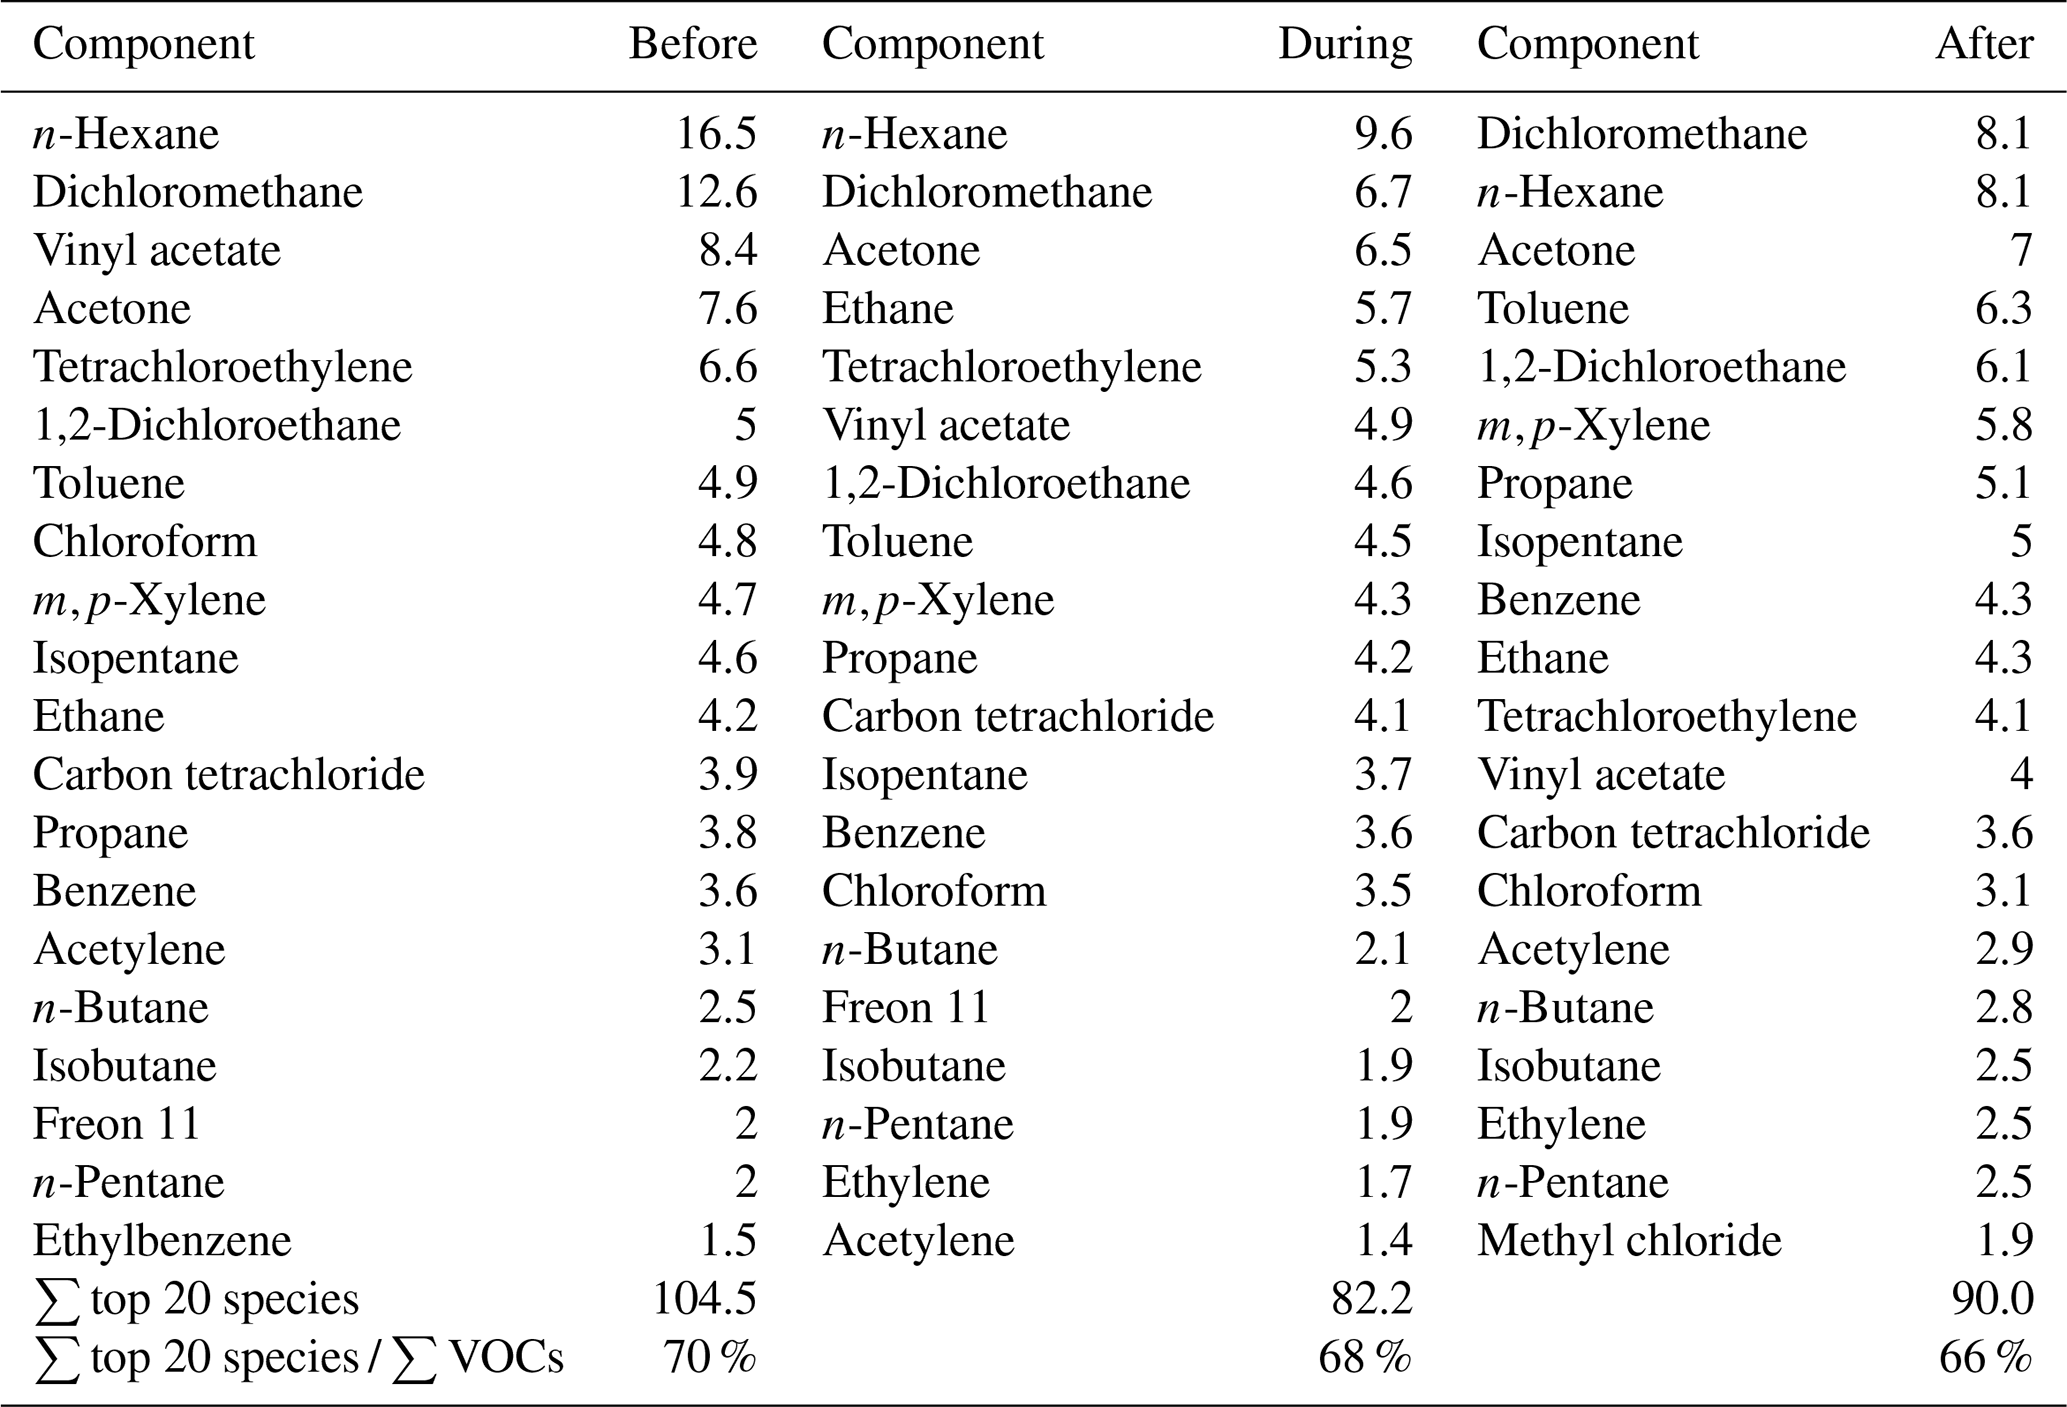
The top 20 VOC species are summarized in Table 1. The top 20 substances were similar in the three stages, but the concentration levels were quite different. Tracers of solvent sources including hexane and dichloromethane (Huang and Hsieh, 2019; Wei et al., 2019) decreased in the control period, reducing by 42 % and 47 %, respectively. The reduction of vinyl acetate and tetrachloroethylene is relatively large, which may be attributed to industrial emission reduction (Hsu et al., 2018; Zhang et al., 2015). In addition, the concentration of acetylene is reduced by 55 % compared with the pre-NMG period, as a potential result of the control of combustion sources (Liu et al., 2020; F. Wu et al., 2016).
3.2.2 Diurnal variations of ambient VOCs
The mean diurnal variations of TVOCs and their compounds before, during, and after the control period are shown in Fig. S7 in the Supplement. Clearly, the diurnal variations of TVOCs during the three periods are similar, showing higher values from evening till morning rush hours, while they are lowest in the afternoon. The composition of alkanes, alkenes, alkynes, and aromatics shows similar daily variations. Previous studies have suggested that VOCs can be oxidized by O3, OH radicals, and NO3 radicals (Carter, 2010b). In short, the reactions with O3 and OH radicals are the most important chemical reactions during daytime, and the reactions with NO3 radicals and O3 are dominant reactions for VOCs occurring at night (Atkinson and Arey, 2003). However, the reaction rate of the OH radical is much higher than that of the NO3 radical, and thus, the concentration of TVOCs and its compounds at night is generally higher than that during the daytime (Atkinson and Arey, 2003). It should be noted that the average VOC mixing ratio at midnight during the control period was significantly lower than that in the other two periods; in particular, the concentrations of aromatics compounds were significantly decreased.
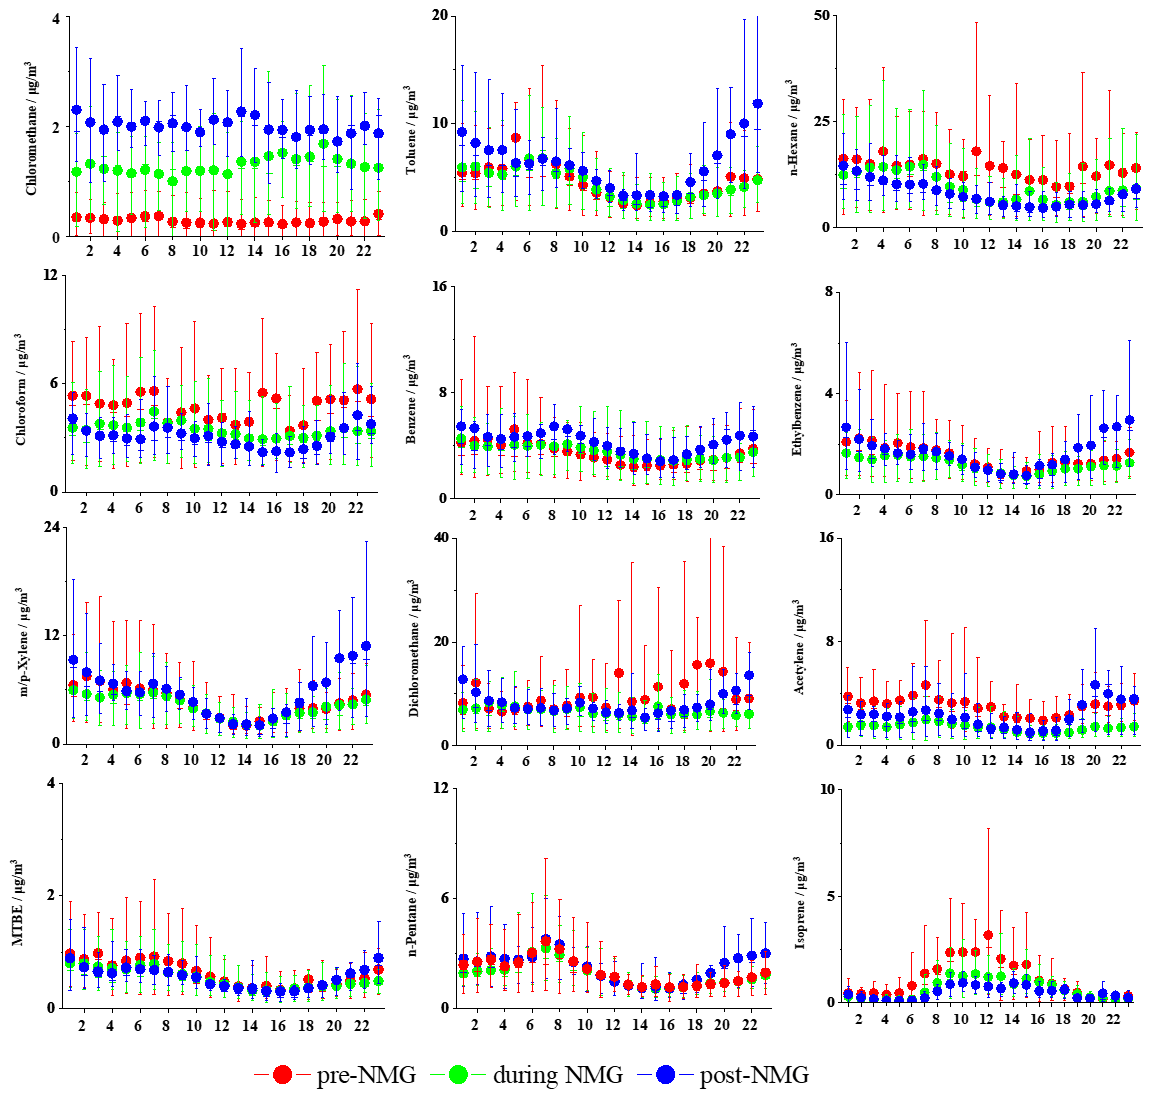
Figure 3Diurnal variations in concentrations of some reactive VOC species in Zhengzhou during the three periods.
As each source type has its own fingerprint, the mean diurnal variations of tracers during the three periods are presented in Fig. 3. Isopentane and n-pentane in the three periods have several minor peaks (e.g., 02:00 and 18:30 LST). The 02:00 LST peak is mainly from the freight trucks, and the 07:00 LST peak is most likely from traffic rush-hour emissions (Gentner et al., 2009; K. Li et al., 2019; Zheng et al. 2018). It should be noted that during the control period, the nighttime concentration significantly decreased, while the daytime concentrations of the three stages are close. Toluene, ethylbenzene, and xylenes (Fig. 3) as well as the tracer gases of NO and NO2 (Fig. S8 in the Supplement) in the three periods had similar diurnal patterns to those of pentane. All of the species mentioned above are tracers of traffic emission (Brito et al., 2015; Dörter et al., 2020; Yenisoy-Karakas et al., 2020). It is speculated that the control effect on muck truck is significant during the control period. As shown in Fig. 3, tracers of solvent utilization, such as hexane and dichloromethane, had different diurnal patterns to those of the vehicle source. During the pre-NMG period, the solvent tracer emissions are so strong that they almost offset the daytime trough caused by photochemical reactions and boundary layer height (K. Li et al., 2019). The daytime levels of the NMG period are lower than those of the first stage, which might be attributed to the intensive control over the use of outdoor solvents. Chloromethane and acetylene are tracers of biomass burning and combustion, respectively (McRoberts et al., 2015; Schauer et al., 2001). During the control period, acetylene decreased significantly, while chloromethane remained higher levels.
3.3 Source attribution and apportionment
3.3.1 Ratios of specific compounds
During the sampling period, the great changes in the mixing ratios of VOCs may be caused by the altered contribution of emission sources. Ratios of specific VOCs have commonly been used to identify emission sources.
Because i- and n-pentane have similar atmospheric lifetimes, these ratios are widely used to examine the impact of vehicle emissions and combustion emissions, and the values varied according to sources (i.e., 0.56–0.80 for coal combustion, 1.5–3.0 for liquid gasoline, 2.2–3.8 for vehicle emissions; Yan et al., 2017; Zheng et al., 2018). Isopentane and n-pentane showed highly significant correlations during the three periods (R2 > 0.6), suggesting the source of these two species was similar (Fig. S9 in the Supplement). In this study, the ratios of -pentane during the three periods were 1.5, 1.7, and 1.5, indicating that the VOCs originated from the mixed sources of coal combustion and vehicle emissions.
The toluene / benzene () ratio has also been widely applied to be an indicator of sources. A previous study reported that these two species are most probably from biomass burning, coal combustion, vehicle emissions, and solvent use, with the ratios ranging between 0.2–0.6, 0.6–1.0, 1.0–2.0, and > 4, respectively (Hui et al., 2018; Kumar et al., 2018; M. Song et al., 2019). As shown in Fig. S9, low correlations (R2 = 0.3–0.5) were found during the three periods, suggesting a more complex set of sources for the two species. The ratio in the three periods was 0.78, 0.75, and 0.92, respectively, indicating that the VOCs were greatly influenced by the mixed source of coal combustion and vehicle emissions. The ratio was lower in the control period. Acetylene concentration was low but the chloromethane concentration was high during the control period, indicating that biomass burning had a greater impact during this period.
3.3.2 Identification of PMF factors
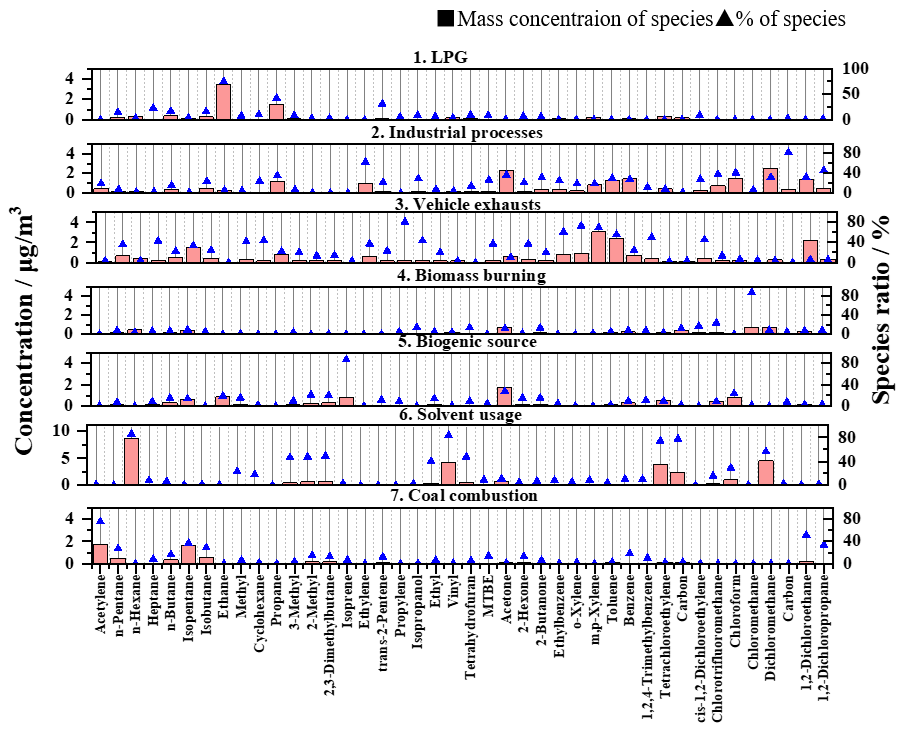
The 42 most abundant species, accounting for almost 90 % total VOC concentrations, were selected to be applied in the PMF receptor model to analyze the relative contribution of each potential source. The factor profiles of seven emission sources, namely, liquefied petroleum gas (LPG) evaporation, industrial processes, vehicle exhausts, biomass burning, biogenic source, solvent usage, and coal combustion, are identified in Fig. 4.
Source 1 was characterized by both high proportions and high abundances of ethane (38 %), ethene (53 %), propane (43 %), and other C3–C5 alkanes. A high proportion of short linear alkanes, such as ethane and propane, was likely released from the use of LPG (Yadav et al., 2019; Zhang et al., 2015). Consequently, factor 1 was assigned to LPG.
Source 2 accounts for larger percentages of carbon disulfide and halohydrocarbon, such as cis-1,2-dichloroethylene, chlorotrifluoromethane, trichloromethane, dichloromethane, 1,2-dichloroethane, and 1,2-dichloropropane, followed by some aromatics. Some previous studies indicated that these species were related to industrial processes (Hui et al., 2020; Zhang et al., 2018). Furthermore, ethylene, considered the blood of the industrial development (C. Song et al., 2019; Zheng et al., 2020), accounted for almost 65 % of the TVOCs in this factor. Therefore, this source is considered to be related to industrial processes.
Source 3 was characterized by a high percentage of some C4–C5 alkanes and aromatics. Toluene, ethyl-benzene, m,p-xylene, o-xylene, i,n-butane, and i,n-pentane are all associated with vehicle exhausts (Huang and Hsieh, 2019; Liu et al., 2019). Furthermore, the ratio was approximately 1.6, suggesting that this source was significantly affected by vehicle exhaust emissions. Factor 3 also includes high proportions of methyl tert-butyl ether, which is a common gasoline additive in China (Yang et al., 2018). Therefore, this factor can be labeled as vehicle exhaust.
Source 4 has high concentrations of chloromethane, which is a typical tracer of biomass burning (Ling et al., 2011; Zhang et al., 2019). The percentages of benzene and toluene were lower, but they could still not be neglected, and the ratio was < 0.5 (B. Li et al., 2019). Thus, source 4 was identified as biomass burning.
Source 5 accounts for larger percentages of isoprene, accounting for 86 % of the TVOCs in the source. Isoprene is an indicator of biogenic emissions and is emitted from many plants (Guenther et al., 1995 and 1997). This factor also included a considerable proportion of intermediate products (Liu et al., 2019), such as acetone, 2-hexanone, and 2-butanone. Therefore, this source is considered to be biogenic emissions.
Source 6 was differentiated by C6–C8 alkanes, such as n-hexane, methyl cyclopentane, 3-methylpentane, 2-methylpentane, and 2,3-dimethylbutane. The percentages of ethyl acetate, tetrachloroethylene, carbon tetrachloride, chloroform, and dichloromethane were high. These substances are important organic solvents and typical tracers of solvent usage (Hui et al., 2018, 2020). Meanwhile, there are virtually no other short-chain hydrocarbons in this source. Therefore, source 6 was primarily attributed to solvent usage rather than industrial processes or the vehicle emission source.
Source 7 was dominated by acetylene, which accounted for 75 % of the TVOCs in the source. Acetylene is a typical tracer of combustion emission (Hui et al., 2019; R. Wu et al., 2016). Some of the VOC species, such as alkanes and benzene, are the main components in emissions from coal burning (Liu et al., 2019; M. Song et al., 2019; Yang et al., 2018). Thus, factor 7 was assigned to combustion emission.

Figure 5Time series of each identified source contributions and accumulated relative VOC contributions.
3.3.3 Contributions of VOC sources
The concentrations of hourly mixing ratio and the relative contributions of each VOC sources are illustrated in Figs. 5 and S10 in the Supplement. Compared with the non-control periods, the contributions of coal combustion, vehicle exhausts, and solvent utilization are significantly reduced during the control period.
Conversely, the mixing ratios of LPG showed higher values during the control period. Peak values of biomass combustion were frequently present during the second period, and biomass combustion accounts for a relatively high proportion in this stage. The highest concentration was observed in the afternoon of the 18 September. Zhengzhou and its surrounding areas are in the harvest period of crops in September, so the emissions of biomass combustion need to be considered. Figure S11 in the Supplement shows the hotspots diagram of Zhengzhou and its surrounding areas during the observation period, and the number of fire spots in September was significantly higher than that in August.
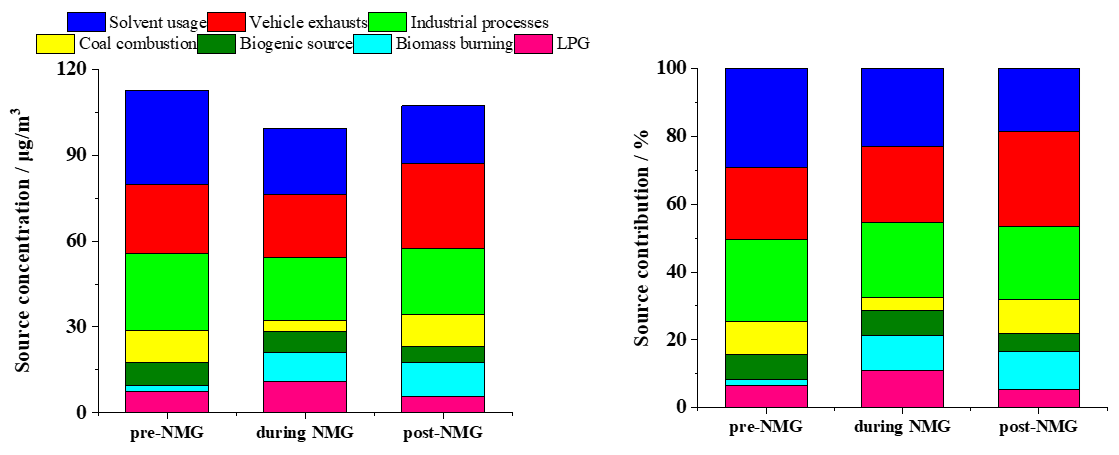
Figure 6Source contributions to VOC concentration in the PMF model during the three periods.
Time series of each identified source contributions are shown in Fig. 6. During the first period, solvent utilization (33 µg m−3) was the largest contributor and accounted for 30 % of TVOCs, followed by industrial processes (26 µg m−3, 23 %) and vehicle exhausts (24 µg m−3, 21 %). Although it was not a typical time for heating, coal combustion still accounted for 10 % of the TVOCs, probably due to several coal-fired power plants around Zhengzhou (B. Li et al., 2019). In contrast, the proportion of biomass combustion was very low during this period, accounting for only 2 % of the TVOCs.
During the control period, solvent utilization made the largest contribution (23 %) to atmospheric VOCs, with the concentration of 23 µg m−3, followed by industrial processes (22 %), vehicle emissions (22 %), and LPG (11 %). Biomass burning should not be ignored in this period, accounting for 10 % of total VOCs. The contribution from coal combustion was relatively low (3.5 µg m−3), accounting only for 4 % of TVOCs.
For the third period, the largest contributor was fuel combustion related to vehicle exhausts, with 30 µg m−3, accounting for 28 % of total VOCs. Industrial processes (23 µg m−3), solvent utilization (20 µg m−3), biomass burning (12 µg m−3), coal combustion (11 µg m−3), LPG (5.7 µg m−3), and biogenic emissions (5.6 µg m−3) accounted for 21 %, 19 %, 11 %, 10 %, 5 %, and 5 % of total VOCs, respectively.
In summary, the concentrations of solvent utilization were reduced to the greatest extent during the control period, with the value of 10 µg m−3 in the pre-NMG period, followed by coal combustion (7.1 µg m−3), industrial processes (4.0 µg m−3), and vehicle exhausts (2.2 µg m−3). Reductions of solvent utilization, coal combustion, industrial processes and vehicle exhausts were responsible for 80 %, 57 %, 32 %, and 18 % of the reductions in ambient VOCs, indicating that the control measures on solvent utilization and coal combustion were the most effective. In contrast, due to weak control on biomass burning and LPG, contributions from these sources were elevated. September is a harvest month in northern China, which means that biomass burning contributions might increase with time. Meanwhile, the peak contribution of this source occurred during the control period because of a lack of relative control measures on LPG.
3.4 Atmospheric environmental implications
In this section, the atmospheric environmental implications of VOCs are discussed by calculating the values of risk assessment and ozone formation potential (OFP).
3.4.1 Risk assessment of individual VOC species
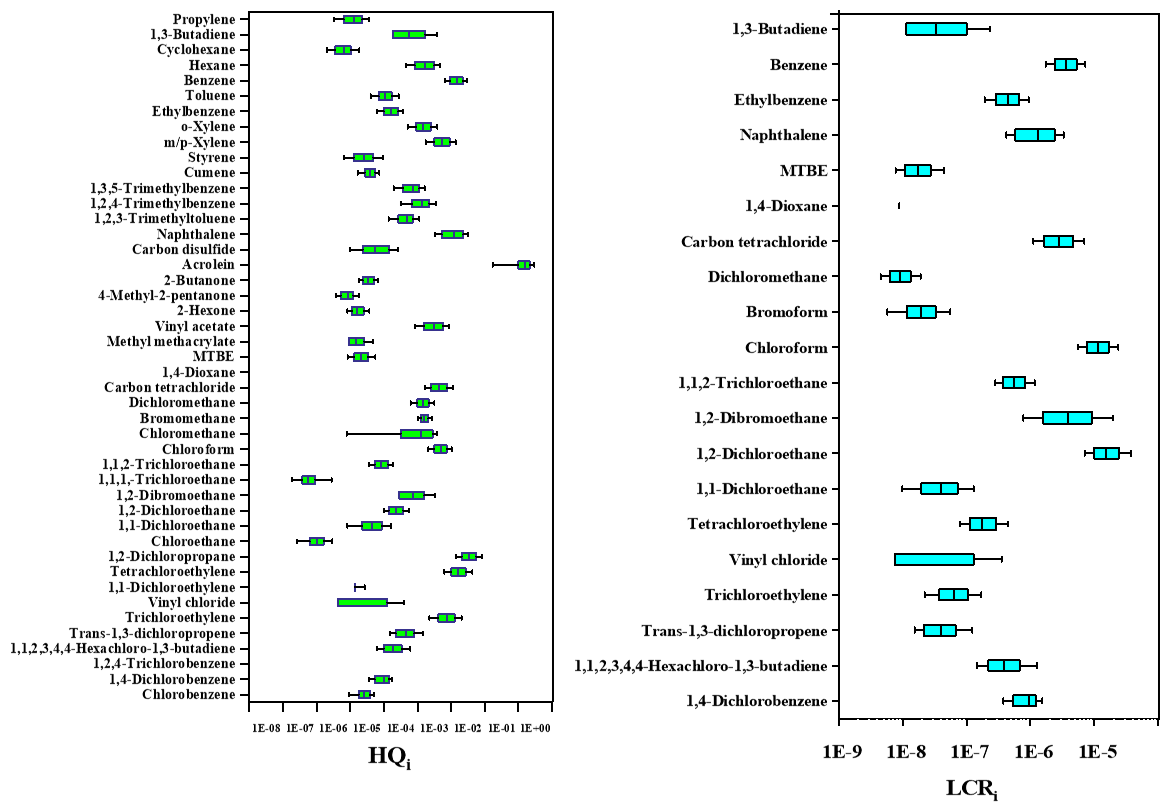
In addition to the impacts on ambient air quality, some VOC species are also toxic with various health impacts. In this paper, the non-carcinogenic risk (expressed by HQ) and carcinogenic risk (expressed by lifetime cancer risk, LCR) of hazardous VOC species were investigated, and the acceptable safety thresholds were 1 and 1 × 10⁻⁶, respectively (US EPA, 2009). On the whole, the HQ of almost all substances is far below the safety threshold, indicating no chance of non-carcinogenic risk. However, only the HQ of acrolein (1.8) exceeded the value of 1, suggesting the obvious chance of non-carcinogenic effects (Fig. 7). As for LCR, six species were above 1 × 10⁻⁶ in this study, including 1,2-dichloroethane (2.5 × 10⁻⁵), chloroform (1.1 × 10⁻⁵), 1,2-dibromoethane (8.1 × 10⁻⁶), naphthalene (6.4 × 10⁻⁶), benzene (5.2 × 10⁻⁶), and tetrachloromethane (3.3 × 10⁻⁶).
During the entire observation period, a total of seven VOCs may pose potential risks to human health. Health risk assessment in Zhengzhou was compared with other cities, as shown in Table S3. Overall, the values of risk assessment in this study are evidently lower than those reported in Beijing (Gu et al., 2019) and Langfang (Yang et al., 2019a), whereas they are higher than the summer of 2018 in Zhengzhou (Li et al., 2020). Evaluated health risk assessment before, during, and after the control period shows cumulative LCR was 5.8 × 10⁻⁵, 5.1 × 10⁻⁵, and 6.3 × 10⁻⁵, respectively, during the three periods (Fig. S12 in the Supplement). Control measures can reduce non-carcinogenic risk. On the other hand, values of six substances still exceed the acceptable safety threshold of LCR during the control period. As for non-carcinogenic risk assessment, the HI was 1.6, 2.1, and 2.1, respectively. Noticeably, the HQ of acrolein (1.9) during the control period was higher than the other two periods, which should be paid more attention to. In summary, VOC concentrations decreased significantly during the control period but still posed health risks to humans. Therefore, we need to focus on the targeted emission reduction of these characteristic substances to protect human health.
3.4.2 Variations of OFP
The OFP and their compositions during the three periods are shown in Fig. S13 and Table S6 in the Supplement. The total OFP during the control period was 183 ± 115 µg m−3, which was 0.77 and 0.83 times lower than before and after the control period, respectively. As shown in Fig. S13, the aromatics were the dominant contributors to total OFP in all three periods, comprising 42 %, 50 %, and 56 %, respectively, followed by OVOCs, alkanes, alkenes, halohydrocarbon, and acetylene. Aromatics played a key role in ozone formation, which is similar to the results of many previous reports (Wang et al., 2013; Zou et al., 2015).
Table 2OFP contributions (µg m−3) of each VOC source during the sampling periods in Zhengzhou.
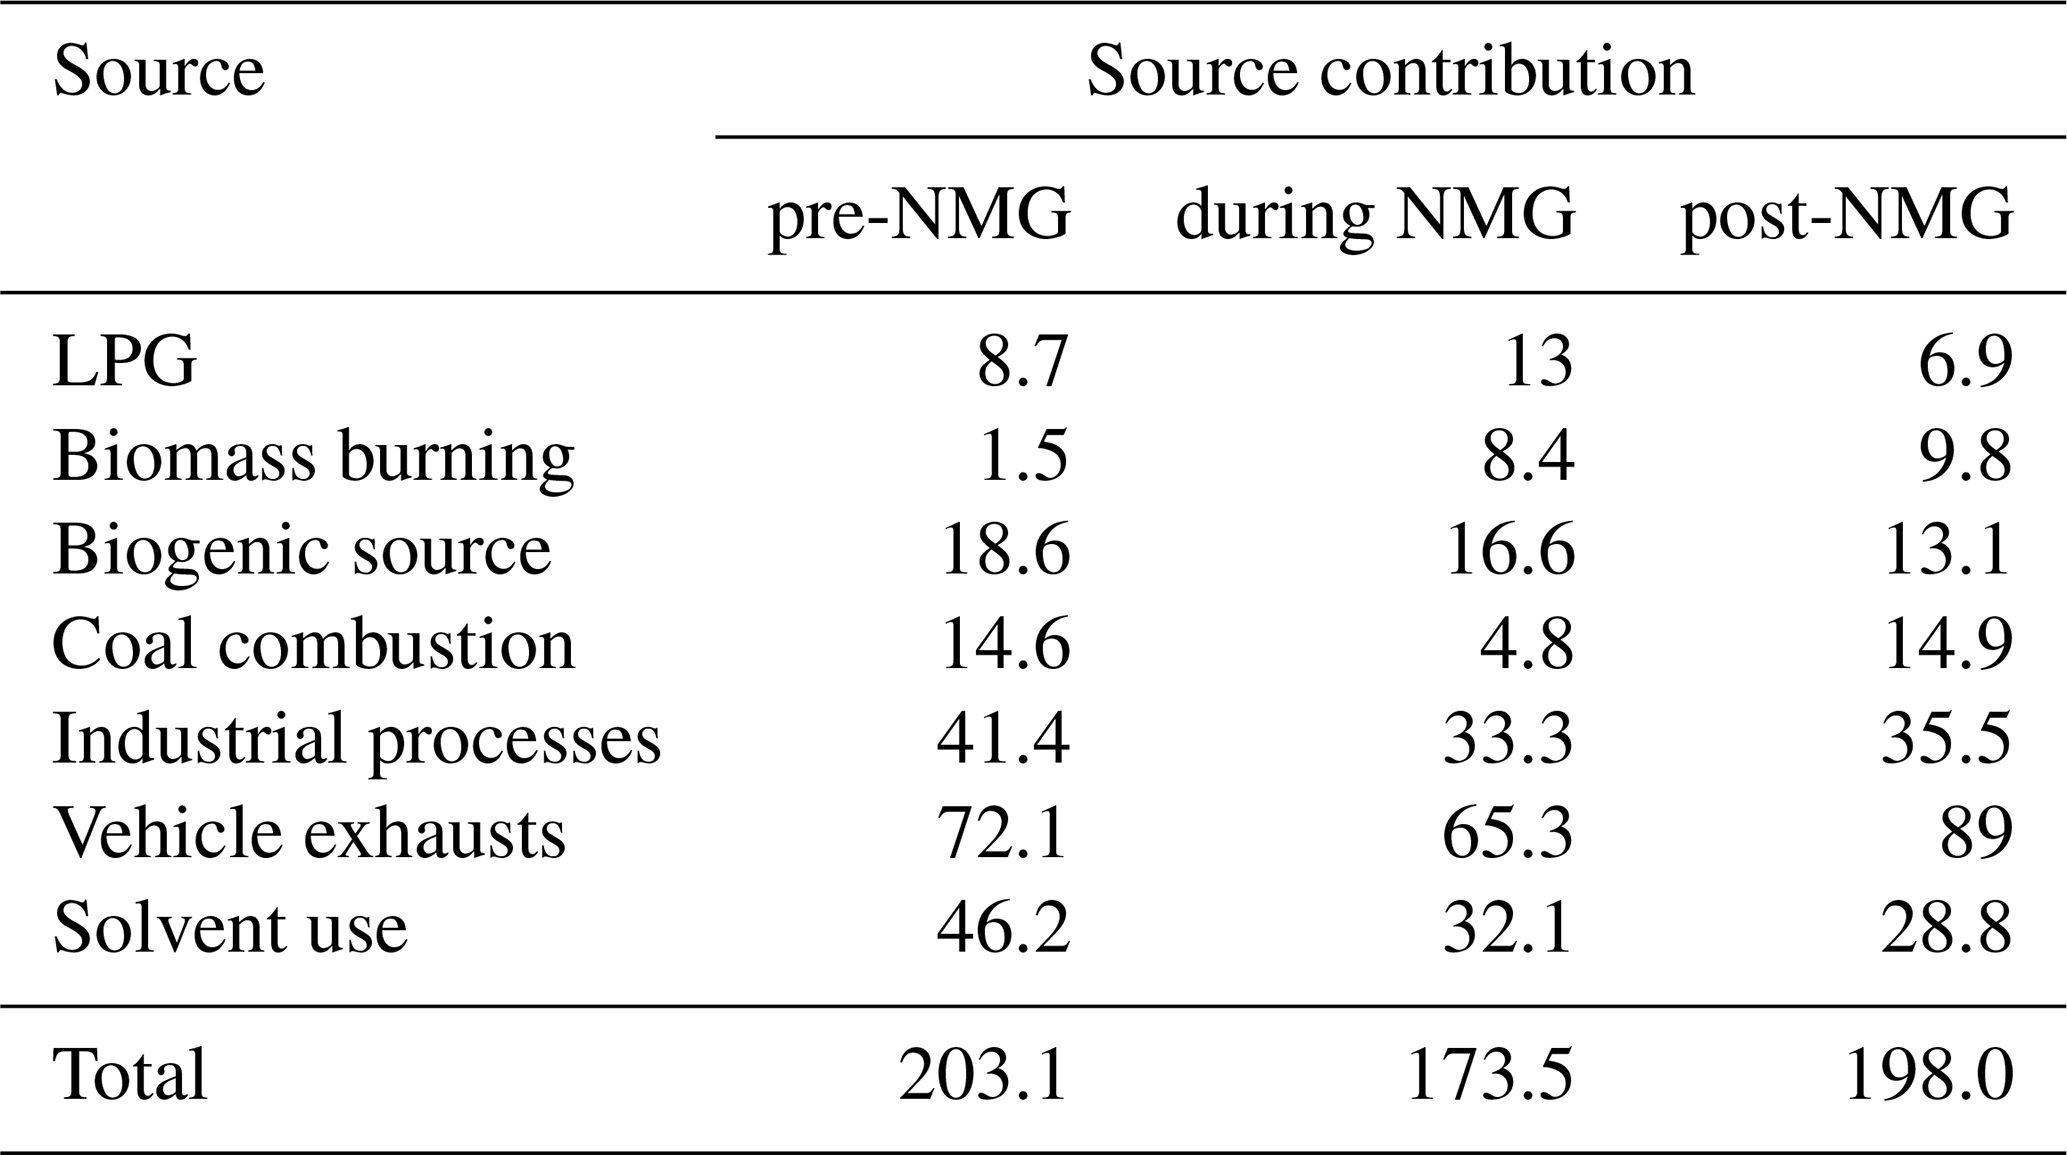
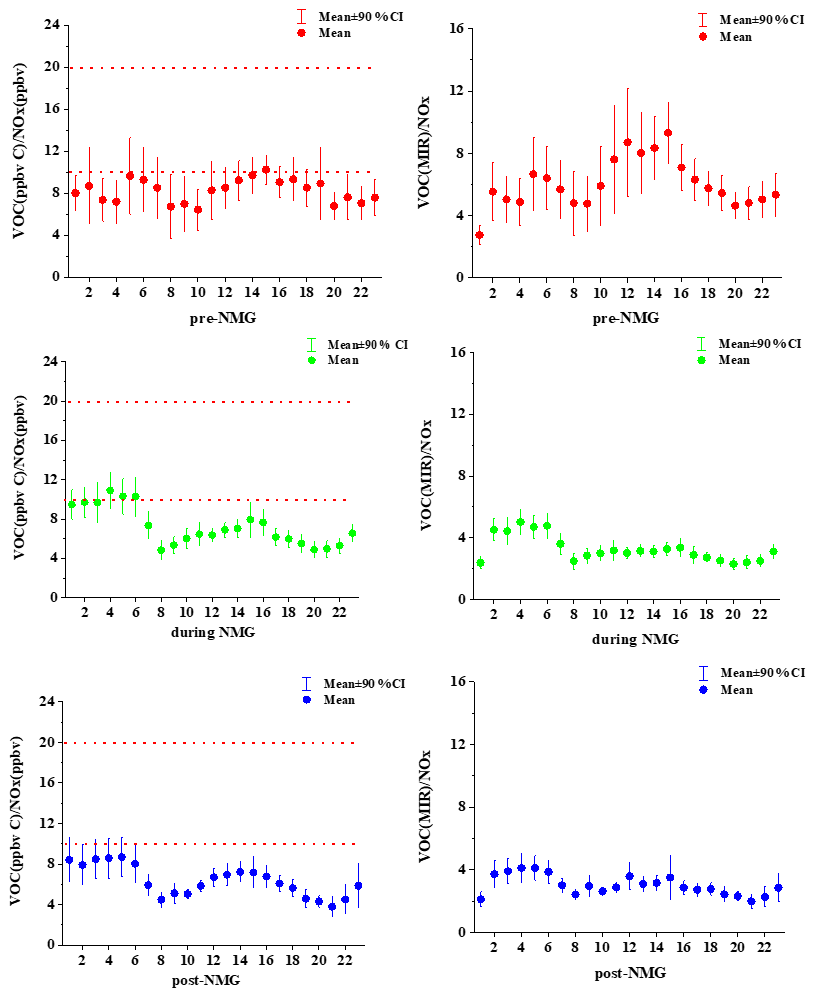
Figure 8Daily variations in the ratio in Zhengzhou before, during, and after the NMG period.
The source contributions to OFP were calculated using the PMF model (Table 2). The most important source to ozone formation was traffic emissions. Industrial emissions and solvent usage were the second and third sources of photochemical ozone formation. Among them, solvent use has the greatest contribution to the OFP reduction with the emission reduction during the control period, explaining a 48 % reduction in OFP. Although combustion contributes only 10 % of the total OFP, this source played an important role in the reduction in OFP, explaining 33 % of the OFP reduction. At the same time, control of traffic and industry also reduced the OFP during the games. Thus, solvent utilization and combustion controls were the most important measures taken to reduce OFP during the National Minority Games 2019 in Zhengzhou. However, the current knowledge about formation mechanisms of O3 is still very limited, and the next section discusses the sensitivity of ozone.
3.5 O3–NOx–VOC sensitivity and control strategies
The impact of ozone precursors on ozone formation can be described as either a NOx-limited or VOC-limited regime, which is an important step in developing effective control strategies to reduce regional ozone pollution. The ratios of have been widely used to determine the ozone formation regime. Generally, VOC-sensitive regimes occur when ratios are lower than 10 (ppb C ppbv−1); ozone formation is NOx-limited when the ratios are greater than 20 (B. Li et al., 2019; Y. Li et al., 2021; Sillman, 1999).
The diurnal variations of the ratios before, during, and after the control period are shown in Fig. 8, and the ratios for the three periods showed similar daily variations. Higher ratios were observed at midnight (01:00–06:00), especially during the control period (Fig. 8), due to the emission reduction of NOx emissions, with a ratio of 10. Afterwards, the ratio decreased rapidly, indicating that NOx concentration increased faster than NMHCs due to the effect of vehicular emissions (Zou et al., 2019). Thereafter, the ratio of also increased with the continuous accumulation of O3 concentration.
At the peak time of O3 concentration (12:00–16:00), the average ratio was approximately 9.3 during the pre-NMG period, which was slightly lower than 10 and thus proved that the ozone generation in this period was limited by VOCs. During the control period, the ratio in the afternoon was lower than that in the pre-NMG period, with a mean value of 7.1. In this study, the mean values of (ppbv C ppbv−1) were below 10 during all three periods, indicating that the O3 formation was sensitive to VOCs in Zhengzhou, and the reductions of the VOC emissions will be beneficial for O3 alleviation. Meanwhile, the daily variation of VOC (MIR) / NOx is similar to that of (ppbv C ppbv−1).
It should be noted that ozone sensitivity can only be initially determined by the ratio, and in the next section this will be verified by the WRF-CMAQ model.
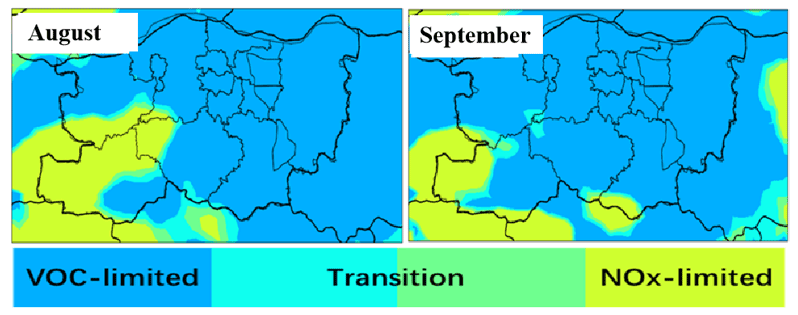
Figure 9Spatial comparison of the O3–NOx–VOC sensitive regime between August and September 2019 in Zhengzhou.
As shown in Fig. 9, the values of sensitivity_NOx / sensitivity_VOCs were generally lower than 0.8 in the urban district of Zhengzhou and its surrounding areas, while the ratio of the western part of Zhengzhou is more than 1.2. Thus, O3 formation is quite sensitive to VOCs, and that means VOCs should be controlled as a priority in the effective control of O3. To achieve a more effective reduction, it is necessary to study reduction ratios that have the greatest effect on control strategies in reducing ozone concentration.
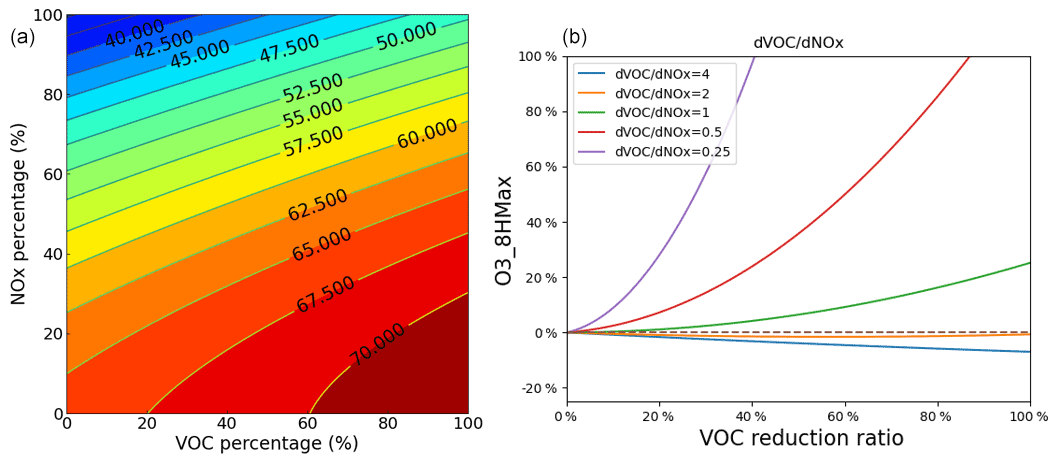
Figure 10An O3 isopleth diagram versus NOx and VOCs using EKMA (a) and a variation chart of O3 concentration in each control path (b) during the pre-NMG period in Zhengzhou.
The Empirical Kinetic Modeling Approach (EKMA) of O3–VOC–NOx sensitivity analysis is presented in Fig. 10. The results reflect that reducing VOCs can alleviate ozone pollution, while reducing NOx concentration might lead to the increase of ozone concentration. Some scholars have pointed out that the reaction rate constant between NOx and the OH radical is 5.5 times higher than that of VOCs and the OH radical (Chen et al., 2019). Therefore, the reduction of NOx may lead to an increase in OH radicals from the VOC oxidation cycle, thereby promoting the formation of O3. The responses of ozone to its precursors (VOCs and NOx) under different emission-reduction scenarios are shown in Fig. 10. Reduction of ozone precursors will not improve photochemical pollution when reduction ratios of the precursors (VOC : NOx) are less than 1. As shown in Fig. 10, O3 levels decreased most effectively for the only VOC reduction scheme, with VOCs : NOx = 2 : 1 (using mol ratio). It should be noted that it is nearly impossible to reduce VOC emissions only while NOx remains unchanged because VOCs (particularly anthropogenic VOCs) and NOx are generally co-emitted (Chen et al., 2019).
During the NMG period, the government carried out stringent emission controls. The concentrations of ozone precursors showed a decreasing trend, but the ozone pollution was still serious. Unreasonable emission reduction may be an important factor leading to ozone pollution. Combined with the results of this study, it is suggested that reduction ratios of the precursors (VOCs : NOx) should be more than 2 to effectively alleviate ozone pollution. Controlling VOC sources is the key to alleviating local ozone pollution, especially the control of aromatic hydrocarbons. Solvent usage is a non-combustion process, and therefore reducing VOC emission from this source will not contribute to the decrease of NOx emission. These findings could guide the formulation and implementation of effective O3 control strategies in Zhengzhou.
A number of strict emission control measures were implemented in Zhengzhou and its surrounding area to ensure good air quality during the NMG period. The concentrations of VOCs and NOx decreased significantly; however, O3 pollution has not been effectively alleviated. To provide scientific references and guidance for atmospheric control strategies, this study systematically quantified the impacts of the characterization of VOC levels, photochemical reactivity, source contribution of the VOCs, and the ozone–NOx–VOC sensitivities during sporting events in Zhengzhou.
The mixing ratios of TVOCs during the control period were 121 ± 55 µg m−3 and decreased by about 19 % and 11 % before and after emission reduction. Source apportionment showed that solvent usage, industrial processes, vehicle exhausts, LPG, biomass burning, biogenic source, and coal combustion were the major sources of VOCs, and the seven sources accounted for 23 %, 23 %, 22 %, 11 %, 10 %, 8 %, and 4 % during the NMG period. The control measures on solvent utilization and coal combustion were most effective, accounting for 80 % and 57 % of the reductions in ambient VOCs, respectively. However, contributions of biomass burning were elevated. The total OFP during the control period was 183 ± 115 µg m−3, which was 0.23 and 0.17 times lower than before and after the control period, respectively. Measures on solvent utilization and combustion were the most important controls to reduce OFP during the NMG period.
The O3–NOx–VOC sensitivity showed that Zhengzhou is under a VOC-sensitive regime. Reducing VOCs can alleviate ozone pollution, while excessively reducing NOx concentration might lead to the increase of ozone concentration. Unreasonable emission reduction may aggravate ozone pollution during the control period. It is suggested that emission-reduction ratios of the precursors (VOC:NOx) should be more than 2. Considering that solvent usage is a non-combustion process, reducing VOC emission from this source will not cause the decrease of NOx emission; therefore the solvent source can be controlled preferentially.
The data set is available to the public and can be accessed upon request from Ruiqin Zhang (rqzhang@zzu.edu.cn).
The supplement related to this article is available online at: https://doi.org/10.5194/acp-21-15239-2021-supplement.
SYu and RZ planned and organized the study and were deeply involved in the writing of the manuscript. FS, SYi, and SW performed the atmospheric measurements and data analysis and wrote the manuscript. BH, XF, and MY assisted heavily with the atmospheric measurements and data analysis. FS and RX conducted the model development and data analysis. Other coauthors provided useful insights on data analysis and contributed to the writing of the manuscript. SYu and FS contributed equally to this work.
The authors declare that they have no conflict of interest.
Publisher's note: Copernicus Publications remains neutral with regard to jurisdictional claims in published maps and institutional affiliations.
This work was supported by the Study of Collaborative Control of PM2.5 and O3 Pollution in Zhengzhou City (grant no. 20200321A) and the National Key Research and Development Program of China (grant no. 2017YFC0212403). We thank Dong Zhang, Aizhi Huang, and Huan Zhang for their contributions to the field observations.
This research has been supported by the Study of Collaborative Control of PM2.5 and O3 Pollution in Zhengzhou City (grant no. 20200321A) and the National Key Research and Development Program of China (grant no. 2017YFC0212403).
This paper was edited by Christopher Cantrell and reviewed by two anonymous referees.
Atkinson, R. and Arey, J.: Atmospheric degradation of volatile organic compounds, Chem. Rev., 103, 4605–4638, https://doi.org/10.1021/cr0206420, 2003.
Bai, L., Lu, X., Yin, S., Zhang, H., Ma, S., Wang, C., Li, Y., and Zhang, R.: A recent emission inventory of multiple air pollutant, PM2.5 chemical species and its spatial-temporal characteristics in central China, J. Clean. Prod., 269, 112–114, 2020.
Baudic, A., Gros, V., Sauvage, S., Locoge, N., Sanchez, O., Sarda-Estève, R., Kalogridis, C., Petit, J.-E., Bonnaire, N., Baisnée, D., Favez, O., Albinet, A., Sciare, J., and Bonsang, B.: Seasonal variability and source apportionment of volatile organic compounds (VOCs) in the Paris megacity (France), Atmos. Chem. Phys., 16, 11961–11989, https://doi.org/10.5194/acp-16-11961-2016, 2016.
Bressi, M., Sciare, J., Ghersi, V., Mihalopoulos, N., Petit, J.-E., Nicolas, J. B., Moukhtar, S., Rosso, A., Féron, A., Bonnaire, N., Poulakis, E., and Theodosi, C.: Sources and geographical origins of fine aerosols in Paris (France), Atmos. Chem. Phys., 14, 8813–8839, https://doi.org/10.5194/acp-14-8813-2014, 2014.
Brito, J., Wurm, F., Serrano, A., Assuno, J., Artaxo, P., Godoy, J., and Artaxo, P.: Vehicular Emission Ratios of VOCs in a Megacity Impacted by Extensive Ethanol Use: Results of Ambient Measurements in Sao Paulo, Brazil, Environ. Sci. Technol., 49, 11381, https://doi.org/10.1021/acs.est.5b03281, 2015.
Byun, D. and Ching, J.: Science Algorithms of the EPA Models-3 Community Multiscale Air Quality (CMAQ) Modeling System, US Environmental Protection Agency, Office of Research and Development, Washington, DC, USA, 1999.
Carter, W.: Development of ozone reactivity scales for volatile organic compounds, J. Air Waste Manage., 44, 881–899, 1994.
Carter, W.: Updated Maximum Incremental Reactivity Scale and Hydrocarbon Bin Reactivities for Regulatory Applications, prepared for California Air Resources Board Contract 07-339, College of Engineering Center for Environmental Research and Technology, University of California, Riverside, California, 2010a.
Carter, W.: Development of the SAPRC-07 chemical mechanism, Atmos. Environ., 44, 5324–5335, 2010b.
Chan, K. L., Hartl, A., Lam, Y. F., Xie, P. H., Liu, W. Q., Cheung, H. M., Lampel, J., Pöhler, D., Li, A., Xu, J., Zhou, H. J., Ning, Z., and Wenig, M. O.: Observations of tropospheric NO2 using ground based MAX-DOAS and OMI measurements during the Shanghai World Expo 2010, Atmos. Environ., 119, 45–58, 2015.
Chen, X., Situ, S., Zhang, Q., Wang, X., Sha, C., Zhouc, L., Wu, L., Wu, L., Ye, L., and Li, C.: The synergetic control of NO2 and O3 concentrations in a manufacturing city of southern China, Atmos. Environ., 201, 402–416, 2019.
Chemel, C., Fisher, B., Kong, X., Francis, X., Sokhi, R., Good, N., Collins, W., and Folberth, G.: Application of chemical transport model CMAQ to policy decisions regarding PM2.5 in the UK, Atmos. Environ., 82, 410–417, 2014.
Chi, X., Liu, C., Xie, Z., Fan, G., Wang, Y., He, P., Fan, S., Hong, Q., Wang, Z., Yu, X., Yue, F., Duan, J., Zhang, P., and Liu, J.: Observations of ozone vertical profiles and corresponding precursors in the low troposphere in Beijing, China, Atmos. Res., 213, 224–235, 2018.
Dörter, M., Odabasi, M., and Yenisoy-Karaka, S.: Source apportionment of biogenic and anthropogenic VOCs in Bolu plateau, Sci. Total Environ., 731, 139201, https://doi.org/10.1016/j.scitotenv.2020.139201, 2020.
Gentner, D., Harley, R., Miller, A., and Goldstein, A.: Diurnal and seasonal variability of gasoline-related volatile organic compound emissions in Riverside, California, Environ. Sci. Technol., 43, 4247–4252, 2009.
Gu, Y., Li, Q., Wei, D., Gao, L., Tan, L., Su, G., Liu, G., Liu, W., Li, C., and Wang, Q.: Emission characteristics of 99 NMVOCs in different seasonal days and the relationship with air quality parameters in Beijing, China, Ecotox. Environ. Safe., 169, 797–806, 2019.
Guenther, A.: Seasonal and spatial variations in natural volatile organic compound emissions, Ecol. Appl., 7, 34–45, 1997.
Guenther, A., Hewitt, C. N., Erickson, D., Fall, R., Geron, C., Graedel, T., Harley, P., Klinger, L., Lerdau, M., McKay, W. A., Pierce, T., Scholes, B., Steinbrecher, R., Tallamraju, R., Taylor, J., and Zimmerman, P.: A global model of natural volatile organic compound emissions, J. Geophys. Res., 100, 8873–8892, 1995.
Hakami, A., Henze, D. K., Seinfeld, J. H., Singh, K., Sandu, A., Kim, S., Byun, D., and Li, Q.: The adjoint of CMAQ, Environ. Sci. Technol., 41, 7807–7817, https://doi.org/10.1021/es070944p, 2007.
Hsu, C. Y., Chiang, H. C., Shie, R. H., Ku, C. H., Lin, T. Y., Chen, M. J., Chen, N. T., and Chen, Y. C.: Ambient VOCs in residential areas near a large-scale petrochemical complex: Spatiotemporal variation, source apportionment and health risk, Environ. Pollut., 240, 95–104, 2018.
Hu, R., Liu, G., Zhang, H., Xue, H., and Wang, X.: Levels, characteristics and health risk assessment of VOCs in different functional zones of Hefei, Ecotox. Environ. Safe., 160, 301–307, 2018.
Huang, W., Fang, D., Shang, J., Li, Z., Zhang, Y., Huo, P., Liu, Z., Schauer, J. J., and Zhang, Y.: Relative impact of short-term emissions controls on gas and particle-phase oxidative potential during the 2015 China Victory Day Parade in Beijing, China, Atmos. Environ., 183, 49–56, 2018.
Huang, Y. S. and Hsieh, C. C.: Ambient volatile organic compound presence in the highly urbanized city: source apportionment and emission position, Atmos. Environ., 206, 45–59, 2019.
Hui, L., Liu, X., Tan, Q., Feng, M., An, J., Qu, Y., Zhang, Y., and Jiang, M.: Characteristics, source apportionment and contribution of VOCs to ozone formation in Wuhan, Central China, Atmos. Environ., 192, 55–71, 2018.
Hui, L., Liu, X., Tan, Q., Feng, M., An, J., Qu, Y., Zhang, Y., and Cheng, N.: VOC characteristics, sources and contributions to SOA formation during haze events in Wuhan, Central China, Sci. Total Environ., 650, 2624–2639, 2019.
Hui, L., Liu, X., Tan, Q., Feng, M., An, J., Qu, Y., Zhang, Y., Deng, Y., Zhai, R., and Wang, Z.: VOC characteristics, chemical reactivity and sources in urban Wuhan, central China, Atmos. Environ., 224, 117340, https://doi.org/10.1016/j.atmosenv.2020.117340, 2020.
Jaars, K., Vestenius, M., van Zyl, P. G., Beukes, J. P., Hellén, H., Vakkari, V., Venter, M., Josipovic, M., and Hakola, H.: Receptor modelling and risk assessment of volatile organic compounds measured at a regional background site in South Africa, Atmos. Environ., 172, 133–148, 2018.
Jiang, N., Li, L., Wang, S., Li, Q., Dong, Z., Duan, S., Zhang, R., and Li, S.: Variation tendency of pollution characterization, sources, and health risks of PM2.5-bound polycyclic aromatic hydrocarbons in an emerging megacity in China: Based on three-year data, Atmos. Res., 217, 81–92, 2019.
Kumar, A., Singh, D., Kumar, K., Singh, B. B., and Jain, V. K.: Distribution of VOCs in urban and rural atmospheres of subtropical India: Temporal variation, source attribution, ratios, OFP and risk assessment, Sci. Total Environ., 613-614, 492–501, 2018.
Li, B., Ho, S. S. H., Gong, S., Ni, J., Li, H., Han, L., Yang, Y., Qi, Y., and Zhao, D.: Characterization of VOCs and their related atmospheric processes in a central Chinese city during severe ozone pollution periods, Atmos. Chem. Phys., 19, 617–638, https://doi.org/10.5194/acp-19-617-2019, 2019.
Li, H., Wang, D., Cui, L., Gao, Y., Huo, J., Wang, X., Zhang, Z., Tan, Y., Huang, Y., Cao, J., Chow, J., Lee, S., and Fu, Q.: Characteristics of atmospheric PM2.5 composition during the implementation of stringent pollution control measures in shanghai for the 2016 G20 summit, Sci. Total. Environ., 648, 1121–1129, https://doi.org/10.1016/j.scitotenv.2018.08.219, 2019.
Li, J., Xie, S. D., Zeng, L. M., Li, L. Y., Li, Y. Q., and Wu, R. R.: Characterization of ambient volatile organic compounds and their sources in Beijing, before, during, and after Asia-Pacific Economic Cooperation China 2014, Atmos. Chem. Phys., 15, 7945–7959, 2015.
Li, J., Zhai, C., Yu, J., Liu, R., Li, Y., Zeng, L., and Xie, S.: Spatiotemporal variations of ambient volatile organic compounds and their sources in Chongqing, a mountainous megacity in China, Sci. Total Environ., 627, 1442–1452, 2018.
Li, K., Li, J., Wang, W., Tong, S., Liggio, J., and Ge, M.: Evaluating the effectiveness of joint emission control policies on the reduction of ambient VOCs: Implications from observation during the 2014 APEC summit in suburban Beijing, Atmos. Environ., 164, 117–127, 2017.
Li, K., Li, J., Tong, S., Wang, W., Huang, R.-J., and Ge, M.: Characteristics of wintertime VOCs in suburban and urban Beijing: concentrations, emission ratios, and festival effects, Atmos. Chem. Phys., 19, 8021–8036, https://doi.org/10.5194/acp-19-8021-2019, 2019.
Li, R., Wang, Z., Cui, L., Fu, H., Zhang, L., Kong, L., Chen, W., and Chen, J.: Air pollution characteristics in China during 2015-2016: Spatiotemporal variations and key meteorological factors, Sci. Total Environ., 648, 902–915, 2019.
Li, Y., Yin, S., Yu, S., Yuan, M., Dong, Z., Zhang, D., Yang, L., and Zhang, R.: Characteristics, source apportionment and health risks of ambient VOCs during high ozone period at an urban site in central plain, China, Chemosphere, 250, 126283, https://doi.org/10.1016/j.chemosphere.2020.126283, 2020.
Li, Y., Yin, S., Yu, S., Bai, L., Wang, X., Lu, X., and Ma, S.: Characteristics of ozone pollution and the sensitivity to precursors during early summer in central plain, China, J. Environ. Sci.-China, 99, 354–368, 2021.
Ling, Z. H., Guo, H., Cheng, H. R., and Yu, Y. F.: Sources of ambient volatile organic compounds and their contributions to photochemical ozone formation at a site in the Pearl River Delta, southern China, Environ. Pollut., 159, 2310–2319, 2011.
Liu, Y., Wang, H., Jing, S., Gao, Y., Peng, Y., Lou, S., Cheng, T., Tao, S., Li, L., Li, Y., Huang, D., Wang, Q., and An, J.: Characteristics and sources of volatile organic compounds (VOCs) in Shanghai during summer: Implications of regional transport, Atmos. Environ., 215, 116902, https://doi.org/10.1016/j.atmosenv.2019.116902, 2019.
Liu, Y., Song, M., Liu, X., Zhang, Y., Hui, L., Kong, L., Zhang, Y., Zhang, C., Qu, Y., An, J., Ma, D., Tan, Q., and Feng, M.: Characterization and sources of volatile organic compounds (VOCs) and their related changes during ozone pollution days in 2016 in Beijing, China, Environ. Pollut., 257, 113599, https://doi.org/10.1016/j.envpol.2019.113599, 2020.
Ma, T., Duan, F., He, K., Qin, Y., Tong, D., Geng, G., Liu, X., Li, H., Yang, S., Ye, S., Xu, B., Zhang, Q., and Ma, Y.: Air pollution characteristics and their relationship with emissions and meteorology in the Yangtze River Delta region during 2014–2016, J. Environ. Sci.-China, 83, 8–20, 2019.
McRoberts, W., Keppler, F., Harper, D., and Hamilton, J.: Seasonal changes in chlorine and methoxyl content of leaves of deciduous trees and their impact on release of chloromethane and methanol at elevated temperatures, Environ. Chem., 12, 426–437, 2015.
Norris, G., Duvall, R., Brown, S., and Bai, S.: EPA Positive Matrix Factorization (PMF) 5.0, Fundamentals and User Guide, EPA/600/R-14/108, US Environmental Protection Agency, Washington, DC, 2014.
RAIS (The Risk Assessment Information System): available at: http://rais.ornl.gov/tools/profile.php (last access: 10 October 2019), 2016.
Ren, Y., Li, H., Meng, F., Wang, G., Zhang, H., Yang, T., Li, W., Ji, Y., Bi, F., and Wang, X.: Impact of emission controls on air quality in Beijing during the 2015 China Victory Day Parade: Implication from organic aerosols, Atmos. Environ., 198, 207–214, 2019.
Sahu, L., Tripathi, N., and Yadav, R.: Contribution of biogenic and photochemical sources to ambient VOCs during winter to summer transition at a semi-arid urban site in India, Environ. Pollut., 229, 595–606, 2017.
Schauer, J., Kleeman, M., Cass, G., and Simoneit, B.: Measurement of emissions from air pollution sources. 3. C1-C29 organic compounds fromfireplace combustion of wood, Environ. Sci. Technol., 35, 1716–1728, 2001.
Schleicher, N., Norra, S., and Chen, Y.: Efficiency of mitigation measures to reduce particulate air pollution-a case study during the Olympic Summer Games 2008 in Beijing, China, Sci. Total Environ., 427–428, 146–158, 2012.
Sillman, S.: The relation between ozone, NOx and hydrocarbons in urban and polluted rural environments, Atmos. Environ., 33, 1821–1845, 1999.
Song, C., Liu, B., Dai, Q., Li, H., and Mao, H.: Temperature dependence and source apportionment of volatile organic compounds (VOCs) at an urban site on the north China plain, Atmos. Environ., 207, 167–181, https://doi.org/10.1016/j.atmosenv.2019.03.030, 2019.
Song, M., Liu, X., Zhang, Y., Shao, M., Lu, K., Tan, Q., Feng, M., and Qu, Y.: Sources and abatement mechanisms of VOCs in southern China, Atmos. Environ., 201, 28–40, https://doi.org/10.1016/j.atmosenv.2018.12.019, 2019.
Su, F., Xu, Q., Wang, K., Yin, S., Wang, S., Zhang, R., Tang, X., and Ying, Q.: On the effectiveness of short-term intensive emission controls on ozone and particulate matter in a heavily polluted megacity in central China, Atmos. Environ., 246, 118111, https://doi.org/10.1016/j.atmosenv.2020.118111, 2021.
Tan, Z., Lu, K., Dong, H., Hu, M., Li, X., Liu, Y., Lu, S., Shao, M., Su, R., Wang, H., Wu, Y., Wahner, A., and Zhang, Y.: Explicit diagnosis of the local ozone production rate and the ozone-NOx-VOC sensitivities, Sci. Bull., 63, 1067–1076, 2018.
Ulbrich, I. M., Canagaratna, M. R., Zhang, Q., Worsnop, D. R., and Jimenez, J. L.: Interpretation of organic components from Positive Matrix Factorization of aerosol mass spectrometric data, Atmos. Chem. Phys., 9, 2891–2918, https://doi.org/10.5194/acp-9-2891-2009, 2009.
US EPA: Air Method, Toxic Organics-15 (TO-15): Compendium of Methods for the Determination of Toxic Organic Compounds in Ambient Air, 2nd edn., Determination of Volatile Organic Compounds (VOCs) in Air Collected in Specially-Prepared Canisters and Analyzed by Gas Chromatography/Mass Spectrometry (GC/MS), Cincinnati, 1999.
US EPA: Risk Assessment Guidance for Superfund Volume I: Human Health Evaluation Manual (Part F, Supplemental Guidance for Inhalation Risk Assessment), EPA-540-R-070–002, US Environmental Protection Agency, Washington, DC, USA, 2009.
Waked, A., Favez, O., Alleman, L. Y., Piot, C., Petit, J.-E., Delaunay, T., Verlinden, E., Golly, B., Besombes, J.-L., Jaffrezo, J.-L., and Leoz-Garziandia, E.: Source apportionment of PM10 in a north-western Europe regional urban background site (Lens, France) using positive matrix factorization and including primary biogenic emissions, Atmos. Chem. Phys., 14, 3325–3346, https://doi.org/10.5194/acp-14-3325-2014, 2014.
Wang, H., Chen, C., Wang, Q., Huang, C., Su, L., Huang, H., Lou, S., Zhou, M., Li, L., Qiao, L., and Wang, Y.: Chemical loss of volatile organic compounds and its impact on the source analysis through a two-year continuous measurement, Atmos. Environ., 80, 488–498, 2013.
Wang, M., Zhu, T., Zheng, J., Zhang, R. Y., Zhang, S. Q., Xie, X. X., Han, Y. Q., and Li, Y.: Use of a mobile laboratory to evaluate changes in on-road air pollutants during the Beijing 2008 Summer Olympics, Atmos. Chem. Phys., 9, 8247–8263, https://doi.org/10.5194/acp-9-8247-2009, 2009.
Wang, N., Lyu, X., Deng, X., Huang, X., Jiang, F., and Ding, A.: Aggravating O3 pollution due to NOx emission control in eastern China, Sci. Total Environ., 677, 732–744, https://doi.org/10.1016/j.scitotenv.2019.04.388, 2019.
Wang, P., Chen, Y., Hu, J., Zhang, H., and Ying, Q.: Attribution of tropospheric ozone to NOx and VOC emissions: considering ozone formation in the transition regime, Environ. Sci. Technol., 53, 1404–1412, 2019.
Wang, S., He, B., Yuan, M., Su, F., Yin, S., Yan, Q., Jiang, N., Zhang, R., and Tang, X.: Characterization of individual particles and meteorological conditions during the cold season in Zhengzhou using a single particle aerosol mass spectrometer, Atmos. Res., 219, 13–23, https://doi.org/10.1016/j.atmosres.2018.12.021, 2019.
Wang, W., Jing, L., Zhan, J., Wang, B., Zhang, D. P., Zhang, H. W., Wang, D. Q., Yang, Y., Zhao, J., Sun, Y. F., Bi, X. H., Wang, X. T., and Feng, J. L.: Nitrated polycyclic aromatic hydrocarbon pollution during the Shanghai World Expo 2010, Atmos. Environ., 89, 242–248, 2014.
Wei, X.-Y., Liu, M., Yang, J., Du, W.-N., Sun, X., Huang, Y.-P., Zhang, X., Khalil, S. K., Luo, D.-M., and Zhou, Y.-D.: Characterization of PM2.5-bound PAHs and carbonaceous aerosols during three-month severe haze episode in Shanghai, China: Chemical composition, source apportionment and long-range transportation, Atmos. Environ., 203, 1–9, 2019.
Wu, F., Yu, Y., Sun, J., Zhang, J., Wang, J., Tang, G., and Wang, Y.: Characteristics, source apportionment and reactivity of ambient volatile organic compounds at Dinghu Mountain in Guangdong Province, China, Sci. Total Environ., 548–549, 347–359, 2016.
Wu, R., Li, J., Hao, Y., Li, Y., Zeng, L., and Xie, S.: Evolution process and sources of ambient volatile organic compounds during a severe haze event in Beijing, China, Sci. Total Environ., 560–561, 62–72, https://doi.org/10.1016/j.scitotenv.2016.04.030, 2016.
Xiong, Y. and Du, K.: Source-resolved attribution of ground-level ozone formation potential from VOC emissions in Metropolitan Vancouver, BC, Sci. Total Environ., 721, 137698, https://doi.org/10.1016/j.scitotenv.2020.137698, 2020.
Xu, W., Liu, X., Liu, L., Dore, A. J., Tang, A., Lu, L., Wu, Q., Zhang, Y., Hao, T., Pan, Y., Chen, J., and Zhang, F.: Impact of emission controls on air quality in Beijing during APEC 2014: Implications from water-soluble ions and carbonaceous aerosol in PM2.5 and their precursors, Atmos. Environ., 210, 241–252, 2019.
Yadav, R., Sahu, L. K., Tripathi, N., Pal, D., Beig, G., and Jaaffrey, S. N. A.: Investigation of emission characteristics of NMVOCs over urban site of western India, Environ. Pollut., 252, 245–255, 2019.
Yan, Y., Peng, L., Li, R., Li, Y., Li, L., and Bai, H.: Concentration, ozone formation potential and source analysis of volatile organic compounds (VOCs) in a thermal power station centralized area: A study in Shuozhou, China, Environ. Pollut., 223, 295–304, 2017.
Yang, W., Zhang, Y., Wang, X., Li, S., Zhu, M., Yu, Q., Li, G., Huang, Z., Zhang, H., Wu, Z., Song, W., Tan, J., and Shao, M.: Volatile organic compounds at a rural site in Beijing: influence of temporary emission control and wintertime heating, Atmos. Chem. Phys., 18, 12663–12682, https://doi.org/10.5194/acp-18-12663-2018, 2018.
Yang, Y., Ji, D., Sun, J., Wang, Y., Yao, D., Zhao, S., Yu, X., Zeng, L., Zhang, R., Zhang, H., Wang, Y., and Wang, Y.: Ambient volatile organic compounds in a suburban site between Beijing and Tianjin: Concentration levels, source apportionment and health risk assessment, Sci. Total Environ., 695, 133889, https://doi.org/10.1016/j.scitotenv.2019.133889, 2019a.
Yenisoy-Karakas, S., Dorter, M., and Odabasi, M.: Intraday and interday variations of 69 volatile organic compounds (BVOCs and AVOCs) and their source profiles at a semi-urban site, Sci. Total Environ., 723, 138028, https://doi.org/10.1016/j.scitotenv.2020.138028, 2020.
Yu, S., Yin, S., Zhang, R., Wang, L., Su, F., Zhang, Y., and Yang, J.: Spatiotemporal characterization and regional contributions of O3 and NO2: An investigation of two years of monitoring data in Henan, China, J. Environ. Sci.-China, 90, 29–40, 2020.
Zeng, P., Lyu, X. P., Guo, H., Cheng, H. R., Jiang, F., Pan, W. Z., Wang, Z. W., Liang, S. W., and Hu, Y. Q.: Causes of ozone pollution in summer in Wuhan, Central China, Environ. Pollut., 241, 852–861, 2018.
Zhang, H., Chen, G., Hu, J., Chen, S., Wiedinmyer, C., Kleeman, M., and Ying, Q.: Evaluation of a seven-year air quality simulation using the Weather Research and Forecasting (WRF)/Community Multiscale Air Quality (CMAQ) models in the eastern United States, Sci. Total Environ., 473–474, 275–85, 2014.
Zhang, Y., Wang, X., Zhang, Z., Lu, S., Huang, Z., and Li, L.: Sources of C(2)-C(4) alkenes, the most important ozone nonmethane hydrocarbon precursors in the Pearl River Delta region, Sci. Total Environ., 502, 236–245, 2015.
Zhang, Y., Li, R., Fu, H., Zhou, D., and Chen, J.: Observation and analysis of atmospheric volatile organic compounds in a typical petrochemical area in Yangtze River Delta, China, J. Environ. Sci.-China, 71, 117312, https://doi.org/10.1016/j.jes.2018.05.027, 2018.
Zhang, Y., Sun, J., Zheng, P., Chen, T., Liu, Y., Han, G., Simpson, I. J., Wang, X., Blake, D. R., Li, Z., Yang, X., Qi, Y., Wang, Q., Wang, W., and Xue, L.: Observations of C1-C5 alkyl nitrates in the Yellow River Delta, northern China: Effects of biomass burning and oil field emissions, Sci. Total Environ., 656, 129–139, 2019.
Zhang, Y., Hong, Z., Chen, J., Xu, L., Hong, Y., Li, M., Hao, H., Chen, Y., Qiu, Y., Wu, X., Li, J.-R., Tong, L., and Xiao, H.: Impact of control measures and typhoon weather on characteristics and formation of PM2.5 during the 2016 G20 summit in China, Atmos. Environ., 224, 233–248, 2020.
Zheng, H., Kong, S., Xing, X., Mao, Y., Hu, T., Ding, Y., Li, G., Liu, D., Li, S., and Qi, S.: Monitoring of volatile organic compounds (VOCs) from an oil and gas station in northwest China for 1 year, Atmos. Chem. Phys., 18, 4567–4595, https://doi.org/10.5194/acp-18-4567-2018, 2018.
Zheng, H., Kong, S., Yan, Y., Chen, N., Yao, L., Liu, X., Wu, F., Cheng, Y., Niu, Z., Zheng, S., Zeng, X., Yan, Q., Wu, J., Zheng, M., Liu, D., Zhao, D., and Qi, S.: Compositions, sources and health risks of ambient volatile organic compounds (VOCs) at a petrochemical industrial park along the Yangtze River, Sci. Total Environ., 703, 135505, https://doi.org/10.1016/j.scitotenv.2019.135505, 2020.
Zou, Y., Deng, X. J., Zhu, D., Gong, D. C., Wang, H., Li, F., Tan, H. B., Deng, T., Mai, B. R., Liu, X. T., and Wang, B. G.: Characteristics of 1 year of observational data of VOCs, NOx and O3 at a suburban site in Guangzhou, China, Atmos. Chem. Phys., 15, 6625–6636, https://doi.org/10.5194/acp-15-6625-2015, 2015.
Zou, Y., Charlesworth, E., Yin, C. Q., Yan, X. L., Deng, X. J., and Li, F.: The weekday/weekend ozone differences induced by the emissions change during summer and autumn in Guangzhou, China, Atmos. Environ., 199, 114–126, 2019.