the Creative Commons Attribution 4.0 License.
the Creative Commons Attribution 4.0 License.
 | 11 Oct 2021
Mass spectral characterization of secondary organic aerosol from urban cooking and vehicular sources
Wenfei Zhu
Zirui Zhang
Hui Wang
Ying Yu
Zheng Chen
Ruizhe Shen
Rui Tan
Kai Song
Kefan Liu
Rongzhi Tang
Yi Liu
Shengrong Lou
Yuanju Li
Wenbin Zhang
Zhou Zhang
Shijin Shuai
Hongming Xu
Shuangde Li
Yunfa Chen
Francesco Canonaco
Andre S. H. Prévôt
In the present work, we conducted experiments of secondary organic aerosol (SOA) formation from urban cooking and vehicular sources to characterize the mass spectral features of primary organic aerosol (POA) and SOA using an high-resolution time-of-flight aerosol mass spectrometer (HR-ToF-AMS). Our results showed that the cooking styles have a greater impact on aged COA (cooking organic aerosol) mass spectra than oxidation conditions. However, the oxidation conditions affect the aged HOA (hydrocarbon-like OA) spectra more significantly than vehicle operating conditions. In our study, we use mass spectra similarity analysis and positive matrix factorization (PMF) analysis to establish the POA and SOA mass spectra of these two sources. These mass spectra are used as source constraints in a multilinear engine (ME-2) model to apportion the OA (organic aerosol) sources in the atmosphere. Compared with the traditional ambient PMF results, the improved ME-2 model can better quantify the contribution of POA and SOA from cooking and vehicular sources. Our work, for the first time, establishes the vehicle and cooking SOA source profiles, and can be further used in the OA source apportionment in the ambient atmosphere.
- Article
(2543 KB) - Full-text XML
-
Supplement
(8882 KB) - BibTeX
- EndNote


Organic aerosol (OA) is an important component of fine particulate matter and has significant environmental and health effects, especially in urban areas (Guo et al., 2012, 2014; Ying et al., 2020). Currently, real-time measurements of OA based on the aerosol mass spectrometer (AMS) have become an effective way to explore OA characteristics in the field campaigns and laboratory studies (Canagaratna et al., 2007; Ge et al., 2017; Hu et al., 2016a; Huang et al., 2011; Kim et al., 2017; Li et al., 2017; Sun et al., 2016; Zhang et al., 2011). Applying positive matrix factorization (PMF) and a multilinear engine (ME-2; Paatero, 1999) to analyze the high-resolution mass spectrometry fragments, OA can be further identified as primary organic aerosol (POA) and secondary organic aerosol (SOA). POA includes a kind of hydrocarbon-like OA (HOA), cooking OA (COA), and biomass burning OA (BBOA) and SOA includes low-oxygenated OA (LO-OOA) and more oxygenated OA (MO-OOA; Canonaco et al., 2013; Elser et al., 2016; Qin et al., 2017; Zhang et al., 2017a; Zhou et al., 2018). Many previous studies have found that HOA is mainly associated with vehicle-related emissions in the urban atmosphere (Hu et al., 2017; Xu et al., 2016; Zhang et al., 2017a). Hereinafter, HOA will be referred to as the abbreviation for organic aerosol emitted by urban vehicles. As lifestyle sources in urban areas, cooking and vehicular sources, that is COA and HOA, mostly determine ambient OA loadings. For example, primary cooking OA (COA) and vehicle exhaust OA (HOA) accounted for 10 %–35 % and 6 %–26 % of OA, respectively, in urban areas in China (He et al., 2011; Hu et al., 2017; Sun et al., 2010, 2014, 2018; Wang et al., 2016; Xu et al., 2016; Zhang et al., 2015).
Besides the contribution to POA, many studies have found that cooking and vehicular sources may also emit a large number of volatile organic compounds (VOCs; Gentner et al., 2009; Katragadda et al., 2010; Klein et al., 2016), semi-volatile organic compounds (SVOCs), and intermediate volatile organic compounds (IVOCs; ≥C13n-alkanes and fatty acids; Louvaris et al., 2017; Schauer et al., 2002; Tang et al., 2021), which may also play important roles in SOA formation (Wang et al., 2021; Yu et al., 2021). However, based on collocated AMS measurements and factor analysis results, the SOA formed by vehicle and cooking sources cannot be effectively resolved from the total SOA due to the lack of secondary mass spectral profiles. The POA mass spectral profiles based on AMS, including HOA (Collier et al., 2015), BBOA (Alfarra et al., 2007; He et al., 2010; Xu et al., 2020), and COA (He et al., 2010; Liu et al., 2017; Mohr et al., 2012; Xu et al., 2020), have been fully explored in laboratory studies and applied as constraint factors into the ME-2 model in the ambient air. Some studies have made it possible to quantify biogenic secondary aerosol products of a single precursor, such as isoprene oxidation products (IEPOX; Budisulistiorini et al., 2013; Hu et al., 2016b), and have been extended to the urban atmosphere to obtain an IEPOX-SOA factor via PMF analysis of OA spectra (Zhang et al., 2017b). Although several studies explored the mass spectral characteristics of SOA from cooking and vehicular sources, i.e., heated cooking oils, gasoline motors, and diesel engines (Kaltsonoudis et al., 2017; Kroll et al., 2012; Liu et al., 2018; Presto et al., 2014), the spectral profiles of cooking SOA under actual cooking conditions and vehicle SOA under different emission conditions are still uncertain. Besides, to date, studies that used ME-2 for a better anthropogenic SOA source apportionment by inputting their SOA spectra as constraints remain scarce. Therefore, it is urgent to characterize the mass spectra of SOA from abundant cooking and vehicular sources to acquire a better source apportionment of SOA.
In this study, cooking and vehicle experiments were carried out to investigate the variation in POA and SOA spectra profiles emitted from vehicle emissions under different running conditions and Chinese cooking emissions under different cooking styles using high-resolution time-of-flight AMS (HR-ToF-AMS). The mass spectral characterizations of POA and SOA from cooking and vehicle emissions were intercompared, and their changes in some indicated ionic fragments were elucidated. Besides, we verified the mass spectral profiles by applying POA and SOA profiles to ME-2 for source apportionment of OA in the winter observation with various primary emissions and the summer observation with high-oxidation conditions.
2.1 Simulation of POA emission and SOA formation from cooking and vehicular sources
For cooking, we prepared four dishes, including deep-fried chicken, shallow-fried tofu, stir-fried cabbage, and Kung Pao chicken. The total cooking time for each experiment ranged from 40 to 66 min, which was almost related to the features of each dish (Table S1 in the Supplement). Each dish was continuously prepared 8 times in parallel during the cooking process until the closed kitchen was full of fumes. The fumes produced by cooking were introduced through the pipeline from the kitchen into the Gothenburg Potential Aerosol Mass (Go:PAM) reactor (Li et al., 2019) in the laboratory after being diluted 8 times by a Dekati dilutor (eDiluter, Dekati Ltd., Finland). Heat insulation cotton was wrapped around the sampling pipelines to prevent fumes from condensing on the wall of the pipe. We considered the emissions sampled after Go:PAM without OH radical as primary emissions and those monitoring after Go:PAM with given OH radicals as secondary formation. The sampling time ranged from 58 to 90 min. In addition, the background blank groups and the dilution gas blank groups were separately completed using boiling water and dilution gas, according to the same steps as experimental groups. More information on the experimental setup of cooking simulations has been given in Zhang et al. (2020).
For vehicle, experiments were performed by using a gasoline direct engine (GDI) with a commercial China V gasoline fuel (emission – 998 cc; maximum power – 100 KW 6000 rpm; peak torque – 205 Nm 2000–3000 rpm). Vehicles operating under real-life conditions had a dynamic rotating speed-torque combination. For example, the combination of 1500 rpm rotating speed and 16 Nm torque and 2000 rpm rotating speed and 16 Nm torque for the engine in this study reflect realistic vehicle speeds of 20 and 40 km/h, respectively. A total of five running conditions covering different speeds and torques, including 1500 rpm_16 Nm, 1750 rpm_16 Nm, 2000 rpm_16 Nm, 2000 rpm_32 Nm, and 2000 rpm_40 Nm, were used to characterize their POA and SOA mass spectra in this study. Once the engine warmed up, it continued to work under one running condition. After the three-way catalytic system, the exhaust from the engine tailpipe was diluted 30 times by the same dilution system as for the cooking experiment. Then the diluted exhaust entered the GO:PAM through the stainless pipe wrapped in heat insulation cotton. For each running condition, five parallel experiments were conducted (Table S2). The sampling time was about 60 min for each experiment.
The Go:PAM reactor consists of quartz tube that is 100 cm long and 9.6 cm in diameter, as described in Watne et al. (2018). The OH radicals in the Go:PAM reactor are generated by the photolysis of ozone and the reaction in the presence of water vapor. We adjusted input ozone concentrations, ranging from ∼0 to ∼6.5 ppm (parts per million) and ∼0 to ∼4.0 ppm, to change the OH radicals in the Go:PAM for vehicle and cooking experiments, respectively. The temperature, relative humidity, and the sampling residence time in Go:PAM for vehicle and cooking experiments are documented in the Supplement (Table S3).
2.2 Instrumentation and data analysis
The design drawing on vehicle and cooking experiments is presented in Fig. S1. In total, two scanning mobility particle sizers (SMPSs; TSI Incorporation, USA) were set at the inlet and outlet of Go:PAM to correct the wall loss (Zhang et al., 2020). The size distribution and number concentration of particles were scanned every 2 (cooking) – 5 min (vehicle) before and after Go:PAM for the cooking and vehicle experiments, respectively. The mass concentrations of non-refractory submicron aerosol (NR-PM1) and high-resolution ions fragments of OA were recorded by HR-ToF-AMS (Aerodyne Research Inc., USA) and synchronized with an SMPS.
Before and after the two experiments, the ionization efficiency (IE) of HR-ToF-AMS was calibrated by applying 300 nm mono-dispersed ammonium nitrate particles synchronization with an SMPS. The collection efficiency (CE) was obtained by comparing the AMS and a synchronous SMPS real-time measurement of particle mass concentrations at the outlet of Go:PAM. Moreover, the real-time measurements of CO2 concentrations (model 410i, Thermo Fisher Scientific, USA) were used to correct the influence of CO2 on OA ion fragments (refer to Canagaratna et al., 2015). Other gas-phase measurements included carbon monoxide (CO, Thermo Fisher Scientific, model 48i-TL), NOx (Thermo Fisher Scientific, model 42i-TL), and SO2 (Thermo Fisher Scientific, model 42i-TL).
The mass concentration, size distribution, and the ion-speciated mass spectra of NR-PM1 species were analyzed using the HR-ToF-AMS standard data analysis software (SQUIRREL, version 1.57, and PIKA, version 1.16). The elemental compositions (O C, H C, N C, and OM OC) were estimated by the improved ambient updated method (Canagaratna et al., 2015). The OH exposure and equivalent photochemical age (EPA) were calculated by offline methods according to SO2 decay shown in Zhang et al. (2020), which were validated by a flow reactor exposure estimator using measured concentrations of reactive compounds such as VOCs, CO, and NOx (Peng et al., 2016). The OH exposure and photochemical age for all conditions in cooking and vehicle experiments were listed in Table S3.
2.3 OA source apportionment
The PMF model can describe the variability in a multivariate database as being a linear combination of static factor profiles and their corresponding time series (Huang et al., 2020; Wang et al., 2017; Zhu et al., 2018). In this study, we used the Igor-based PMF model with the PMF2.exe algorithm (Paatero and Hopke, 2003) and the PMF Evaluation Toolkit version 2.08D (Ulbrich et al., 2009) to split POA and SOA factors from cooking and vehicle aged OA. The PMF model was also used to identify the source of OA for the ambient atmosphere during the summer and winter observations of Shanghai, following the procedure presented in the literature (Hu et al., 2016a; Zhang et al., 2011), as described in Sect. 3.3. In contrast to an unconstrained PMF analysis, the ME-2 algorithm allows the user to add prior information (e.g., source profiles) into the model to constrain the matrix rotation and separated the mixed solution. In this study, we adopted the toolkit SoFi (Source Finder) with an a-value approach to perform organic HR-AMS data sets collected in Shanghai. The a-value can vary between 0 and 1, which is the extent to which the output profiles can vary from the model inputs. The a-value test was performed following the technical guidelines presented in Crippa et al. (2014). The reference mass spectral profiles that constrained in ME-2 analysis were derived from lab-based primary and secondary cooking and vehicular factors of this study. Details of the algorithm could refer to previous studies (Canonaco et al., 2013; Huang et al., 2020; Reyes-Villegas et al., 2016).
2.4 Mass spectra similarity analysis
In this study, the angle θ was used to evaluate the correlation between the two AMS mass spectra features. The angle θ between the two AMS mass spectra (MSa and MSb) is given by the following:
The θ angle between two mass spectra is 0–5, 5–10, 10–15, 15–30, and >30, which means excellent consistency, good consistency, many similarities, limited similarities, and poor consistency, respectively (Kaltsonoudis et al., 2017; Kostenidou et al., 2009).
3.1 Mass spectra of POA and aged OA from the cooking and vehicular sources
Figure 1a shows the mass spectra of aged HOA under different vehicle running conditions when EPA was 0.6 d. The mass spectra of aged HOA emission from different vehicle running conditions under other various oxidation degrees are included in Fig. S2. All the aged HOA spectral profiles from different vehicle running conditions showed a similar pattern, and the θ angles among the mass spectra of aged HOA were less than 10∘ at EPA 0.6 d (Table 1), suggesting little difference between the mass spectra. The mass spectra of aged HOA at 0.6 d were dominated by the ion series of CnH ( 29, 43, 57, 71, 85) and CnH ( 41, 55, 69, 83), resulting from fewer oxidized components such as saturated alkanes (alkenes). As the highest proportion of ion fragments, 43 and 29 consisted of oxygen-containing ions like CHO+ and C2H3O+, respectively, whose fractions were much larger than the hydrocarbon-like ion fragments at the same mass integers. Moreover, there were also abundant tracer ion fragments for SOA ( 28 and 44).

Figure 1(a) The mass spectra of aged HOA emission from different vehicle running conditions at EPA 0.6 d. (b) The mass spectra of aged COA from four Chinese dishes at EPA 0.7 d. In total, five running conditions cover different speeds and torques, including 1500 rpm_16 Nm, 1750 rpm_16 Nm, 2000 rpm_16 Nm, 2000 rpm_32 Nm, and 2000 rpm_40 Nm. The four dishes include deep-fried chicken, shallow-fried tofu, stir-fried cabbage, and Kung Pao chicken.
The mass spectra of aged COA at 0.7 d of EPA are presented in Fig. 1b. Detailed mass spectra of aged COA under other various oxidation degrees are included in Fig. S3. The similarity of aged COA among different types of cooking was greater than that of aged HOA among different running conditions when the EPA was at the same level. Except for the θ angles of deep-fried chicken vs. stir-fried cabbage (21∘) and deep-fried chicken vs. shallow-fried tofu (19∘), the θ angles among other aged COA at EPA 0.7 d exhibited good agreement (θ<15∘) in the mass spectra (Table 1). The mass spectra of cooking were dominated by the similar ion series to those of vehicles, which were mostly 28, 29, 41, 43, 44, 55, 57, 67, and 69. However, the major mass spectral differences between cooking and vehicles were the abundance of 41 and the ratio of oxygen-containing ions to hydrocarbon ions (CxHyO CxH). The four Chinese dishes had prominent peaks at 41, 43, and 55 (generated from C3H and C3H; C4H), which was qualitatively consistent with mass spectra of primary COA in other studies (Xu et al., 2020). As described by He et al. (2010), the most abundant ion fragments at 41 and 55 from primary Chinese cooking emissions associated with frying result from unsaturated fatty acids.
Table 1The θ angles among the mass spectra of (a) aged HOA at EPA 0.6 d and (b) aged COA at EPA 0.7 d.
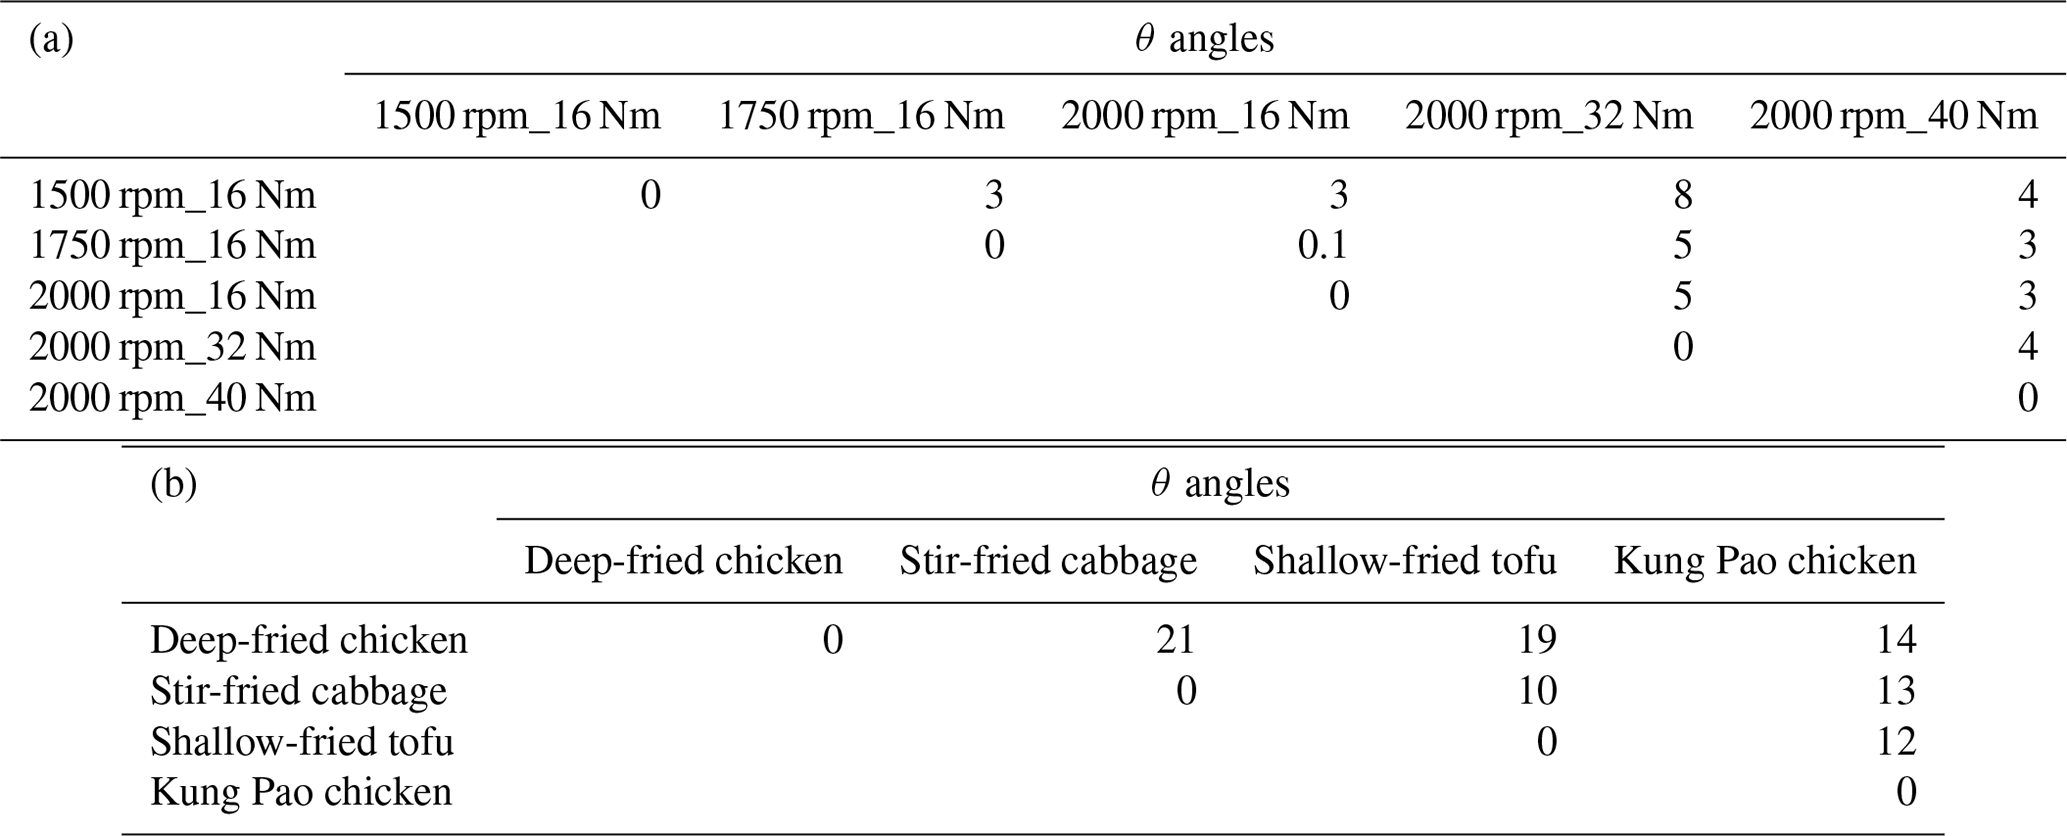
Figure 2a shows the mass spectra of aged HOA oxidation at different OH exposures under the same vehicle running condition (2000 rpm, 16 Nm). The changes in the mass spectra of aged HOA under different conditions are provided in Fig. S4. It is worth noting that the source characteristics of vehicle POA were uncertain due to its low concentration emitted from the engine in this study (Table S4). A related study has found that the POA factor from vehicle emissions is similar to the HOA factor derived from environmental data sets (Presto et al., 2014). Therefore, we used the average HOA spectrum derived from unconstrained PMF analysis based on the ambient observations of Shanghai, Beijing, Dezhou, and Shenzhen in China as an alternative to the mass spectrum of vehicle POA, as shown in Figs. 2a and S4. Detailed observations of Shanghai, Dezhou, and Shenzhen can be found in Zhu et al. (2021a). The observations in Beijing have been given in Hu et al. (2017). The HOA spectrum was similar to that reported in Ng et al. (2011), which has been widely used as traffic emission profiles. As the oxidation degree increased, the ion fragments varied and, similarly, hydrocarbon-like ion fragments decreased. The mass spectra at 2.9 and 4.1 d had very similar patterns, with the most abundant signals at 28 and 44, respectively (Figs. 2 and S4), which showed good consistency with the mass spectra of MO-OOA resolved from ambient data sets () compared with MO-OOA obtained during the spring observations in Ng et al. (2011) and Zhu et al. (2021b). When EPA was 1.7 d, there were different mass spectra patterns, with dominant signals at 28 and 44, yet it contained a large signal at 43, and many similarities with the spectra of the ambient LO-OOA (Figs. 2 and S4; Hu et al., 2017; Zhu et al., 2021b). Oxidation degrees greatly affected the similarity of mass spectra between POA and those of aged HOA. The mass spectra profile of HOA_ambient displayed poor agreement (θ>30∘) with all aged HOA spectra profiles (Table S7). Moreover, the mass spectra under the low-oxidation degree (EPA was 0.6 d) was also poorly correlated with those mass spectra under the high-oxidation degree (EPA were 2.9 and 4.1 d; Table S7).
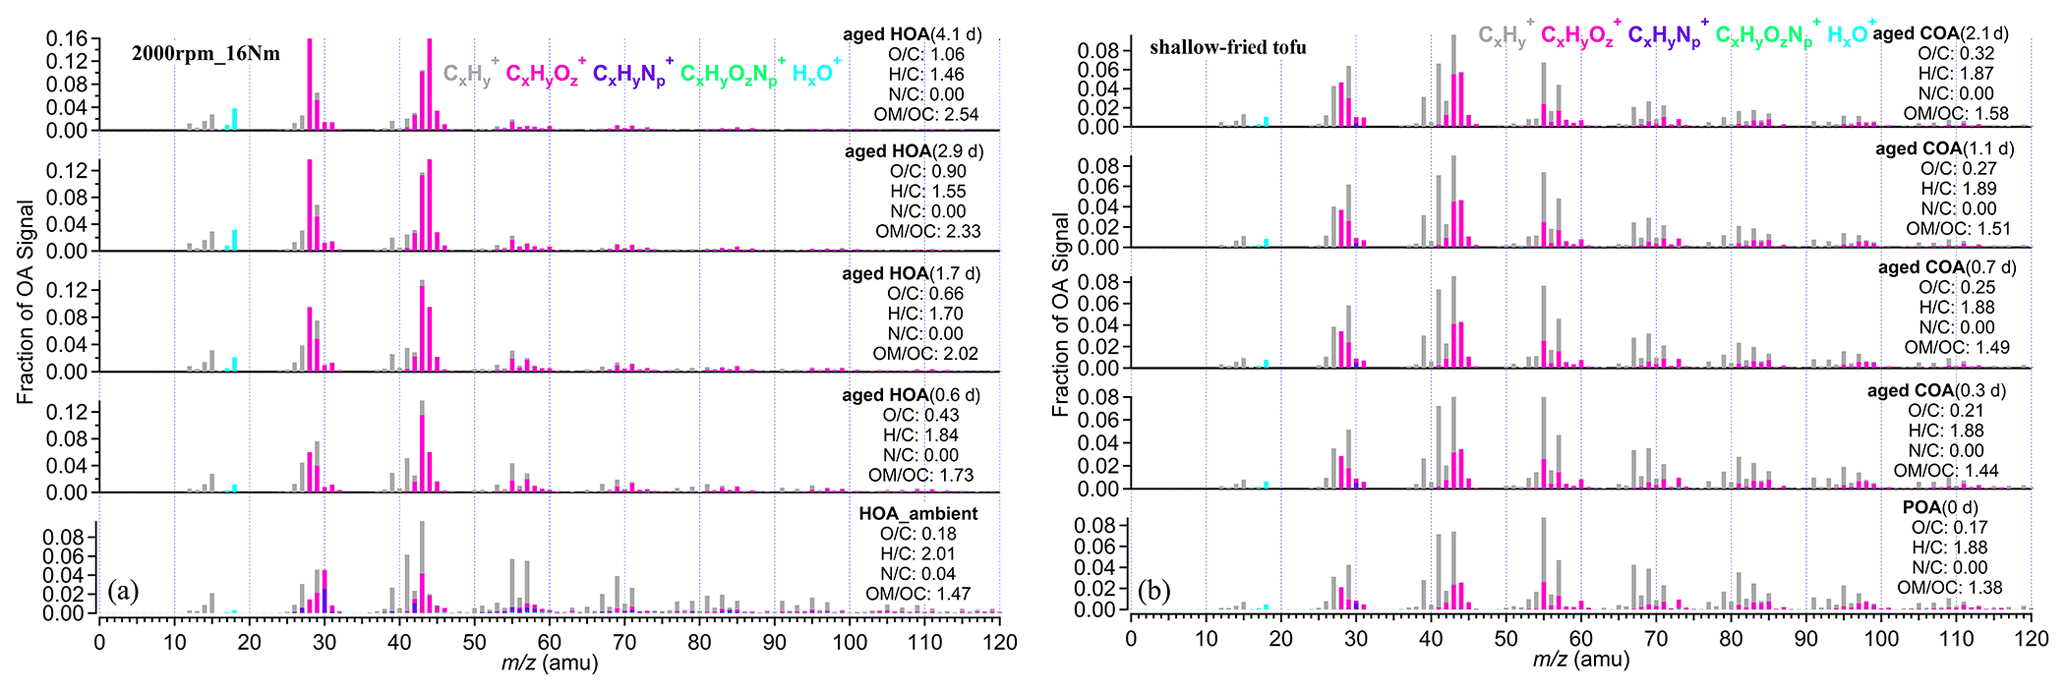
Figure 2(a) The mass spectra of HOA and aged HOA oxidation under four different OH exposures at the same running condition (2000 rpm; 16 Nm). (b) The mass spectra of primary COA and aged COA oxidation of different OH exposure for shallow-fried tofu. The EPA was obtained from offline methods according to SO2 decay shown in Table S3. The elemental compositions were estimated by the improved ambient updated method (Canagaratna et al., 2015).
The mass spectra of primary COA and aged COA showed great inter-correlations (θ<15∘), which were smaller than that of vehicle OA (Table S8). The spectra of aged COA derived herein displayed good consistency with those from cooking oils (Liu et al., 2018; Figs. 2b and S5). It should be noted that the fractions of 28 and 44 signals in aged COA were lower than those of aged HOA at the similar EPA. In addition, the aged COA had more hydrocarbon-like ions at the same mass integers than aged HOA.
All of the above results imply that oxidation condition drives the variabilities in mass spectra of the vehicle OA. In contrast, cooking styles instead of oxidation conditions significantly affected the mass spectra of cooking OA. Here we concluded some possible explanations for these results. On one hand, under the same oxidation conditions and different emission conditions, the similarity among the mass spectra of vehicles was larger than that of cooking, which may be related to their precursors. Some studies have shown that the species and the proportion of gaseous organic matter emitted by different dishes are quite different (Wang et al., 2018). As described in the literature, alkanes and oxygenated volatile organic compounds (O-VOCs) contributed to over 97 % of the total VOCs for fried food, and O-VOCs were the dominant contributors for Sichuan and Hunan cuisine where stir-frying is common (Wang et al., 2018). Different gaseous precursors cause distinctions in the particle-phase SOA formation, which is reflected in the variations in AMS ion fragments between the four dishes in our study. Compared to cooking, the precursors from vehicles are mainly hydrocarbons, and the difference in emissions under different running conditions is inapparent (Robinson et al., 2007). On the other hand, under the same emission conditions and different oxidation conditions, the similarity among the mass spectra of cooking sources is larger than that of vehicle sources, likely due to the oxidation pathway of precursors. As mentioned above, O-VOCs are important precursors of cooking sources, and their oxidation mechanisms are mostly alcohol/peroxide substitution process. This conclusion was proved by a Van Krevelen diagram, showing that the cooking data gather around the slope of approximately −0.1 (Zhang et al., 2020), in agreement with that of heated oils OA (Liu et al., 2018). However, for vehicles, with the increase in oxidation degrees, the reaction pathways of hydrocarbon precursors varied diversely. In the Van Krevelen space, the vehicle data fell along a line with a slope of −0.5 (Fig. S6), indicating oxidation processes involving the addition of both carboxylic acid and alcohol or peroxide functional groups without fragmentation and/or the addition of carboxylic acid functional groups with fragmentation.
3.2 Identification of the cooking and vehicular sources SOA mass spectra
Although the f44 (proportion of 44 in OA) of aged COA raised from 0.03 to 0.08 with oxidation increasing (Figs. 2b and S5), the high abundance of 41, 55, and 57 in aged COA mass spectra for the four dishes may be a sign that aged COA identified in this study is a mixture of POA and SOA. PMF analysis was performed on the high-resolution mass spectra to split SOA and POA factors from integrated primary COA and aged COA under each dish. Similarly, the same PMF procedure was also applied for vehicle aged data sets for each running condition. The choice of the PMF solution can be found in the Supplement (Figs. S7–S10 and Tables S9–S10; taken from stir-fried cabbage for cooking and 2000 rpm_32 Nm for vehicles as an example).
Some ions like 41, 55, 57, 43, 28, and 44 are typically used as tracers of OOA, COA, HOA, LO-OOA, and MO-OOA. Figure 3 shows the high-resolution mass spectra of POA and SOA from four Chinese dishes and five vehicle running conditions. The cooking PMF POA of the four Chinese dishes all showed obvious hydrocarbon-like signals at 41, 43, 55, 57, 67, and 69, with ion fragments of C3H, C3H, C4H, C4H, C5H, and C5H, respectively. The fraction of 41 in cooking POA ranged from 0.051 to 0.069. The prominent fractions of 43 (f43=0.068–0.083), 55 (f55=0.064–0.084), 57 (f57=0.041–0.097), 67 (f67=0.021–0.40), and 69 (f69=0.034–0.049) were observed (Table S10). For mass spectra of cooking PMF SOA, the oxidized ion fragments had higher signals than those of hydrocarbon-like ion fragments. The dominant signals existed at 28 (f28=0.045–0.068), 29 (f29=0.048–0.080), 41 (f41=0.050–0.068), 43 (f43=0.087–0.103), 44 (f44=0.058–0.080), and 55 (f55=0.050–0.064; Table S11).
Different from the cooking, two vehicle PMF SOA factors were derived from aged HOA, rather than integrated primary HOA and aged HOA data sets due to the low primary HOA emission (Table S4), as described in Sect. 3.1. Unfortunately, the vehicle PMF POA factor cannot be separated from aged HOA due to higher OH exposure. According to different O C ratios, they were considered to be low-oxidized vehicle SOA (LO-SOA) and more oxidized vehicle SOA (MO-SOA). As indicated in Fig. 3 and Table S13, the prominent 28 (average f28=0.045), 41 (average f41=0.046), 43 (average f43=0.158), 44 (average f44=0.054), 55 (average f55=0.039), and 57 (average f57=0.027) of vehicle PMF LO-SOA were comparable with those of cooking PMF SOA. The fraction of 43 of vehicle PMF LO-SOA was higher than that in cooking SOA by a factor of 2, which may be caused by the inability to separate the vehicle PMF POA factor in the PMF analysis. The abundant 28 and 44 (mainly generated from CO) are widely used as the ambient MO-OOA markers (Sun et al., 2018; Xu et al., 2017). We observed high factions of 28 (f28=0.110–0.214) and 44 (f44=0.121–0.224) in vehicle PMF MO-SOA (Table S13) and high O C ratios (0.88–1.33), which were much higher than those of vehicle PMF LO-SOA (O C =0.37–0.53) and cooking SOA (O C =0.29–0.41).
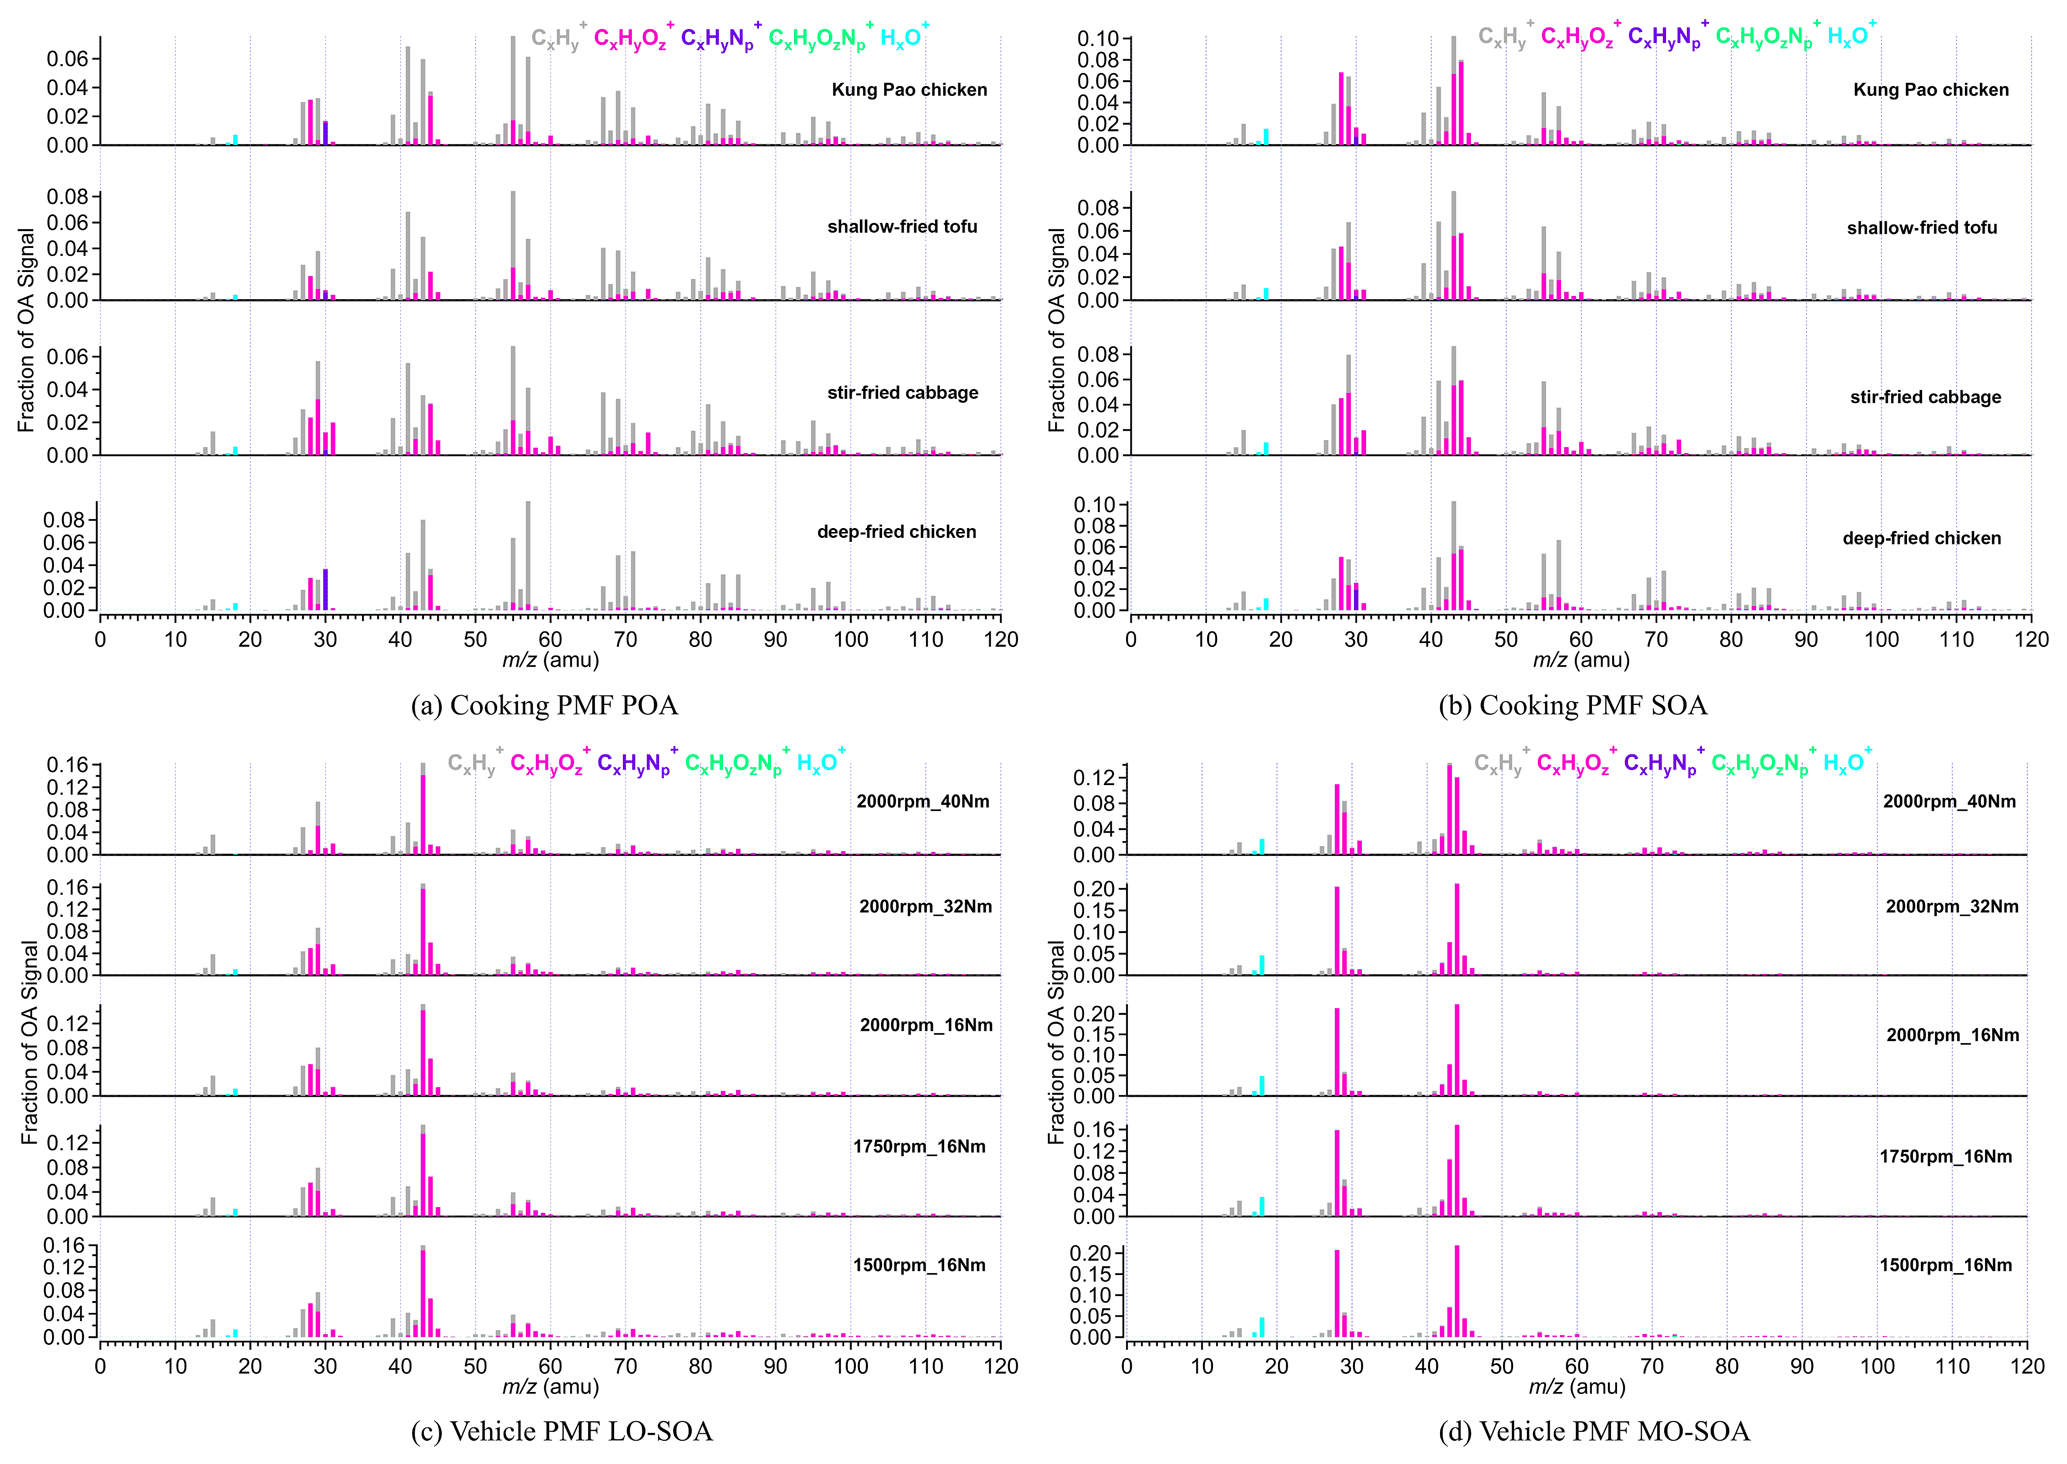
Figure 3The mass spectra of PMF POA and SOA from vehicle and cooking. PMF analysis was performed on the high-resolution mass spectra to split two factors (cooking POA and SOA) from aged COA and two SOA factors (vehicle LO-SOA and MO-SOA) from aged HOA, respectively.
Similarly, for the resolved SOA factors, the correlation of mass spectra among cooking groups under different cooking methods (θ=8–21∘) was worse than that of vehicle groups (vehicle PMF LO-SOA; θ=3–19∘) under different running conditions (Tables S15 and S17). The mass spectra of the PMF POA factors for deep-fried chicken exhibited poor agreement with those of stir-fried cabbage, Kung Pao chicken, and shallow-fried tofu (Table S16). In addition, we also found that the θ angles between vehicle PMF LO-SOA and vehicle PMF MO-SOA under five GDI running conditions ranged from 36 to 50∘ (Fig. S11), indicating that the mass spectra profiles of vehicle PMF LO-SOA have a poor consistency with those of vehicle PMF MO-SOA, consistent with the changes in the mass spectra characteristics of vehicles, under the same emission conditions and different oxidation conditions. Our results suggest that it is necessary to consider the cooking styles when constraining cooking and atmospheric oxidation conditions when constraining vehicle factors.
3.3 Application of established POA and SOA profile in ambient OA source apportionment
The POA and SOA of cooking as the primary and secondary spectrum constraints for ME-2 were obtained by averaging the high-resolution mass spectra data sets of the four dishes, which were identified from aged COA using the PMF model. Similarly, combining different GDI running conditions, the averaged vehicle LO-SOA and vehicle MO-SOA, which were resolved based on aged HOA by using the PMF model, were used as the input mass spectra profiles of vehicles for ME-2. The mass spectral profiles for cooking and vehicle as constraints in the ME-2 model are shown in Fig. S12.
The θ angles between the mass spectral profiles from urban cooking and vehicular sources and ambient PMF-resolved factors were calculated and summarized in Fig. 4 and Table S19. The AMS mass spectra of ambient factors were obtained and averaged in Shanghai, Dezhou, Beijing, and Shenzhen in China (Hu et al., 2017; Zhu et al., 2021a). The θ angles among ambient COA, HOA, LO-OOA, and MO-OOA factors, the cooking POA and SOA, and the vehicle LO-SOA and MO-SOA ranged from 18 to 52∘ (Fig. 4), suggesting that the cooking POA, cooking SOA, and the vehicle LO-SOA and MO-SOA can be used as source constraints for ME-2 in ambient air.
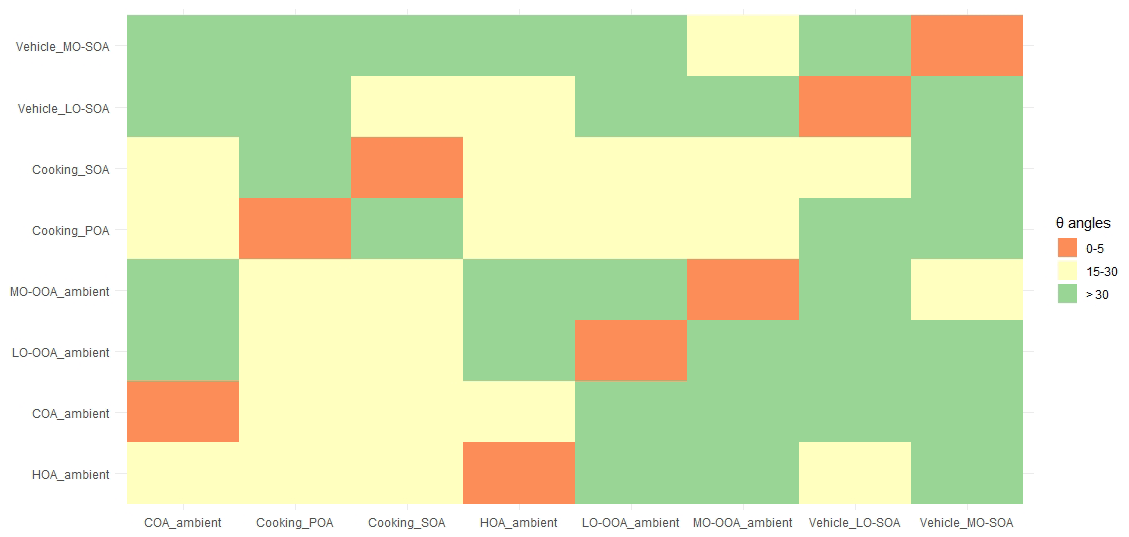
Figure 4The θ angles between ambient COA, HOA, LO-OOA, and MO-OOA factors, the cooking PMF, POA, and SOA, and the vehicle LO-SOA and MO-SOA. The θ angle between two mass spectra is 0–5, 5–10, 10–15, and 15–30, and >30 indicates excellent consistency, good consistency, many similarities, limited similarities, and poor consistency, respectively. The ambient COA, HOA, LO-OOA, and MO-OOA factors were averages of the resolved factors which were found in Shanghai, Dezhou, Beijing, and Shenzhen data sets (Hu et al., 2017; Zhu et al., 2021a).
Considering the actual oxidation conditions, that is the concentration of OH radicals, the lacking vehicle POA due to its low emission (Table S4), and the SOA spectra constraining reasonably, the cooking POA, cooking SOA, vehicle LO-SOA, and ambient HOA (instead of vehicle POA; derived from Beijing, Shenzhen, Dezhou, Shanghai ambient measurements) were finally selected as the input source spectra of ME-2. We further demonstrated the feasibility of input primary and secondary mass spectra for OA source apportionment in two field campaigns at the urban site of Shanghai in summer and winter. The ambient measurements in Shanghai were taken in situ at the same location as Zhu et al. (2021a), i.e., the Shanghai Academy of Environmental Sciences (31.10∘ N, 121.25∘ E), a typical urban site in the Yangtze River Delta region from 23 August to 5 September 2016 and from 28 November 2016 to 12 December 2017, with HR-ToF-AMS at 4 min time resolution. For the tracers described below, the mass concentration of chemical compositions, e.g., sulfate, nitrate, and ion-speciated fragment, were detected by HR-ToF-AMS, as shown in Zhu et al. (2021b). The detail measurements of black carbon (BC) and nitrogen oxides (NOx) can also be found in Zhu et al. (2021b). In general, the ME-2 source analysis was performed by constraining two primary OA factors (cooking POA and HOA) and two secondary OA factors (cooking SOA and vehicle LO-SOA) with the fixed a-value of 0.1 for HOA, 0.2 for cooking POA, and 0.4 for vehicle LO-SOA and cooking SOA, based on the same ambient OA data sets of the summer and winter observations in Shanghai. In ME-2 solutions from one to seven factors, we found the solution of six factors (i.e., COA, HOA, other POA, cooking SOA, and vehicle LO-SOA) was most interpretable for the wintertime observations. For the five-factor solution, in addition to the constrained four factors, factor five appeared to be mixed primary and secondary features. However, other POA split into two factors, with similar profiles in a seven-factor solution (Fig. S13). Source apportionment on OA data sets by using the unconstrained PMF model was also examined to compare with ME-2 analysis. The choice for the optimal solution for the PMF model was presented in the supporting information (Figs. S14–S16 and Tables S20–S21). Ambient PMF-resolved OA factors included POA factors (i.e., HOA and COA), and SOA factors (i.e., OOA) in the winter observations in Shanghai, on average accounting for 27 %, 35 %, and 38 % of OA mass. OOA resolved by the PMF model did not separate into two types of OOAs including LO-OOA and MO-OOA. Besides, we observed that HOA and COA profiles (provided via PMF during the wintertime) contained high signals at the biomass burning tracer ion ( 73) and 91 (polycyclic aromatic hydrocarbon (PAH)-related ), indicating that the mixing among HOA, COA, and other source emissions (e.g., BBOA; Fig. 5).
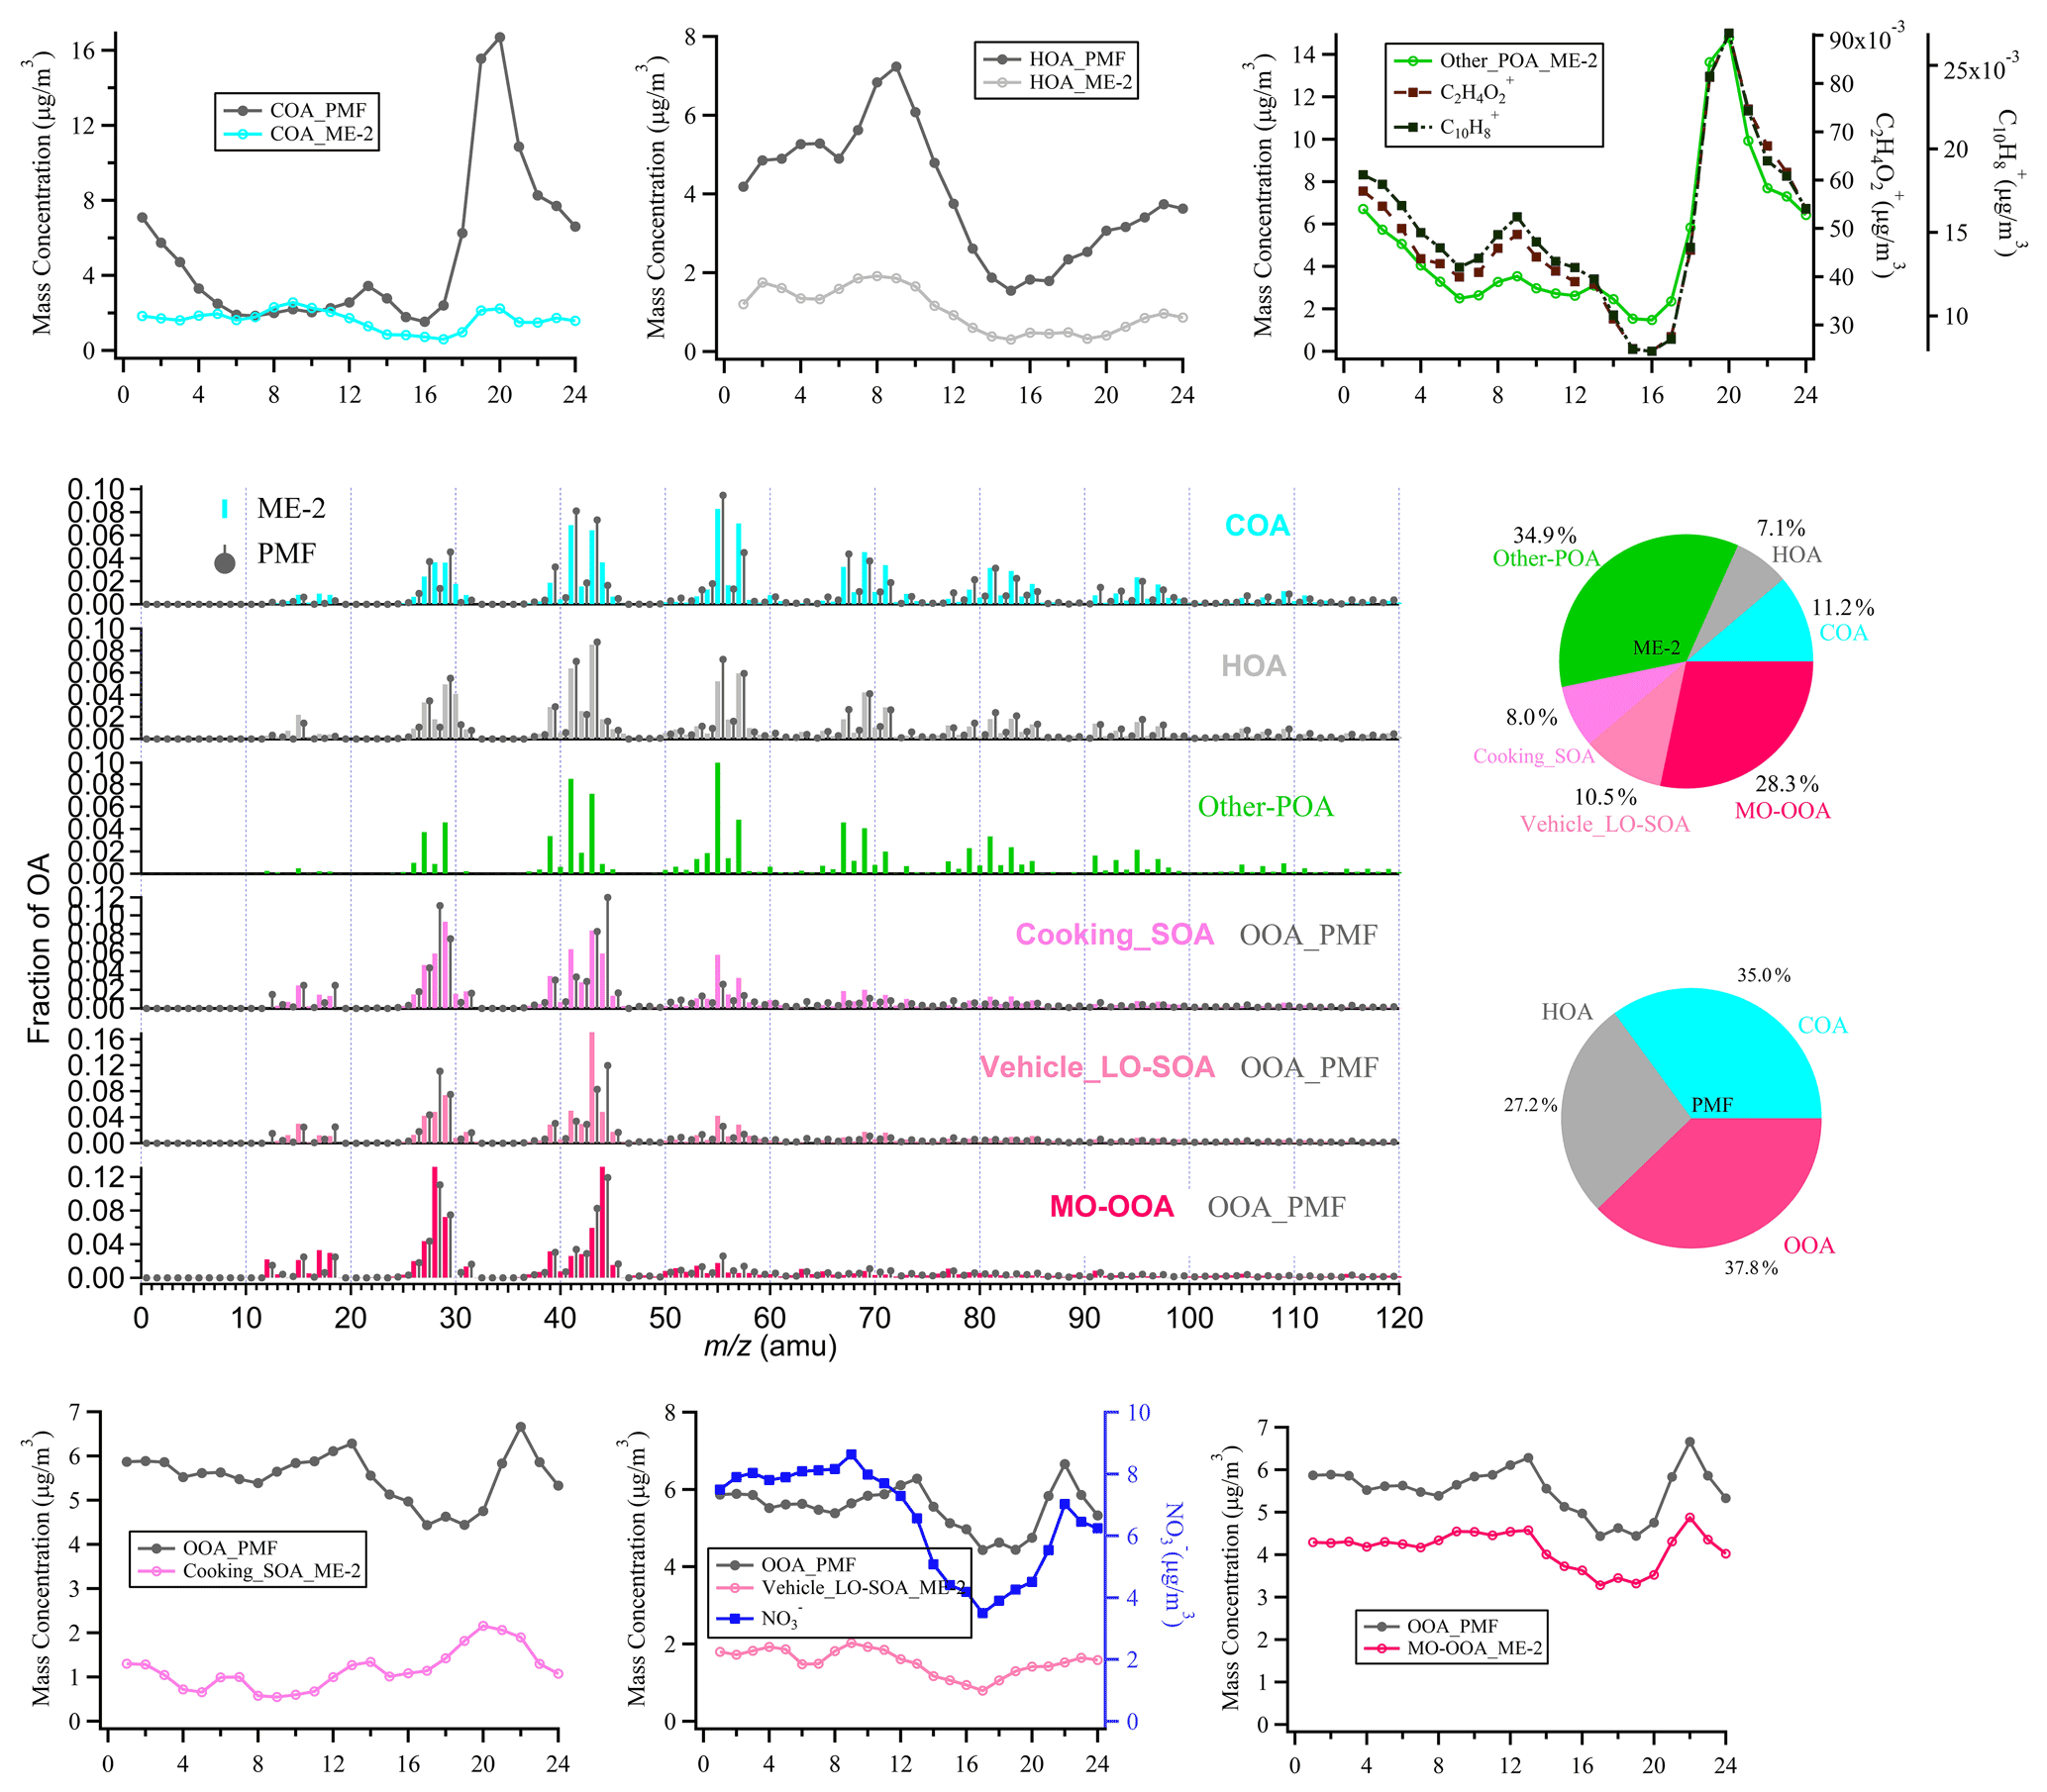
Figure 5The comparison of the mass spectra, the diurnal variation, and fraction between ME-2 and PMF-resolved factors during the wintertime in Shanghai. The black lines in the spectra and diurnal pattern are the results of PMF analysis of the actual atmosphere in Shanghai winter. The others correspond to the ME-2 source analysis results by using two primary OA factors (the cooking POA and ambient HOA) and two secondary OA factors (the cooking SOA and the vehicle LO-SOA) as constraints, based on the same ambient OA data sets as the PMF model during the winter observations of Shanghai. Note that, in the mass spectra and daily patterns, the OOA_PMF factors which compared with vehicle LO-SOA and cooking SOA, respectively, are the same rather as the two resolved factors.
As shown in Fig. 5, compared with PMF results, the proportions of HOA (7 %) and COA (11 %) obtained by source apportionment with ME-2 have significantly decreased to the expected value during the winter observation (Huang et al., 2020; Xu et al., 2020). As expected, other POA contributions were identified in the highly polluted season and correlated well with C2H4O and C10H, which are well-known fragments from biomass burning and coal combustion emissions (Figs. 5, S17, and Table S22; Alfarra et al., 2007; Duan et al., 2020; Hu et al., 2016a; Lee et al., 2010). The diurnal patterns of HOA_PMF were consistent with HOA_ME-2 during the winter observation, presenting low concentrations during the daytime and high concentrations at nighttime, likely due to the combined influence of boundary layer height and emissions from diesel vehicles during the nighttime. The temporal variation in 2 HOA factors showed a high correlation with NOx (Pearson's r>0.7), suggesting 2 HOA factors are associated with vehicle emissions. Some variabilities existed between the diurnal cycle of COA_PMF and COA_ME-2. However, COA_ME-2 correlated better with C6H10O+ than COA_PMF, which was considered a fragment tracer mainly from cooking emissions (Ge et al., 2012; Hu et al., 2016a; Sun et al., 2011; Xu et al., 2016). For SOA factors, the sum of cooking SOA and vehicle LO-SOA had a high correlation with nitrate (Pearson's r=0.84; Fig. S17 and Table S22) and fragments of low-oxidizing substances (C2H3O+; Pearson's r=0.95). In addition, we noticed that the vehicle SOA analyzed by ME-2 exhibited consistency with the diurnal variation in nitrate, especially as the reasonable morning peak (∼09:00 Beijing time – BJT) was retained, implying that vehicle SOA is well separated by using ME-2 in winter. MO-OOA resolved via ME-2 was characterized by a prominent signal at 28 and 44, consistent with those in OOA identified by using PMF and in other studies (Duan et al., 2020; Kim et al., 2017). Meanwhile, there was a strong correlation between the MO-OOA time series and sulfate (Pearson's r=0.93), which was representative of regional aging species. Unfortunately, the SOA factor corresponding to other POA (likely biomass burning OA) has not been resolved. Some studies have found that OA emitted by biomass burning will be rapidly oxidized in the ambient atmosphere, and the BBOA in the fresh plume is mostly aged OA (Zhou et al., 2017). When the aged biomass burning OA is further oxidized, it is difficult to identify the biomass burning SOA from mixed within OOA without constraining its SOA factor. Overall, ME-2 source analysis with the input of four source spectra profiles significantly improved the OA source apportionment during the wintertime. In comparing the ME-2 analysis results with only two POA factors constraining to that of the four factors being constrained, the diurnal variations in HOA and COA obtained by constraining two primary sources were more consistent with those of the ME-2-constrained four factors than PMF. However, OOA and POA were weakly separated, and the diurnal patterns of OOA were correlated with the case for the peak of other POA during the evening (20:00–21:00; Figs. S18–S19). These phenomena imply that the SOA factor constraint can be more environmentally meaningful factors to a certain extent.
For the source apportionment in summer with high-oxidation conditions (Fig. S20), the fraction of COA reduced from 21 % (PMF result) to 12 % (ME-2 result). Moreover, the diurnal patterns of ME-2 SOA factors are more reasonable than PMF SOA factors. For example, the MO-OOA obtained based on ME-2 analysis was in good agreement with the diurnal variation in Ox in summer. Pearson's r between MO-OOA_ME-2 and CO ( 44), a marker of SOA, was 0.95, higher than that of MO-OOA_PMF (0.79), which better reflects the characteristics of the MO-OOA factor in ME-2 (Fig. S21 and Table S23). In general, the accurate source apportionment results have significantly indicated that the source profiles of the primary and secondary OA of cooking and vehicles obtained in our study can be used as constraints for the source apportionment of OA with ME-2 in various primary emissions or high-oxidation conditions.
POA emissions and SOA formation in the Go:PAM reactor from urban cooking and vehicular sources were explored. The aged COA had higher hydrocarbon ions than aged HOA in mass spectra. The spectra profiles of urban cooking and vehicular sources derived from the lab simulation were performed as constraints in ME-2 model. The OA source apportionment, using ME-2 compared with unconstrained PMF based on the HR OA data sets in Shanghai validated the reasonableness of the primary and secondary source profiles of cooking and vehicles. It is noted that the vehicle experiments were solely conducted under a single engine with gasoline, and the cooking experiment only related to limited cooking styles. The variations in VOCs in diesel and gasoline vehicle emissions may lead to differences in the SOA characteristics (Wang et al., 2020). The POA and gas-phase precursor emitted from another cooking style – meat charbroiling – can also form a large amount of SOA after photochemical oxidation (Kaltsonoudis et al., 2017). More work needs to be done to explore the POA and SOA mass spectrometric characteristics of emissions from vehicles and cooking sources. In addition, SOA mass spectra were split from aged COA and aged HOA by using the PMF model and, therefore, provided limited information on dynamic SOA mass spectra; we suggested that further studies control the oxidation conditions to obtain a set of dynamic pure SOA spectral profile. In particular, the absence of primary HOA due to low emissions of engine and the inability to separate vehicle PMF POA from aged HOA in the PMF analysis were major limitations of this study. In addition to obtaining pure vehicle POA through source experiments, further work can apply the ME-2 model for constraining pure SOA profiles from experimental data sets to obtain the vehicle POA profiles. Constraining many SOA factors could over-constrain the ME-2 runs, which leads to factor mixing and reduces the number of factors. Therefore, SOA source spectra can only be appropriately and reasonably limited in the ME-2 model. Besides, measurements of accurate tracers for all factors that resolved by PMF or the ME-2 model should be conducted in future work to improve source apportionment verification. For example, we had to combine vehicle LO-SOA and cooking SOA as LO-OOA due to the lack of the measurement tracers for vehicle and cooking SOA factors, and then we analyzed the time series correlation of LO-OOA with nitrate and other tracer ions. Due to the limitation of Go:PAM, the dilution and high concentration of OH radicals without other inorganic aerosol seeds were adopted to measure and simulate the atmospheric aging of aerosols. Thus, the possible atmospheric transformations and the reaction pathway are affected. In the future, it is still necessary to conduct further research, for instance, by using a quasi-atmospheric aerosol evolution study (QUALITY) chamber (Guo et al., 2020) to study the SOA formation under different actual oxidation conditions like high/low NOx and so forth. Moreover, ambient data sets obtained from different sites and seasons need to be analyzed to validate the application of POA and SOA profiles of cooking and vehicles in this study, noting the selection of a loose constraint via a value in SOA factors due to their high variability. Our research found that SOA from the urban cooking and vehicular sources contributed 19 % and 35 % of OA in the wintertime and summertime of Shanghai, implying the need to develop control measures to reduce emissions from cooking and vehicular sources in the future.
| Abbreviations | Description |
| OA | Organic aerosol |
| POA | Primary organic aerosol |
| SOA | Secondary organic aerosol |
| HOA | Hydrocarbon-like organic aerosol; associated with vehicle-related emissions in urban areas |
| COA | Cooking organic aerosol |
| LO-OOA | Low-oxygenated organic aerosol |
| MO-OOA | More oxygenated organic aerosol |
| PMF | Positive matrix factorization |
| ME-2 | A multilinear engine |
| HR-ToF-AMS | High-resolution time-of-flight aerosol mass spectrometer |
| SMPS | Scanning mobility particle sizer |
| Go:PAM | Gothenburg Potential Aerosol Mass reactor |
| VOCs | volatile organic compounds |
| SVOCs | semi-volatile organic compounds |
| IVOCs | intermediate volatile organic compounds |
| O-VOCs | oxygenated volatile organic compounds |
| fraction of 28, 29, 41, 43 … in total organic aerosol | |
| Aged HOAs | organic aerosols oxidized by the Potential Aerosol Mass reactor in vehicle experiments |
| Aged COAs | Organic aerosols oxidized by the Potential Aerosol Mass reactor in cooking experiments |
| LO-SOA | Low-oxidized vehicle secondary organic aerosol |
| MO-SOA | More oxidized vehicle secondary organic aerosol |
The data provided in this paper can be obtained from the author upon request (songguo@pku.edu.cn).
The Supplement contains the following information: a schematic depiction of the simulation and measurement system (Fig. S1); details of the mass spectra of aged HOA and aged COA (Figs. S2–S5; Tables S5–S8); a van Krevelen diagram of POA, aged COA, and aged HOA (Fig. S6); the choice for the PMF and ME-2 analysis (Figs. S7–S10; Tables S9–S10; Figs. S13–S14; Tables S20–S21); ME-2 source analysis during the summer observation in Shanghai (Fig. S19); the time series correlations of factors with external tracers (Figs. S17–S18, S21; Tables S22–S23); experimental parameters (Tables S1–S3); and the mass spectra similarity analysis between mass spectra of ambient factor and mass spectral profiles for vehicle and cooking (Tables S15–S19; Fig. S11). The supplement related to this article is available online at: https://doi.org/10.5194/acp-21-15065-2021-supplement.
WFZ, ZRZ, HW, YY, ZC, RZS, RT, KS, KFL, RZT, YL, YJL, WBZ, and ZZ conducted the experiments. WFZ, ZRZ, SG, and MH analyzed the data. SRL, SJS, HMX, SDL, YFC, FC, and ASHP reviewed and commented on the paper. WFZ and SG wrote the paper.
The authors declare that they have no conflict of interest.
Publisher’s note: Copernicus Publications remains neutral with regard to jurisdictional claims in published maps and institutional affiliations.
This research has been supported by the National Natural Science Foundation of China (grant nos. 51636003, 41977179, and 91844301), the Beijing Municipal Science and Technology Commission (grant no. Z201100008220011), the Beijing Municipal Natural Science Foundation (grant no. 8192022), the fellowship of China Postdoctoral Science Foundation (grant no. 2020M680242), and the State Key Laboratory of Multi-phase Complex Systems (grant no. MPCS-2019-D-09).
This paper was edited by Lea Hildebrandt Ruiz and reviewed by Sahil Bhandari and one anonymous referee.
Alfarra, M. R., Prevot, A. S. H., Szidat, S., Sandradewi, J., Weimer, S., Lanz, V. A., Schreiber, D., Mohr, M., and Baltensperger, U.: Identification of the mass spectral signature of organic aerosols from wood burning emissions, Environ. Sci. Technol., 41, 5770–5777, 2007.
Budisulistiorini, S. H., Canagaratna, M. R., Croteau, P. L., Marth, W. J., Baumann, K., Edgerton, E. S., Shaw, S. L., Knipping, E. M., Worsnop, D. R., Jayne, J. T., Gold, A., and Surratt, J. D.: Real-Time Continuous Characterization of Secondary Organic Aerosol Derived from Isoprene Epoxydiols in Downtown Atlanta, Georgia, Using the Aerodyne Aerosol Chemical Speciation Monitor, Environ. Sci. Technol., 47, 5686–5694, 2013.
Canagaratna, M. R., Jimenez, J. L., Kroll, J. H., Chen, Q., Kessler, S. H., Massoli, P., Hildebrandt Ruiz, L., Fortner, E., Williams, L. R., Wilson, K. R., Surratt, J. D., Donahue, N. M., Jayne, J. T., and Worsnop, D. R.: Elemental ratio measurements of organic compounds using aerosol mass spectrometry: characterization, improved calibration, and implications, Atmos. Chem. Phys., 15, 253–272, https://doi.org/10.5194/acp-15-253-2015, 2015.
Canagaratna, M. R., Jayne, J. T., Jimenez, J. L., Allan, J. D., Alfarra, M. R., Zhang, Q., Onasch, T. B., Drewnick, F., Coe, H., Middlebrook, A., Delia, A., Williams, L. R., Trimborn, A. M., Northway, M. J., DeCarlo, P. F., Kolb, C. E., Davidovits, P., and Worsnop, D. R.: Chemical and microphysical characterization of ambient aerosols with the aerodyne aerosol mass spectrometer, Mass. Spectrom. Rev., 26, 185–222, 2007.
Canonaco, F., Crippa, M., Slowik, J. G., Baltensperger, U., and Prévôt, A. S. H.: SoFi, an IGOR-based interface for the efficient use of the generalized multilinear engine (ME-2) for the source apportionment: ME-2 application to aerosol mass spectrometer data, Atmos. Meas. Tech., 6, 3649–3661, https://doi.org/10.5194/amt-6-3649-2013, 2013.
Collier, S., Zhou, S., Kuwayama, T., Forestieri, S., Brady, J., Zhang, M., Kleeman, M., Cappa, C., Bertram, T., and Zhang, Q.: Organic PM Emissions from Vehicles: Composition, O C Ratio, and Dependence on PM Concentration, Aerosol Sci. Tech., 49, 86–97, 2015.
Crippa, M., Canonaco, F., Lanz, V. A., Äijälä, M., Allan, J. D., Carbone, S., Capes, G., Ceburnis, D., Dall'Osto, M., Day, D. A., DeCarlo, P. F., Ehn, M., Eriksson, A., Freney, E., Hildebrandt Ruiz, L., Hillamo, R., Jimenez, J. L., Junninen, H., Kiendler-Scharr, A., Kortelainen, A.-M., Kulmala, M., Laaksonen, A., Mensah, A. A., Mohr, C., Nemitz, E., O'Dowd, C., Ovadnevaite, J., Pandis, S. N., Petäjä, T., Poulain, L., Saarikoski, S., Sellegri, K., Swietlicki, E., Tiitta, P., Worsnop, D. R., Baltensperger, U., and Prévôt, A. S. H.: Organic aerosol components derived from 25 AMS data sets across Europe using a consistent ME-2 based source apportionment approach, Atmos. Chem. Phys., 14, 6159–6176, https://doi.org/10.5194/acp-14-6159-2014, 2014.
Duan, J., Huang, R.-J., Li, Y., Chen, Q., Zheng, Y., Chen, Y., Lin, C., Ni, H., Wang, M., Ovadnevaite, J., Ceburnis, D., Chen, C., Worsnop, D. R., Hoffmann, T., O'Dowd, C., and Cao, J.: Summertime and wintertime atmospheric processes of secondary aerosol in Beijing, Atmos. Chem. Phys., 20, 3793–3807, https://doi.org/10.5194/acp-20-3793-2020, 2020.
Elser, M., Huang, R.-J., Wolf, R., Slowik, J. G., Wang, Q., Canonaco, F., Li, G., Bozzetti, C., Daellenbach, K. R., Huang, Y., Zhang, R., Li, Z., Cao, J., Baltensperger, U., El-Haddad, I., and Prévôt, A. S. H.: New insights into PM2.5 chemical composition and sources in two major cities in China during extreme haze events using aerosol mass spectrometry, Atmos. Chem. Phys., 16, 3207–3225, https://doi.org/10.5194/acp-16-3207-2016, 2016.
Ge, X., Li, L., Chen, Y., Chen, H., Wu, D., Wang, J., Xie, X., Ge, S., Ye, Z., and Xu, J.: Aerosol characteristics and sources in Yangzhou, China resolved by offline aerosol mass spectrometry and other techniques, Environ. Pollut., 225, 74–85, 2017.
Ge, X., Setyan, A., Sun, Y., and Zhang, Q.: Primary and secondary organic aerosols in Fresno, California during wintertime: Results from high resolution aerosol mass spectrometry, J. Geophys. Res.-Atmos., 117, D19301, https://doi.org/10.1029/2012JD018026, 2012.
Gentner, D. R., Harley, R. A., Miller, A. M., and Goldstein, A. H.: Diurnal and Seasonal Variability of Gasoline-Related Volatile Organic Compound Emissions in Riverside, California, Environ. Sci. Technol., 43, 4247–4252, 2009.
Guo, S., Hu, M., Guo, Q., Zhang, X., Zheng, M., Zheng, J., Chang, C. C., Schauer, J. J., and Zhang, R.: Primary Sources and Secondary Formation of Organic Aerosols in Beijing, China, Environ. Sci. Technol., 46, 9846–9853, 2012.
Guo, S., Hu, M., Peng, J., Wu, Z., Zamora, M. L., Shang, D., Du, Z., Zheng, J., Fang, X., Tang, R., Wu, Y., Zeng, L., Shuai, S., Zhang, W., Wang, Y., Ji, Y., Li, Y., Zhang, A. L., Wang, W., Zhang, F., Zhao, J., Gong, X., Wang, C., Molina, M. J., and Zhang, R.: Remarkable nucleation and growth of ultrafine particles from vehicular exhaust, P. Natl. Acad. Sci. USA, 117, 3427–3432, 2020.
Guo, S., Hu, M., Zamora, M. L., Peng, J., Shang, D., Zheng, J., Du, Z., Wu, Z., Shao, M., Zeng, L., Molina, M. J., and Zhang, R.: Elucidating severe urban haze formation in China, P. Natl. Acad. Sci. USA, 111, 17373–17378, 2014.
He, L. Y., Huang, X. F., Xue, L., Hu, M., Lin, Y., Zheng, J., Zhang, R., and Zhang, Y. H.: Submicron aerosol analysis and organic source apportionment in an urban atmosphere in Pearl River Delta of China using high-resolution aerosol mass spectrometry, J. Geophys. Res.-Atmos., 116, D12304, https://doi.org/10.1029/2010JD014566, 2011.
He, L.-Y., Lin, Y., Huang, X.-F., Guo, S., Xue, L., Su, Q., Hu, M., Luan, S.-J., and Zhang, Y.-H.: Characterization of high-resolution aerosol mass spectra of primary organic aerosol emissions from Chinese cooking and biomass burning, Atmos. Chem. Phys., 10, 11535–11543, https://doi.org/10.5194/acp-10-11535-2010, 2010.
Hu, W., Hu, M., Hu, W., Jimenez, J. L., Yuan, B., Chen, W., Wang, M., Wu, Y., Chen, C., and Wang, Z.: Chemical composition, sources, and aging process of submicron aerosols in Beijing: Contrast between summer and winter, J. Geophys. Res.-Atmos., 121, 1955–1977, 2016a.
Hu, W., Hu, M., Hu, W.-W., Zheng, J., Chen, C., Wu, Y., and Guo, S.: Seasonal variations in high time-resolved chemical compositions, sources, and evolution of atmospheric submicron aerosols in the megacity Beijing, Atmos. Chem. Phys., 17, 9979–10000, https://doi.org/10.5194/acp-17-9979-2017, 2017.
Hu, W., Palm, B. B., Day, D. A., Campuzano-Jost, P., Krechmer, J. E., Peng, Z., de Sá, S. S., Martin, S. T., Alexander, M. L., Baumann, K., Hacker, L., Kiendler-Scharr, A., Koss, A. R., de Gouw, J. A., Goldstein, A. H., Seco, R., Sjostedt, S. J., Park, J.-H., Guenther, A. B., Kim, S., Canonaco, F., Prévôt, A. S. H., Brune, W. H., and Jimenez, J. L.: Volatility and lifetime against OH heterogeneous reaction of ambient isoprene-epoxydiols-derived secondary organic aerosol (IEPOX-SOA), Atmos. Chem. Phys., 16, 11563–11580, https://doi.org/10.5194/acp-16-11563-2016, 2016b.
Huang, R.-J., He, Y., Duan, J., Li, Y., Chen, Q., Zheng, Y., Chen, Y., Hu, W., Lin, C., Ni, H., Dai, W., Cao, J., Wu, Y., Zhang, R., Xu, W., Ovadnevaite, J., Ceburnis, D., Hoffmann, T., and O'Dowd, C. D.: Contrasting sources and processes of particulate species in haze days with low and high relative humidity in wintertime Beijing, Atmos. Chem. Phys., 20, 9101–9114, https://doi.org/10.5194/acp-20-9101-2020, 2020.
Huang, X.-F., He, L.-Y., Hu, M., Canagaratna, M. R., Kroll, J. H., Ng, N. L., Zhang, Y.-H., Lin, Y., Xue, L., Sun, T.-L., Liu, X.-G., Shao, M., Jayne, J. T., and Worsnop, D. R.: Characterization of submicron aerosols at a rural site in Pearl River Delta of China using an Aerodyne High-Resolution Aerosol Mass Spectrometer, Atmos. Chem. Phys., 11, 1865–1877, https://doi.org/10.5194/acp-11-1865-2011, 2011.
Kaltsonoudis, C., Kostenidou, E., Louvaris, E., Psichoudaki, M., Tsiligiannis, E., Florou, K., Liangou, A., and Pandis, S. N.: Characterization of fresh and aged organic aerosol emissions from meat charbroiling, Atmos. Chem. Phys., 17, 7143–7155, https://doi.org/10.5194/acp-17-7143-2017, 2017.
Katragadda, H. R., Fullana, A., Sidhu, S., and Carbonell-Barrachina, A. A.: Emissions of volatile aldehydes from heated cooking oils, Food Chem., 120, 59–65, 2010.
Kim, H., Zhang, Q., Bae, G.-N., Kim, J. Y., and Lee, S. B.: Sources and atmospheric processing of winter aerosols in Seoul, Korea: insights from real-time measurements using a high-resolution aerosol mass spectrometer, Atmos. Chem. Phys., 17, 2009–2033, https://doi.org/10.5194/acp-17-2009-2017, 2017.
Klein, F., Platt, S. M., Farren, N. J., Detournay, A., Bruns, E. A., Bozzetti, C., Daellenbach, K. R., Kilic, D., Kumar, N. K., Pieber, S. M., Slowik, J. G., Temime-Roussel, B., Marchand, N., Hamilton, J. F., Baltensperger, U., Prevot, A. S. H., and El Haddad, I.: Characterization of Gas-Phase Organics Using Proton Transfer Reaction Time-of-Flight Mass Spectrometry: Cooking Emissions, Environ. Sci. Technol., 50, 1243–1250, 2016.
Kostenidou, E., Lee, B.-H., Engelhart, G. J., Pierce, J. R., and Pandis, S. N.: Mass Spectra Deconvolution of Low, Medium, and High Volatility Biogenic Secondary Organic Aerosol, Environ. Sci. Technol., 43, 4884–4889, 2009.
Kroll, J. H., Smith, J. D., Worsnop, D. R., and Wilson, K. R.: Characterisation of lightly oxidised organic aerosol formed from the photochemical aging of diesel exhaust particles, Environ. Chem., 9, 211–220, 2012.
Lee, T., Sullivan, A. P., Mack, L., Jimenez, J. L., Kreidenweis, S. M., Onasch, T. B., Worsnop, D. R., Malm, W., Wold, C. E., Hao, W. M., and Collett Jr., J. L.: Chemical Smoke Marker Emissions During Flaming and Smoldering Phases of Laboratory Open Burning of Wildland Fuels, Aerosol Sci. Tech., 44, I-V, https://doi.org/10.1080/02786826.2010.499884, 2010.
Li, J., Liu, Q., Li, Y., Liu, T., Huang, D., Zheng, J., Zhu, W., Hu, M., Wu, Y., Lou, S., Hallquist, A. M., Hallquist, M., Chan, C. K., Canonaco, F., Prevot, A. S. H., Fung, J. C. H., Lau, A. K. H., and Yu, J. Z.: Characterization of Aerosol Aging Potentials at Suburban Sites in Northern and Southern China Utilizing a Potential Aerosol Mass (Go:PAM) Reactor and an Aerosol Mass Spectrometer, J. Geophys. Res.-Atmos., 124, 5629–5649, 2019.
Li, Y. J., Sun, Y., Zhang, Q., Li, X., Li, M., Zhou, Z., and Chan, C. K.: Real-time chemical characterization of atmospheric particulate matter in China: A review, Atmos. Environ., 158, 270–304, 2017.
Liu, T., Li, Z., Chan, M., and Chan, C. K.: Formation of secondary organic aerosols from gas-phase emissions of heated cooking oils, Atmos. Chem. Phys., 17, 7333–7344, https://doi.org/10.5194/acp-17-7333-2017, 2017.
Liu, T., Wang, Z., Wang, X., and Chan, C. K.: Primary and secondary organic aerosol from heated cooking oil emissions, Atmos. Chem. Phys., 18, 11363–11374, https://doi.org/10.5194/acp-18-11363-2018, 2018.
Louvaris, E. E., Karnezi, E., Kostenidou, E., Kaltsonoudis, C., and Pandis, S. N.: Estimation of the volatility distribution of organic aerosol combining thermodenuder and isothermal dilution measurements, Atmos. Meas. Tech., 10, 3909–3918, https://doi.org/10.5194/amt-10-3909-2017, 2017.
Mohr, C., DeCarlo, P. F., Heringa, M. F., Chirico, R., Slowik, J. G., Richter, R., Reche, C., Alastuey, A., Querol, X., Seco, R., Peñuelas, J., Jiménez, J. L., Crippa, M., Zimmermann, R., Baltensperger, U., and Prévôt, A. S. H.: Identification and quantification of organic aerosol from cooking and other sources in Barcelona using aerosol mass spectrometer data, Atmos. Chem. Phys., 12, 1649–1665, https://doi.org/10.5194/acp-12-1649-2012, 2012.
Ng, N. L., Canagaratna, M. R., Jimenez, J. L., Zhang, Q., Ulbrich, I. M., and Worsnop, D. R.: Real-Time Methods for Estimating Organic Component Mass Concentrations from Aerosol Mass Spectrometer Data, Environ. Sci. Technol., 45, 910–916, 2011.
Paatero, P.: The multilinear engine – A table-driven, least squares program for solving multilinear problems, including the n-way parallel factor analysis model, J. Comput. Graph. Stat., 8, 854–888, 1999.
Paatero, P. and Hopke, P. K.: Discarding or downweighting high-noise variables in factor analytic models, Anal. Chim. Acta, 490, 277–289, 2003.
Peng, Z., Day, D. A., Ortega, A. M., Palm, B. B., Hu, W., Stark, H., Li, R., Tsigaridis, K., Brune, W. H., and Jimenez, J. L.: Non-OH chemistry in oxidation flow reactors for the study of atmospheric chemistry systematically examined by modeling, Atmos. Chem. Phys., 16, 4283–4305, https://doi.org/10.5194/acp-16-4283-2016, 2016.
Presto, A. A., Gordon, T. D., and Robinson, A. L.: Primary to secondary organic aerosol: evolution of organic emissions from mobile combustion sources, Atmos. Chem. Phys., 14, 5015–5036, https://doi.org/10.5194/acp-14-5015-2014, 2014.
Qin, Y. M., Tan, H. B., Li, Y. J., Schurman, M. I., Li, F., Canonaco, F., Prévôt, A. S. H., and Chan, C. K.: Impacts of traffic emissions on atmospheric particulate nitrate and organics at a downwind site on the periphery of Guangzhou, China, Atmos. Chem. Phys., 17, 10245–10258, https://doi.org/10.5194/acp-17-10245-2017, 2017.
Reyes-Villegas, E., Green, D. C., Priestman, M., Canonaco, F., Coe, H., Prévôt, A. S. H., and Allan, J. D.: Organic aerosol source apportionment in London 2013 with ME-2: exploring the solution space with annual and seasonal analysis, Atmos. Chem. Phys., 16, 15545–15559, https://doi.org/10.5194/acp-16-15545-2016, 2016.
Robinson, A. L., Donahue, N. M., Shrivastava, M. K., Weitkamp, E. A., Sage, A. M., Grieshop, A. P., Lane, T. E., Pierce, J. R., and Pandis, S. N.: Rethinking organic aerosols: Semivolatile emissions and photochemical aging, Science 315, 1259–1262, 2007.
Schauer, J. J., Kleeman, M. J., Cass, G. R., and Simoneit, B. R. T.: Measurement of emissions from air pollution sources. 4. C1–C27 organic compounds from cooking with seed oils, Environ. Sci. Technol., 36, 567–575, 2002.
Sun, J., Zhang, Q., Canagaratna, M. R., Zhang, Y., Ng, N. L., Sun, Y., Jayne, J. T., Zhang, X., Zhang, X., and Worsnop, D. R.: Highly time-and size-resolved characterization of submicron aerosol particles in Beijing using an Aerodyne Aerosol Mass Spectrometer, Atmos. Environ., 44, 131–140, 2010.
Sun, Y., Jiang, Q., Wang, Z., Fu, P., Li, J., Yang, T., and Yin, Y.: Investigation of the sources and evolution processes of severe haze pollution in Beijing in January 2013, J. Geophys. Res.-Atmos., 119, 4380–4398, 2014.
Sun, Y., Du, W., Fu, P., Wang, Q., Li, J., Ge, X., Zhang, Q., Zhu, C., Ren, L., Xu, W., Zhao, J., Han, T., Worsnop, D. R., and Wang, Z.: Primary and secondary aerosols in Beijing in winter: sources, variations and processes, Atmos. Chem. Phys., 16, 8309–8329, https://doi.org/10.5194/acp-16-8309-2016, 2016.
Sun, Y., Xu, W., Zhang, Q., Jiang, Q., Canonaco, F., Prévôt, A. S. H., Fu, P., Li, J., Jayne, J., Worsnop, D. R., and Wang, Z.: Source apportionment of organic aerosol from 2-year highly time-resolved measurements by an aerosol chemical speciation monitor in Beijing, China, Atmos. Chem. Phys., 18, 8469–8489, https://doi.org/10.5194/acp-18-8469-2018, 2018.
Sun, Y.-L., Zhang, Q., Schwab, J. J., Demerjian, K. L., Chen, W.-N., Bae, M.-S., Hung, H.-M., Hogrefe, O., Frank, B., Rattigan, O. V., and Lin, Y.-C.: Characterization of the sources and processes of organic and inorganic aerosols in New York city with a high-resolution time-of-flight aerosol mass apectrometer, Atmos. Chem. Phys., 11, 1581–1602, https://doi.org/10.5194/acp-11-1581-2011, 2011.
Tang, R., Lu, Q., Guo, S., Wang, H., Song, K., Yu, Y., Tan, R., Liu, K., Shen, R., Chen, S., Zeng, L., Jorga, S. D., Zhang, Z., Zhang, W., Shuai, S., and Robinson, A. L.: Measurement report: Distinct emissions and volatility distribution of intermediate-volatility organic compounds from on-road Chinese gasoline vehicles: implication of high secondary organic aerosol formation potential, Atmos. Chem. Phys., 21, 2569–2583, https://doi.org/10.5194/acp-21-2569-2021, 2021.
Ulbrich, I. M., Canagaratna, M. R., Zhang, Q., Worsnop, D. R., and Jimenez, J. L.: Interpretation of organic components from Positive Matrix Factorization of aerosol mass spectrometric data, Atmos. Chem. Phys., 9, 2891–2918, https://doi.org/10.5194/acp-9-2891-2009, 2009.
Wang, H., Guo, S., Yu, Y., Shen, R., Zhu, W., Tang, R., Tan, R., Liu, K., Song, K., Zhang, W., Zhang, Z., Shuai, S., Xu, H., Zheng, J., Chen, S., Li, S., Zeng, L., and Wu, Z.: Secondary aerosol formation from a Chinese gasoline vehicle: Impacts of fuel (E10, gasoline) and driving conditions (idling, cruising), Sci. Total Environ., 795, 148809–148809, 2021.
Wang, H., Xiang, Z., Wang, L., Jing, S., Lou, S., Tao, S., Liu, J., Yu, M., Li, L., Lin, L., Chen, Y., Wiedensohler, A., and Chen, C.: Emissions of volatile organic compounds (VOCs) from cooking and their speciation: A case study for Shanghai with implications for China, Sci. Total Environ., 621, 1300–1309, 2018.
Wang, J., Ge, X., Chen, Y., Shen, Y., Zhang, Q., Sun, Y., Xu, J., Ge, S., Yu, H., and Chen, M.: Highly time-resolved urban aerosol characteristics during springtime in Yangtze River Delta, China: insights from soot particle aerosol mass spectrometry, Atmos. Chem. Phys., 16, 9109–9127, https://doi.org/10.5194/acp-16-9109-2016, 2016.
Wang, M., Li, S., Zhu, R., Zhang, R., Zu, L., Wang, Y., and Bao, X.: On-road tailpipe emission characteristics and ozone formation potentials of VOCs from gasoline, diesel and liquefied petroleum gas fueled vehicles, Atmos. Environ., 223, 117294, https://doi.org/10.1016/j.atmosenv.2020.117294, 2020.
Wang, Y. C., Huang, R. J., Ni, H. Y., Chen, Y., Wang, Q. Y., Li, G. H., Tie, X. X., Shen, Z. X., Huang, Y., Liu, S. X., Dong, W. M., Xue, P., Frohlich, R., Canonaco, F., Elser, M., Daellenbach, K. R., Bozzetti, C., Haddad, I.E., Prevot, A. S. H., Canagaratna, M. R., Worsnop, D. R., and Cao, J. J.: Chemical composition, sources and secondary processes of aerosols in Baoji city of northwest China, Atmos. Environ. 158, 128–137, 2017.
Watne, A. K., Psichoudaki, M., Ljungstrom, E., Le Breton, M., Hallquist, M., Jerksjo, M., Fallgren, H., Jutterstrom, S., and Hallquist, A. M.: Fresh and Oxidized Emissions from In-Use Transit Buses Running on Diesel, Biodiesel, and CNG, Environ. Sci. Technol., 52, 7720–7728, 2018.
Xu, J., Shi, J., Zhang, Q., Ge, X., Canonaco, F., Prévôt, A. S. H., Vonwiller, M., Szidat, S., Ge, J., Ma, J., An, Y., Kang, S., and Qin, D.: Wintertime organic and inorganic aerosols in Lanzhou, China: sources, processes, and comparison with the results during summer, Atmos. Chem. Phys., 16, 14937–14957, https://doi.org/10.5194/acp-16-14937-2016, 2016.
Xu, W., Han, T., Wei, D., Wang, Q., Chen, C., Jian, Z., Zhang, Y., Jie, L., Fu, P., and Wang, Z.: Effects of Aqueous-phase and Photochemical Processing on Secondary Organic Aerosol Formation and Evolution in Beijing, China, Environ. Sci. Technol., 51, 762–770, https://doi.org/10.1021/acs.est.6b04498, 2017.
Xu, W., He, Y., Qiu, Y., Chen, C., Xie, C., Lei, L., Li, Z., Sun, J., Li, J., Fu, P., Wang, Z., Worsnop, D. R., and Sun, Y.: Mass spectral characterization of primary emissions and implications in source apportionment of organic aerosol, Atmos. Meas. Tech., 13, 3205–3219, https://doi.org/10.5194/amt-13-3205-2020, 2020.
Yu, Y., Wang, H., Wang, T. T., Song, K., Tan, T. Y., Wan, Z. C., Gao, Y. Q., Dong, H. B., Chen, S. Y., Zeng, L. M., Hu, M., Wang, H. L., Lou, S. R., Zhu, W. F., and Guo, S.: Elucidating the importance of semi-volatile organic compounds to secondary organic aerosol formation at a regional site during the EXPLORE-YRD campaign, Atmos. Environ., 246, 118043, https://doi.org/10.1016/j.atmosenv.2020.118043, 2021.
Zhang, Q., Jimenez, J. L., Canagaratna, M. R., Ulbrich, I. M., Ng, N. L., Worsnop, D. R., and Sun, Y.: Understanding atmospheric organic aerosols via factor analysis of aerosol mass spectrometry: a review, Anal. Bioanal. Chem., 401, 3045–3067, 2011.
Zhang, X., Zhang, Y., Sun, J., Yu, Y., Canonaco, F., Prevot, A. S. H., and Li, G.: Chemical characterization of submicron aerosol particles during wintertime in a northwest city of China using an Aerodyne aerosol mass spectrometry, Environ. Pollut., 222, 567–582, 2017a.
Zhang, Y., Tang, L., Sun, Y., Favez, O., Canonaco, F., Albinet, A., Couvidat, F., Liu, D., Jayne, J. T., Wang, Z., Croteau, P. L., Canagaratna, M. R., Zhou, H.-C., Prevot, A. S. H., and Worsnop, D. R.: Limited formation of isoprene epoxydiols-derived secondary organic aerosol under NOx-rich environments in Eastern China, Geophys. Res. Lett., 44, 2035–2043, 2017b.
Zhang, Y. J., Tang, L. L., Wang, Z., Yu, H. X., Sun, Y. L., Liu, D., Qin, W., Canonaco, F., Prévôt, A. S. H., Zhang, H. L., and Zhou, H. C.: Insights into characteristics, sources, and evolution of submicron aerosols during harvest seasons in the Yangtze River delta region, China, Atmos. Chem. Phys., 15, 1331–1349, https://doi.org/10.5194/acp-15-1331-2015, 2015.
Zhang, Z., Zhu, W., Hu, M., Wang, H., Chen, Z., Shen, R., Yu, Y., Tan, R., and Guo, S.: Secondary Organic Aerosol from Typical Chinese Domestic Cooking Emissions, Environ. Sci. Tech. Let., 8, 24–31, https://doi.org/10.1021/acs.estlett.0c00754, 2021.
Zhou, S., Collier, S., Jaffe, D. A., Briggs, N. L., Hee, J., Sedlacek III, A. J., Kleinman, L., Onasch, T. B., and Zhang, Q.: Regional influence of wildfires on aerosol chemistry in the western US and insights into atmospheric aging of biomass burning organic aerosol, Atmos. Chem. Phys., 17, 2477–2493, https://doi.org/10.5194/acp-17-2477-2017, 2017.
Zhou, W., Wang, Q., Zhao, X., Xu, W., Chen, C., Du, W., Zhao, J., Canonaco, F., Prévôt, A. S. H., Fu, P., Wang, Z., Worsnop, D. R., and Sun, Y.: Characterization and source apportionment of organic aerosol at 260 m on a meteorological tower in Beijing, China, Atmos. Chem. Phys., 18, 3951–3968, https://doi.org/10.5194/acp-18-3951-2018, 2018.
Zhu, Q., Huang, X.-F., Cao, L.-M., Wei, L.-T., Zhang, B., He, L.-Y., Elser, M., Canonaco, F., Slowik, J. G., Bozzetti, C., El-Haddad, I., and Prévôt, A. S. H.: Improved source apportionment of organic aerosols in complex urban air pollution using the multilinear engine (ME-2), Atmos. Meas. Tech., 11, 1049–1060, https://doi.org/10.5194/amt-11-1049-2018, 2018.
Zhu, W., Guo, S., Lou, S., Wang, H., Yu, Y., Xu, W., Liu, Y., Cheng, Z., Huang, X., He, L., Zeng, L., Chen, S., and Hu, M.: A novel algorithm to determine the scattering coefficient of ambient organic aerosols, Environ. Pollut., 270, 116209, https://doi.org/10.1016/j.envpol.2020.116209, 2021a.
Zhu, W., Zhou, M., Cheng, Z., Yan, N., Huang, C., Qiao, L., Wang, H., Liu, Y., Lou, S., and Guo, S.: Seasonal variation of aerosol compositions in Shanghai, China: Insights from particle aerosol mass spectrometer observations, Sci. Total Environ., 771, 144948–144948, 2021b.