the Creative Commons Attribution 4.0 License.
the Creative Commons Attribution 4.0 License.
 | 15 Oct 2021
How alkaline compounds control atmospheric aerosol particle acidity
Vlassis A. Karydis
Alexandra P. Tsimpidi
Andrea Pozzer
Jos Lelieveld
The acidity of atmospheric particulate matter regulates its mass, composition, and toxicity and has important consequences for public health, ecosystems and climate. Despite these broad impacts, the global distribution and evolution of aerosol particle acidity are unknown. We used the comprehensive atmospheric multiphase chemistry–climate model EMAC (ECHAM5/MESSy Atmospheric Chemistry) to investigate the main factors that control aerosol particle acidity and uncovered remarkable variability and unexpected trends during the past 50 years in different parts of the world. Aerosol particle acidity decreased strongly over Europe and North America during the past decades while at the same time it increased over Asia. Our simulations revealed that these particle acidity trends are strongly related to changes in the phase partitioning of nitric acid, production of sulfate in aqueous aerosols, and the aerosol hygroscopicity. It is remarkable that the aerosol hygroscopicity (κ) has increased in many regions following the particle pH. Overall, we find that alkaline compounds, notably ammonium and to a lesser extent crustal cations, regulate the particle pH on a global scale. Given the importance of aerosol particles for the atmospheric energy budget, cloud formation, pollutant deposition, and public health, alkaline species hold the key to control strategies for air quality and climate change.
- Article
(3771 KB) - Full-text XML
-
Supplement
(489 KB) - BibTeX
- EndNote


Aerosol particle acidity is a central property of atmospheric particulates that influence clouds, climate, and air quality, including impacts on human health (Raizenne et al., 1996; Lelieveld et al., 2015). It affects the partitioning of semi-volatile acids between the gas and particle phases (Guo et al., 2016, 2017, 2018; Nenes et al., 2020), secondary organic aerosol (SOA) formation (Xu et al., 2015; Marais et al., 2016), the solubility of trace metals in aerosol particles (Oakes et al., 2012) associated with their toxicity (Fang et al., 2017) and nutrient capacity (Jickells et al., 2005), the activation of halogens that act as oxidants (Saiz-Lopez and von Glasow, 2012), the conversion of sulfur dioxide (Seinfeld and Pandis, 2006; Cheng et al., 2016), the particle hygroscopic growth and lifetime (Metzger et al., 2006; Abdelkader et al., 2015; Karydis et al., 2017), and atmospheric corrosivity (Leygraf et al., 2016). Direct measurement of particle acidity is difficult and associated with much uncertainty, being dependent on filter sampling and the H+ molality in the aqueous extract, which is sensitive to artifacts (Pathak et al., 2004). Therefore, particle pH, a commonly used acidity metric of aqueous aerosols, is typically inferred by proxy techniques (Hennigan et al., 2015; Pye et al., 2020). Two of the most common are the ion balance and the molar ratio methods. These methods do not consider the effects of aerosol water and multiphase interactions with gas-phase species as well as the partial dissociation of acids (Hennigan et al., 2015). The simultaneous measurement of gas-phase species can improve particle pH estimates by accounting for the phase partitioning of semi-volatile species (e.g., NH3, HNO3). However, the accuracy of this approach relies on the availability of information on these species in both the gas and particle phases, being scant in most cases.
The most reliable estimates of pH are obtained with thermodynamic equilibrium models, although the accuracy can be limited by not accounting for all ionic species. For example, most atmospheric chemistry models do not consider crustal elements (e.g., Ca2+, Mg2+, K+) and Na+ in sea salt. These species affect the ion balance by influencing the phase partitioning of nitrate and ammonium, especially in areas where aeolian dust is abundant (Karydis et al., 2016). Here we present 50-year global acidity trends of fine particulate matter (i.e., with a diameter < 2.5 µm) by employing the ECHAM5/MESSy Atmospheric Chemistry (EMAC) chemistry–climate model (Jöckel et al., 2010). The pH calculations are performed online with the ISORROPIA II thermodynamic equilibrium model (Fountoukis and Nenes, 2007).
2.1 Global variability of aerosol particle acidity
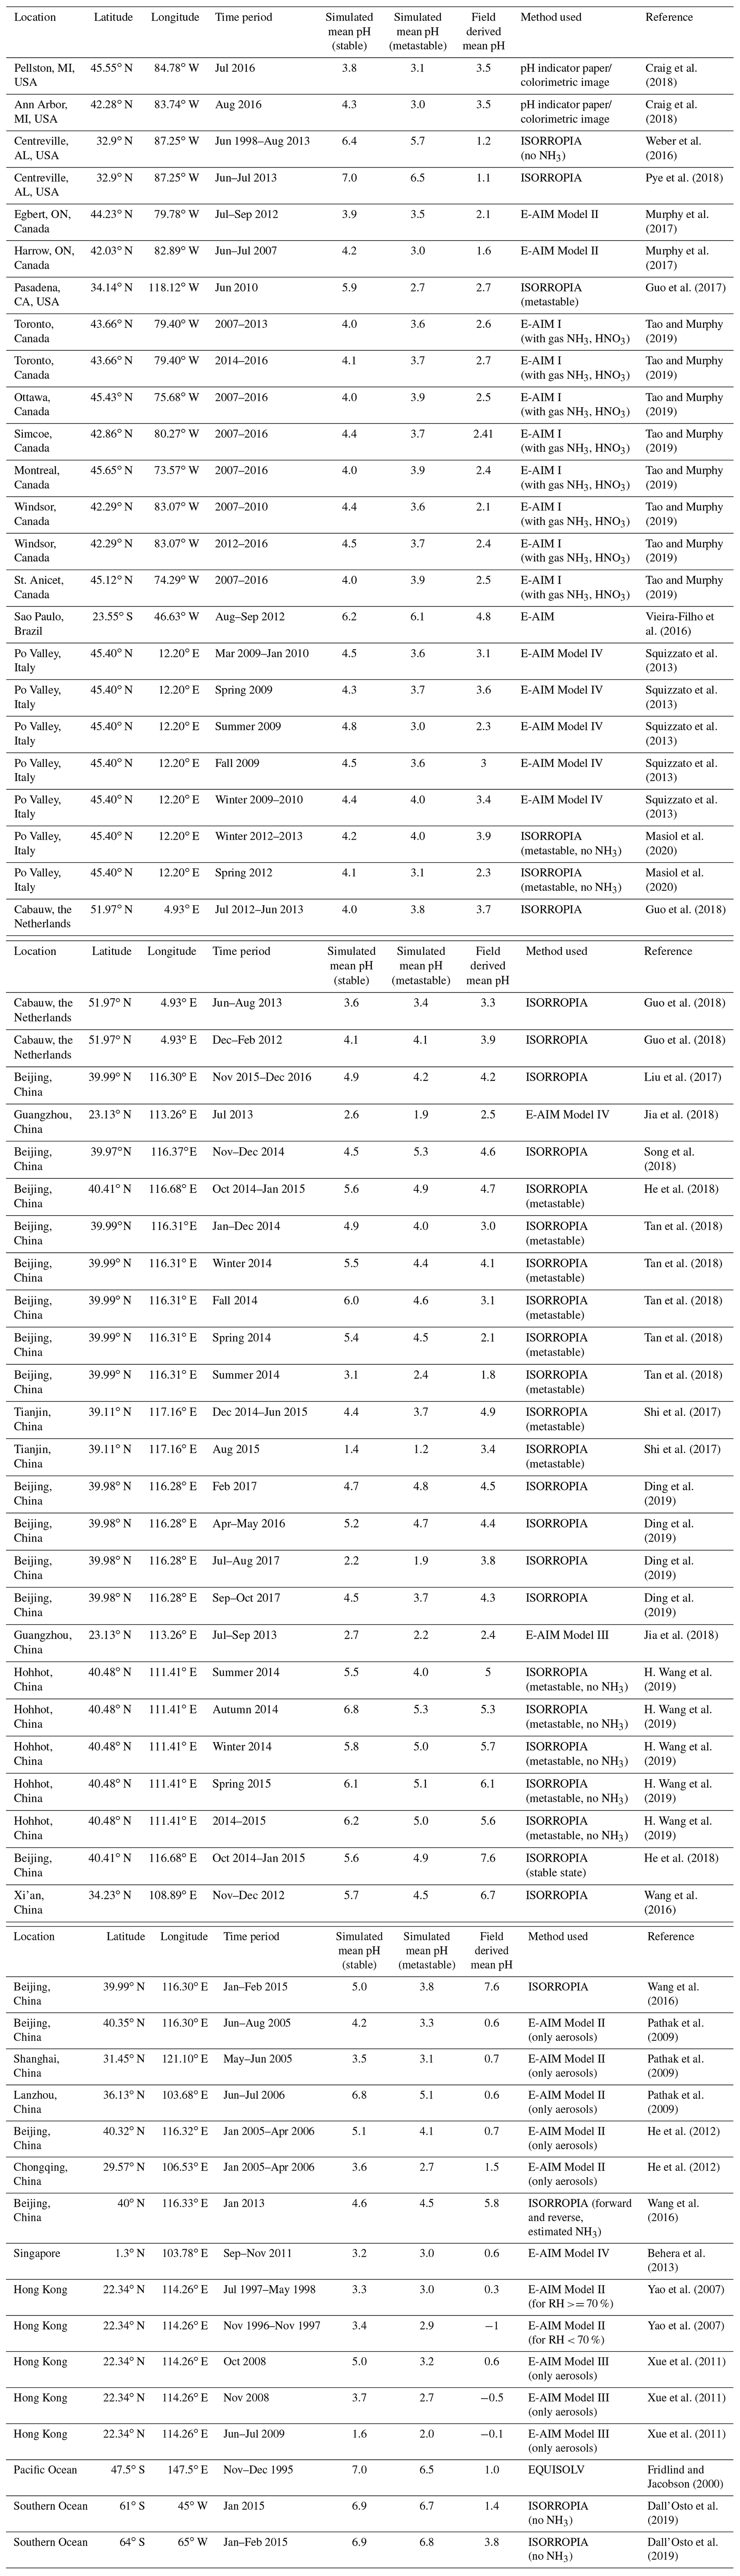
Figure 1 shows the modeled near-surface distribution of fine aerosol particle acidity for the 2010–2015 period. We find predominantly acidic particles over the anthropogenically influenced regions in the Northern Hemisphere and the tropical biomass burning zones and mostly alkaline particles over deserts and oceans, especially over the southern oceans. The pH typically ranges from 4.0 to 6.7 (5.3 on average) over the western USA since it is affected by crustal cations from the surrounding deserts. Polluted areas located downwind of crustal sources are of special interest since the pH calculations can be sensitive to the aerosol state assumption (see Sect. 4.3). Over Pasadena, the base case model using the stable-state mode estimates a mean pH of 5.9 units, while the sensitivity simulation with only liquid particles results in 2.7 pH units (equal to Guo et al., 2017, estimations by using the metastable assumption; Table A1). Our sensitivity analysis revealed that the aerosol state itself is not affected by the state assumption since both stable and metastable predict the same amount of water in the aerosol. Differences in the calculated pH can be due to the high concentrations of calcium from the Great Basin Desert, which results in the precipitation of high amounts of CaSO4, lowering the particle acidity (but without affecting the water activity since CaSO4 is insoluble and does not contribute to the MDRH depression). It is worth mentioning that calcium was not included in the Guo et al. (2017) study, which helps explain the differences in the observed and simulated particle acidity. The simulated particle-phase fraction of nitrate over Pasadena is 40 % using the stable-state assumption and 32 % using the metastable assumption compared to the observationally derived 51 %. Over Europe, the pH ranges from 2.6 to 6.7 (3.9 on average). Observational estimates of particle pH from the Po Valley (Squizzato et al., 2013; Masiol et al., 2020) and Cabauw (Guo et al., 2018) support the relatively low acidity of fine particles over Europe (Table A1). Model calculations compare well with observational estimates from Cabauw but result in higher pH (∼1 unit) compared to values from the Po Valley (estimated by using the E-AIM model). Over East Asia the average pH is 4.7, ranging from 2.6 to 7.4. Relatively high pH is found over regions where anthropogenic aerosols are mixed with aeolian dust, e.g., from the Gobi desert, which decrease the acidity (e.g., ∼6 pH units over Hohhot, which agrees well with the estimations of H. Wang et al., 2019). The relatively low pH in large parts of Asia is explained by strong SO2 emissions and associated sulfate, which have increased strongly in the past decades (e.g., over Guangzhou, supported by estimations of Jia et al., 2018). Estimates of unrealistically high particle acidity can result from omitting the gas-phase concentrations of semi-volatile ions from the pH calculations (e.g., estimates over Hong Kong: Yao et al., 2007; Xue et al., 2011; Singapore: Behera et al., 2013; and Shanghai: Pathak et al., 2009; Table A1). At the same time, SO2 emissions have decreased over Europe and the USA and recently in China. However, aerosol particles over the eastern USA have remained acidic, with an average pH of 3.0 until recently, corroborating the findings of Weber et al. (2016) and Lawal et al. (2018) that aerosol particle acidity over this region is less sensitive to SO2 than to NH3 emissions.
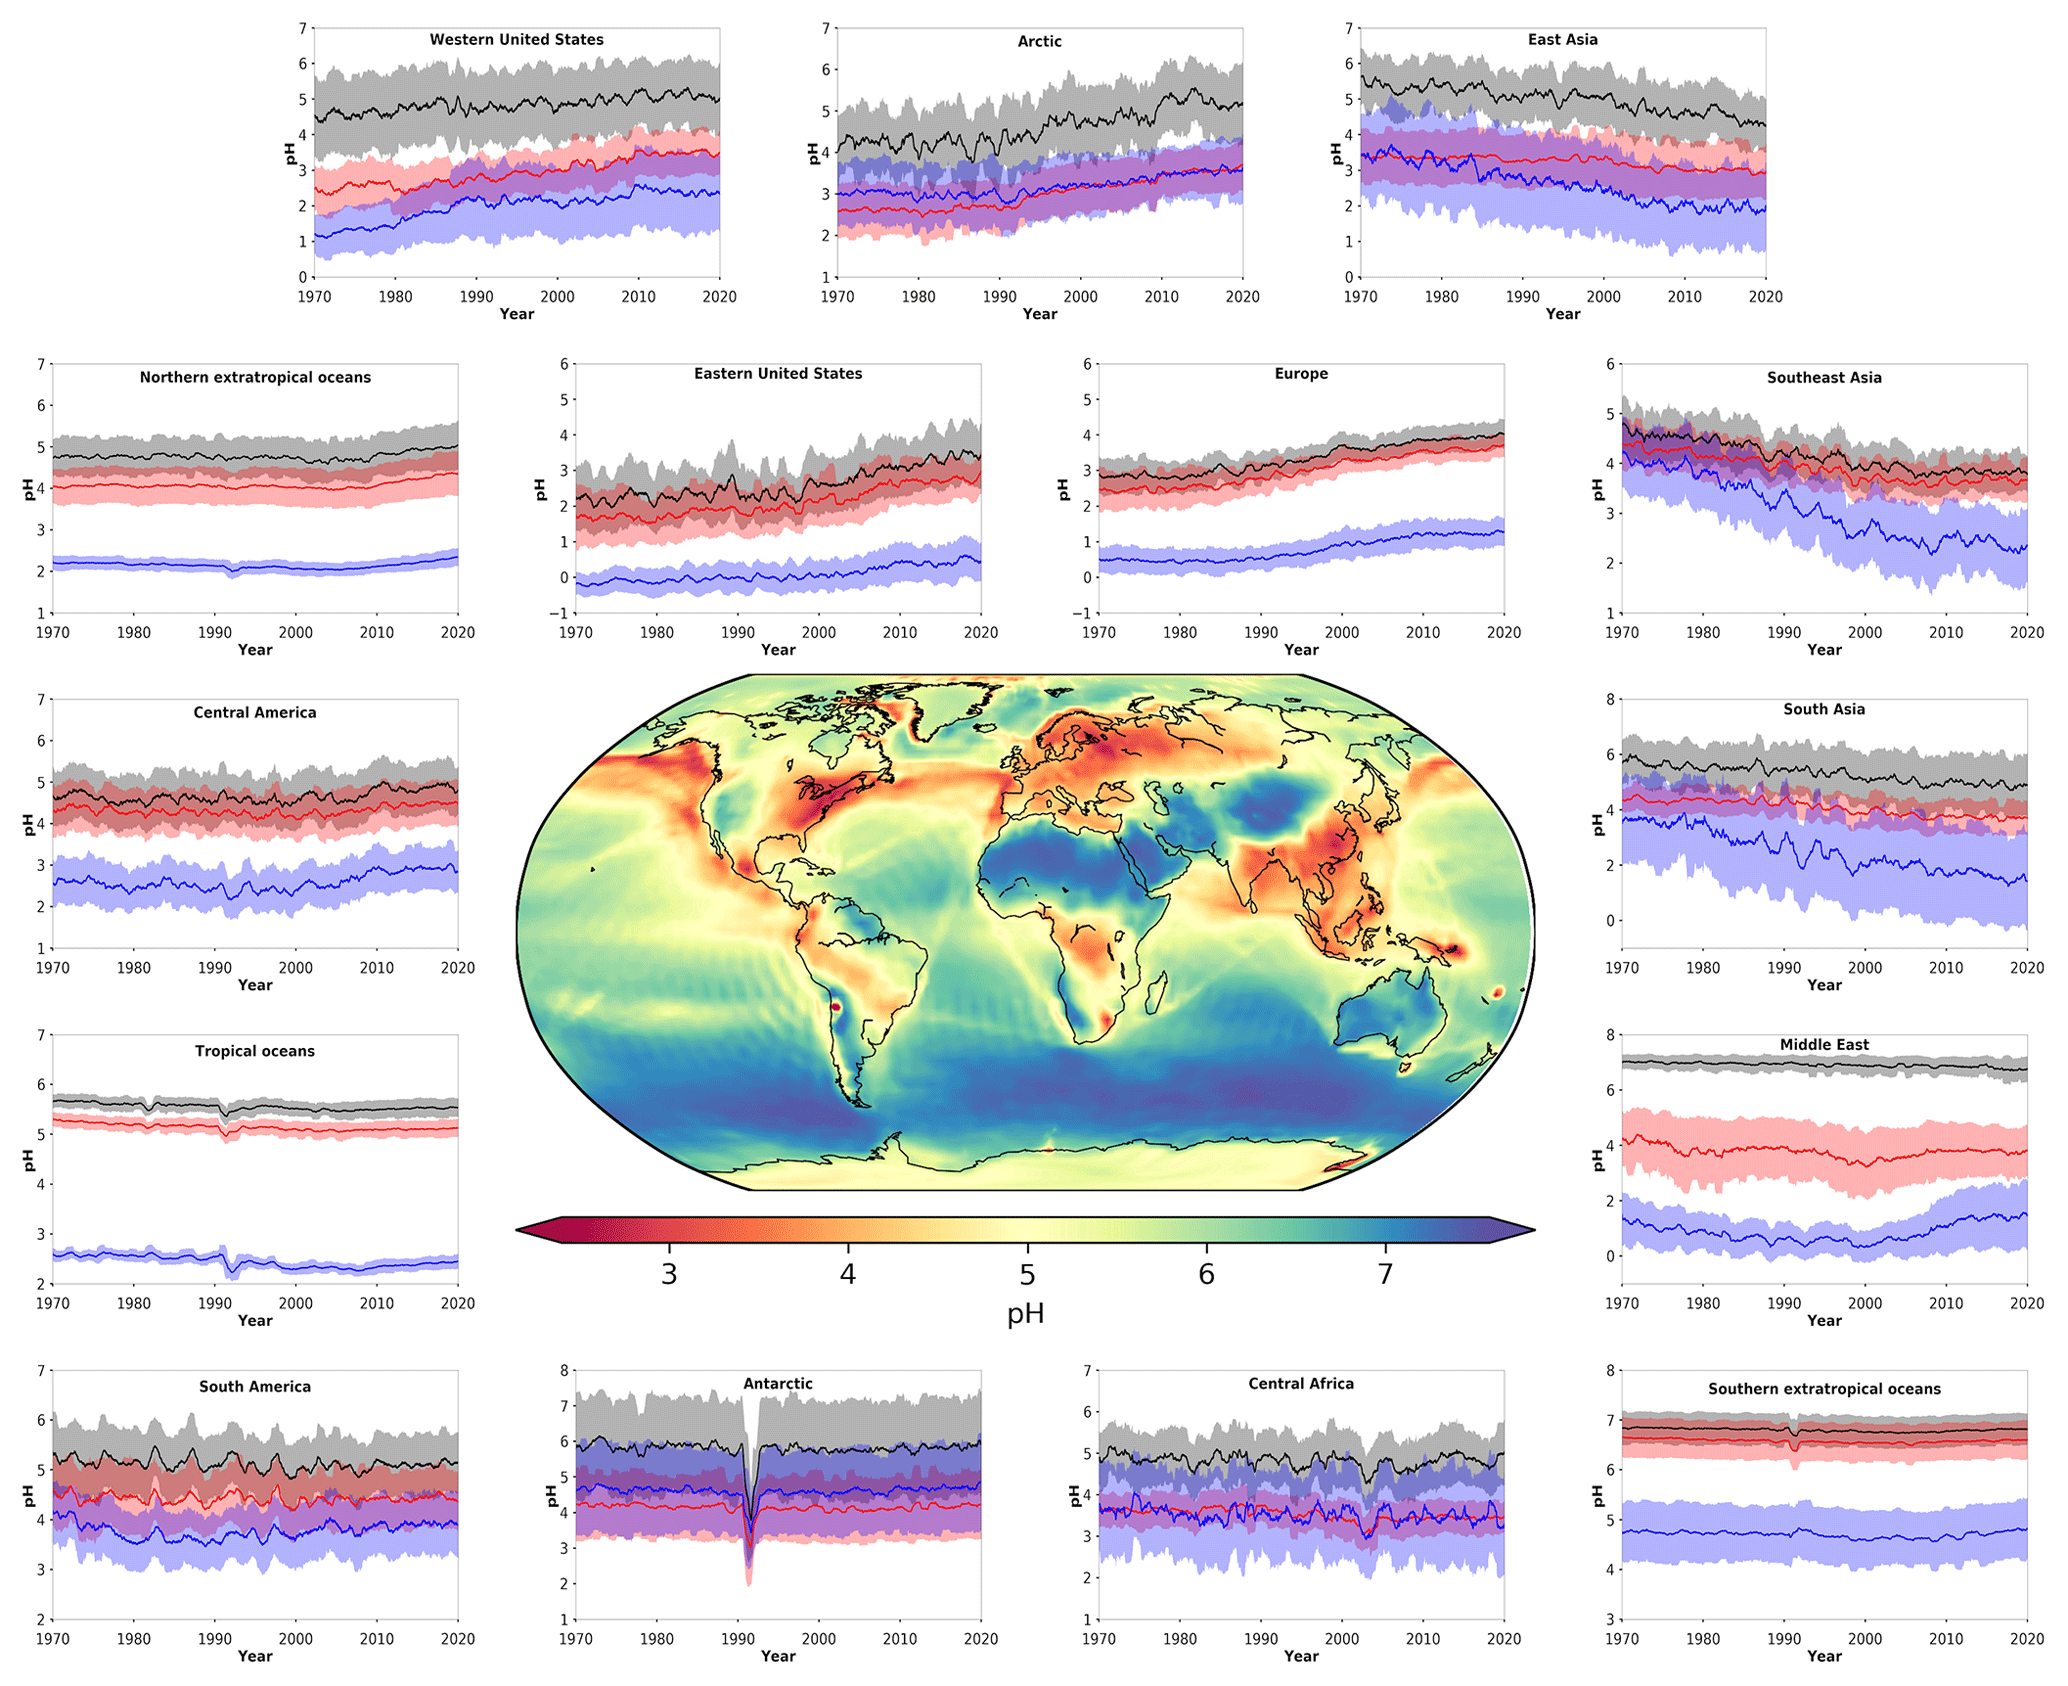
Figure 1Mean, near-surface fine aerosol particle pH during the period 2010–2015 (central panel). Surrounding panels show the temporal pH evolution during the period 1970–2020 at locations defined in Table 1. Black lines represent the reference simulation. Red and blue lines show the sensitivity simulations in which crustal particle and NH3 emissions are removed, respectively. Ranges represent the 1σ SD (standard deviation). The anomaly in 1991/92 is related to the Mount Pinatubo eruption.
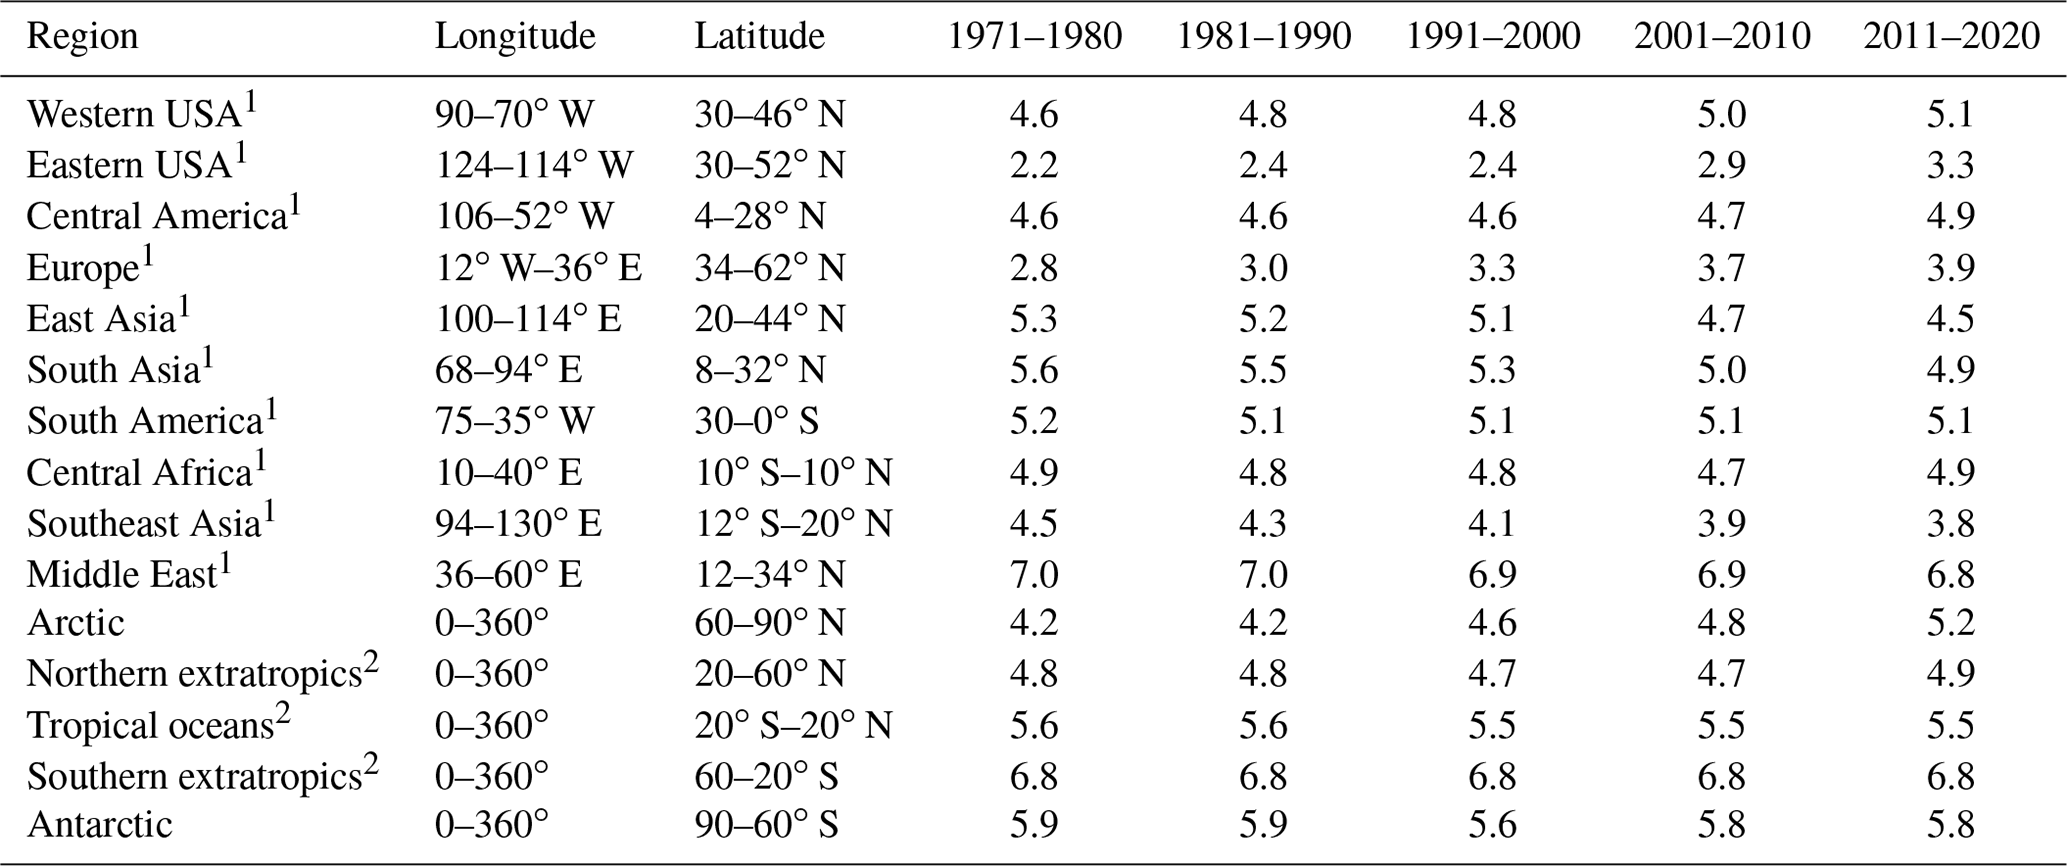
The particle pH over polluted Northern Hemisphere mid-latitudes (e.g., over East Asia) and the northern extratropical oceans exhibits a clear seasonal pattern with lower values during boreal summer and higher ones during winter, driven by the availability of ammonium and by the aerosol water content (Fig. 2). This is evident from both our model calculations and from observational estimates, mostly in heavily populated areas such as the Po Valley (Squizzato et al., 2013), Beijing (Tan et al., 2018), and Tianjin (Shi et al., 2017) and to a lesser extent over areas strongly affected by aeolian dust (e.g., Hohhot; Y. Wang et al., 2019) (Table A1). Over tropical regions, fine particulates have a pH between 3.2 and 7.4, being strongly influenced by pyrogenic potassium, i.e., from widespread biomass burning (Metzger et al., 2006), and a high aerosol water content. Observational estimates from Sao Paulo support these high pH values (Vieira-Filho et al., 2016), albeit with 1 unit bias mainly related to the use of the E-AIM model. Over deserts, particles are relatively alkaline, with a pH up to 7.4. Particles in the marine environment tend to be alkaline also, with a pH up to 7.4 over the southern oceans. Observational estimates report highly acidic particles over the southern oceans due to the lack of gas-phase input for the pH calculations (Dall'Osto et al., 2019). Over the Arctic and the northern Atlantic and Pacific oceans, particle acidity is significantly enhanced by strong sulfur emissions from international shipping and pollution transport from industrialized areas (Fig. 1). The pH over the northern extratropical oceans and the Arctic ranges from 2.0 to 7.0 with an average of about 5.2. The annual cycle of particle acidity over these regions is strongly influenced by anthropogenic pollution, being relatively high during boreal summer. Over the Antarctic, particle pH ranges from 4.5 to 7.0 and follows a clear seasonal pattern (Fig. 2).
2.2 Temporal evolution of aerosol particle acidity
Figure 1 and Table 1 present the aerosol particle pH over the period 1970–2020. We investigated the impacts of alkaline species by omitting the emissions of ammonia and mineral cations in two sensitivity simulations.
Table 1Decadal averages of aerosol particle pH.
1 Only values over land are considered for the calculation of pH. 2 Only values over oceans are considered for the calculation of pH.
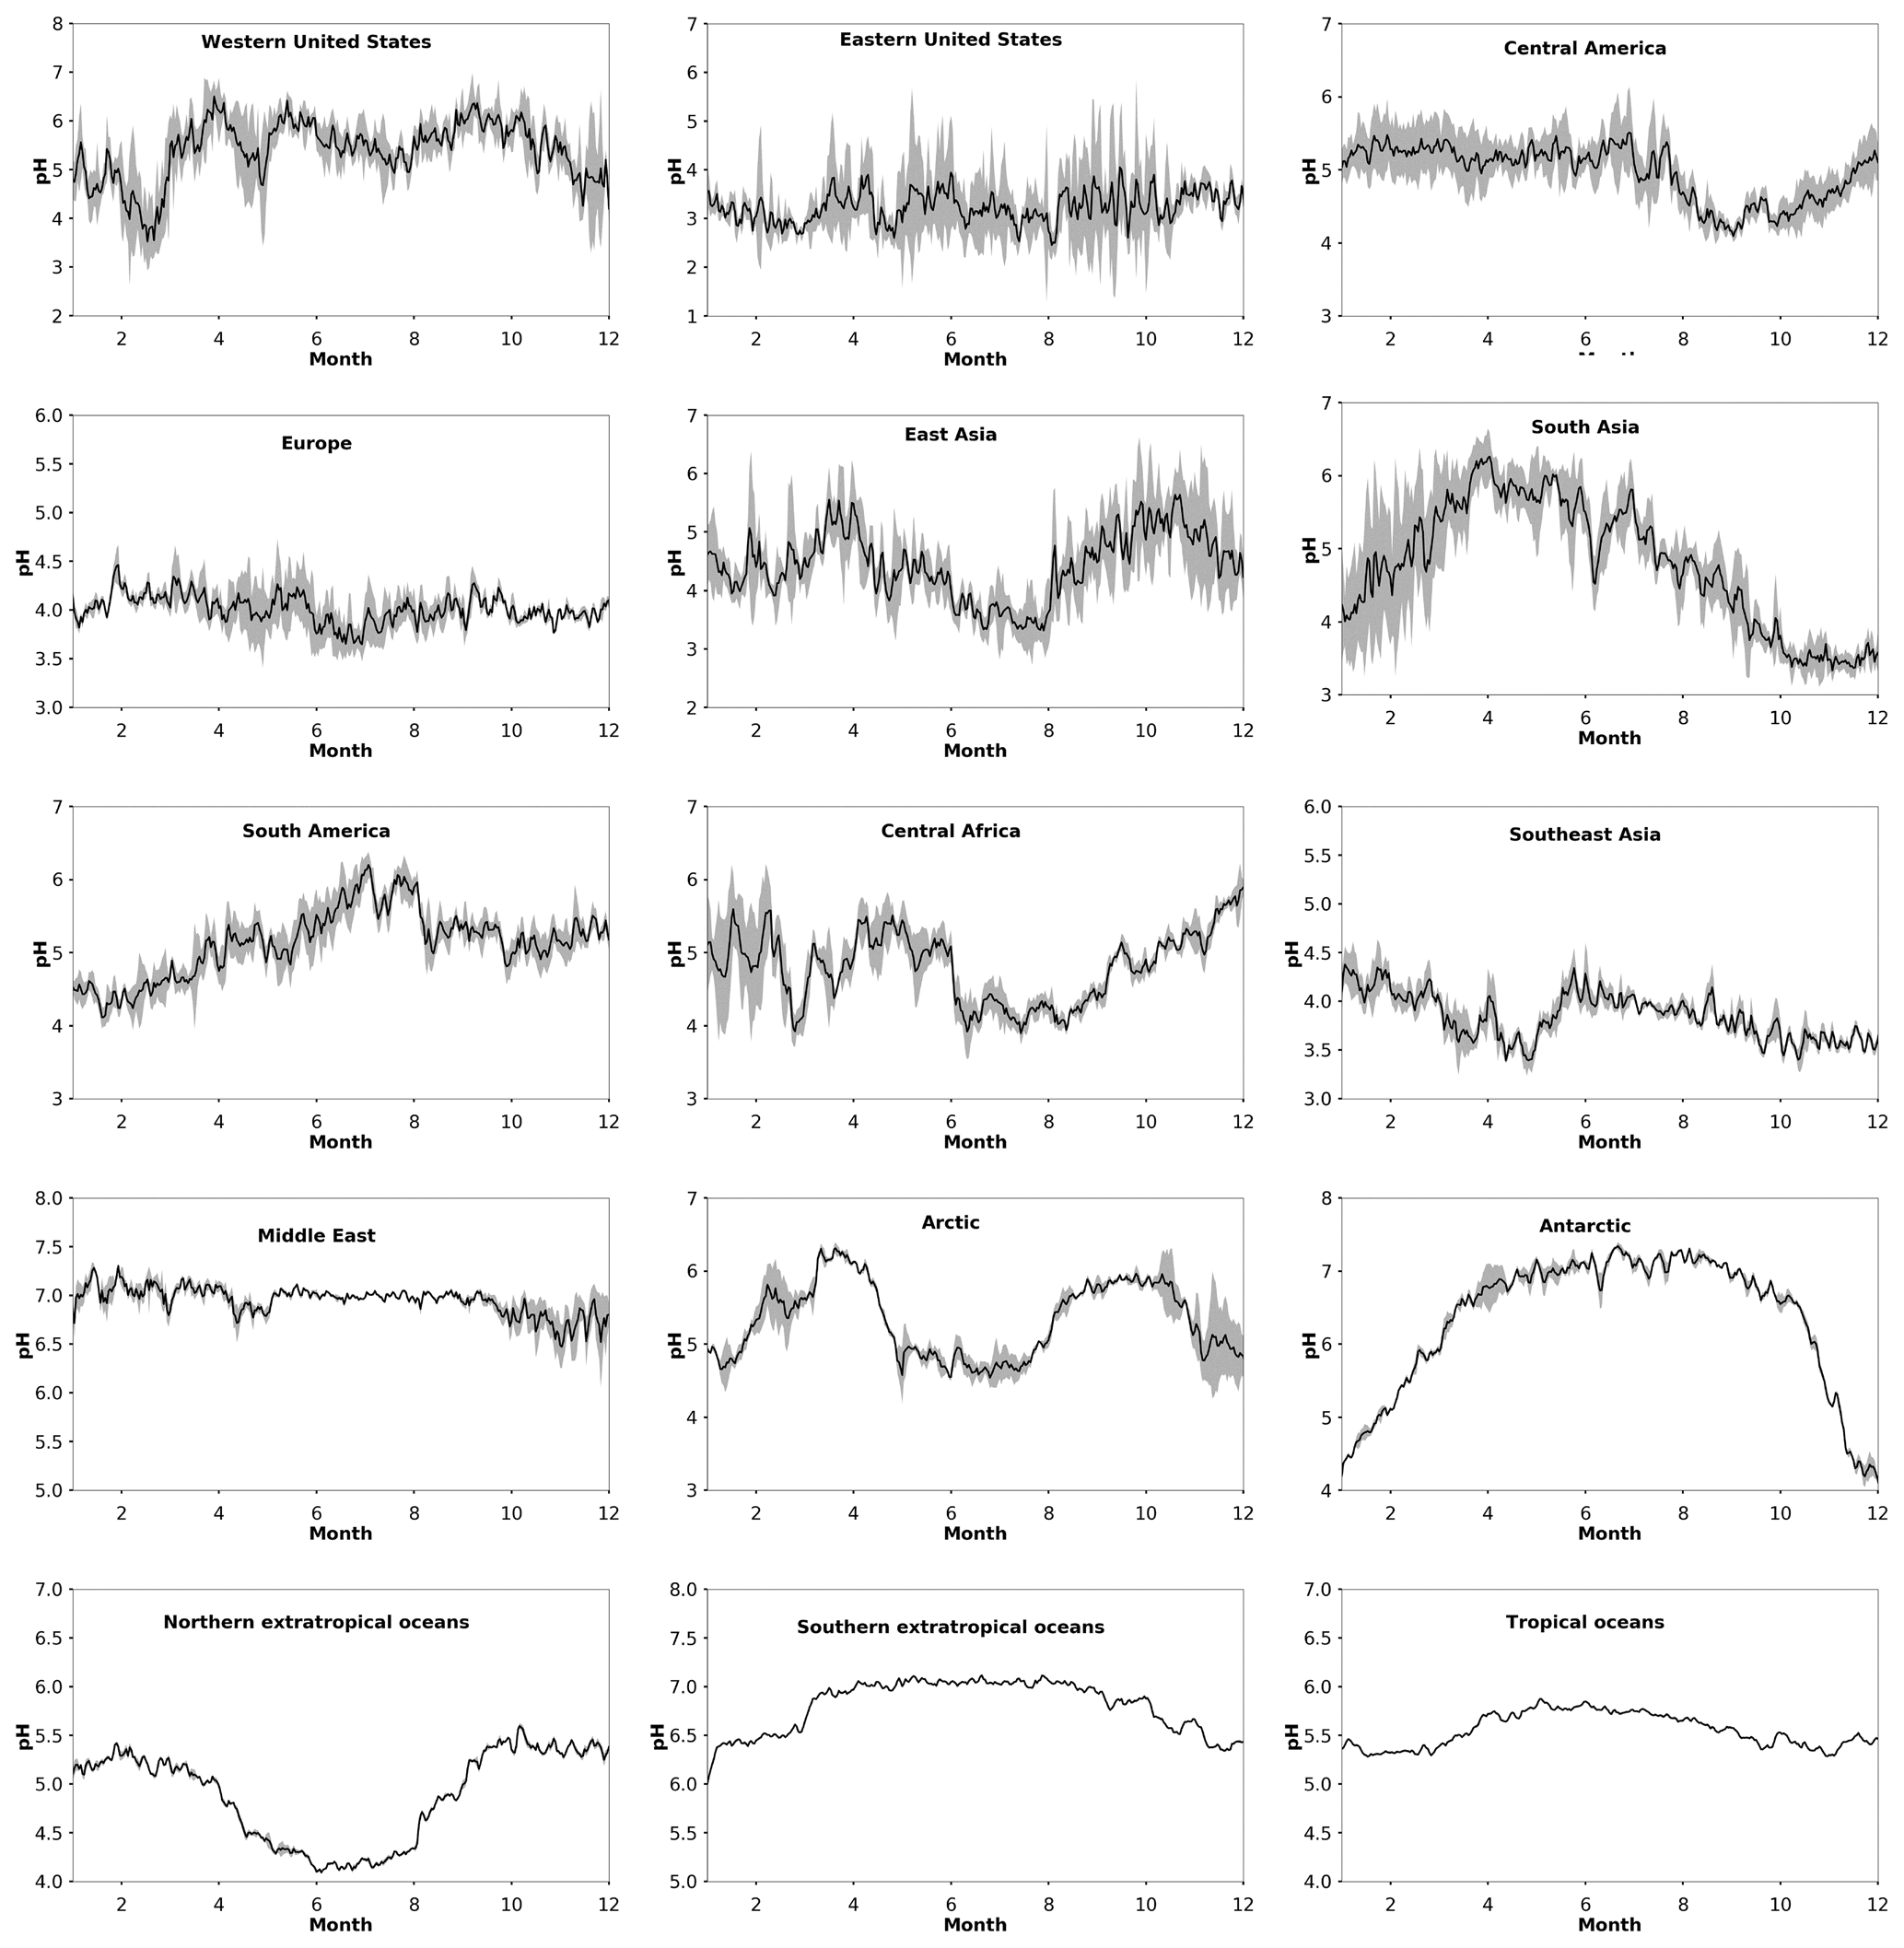
Figure 2Average seasonal cycle of modeled pH during the period 2010–2015 at locations defined in Table 1. Ranges represent the 1σ SD.
2.2.1 Europe
Over Europe, the pH has increased strongly from about 2.8 during the 1970s to 3.9 recently. Especially during the 1990s, NH3 emissions over Europe increased significantly by 14 %, while at the same time NOx and SO2 emissions decreased by 13 % and 49 %, respectively. While this trend has continued in the past decade, pH changes slowed because the sulfate and nitrate decreases have been compensated through volatilization of ammonia from the particles. In addition, the recently increasing cation / anion ratio is accompanied by a reduction of aerosol water, preventing a significant decrease in the particle acidity (Fig. S1 in the Supplement). Overall, the increase in aerosol particle pH by more than 1 unit during the last 50 years had a significant impact on the gas-particle partitioning of semi-volatile acids, e.g., nitric acid, since their dissociation into ions enhances their solubility (Nah et al., 2018). Here, the fraction of nitrate in the particle phase relative to total nitrate (gas plus particle) has increased from ∼70 % to 85 % (Fig. 3). The increase in particle pH has been accompanied by an increase in aerosol κ hygroscopicity (Fig. 4). After the substantial reduction of SO2 emissions, sulfate salts (e.g., ammonium sulfate with κ=0.53) are replaced by more hygroscopic nitrate salts (e.g., ammonium nitrate with κ=0.67) in the aerosol composition. In addition, the decrease in organic compound emissions during the last 50 years contributed to the increase in the aerosol hygroscopicity. Our sensitivity simulations reveal that particle acidity over Europe is highly sensitive to NH3 emissions. Despite the decline of both SO2 and NOx during the past decades, the particle would have remained highly acidic (pH ∼ 1) in the absence of NH3.

Figure 3Time evolution of particle-phase fraction of total nitrate as a function of pH over Europe (a), the eastern USA (b), and East Asia (c) during the period 1970–2020.
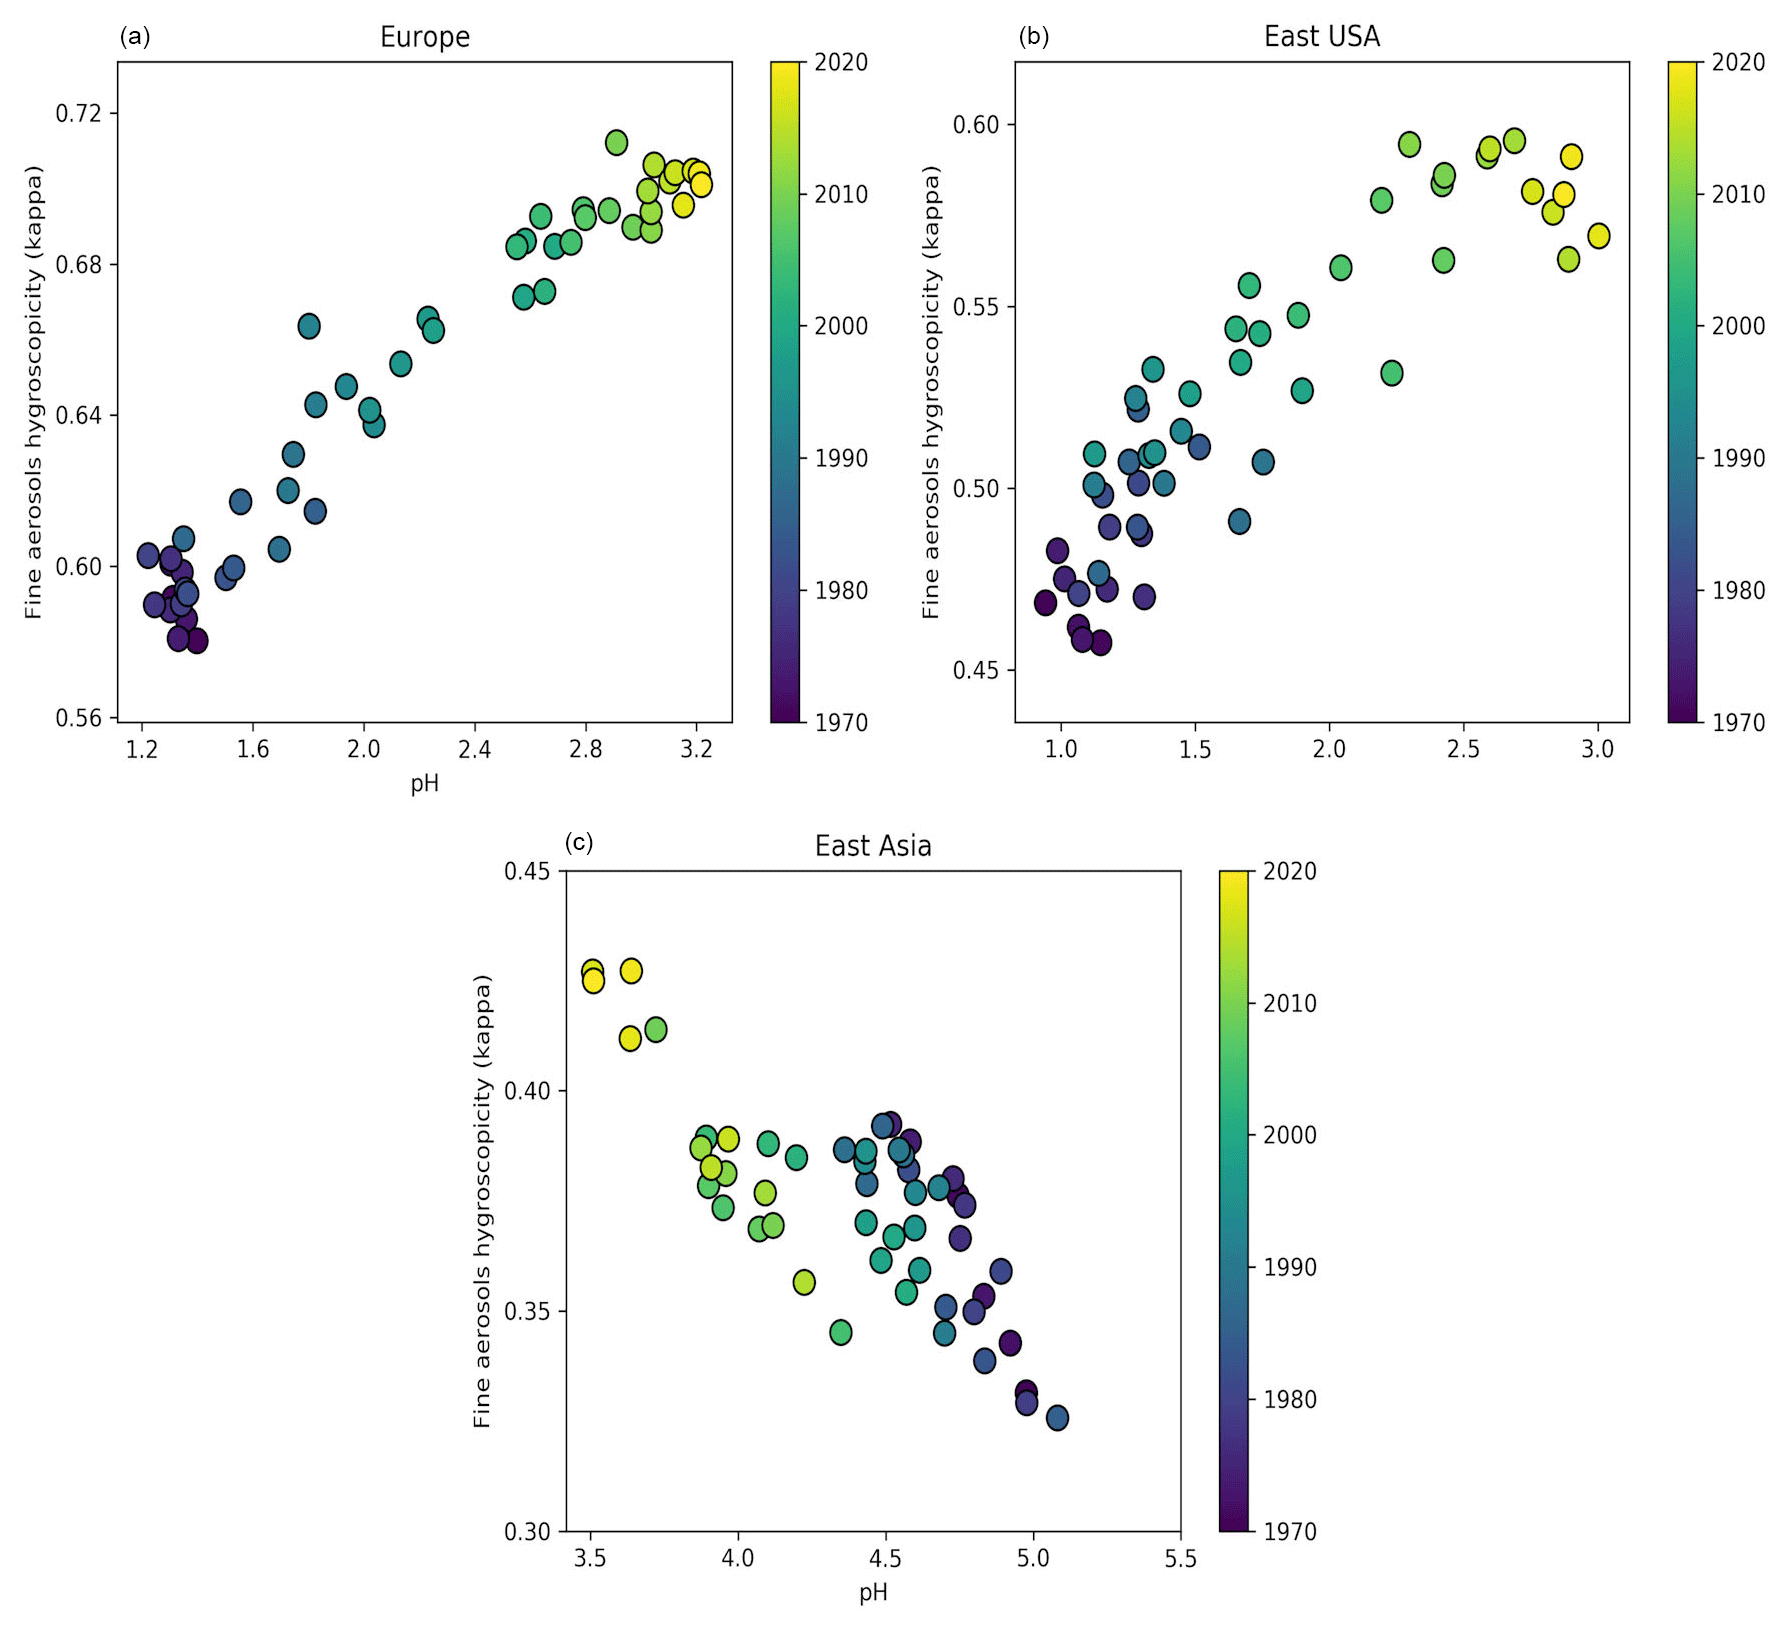
Figure 4Time evolution of annual average aerosol hygroscopicity (κ) as a function of pH over Europe (a), the eastern USA (b), and East Asia (c) during the period 1970–2020 at the lowest cloud-forming level (940 hPa).
2.2.2 North America
Over North America, particle acidity also decreased with SO2 and NOx emissions. Nevertheless, these emissions are still relatively strong in the eastern USA (5 times higher than in the western USA), resulting in very acidic particles, with a pH ranging from 2.2 in 1971 to 3.3 recently (Figs. 1 and S1). Such acidic conditions promote the dissolution of metals (e.g., Fe, Mn, Cu) in ambient particles (Fang et al., 2017). Soluble transition metals in atmospheric aerosols have been linked to adverse health impacts since they generate reactive oxygen species, leading to oxidative stress and increased toxicity of fine particulate matter (Fang et al., 2017; Park et al., 2018). Since the solubility of transition metals increases exponentially below a pH of 3, the decrease in particle acidity over the eastern USA reported here suggests that the particles have become substantially less toxic in the past few decades. Similarly to Europe, the increasing pH has resulted in a growing aerosol nitrate fraction from ∼50 % during the 1970s to 65 % recently (Fig. 3) and in a strong increase in aerosol hygroscopicity by ∼0.15 units at the cloud base (Fig. 4). The role of NH3 is critically important; without it the particle pH over the eastern USA would be close to zero. Over the western USA, the particle pH is higher (∼5), being affected by aeolian dust from the Great Basin Desert, although NH3 is still the most important alkaline buffer.
2.2.3 East and South Asia
In Asia, SO2 and NOx emissions have increased drastically since 1970. However, the simultaneous increase in NH3 emissions along with the presence of mineral dust from the surrounding deserts (i.e., Gobi, Taklimakan, Thar) decelerated the increase in particle acidity. Over East Asia, the particle pH decreased from about 5.3 during the 1970s to 4.5 in 2010. This change in particle acidity has affected the predominant pathway of sulfate formation through aerosol aqueous-phase chemistry. Under acidic conditions, SO2 is mainly oxidized by transition metal ions, while at pH > 5 the oxidation by O3 and NO2 predominates (Cheng et al., 2016). Therefore, the decrease in pH during the last 50 years, even though relatively modest, was sufficient to turn off sulfate production from O3 oxidation (Fig. 5). At the same time, the increased particle acidity hinders the partitioning of nitric acid to the particle phase, reducing the aerosol nitrate fraction from 90 % to 80 % (Fig. 3). Remarkably, the aerosol hygroscopicity has increased from ∼0.3 in the 1970s to 0.45 recently (Fig. 4), revealing a reverse development compared to Europe and the USA. Here, the fraction of mineral dust in the aerosol is higher; therefore, the particles gained hygroscopicity by the acquired pollution solutes. Recently, the SO2 emissions have dropped and the NOx emission increase has slowed in East Asia, while SO2 emissions are soaring in South Asia. SO2 emission trends since 2007 have been so drastic that inventories and scenarios tend to overestimate the emitted SO2. Satellite observations indicate that India has recently overtaken China as the world's largest emitter of SO2 (Li et al., 2017). Following the satellite observations, we implemented the significant SO2 reduction trends in our model (Fig. S2). Surprisingly, the effect only becomes noticeable over East Asia after 2016, when the particle pH started increasing by about 0.3 units, while we do not find any change over South Asia. This corroborates the strong buffering that we found over other regions such as Europe. Figure 1 shows that NH3 has been the major buffer, supporting the recent findings of Zheng et al. (2020) that the acid–base pair of provides the largest buffering capacity over East and South Asia. However, we also found that in East Asia and to a lesser extent in South Asia crustal elements, not considered in the study of Zheng et al. (2020), have contributed significantly to maintaining a mean pH of 4.5–5 in the past decade (Fig. 1). Calcium is the major crustal component of dust from the Gobi and Taklimakan deserts (Karydis et al., 2016), and unlike other crustal compounds it can react with sulfate ions and form insoluble CaSO4, which precipitates out of the aerosol aqueous phase. This interaction reduces the aqueous sulfate and thus the particle acidity.
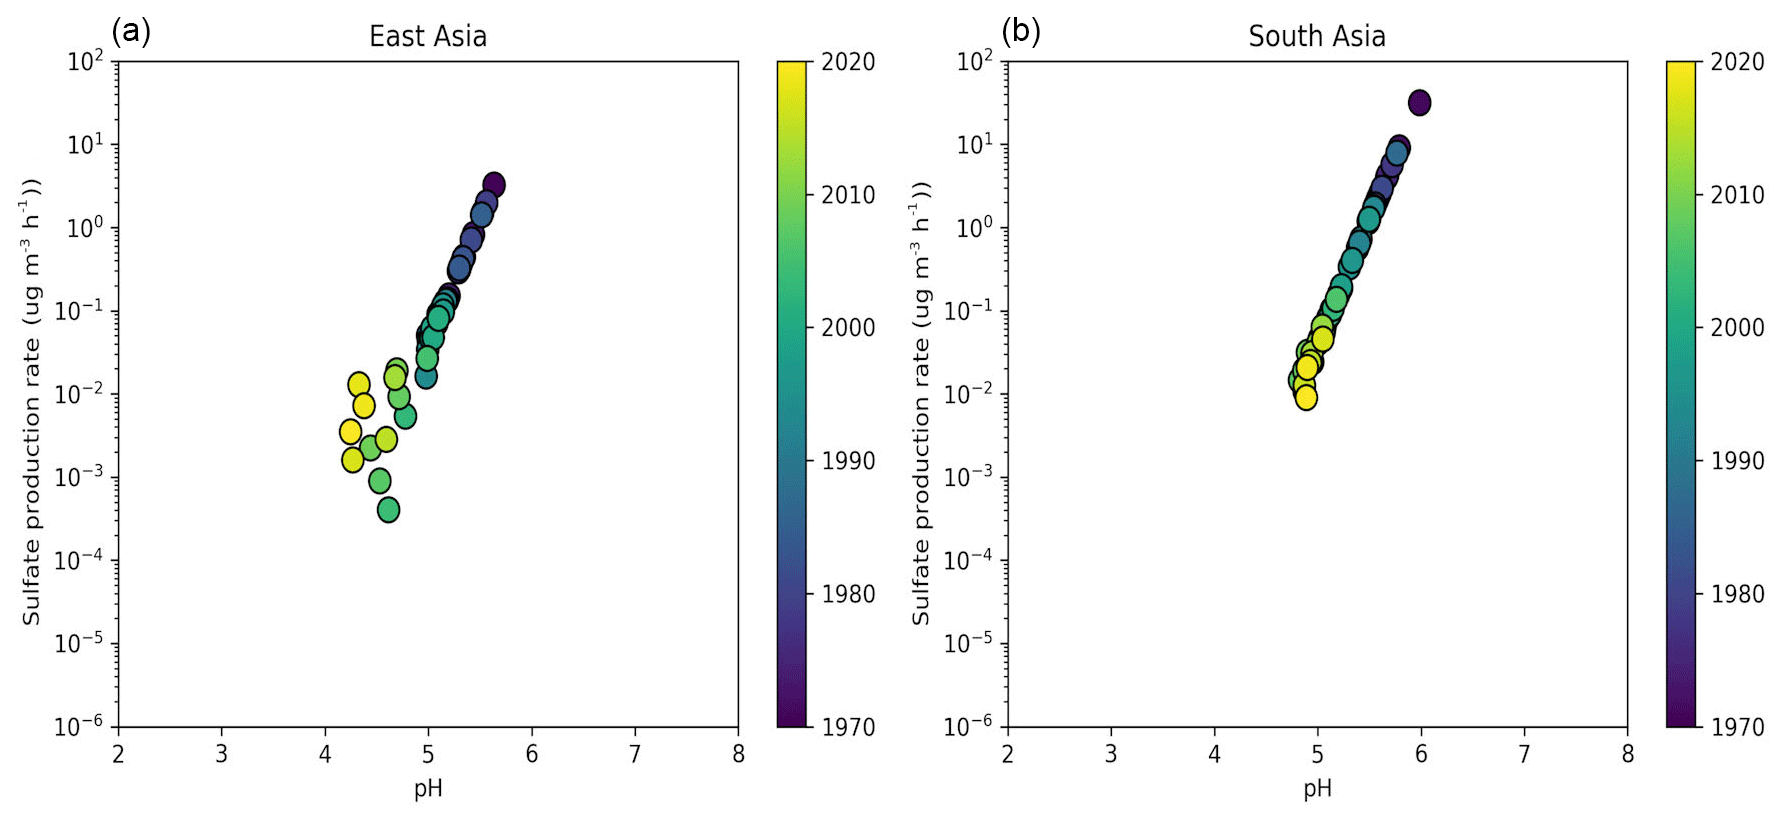
Figure 5Time evolution of the sulfate production rate on aqueous particles from the SO2 + O3 multiphase chemistry reaction as a function of aerosol particle pH over East Asia (a) and South Asia (b) during the period 1970–2020.
2.2.4 Tropical forests, Middle East
Over tropical forests, aerosol particles are typically not very acidic, with pH values > 4. Note that organic acids were not included in the particle pH calculations; however, their contribution to the total ionic load is small (Andreae et al., 1988; Falkovich et al., 2005), and particle acidity can be attributed to inorganic acids. Over the Amazon and Congo basins, the particle pH has remained around 5 since 1970. The Southeast Asian forest atmosphere is affected by pollution from mainland Asia, and the particle pH decreased to around 4 recently. This pH drop has enhanced SOA formation from isoprene, since under low-NOx conditions (typical over rainforests) the presence of acidifying sulfate increases the reactive uptake of epoxydiols (Xu et al., 2015; Surratt et al., 2010). Nevertheless, NH3 emissions provide a remarkably strong buffer over all three tropical regions, while mineral dust cations are also important over the Amazon and Congo forests. Further, the Middle East is affected by strong anthropogenic (fossil-fuel-related) and natural (aeolian dust) aerosol sources. Due to the high abundance of mineral dust, the pH has remained close to 7. Without crustal cations, the pH would drop to about 4. Despite the omnipresence of alkaline species from the surrounding deserts, NH3 still plays a central role in controlling the acidification of mineral dust aerosols, which can affect their hygroscopic growth and hence their climate forcing (Klingmüller et al., 2019, 2020).
2.2.5 Oceans
Over the Arctic and northern extratropical oceans, particle acidity is strongly affected by pollution transport from the urban-industrial mid-latitudes. The Arctic particle pH is highly variable, remaining relatively low up to 1990 (∼4.2), after which it increased to about 5.2. Crustal cations are found to play a significant role in lowering the particle acidity. Over the northern extratropical oceans, particle pH has remained relatively constant (∼4.8). NH3 provides an important alkaline buffer, and without it the particle pH would have been below 3. NH3 is also proven to be important over the tropical and southern extratropical oceans, where a noticeable increase in aerosol particle acidity occurred after June 1991, when the eruption of Mount Pinatubo in the Philippines released ∼20 million tons of SO2 into the stratosphere (McCormick et al., 1995). The impact of Pinatubo sulfate, after returning to the troposphere, on particle acidity is mostly evident over Antarctica, where the pH dropped by 2 units, as the stratospheric circulation is strongest in the winter hemisphere. Over Antarctica concentrations of dust and especially of NH3 are very low, and Fig. 1 illustrates that only in this pristine environment could the large Pinatubo anomaly overwhelm the buffering by alkaline species. Except after Pinatubo, the pH has remained nearly constant at 5.8 over Antarctica and about 5.5 in the tropics and 6.8 in the southern extratropics.
We find that over Europe and North America the aerosol particle acidity decreased strongly in the past few decades, resulting in substantially less toxic and more hygroscopic aerosols. At the same time, the particle acidity over Asia has increased, even though the increase in NH3 emissions and the presence of mineral dust decelerated the change in the particle pH. The inevitable decrease in the particle pH hindered the partitioning of nitric acid into the particulate phase and the sulfate production in the aerosol aqueous phase; however, the aerosol hygroscopicity increased over Asia following a reverse correlation with the particle pH. Overall, the aerosol particle pH is generally well-buffered by alkaline compounds, notably NH3 and, in some areas, crustal elements. NH3 is found to supply a remarkable buffering capacity on a global scale from the polluted continents to the remote oceans. In the absence of NH3, aerosol particles would be highly (to extremely) acidic in most of the world. Therefore, potential future changes in NH3 are critically important in this respect. Agriculture is the main NH3 source and a controlling factor in fine particle concentrations and health impacts in some areas (e.g., Europe) (Pozzer et al., 2017). The control of agricultural ammonia emissions must therefore be accompanied by very strong reductions of SO2 and NOx to avoid aerosol particles becoming highly acidic, with implications for human health (aerosol toxicity), ecosystems (acid deposition and nutrient availability), and clouds and climate (aerosol hygroscopicity).
A1 Aerosol–chemistry–climate model
We used the EMAC model, which is a numerical chemistry and climate simulation system that describes lower- and middle-atmosphere processes (Jöckel et al., 2006). EMAC uses the Modular Earth Submodel System (MESSy2) (Jöckel et al., 2010) to link the different submodels with an atmospheric dynamical core, being an updated version of the 5th generation European Centre – Hamburg general circulation model (ECHAM5) (Roeckner et al., 2006). EMAC has been extensively described and evaluated against in situ observations and satellite retrievals to compute particulate matter concentrations and composition, aerosol optical depth, acid deposition, gas-phase mixing ratios, cloud properties, and meteorological parameters (Karydis et al., 2016, 2017; Pozzer et al., 2012; Tsimpidi et al., 2016; Bacer et al., 2018). The spectral resolution of EMAC used in this study is T63L31, corresponding to a horizontal grid resolution of approximately and 31 vertical layers extending up to 10 hPa (i.e., 25 km) from the surface. The presented model simulations encompass the 50-year period 1970–2020.
EMAC calculates fields of gas-phase species online through the Module Efficiently Calculating the Chemistry of the Atmosphere (MECCA) submodel (Sander et al., 2019). MECCA calculates the concentration of a range of gases, including aerosol precursor species (e.g., SO2, NH3, NOx, DMS, H2SO4, and DMSO) and the major oxidant species (e.g., OH, H2O2, NO3, and O3). Aerosol microphysics are calculated by the Global Modal-aerosol eXtension (GMXe) module (Pringle et al., 2010). The organic aerosol formation and atmospheric evolution are calculated by the ORACLE submodel (Tsimpidi et al., 2014, 2018). The aerosol size distribution is described by seven lognormal modes: four hydrophilic modes that cover the aerosol size spectrum of nucleation, Aitken, accumulation, and coarse modes and three hydrophobic modes that cover the same size range except nucleation. The aerosol composition within each size mode is uniform (internally mixed); however, it varies between modes (externally mixed). Each mode is defined in terms of total number concentration, number mean radius, and geometric standard deviation (Pringle et al., 2010). The removal of gas and aerosol species through wet and dry deposition is calculated within the SCAV (Tost et al., 2006) and DRYDEP (Kerkweg et al., 2006) submodels, respectively. The sedimentation of aerosols is calculated within the SEDI submodel (Kerkweg et al., 2006). The cloud cover, microphysics, and precipitation of large-scale clouds is calculated by the CLOUD submodel (Roeckner et al., 2006), which uses a two-moment stratiform microphysical scheme (Lohmann and Ferrachat, 2010) and describes liquid droplet (Karydis et al., 2017) and ice crystal (Bacer et al., 2018) formation by accounting for the aerosol physicochemical properties. The effective hygroscopicity parameter κ is used to describe the influence of chemical composition on the cloud condensation nuclei (CCN) activity of atmospheric aerosols. κ is calculated using the mixing rule of Petters and Kreidenweis (2007) and the individual κ parameter values for each inorganic salt (Petters and Kreidenweis, 2007; Sullivan et al., 2009). Organic aerosol species are assumed to have a constant hygroscopicity κ parameter of 0.14, while bulk mineral dust and black carbon are assumed to have zero hygroscopicity.
A2 Emissions
The vertically distributed (Pozzer et al., 2009) CMIP5 RCP8.5 emission inventory (van Vuuren et al., 2011) is used for the anthropogenic and biomass burning emissions during the years 1970–2020. Direct emissions of aerosol components from biofuel and open biomass burning are considered by using scaling factors applied to the emitted black carbon based on the findings of Akagi et al. (2011) (Table S1 in the Supplement). Dust emission fluxes and emissions of crustal species (Ca2+, Mg2+, K+, Na+) are calculated online as described by Klingmüller et al. (2018) and based on the chemical composition of the emitted soil particles in every grid cell (Karydis et al., 2016); Table S2. NOx produced by lightning is calculated online and distributed vertically based on the parameterization of Grewe et al. (2001). The emissions of NO from soils are calculated online based on the algorithm of Yienger and Levy (1995). The oceanic DMS emissions are calculated online by the AIRSEA submodel (Pozzer et al., 2006). The natural emissions of NH3 are based on the GEIA database (Bouwman et al., 1997). Emissions of sea spray aerosols (assuming a composition suggested by Seinfeld and Pandis, 2006; Table S1) and volcanic degassing emissions of SO2 are based on the offline emission data set of AEROCOM (Dentener et al., 2006).
A3 Thermodynamic model
The inorganic aerosol composition, which is of prime importance for the accurate pH calculation, is computed with the ISORROPIA-II thermodynamic equilibrium model (Fountoukis and Nenes, 2007). ISORROPIA-II calculates the gas/liquid/solid equilibrium partitioning of the K+–Ca2+–Mg2+––Na+–––Cl−–H2O aerosol system and considers the presence of 15 aqueous-phase components and 19 salts in the solid phase. ISORROPIA-II solves for the equilibrium state by considering the chemical potential of the species and minimizes the number of equations and iterations required by considering specific compositional “regimes”. The assumption of thermodynamic equilibrium is a good approximation for fine-mode aerosols that rapidly reach equilibrium. However, the equilibrium timescale for large particles is typically larger than the time step of the model (Meng and Seinfeld, 1996), leading to errors in the size distribution of semi-volatile ions like nitrate. Since the current study includes reactions of nitric acid with coarse sea-salt and dust aerosol cations, the competition of fine and coarse particles for the available nitric acid can only be accurately represented by taking into account the kinetic limitations during condensation of HNO3 in the coarse-mode aerosols. To account for kinetic limitations by mass transfer and transport between the gas and particle phases, the process of gas/aerosol partitioning is calculated in two stages (Pringle et al., 2010). First, the gaseous species that kinetically condense onto the aerosol phase within the model time step are calculated assuming diffusion-limited condensation (Vignati et al., 2004). Then, ISORROPIA-II re-distributes the mass between the gas and aerosol phases assuming instant equilibrium between the two phases.
ISORROPIA-II is used in the forward mode, in which the total (i.e., gas and aerosol) concentrations are given as input. Reverse-mode calculations (i.e., when only the aerosol-phase composition is known) should be avoided since they are sensitive to errors and infer bimodal behavior with highly acidic or highly alkaline particles, depending on whether anions or cations are in excess (Song et al., 2018). While it is often assumed that aerosols are in a metastable state (i.e., composed only of a supersaturated aqueous phase), here we use ISORROPIA-II in the thermodynamically stable-state mode where salts are allowed to precipitate once the aqueous phase becomes saturated. For this purpose, we have used the revised ISORROPIA-II model which includes modifications proposed by Song et al. (2018), who resolved coding errors related to pH calculations when the stable-state assumption is used. By comparing with the benchmark thermodynamic model E-AIM, Song et al. (2018) found that ISORROPIA-II produces somewhat higher pH (by 0.1–0.7 units, negatively correlated with RH). However, E-AIM model versions either lack crustal cations from the ambient mixture of components (e.g., version II) (Clegg et al., 1998) or only include Na+ with the restriction that it should be used when RH > 60 % (e.g., version IV) (Friese and Ebel, 2010). Song et al. (2018) applied the revised ISORROPIA-II during winter haze events in eastern China and found that the assumed particle-phase state, either stable or metastable, does not significantly impact the pH predictions.
We performed a sensitivity simulation with only liquid particles (i.e., metastable), which revealed that the assumed particle-phase state does not significantly impact the pH calculations over oceans and polluted regions (e.g., Europe); however, the metastable assumption produces more acidic particles (up to 2 units of pH) in regions affected by high concentrations of crustal cations and consistently low RH values (Fig. S3). Fountoukis and Nenes (2007) have shown that the metastable solution predicts significant amounts of water below the mutual deliquescence relative humidity (MDRH, where all salts are simultaneously saturated with respect to all the components). Further, the generally high calcium concentrations downwind of deserts result in increasing pH values due to the precipitation of insoluble salts such as the CaSO4. The metastable-state assumption fails to reproduce this since it only treats the ions in the aqueous phase. In general, high amounts of crustal species can significantly increase the particle pH, which is consistent with the presence of excess carbonate in the particle phase (Meng et al., 1995). It is worth mentioning that the stable-state solution algorithm of ISORROPIA II starts with assuming a dry aerosol and based on the ambient RH dissolves each of the salts depending on their DRH. However, in the ambient atmosphere, when the RH over a wet particle is decreasing, it may not crystallize below the MDRH but instead remain in a metastable state affecting the uptake of water by the particle and thus the pH. This could be the case in some locations with high diurnal variations of RH. Our sensitivity calculations show that, overall, the stable-state assumption produces an about 0.5 units higher global average pH than the metastable assumption. Karydis et al. (2016) have shown that while the aerosol-state assumption has a marginal effect on the calculated nitrate aerosol tropospheric burden (2 % change), it can be important over and downwind of deserts at very low RHs, where nitrate is reduced by up to 60 % by using the metastable assumption. This is in accordance with the findings of Ansari and Pandis (2000), who suggested that the stable state results in higher concentrations of aerosol nitrate when the RH is low (<35 %) and/or sulfate-to-nitrate molar ratios are low (<0.25).
A4 pH calculations
The pH is defined as the negative decimal logarithm of the hydrogen ion activity () in a solution:
where is the molality of hydrogen ions in the solution and γ is the ion activity coefficient of hydrogen. Assuming that γ is unity, the aerosol particle pH can be calculated by using the hydrogen ion concentration in the aqueous particle phase calculated by ISORROPIA-II (in molec m−3) and the aerosol water content calculated by GMXe (in molec kg−1). GMXe assumes that particle modes are internally mixed and takes into account the contribution of both inorganic and organic (based on the organic hygroscopicity parameter, κ=0.14; Tsimpidi et al., 2014) species to aerosol water.
The aerosol particle pH is calculated online at each time step and output stored every 5 h based on instantaneous concentrations of fine aerosol water and hydrogen ions. The average pH values shown in the paper are based on the calculated instantaneous mean pH values. According to Jensen's inequality (Jensen, 1906), the average of the instantaneous pH values is less than or equal to the pH calculated based on the average of the water and hydrogen ion instantaneous values. We estimate that the average pH calculated based on 5-hourly instantaneous values is approximately 1–3 (∼2 globally averaged) units higher than the pH calculated based on the average water and hydrogen ion concentrations. By including online gas-particle partitioning calculations of the system in polluted air, as applied here, we find that the particle pH is higher by approximately 1 unit (Guo et al., 2015). Hence by neglecting these aspects the particle pH would be low-biased by about 3 units.
A5 Comparison against pH estimations from field-derived PM2.5 compositional data
The pH calculated here is compared against pH estimations from field-derived PM2.5 compositional data around the world compiled by Pye et al. (2020) (Table A1). pH data derived from other particle sizes (e.g., PM1) have been omitted since particle acidity can vary significantly with size (Kakavas et al., 2021). It should be emphasized that the comparison presented in Table A1 aims to corroborate the spatial variability of pH found in this study and not to evaluate the model calculations. Since direct measurements of particle acidity are not available, the observation-based particle pH is estimated by employing thermodynamic equilibrium models (e.g., ISORROPIA) and making assumptions that can significantly affect the results, especially when the data are averaged over extended periods, while RH conditions during data collection are not always accounted for, e.g., in studies based on filter sampling. The calculation of aerosol particle acidity on a global scale requires the advanced treatment of atmospheric aerosol chemical complexity, representing the real atmosphere, and beyond the conventional methods used by chemistry–climate models (CCMs). The atmospheric chemistry model system EMAC is an ideal tool for this purpose since it is one of the most comprehensive CCMs containing advanced descriptions of the aerosol thermodynamics (including, e.g., dust–pollution interactions) and organic aerosol formation and atmospheric aging (affecting the aerosol water). Our model calculations for aerosol particle acidity are based on some processes/factors that are not included explicitly, usually neglected by model calculations used to constrain the particle acidity from observations. Sources of discrepancy between the pH calculations can be the following.
-
The stable/metastable assumption does not affect the pH most of the time; however, in some cases with low RHs and the presence of crustal cations, the metastable assumption results in lower pHs (see Sect. 4.3).
-
Crustal species from deserts and Na+ from sea salt can elevate the pH significantly in some locations; however, these are often neglected in observations.
-
The organic aerosols (which are treated comprehensively by our model using the module ORACLE and the volatility basis set framework; Tsimpidi et al., 2014) can contribute significantly to the aerosol water and thus increase the particle pH. This contribution is not considered by many observational studies.
-
Including gas-phase species (e.g., NH3, HNO3) in the pH calculations is important. Using only the aerosol phase as input (i.e., reverse mode), the inferred pH exhibits bimodal behavior with very acidic or alkaline values depending on whether anions or cations are in excess (Hennigan et al., 2015). Even if the forward mode is used (without gas-phase input), the calculated particle pH is biased low (approximately 1 pH unit) due to the repartition of semi-volatile anions (i.e., NH3) to the gas phase to establish equilibrium (Guo et al., 2015).
-
Another important aspect, not explicitly mentioned in many studies, relates to the methods used to derive the campaign-average (or for 3D models the simulated average) pH. In our model the particle pH is calculated online (2 min time resolution), while output is stored every 5 h based on instantaneous concentrations of fine-particle H2O and H+. This mimics 5-hourly aerosol sampling. Then, the average pH values are calculated from the instantaneous mean pH values (see Sect. 4.4). Often models use average values (and not instantaneous ones) as output, or field-derived pH calculations use average observed H2O and H+ values, which can result in important underestimation (by ∼1–3 units) of the particle pH (Jensen, 1906).
-
Some unrealistically high pH values in a few past studies resulted from coding errors in the stable-state assumption of the ISORROPIA II model, which have been corrected in our study following the recommendation of Song et al. (2018).
-
The type of thermodynamic model used is also important. Song et al. (2018) found that ISORROPIA-II produces somewhat higher pH (by 0.1–0.7 units, negatively correlated with RH) compared to the thermodynamic model E-AIM, which is used to observationally constrain pH in some studies.
-
Measurements of PM2.5 nitrate are not always reliable because of artifacts associated with the volatility of ammonium nitrate (Schaap et al., 2004). Ammonium and nitrate can partially evaporate from Teflon filters at temperatures between 15 and 20 ∘C and can evaporate completely at temperatures above. The evaporation from quartz filters is also significant at temperatures higher than 20 ∘C. This systematic underestimation of ammonium nitrate can affect the observed chemical composition of the aerosol and thus the pH calculations.
-
The comparison between global model output and observations at specific locations. This also concerns the aerosol concentrations but is especially important for the aerosol particle acidity. Apart from the size of the model grid cells (i.e., ), the altitude is also important. The first vertical layer of EMAC is approximately 67 m in height. On the other hand, ground observations are typically collected at a height up to 3 m. While the aerosol particles within size modes simulated in our model are well-mixed, perhaps this is not the case for the aerosol particles observed at the surface and potentially close to sources, and thus the particle acidity may be higher (e.g., due to the higher contribution from local primary sources like , lower water amounts in the aerosol, or lower concentrations of semi-volatile cations like ).
A6 Partitioning of nitric acid between the gas and aerosol phases
The impact of pH on the fraction of nitrate in the particle phase relative to total nitrate (gas plus particle), i.e., ε(), during the 50 years of simulation in specific regions is calculated as follows (Nah et al., 2018):
where is the combined molality-based equilibrium constant of HNO3 dissolution and deprotonation, γs represent the activity coefficients, W is the aerosol water, R is the gas constant, and T is the ambient temperature. Equation (A2) is equivalent to the instantaneous calculations of ISOROPIA II within EMAC. However, the model output is produced after considering all processes in the model and is not calculated at every time step. Therefore, the use of Eq. (2) can provide a clearer picture of the impact of pH on HNO3 gas/particle partitioning since the model output (e.g., gas-phase HNO3 and nitrate in four size modes) is subject to uncertainties related to other processes (e.g., deposition, coagulation, transport).
A7 Sulfate formation in aqueous aerosols
The sulfate production rate on aqueous particles from the heterogeneous oxidation of S(IV) with the dissolved O3 is given by
The first-order uptake rate, k, from monodisperse aerosols with radius ra and total aerosol surface A is calculated following Jacob (2000):
where υ is the mean molecular speed of O3 and Dg is its gas-phase molecular diffusion coefficient calculated as follows:
where T is the ambient air temperature, ρair is the air density, and M the molar mass of O3. γ is the reaction probability calculated following Jacob (2000) and Shao et al. (2019).
where α is the mass accommodation coefficient, Da is the aqueous-phase molecular diffusion coefficient of O3, H is the effective Henry's law constant of O3 (Sander, 2015), R is the ideal gas constant, fr is the reacto-diffusive correction term (Shao et al., 2019), and K is the pseudo-first-order reaction rate constant between S(IV) and O3 in the aqueous phase (Seinfeld and Pandis, 2006).
Table A1Simulated fine aerosol particle pH compared to observationally constrained estimates of fine particle acidity compiled by Pye et al. (2020).
Data and related material can be obtained from Vlassis A. Karydis (v.karydis@fz-juelich.de) upon request.
The supplement related to this article is available online at: https://doi.org/10.5194/acp-21-14983-2021-supplement.
VAK and JL planned the research. VAK, APT, and AP performed the model calculations. VAK, AP, and JL analyzed the results. VAK and JL wrote the paper. All the authors contributed to the manuscript.
The authors declare that they have no conflict of interest.
Publisher's note: Copernicus Publications remains neutral with regard to jurisdictional claims in published maps and institutional affiliations.
This article is part of the special issue “The Modular Earth Submodel System (MESSy) (ACP/GMD inter-journal SI)”. It is not associated with a conference.
The authors were granted computing time on the supercomputer GAIA at the Max Planck Institute for Chemistry, Mainz, and on the supercomputer JURECA through JARA at the Forschungszentrum Jülich. The work of Vlassis A. Karydis is supported by the European Union via its Horizon 2020 project FORCeS (GA 821205).
The article processing charges for this open-access publication were covered by the Forschungszentrum Jülich.
This paper was edited by Ken Carslaw and Maria Kanakidou and reviewed by two anonymous referees.
Abdelkader, M., Metzger, S., Mamouri, R. E., Astitha, M., Barrie, L., Levin, Z., and Lelieveld, J.: Dust-air pollution dynamics over the eastern Mediterranean, Atmos.Chem. Phys., 15, 9173–9189, https://doi.org/10.5194/acp-15-9173-2015, 2015.
Akagi, S. K., Yokelson, R. J., Wiedinmyer, C., Alvarado, M. J., Reid, J. S., Karl, T., Crounse, J. D., and Wennberg, P. O.: Emission factors for open and domestic biomass burning for use in atmospheric models, Atmos. Chem. Phys., 11, 4039–4072, https://doi.org/10.5194/acp-11-4039-2011, 2011.
Andreae, M. O., Talbot, R. W., Andreae, T. W., and Harriss, R. C.: Formic and acetic-acid over the central Amazon region, Brazil. 1. dry season, J. Geophys. Res.-Atmos., 93, 1616–1624, https://doi.org/10.1029/JD093iD02p01616, 1988.
Ansari, A. S. and Pandis, S. N.: The effect of metastable equilibrium states on the partitioning of nitrate between the gas and aerosol phases, Atmos. Environ., 34, 157–168, https://doi.org/10.1016/s1352-2310(99)00242-3, 2000.
Bacer, S., Sullivan, S. C., Karydis, V. A., Barahona, D., Kramer, M., Nenes, A., Tost, H., Tsimpidi, A. P., Lelieveld, J., and Pozzer, A.: Implementation of a comprehensive ice crystal formation parameterization for cirrus and mixed-phase clouds in the EMAC model (based on MESSy 2.53), Geosci. Model Dev., 11, 4021–4041, https://doi.org/10.5194/gmd-11-4021-2018, 2018.
Behera, S. N., Betha, R., Liu, P., and Balasubramanian, R.: A study of diurnal variations of PM2.5 acidity and related chemical species using a new thermodynamic equilibrium model, Sci. Total Environ., 452–453, 286–295, https://doi.org/10.1016/j.scitotenv.2013.02.062, 2013.
Bouwman, A. F., Lee, D. S., Asman, W. A. H., Dentener, F. J., VanderHoek, K. W., and Olivier, J. G. J.: A global high-resolution emission inventory for ammonia, Global Biogeochem. Cy., 11, 561–587, https://doi.org/10.1029/97gb02266, 1997.
Cheng, Y. F., Zheng, G. J., Wei, C., Mu, Q., Zheng, B., Wang, Z. B., Gao, M., Zhang, Q., He, K. B., Carmichael, G., Poschl, U., and Su, H.: Reactive nitrogen chemistry in aerosol water as a source of sulfate during haze events in China, Sci. Adv., 2, e1601530, https://doi.org/10.1126/sciadv.1601530, 2016.
Clegg, S. L., Brimblecombe, P., and Wexler, A. S.: Thermodynamic model of the system H+–NH4+–Na+––NB3−–Cl−–H2O at 298.15 K, J. Phys. Chem. A, 102, 2155–2171, https://doi.org/10.1021/jp973043j, 1998.
Craig, R. L., Peterson, P. K., Nandy, L., Lei, Z., Hossain, M. A., Camarena, S., Dodson, R. A., Cook, R. D., Dutcher, C. S., and Ault, A. P.: Direct Determination of Aerosol pH: Size-Resolved Measurements of Submicrometer and Supermicrometer Aqueous Particles, Anal. Chem., 90, 11232–11239, https://doi.org/10.1021/acs.analchem.8b00586, 2018.
Dall'Osto, M., Airs, R. L., Beale, R., Cree, C., Fitzsimons, M. F., Beddows, D., Harrison, R. M., Ceburnis, D., O'Dowd, C., Rinaldi, M., Paglione, M., Nenes, A., Decesari, S., and Simó, R.: Simultaneous Detection of Alkylamines in the Surface Ocean and Atmosphere of the Antarctic Sympagic Environment, ACS Earth Space Chem., 3, 854–862, https://doi.org/10.1021/acsearthspacechem.9b00028, 2019.
Dentener, F., Kinne, S., Bond, T., Boucher, O., Cofala, J., Generoso, S., Ginoux, P., Gong, S., Hoelzemann, J. J., Ito, A., Marelli, L., Penner, J. E., Putaud, J.-P., Textor, C., Schulz, M., van der Werf, G. R., and Wilson, J.: Emissions of primary aerosol and precursor gases in the years 2000 and 1750 prescribed data-sets for AeroCom, Atmos. Chem. Phys., 6, 4321–4344, https://doi.org/10.5194/acp-6-4321-2006, 2006.
Ding, J., Zhao, P., Su, J., Dong, Q., Du, X., and Zhang, Y.: Aerosol pH and its driving factors in Beijing, Atmos. Chem. Phys., 19, 7939–7954, https://doi.org/10.5194/acp-19-7939-2019, 2019.
Falkovich, A. H., Graber, E. R., Schkolnik, G., Rudich, Y., Maenhaut, W., and Artaxo, P.: Low molecular weight organic acids in aerosol particles from Rondonia, Brazil, during the biomass-burning, transition and wet periods, Atmos. Chem. Phys. 5, 781–797, https://doi.org/10.5194/acp-5-781-2005, 2005.
Fang, T., Guo, H. Y., Zeng, L. H., Verma, V., Nenes, A., and Weber, R. J.: Highly Acidic Ambient Particles, Soluble Metals, and Oxidative Potential: A Link between Sulfate and Aerosol Toxicity, Environ. Sci. Technol., 51, 2611–2620, https://doi.org/10.1021/acs.est.6b06151, 2017.
Fountoukis, C. and Nenes, A.: ISORROPIA II: a computationally efficient thermodynamic equilibrium model for K+–Ca2+–Mg2+–NH4+–Na+––NO3−–Cl−–H2O aerosols, Atmos. Chem. Phys., 7, 4639–4659, https://doi.org/10.5194/acp-7-4639-2007, 2007.
Fridlind, A. M. and Jacobson, M. Z.: A study of gas-aerosol equilibrium and aerosol pH in the remote marine boundary layer during the First Aerosol Characterization Experiment (ACE 1), J. Geophys. Res.-Atmos., 105, 17325–17340, https://doi.org/10.1029/2000JD900209, 2000.
Friese, E. and Ebel, A.: Temperature Dependent Thermodynamic Model of the System H+–NH4+–Na+––NO3−–Cl−–H2O, J. Phys. Chem. A, 114, 11595–11631, https://doi.org/10.1021/jp101041j, 2010.
Grewe, V., Brunner, D., Dameris, M., Grenfell, J. L., Hein, R., Shindell, D., and Staehelin, J.: Origin and variability of upper tropospheric nitrogen oxides and ozone at northern mid-latitudes, Atmos. Environ., 35, 3421–3433, https://doi.org/10.1016/s1352-2310(01)00134-0, 2001.
Guo, H., Xu, L., Bougiatioti, A., Cerully, K. M., Capps, S. L., Hite, J. R., Carlton, A. G., Lee, S. H., Bergin, M. H., Ng, N. L., Nenes, A., and Weber, R. J.: Fine-particle water and pH in the southeastern United States, Atmos. Chem. Phys., 15, 5211–5228, https://doi.org/10.5194/acp-15-5211-2015, 2015.
Guo, H., Sullivan, A. P., Campuzano-Jost, P., Schroder, J. C., Lopez-Hilfiker, F. D., Dibb, J. E., Jimenez, J. L., Thornton, J. A., Brown, S. S., Nenes, A., and Weber, R. J.: Fine particle pH and the partitioning of nitric acid during winter in the northeastern United States, J. Geophys. Res.-Atmos., 121, 10355–10376, https://doi.org/10.1002/2016jd025311, 2016.
Guo, H., Otjes, R., Schlag, P., Kiendler-Scharr, A., Nenes, A., and Weber, R. J.: Effectiveness of ammonia reduction on control of fine particle nitrate, Atmos. Chem. Phys., 18, 12241–12256, https://doi.org/10.5194/acp-18-12241-2018, 2018.
Guo, H. Y., Liu, J. M., Froyd, K. D., Roberts, J. M., Veres, P. R., Hayes, P. L., Jimenez, J. L., Nenes, A., and Weber, R. J.: Fine particle pH and gas-particle phase partitioning of inorganic species in Pasadena, California, during the 2010 CalNex campaign, Atmos. Chem. Phys., 17, 5703–5719, https://doi.org/10.5194/acp-17-5703-2017, 2017.
He, K., Zhao, Q., Ma, Y., Duan, F., Yang, F., Shi, Z., and Chen, G.: Spatial and seasonal variability of PM2.5 acidity at two Chinese megacities: insights into the formation of secondary inorganic aerosols, Atmos. Chem. Phys., 12, 1377–1395, https://doi.org/10.5194/acp-12-1377-2012, 2012.
He, P., Alexander, B., Geng, L., Chi, X., Fan, S., Zhan, H., Kang, H., Zheng, G., Cheng, Y., Su, H., Liu, C., and Xie, Z.: Isotopic constraints on heterogeneous sulfate production in Beijing haze, Atmos. Chem. Phys., 18, 5515–5528, https://doi.org/10.5194/acp-18-5515-2018, 2018.
Hennigan, C. J., Izumi, J., Sullivan, A. P., Weber, R. J., and Nenes, A.: A critical evaluation of proxy methods used to estimate the acidity of atmospheric particles, Atmos. Chem. Phys., 15, 2775–2790, https://doi.org/10.5194/acp-15-2775-2015, 2015.
Jacob, D. J.: Heterogeneous chemistry and tropospheric ozone, Atmos. Environ., 34, 2131–2159, https://doi.org/10.1016/s1352-2310(99)00462-8, 2000.
Jensen, J.: On the convex functions and inequalities between mean values, Acta Math., 30, 175–193, https://doi.org/10.1007/bf02418571, 1906.
Jia, S., Wang, X., Zhang, Q., Sarkar, S., Wu, L., Huang, M., Zhang, J., and Yang, L.: Technical note: Comparison and interconversion of pH based on different standard states for aerosol acidity characterization, Atmos. Chem. Phys., 18, 11125–11133, https://doi.org/10.5194/acp-18-11125-2018, 2018.
Jickells, T. D., An, Z. S., Andersen, K. K., Baker, A. R., Bergametti, G., Brooks, N., Cao, J. J., Boyd, P. W., Duce, R. A., Hunter, K. A., Kawahata, H., Kubilay, N., laRoche, J., Liss, P. S., Mahowald, N., Prospero, J. M., Ridgwell, A. J., Tegen, I., and Torres, R.: Global iron connections between desert dust, ocean biogeochemistry, and climate, Science, 308, 67–71, https://doi.org/10.1126/science.1105959, 2005.
Jöckel, P., Tost, H., Pozzer, A., Brühl, C., Buchholz, J., Ganzeveld, L., Hoor, P., Kerkweg, A., Lawrence, M. G., Sander, R., Steil, B., Stiller, G., Tanarhte, M., Taraborrelli, D., van Aardenne, J., and Lelieveld, J.: The atmospheric chemistry general circulation model ECHAM5/MESSy1: consistent simulation of ozone from the surface to the mesosphere, Atmos. Chem. Phys., 6, 5067–5104, https://doi.org/10.5194/acp-6-5067-2006, 2006.
Jöckel, P., Kerkweg, A., Pozzer, A., Sander, R., Tost, H., Riede, H., Baumgaertner, A., Gromov, S., and Kern, B.: Development cycle 2 of the Modular Earth Submodel System (MESSy2), Geosci. Model Dev., 3, 717–752, https://doi.org/10.5194/gmd-3-717-2010, 2010.
Kakavas, S., Patoulias, D., Zakoura, M., Nenes, A., and Pandis, S. N.: Size-resolved aerosol pH over Europe during summer, Atmos. Chem. Phys., 21, 799–811, https://doi.org/10.5194/acp-21-799-2021, 2021.
Karydis, V. A., Tsimpidi, A. P., Pozzer, A., Astitha, M., and Lelieveld, J.: Effects of mineral dust on global atmospheric nitrate concentrations, Atmos. Chem. Phys., 16, 1491–1509, https://doi.org/10.5194/acp-16-1491-2016, 2016.
Karydis, V. A., Tsimpidi, A. P., Bacer, S., Pozzer, A., Nenes, A., and Lelieveld, J.: Global impact of mineral dust on cloud droplet number concentration, Atmos. Chem. Phys., 17, 5601–5621, https://doi.org/10.5194/acp-17-5601-2017, 2017.
Kerkweg, A., Buchholz, J., Ganzeveld, L., Pozzer, A., Tost, H., and Jöckel, P.: Technical Note: An implementation of the dry removal processes DRY DEPosition and SEDImentation in the Modular Earth Submodel System (MESSy), Atmos. Chem. Phys., 6, 4617–4632, https://doi.org/10.5194/acp-6-4617-2006, 2006.
Klingmüller, K., Metzger, S., Abdelkader, M., Karydis, V. A., Stenchikov, G. L., Pozzer, A., and Lelieveld, J.: Revised mineral dust emissions in the atmospheric chemistry-climate model EMAC (MESSy 2.52 DU_Astitha1 KKDU2017 patch), Geosci. Model Dev., 11, 989–1008, https://doi.org/10.5194/gmd-11-989-2018, 2018.
Klingmüller, K., Lelieveld, J., Karydis, V. A., and Stenchikov, G. L.: Direct radiative effect of dust-pollution interactions, Atmos. Chem. Phys., 19, 7397–7408, https://doi.org/10.5194/acp-19-7397-2019, 2019.
Klingmüller, K., Karydis, V. A., Bacer, S., Stenchikov, G. L., and Lelieveld, J.: Weaker cooling by aerosols due to dust–pollution interactions, Atmos. Chem. Phys., 20, 15285–15295, https://doi.org/10.5194/acp-20-15285-2020, 2020.
Lawal, A. S., Guan, X. B., Liu, C., Henneman, L. R. F., Vasilakos, P., Bhogineni, V., Weber, R. J., Nenes, A., and Russell, A. G.: Linked Response of Aerosol Acidity and Ammonia to SO2 and NOx Emissions Reductions in the United States, Environ. Sci. Technol., 52, 9861–9873, https://doi.org/10.1021/acs.est.8b00711, 2018.
Lelieveld, J., Evans, J. S., Fnais, M., Giannadaki, D., and Pozzer, A.: The contribution of outdoor air pollution sources to premature mortality on a global scale, Nature, 525, 367–371, https://doi.org/10.1038/nature15371, 2015.
Leygraf, C., Wallinder, I. O., Tidblad, J., and Graedel, T.: Atmospheric Corrosion, John Wiley & Sons, Hoboken, New Jersey, USA, 2016.
Li, C., McLinden, C., Fioletov, V., Krotkov, N., Carn, S., Joiner, J., Streets, D., He, H., Ren, X., Li, Z., and Dickerson, R. R.: India Is Overtaking China as the World's Largest Emitter of Anthropogenic Sulfur Dioxide, Sci. Rep., 7, 14304, https://doi.org/10.1038/s41598-017-14639-8, 2017.
Liu, M., Song, Y., Zhou, T., Xu, Z., Yan, C., Zheng, M., Wu, Z., Hu, M., Wu, Y., and Zhu, T.: Fine particle pH during severe haze episodes in northern China, Geophys. Res. Lett., 44, 5213–5221, https://doi.org/10.1002/2017GL073210, 2017.
Lohmann, U. and Ferrachat, S.: Impact of parametric uncertainties on the present-day climate and on the anthropogenic aerosol effect, Atmos. Chem. Phys., 10, 11373–11383, https://doi.org/10.5194/acp-10-11373-2010, 2010.
Marais, E. A., Jacob, D. J., Jimenez, J. L., Campuzano-Jost, P., Day, D. A., Hu, W., Krechmer, J., Zhu, L., Kim, P. S., Miller, C. C., Fisher, J. A., Travis, K., Yu, K., Hanisco, T. F., Wolfe, G. M., Arkinson, H. L., Pye, H. O. T., Froyd, K. D., Liao, J., and McNeill, V. F.: Aqueous-phase mechanism for secondary organic aerosol formation from isoprene: application to the southeast United States and co-benefit of SO2 emission controls, Atmos. Chem. Phys., 16, 1603–1618, https://doi.org/10.5194/acp-16-1603-2016, 2016.
Masiol, M., Squizzato, S., Formenton, G., Khan, M. B., Hopke, P. K., Nenes, A., Pandis, S. N., Tositti, L., Benetello, F., Visin, F., and Pavoni, B.: Hybrid multiple-site mass closure and source apportionment of PM2.5 and aerosol acidity at major cities in the Po Valley, Sci. Total Environ., 704, 135287, https://doi.org/10.1016/j.scitotenv.2019.135287, 2020.
McCormick, M. P., Thomason, L. W., and Trepte, C. R.: Atmospheric Effects Of The MT-Pinatubo Eruption, Nature, 373, 399–404, https://doi.org/10.1038/373399a0, 1995.
Meng, Z. Y. and Seinfeld, J. H.: Time scales to achieve atmospheric gas-aerosol equilibrium for volatile species, Atmos. Environ., 30, 2889–2900, https://doi.org/10.1016/1352-2310(95)00493-9, 1996.
Meng, Z. Y., Seinfeld, J. H., Saxena, P., and Kim, Y. P.: Atmospheric gas-aerosol equilibrium. 4. Thermodynamics of carbonates, Aerosol Sci. Tech., 23, 131–154, 1995.
Metzger, S., Mihalopoulos, N., and Lelieveld, J.: Importance of mineral cations and organics in gas-aerosol partitioning of reactive nitrogen compounds: case study based on MINOS results, Atmos. Chem. Phys., 6, 2549–2567, https://doi.org/10.5194/acp-6-2549-2006, 2006.
Murphy, J. G., Gregoire, P. K., Tevlin, A. G., Wentworth, G. R., Ellis, R. A., Markovic, M. Z., and VandenBoer, T. C.: Observational constraints on particle acidity using measurements and modelling of particles and gases, Faraday Discuss., 200, 379–395, https://doi.org/10.1039/C7FD00086C, 2017.
Nah, T., Guo, H., Sullivan, A. P., Chen, Y., Tanner, D. J., Nenes, A., Russell, A., Ng, N. L., Huey, L. G., and Weber, R. J.: Characterization of aerosol composition, aerosol acidity, and organic acid partitioning at an agriculturally intensive rural southeastern US site, Atmos. Chem. Phys., 18, 11471–11491, https://doi.org/10.5194/acp-18-11471-2018, 2018.
Nenes, A., Pandis, S. N., Weber, R. J., and Russell, A.: Aerosol pH and liquid water content determine when particulate matter is sensitive to ammonia and nitrate availability, Atmos. Chem. Phys., 20, 3249–3258, https://doi.org/10.5194/acp-20-3249-2020, 2020.
Oakes, M., Ingall, E. D., Lai, B., Shafer, M. M., Hays, M. D., Liu, Z. G., Russell, A. G., and Weber, R. J.: Iron Solubility Related to Particle Sulfur Content in Source Emission and Ambient Fine Particles, Environ. Sci. Technol., 46, 6637–6644, https://doi.org/10.1021/es300701c, 2012.
Park, M., Joo, H. S., Lee, K., Jang, M., Kim, S. D., Kim, I., Borlaza, L. J. S., Lim, H., Shin, H., Chung, K. H., Choi, Y.-H., Park, S. G., Bae, M.-S., Lee, J., Song, H., and Park, K.: Differential toxicities of fine particulate matters from various sources, Scient. Rep., 8, 17007, https://doi.org/10.1038/s41598-018-35398-0, 2018.
Pathak, R. K., Yao, X. H., and Chan, C. K.: Sampling artifacts of acidity and ionic species in PM2.5, Environ. Sci. Technol., 38, 254–259, https://doi.org/10.1021/es0342244, 2004.
Pathak, R. K., Wu, W. S., and Wang, T.: Summertime PM2.5 ionic species in four major cities of China: nitrate formation in an ammonia-deficient atmosphere, Atmos. Chem. Phys., 9, 1711–1722, https://doi.org/10.5194/acp-9-1711-2009, 2009.
Petters, M. D. and Kreidenweis, S. M.: A single parameter representation of hygroscopic growth and cloud condensation nucleus activity, Atmos. Chem. Phys., 7, 1961–1971, https://doi.org/10.5194/acp-7-1961-2007, 2007.
Pozzer, A., Jöckel, P., Sander, R., Williams, J., Ganzeveld, L., and Lelieveld, J.: Technical Note: The MESSy-submodel AIRSEA calculating the air-sea exchange of chemical species, Atmos. Chem. Phys., 6, 5435–5444, https://doi.org/10.5194/acp-6-5435-2006, 2006.
Pozzer, A., Jöckel, P., and Van Aardenne, J.: The influence of the vertical distribution of emissions on tropospheric chemistry, Atmos. Chem. Phys., 9, 9417–9432, https://doi.org/10.5194/acp-9-9417-2009, 2009.
Pozzer, A., de Meij, A., Pringle, K. J., Tost, H., Doering, U. M., van Aardenne, J., and Lelieveld, J.: Distributions and regional budgets of aerosols and their precursors simulated with the EMAC chemistry–climate model, Atmos. Chem. Phys., 12, 961–987, https://doi.org/10.5194/acp-12-961-2012, 2012.
Pozzer, A., Tsimpidi, A. P., Karydis, V. A., de Meij, A., and Lelieveld, J.: Impact of agricultural emission reductions on fine-particulate matter and public health, Atmos. Chem. Phys., 17, 12813–12826, https://doi.org/10.5194/acp-17-12813-2017, 2017.
Pringle, K. J., Tost, H., Message, S., Steil, B., Giannadaki, D., Nenes, A., Fountoukis, C., Stier, P., Vignati, E., and Lelieveld, J.: Description and evaluation of GMXe: a new aerosol submodel for global simulations (v1), Geosci. Model Dev., 3, 391–412, https://doi.org/10.5194/gmd-3-391-2010, 2010.
Pye, H. O. T., Zuend, A., Fry, J. L., Isaacman-VanWertz, G., Capps, S. L., Appel, K. W., Foroutan, H., Xu, L., Ng, N. L., and Goldstein, A. H.: Coupling of organic and inorganic aerosol systems and the effect on gas–particle partitioning in the southeastern US, Atmos. Chem. Phys., 18, 357–370, https://doi.org/10.5194/acp-18-357-2018, 2018.
Pye, H. O. T., Nenes, A., Alexander, B., Ault, A. P., Barth, M. C., Clegg, S. L., Collett, J. L., Fahey, K. M., Hennigan, C. J., Herrmann, H., Kanakidou, M., Kelly, J. T., Ku, I. T., McNeill, V. F., Riemer, N., Schaefer, T., Shi, G. L., Tilgner, A., Walker, J. T., Wang, T., Weber, R., Xing, J., Zaveri, R. A., and Zuend, A.: The acidity of atmospheric particles and clouds, Atmos. Chem. Phys., 20, 4809–4888, https://doi.org/10.5194/acp-20-4809-2020, 2020.
Raizenne, M., Neas, L. M., Damokosh, A. I., Dockery, D. W., Spengler, J. D., Koutrakis, P., Ware, J. H., and Speizer, F. E.: Health effects of acid aerosols on North American children: Pulmonary function, Environ. Health Perspect., 104, 506–514, https://doi.org/10.2307/3432991, 1996.
Roeckner, E., Brokopf, R., Esch, M., Giorgetta, M., Hagemann, S., Kornblueh, L., Manzini, E., Schlese, U., and Schulzweida, U.: Sensitivity of simulated climate to horizontal and vertical resolution in the ECHAM5 atmosphere model, J. Climate, 19, 3771–3791, https://doi.org/10.1175/jcli3824.1, 2006.
Saiz-Lopez, A. and von Glasow, R.: Reactive halogen chemistry in the troposphere, Chem. Soc. Rev., 41, 6448–6472, https://doi.org/10.1039/c2cs35208g, 2012.
Sander, R.: Compilation of Henry's law constants (version 4.0) for water as solvent, Atmos. Chem. Phys., 15, 4399–4981, https://doi.org/10.5194/acp-15-4399-2015, 2015.
Sander, R., Baumgaertner, A., Cabrera-Perez, D., Frank, F., Gromov, S., Grooss, J. U., Harder, H., Huijnen, V., Jockel, P., Karydis, V. A., Niemeyer, K. E., Pozzer, A., Hella, R. B., Schultz, M. G., Taraborrelli, D., and Tauer, S.: The community atmospheric chemistry box model CAABA/MECCA-4.0, Geosci. Model Dev., 12, 1365–1385, https://doi.org/10.5194/gmd-12-1365-2019, 2019.
Schaap, M., van Loon, M., ten Brink, H. M., Dentener, F. J., and Builtjes, P. J. H.: Secondary inorganic aerosol simulations for Europe with special attention to nitrate, Atmos. Chem. Phys., 4, 857–874, https://doi.org/10.5194/acp-4-857-2004, 2004.
Seinfeld, J. H. and Pandis, S. N.: Atmospheric Chemistry and Physics: From Air Pollution to Climate Change, 2nd Edn., John Wiley & Sons, Inc., Hoboken, New Jersey, 2006.
Shao, J., Chen, Q., Wang, Y., Lu, X., He, P., Sun, Y., Shah, V., Martin, R. V., Philip, S., Song, S., Zhao, Y., Xie, Z., Zhang, L., and Alexander, B.: Heterogeneous sulfate aerosol formation mechanisms during wintertime Chinese haze events: air quality model assessment using observations of sulfate oxygen isotopes in Beijing, Atmos. Chem. Phys., 19, 6107–6123, https://doi.org/10.5194/acp-19-6107-2019, 2019.
Shi, G., Xu, J., Peng, X., Xiao, Z., Chen, K., Tian, Y., Guan, X., Feng, Y., Yu, H., Nenes, A., and Russell, A. G.: pH of Aerosols in a Polluted Atmosphere: Source Contributions to Highly Acidic Aerosol, Environ. Sci. Technol., 51, 4289–4296, https://doi.org/10.1021/acs.est.6b05736, 2017.
Song, S., Gao, M., Xu, W., Shao, J., Shi, G., Wang, S., Wang, Y., Sun, Y., and McElroy, M. B.: Fine-particle pH for Beijing winter haze as inferred from different thermodynamic equilibrium models, Atmos. Chem. Phys., 18, 7423–7438, https://doi.org/10.5194/acp-18-7423-2018, 2018.
Squizzato, S., Masiol, M., Brunelli, A., Pistollato, S., Tarabotti, E., Rampazzo, G., and Pavoni, B.: Factors determining the formation of secondary inorganic aerosol: a case study in the Po Valley (Italy), Atmos. Chem. Phys., 13, 1927–1939, https://doi.org/10.5194/acp-13-1927-2013, 2013.
Sullivan, R. C., Moore, M. J. K., Petters, M. D., Kreidenweis, S. M., Roberts, G. C., and Prather, K. A.: Effect of chemical mixing state on the hygroscopicity and cloud nucleation properties of calcium mineral dust particles, Atmos. Chem. Phys., 9, 3303–3316, https://doi.org/10.5194/acp-9-3303-2009, 2009.
Surratt, J. D., Chan, A. W. H., Eddingsaas, N. C., Chan, M. N., Loza, C. L., Kwan, A. J., Hersey, S. P., Flagan, R. C., Wennberg, P. O., and Seinfeld, J. H.: Reactive intermediates revealed in secondary organic aerosol formation from isoprene, P. Natl. Acad. Sci. USA, 107, 6640–6645, https://doi.org/10.1073/pnas.0911114107, 2010.
Tan, T., Hu, M., Li, M., Guo, Q., Wu, Y., Fang, X., Gu, F., Wang, Y., and Wu, Z.: New insight into PM2.5 pollution patterns in Beijing based on one-year measurement of chemical compositions, Sci. Total Environ., 621, 734–743, https://doi.org/10.1016/j.scitotenv.2017.11.208, 2018.
Tao, Y. and Murphy, J. G.: The sensitivity of PM2.5 acidity to meteorological parameters and chemical composition changes: 10-year records from six Canadian monitoring sites, Atmos. Chem. Phys., 19, 9309–9320, https://doi.org/10.5194/acp-19-9309-2019, 2019.
Tost, H., Jöckel, P., Kerkweg, A., Sander, R., and Lelieveld, J.: Technical note: A new comprehensive SCAVenging submodel for global atmospheric chemistry modelling, Atmos. Chem. Phys., 6, 565–574, https://doi.org/10.5194/acp-6-565-2006, 2006.
Tsimpidi, A. P., Karydis, V. A., Pozzer, A., Pandis, S. N., and Lelieveld, J.: ORACLE (v1.0): module to simulate the organic aerosol composition and evolution in the atmosphere, Geosci. Model Dev., 7, 3153–3172, https://doi.org/10.5194/gmd-7-3153-2014, 2014.
Tsimpidi, A. P., Karydis, V. A., Pandis, S. N., and Lelieveld, J.: Global combustion sources of organic aerosols: model comparison with 84 AMS factor-analysis data sets, Atmos. Chem. Phys., 16, 8939–8962, https://doi.org/10.5194/acp-16-8939-2016, 2016.
Tsimpidi, A. P., Karydis, V. A., Pozzer, A., Pandis, S. N., and Lelieveld, J.: ORACLE 2-D (v2.0): an efficient module to compute the volatility and oxygen content of organic aerosol with a global chemistry-climate model, Geosci. Model Dev., 11, 3369–3389, https://doi.org/10.5194/gmd-11-3369-2018, 2018.
van Vuuren, D. P., Edmonds, J., Kainuma, M., Riahi, K., Thomson, A., Hibbard, K., Hurtt, G. C., Kram, T., Krey, V., Lamarque, J. F., Masui, T., Meinshausen, M., Nakicenovic, N., Smith, S. J., and Rose, S. K.: The representative concentration pathways: an overview, Climatic Change, 109, 5–31, https://doi.org/10.1007/s10584-011-0148-z, 2011.
Vieira-Filho, M., Pedrotti, J. J., and Fornaro, A.: Water-soluble ions species of size-resolved aerosols: Implications for the atmospheric acidity in São Paulo megacity, Brazil, Atmos. Res., 181, 281–287, https://doi.org/10.1016/j.atmosres.2016.07.006, 2016.
Vignati, E., Wilson, J., and Stier, P.: M7: An efficient size-resolved aerosol microphysics module for large-scale aerosol transport models, J. Geophys. Res.-Atmos., 109, D22202, https://doi.org/10.1029/2003jd004485, 2004.
Wang, G., Zhang, R., Gomez, M. E., Yang, L., Levy Zamora, M., Hu, M., Lin, Y., Peng, J., Guo, S., Meng, J., Li, J., Cheng, C., Hu, T., Ren, Y., Wang, Y., Gao, J., Cao, J., An, Z., Zhou, W., Li, G., Wang, J., Tian, P., Marrero-Ortiz, W., Secrest, J., Du, Z., Zheng, J., Shang, D., Zeng, L., Shao, M., Wang, W., Huang, Y., Wang, Y., Zhu, Y., Li, Y., Hu, J., Pan, B., Cai, L., Cheng, Y., Ji, Y., Zhang, F., Rosenfeld, D., Liss, P. S., Duce, R. A., Kolb, C. E., and Molina, M. J.: Persistent sulfate formation from London Fog to Chinese haze, P. Natl. Acad. Sci. USA, 113, 13630–13635, https://doi.org/10.1073/pnas.1616540113, 2016.
Wang, H., Ding, J., Xu, J., Wen, J., Han, J., Wang, K., Shi, G., Feng, Y., Ivey, C. E., Wang, Y., Nenes, A., Zhao, Q., and Russell, A. G.: Aerosols in an arid environment: The role of aerosol water content, particulate acidity, precursors, and relative humidity on secondary inorganic aerosols, Sci. Total Environ., 646, 564–572, https://doi.org/10.1016/j.scitotenv.2018.07.321, 2019.
Wang, Y., Li, W., Gao, W., Liu, Z., Tian, S., Shen, R., Ji, D., Wang, S., Wang, L., Tang, G., Song, T., Cheng, M., Wang, G., Gong, Z., Hao, J., and Zhang, Y.: Trends in particulate matter and its chemical compositions in China from 2013–2017, Sci. China Earth Sci., 62, 1857–1871, https://doi.org/10.1007/s11430-018-9373-1, 2019.
Weber, R. J., Guo, H. Y., Russell, A. G., and Nenes, A.: High aerosol acidity despite declining atmospheric sulfate concentrations over the past 15 years, Nat. Geosci., 9, 282–285, https://doi.org/10.1038/ngeo2665, 2016.
Xu, L., Guo, H. Y., Boyd, C. M., Klein, M., Bougiatioti, A., Cerully, K. M., Hite, J. R., Isaacman-VanWertz, G., Kreisberg, N. M., Knote, C., Olson, K., Koss, A., Goldstein, A. H., Hering, S. V., de Gouw, J., Baumann, K., Lee, S. H., Nenes, A., Weber, R. J., and Ng, N. L.: Effects of anthropogenic emissions on aerosol formation from isoprene and monoterpenes in the southeastern United States, P. Natl. Acad. Sci. USA, 112, 37–42, https://doi.org/10.1073/pnas.1417609112, 2015.
Xue, J., Lau, A. K. H., and Yu, J. Z.: A study of acidity on PM2.5 in Hong Kong using online ionic chemical composition measurements, Atmos. Environ., 45, 7081–7088, https://doi.org/10.1016/j.atmosenv.2011.09.040, 2011.
Yao, X., Ling, T. Y., Fang, M., and Chan, C. K.: Size dependence of in situ pH in submicron atmospheric particles in Hong Kong, Atmos. Environ., 41, 382–393, https://doi.org/10.1016/j.atmosenv.2006.07.037, 2007.
Yienger, J. J. and Levy, H.: Empirical-model of global soil-biogenic NOx emissions, J. Geophys. Res.-Atmos., 100, 11447–11464, https://doi.org/10.1029/95jd00370, 1995.
Zheng, G., Su, H., Wang, S., Andreae, M. O., Pöschl, U., and Cheng, Y.: Multiphase buffer theory explains contrasts in atmospheric aerosol acidity, Science, 369, 1374–1377, https://doi.org/10.1126/science.aba3719, 2020.