the Creative Commons Attribution 4.0 License.
the Creative Commons Attribution 4.0 License.
 | 07 Oct 2021
Characterization of non-refractory (NR) PM1 and source apportionment of organic aerosol in Kraków, Poland
Anna K. Tobler
Alicja Skiba
Francesco Canonaco
Griša Močnik
Pragati Rai
Gang Chen
Jakub Bartyzel
Miroslaw Zimnoch
Katarzyna Styszko
Jaroslaw Nęcki
Markus Furger
Kazimierz Różański
Urs Baltensperger
Jay G. Slowik
Andre S. H. Prevot
Kraków is routinely affected by very high air pollution levels, especially during the winter months. Although a lot of effort has been made to characterize ambient aerosol, there is a lack of online and long-term measurements of non-refractory aerosol. Our measurements at the AGH University of Science and Technology provide the online long-term chemical composition of ambient submicron particulate matter (PM1) between January 2018 and April 2019. Here we report the chemical characterization of non-refractory submicron aerosol and source apportionment of the organic fraction by positive matrix factorization (PMF). In contrast to other long-term source apportionment studies, we let a small PMF window roll over the dataset instead of performing PMF over the full dataset or on separate seasons. In this way, the seasonal variation in the source profiles can be captured. The uncertainties in the PMF solutions are addressed by the bootstrap resampling strategy and the random a-value approach for constrained factors.
We observe clear seasonal patterns in the concentration and composition of PM1, with high concentrations during the winter months and lower concentrations during the summer months. Organics are the dominant species throughout the campaign. Five organic aerosol (OA) factors are resolved, of which three are of a primary nature (hydrocarbon-like OA (HOA), biomass burning OA (BBOA) and coal combustion OA (CCOA)) and two are of a secondary nature (more oxidized oxygenated OA (MO-OOA) and less oxidized oxygenated OA (LO-OOA)). While HOA contributes on average 8.6 % ± 2.3 % throughout the campaign, the solid-fuel-combustion-related BBOA and CCOA show a clear seasonal trend with average contributions of 10.4 % ± 2.7 % and 14.1 %, ±2.1 %, respectively. Not only BBOA but also CCOA is associated with residential heating because of the pronounced yearly cycle where the highest contributions are observed during wintertime. Throughout the campaign, the OOA can be separated into MO-OOA and LO-OOA with average contributions of 38.4 % ± 8.4 % and 28.5 % ± 11.2 %, respectively.
- Article
(1797 KB) - Full-text XML
-
Supplement
(949 KB) - BibTeX
- EndNote


Aerosol adversely impacts visibility, air quality (Watson, 2002), public health (Pope and Dockery, 2006) and regional to global climate (IPCC, 2013). A significant fraction of the aerosol mass consists of organic aerosol (OA) particles (Jimenez et al., 2009). The knowledge of OA properties and the characterization of the OA chemical composition and different sources have greatly improved over the last few decades. Aerosol chemical speciation monitors (ACSMs; Ng et al., 2011b) are widely used by many research groups and air quality monitoring agencies to quantify the chemical composition of non-refractory (NR) particulate matter (PM) because it allows for online long-term measurements of NR PM with little maintenance needed. Online techniques have the advantage of providing (near-)real-time measurements of the aerosol composition and properties while minimizing the risks of sample contamination and losses during the sample preparation. A good inter-comparability of different ACSMs has been shown in previous studies (Crenn et al., 2015; Freney et al., 2019).
Cities in eastern Europe experience poor air quality from both a European and a global perspective (European Environment Agency, 2019). Despite high levels of ambient pollution, online state-of-the-art atmospheric research of the chemical composition of ambient aerosol remains scarce. There are only a few studies from eastern Europe, including the Czech Republic (Kubelová et al., 2015), Romania (Vasilescu et al., 2017) and Estonia (Elser et al., 2016a). Especially in southern Poland, the annual limit of 25 µg m−3 regarding particulate matter with an aerodynamic diameter smaller than 2.5 µm (PM2.5) is substantially exceeded in many places (European Environment Agency, 2019), including in the case of Kraków, where long-term online measurements of the chemical characterization of ambient aerosol are not available yet.
Previous air quality studies in Kraków were mostly based on offline analysis, focused on elemental analysis (Samek et al., 2017, 2019; Zimnoch et al., 2020) or oxidative potential (Styszko et al., 2017). These studies identified coal; traffic; and steel, cement and metal industries as major pollution sources. In Poland, the combustion of coal is very common. For example, in 2016 over 80 % of the electricity in the country is produced through coal combustion (International Energy Agency, 2017). Residential heating also strongly depends on coal combustion, as it is estimated that almost 70 % of houses have a coal-fired boiler installed (Zaborowski and Dworakowska, 2016). Coal is a heavily polluting fuel, especially during incomplete combustion. An earlier study of real-time PM10 measurements identified residential heating by coal combustion as the major contributor to severe smog episodes in Kraków (Mira-Salama et al., 2008). Kraków passed a resolution to ban the use of all solid fuels within the city, starting from 1 September 2019 (Marshal's Office of the Malopolska Region, 2016). A thorough understanding of the chemical composition of PM is crucial for the evaluation of this policy's efficiency, as well as for the design of future actions.
In this study, we present a detailed characterization of NR PM1 based on the first long-term ACSM measurements in Poland. We identified and quantified five main OA sources based on positive matrix factorization (PMF) analysis (Paatero and Tapper, 1994). The advanced rolling window technique was applied during the PMF analysis (Canonaco et al., 2021) which allows us to capture the temporal variability in the emission sources related to systematic atmospheric variability over the measurement campaign and in addition allows for estimating the uncertainties in the PMF analysis. This work contributes to a better understanding of ambient aerosol and smog episodes in Kraków before the ban of solid fuels.
2.1 Sampling site and instrumentation
The long-term submicron aerosol online measurements presented in this study were performed from 8 January 2018 until 10 April 2019 at the Faculty of Physics and Applied Computer Science, AGH University of Science and Technology (AGH; 50∘04′ N, 19∘55′ E), in Kraków, Poland. The faculty building is located in the Krowodrza district, west of the old city center of Kraków, in a suburban residential area with high traffic intensity, recreational areas and residential buildings.
A quadrupole aerosol chemical speciation monitor (Q-ACSM; Aerodyne Research Inc., Billerica, MA, USA) (Ng et al., 2011b) and a seven-wavelength aethalometer model AE33 (Magee Scientific, Berkeley, CA, USA) (Drinovec et al., 2015) were installed in a temperature-controlled room. Ambient aerosol was continuously sampled at a flow rate of 5 L min−1 through a PM2.5 cyclone (BGI, Mesa Labs), installed 2 m above the rooftop of the building. The measurements were conducted in the room below. A bypass flow of 2 L min−1 was installed to maintain the total flow required for the cyclone. Aerosol was dried by a Nafion dryer (MD-110-24S-4, Perma Pure LLC). Afterwards, the flow was split so that the ACSM sampled approximately 0.1 L min−1 while a 3 L min−1 bypass flow was maintained to ensure near-isokinetic sampling conditions for the ACSM. From 8 January to 22 June 2018, the aethalometer was installed in front of the Nafion dryer with a sample flow of 2 L min−1; afterwards the aethalometer was used to uphold the bypass flow at the ACSM and sampled with a flow rate of 3 L min−1.
2.2 Quadrupole aerosol chemical speciation monitor (Q-ACSM)
The Q-ACSM sampling method and operating details have been previously described in detail by Ng et al. (2011b). Briefly, the aerosol is focused in an aerodynamic lens (PM1; Liu et al., 2007) into a narrow beam after transmission through a 100 µm critical orifice. After passing through a differentially pumped vacuum chamber, non-refractory particles are flash vaporized on a tungsten vaporizer operated at ∼600 ∘C. An yttriated iridium filament is then used to ionize the evolved vapors via electron impact at 70 eV. The ions are subsequently detected by a quadrupole residual gas analyzer (RGA, Pfeiffer Vacuum PrismaPlus). The ACSM alternately samples ambient air and filtered, particle-free air, each for 30 s. The difference spectrum of these measurements represents the aerosol mass spectrum, which typically ranges between mass-to-charge ratios 10 and 150 with unit mass resolution (UMR).
To quantify the mass concentration, the Q-ACSM was routinely calibrated with ammonium nitrate (NH4NO3), ammonium sulfate ((NH4)2SO4) and ammonium chloride (NH4Cl) in order to determine the response factor (RF) of the instrument and the relative ionization efficiencies (RIEs) of ammonium, sulfate and chloride. Because of artifacts related to slowly vaporizing species, the instrument showed apparent negative chloride concentrations for most of the campaign. This apparent negative chloride concentration was corrected by adaptation of the standard fragmentation table in combination with an instrument-specific RIE_Chl′ based on measurement of 36 (HCl+), as described by Tobler et al. (2020b). For this study, an average RIE_Chl′ of 0.41 ± 0.17, RIE of 2.43 ± 0.58 and RIE of 0.38 ± 0.11 together with an average RF of 4.68 ± A (µg m−3)−1 were employed. The particle collection efficiency (CE) was assessed using the method of Middlebrook et al. (2012). It resulted in a constant CE of 0.5, as the particles were dried, no sufficiently acidic particles were measured and the ammonium nitrate mass fraction (ANMF) was below 0.4 for > 99.7 % of the data. Based on the data acquired during the calibrations, an inorganic salt interference between 3.6 % and 7.8 % on 44 was found following the calculations of Pieber et al. (2016). Although the instrument was calibrated regularly, the full extent of the artifact was hard to quantify, so this correction could also have introduced additional uncertainties into the dataset. Furthermore, it has been shown that discrepancies in f44 (the 44 fraction of organic mass) can result in significant differences in the PMF factor profile analysis but not in the total factor contribution (Fröhlich et al., 2015). Therefore, the data presented here do not include the suggested change in the fragmentation table for 44.
The ACSM data were analyzed using ACSM Local 1.6.1.3 (Aerodyne Research Inc.) in Igor 6.37 (WaveMetrics, Inc.). The data were collected with a resolution of 10 min and then averaged to 30 min for the PMF analysis. The time is reported in UTC (1 and 2 h behind local time during winter and summer, respectively).
2.2.1 Aethalometer
The Magee Scientific aethalometer model AE33 measures the light attenuation at seven wavelengths (370, 470, 520, 590, 660, 880 and 950 nm) of particles collected on a filter tape (M8020, described in Drinovec et al., 2015, and M8060). The light attenuation is converted into equivalent black carbon (eBC) mass concentrations using the nominal mass absorption cross-section (MAC) value of 7.77 m2 g−1 (at 880 nm). The MAC value used here is used in conjunction with the multiple scattering parameter C appropriate for the tape (Drinovec et al., 2015; Yus-Díez et al., 2021) as discussed in the Supplement (Sect. S1). The dual-spot technique of the AE33 is able to correct loading non-linearities in real time (Drinovec et al., 2015, 2017). This correction was checked using eBC versus attentuation (BC(ATN)) plots (Drinovec et al., 2015) for the wavelengths used in source apportionment (see below and Fig. S2).
Different combustion sources feature different levels of light absorption wavelength dependence, especially in the ultraviolet (UV) and lower visible range, a feature that can be used for source apportionment (Sandradewi et al., 2008; Zotter et al., 2017). Sandradewi et al. (2008) presented a model to separate biomass burning (eBCwb) and traffic (eBCtr) contributions to eBC in environments dominated by those two combustion types.
A single parameter is used to describe the source-specific dependence of the light absorption coefficient b on the wavelength – the absorption Ångström exponent (AAE):
Zotter et al. (2017) proposed Ångström exponents of 0.9 and 1.68 for traffic and wood burning based on 14C elemental carbon (EC) measurements, respectively. If no such measurements are available, the absorption AAE frequency distribution allows an estimation of the AAE values that should be used in the model. In Kraków, we expect there to be at least three combustion sources that contribute to eBC, namely traffic, biomass burning and coal combustion. We expect to be able to separate traffic emissions from solid fuel (biomass burning and coal combustion) emissions; therefore the terminology eBCtr and eBCsf will be used in this paper. Based on the AAE probability density function (Fig. S3), source-specific values for traffic of AAEtr= 0.85 and solid fuel of AAEsf= 1.9 were used for the eBC source apportionment.
2.2.2 Additional measurements
Meteorological parameters were measured on the rooftop by conventional methods. From 1 January 2019 on, concentrations of the trace gases CO (Horiba APMA-360CE CO analyzer), O3 (Thermo Scientific 49i Ozone Analyzer), NOx (Horiba APMA-360CE NOx analyzer) and SO2 (Thermo Scientific 43i SO2 Analyzer) were monitored. Since the gas measurements at AGH are not available for the full campaign, reference data from the monitoring station (“Bujaka station”) run by the Chief Inspectorate for Environmental Protection, located ca. 6.8 km southeast of the AGH monitoring station (50∘00′ N, 19∘57′ E) were used as well. The Bujaka station routinely measures NOx (Teledyne API T200 NO/NO2/NOx analyzer), O3 (Environnement S.A. Model O342e UV Photometric Ozone Analyzer), SO2 (Teledyne API T100 UV Fluorescence SO2 Analyzer) and PM2.5 (BAM 1020 Met One Instruments).
From 15 March to 10 April 2019, an Xact® 625i ambient metals monitor (Cooper Environmental Services, Tigard, OR, USA) was installed on the rooftop next to the ACSM inlet. The Xact determines the elemental concentrations in ambient aerosol by X-ray fluorescence (Furger et al., 2017). It was set up with an automated alternating PM2.5 and PM10 inlet (Furger et al., 2020) to quantify 32 elements (Al, Si, P, S, Cl, K, Ca, Sc, Ti, V, Cr, Mn, Fe, Co, Ni, Cu, Zn, Ga, Ge, As, Se, Br, Rb, Sr, Y, Zr, Cd, In, Sn, Sb, Ba and Pb) with a 1 h time resolution (Rai et al., 2021). In this work, only the PM2.5 measurements are used as they are more comparable to the ACSM data (PM1).
2.3 OA source apportionment
Positive matrix factorization (PMF) (Paatero and Tapper, 1994) is a bilinear receptor model with non-negativity constraints that describes the variability in a multivariate dataset. Here, it is applied to the organic mass spectra measured by the Q-ACSM. The dataset X, i.e., the time series of organic mass spectra, is represented by the matrix product of factor contributions G and factor profiles F. The fraction that cannot be explained by the model is contained in the residual matrix E.
where G describes the time series (mass concentration) of a certain source and F represents the chemical fingerprint (mass spectrum) of the source. The dimensions of G and F depend on the rank p, the number of factors chosen to describe the dataset. PMF minimizes the quantity Q (Eq. 3), defined by the elements of the residual matrix E (eij) and the measurement uncertainty (σij), by using a least-squares algorithm in order to solve Eq. (2):
PMF suffers from rotational ambiguity, where different combinations of G and F lead to similar Q values. Some of those solutions may be mixed and/or not environmentally reasonable. It has been shown that introducing constraints based on a priori information is an effective method to separate environmentally reasonable solutions (Canonaco et al., 2013; Crippa et al., 2014). The multilinear engine (ME-2) algorithm (Paatero, 1999) allows the introduction of factor profiles and time series constraints in the form of the a-value approach. In the case of a profile constraint, the a value defines the extent a factor is allowed to vary from the anchor profile during the PMF iteration:
The statistical uncertainty (stability) of the PMF solution can be evaluated using the bootstrap resampling strategy (Davison and Hinkley, 1997). During each iteration of the bootstrap analysis, the entries of the input data matrix and corresponding entries of the error matrix are randomly resampled. The newly created matrices have the same size as the original input matrices.
2.4 Rolling PMF technique
A disadvantage of PMF for analysis of long-term (i.e., multi-season) datasets is the assumption of static factor profiles over the entire period PMF is performed. While this may be a reasonable approximation for short-term measurements, long-term measurements, as are typical of ACSM measurements, are likely subject to evolving factor profiles due to seasonality. To account for such source variations, the rolling PMF window technique has been introduced (Canonaco et al., 2021; Parworth et al., 2015). In this approach, PMF is performed over a small window, which is gradually translated across the entire dataset. The user selects the width of the PMF window, the shift parameter and the PMF repeats per window based on the dataset. This approach generates an enormous number of PMF solutions, which requires automated criteria to identify and accept environmentally reasonable PMF solutions (while rejecting the others). This is performed based on seasonal pretests. Chen et al. (2020) demonstrated that the rolling PMF approach provides better solutions regarding scaled residuals and comparison with external data compared to traditional seasonal PMF. The presented OA source apportionment was conducted through SourceFinder Professional (SoFi Pro, Datalystica Ltd., Villigen, Switzerland) (Canonaco et al., 2013, 2021) within the Igor Pro software environment (WaveMetrics, Inc., Lake Oswego, OR, USA).
PMF was performed on the organic aerosol fraction, averaged to a 30 min resolution to improve the signal-to-noise ratio. Since the presence of coal combustion OA (CCOA) was expected, which has a typical marker signal at 115, the mass-to-charge range of 12 to 120 was considered for PMF analysis. However, 12 and 37 were excluded because of systematically negative signals during most of the campaign.
2.4.1 Pretests and definition of environmentally reasonable PMF solutions
PMF analysis of individual seasons was performed to identify the major sources and to define the criteria for environmentally reasonable PMF solutions in the rolling analysis. The dataset was divided into the four seasons (winter (December, January, February), spring (March, April, May), summer (June, July, August) and fall (September, October, November)). Since the campaign covers a period of 16 months, which includes two winters and two springs, six separate PMF inputs were prepared.
In a first step, the primary factors were separated. Therefore, the winter seasons were thoroughly investigated to capture and separate the solid fuel sources. This season was chosen as it was expected to exhibit the highest emissions of biomass burning OA (BBOA) and coal combustion OA (CCOA) due to residential heating. Unconstrained PMF did not lead to clean primary factor profiles. To prevent the mixing of the hydrocarbon-like OA (HOA) and the solid fuel OA, the HOA profile was constrained by the reference profile by Crippa et al. (2013) from a short-term aerosol mass spectrometer (AMS) study in Paris. This reference profile has proven to be very stable even if there are differences in the vehicle fleet (Tobler et al., 2020a). There was no evidence of a cooking OA (COA) factor. The high fractions of 60 and 73 suggested the presence of BBOA. Therefore, BBOA was constrained with different a values by using the reference profile by Ng et al. (2011a). Analysis of the a-value sensitivity tests gave a slightly altered BBOA factor profile, adapted to the current dataset. Using this newly found BBOA over the initial BBOA reference profile for further analysis was beneficial as the residual could be decreased. Thanks to the constraining of HOA and BBOA, a third primary factor could be resolved, which would have most likely remained mixed in a fully unconstrained PMF analysis. This factor exhibited signals from unsaturated hydrocarbons and polycyclic aromatic hydrocarbons (PAHs) as typically found in CCOA profiles. Especially hydrocarbons in the higher mass range ( values of 77, 91, 105 and 115) were mostly explained by this primary factor (explained variation by up to 0.82, 0.76, 0.81 and 0.91, respectively). Since the coal profiles may strongly depend on the type of coal, the exploration of this factor profile was preferred over the CCOA reference profiles from coal used in China (Elser et al., 2016b) or Ireland (Dall'Osto et al., 2013; Lin et al., 2017). To test the stability of the CCOA factor found, the input data matrix was repeatedly (n= 250) perturbed using the bootstrap resampling strategy (Davison and Hinkley, 1997). The obtained CCOA factor profile was then used to constrain the solution together with HOA and BBOA. The number of oxygenated OA (OOA) factors was decided based on residual analysis. Although, it is more common to have less separation of the OOA sources in winter compared to summer, the high residuals at 60 and 73 could only be decreased by allowing two OOA factors to be present in all seasons. Increasing the number of factors to six or more factors led to splitting of either the OOA or the OOA–CCOA factors (Fig. S6). Therefore, the five-factor solution (with two OOA factors) was favored throughout the campaign.
Based on these seasonal pretests, PMF with the rolling window approach was carried out. The exact settings applied in this study are described in Sect. S4. As this approach led to an enormous number of single PMF solutions, carefully chosen user-defined criteria were needed to define and separate environmentally reasonable PMF solutions. Solutions that fulfilled all criteria simultaneously were regarded as environmentally reasonable solutions. These criteria were also used to identify and sort the unconstrained factors. In the following, specific characteristics of the factors are discussed.
eBCtr is a common tracer for traffic emissions; therefore it is used as the criterion for HOA. Although the aethalometer model (Sandradewi et al., 2008) was developed for environments dominated by only two combustion sources, namely traffic and biomass burning, the model still works well enough to separate liquid (traffic) and solid fuels (biomass burning and coal combustion). Moreover, it can be assumed that the AAE for traffic is relatively constant throughout the year and therefore the eBCtr is trustworthy. Correlations of eBCtr with HOA were subject to a Student's t test to evaluate whether the difference in the correlation was significant compared to the correlation of eBCtr with other factors. Solutions with a p value ≤ 0.01 were accepted as reasonable.
Anhydrous sugar fragments, such as levoglucosan fragments ( 60 and 73), are typical of BBOA. Therefore, the explained variation in 60 was chosen as a criterion. Levoglucosan can also be found in coal combustion emissions (Fabbri et al., 2008; Elser et al., 2016b) but comprises a much smaller fraction than in wood burning. Hence, only solutions that had higher explained variation in 60 in BBOA compared to CCOA or the OOA were accepted as environmentally reasonable.
CCOA is characterized by signals from unsaturated hydrocarbons and polycyclic aromatic hydrocarbons (PAHs) at values of 41, 51, 53, 55, 69, 77, 91 and 115 (Dall'Osto et al., 2013; Elser et al., 2016b; Lin et al., 2017; Xu et al., 2020). The explained variation in 115 was chosen as a criterion, as it exhibited the highest explained variation among those ions (in winter up to 0.91) and had fewer potential sources compared to, e.g., 55 or 69. Similarly to the explained variation in 60 in BBOA, solutions with the highest explained variation in 115 in CCOA compared to other factors were regarded as environmentally reasonable. In addition, coal combustion is often accompanied by high chloride emissions (Iapalucci et al., 1969; Yudovich and Ketris, 2006). In the winter solutions, the correlation of CCOA and Chl was exceptionally high. However, in the summer months, the correlation may be quite weak, as the gas-phase–particle-phase equilibrium changes drastically with increased temperatures. While chloride is mostly present in the particle phase as NH4Cl when lower temperatures are present, with higher temperatures chloride is mostly present in the gas phase as HCl. Under such conditions, Chl levels may be close to the detection limit of the ACSM and do not provide a reliable reference for CCOA concentrations. Therefore the correlation of CCOA and Chl was only used as a criterion during the period where the daily Chl averages were consistently well above the detection limit, meaning that this criterion was not evaluated from 31 March to 2 November 2018.
The two unconstrained OOA factors were separated into more oxidized oxygenated OA (MO-OOA) and less oxidized oxygenated OA (LO-OOA) based on the fraction of 44 in the factor profiles. This sorting criterion proved more robust compared to sorting based on the ratio of 44 to 43 in the profiles of the OOA factors. Typically, the ambient OOA is represented in the f44–f43 space (Ng et al., 2010). To avoid unreasonable solutions with zero intensities at those two values, solutions withf43≤ 0.01 and/or f44≤ 0.01 were rejected.
3.1 Chemical composition and seasonal variations in NR PM1
In this study, we report the first long-term online measurements of non-refractory (NR) particulate matter with a diameter < 1 µm (PM1) for Kraków, Poland. The measurements were carried out from 8 January 2018 until 10 April 2019. The time series of the chemical composition of NR PM1 species (Chl, NH4, NO3, Org and SO4) are shown in Fig. 1. Regular calibrations ensured the quantification and the comparison of NR PM1 with total PM2.5 from the Bujaka station further supporting the reported concentrations (Sect. S1). A clear seasonal pattern was observed with the highest concentrations during the winter months and lowest concentrations during summer. Monthly average concentrations ranged from 15.9 µg m3 (May 2018) to 61.1 µg m3 (January 2019). Hourly peak concentrations reached up to 251.2 µg m3 (January 2018).
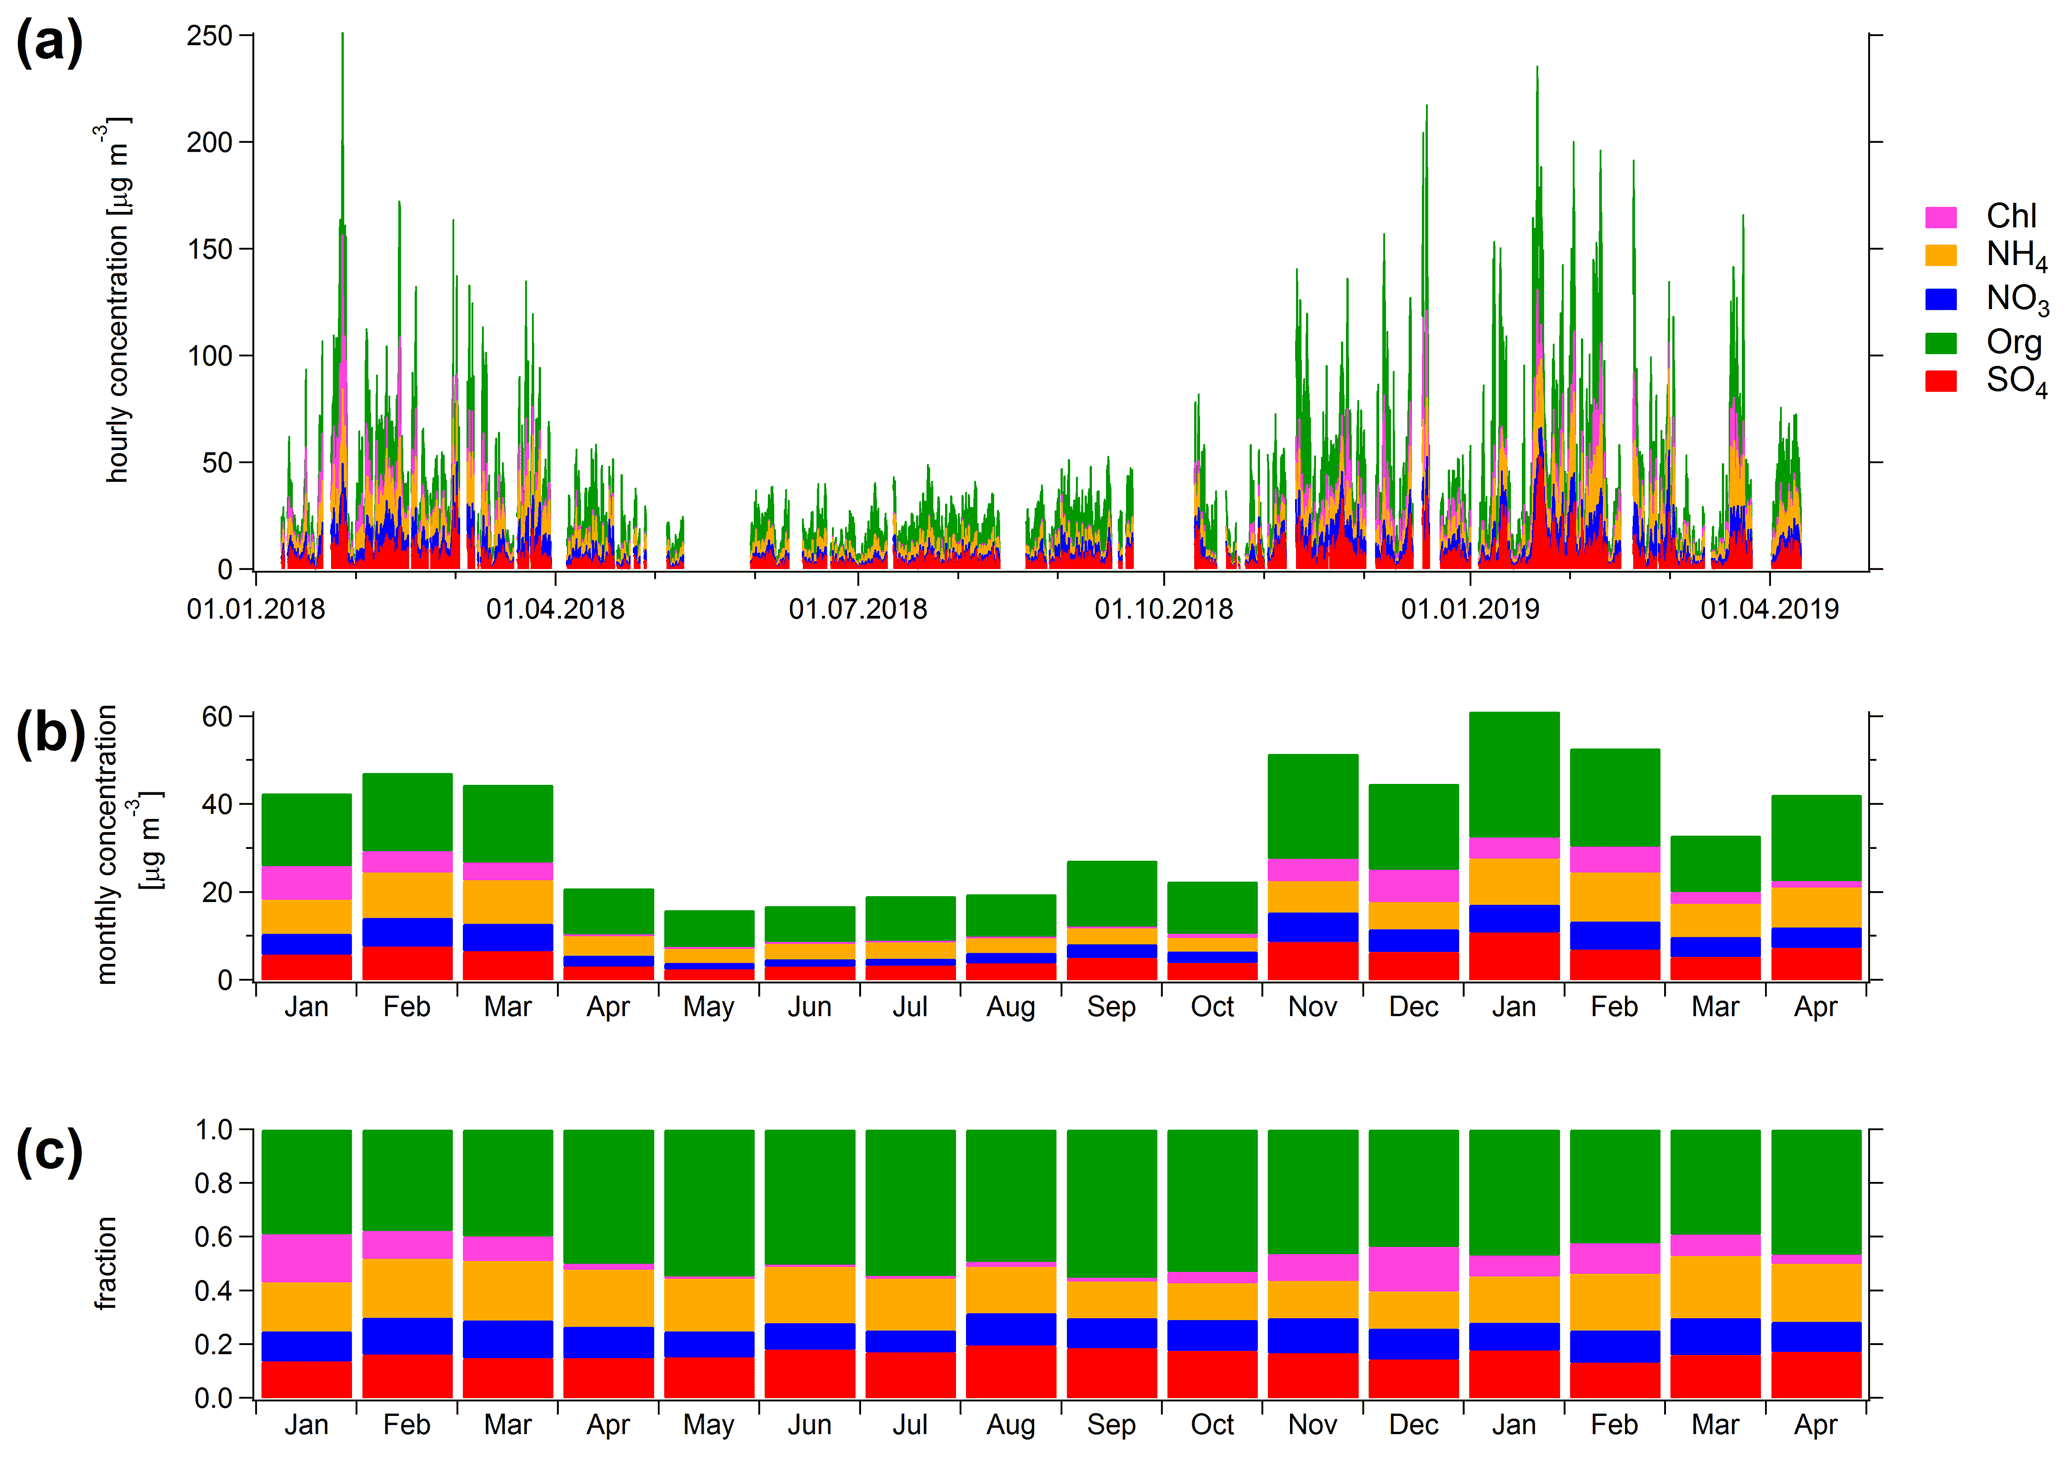
Figure 1(a) Hourly chemical composition of NR PM1 in Kraków from 8 January 2018 to 10 April 2019. The bar plots show the monthly average chemical composition in (b) absolute mass loadings and (c) relative fractions. All times are in UTC.
Based on monthly averages, the fraction of sulfate was stable during the year (between 13.1 % and 19.7 %), while chloride presented the strongest seasonal variation. In January 2018, the fraction of chloride was 18 %, whereas in June 2019 chloride only contributed 0.8 % to the total NR PM1 mass. This variation is expected to be associated with enhanced coal combustion emissions in winter and the gas-phase–particle-phase equilibrium shift due to elevated temperatures in summer, meaning that during warmer weather chloride is mostly present in the gas phase as HCl. Organic aerosol (OA) was the dominant species through the entire campaign, with its contribution to the total mass ranging from 38 % in February 2018 to 55 % in September 2018. The seasonal variation and source contributions to the total OA mass are discussed in more detail in Sect. 3.2.
The diurnal variations in the ACSM species over all seasons are shown in Fig. S4. The diurnal cycle of the organics was similar over all the seasons. The cycle showed the highest concentrations overnight, a small shoulder in the early morning and the lowest concentrations during the early afternoon. PMF analysis (Sect. 3.2) revealed that the evening peak was driven by primary emissions. Nitrate showed a pronounced peak in the morning hours for all seasons. Ammonium showed a similar pattern but with a more stable diurnal profile in summer and fall. The diurnal pattern of chloride was most dominant during the colder seasons and was characterized by high concentrations during the night. Coal combustion was found to co-emit high chloride levels (Iapalucci et al., 1969; Yudovich and Ketris, 2006). The chloride diurnal cycle was likely driven by coal combustion emissions from residential heating and temperature variations, through temperature-dependent gas–particle partitioning. Sulfate showed the most stable diurnal cycle of all species. The elevated concentrations in the afternoon in the warmer seasons are likely due to photochemical processing of gas-phase SO2.
3.2 OA source apportionment
The average factor profiles are presented in Fig. 2. The error bars show the standard deviation and represent the variability in the factor profiles over the full campaign. The first three factor profiles represent the constrained primary OA (POA) sources: HOA, BBOA and CCOA. They were constrained with an average a value of 0.19, 0.21 and 0.18 for HOA, BBOA and CCOA, respectively. The two OOA sources were separated by the fraction of 44 (f44) in their profiles. In general, the primary (constrained) source profiles showed less variation compared to the secondary (oxygenated) source profiles. Especially the LO-OOA showed high variability in 43 and 44. Without the rolling PMF technique, this variability would be harder to explore.
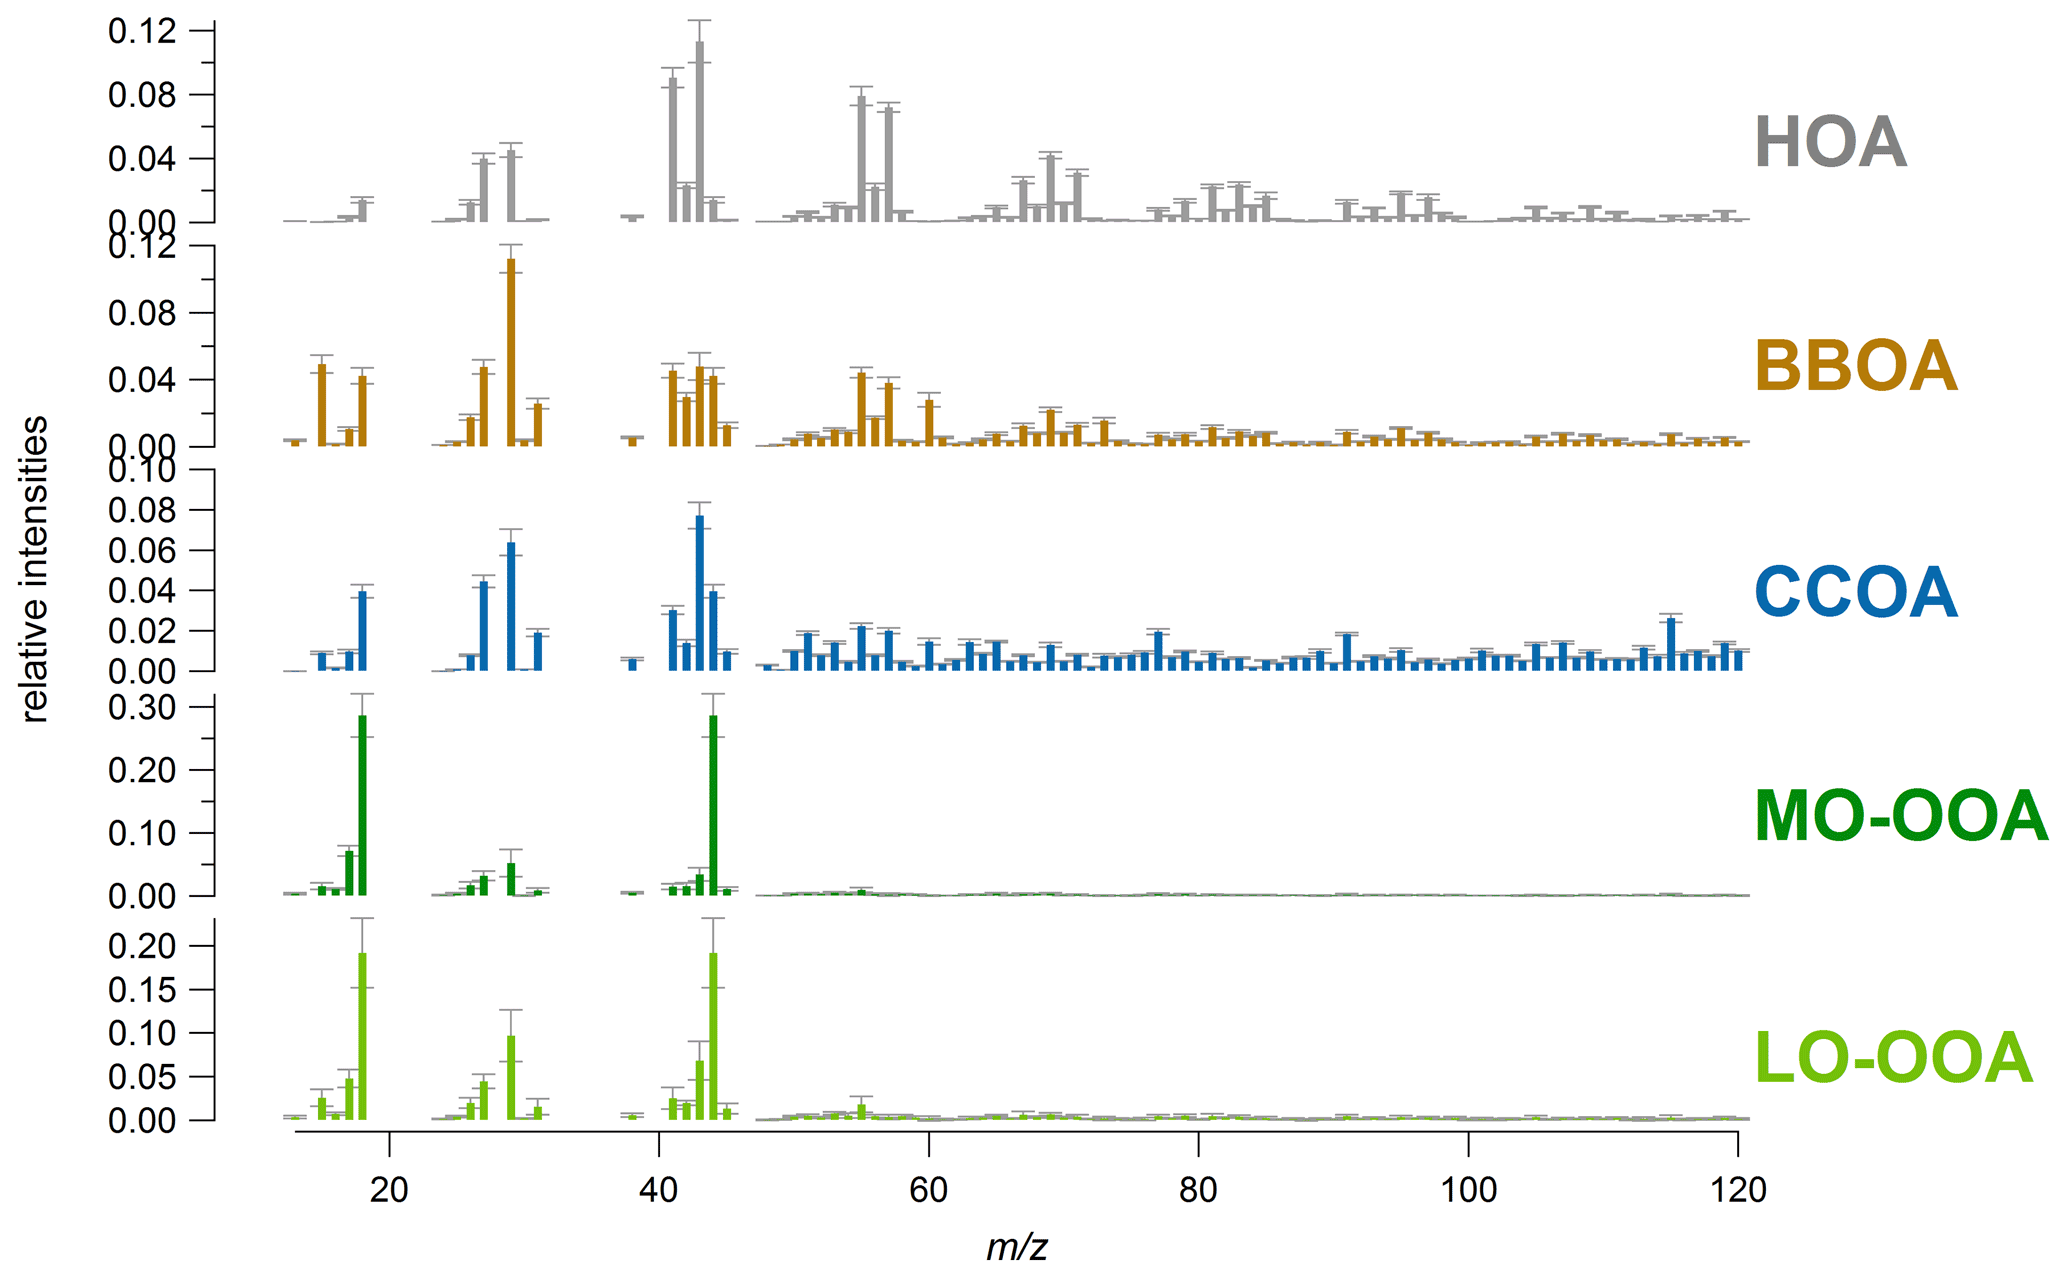
Figure 2Mean factor profiles of the five factors. The profile variability is represented by the grey error bars (standard deviation).
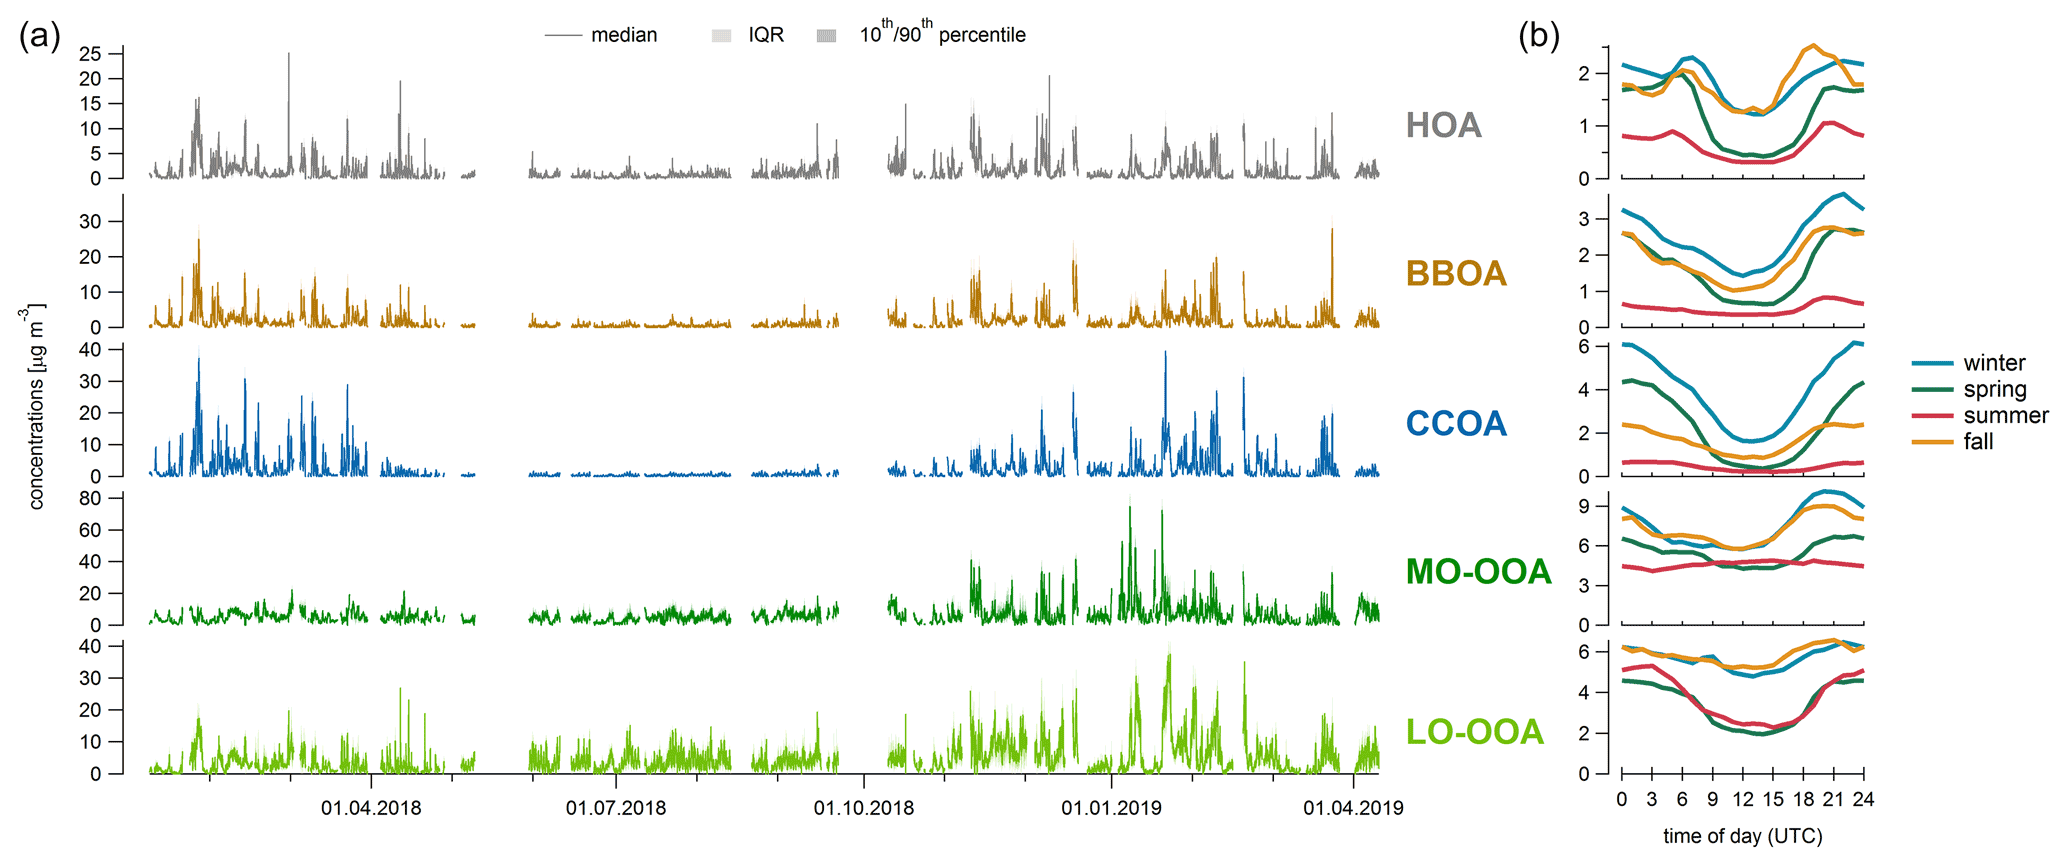
Figure 3Medians, interquartile ranges (IQRs), and 10th and 90th percentiles of the time series (a) and mean values of the diurnal variations (b) of the five resolved PMF factors. The time is reported in UTC (1 and 2 h behind local time during winter and summer, respectively).
The average time series and the seasonal diurnal variations are presented in Fig. 3. HOA presented a morning and an evening peak, consistent with the traffic rush hours during the respective season. The concentrations of BBOA and CCOA were much higher in the colder periods compared to summer. Furthermore, the emissions were more dominant during the night. Therefore, the two combustion OA factors were mainly attributed to residential heating. Overnight, BBOA declined earlier than CCOA. We attribute this to increased fireplace activity during the late evening (in contrast to residential heating overnight with a greater share of coal). The diurnal profiles of MO-OOA and LO-OOA are different, especially during summer, where the LO-OOA concentration decreases during the day due to dilution, evaporation and photochemical aging into MO-OOA. In general, the diurnals of the primary pollutants were strongly driven by vertical mixing with low mixing heights causing enhanced accumulation of pollutants during the night and strong mixing causing dilution of the primary pollutants from late morning to sunset. More details on the influence of the planetary boundary layer height (PBLH) are not discussed as measurements such as 222Rn concentrations (Zimnoch et al., 2014) were not available during this campaign.
The monthly average concentrations and contributions of each OA factor to the total OA mass are presented in Fig. 4. The fractional contribution of HOA to the total mass was the most constant. A clear seasonal pattern could be observed for the solid fuel OA factors (BBOA and CCOA) as well as for the OOA factors (MO-OOA and LO-OOA). The contribution of MO-OOA and LO-OOA was generally higher during summer compared to winter. The seasonal dependence of BBOA and CCOA was associated with residential heating in Kraków, resulting in higher contributions in winter. During the colder periods, CCOA was more dominant than BBOA, which is also consistent with previous offline measurements (Zimnoch et al., 2020). Due to the pronounced yearly cycle (similar to that of BBOA) other coal-related sources of OA are likely not as important. It can be assumed that also in other regions in Europe and Asia, where residential coal combustion is still practiced and high OA mass loadings are measured (like in the western Balkans or northern India), residential coal combustion is a substantial emission source. Comparing the two winter periods covered in this study, the contribution of the primary sources was higher in the first winter although it was a rather warm and clean winter. In contrast, the contribution of MO-OOA to the total OA mass was higher in the second winter compared to the first winter. The drop in primary BBOA and CCOA could be related to Kraków preparing households to switch from solid fuel to non-solid fuel (mostly gas) for residential heating as required by the resolution to ban all solid fuel by September 2019 (Marshal's Office of the Malopolska Region, 2016). On the other hand, regional influences by contributions from aged BBOA and CCOA from the surrounding villages might be manifested in MO-OOA.
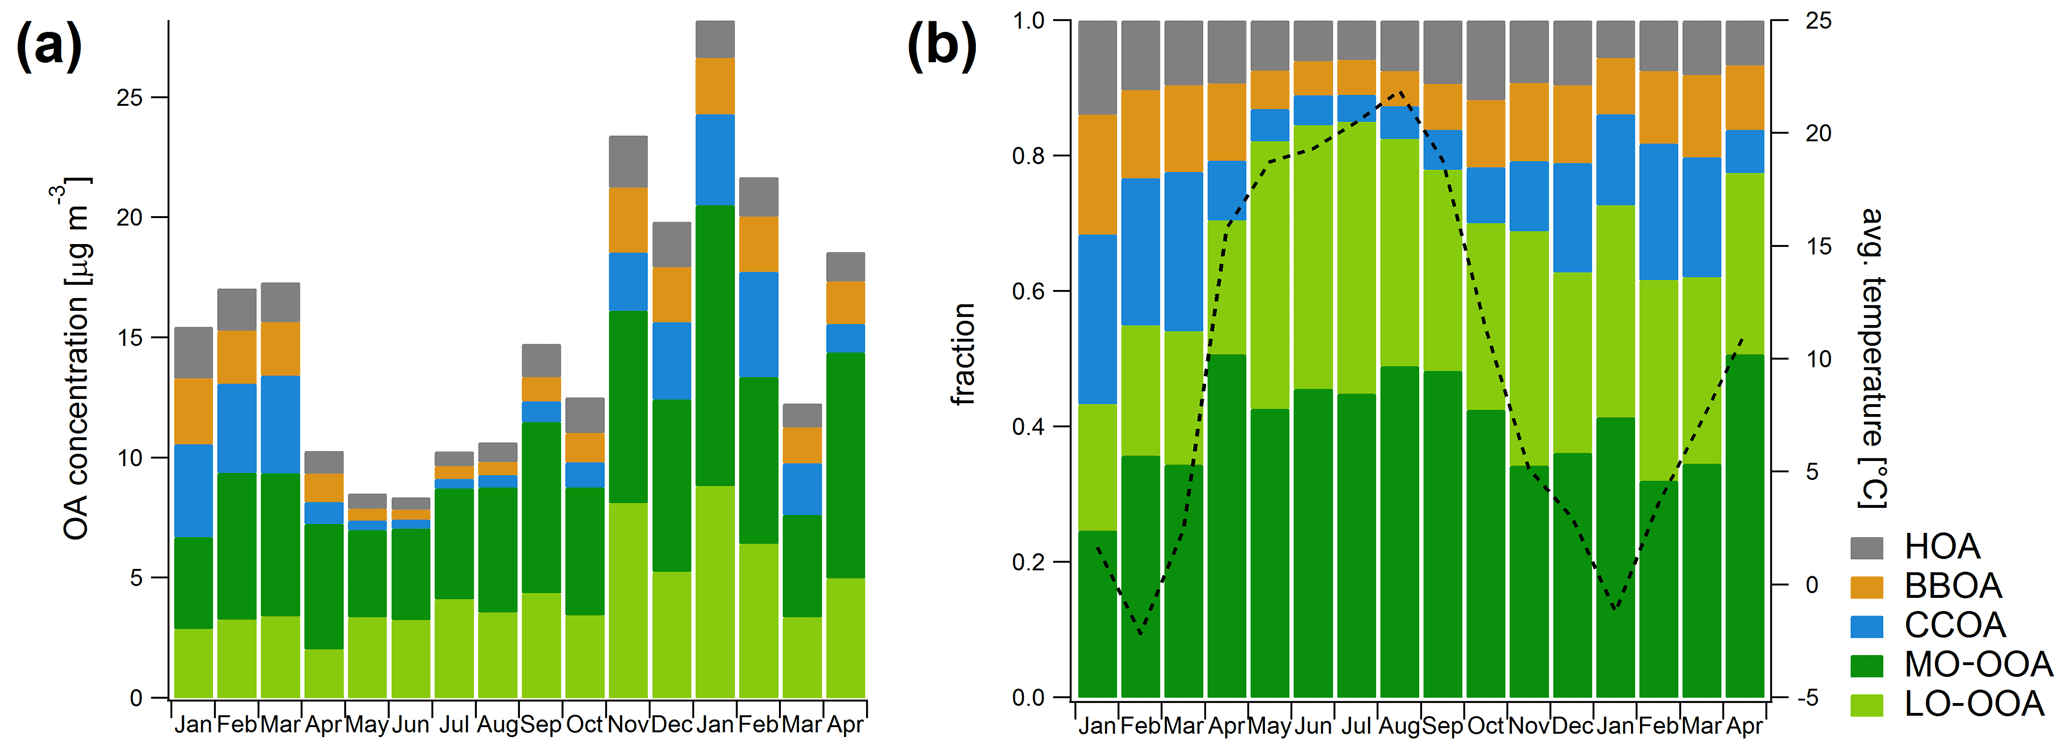
Figure 4(a) Monthly concentrations and (b) contributions of the different sources to the total OA mass. While HOA has a similar contribution throughout the campaign, the solid-fuel-combustion-related BBOA and CCOA show a clear seasonal pattern with the highest contributions during winter. The contributions of MO-OOA and LO-OOA are highest during summer.
The contribution of the five OA factors as a function of OA mass loadings during the seasons is presented in Fig. 5. In spring, the low OA mass loading is dominated by the two OOA fractions, in particular by MO-OOA. With increasing OA mass loadings and decreasing temperature in spring, the POA contribution changes drastically. The contribution of CCOA increases gradually from 7 % to 30 %, and the contribution of BBOA increases from 7 % to 18 %, while the MO-OOA contribution decreases from 55 % to 21 % and the LO-OOA contribution decreases only from 25 % to 19 %. In summer, a small increase in BBOA (4 % to 11 %) can be observed, while CCOA stays constant with a contribution of 4 %. The increase in BBOA could be related to an increase in outdoor activities related to the warmer weather. In fall, a continuous increase in BBOA and CCOA (5 % to 16 % and 8 % to 12 %, respectively) and a decrease in LO-OOA (from 37 % to 19 %) with increasing OA mass loadings are observed, while MO-OOA has a rather constant contribution of 40 %. In winter, BBOA contributes around 10 % to the total OA mass over all OA mass loadings, while the contribution of CCOA continuously increases from 10 % to 23 % with increasing OA mass loadings. While the LO-OOA contribution slightly increases (from 23 % to 26 %), the MO-OOA contribution decreases from 49 % to 30 %.

Figure 5Seasonal contributions of the OA sources (HOA, BBOA, CCOA, MO-OOA and LO-OOA) as a function of the total submicron OA mass loadings. The average bin temperature is shown in red.
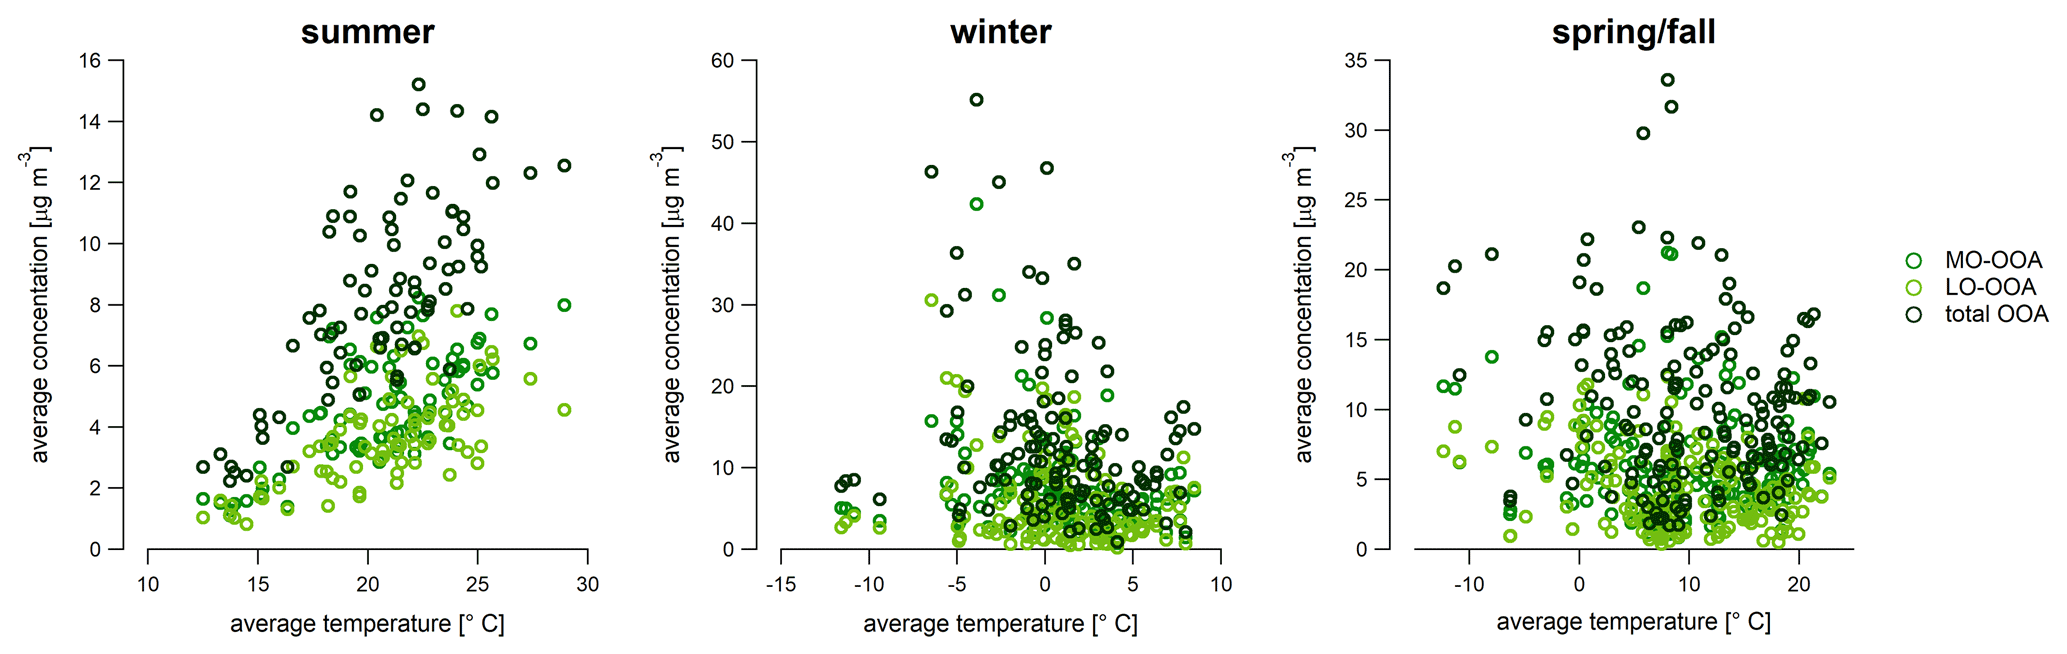
Figure 6Daily average concentrations of the OOA factors versus the daily average temperature for summer, winter, and spring and fall.
The mass fraction of HOA during all seasons and OA mass loadings is rather constant. In general, low OA mass loadings are dominated by the OOA factors, while the POA factors gain importance with increasing OA mass loadings. The highest seasonal contribution of POA is observed in spring, although at a temperature similar to that of winter. These results emphasize the major role of primary sources during pollution events, in particular of POA resulting from solid fuel combustion. Furthermore, in spring, summer and winter, LO-OOA is favored compared to MO-OOA in periods with high OA mass loadings.
Figure 6 shows the temperature dependence of the OOA factors. In summer, the OOA concentrations substantially increase with temperature as expected for the formation of biogenic secondary OA (SOA) (Daellenbach et al., 2017). In winter, high OOA concentrations are observed with lower temperature. This could be related to SOA formation from residential heating precursors. In spring and fall, no clear trend is observed. The high concentration at lower temperature is linked to the cold period in spring, when high POA concentrations from CCOA can also be observed.
Coal combustion typically leads to co-emission of chloride as well as of several heavy metals and metalloids such as As, Ga, Pb and Se (Rai et al., 2021). Xact data are available for the last month of the campaign. As expected, the correlation between the coal-related trace elements measured by the Xact and the OA factors (Fig. S9) was highest with CCOA (As (r2= 0.63), Cl (r2= 0.85), Ga (r2= 0.49) and Pb (r2= 0.55)). The correlation with the other factors was clearly lower (r2= 0.39 for As and LO-OOA and HOA, r2= 0.48 for Cl and HOA, r2= 0.26 for Ga and LO-OOA, and r2= 0.41 for Pb and HOA). The correlation of CCOA and Se (r2= 0.28) was slightly lower than the correlation of LO-OOA and Se (r2= 0.42). This is probably related to the non-zero saturation vapor concentration of SeO2 such that Se is probably more related to regional transport of coal combustion emissions. Se not only is a marker for coal combustion but also can be used to trace SO2 oxidation in clouds and fog as it has a similar removal rate to that of sulfate (Chiou and Manuel, 1986). Based on the diurnal variation in CCOA, we expect CCOA to be mostly from residential heating. However, some metal components might also be emitted by industries rather than only by coal combustion, which could explain the reduced correlation with the CCOA factor for some elements.
While the eBC source apportionment works well for environments with only two combustion sources (i.e., traffic and wood combustion emissions), it has not been proven robust for more than two combustion sources. In the average solution, HOA and eBCtr show a correlation of r2= 0.73, while the correlation of eBCsf and the sum of BBOA and CCOA is r2= 0.88 (Fig. S8). The two different slopes for the two winters in the eBCsf versus (BBOA + CCOA) plot could be related to a change in the solid fuel composition used for heating as preparation for the solid fuel ban. While we expect the quantification of eBCtr to be relatively good, as α can be expected to be quite constant during the course of a year, the eBCsf quantification is more uncertain. Therefore, only the eBCtr was used to define reasonable HOA solutions. Seasonal multilinear regressions were performed to better understand the contribution of the two and three combustion sources (traffic and solid fuel combustion and biomass burning and coal combustion) to the total eBC. However, the results cannot be interpreted conclusively. Together with the relatively low OA-to-eBC ratios (Table S1), it can be assumed that there is at least one additional source contributing to the total eBC concentration, e.g., industrial emissions or plastic combustion. Further investigation through offline analysis or long-term campaigns with parallel ACSM and Xact measurements and subsequent combined PMF could give more insight into further emission sources in Kraków.
This work presents the first real-time long-term measurements of submicron aerosol particle composition in Kraków. The concentration of NR PM1 follows a clear seasonal trend with the highest concentrations during winter and lowest concentrations during summer. The strongest seasonal pattern is observed for chloride, for which emissions are much higher in winter due to coal combustion with the low temperatures favoring partitioning of chloride to the particle phase.
The rolling PMF technique was successfully applied to long-term measurements in Kraków. Unlike traditional PMF, the rolling approach allows time-dependent factor profiles. Five OA factors were identified during the whole measurement period: HOA, BBOA, CCOA, MO-OOA and LO-OOA. Over the full campaign, the average HOA contribution to the total OA mass was 8.7 % and showed a distinct diurnal pattern with peaks during the traffic rush hours. BBOA and CCOA have a similar trend with high contributions (up to 38 % and 55 %, respectively) during the winter months. Residential heating is the dominant source for both BBOA and CCOA. The total OOA (MO-OOA + LO-OOA) followed the opposite seasonal trend compared to the combustion OA sources. While MO-OOA contributed more during winter, the contribution of LO-OOA was higher during summer. The rotational and statistical uncertainties were assessed using the bootstrap resampling strategy combined with the random a-value approach. The relative PMF errors (Fig. S7) were ±27.1 %, ±26.1 %, ±14.6 %, ±21.8 % and ±39.2 % for HOA, BBOA, CCOA, MO-OOA, and LO-OOA, respectively.
Highly time-resolved, long-term measurements provide a basis for monitoring the impact of policies, such as Kraków's ban of all solid fuels from September 2019 onwards, on the air quality. Further work is required to fully characterize the impact of European coal combustion on a regional and local level.
The data presented in the text and figures as well as in the Supplement are available on Zenodo (https://doi.org/10.5281/zenodo.5482368; Tobler, 2021). Additional related data can be made available upon request.
The supplement related to this article is available online at: https://doi.org/10.5194/acp-21-14893-2021-supplement.
AS, AKT, JN and KS were responsible for the instrumentation installation, data collection and/or instrument calibration. GM analyzed the aethalometer data. PR and MF were responsible for the Xact measurements. JB and MZ provided external data. AKT analyzed the ACSM data, performed the source apportionment and wrote the manuscript. ASHP, JGS, JN, KR and UB were involved with the supervision. FC, GM, JGS, ASHP and UB assisted in the interpretation of the results. All co-authors contributed to the paper discussion and revision.
Francesco Canonaco is employed by Datalystica Ltd., the official distributor of the SoFi Pro licenses. During the final revision of the manuscript, Anna K. Tobler was also with Datalystica Ltd.
Publisher’s note: Copernicus Publications remains neutral with regard to jurisdictional claims in published maps and institutional affiliations.
This work was financially supported by the EU Horizon 2020 Framework Programme via the ERA-PLANET project SMURBS (grant agreement no. 689443); the Swiss State Secretariat for Education, Research and Innovation (SERI, contract no. 15.0159-1); the COST action CA16109 Chemical On- Line cOmpoSition and Source Apportionment of fine aerosoL, COLOSSAL, grant and the related project Source apportionment using long-term Aerosol Mass Spectrometry and Aethalometer Measurements (SAMSAM, IZCOZ0_177063); and the Swiss National Science Foundation (starting grant BSSGI0_155846). Furthermore, this research was partially financed by the AGH UST grant 16.16.210.476 subsidy of the Polish Ministry of Science and Higher Education. Alicja Skiba was partly supported by the EU Project POWR.03.02.00-00-I004/16.
This paper was edited by Veli-Matti Kerminen and reviewed by two anonymous referees.
Canonaco, F., Crippa, M., Slowik, J. G., Baltensperger, U., and Prévôt, A. S. H.: SoFi, an IGOR-based interface for the efficient use of the generalized multilinear engine (ME-2) for the source apportionment: ME-2 application to aerosol mass spectrometer data, Atmos. Meas. Tech., 6, 3649–3661, https://doi.org/10.5194/amt-6-3649-2013, 2013.
Canonaco, F., Tobler, A., Chen, G., Sosedova, Y., Slowik, J. G., Bozzetti, C., Daellenbach, K. R., El Haddad, I., Crippa, M., Huang, R.-J., Furger, M., Baltensperger, U., and Prévôt, A. S. H.: A new method for long-term source apportionment with time-dependent factor profiles and uncertainty assessment using SoFi Pro: application to 1 year of organic aerosol data, Atmos. Meas. Tech., 14, 923–943, https://doi.org/10.5194/amt-14-923-2021, 2021.
Chen, G., Sosedova, Y., Canonaco, F., Fröhlich, R., Tobler, A., Vlachou, A., Daellenbach, K. R., Bozzetti, C., Hueglin, C., Graf, P., Baltensperger, U., Slowik, J. G., El Haddad, I., and Prévôt, A. S. H.: Time dependent source apportionment of submicron organic aerosol for a rural site in an alpine valley using a rolling PMF window, Atmos. Chem. Phys. Discuss. [preprint], https://doi.org/10.5194/acp-2020-1263, in review, 2020.
Chiou, K. Y. and Manuel, O. K.: Tellurium and selenium in aerosols, Environ. Sci. Technol., 20, 987–991, https://doi.org/10.1021/es00152a003, 1986.
Crenn, V., Sciare, J., Croteau, P. L., Verlhac, S., Fröhlich, R., Belis, C. A., Aas, W., Äijälä, M., Alastuey, A., Artiñano, B., Baisnée, D., Bonnaire, N., Bressi, M., Canagaratna, M., Canonaco, F., Carbone, C., Cavalli, F., Coz, E., Cubison, M. J., Esser-Gietl, J. K., Green, D. C., Gros, V., Heikkinen, L., Herrmann, H., Lunder, C., Minguillón, M. C., Močnik, G., O'Dowd, C. D., Ovadnevaite, J., Petit, J.-E., Petralia, E., Poulain, L., Priestman, M., Riffault, V., Ripoll, A., Sarda-Estève, R., Slowik, J. G., Setyan, A., Wiedensohler, A., Baltensperger, U., Prévôt, A. S. H., Jayne, J. T., and Favez, O.: ACTRIS ACSM intercomparison – Part 1: Reproducibility of concentration and fragment results from 13 individual Quadrupole Aerosol Chemical Speciation Monitors (Q-ACSM) and consistency with co-located instruments, Atmos. Meas. Tech., 8, 5063–5087, https://doi.org/10.5194/amt-8-5063-2015, 2015.
Crippa, M., DeCarlo, P. F., Slowik, J. G., Mohr, C., Heringa, M. F., Chirico, R., Poulain, L., Freutel, F., Sciare, J., Cozic, J., Di Marco, C. F., Elsasser, M., Nicolas, J. B., Marchand, N., Abidi, E., Wiedensohler, A., Drewnick, F., Schneider, J., Borrmann, S., Nemitz, E., Zimmermann, R., Jaffrezo, J.-L., Prévôt, A. S. H., and Baltensperger, U.: Wintertime aerosol chemical composition and source apportionment of the organic fraction in the metropolitan area of Paris, Atmos. Chem. Phys., 13, 961–981, https://doi.org/10.5194/acp-13-961-2013, 2013.
Crippa, M., Canonaco, F., Lanz, V. A., Äijälä, M., Allan, J. D., Carbone, S., Capes, G., Ceburnis, D., Dall'Osto, M., Day, D. A., DeCarlo, P. F., Ehn, M., Eriksson, A., Freney, E., Hildebrandt Ruiz, L., Hillamo, R., Jimenez, J. L., Junninen, H., Kiendler-Scharr, A., Kortelainen, A.-M., Kulmala, M., Laaksonen, A., Mensah, A. A., Mohr, C., Nemitz, E., O'Dowd, C., Ovadnevaite, J., Pandis, S. N., Petäjä, T., Poulain, L., Saarikoski, S., Sellegri, K., Swietlicki, E., Tiitta, P., Worsnop, D. R., Baltensperger, U., and Prévôt, A. S. H.: Organic aerosol components derived from 25 AMS data sets across Europe using a consistent ME-2 based source apportionment approach, Atmos. Chem. Phys., 14, 6159–6176, https://doi.org/10.5194/acp-14-6159-2014, 2014.
Daellenbach, K. R., Stefenelli, G., Bozzetti, C., Vlachou, A., Fermo, P., Gonzalez, R., Piazzalunga, A., Colombi, C., Canonaco, F., Hueglin, C., Kasper-Giebl, A., Jaffrezo, J.-L., Bianchi, F., Slowik, J. G., Baltensperger, U., El-Haddad, I., and Prévôt, A. S. H.: Long-term chemical analysis and organic aerosol source apportionment at nine sites in central Europe: source identification and uncertainty assessment, Atmos. Chem. Phys., 17, 13265–13282, https://doi.org/10.5194/acp-17-13265-2017, 2017.
Dall'Osto, M., Ovadnevaite, J., Ceburnis, D., Martin, D., Healy, R. M., O'Connor, I. P., Kourtchev, I., Sodeau, J. R., Wenger, J. C., and O'Dowd, C.: Characterization of urban aerosol in Cork city (Ireland) using aerosol mass spectrometry, Atmos. Chem. Phys., 13, 4997–5015, https://doi.org/10.5194/acp-13-4997-2013, 2013.
Davison, A. C. and Hinkley, D. V.: Bootstrap methods and their application, Cambridge University Press, New York, 1997.
Drinovec, L., Močnik, G., Zotter, P., Prévôt, A. S. H., Ruckstuhl, C., Coz, E., Rupakheti, M., Sciare, J., Müller, T., Wiedensohler, A., and Hansen, A. D. A.: The ”dual-spot” Aethalometer: an improved measurement of aerosol black carbon with real-time loading compensation, Atmos. Meas. Tech., 8, 1965–1979, https://doi.org/10.5194/amt-8-1965-2015, 2015.
Drinovec, L., Gregorič, A., Zotter, P., Wolf, R., Bruns, E. A., Prévôt, A. S. H., Petit, J.-E., Favez, O., Sciare, J., Arnold, I. J., Chakrabarty, R. K., Moosmüller, H., Filep, A., and Močnik, G.: The filter-loading effect by ambient aerosols in filter absorption photometers depends on the coating of the sampled particles, Atmos. Meas. Tech., 10, 1043–1059, https://doi.org/10.5194/amt-10-1043-2017, 2017.
Elser, M., Bozzetti, C., El-Haddad, I., Maasikmets, M., Teinemaa, E., Richter, R., Wolf, R., Slowik, J. G., Baltensperger, U., and Prévôt, A. S. H.: Urban increments of gaseous and aerosol pollutants and their sources using mobile aerosol mass spectrometry measurements, Atmos. Chem. Phys., 16, 7117–7134, https://doi.org/10.5194/acp-16-7117-2016, 2016a.
Elser, M., Huang, R.-J., Wolf, R., Slowik, J. G., Wang, Q., Canonaco, F., Li, G., Bozzetti, C., Daellenbach, K. R., Huang, Y., Zhang, R., Li, Z., Cao, J., Baltensperger, U., El-Haddad, I., and Prévôt, A. S. H.: New insights into PM2.5 chemical composition and sources in two major cities in China during extreme haze events using aerosol mass spectrometry, Atmos. Chem. Phys., 16, 3207–3225, https://doi.org/10.5194/acp-16-3207-2016, 2016b.
European Environment Agency: Air quality in Europe – 2019 report, Publications Office of the European Union, Luxembourg, available at: https://www.eea.europa.eu/publications/air-quality-in-europe-2019 (last access: 9 March 2020), 2019.
Fabbri, D., Marynowski, L., Fabiańska, M. J., Zatoń, M., and Simoneit, B. R. T.: Levoglucosan and other cellulose markers in pyrolysates of miocene lignites: geochemical and environmental implications, Environ. Sci. Technol., 42, 2957–2963, https://doi.org/10.1021/es7021472, 2008.
Freney, E., Zhang, Y. J., Croteau, P., Amodeo, T., Williams, L., Truong, F., Petit, J. E., Sciare, J., Sarda-Esteve, R., Bonnaire, N., Arumae, T., Aurela, M., Bougiatioti, A., Mihalopoulos, N., Coz, E., Artinano, B., Crenn, V., Elste, T., Heikkinen, L., Poulain, L., Wiedensohler, A., Herrmann, H., Priestman, M., Alastuey, A., Stavroulas, I., Tobler, A., Vasilescu, J., Zanca, N., Canagaratna, M., Carbone, C., Flentje, H., Green, D., Maasikmets, M., Marmureanu, L., Minguillon, M. C., Prevot, A. S. H., Gros, V., Jayne, J., and Favez, O.: The second ACTRIS inter-comparison (2016) for Aerosol Chemical Speciation Monitors (ACSM): Calibration protocols and instrument performance evaluations, Aerosol Sci. Tech., 53, 830–842, https://doi.org/10.1080/02786826.2019.1608901, 2019.
Fröhlich, R., Crenn, V., Setyan, A., Belis, C. A., Canonaco, F., Favez, O., Riffault, V., Slowik, J. G., Aas, W., Aijälä, M., Alastuey, A., Artiñano, B., Bonnaire, N., Bozzetti, C., Bressi, M., Carbone, C., Coz, E., Croteau, P. L., Cubison, M. J., Esser-Gietl, J. K., Green, D. C., Gros, V., Heikkinen, L., Herrmann, H., Jayne, J. T., Lunder, C. R., Minguillón, M. C., Močnik, G., O'Dowd, C. D., Ovadnevaite, J., Petralia, E., Poulain, L., Priestman, M., Ripoll, A., Sarda-Estève, R., Wiedensohler, A., Baltensperger, U., Sciare, J., and Prévôt, A. S. H.: ACTRIS ACSM intercomparison – Part 2: Intercomparison of ME-2 organic source apportionment results from 15 individual, co-located aerosol mass spectrometers, Atmos. Meas. Tech., 8, 2555–2576, https://doi.org/10.5194/amt-8-2555-2015, 2015.
Furger, M., Minguillón, M. C., Yadav, V., Slowik, J. G., Hüglin, C., Fröhlich, R., Petterson, K., Baltensperger, U., and Prévôt, A. S. H.: Elemental composition of ambient aerosols measured with high temporal resolution using an online XRF spectrometer, Atmos. Meas. Tech., 10, 2061–2076, https://doi.org/10.5194/amt-10-2061-2017, 2017.
Furger, M., Rai, P., Slowik, J. G., Cao, J., Visser, S., Baltensperger, U., and Prévôt, A. S. H.: Automated alternating sampling of PM10 and PM2.5 with an online XRF spectrometer, Atmos. Environ. X, 5, 100065, https://doi.org/10.1016/j.aeaoa.2020.100065, 2020.
Iapalucci, T. L., Demski, R. J., and Bienstock, D.: Chlorine in coal combustion, United States Department of the Interior, Bureau of Mines Report of Investigation 7260, 1969.
International Energy Agency: Energy Policies of IEA Countries – Poland – 2016 Review, IEA Publications, Paris, available at: https://www.iea.org/reports/energy-policies-of-iea-countries-poland-2016-review (last access: 22 March 2019), 2017.
IPCC: Climate Change 2013: The Physical Science Basis, Contribution of Working Group I to the Fifth Assessment Report of the Intergovernmental Panel on Climate Change, edited by: Stocker, T. F., Qin, D., Plattner, G.-K., Tignor, M., Allen, S. K., Boschung, J., Nauels, A., Xia, Y., Bex, V., and Midgley, P. M., Cambridge, United Kingdom and New York, NY, USA, 2013.
Jimenez, J. L., Canagaratna, M. R., Donahue, N. M., Prevot, A. S., Zhang, Q., Kroll, J. H., DeCarlo, P. F., Allan, J. D., Coe, H., Ng, N. L., Aiken, A. C., Docherty, K. S., Ulbrich, I. M., Grieshop, A. P., Robinson, A. L., Duplissy, J., Smith, J. D., Wilson, K. R., Lanz, V. A., Hueglin, C., Sun, Y. L., Tian, J., Laaksonen, A., Raatikainen, T., Rautiainen, J., Vaattovaara, P., Ehn, M., Kulmala, M., Tomlinson, J. M., Collins, D. R., Cubison, M. J., Dunlea, E. J., Huffman, J. A., Onasch, T. B., Alfarra, M. R., Williams, P. I., Bower, K., Kondo, Y., Schneider, J., Drewnick, F., Borrmann, S., Weimer, S., Demerjian, K., Salcedo, D., Cottrell, L., Griffin, R., Takami, A., Miyoshi, T., Hatakeyama, S., Shimono, A., Sun, J. Y., Zhang, Y. M., Dzepina, K., Kimmel, J. R., Sueper, D., Jayne, J. T., Herndon, S. C., Trimborn, A. M., Williams, L. R., Wood, E. C., Middlebrook, A. M., Kolb, C. E., Baltensperger, U., and Worsnop, D. R.: Evolution of organic aerosols in the atmosphere, Science, 326, 1525–1529, https://doi.org/10.1126/science.1180353, 2009.
Kubelová, L., Vodička, P., Schwarz, J., Cusack, M., Makeš, O., Ondráček, J., and Ždímal, V.: A study of summer and winter highly time-resolved submicron aerosol composition measured at a suburban site in Prague, Atmos. Environ., 118, 45–57, https://doi.org/10.1016/j.atmosenv.2015.07.030, 2015.
Lin, C., Ceburnis, D., Hellebust, S., Buckley, P., Wenger, J., Canonaco, F., Prévôt, A. S. H., Huang, R.-J., O'Dowd, C., and Ovadnevaite, J.: Characterization of primary organic aerosol from domestic wood, peat, and coal burning in Ireland, Environ. Sci. Technol., 51, 10624–10632, https://doi.org/10.1021/acs.est.7b01926, 2017.
Liu, P. S. K., Deng, R., Smith, K. A., Williams, L. R., Jayne, J. T., Canagaratna, M. R., Moore, K., Onasch, T. B., Worsnop, D. R., and Deshler, T.: Transmission Efficiency of an Aerodynamic Focusing Lens System: Comparison of Model Calculations and Laboratory Measurements for the Aerodyne Aerosol Mass Spectrometer, Aerosol Sci. Tech., 41, 721–733, https://doi.org/10.1080/02786820701422278, 2007.
Marshal's Office of the Malopolska Region: Resolution No. XVIII/243/16 of the Regional Council of the Malopolska Region, Marshal's Office of the Malopolska Region, 2016.
Middlebrook, A. M., Bahreini, R., Jimenez, J. L., and Canagaratna, M. R.: Evaluation of Composition-Dependent Collection Efficiencies for the Aerodyne Aerosol Mass Spectrometer using Field Data, Aerosol Sci. Tech., 46, 258–271, https://doi.org/10.1080/02786826.2011.620041, 2012.
Mira-Salama, D., Grüning, C., Jensen, N. R., Cavalli, P., Putaud, J. P., Larsen, B. R., Raes, F., and Coe, H.: Source attribution of urban smog episodes caused by coal combustion, Atmos. Res., 88, 294–304, https://doi.org/10.1016/j.atmosres.2007.11.025, 2008.
Ng, N. L., Canagaratna, M. R., Zhang, Q., Jimenez, J. L., Tian, J., Ulbrich, I. M., Kroll, J. H., Docherty, K. S., Chhabra, P. S., Bahreini, R., Murphy, S. M., Seinfeld, J. H., Hildebrandt, L., Donahue, N. M., DeCarlo, P. F., Lanz, V. A., Prévôt, A. S. H., Dinar, E., Rudich, Y., and Worsnop, D. R.: Organic aerosol components observed in Northern Hemispheric datasets from Aerosol Mass Spectrometry, Atmos. Chem. Phys., 10, 4625–4641, https://doi.org/10.5194/acp-10-4625-2010, 2010.
Ng, N. L., Canagaratna, M. R., Jimenez, J. L., Zhang, Q., Ulbrich, I. M., and Worsnop, D. R.: Real-time methods for estimating organic component mass concentrations from aerosol mass spectrometer data, Environ. Sci. Technol., 45, 910–916, https://doi.org/10.1021/es102951k, 2011a.
Ng, N. L., Herndon, S. C., Trimborn, A., Canagaratna, M. R., Croteau, P. L., Onasch, T. B., Sueper, D., Worsnop, D. R., Zhang, Q., Sun, Y. L., and Jayne, J. T.: An Aerosol Chemical Speciation Monitor (ACSM) for routine monitoring of the composition and mass concentrations of ambient aerosol, Aerosol Sci. Tech., 45, 780–794, https://doi.org/10.1080/02786826.2011.560211, 2011b.
Paatero, P. and Tapper, U.: Positive Matrix Factorization – a nonnegative factor model with optimal utilization of error-estimates of data values, Environmetrics, 5, 111–126, https://doi.org/10.1002/env.3170050203, 1994.
Paatero, P.: The multilinear engine – A table-driven, least squares program for solving multilinear problems, including the n-way parallel factor analysis model, J. Comput. Graph. Stat., 8, 854–888, https://doi.org/10.2307/1390831, 1999.
Parworth, C., Fast, J., Mei, F., Shippert, T., Sivaraman, C., Tilp, A., Watson, T., and Zhang, Q.: Long-term measurements of submicrometer aerosol chemistry at the Southern Great Plains (SGP) using an Aerosol Chemical Speciation Monitor (ACSM), Atmos. Environ., 106, 43–55, https://doi.org/10.1016/j.atmosenv.2015.01.060, 2015.
Pieber, S. M., El Haddad, I., Slowik, J. G., Canagaratna, M. R., Jayne, J. T., Platt, S. M., Bozzetti, C., Daellenbach, K. R., Fröhlich, R., Vlachou, A., Klein, F., Dommen, J., Miljevic, B., Jimenez, J. L., Worsnop, D. R., Baltensperger, U., and Prevot, A. S. H.: Inorganic Salt Interference on CO in Aerodyne AMS and ACSM Organic Aerosol Composition Studies, Environ. Sci. Technol., 50, 10494–10503, https://doi.org/10.1021/acs.est.6b01035, 2016.
Pope, C. A. and Dockery, D. W.: Health effects of fine particulate air pollution: Lines that connect, J. Air Waste Manage., 56, 709–742, https://doi.org/10.1080/10473289.2006.10464485, 2006.
Rai, P., Slowik, J. G., Furger, M., El Haddad, I., Visser, S., Tong, Y., Singh, A., Wehrle, G., Kumar, V., Tobler, A. K., Bhattu, D., Wang, L., Ganguly, D., Rastogi, N., Huang, R.-J., Necki, J., Cao, J., Tripathi, S. N., Baltensperger, U., and Prévôt, A. S. H.: Highly time-resolved measurements of element concentrations in PM10 and PM2.5: comparison of Delhi, Beijing, London, and Krakow, Atmos. Chem. Phys., 21, 717–730, https://doi.org/10.5194/acp-21-717-2021, 2021.
Samek, L., Stegowski, Z., Furman, L., Styszko, K., Szramowiat, K., and Fiedor, J.: Quantitative assessment of PM2.5 sources and their seasonal variation in Krakow, Water Air Soil Pollut., 228, p. 290, https://doi.org/10.1007/s11270-017-3483-5, 2017.
Samek, L., Stegowski, Z., Styszko, K., Furman, L., Zimnoch, M., Skiba, A., Kistler, M., Kasper-Giebl, A., Rozanski, K., and Konduracka, E.: Seasonal variations of chemical composition of PM2.5 fraction in the urban area of Krakow, Poland: PMF source attribution, Air Qual. Atmos. Hlth., 13, 89–96, https://doi.org/10.1007/s11869-019-00773-x, 2019.
Sandradewi, J., Prevot, A. S. H., Szidat, S., Perron, N., Alfarra, M. R., Lanz, V. A., Weingartner, E., and Baltensperger, U.: Using Aerosol Light Absorption Measurements for the Quantitative Determination of Wood Burning and Traffic Emission Contributions to Particulate Matter, Environ. Sci. Technol., 42, 3316–3323, https://doi.org/10.1021/es702253m, 2008.
Styszko, K., Samek, L., Szramowiat, K., Korzeniewska, A., Kubisty, K., Rakoczy-Lelek, R., Kistler, M., and Giebl, A. K.: Oxidative potential of PM10 and PM2.5 collected at high air pollution site related to chemical composition: Krakow case study, Air Qual. Atmos. Hlth., 10, 1123–1137, https://doi.org/10.1007/s11869-017-0499-3, 2017.
Tobler, A. K.: Characterization of NR-PM1 and source apportionment of organic aerosol in Krakow, Poland, https://doi.org/10.5281/zenodo.5482368, 2021.
Tobler, A., Bhattu, D., Canonaco, F., Lalchandani, V., Shukla, A., Thamban, N. M., Mishra, S., Srivastava, A. K., Bisht, D. S., Tiwari, S., Singh, S., Močnik, G., Baltensperger, U., Tripathi, S. N., Slowik, J. G., and Prévôt, A. S. H.: Chemical characterization of PM2.5 and source apportionment of organic aerosol in New Delhi, India, Sci. Total Environ., 745, 140924, https://doi.org/10.1016/j.scitotenv.2020.140924, 2020a.
Tobler, A. K., Skiba, A., Wang, D. S., Croteau, P., Styszko, K., Nęcki, J., Baltensperger, U., Slowik, J. G., and Prévôt, A. S. H.: Improved chloride quantification in quadrupole aerosol chemical speciation monitors (Q-ACSMs), Atmos. Meas. Tech., 13, 5293–5301, https://doi.org/10.5194/amt-13-5293-2020, 2020b.
Vasilescu, J., Marmureanu, L., Nemuc, A., Nicolae, D., and Talianu, C.: Seasonal Variation of the Aerosol Chemical Composition in a Romanian Peri-Urban Area, Environ. Eng. Manag. J., 16, 2491–2496, https://doi.org/10.30638/eemj.2017.258, 2017.
Watson, J. G.: Visibility: science and regulation, J. Air Waste Manage., 52, 628–713, https://doi.org/10.1080/10473289.2002.10470813, 2002.
Xu, W., He, Y., Qiu, Y., Chen, C., Xie, C., Lei, L., Li, Z., Sun, J., Li, J., Fu, P., Wang, Z., Worsnop, D. R., and Sun, Y.: Mass spectral characterization of primary emissions and implications in source apportionment of organic aerosol, Atmos. Meas. Tech., 13, 3205–3219, https://doi.org/10.5194/amt-13-3205-2020, 2020.
Yudovich, Y. E. and Ketris, M. P.: Chlorine in coal: A review, Int. J. Coal Geol., 67, 127–144, https://doi.org/10.1016/j.coal.2005.09.004, 2006.
Yus-Díez, J., Bernardoni, V., Močnik, G., Alastuey, A., Ciniglia, D., Ivančič, M., Querol, X., Perez, N., Reche, C., Rigler, M., Vecchi, R., Valentini, S., and Pandolfi, M.: Determination of the multiple-scattering correction factor and its cross-sensitivity to scattering and wavelength dependence for different AE33 Aethalometer filter tapes: a multi-instrumental approach, Atmos. Meas. Tech., 14, 6335–6355, https://doi.org/10.5194/amt-14-6335-2021, 2021.
Zaborowski, M. and Dworakowska, A.: Energy Efficiency in Poland – 2015 Review, Institute of Environmental Economics, Kraków, available at: https://iee.org.pl/index.php/project/energy-efficiency-in-poland-2015-review/ (last access: 9 August 2019), 2016.
Zimnoch, M., Wach, P., Chmura, L., Gorczyca, Z., Rozanski, K., Godlowska, J., Mazur, J., Kozak, K., and Jeričević, A.: Factors controlling temporal variability of near-ground atmospheric 222Rn concentration over central Europe, Atmos. Chem. Phys., 14, 9567–9581, https://doi.org/10.5194/acp-14-9567-2014, 2014.
Zimnoch, M., Samek, L., Furman, L., Styszko, K., Skiba, A., Gorczyca, Z., Galkowski, M., Rozanski, K., and Konduracka, E.: Application of Natural Carbon Isotopes for Emission Source Apportionment of Carbonaceous Particulate Matter in Urban Atmosphere: A Case Study from Krakow, Southern Poland, Sustainability, 12, 5777, https://doi.org/10.3390/su12145777, 2020.
Zotter, P., Herich, H., Gysel, M., El-Haddad, I., Zhang, Y., Močnik, G., Hüglin, C., Baltensperger, U., Szidat, S., and Prévôt, A. S. H.: Evaluation of the absorption Ångström exponents for traffic and wood burning in the Aethalometer-based source apportionment using radiocarbon measurements of ambient aerosol, Atmos. Chem. Phys., 17, 4229–4249, https://doi.org/10.5194/acp-17-4229-2017, 2017.