the Creative Commons Attribution 4.0 License.
the Creative Commons Attribution 4.0 License.
 | 06 Oct 2021
Sources of black carbon at residential and traffic environments obtained by two source apportionment methods
Sanna Saarikoski
Jarkko V. Niemi
Minna Aurela
Liisa Pirjola
Anu Kousa
Topi Rönkkö
Hilkka Timonen
This study investigated the sources of black carbon (BC) at two contrasting urban environments in Helsinki, Finland: residential area and street canyon. The measurement campaign in the residential area was conducted in winter–spring 2019, whereas in the street canyon the measurements were carried out in autumn 2015. The sources of BC were explored by using positive matrix factorization (PMF) for the organic and refractory black carbon (rBC) mass spectra collected with a soot particle aerosol mass spectrometer (SP-AMS). Based on the PMF analysis, two sites had different local BC sources; the largest fraction of BC originated from biomass burning at the residential site (38 %) and from the vehicular emissions in the street canyon (57 %). Also, the mass size distribution of BC diverged at the sites as BC from traffic was found at the particle size of ∼100–150 nm whereas BC from biomass combustion was detected at ∼300 nm. At both sites, a large fraction of BC was associated with urban background or long-range-transported BC indicated by the high oxidation state of organics related to those PMF factors.
The results from the PMF analysis were compared with the source apportionment from the Aethalometer model calculated with two pairs of absorption Ångström values. It was found that several PMF factors can be attributed to wood combustion and fossil fuel fraction of BC provided by the Aethalometer model. In general, the Aethalometer model showed less variation between the sources within a day than PMF, indicating that it was less responsive to the fast changes in the BC sources at the site, or it could not distinguish between as many sources as PMF due to the similar optical properties of the BC sources. The results of this study increase understanding of the limitations and validity of the BC source apportionment methods in different environments. Moreover, this study advances the current knowledge of BC sources and especially the contribution of residential combustion in urban areas.
- Article
(3473 KB) - Full-text XML
-
Supplement
(3162 KB) - BibTeX
- EndNote


Black carbon (BC) is a light-absorbing carbonaceous aerosol component that has significant climate impacts. It has a positive radiative forcing on climate (IPCC, 2014), and when deposited on snow, it can lead to the reduction of the earth's surface albedo in snow-covered areas (Hansen and Nazarenko, 2004). Besides climatic effects, BC has been associated with adverse effects on public health in urban areas (Janssen et al., 2011; Segersson et al., 2017; WHO, 2012). Atmospheric BC is characterized by a substantial spatial and temporal variation (Luoma et al., 2021) because of its unequally located sources and restricted atmospheric lifetime from days to weeks. The largest BC concentrations are typically measured in urban areas close to the source; however, BC can also be transported long distances with the air masses (Ikeda et al., 2017). In particular the transport of BC to Arctic areas has been associated with a substantial impact on climate (AMAP, 2015).
BC is a primary particulate aerosol component that originates from incomplete combustion processes. It consists predominantly of agglomerated submicron particles (<1 µm), but shortly after emission, BC becomes mixed with other aerosol chemical species, i.e., inorganics such as sulfate, nitrate, and ammonium, and organic compounds. In urban areas, the main sources of BC are typically transportation, residential combustion, and industry (Bond et al., 2013). In recent years, BC emissions from vehicular traffic have been noticed to decrease due to technology advancements and legislation (Luoma et al., 2021; Pirjola et al., 2016; Järvinen et al., 2019); however, the regulation of residential combustion emissions is still in its infancy in many European countries (Klimont et al., 2017; Kukkonen et al., 2020). That trend may lead to a change in the BC source distribution by increasing the contribution of BC from residential combustion relative to the regulated source sectors, i.e., engine and industrial emissions.
The sources of BC can be investigated with various methods. The origin of BC can be examined with statistical methods, e.g., with positive matrix factorization (PMF; Paatero and Tapper, 1994; Paatero, 1997), which is a receptor model that does not need a priori information on the profiles or time trends of the factors. PMF combined with an Aerodyne aerosol mass spectrometer (AMS; Jayne et al., 2000) is a powerful tool to investigate the sources of submicron non-refractory particulate matter (e.g., Ulbrich et al., 2009); however, AMS equipped with a laser vaporizer (soot particle aerosol mass spectrometer (SP-AMS); Onasch et al., 2012) can extend the source apportionment to refractory material such as refractory black carbon (rBC) and metals. For example, Rivellini et al. (2020) found five sources for rBC, trace metals, and organics in the ambient air of Singapore by applying PMF to the SP-AMS data while Bibi et al. (2021) utilized PMF to separate rBC originating from bonfires and domestic wood burning in UK. On the other hand, Saarikoski et al. (2019) have investigated the sources of rBC in an underground mine with PMF, and Carbone et al. (2019) have distinguished fuel- and lubricating-oil-related rBC in the diesel engine exhaust particles in the laboratory by using PMF for the mass spectra of rBC, organics, and metals. One disadvantage of using PMF for the SP-AMS data is that the mass spectra of rBC contain relatively few fragments (typically the largest signal is observed for – fragments), and therefore, the identification of the sources is typically based on organic fragments. However, the rBC mass spectra have been noticed to be somewhat source specific, differing for example for laboratory-generated rBC particles and particles from aircraft turbine (Corbin et al., 2014), diesel truck, and biomass burning particles (Onasch et al., 2015) and ambient hydrocarbon-like organic aerosol (HOA) and oxygenated organic aerosol (OOA) factors (Rivellini et al., 2020). One option to improve the separation of BC sources is to include larger Cx fragments in the PMF matrix, as was done in the study of Bibi et al. (2021), where the addition of fullerene signals (for example ) increased the number of meaningful sources.
The origin of BC can also be investigated by taking advantage of the absorption spectra of light-absorbing material in particles. BC is generally a powerful light absorber over the entire visible wavelength range. However, particles from fossil fuel and biomass combustion are characterized by different spectral dependencies, which allows us to distinguish these sources based on their absorption properties. BC from fossil fuel combustion is assumed to absorb in the long visible and near-infrared wavelengths (∼600–950 nm), whereas other light-absorbing compounds, for example brown carbon from biomass burning, also absorb light close to the near-ultraviolet and lower-visible wavelengths (∼300–500 nm; Kirchstetter et al., 2004; Laskin et al., 2015).
The source apportionment method based on the light absorption at different wavelengths is usually called an Aethalometer model (Sandradewi et al., 2008a, b; Herich et al., 2011; Wang et al., 2011a, b) according to the multi-wavelength optical instrument typically used in the measurements. The Aethalometer model assumes that the absorption from fossil fuel particles follows the spectral dependency of λ−αff and biomass combustion dependency of λ−αwb in which the exponents are referred to as absorption Ångström exponents (α) for fossil fuel (αff) and wood burning (αwb). One of the largest sources of uncertainty in the Aethalometer model is related to the selection of αff and αwb values (Healy et al., 2017; Zotter et al., 2017) as the α values depend on the sampling site and selected wavelength range or pairs. It has been found that αff is typically in the range of ∼0.8–1.2 in ambient air whereas αwb can vary from 1.6 to 2.2 (Sandradewi et al., 2008b; Herich et al., 2011; Sciare et al., 2011; Zotter et al., 2017; Helin et al., 2018). It has also been shown that α values are affected by the core size of the BC particles, width of the size distribution, and chemical composition and thickness of the coating on the BC particles (Gyawali et al., 2009; Lack and Cappa, 2010; Lack and Langridge, 2013; Virkkula, 2021).
Besides PMF and Aethalometers, the sources of BC can be investigated by a chemical mass balance (CMB) model (Friedlander, 1973; Cooper and Watson, 1980), which is also a receptor model. However, different from PMF, it requires a prior knowledge of the sources (source profiles) relevant to the measurement site. Additionally, AMS PMF and the Aethalometer model are typically applied to the high-time-resolution data whereas CMB has been used mostly for the filter samples (Chen et al., 2012; Yoon et al., 2018). From the filter samples, the origin of BC can also be explored by analyzing BC (or elemental carbon, EC) for radiocarbon 14C. Measuring the ratio of 14C to a stable carbon isotope, typically 12C, provides information on the contributions of fossil and modern EC (e.g., in Szidat et al., 2004; Huang et al., 2006; Yttri et al., 2011).
The aim of this study was to investigate the sources of BC at two contrasting urban environments in Helsinki, Finland: residential area and street canyon. In this study, the sources of BC were explored by using PMF for the data collected with the SP-AMS. PMF analysis was applied to the organic data matrix that was complemented with three dominant refractory black carbon fragments: , , and . The results from the PMF analysis were compared with the light absorption and source apportionment results from the multi-wavelength Aethalometer. Although several studies have been published on the sources of BC in recent years, to our knowledge, this is the first time the results from the PMF analysis have been compared with the results from the Aethalometer model for BC at two measurement environments. Additionally, the emission factors for the biomass burning and traffic-related BC were estimated at the residential site. This study utilized the state-of-the-art aerosol instruments and source apportionment tools to provide novel information on local, regional, and remote sources of BC in Nordic urban environments. That data are highly required by the modelers and authorities when assessing the climate and air quality impact of BC as well as directing the emission legislation and emission mitigation actions.
2.1 Measurement sites
2.1.1 Residential area
The measurements were conducted in the residential area in Pirkkola, Helsinki (Fig. S1 in the Supplement), from 15 January to 16 April 2019. The measurement station was located in the middle of a detached housing area built primarily in the 1940s, and it was operated by the Helsinki Region Environmental Services Authority (HSY). One of the main sources of particles in Pirkkola in the cold season is wood burning. Unfortunately, there are no detailed statistics on wood burning in Pirkkola, but in general, fireplaces are used in ∼80 % of detached and semi-detached houses in the Helsinki metropolitan area (Ohtonen et al., 2020); however, the use of biomass combustion as a primary heating source is scarce. Furthermore, many of the houses in Helsinki have wood-heated sauna stoves (28 % of detached and semi-detached houses in the Helsinki metropolitan area on average). In addition to residential biomass burning, there was also some oil (light fuel oil) combustion in domestic boilers for the heating purposes in Pirkkola. In this study, we did not focus on oil burning as the emissions from oil burning did not impact BC concentrations (see Fig. S2). Oil combustion affected CO2 and NO concentrations, also with a minor influence on particle number concentration (>5 nm particles; measured with CPC A20, Airmodus, Finland). Regarding traffic, there are some small- and medium-sized streets (traffic volume of 3000–8000 vehicles per day; statistics by the city of Helsinki) in the area that can have an influence on the pollutants measured at the site. Additionally, there are three busy roads within a 1 km radius from the site with the approximate traffic volumes of 124 000 (Ring road I; heavy duty 14 %), 67 000 (Highway E12; heavy duty 16 %) and 75 000 (Highway 45; heavy duty 16 %) vehicles per workday in 2019 (Statistics by the city of Helsinki). The Pirkkola site is described in more detail in Kuula et al. (2020).
2.1.2 Street canyon
The measurements in the street canyon were performed at the Mäkelänkatu supersite (Fig. S1) between 2 and 22 October 2015. The SP-AMS measurements were not continuous at the street canyon site as they consisted of eight separate time periods with a total of 195 h of data. The measurement station was located next to a six-lane street with an approximate traffic volume of 28 000 vehicles per workday (12 % of heavy duty) in 2015 (statistics by the city of Helsinki). The major particle source at the site is traffic, whereas the contribution of biomass burning to particle concentrations can be assumed to be minor since there are only very few small-house areas nearby. Also, the measurement period was in autumn when the need for the additional heating with wood was not notable (ambient temperature varied from −2 to 18 ∘C with an average of 7 ∘C in October 2015). The Mäkelänkatu supersite has been described in more detail in Hietikko et al. (2018) and Barreira et al. (2021). Besides local sources, long-range transport (LRT) from central and eastern Europe can have a significant impact on particle concentrations at all locations in the Helsinki area (e.g., in Niemi et al., 2009; Barreira et al., 2021).
2.2 Instruments
2.2.1 Soot particle aerosol mass spectrometer (SP-AMS)
The concentrations, mass spectra, and size distributions of rBC were determined by the soot particle aerosol mass spectrometer (Aerodyne Research Inc, Billerica, US; Onasch et al., 2012). The SP-AMS is different from the standard AMS as it has an additional laser vaporizer that allows the determination of refractory particulate species. It is possible to operate the SP-AMS only with the laser vaporizer; however, both tungsten and laser vaporizers were utilized in this study in order to also measure all non-refractory particulate material, i.e., organics, sulfate, nitrate, ammonium, and chloride. Also, the potassium signal was extracted from the data, but it was used only for the validation of the PMF results. The SP-AMS size distributions were measured in a standard particle time-of-flight (PToF) mode, and because of the aerodynamic lens in the SP-AMS, the size range was from ∼50 nm to 1 µm. The SP-AMS was operated with a time resolution of 90 and 30 s at the residential and street canyon sites, respectively.
The SP-AMS data were analyzed with IGOR 6.37 SQRL 1.62A and PIKA 1.22A softwares. Ionization efficiency for nitrate was determined by calibrating the instrument with ammonium nitrate while the relative ionization efficiency for rBC (0.05) was based on the calibrations with Regal black. A collection efficiency of 1 was applied to both data sets. Compared to the Aethalometer, rBC from the SP-AMS was consistently smaller than BC from the Aethalometer (Fig. S3). Although the measurements in the SP-AMS and Aethalometer are based on different techniques, the main reason for the lower rBC concentrations measured by the SP-AMS was likely to be the imperfect laser-to-particle beam alignment. Therefore, rBC from the SP-AMS data was normalized to the Aethalometer BC concentrations that were assumed to represent total ambient BC more realistically.
The concentrations of non-refractory AMS species (organics, sulfate, ammonium, nitrate, chloride) were utilized in this study only for calculating the coating factor. In order to validate the non-refractory AMS concentrations, the sum of the SP-AMS species (excluding rBC) and BC from the Aethalometer was compared with the concurrent PM1 measurements (Grimm model EDM 180, Grimm Aerosol Technik, Ainring, Germany) at the residential site. The sum of the SP-AMS species and AE33 BC made on average 71 % of Grimm PM1 with a moderate correlation (Pearson's correlation coefficient r=0.888; Fig. S4a). A similar comparison was made by using the composition dependent collection efficiency (CDCE; Middlebrook et al., 2012) instead of constant CE=1. The time series of the CDCE are shown in Figs. S4c and S5 for both sites with the average CDCE being 0.59 and 0.49 for the residential and site street canyon sites, respectively. With the CDCE, the sum of the SP-AMS species and AE33 BC was closer to PM1 from Grimm (∼85 % of PM1); however, the correlation was slightly poorer (r=0.876; Fig. S4b). For the street canyon site, PM1 comparison could not be calculated as there was no PM1 mass measurement at that time. The uncertainty in the coating factor due to the CE value of 1 will be discussed in Sect. 3.3.
2.2.2 Aethalometer (AE33)
Black carbon was measured optically by using a dual-spot Aethalometer (AE33, Aerosol d.o.o., Ljubljana, Slovenia; Drinovec et al., 2015). AE33 operated with a flow rate of 5 L min−1 and a time resolution of 1 min. A size cut at 1 µm was carried out by using a sharp cut cyclone (Model SCC1.197, BGI Inc., Butler, NJ, USA) in the inlet. The multiple-scattering enhancement factor C of 1.57 was utilized (Drinovec et al., 2015), and the default mass absorption coefficient values were used. Since the Aethalometer determined BC optically, it should be referred to as equivalent BC (eBC); however, for simplicity, it is called BC in this paper.
2.2.3 Auxiliary measurement
The 24 h PM10 filter samples were collected at both sites during the campaigns. PM10 samples were collected continuously at the residential site (a total of 89 samples), whereas in the street canyon, PM10 filters were collected every 3 d. PM10 filters were analyzed for biomass burning tracers and monosaccharide anhydrides (MAs), i.e., levoglucosan, mannosan, and galactosan, with a liquid chromatograph mass spectrometer (Saarnio et al., 2010b). It should be noted here that the MA results from the street canyon were not utilized in this study since the SP-AMS and PM10 sampling was not continuous in the street canyon, and PM10 filter sampling overlapped the SP-AMS measurements only during short time periods. However, the average concentration of levoglucosan was 42 ng m−3 in PM10 in October 2015 in the street canyon. For the comparison, the average levoglucosan concentration at the residential site was more than double that (110 ng m−3) between 15 January and 16 April 2019.
The concentrations of nitrogen oxides (NO, NOx, and NO2) were measured at the residential and street canyon sites with 1 min time resolution (Horiba APNA 370, Kyoto, Japan). CO2 was measured only at the residential site (1 min time resolution; Vaisala GMP343, Vantaa, Finland). Regarding the meteorological parameters, only wind speed and wind direction were measured directly at the residential site. Ambient temperature data were taken from the Kumpula weather station that was located approximately 5 km southeast from the residential site. The SP-AMS data from the street canyon were not analyzed in terms of meteorology as the SP-AMS measurements were not continuous and the measurement period was rather limited. Both sites also had other air quality measurements such as PM2.5 and PM10, but those results are not included in this paper.
BC concentrations at the residential site were compared with the concurrent measurements at the regional background air quality monitoring station (Luukki, Espoo; ∼15 km northwest from residential site in Pirkkola, Fig. S1). BC at the Luukki site was measured with a multi-angle absorption photometer (MAAP, model 5012, Thermo Fisher Scientific, Waltham, US) with 1 min time resolution. For the comparison of AE33 with MAAP (Sect. 3.1), BC from the AE33 was multiplied by a factor of 0.75 (Helin et al., 2018). All the other AE33 data are presented without the conversion factor.
2.3 Source apportionment
2.3.1 AMS PMF
The sources of BC were explored by analyzing the SP-AMS high-resolution (HR) mass spectra with PMF (CU AMS PMF tool v. 2.08D; Paatero and Tapper, 1994; Ulbrich et al., 2009). The data matrix contained organic fragments and three rBC fragments, , , and . For the larger carbon fragments, the signal was close to the detection limit, and therefore, they were not included in the PMF analysis. The number of factors was varied from two to eight (Fig. S6), of which the solutions with three to five factors were investigated in more detail. Before the PMF analyses, the SP-AMS data from the residential and street canyon sites were averaged to 10 and 5 min, respectively. For the street canyon data, the CHO+ fragment at mass-to-charge ratio () 29 was excluded from the data matrix. The reason for that was that at 28 was fluctuating due to the unresolved issue in the instrument, which caused a large uncertainty for the determination of the isotope 15NN+ at 29 and also for CHO+ that was overlapping 15NN+.
The mass spectra, time series, and diurnal trends for three- to five-factor PMF solutions are shown in Figs. S7–S12. For both sites, in three-factor solutions the factors were identified as HOA, biomass burning organic aerosol (BBOA), and low-volatility OOA (LV-OOA). The mass spectra of HOA had a typical hydrocarbon pattern with the largest signals for , , , , , and at 41, 43, 55, 57, 69 and 71, respectively, and a large hydrogen-to-carbon ratio (H:C) and small oxygen-to-carbon ratio (O:C) for the organic fragments. At the residential site, HOA peaked during the morning rush hour at 09:00–10:00 LT and again later in the evening at 21:00–22:00 LT. A similar morning peak was found for HOA in the street canyon, but the second maximum appeared earlier at 17:00–18:00 LT during the evening rush hour. The mass spectra of BBOA had the largest signal for oxygenated fragments and at 60 and 73, respectively, which are typical fragments for the biomass burning emissions (Alfarra et al., 2007). In terms of diurnal trends, BBOA had the maximum between 20:00 and 21:00 LT at the residential site whereas in the street canyon BBOA concentration was slightly smaller in daytime, from 06:00 to 17:00 LT, than at the other times of the day. LV-OOA had the largest signal for and CO+ at 44 and 28, respectively, and was highly oxygenated with a large O:C. The diurnal pattern of LV-OOA was flat at the residential site, but in the street canyon there was a drop in the LV-OOA concentrations from 10:00 to 19:00 LT.
When the number of factors was increased from three to four, LV-OOA was split into LV-OOA and semi-volatile OOA (SV-OOA) at the residential site (Fig. S13a). Additionally, the mass contribution of HOA decreased when going from a three- to four-factor solution while the contribution of BBOA remained almost at the same level. In a four-factor solution, SV-OOA was less oxidized than LV-OOA with the largest signal for C2H3O+ at 43. In terms of diurnal pattern, SV-OOA had clearly smaller concentrations from 09:00 to 19:00 LT at the residential site. Also in the street canyon, the fourth factor was identified as SV-OOA. SV-OOA obtained mass from LV-OOA and BBOA (Fig. S14a). Similar to the residential site, SV-OOA had the largest signal for C2H3O+ at 43 in the mass spectra and in the diurnal trend a decrease in daytime. However, in the street canyon smaller concentrations in daytime lasted shorter in time (only from 11:00 to 17:00 LT).
In the five-factor solution, LV-OOA was split into two factors, of which one was related to the long-range-transported particles (called LV-OOA-LRT) at the residential site. LV-OOA-LRT had very similar mass spectra to other LV-OOA, but their time series and diurnal trends differed significantly as LV-OOA-LRT was observed mostly at the end of the measurement period in April. LRT particles probably originated from agricultural burning or wildfires since they had a high contribution of organics and BC; however, at the end of the LRT episode, inorganic species, sulfate, nitrate, and ammonium, were also mixed with the biomass burning emissions.
In the street canyon, the fifth factor was identified as coffee roastery organic aerosol (CoOA). CoOA contributed only 3 % to the total signal (Fig. S14a), but it had very distinctive mass spectra. The mass spectra of CoOA had pronounced peaks at 55, 67, 82, and 109 corresponding to the HR fragments of C3H5N+, , , and , respectively, those fragments being characteristic for caffeine (Carbone et al., 2014). CoOA has been observed earlier in Helsinki at the SMEAR III station with a contribution of 1 % to organics (Timonen et al., 2013). However, the street canyon site utilized in this study was located much closer to the coffee roastery (∼600 m north from the roastery) than SMEAR III (∼1.5 km northeast from the roastery). The emissions from the coffee roastery were observed in three time periods between 06:00 and 18:00 LT, which was presumable because the coffee roastery operated only in daytime.
Regarding the six-factor solution, SV-OOA was split into two similar factors at the residential site. In the seven-factor solution, there was an additional factor that contained practically only rBC fragments, and in the eight-factor solution HOA was split into two identical factors. In the street canyon, the six-factor solution split LV-OOA. In the seven-factor solution, another SV-OOA appeared while in the eight-factor solution HOA was divided. Since the PMF solutions from six to eight factors did not provide any additional information, from now on, only the solutions with three to five factors are investigated in more detail.
The BBOA factor was compared with MAs analyzed from the 24 h PM10 filter samples collected at the residential site. It was found that for the three-factor solution the correlations between BBOA and levoglucosan and BBOA and mannosan were weaker than for four- and five-factor solutions (Fig. S15). In contrast, for BBOA and galactosan, the correlation was strongest for the three-factor solution, with Pearson's correlation coefficient (r) decreasing slightly when increasing the number of factors. In terms of the non-refractory species measured by the SP-AMS, sulfate correlated strongest with LV-OOA, with r increasing significantly going from four to five factors (Fig. S16). Also, nitrate and ammonium had the largest r with LV-OOA, but for them, the difference between the number of factors was smaller. Chloride and potassium correlated most strongly with BBOA and HOA, the correlation between potassium and BBOA being slightly smaller for the three-factor solution than for four- and five-factor solutions. None of the non-refractory species correlated clearly with SV-OOA or LV-OOA-LRT. HOA correlated strongly with NO and NOx, with r being larger for four- and five-factor solutions than for the three-factor solution.
In the street canyon, sulfate, nitrate, and ammonium correlated with LV-OOA with no difference between the number of factors (Fig. S17). Different from the residential area, chloride and potassium had the smallest r with BBOA and HOA. CoOA had a modest correlation with chloride. In terms of nitrogen oxides, HOA had the largest (but moderate) correlation with NO2. MAs were measured at the street canyon site only every 3 d and therefore were not compared with BBOA.
The contribution of rBC fragments to the total signal in the mass spectra of the PMF factors is given in Tables S1 and S2 in the Supplement. At the residential site, the contribution of rBC was largest to the mass spectra of BBOA in three- and four-factor solutions while in the five-factor solution the contribution of rBC was largest for LV-OOA. In the street canyon, the contribution of rBC was largest to HOA independent of the number of factors. The contribution of rBC to HOA was more than double in the street canyon compared to that at the residential site. In contrast, the mass spectra of BBOA had several times more rBC at the residential site than in the street canyon. Also, the mass spectra of organics in BBOA differed between the residential and street canyon sites as the contribution of (at 60) and (at 73) was much larger at the residential site compared to the contribution in the street canyon, indicating that BBOA at the street canyon site was probably more aged with its mass spectra resembling secondary organic aerosol (SOA). That can make the separation of primary and secondary OA factors more complicated at the street canyon site.
The distribution of rBC between the PMF factors is shown in Figs. S13b and S14b from three- to five-factor solutions. Compared to the total mass spectra utilized in the PMF analysis (organics+rBC), BBOA and HOA had larger contributions to rBC than to organics+rBC at the residential site. The contribution of BBOA to rBC was smaller in the five-factor solution than in three- and four-factor solutions while HOA had the smallest contribution in the four-factor solution. On the other hand, SV-OOA and LV-OOA and LV-OOA-LRT had smaller contributions to rBC than to organics+rBC, excluding LV-OOA in the five-factor solution that had a larger contribution to rBC than to organics+rBC. In the street canyon, HOA had a larger and BBOA a smaller contribution to rBC than to organics+rBC. For LV-OOA and SV-OOA the contributions to organics+rBC and rBC were almost equal.
The sum of , , and fragments included in the PMF input data matrix was compared with the sum of the same fragments found in the PMF solutions at the residential site and street canyon (Figs. S18 and S19). It can be seen from the figure that for the residential site, the correlation was largest for the five-factor solution while in the street canyon correlation coefficient was slightly smaller for the five-factor solution than for three- and four-factor solutions. Somewhat similar trends were obtained when the sum of , , and fragments was replaced by high-resolution rBC (HRBC) (including all fragments in the mass spectra) calculated in PIKA. In general, the PMF solution was able to explain the majority of the variation in , , and fragments at the residential site; however, in the street canyon, the difference between the sum of , and fragments in PIKA and the PMF solution was larger. In general, the unresolved mass (organics+rBC) was 1.9 %, 2.2 %, and 1.6 % at the residential site and 3.6 %, 3.5 %, and 2.6 % in the street canyon for three-, four-, and five-factor solutions, respectively.
PMF solutions from three to five factors were examined for the rotational freedom by varying fpeak and for the accuracy with bootstrapping and multiple seeds. Based on these validation tests, it was found that for the street canyon data, four- and five-factor solutions did not provide consistent results, especially the contribution of CoOA, which varied significantly. Therefore, the three-factor solution was selected to represent the sources of rBC in the street canyon most accurately. For the residential site, the five-factor solution was chosen as it was found to explain the variation in the rBC sources most realistically.
Detailed figures on the residuals for the chosen solutions are presented in Figs. S20 and S21. For the residential site (five factors), there was some unexplained mass during the daytime and especially in the evening, shown by the diurnal variation in the residuals. That is, however, in line with Frölich et al. (2015), who noticed that in the evening when the concentration of organics was highest the scaled residuals in PMF tended to be slightly larger than at the other times of the day. In terms of mass spectra, the largest residuals were calculated for the , CO+, and fragments, but relative to the measured signal, they did not stand out in the mass spectra. In the street canyon, there was some unexplained mass during the morning rush hour and evening. The largest absolute residual was calculated for fragment followed by and CO+, but similar to the residential site, the residuals for these fragments did not distinguish from the others when the residuals were calculated relative to the measured signal.
For the comparison, PMF was also applied to the organic mass spectra without the Cx fragments included to examine whether the rBC fragments affected the PMF solutions. The five-factor solution for the residential site and three-factor solution for the street canyon data are presented in Fig. S22 for organics. Very similar factors were obtained for organics compared to those with organics+rBC for both data sets (Figs. S23 and S25). Regarding the time series (Figs. S24 and S26), only LV-OOA differed slightly when PMF was applied to only organics compared to PMF applied to organics+rBC at the residential site.
In the following chapters, we discuss only rBC associated with the PMF factors. Therefore, rBC related to BBOA, HOA, LV-OOA, SV-OOA, and LV-OOA-LRT factors is hereafter referred to as BCBBOA, BCHOA, BCSV-OOA, BCLV-OOA, and BCLV-OOA-LRT, respectively. For simplicity, rBC was replaced by BC.
2.3.2 Ångström exponent and Aethalometer model
Absorption Ångström exponent values were calculated by using two wavelengths (470 and 950 nm) with the equation
where babs is aerosol light absorption coefficient given by the AE33.
The fraction of wood burning BC (BCwb) was calculated by using the Aethalometer model (Sandradewi et al., 2008a, b):
Two pairs of Ångström exponent values were utilized to obtain BC associated with fossil fuel (BCff) and wood burning (BCwb): αff and αwb of 0.9 and 1.68 (Zotter et al., 2017), and instrument default values αff and αwb of 1 and 2, respectively. In the previous work of Helin et al. (2018), α values equal to αff=1.10 and αwb=1.60 in the street canyon and αff=0.95 and αwb=1.60 at the detached house area were estimated for aerosol in the Helsinki area based on the concurrent levoglucosan analysis. Those values were not utilized in this study as the data of Helin et al. (2018), and this study differed in site locations, measurement year, and the AE33 tape batch. Additionally, the aim of this study was to select contrasting αff–αwb pairs to investigate the impact of αff–αwb values on the BC source apportionment. The same αff–αwb pairs that were used in this study have also been utilized in Virkkula (2021), who modeled the uncertainties related to the absorption by eBC from fossil fuel and wood burning with a core–shell Mie model.
3.1 Sources of BC in the residential area
The average (± SD) BC concentration was 0.86 (±1.5) µg m−3 at the residential site during the measurements from 15 January to 16 April 2019 (1 h averaged AE33 data). Regarding the sources of BC, five PMF factors were found to explain the variation in BC at the residential site. On average, the largest fraction of BC was related to biomass burning (BCBBOA; 38 %; Fig. 1) followed by BC associated with the LV-OOA (BCLV-OOA; 27 %) and HOA (BCHOA; 17 %) factors. BC attributed to the SV-OOA (BCSV-OOA) and LV-OOA-LRT (BCLV-OOA-LRT) factors had similar contributions (9 %).
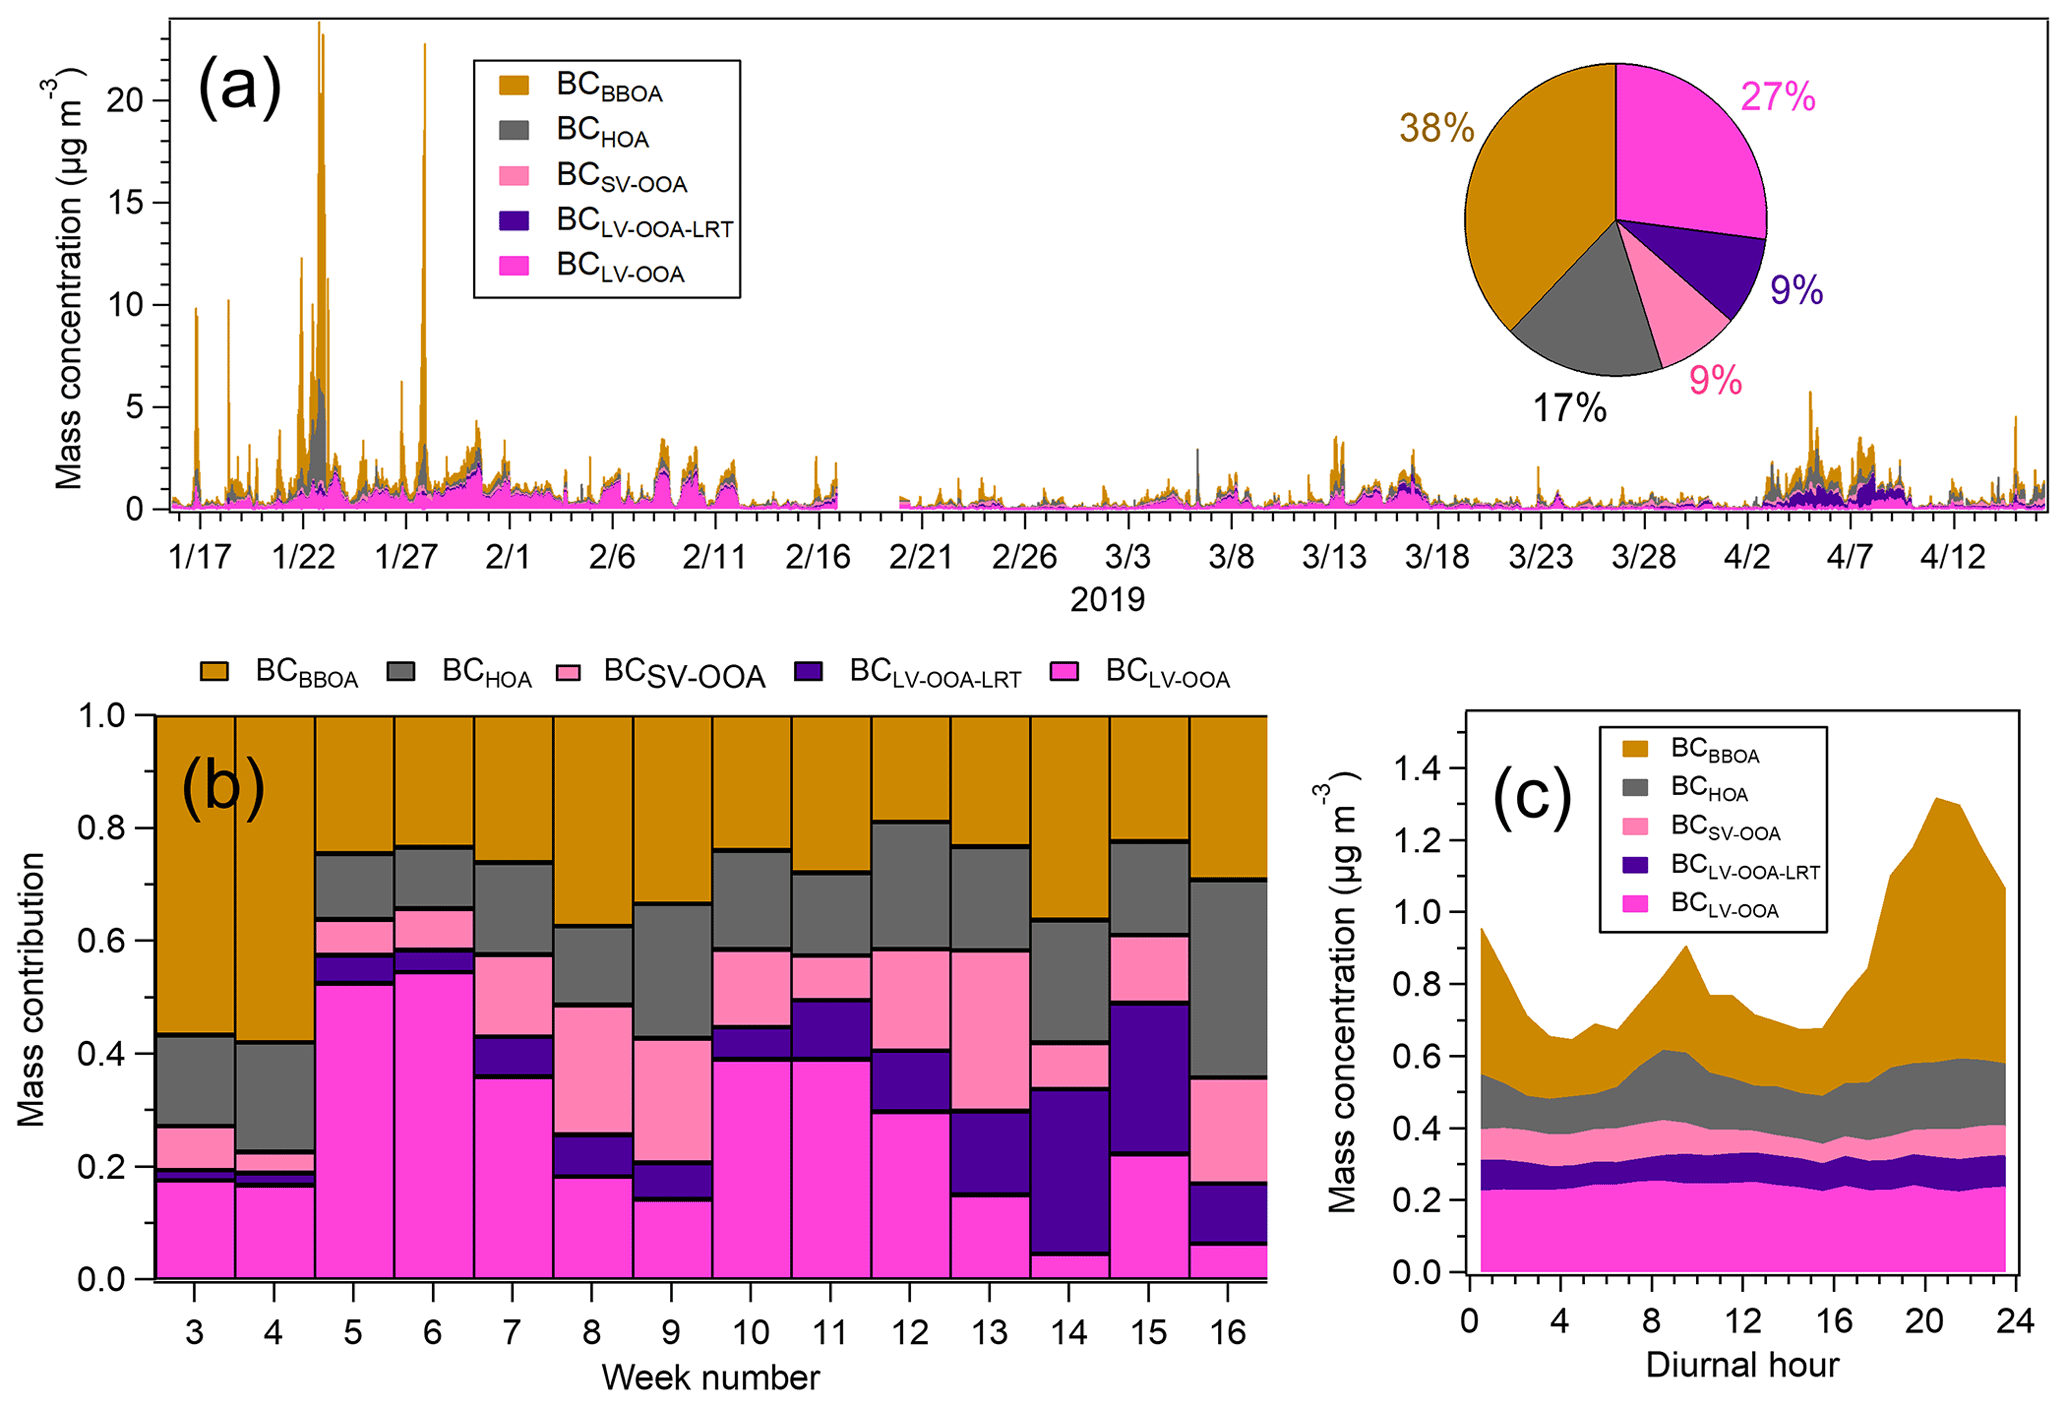
Figure 1Source apportionment of BC at the residential site by using PMF for the SP-AMS data. Time series with average contributions (a), weekly average contributions (b), and diurnal variations (c). Time series in (a) are presented with 10 min time resolution.
BCBBOA originated mostly from local small-scale wood burning. The majority of the houses in the area had at least one fireplace, and since the measurements were carried out during the cold season, fireplaces were used frequently in many houses. In particular at the beginning of the measurement campaign, the ambient temperature was low, reaching the campaign minimum of −21 ∘C (1 h average) on 22 January 2019 (Fig. S27). On that day, the BC concentration had a campaign maximum of 24 µg m−3 (10 min average), and BCBBOA constituted as much as 80 % of total BC. In addition to 22 January, there were several episodes of biomass smoke during the first 2 weeks of the campaign. On average, the fraction of BCBBOA was 60 % in the first 2 weeks, after which it decreased to 23 %–37 % in terms of weekly averages (Fig. 1b).
BCBBOA had a clear maximum in the evening between 20:00 and 22:00 LT but also a small increase in the morning between 09:00 and 10:00 LT (Fig. 1c). Extensive use of fireplaces in the evening for heating purposes together with heating of sauna stoves was a likely cause of large evening peaks. Also, temperature and wind speed typically decreased in the evening (Fig. S28), causing poor atmospheric dilution. In general, the largest BCBBOA concentrations were observed when the temperature was below , but besides that, the temperature dependency of BCBBOA was small (Fig. S29). Regarding different days of the week, the contribution of BCBBOA was slightly larger on Saturday than on other days, which can be explained by the tradition of heating sauna stoves on Saturday evening.
In the earlier study conducted in the Helsinki residential area (Helin et al., 2018), the average contribution of BCwb to total BC was 46 %±13 % in winter calculated with the Aethalometer model. That is a larger contribution than the campaign average percentage obtained in this study (38 %), however, it is smaller than the average contribution during the first 2 weeks of the measurements (60 %). Helin et al. (2018) detected a similar diurnal pattern with the BCwb maximum in the evening, but in their study an increase in BCff was also observed in the evening concurrently with BCwb. In other locations in Europe, the contribution of wood burning to BC has been measured to vary in the range of 7 %–88 % in wintertime (Sandradewi et al., 2008b; Herich et al., 2011; Sciare et al., 2011; Drinovec et al., 2015; Becerril-Valle et al., 2017), with the smallest contributions typically measured at urban locations and the largest values in rural areas.
BCHOA was mostly associated with vehicle exhaust emissions. BCHOA peaked between 08:00 and 10:00 LT in the morning, and the concentrations started to increase again after 16:00 LT and stayed elevated over midnight. The morning peak is probably related to the morning rush hour even though there was not much vehicle traffic near the site. However, as mentioned earlier, there were three large roads within ∼1 km of the site that could have also caused BCHOA. Elevated BCHOA concentrations in the evening were likely to be related to both the evening traffic and poor atmospheric mixing conditions. Moreover, BCHOA was smaller on weekends than weekdays, indicating its origin being mostly in exhaust emissions. In terms of ambient temperature, the largest BCHOA concentrations were detected with the lowest temperatures, similar to BCBBOA (Fig. S29).
BCLV-OOA was likely related to regional urban background and/or long-range-transported BC as the related PMF factor (LV-OOA) correlated with inorganic species, sulfate, nitrate, and ammonium. BCLV-OOA concentrations were slightly larger at the beginning of the campaign, and the contribution of BCLV-OOA to total BC was largest during the third and fourth weeks of the measurements (Fig. 1b). The diurnal trend of BCLV-OOA was very flat, with no dependence on the time of the day. Regarding temperature, the largest BCLV-OOA concentrations were detected when the ambient temperature was near zero (Fig. S29).
BCLV-OOA-LRT was especially attributed to the long-range-transported biomass smoke as BCLV-OOA-LRT peaked in April when two LRT episodes were observed. The first episode lasted almost 4 d (from 2 to 6 April 2019) while the second episode lasted only slightly longer than 1 d (from the late evening of 6 April to the early hours of 8 April 2019). According to the calculated air mass back trajectories (Fig. S30), LRT aerosol arrived in Helsinki from agricultural burning or wildfires in eastern Europe. During those episodes, BCLV-OOA-LRT composed 50 % of total BC. However, in terms of weekly averages, the largest contribution of BCLV-OOA-LRT was 30 % in week 14 (Fig. 1b). BCLV-OOA-LRT did not display a clear diurnal trend. In terms of ambient temperature, the largest BCLV-OOA-LRT concentrations were observed when the temperature was above 0 ∘C (Fig. S29), which was expected as the LRT episodes detected in Finland are mostly related to the transport of warm air masses from the southeast to southwest sector (central or eastern Europe). It has been shown in earlier studies that BC concentrations are typically 2–4 times larger during the LRT episodes compared to the non-episodic periods (Saarikoski et al., 2007; Saarnio et al., 2010a). LRT episodes observed in Helsinki in April 2019 will be discussed in more detail in another paper.
BCSV-OOA had only a minor (9 %) contribution to total BC at the residential site. In terms of time series, BCSV-OOA concentration did not change much during the measurements; however, BCSV-OOA concentration was smaller from 09:00 to 21:00 LT than at the other times of the day. Based on the mass spectra of organics in the SV-OOA factor and its diurnal trend, it can be speculated that BCSV-OOA was related to the aging of local traffic and biomass burning emissions. BCSV-OOA concentrations did not depend on the ambient temperature (Fig. S29).
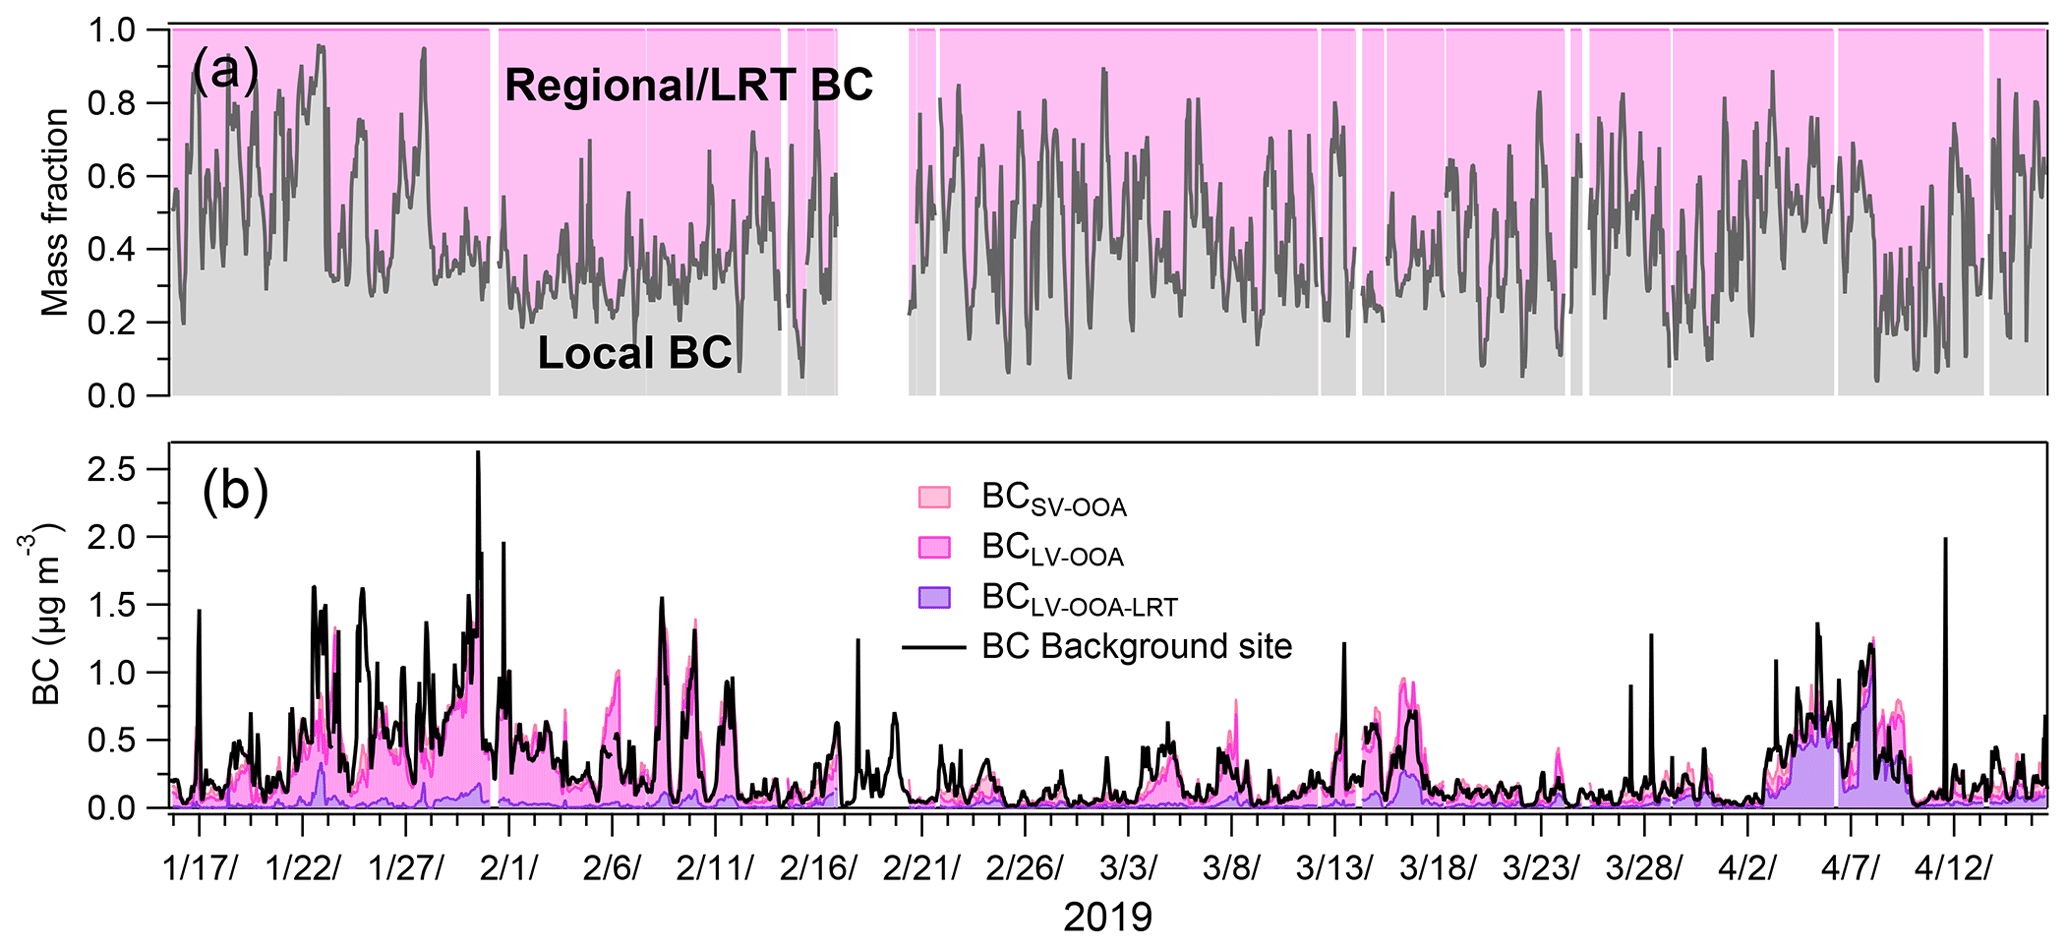
Figure 2Regional or long-range-transported vs. local BC in the residential area. The distribution of BC to local and regional–LRT BC at the residential site (a), and the time series of BCLV-OOA, BCLV-OOA-LRT, and BCSV-OOA at the residential site (stacked) compared with total BC at the background site (b).
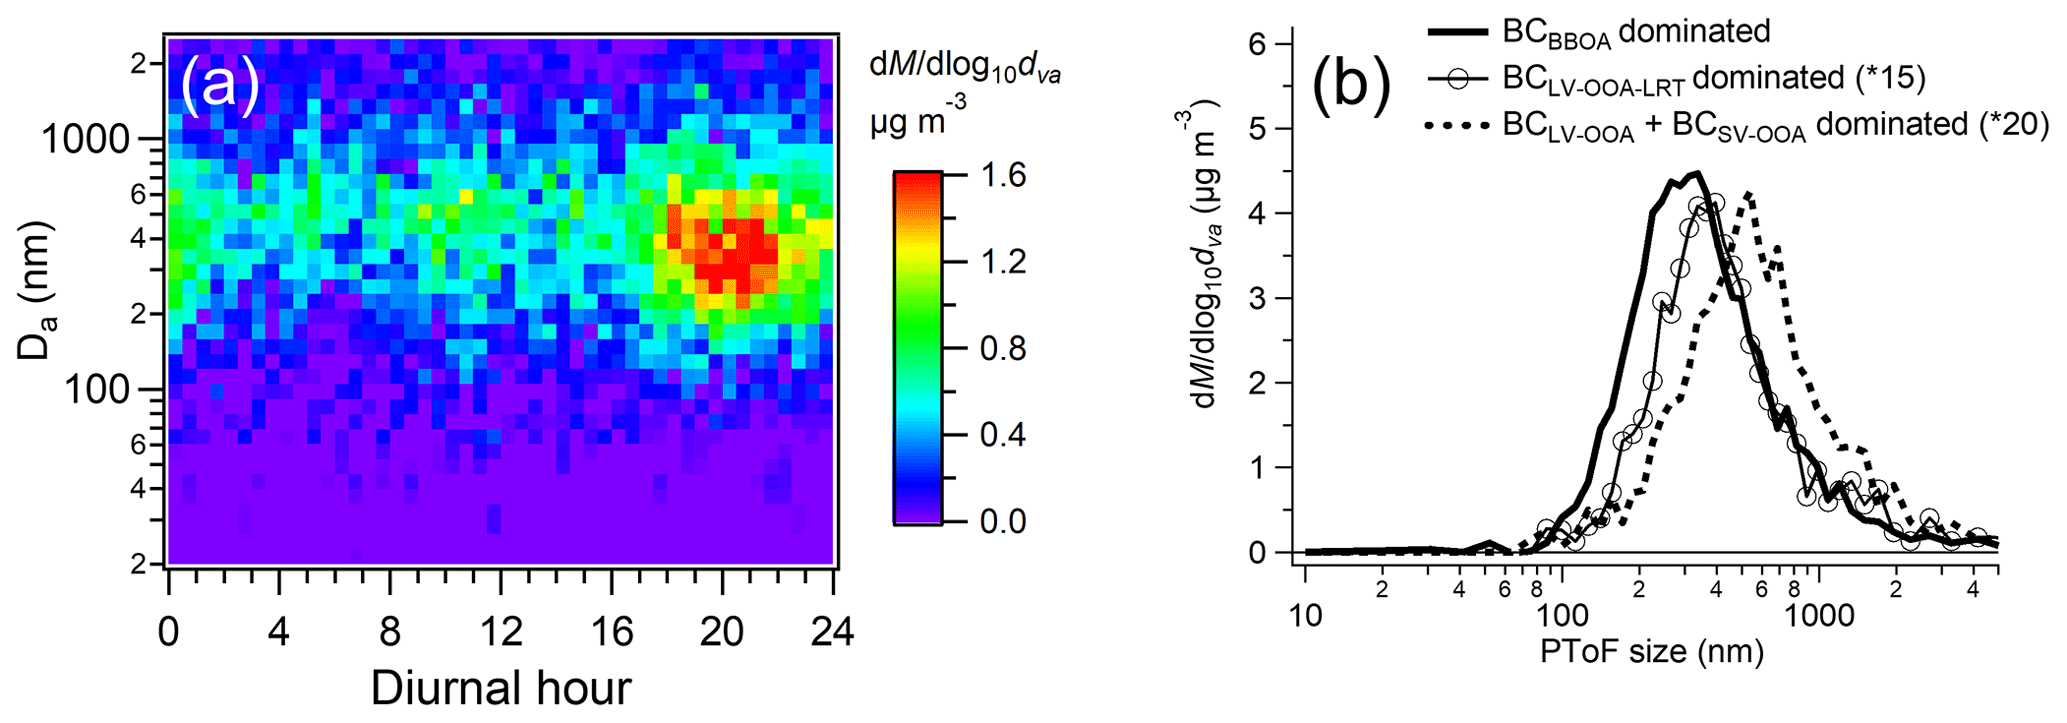
Figure 3Mass size distribution of BC in the residential area. The evolution of mass size distributions during the day (a) and the examples of the mass size distribution during the periods when BCBBOA, BCLV-OOA-LRT, or the sum of BCLV-OOA and BCSV-OOA dominated total BC concentration (b). Data for (a) were collected from 16 January to 28 February 2019 when there were intensive biomass burning episodes. The BCBBOA period in (b) was measured on 22 January 2019 from 19:45 to 23:30 LT, the BCLV-OOA-LRT period from 4 April 2019 at 03:45 LT to 5 April 2019 at 23:30 LT, and the BCLV-OOA + BCSV-OOA period from 17 March to 1 April 2019.
By assuming that BCBBOA and BCHOA are locally emitted, the average contribution of local sources to BC was 55 %, being slightly larger at the beginning of the campaign (Fig. 2). The remaining BC fractions, BCLV-OOA, BCLV-OOA-LRT, and BCSV-OOA, are likely to be related to either regional background or LRT. Regional and LRT BC fractions were compared with the BC concentrations measured concurrently at the Luukki regional background site approximately 15 km northwest from the residential site. It can be seen from the time series that the sum of BCLV-OOA, BCLV-OOA-LRT, and BCSV-OOA measured at the residential site closely followed the time series of BC at the background site (Fig. 2). However, at the beginning of the measurements in January 2019, there were some cases when BC was larger at the background site than the sum of BCLV-OOA, BCLV-OOA-LRT, and BCSV-OOA at the residential site, probably caused by the local BC emissions at the background site accumulated in the boundary layer due to the temperature inversion. Although the background site of Luukki is located in a sparsely inhabited area, there are some houses only a few hundred meters away from the site, which can have an impact on the measured concentrations.
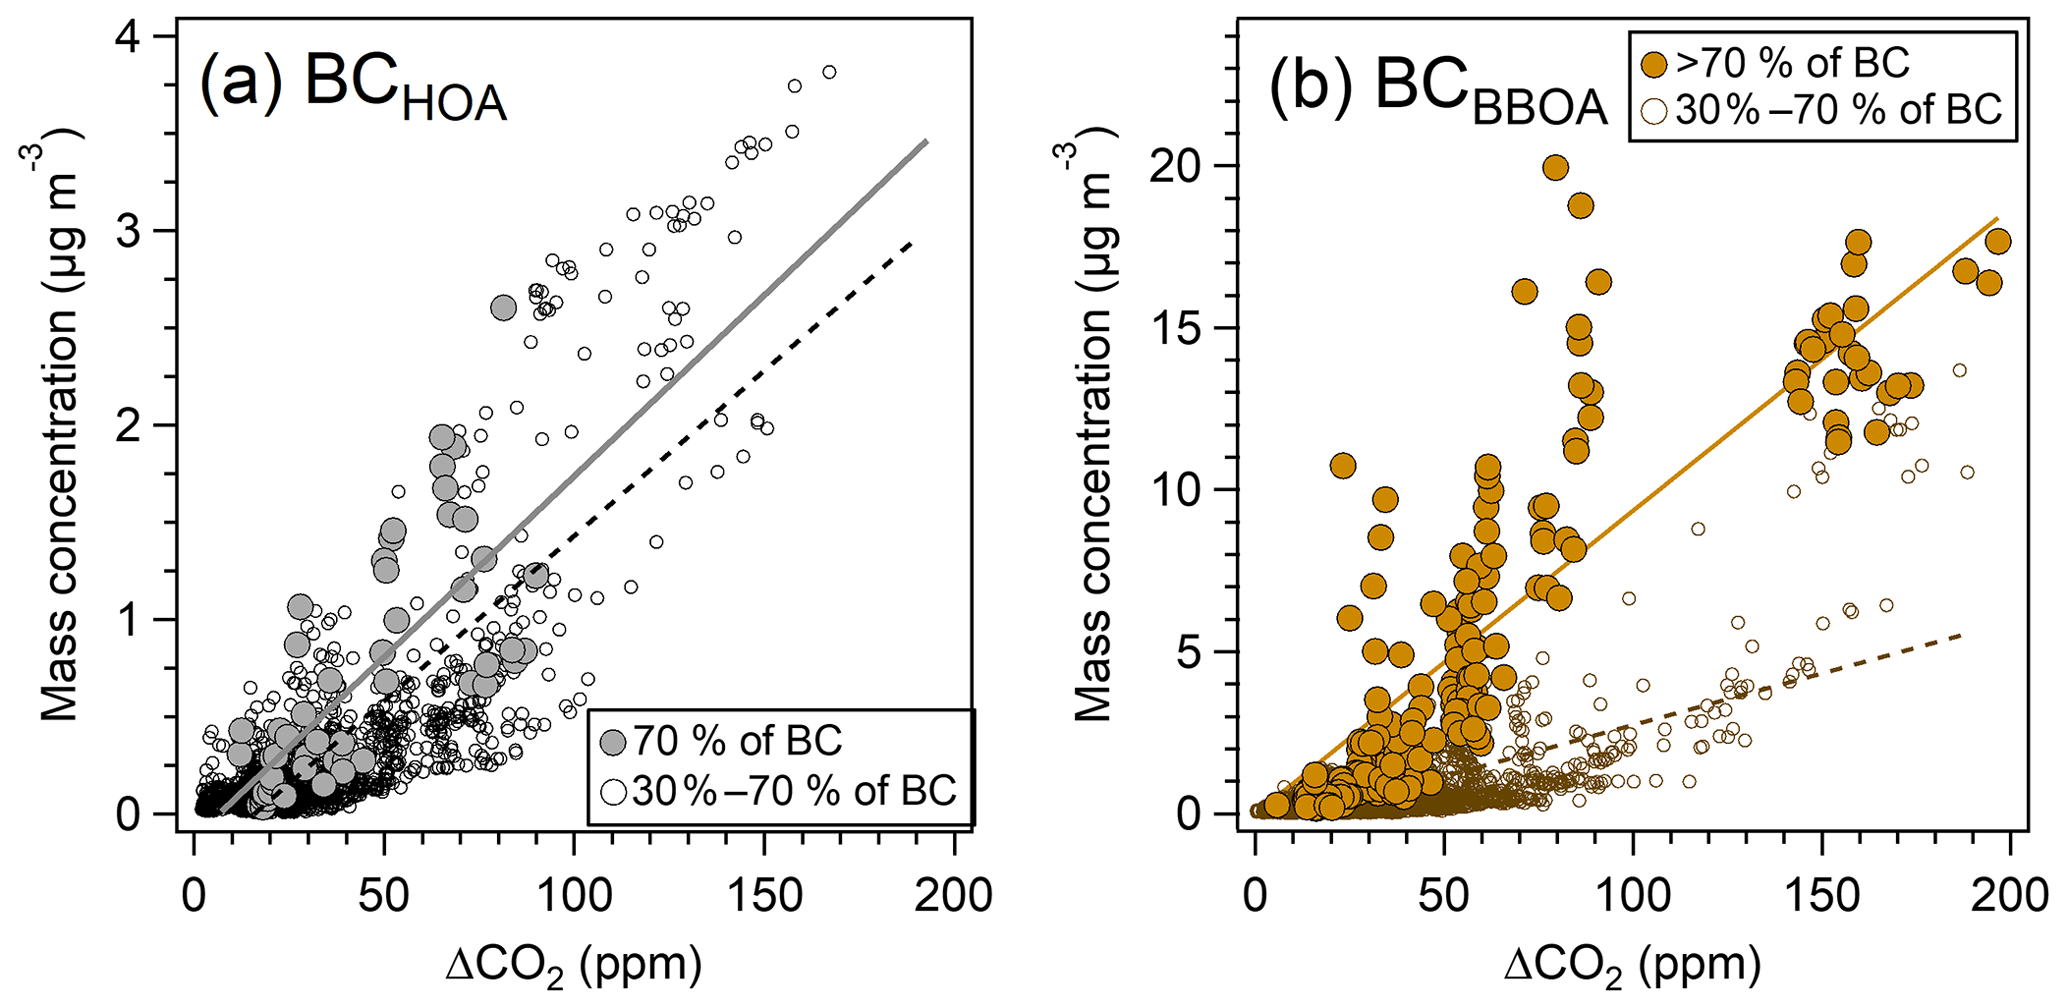
Figure 4The relationship between BCHOA and BCBBOA to CO2 concentrations at the residential site. BCHOA (a) and BCBBOA (b) vs. ΔCO2 concentrations. ΔCO2 was calculated as CO2(measured)−CO2(background), and CO2(background) was 404 ppm. The slopes were 0.019 and 0.017 (HOA) and 0.10 and 0.032 (BBOA) for >70 % and 30 %–70 % of BC, respectively. The values are the 10 min average.
Regarding the size distributions, BC was typically found at the particle size between 100 and 1000 nm at the residential site (Fig. 3a). The size distribution of BC depended on the main BC source. BC peaked between 200 and 500 nm in the evening, when there was a lot of biomass burning, while at the other times of the day, including morning, BC was detected at the larger particle size with the maximum between 350 and 800 nm. Figure 3b presents average BC mass size distributions for the periods when BC was impacted by biomass burning (BCBBOA 72 % of BC) and regional background (BCLV-OOA + BCSV-OOA; 47 % of BC). During the BCBBOA period, the maximum was located at ∼300 nm, while during the regional background period the maximum was measured at ∼550 nm. Note that the total BC concentration was 20 times smaller for the regional background period. During the LRT episode in April, the maximum of the BC size distribution was between that of the biomass burning episode and regional background at ∼350–450 nm (Fig. 3b). The size distributions of organics were very similar to those of BC during the three periods (Fig. S31a), indicating that BC was mostly internally mixed with organics.
BC emitted from different sources was also investigated in relation to gaseous CO2 concentrations measured concurrently at the residential site. From the BC–CO2 plots it can be noticed that the BCHOA concentration increased clearly when CO2 increased; however, for the other factors the relationship was less clear (Fig. S32). The BC-to-CO2 ratio was investigated in more detail for the local combustion sources, BCBBOA and BCHOA. Background CO2 concentration, which was defined as the smallest 1 % of the CO2 concentrations measured at the residential site being equal to 404 ppm, was subtracted from the measured CO2 concentrations, and the remaining CO2 was plotted against BCHOA and BCBBOA concentrations (Fig. 4). Moreover, the data points were classified according to the fraction of BCHOA or BCBBOA in total BC; only the data points when BCHOA or BCBBOA contributed 30 %–70 % or >70 % to total BC were selected (30 %–70 % marked with open circles and >70 % with closed circles in Fig. 4). For BCHOA the slope was 0.019 when BCHOA was >70 % and 0.017 when the mass fraction of BCHOA was 30 %–70 %. For BCBBOA the slope was 0.10 (>70 % to total BC), which suggests that biomass burning produces approximately 5 times more BC in relation to CO2 during biomass burning events compared to engine emissions. However, there was a lot of scattering in the BCBBOA-to-CO2 ratio likely due to the unstable burning conditions in domestic fireplaces that can in turn result in large differences in emitted BC (Heringa et al., 2011; Kortelainen et al., 2018). When converting the slope of BCHOA to the BC emission factor (EFBC) by using a carbon mass fraction (CMF) ratio of of 3141 g kg−1 of fuel (Enroth et al., 2016), a value equal to 0.03 g kg−1 of fuel was obtained. That was roughly one-fifth of EFBC measured in 2012 in Helsinki at the roadside (Enroth et al., 2016), but it was at the same level as EFBC measured near the road in Toronto, Canada, in 2016 (Wang et al., 2018). For BCBBOA, EFBC was not calculated as emitted BC, and CO2 depends largely on biomass material burned as well as the combustion conditions and devices (Savolahti et al., 2016).
3.2 Sources of BC in the street canyon
The average (± SD) BC concentration in the street canyon in October 2015 was 0.90 (±0.74) µg m−3 for the 1 h averaged data measured with the AE33. Three PMF factors were found to be related to the sources of BC, BBOA, HOA and LV-OOA, which were similar in mass spectra to those found at the residential site. More than half (57 %) of BC was made of BCHOA in the street canyon, on average (Fig. 5a). Similar to the residential site, BCHOA peaked during morning rush hour (07:00–10:00 LT) and again between 15:00 and 21:00 LT in the evening (Fig. 5b), indicating that it originated predominantly from vehicle exhaust emissions. Different from the residential site, BCHOA did not remain at the elevated level in nighttime as the smallest BCHOA concentrations were detected between 02:00 and 06:00 LT. In the earlier study of Helin et al. (2018), 83 %–91 % of BC has been associated with fossil fuel combustion in the street canyon in Helsinki by the Aethalometer model. BCHOA and BCff can, however, represent slightly different sources as will be discussed later in Sect. 3.3. Both the measurements presented in this paper and in Helin et al. (2018) were conducted in 2015–2016. Compared to the situation today, BC related to traffic emissions can be assumed to be smaller than in 2015–2016 as a general declining trend of BC concentrations related to traffic has been presented recently for the Helsinki area by Luoma et al. (2021). They found a statistically significant decreasing trend in the range of −10.4 to −5.9 % yr−1. The decrease was most noticeable at the traffic sites and particularly during the morning rush hour.
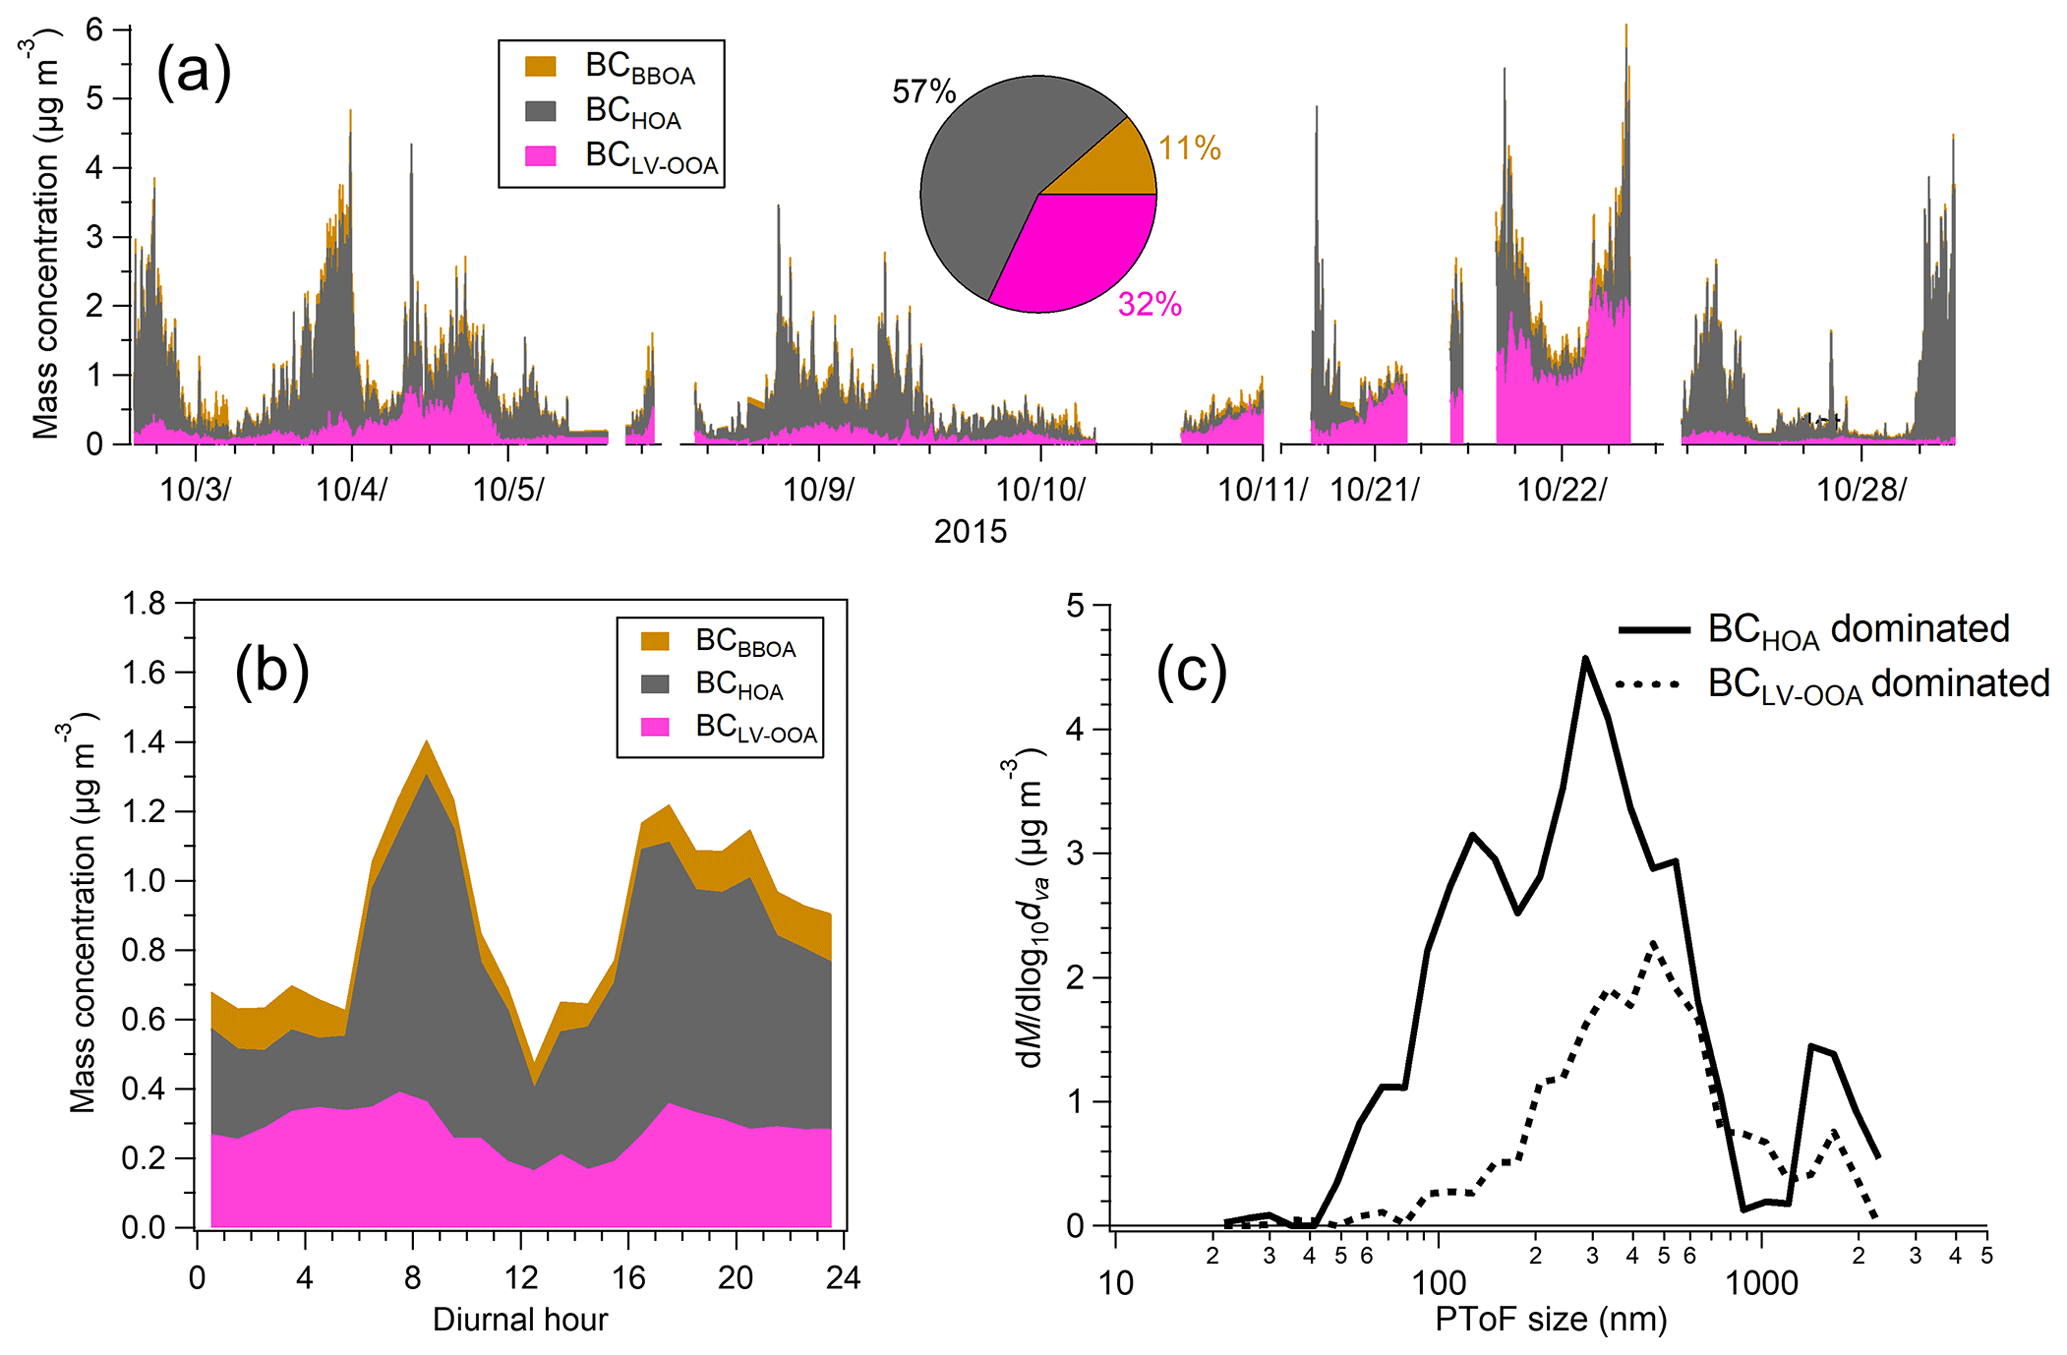
Figure 5Source apportionment of BC by using PMF and size distributions for the SP-AMS data in the street canyon. Time series with average contributions (a) and diurnal variations (b) in the BC fractions and the size distributions when BCHOA and OOA fractions dominated (3 October 2015, 18:30 to 23:55 LT and 21 October 2015, 20:00 LT to 22 October 2015, 04:00 LT, respectively). Time series in (a) are presented with 5 min time resolution.
The second largest contributor to BC in the street canyon was BCLV-OOA (32 %). BCLV-OOA did not display a clear diurnal variation. Like at the residential site, BCLV-OOA was assumed to be mostly related to regional background or long-range-transported BC as the corresponding PMF factor (LV-OOA) correlated with sulfate, nitrate, and ammonium. The comparison with the background BC concentrations could not be conducted as there was no BC measurement at the background site in the Helsinki area in 2015. The contribution of BCBBOA was rather small (11 %) in the street canyon. The measurements in the street canyon were performed in autumn when the ambient temperature was still quite high (an average of 7 ∘C), so there was no need for the additional heating with wood. Moreover, the street canyon site was located in an urban area surrounded by apartment buildings that did not have fireplaces. In terms of diurnal profiles, BCBBOA showed larger concentrations in the evening and at night.
The mass size distributions of BC are presented in Fig. 5c for two cases; BC was dominated by traffic emissions and BC was mostly related to regional background or LRT. When traffic emissions dominated BC (BCHOA 80 % of BC), there were two modes of which the first one was located at ∼130 nm and the second one at ∼300 nm. The mode at ∼100–150 nm has been detected earlier for the traffic emissions (Enroth et al., 2016) while the second mode was probably also related to regionally distributed BC or LRT. During the period of regional background or LRT period (BCLV-OOA 70 % of BC), there was only one mode that was located at a larger particle size (∼450 nm) than the second mode for the BCHOA period. This suggests that BCLV-OOA was possibly associated with non-local sources. During the BCLV-OOA-dominated period, the size distributions of BC were similar to those of organics (Fig. S31b), but in the BCHOA-dominated period, there was slightly more BC in the first mode (at ∼130 nm) relative to organics than in the second mode (at ∼300 nm).
3.3 Comparison of PMF and Aethalometer model source apportionment methods for BC
The source apportionment obtained from the PMF analysis was compared with the absorption properties of particles measured by the AE33. First, an absorption Ångström exponent was calculated for both sites. The α value is typically utilized to characterize different types of aerosols, e.g., BC, brown carbon, and dust particles, and it has been shown to differ greatly between various emission sources (Kirchstetter et al., 2004; Zotter et al., 2017).
The α values measured at the residential and street canyon sites are presented as histograms in Fig. 6. The median α was clearly smaller in the street canyon (1.06) than at the residential site (1.30). However, the shape of the α distribution showed that in the street canyon there were some cases when the α value was larger (∼1.2) than the median. Those cases corresponded to a large BCBBOA fraction as the α values calculated specifically for the periods dominated by BCBBOA or BCHOA (>50 % of BCBBOA or BCHOA) were 1.36 and 1.25 at the residential site and 1.24 and 1.12 in the street canyon, respectively. In terms of diurnal variation in the α values, α was smaller in daytime at both sites, the difference between day and night being larger for the street canyon than for the residential area (Fig. S33).
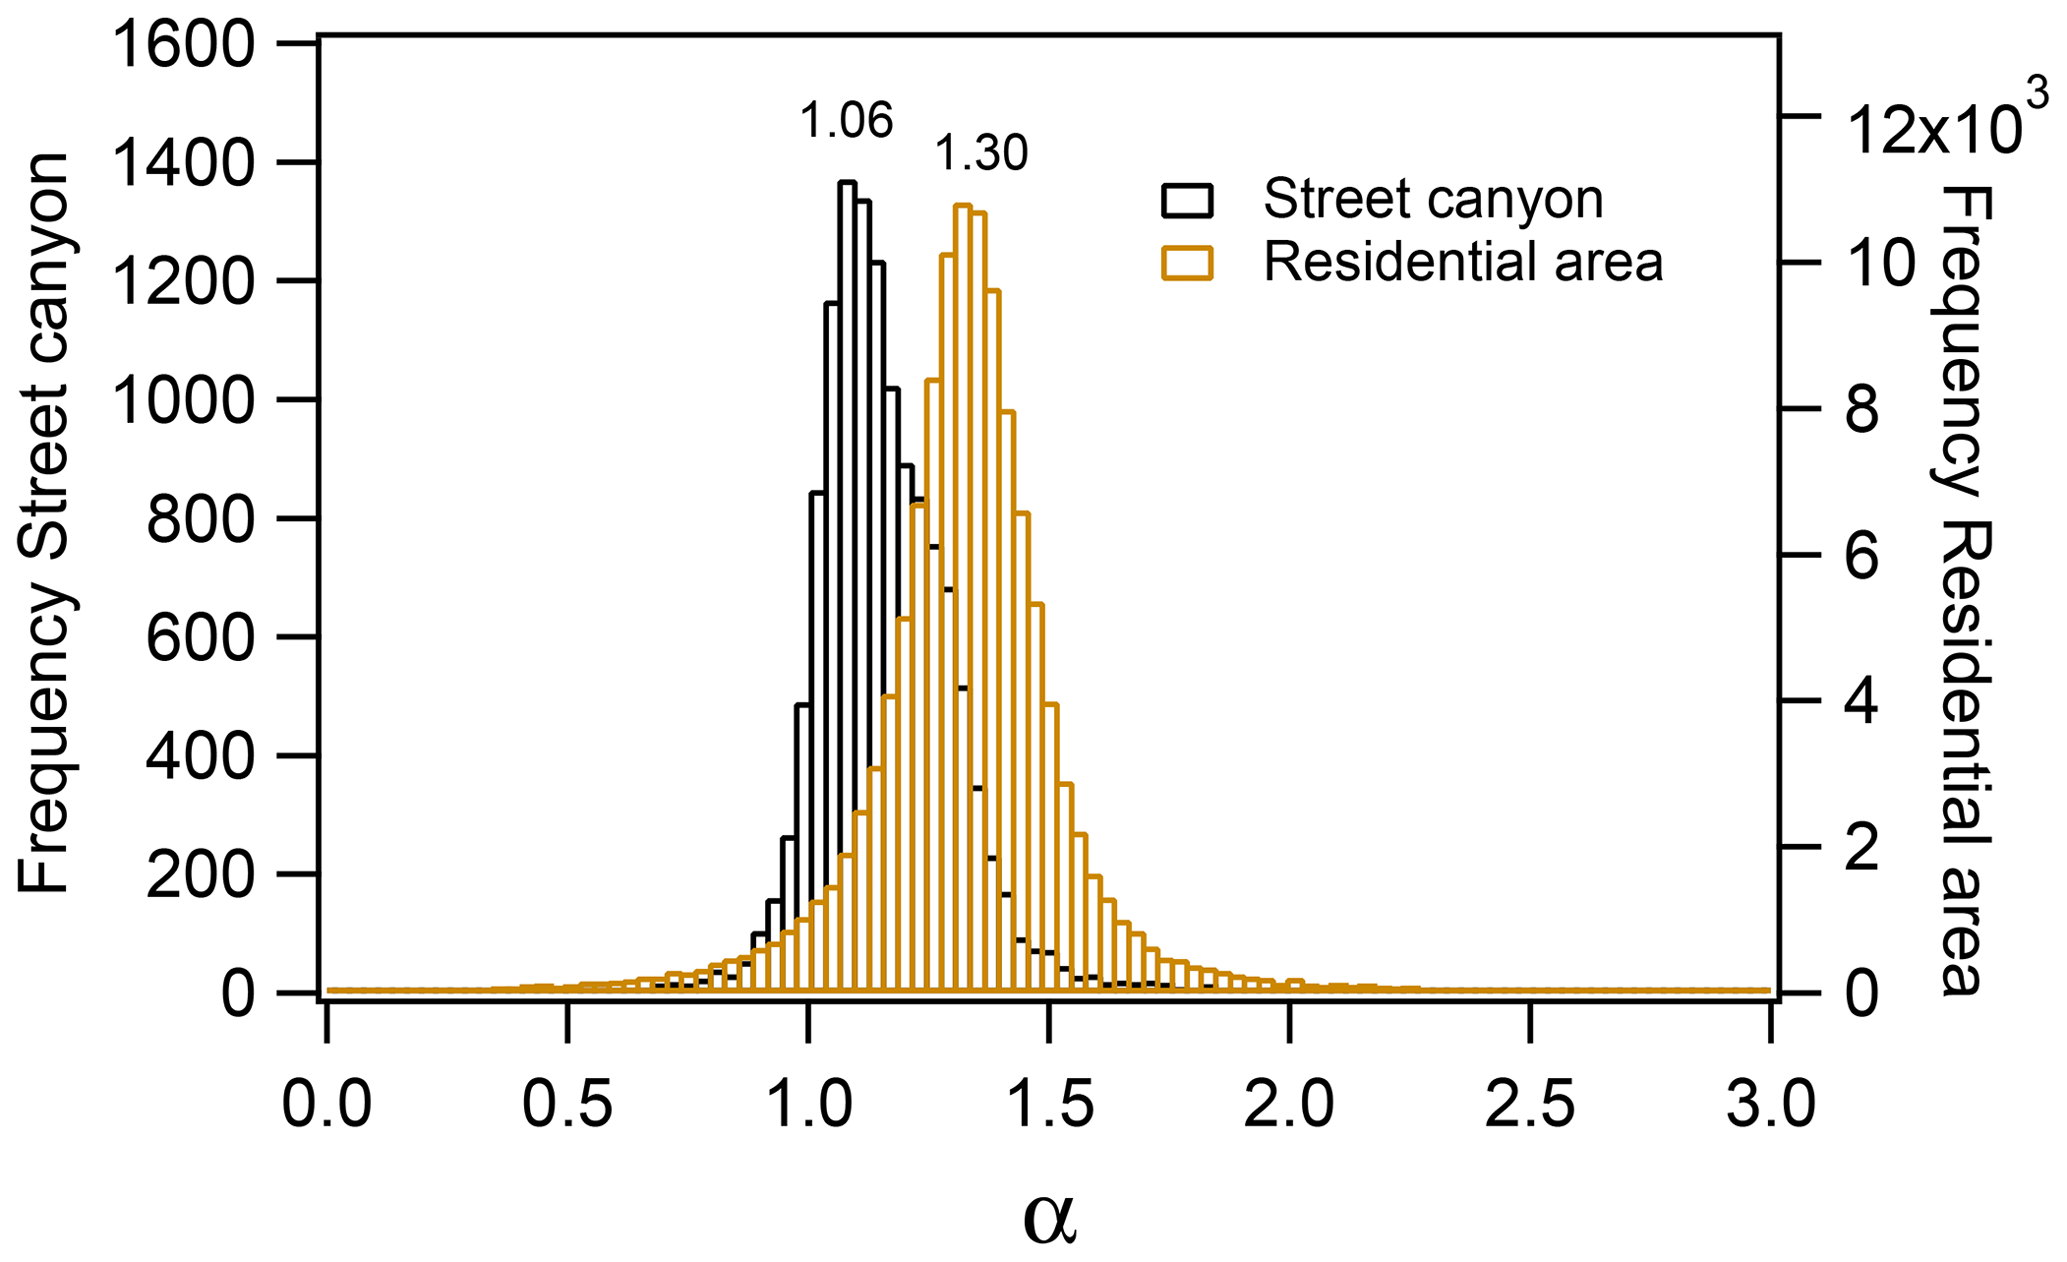
Figure 6Absorption Ångström exponents calculated for the street canyon and residential area data. Histograms are for 1 min resolution data.
The average α values calculated in this study were similar to those found in the earlier study of Helin et al. (2018) in the Helsinki area (1–1.05 and 1.2–1.3 for the street canyon and residential sites, respectively). Compared to the α values obtained from the biomass burning emission measurements, Martinsson et al. (2015) have reported α values between 0.9 and 1.3 for the burning of birch logs in a conventional wood stove; however, α increased to above 2 when fuel was added. For various sauna stoves, α has been measured to be 1.17–1.33, but when wood had high moisture content, α was larger (1.6; Tissari et al., 2019). In ambient measurements, α can be larger than that measured directly from the emission source as α values for biomass burning emissions have been shown to increase due to the atmospheric oxidation processes simulated with a smog chamber (Tasoglou et al., 2017). However, studies have also reported a decrease in α in biomass burning emissions by photooxidation during atmospheric aging (Nicolae et al., 2013; Dasari et al., 2019), which can explain the difference in α if the biomass burning particles are not locally emitted. For diesel buses, α has been reported to be 0.8–1.2 depending on the driving phase (Helin et al., 2021), while for motor vehicle emissions measured at a roadway and tunnel, α was in range of 0.6–0.9 (Kirchstetter et al., 2004).
There are several factors that can have an impact on α. One of them is the coating of the BC particles. In this study, the particle coating factor was calculated similar to Drinovec et al. (2017) by summing all the SP-AMS inorganic and organic species (excluding rBC) and dividing the sum by BC from the AE33. Based on our results, α did not seem to significantly depend on the coating factor; however, there was a tiny increase in α when the coating factor increased (Fig. S34). Also, the chemical composition of the coating was investigated, but the composition did not unambiguously affect α. In general, the coating factor was much larger at the residential site (average coating factor 7.4) compared to that in the street canyon (average coating factor 1.6). It should be noted here that the coating factor calculation had some uncertainties. The assumptions in the coating factor calculations were (1) CE of 1 for the AMS species, (2) default RIEs for organics and inorganic AMS species, and (3) similar particle size range for the AMS species and BC from the AE33. If the uncertainty of using CE=1 is estimated to be 30 % and the uncertainty of RIEs for each AMS species is 20 %, the total uncertainty due to CE and RIE is ∼40 %. The uncertainty in the coating factor due to the different particle sizes measured by the SP-AMS and AE33 is difficult to estimate quantitatively. Qualitatively, it can be assumed that the AMS is missing particle mass below <50 nm, and therefore the coating factor can be slightly underestimated, especially in the street canyon where there can be small traffic-related particles.
It has been noticed in earlier studies that the filter-loading parameter (k) provided by the AE33 can also be used to determine particle coating. Drinovec et al. (2017) found a strong anticorrelation between the compensation parameter at 880 nm (k6) and the coating factor, suggesting that the coating of BC may be responsible for the decrease in the compensation parameter. In this study, the dependence of k6 on the SP-AMS coating factor was weak. At the residential site, there was a slight negative correlation between k6 and the coating factor, whereas there was no correlation for the street canyon data (Fig. S34).
Absorption Ångström exponents can be exploited further for the source apportionment of BC. First, the α values were compared with the fraction of BCBBOA and BCHOA in total BC measured at the residential site (Fig. S35). It can be seen from the figure that the increasing fraction of BCBBOA somewhat increased the α values whereas the opposite was true for BCHOA. Next, the Aethalometer model was applied to the AE33 data sets to calculate the contributions of BCff and BCwb concentrations. Two pairs of absorption Ångström exponents were used for fossil fuel (αff) and wood burning (αwb): 1 and 2 (default values from the manufacturer) and 0.9 and 1.68 (Sandadewi et al., 2008b).

Figure 7Comparison of AMS-PMF with the Aethalometer model source apportionment for BC at the residential site. Time series (a), the scatter plot of BCwb and BCBBOA concentrations (b), and BB% (c). BCwb and BB% with the Aethalometer model were calculated by using αff=0.9 and αwb=1.68 and αff=1 and αwb=2. We used 1 h time resolution. Marker size in (b) and (c) illustrates the concentration of total BC. The dotted line in (b) and (c) shows the 1:1 line.
In Fig. 7 BCBBOA from the PMF analysis was compared with BCwb from the Aethalometer model for the residential site data. Biomass burning BC obtained from two source apportionment methods followed a very similar time trend; however, BCwb calculated with the αff and αwb values of 1 and 2, respectively, displayed only half of the values of BCBBOA or BCwb calculated with the αff and αwb values of 0.9 and 1.68, respectively. The same trend is shown in the scatter plots in Figs. 7b and S36. In terms of diurnal variation (Fig. S37), BCBBOA and BCwb both had a maximum in the afternoon and a second peak in the morning, with BCBBOA increasing in both cases slightly later than BCwb. The reason for the delay can be speculated to be due to the fact that organics and BC can be emitted at different ratios at different stages of burning (e.g., Kortelainen et al., 2018), with the time behavior of BCBBOA being determined by biomass burning organics due to the used PMF method.
By converting these values to the percentage of biomass burning BC (BB%), it can be seen that, with the αff and αwb values of 0.9 and 1.68, the Aethalometer model gave larger values than PMF when BB% was small, whereas at larger BB% values, the results from the Aethalometer model were smaller than those from PMF. In general, that trend suggests that the Aethalometer model produces more constant BB% than PMF and is likely be less sensitive to the changes in the BC sources compared to PMF. Similar observation was done when the diurnal patterns of BB% values were compared; BB% from the Aethalometer model had a rather flat diurnal trend whereas BB% from PMF varied more clearly during the course of the day (Fig. S37b). Aethalometer model and PMF results were also compared by adding BCLV-OOA-LRT to BB% from PMF (Fig. S38) since the LRT particles detected in April were likely to originate from agricultural burning or wildfires. Adding BCLV-OOA-LRT to BB% increased small BB% values from PMF, which improved the comparison between PMF and the Aethalometer model slightly. It should be noted here that a constant α value may not be adapted when there are several BCwb sources at the site, for example local biomass burning and LRT. With the default αff and αwb values of 1 and 2, BB% from the Aethalometer model was much smaller than that from PMF regardless of the PMF factors included in the calculation.
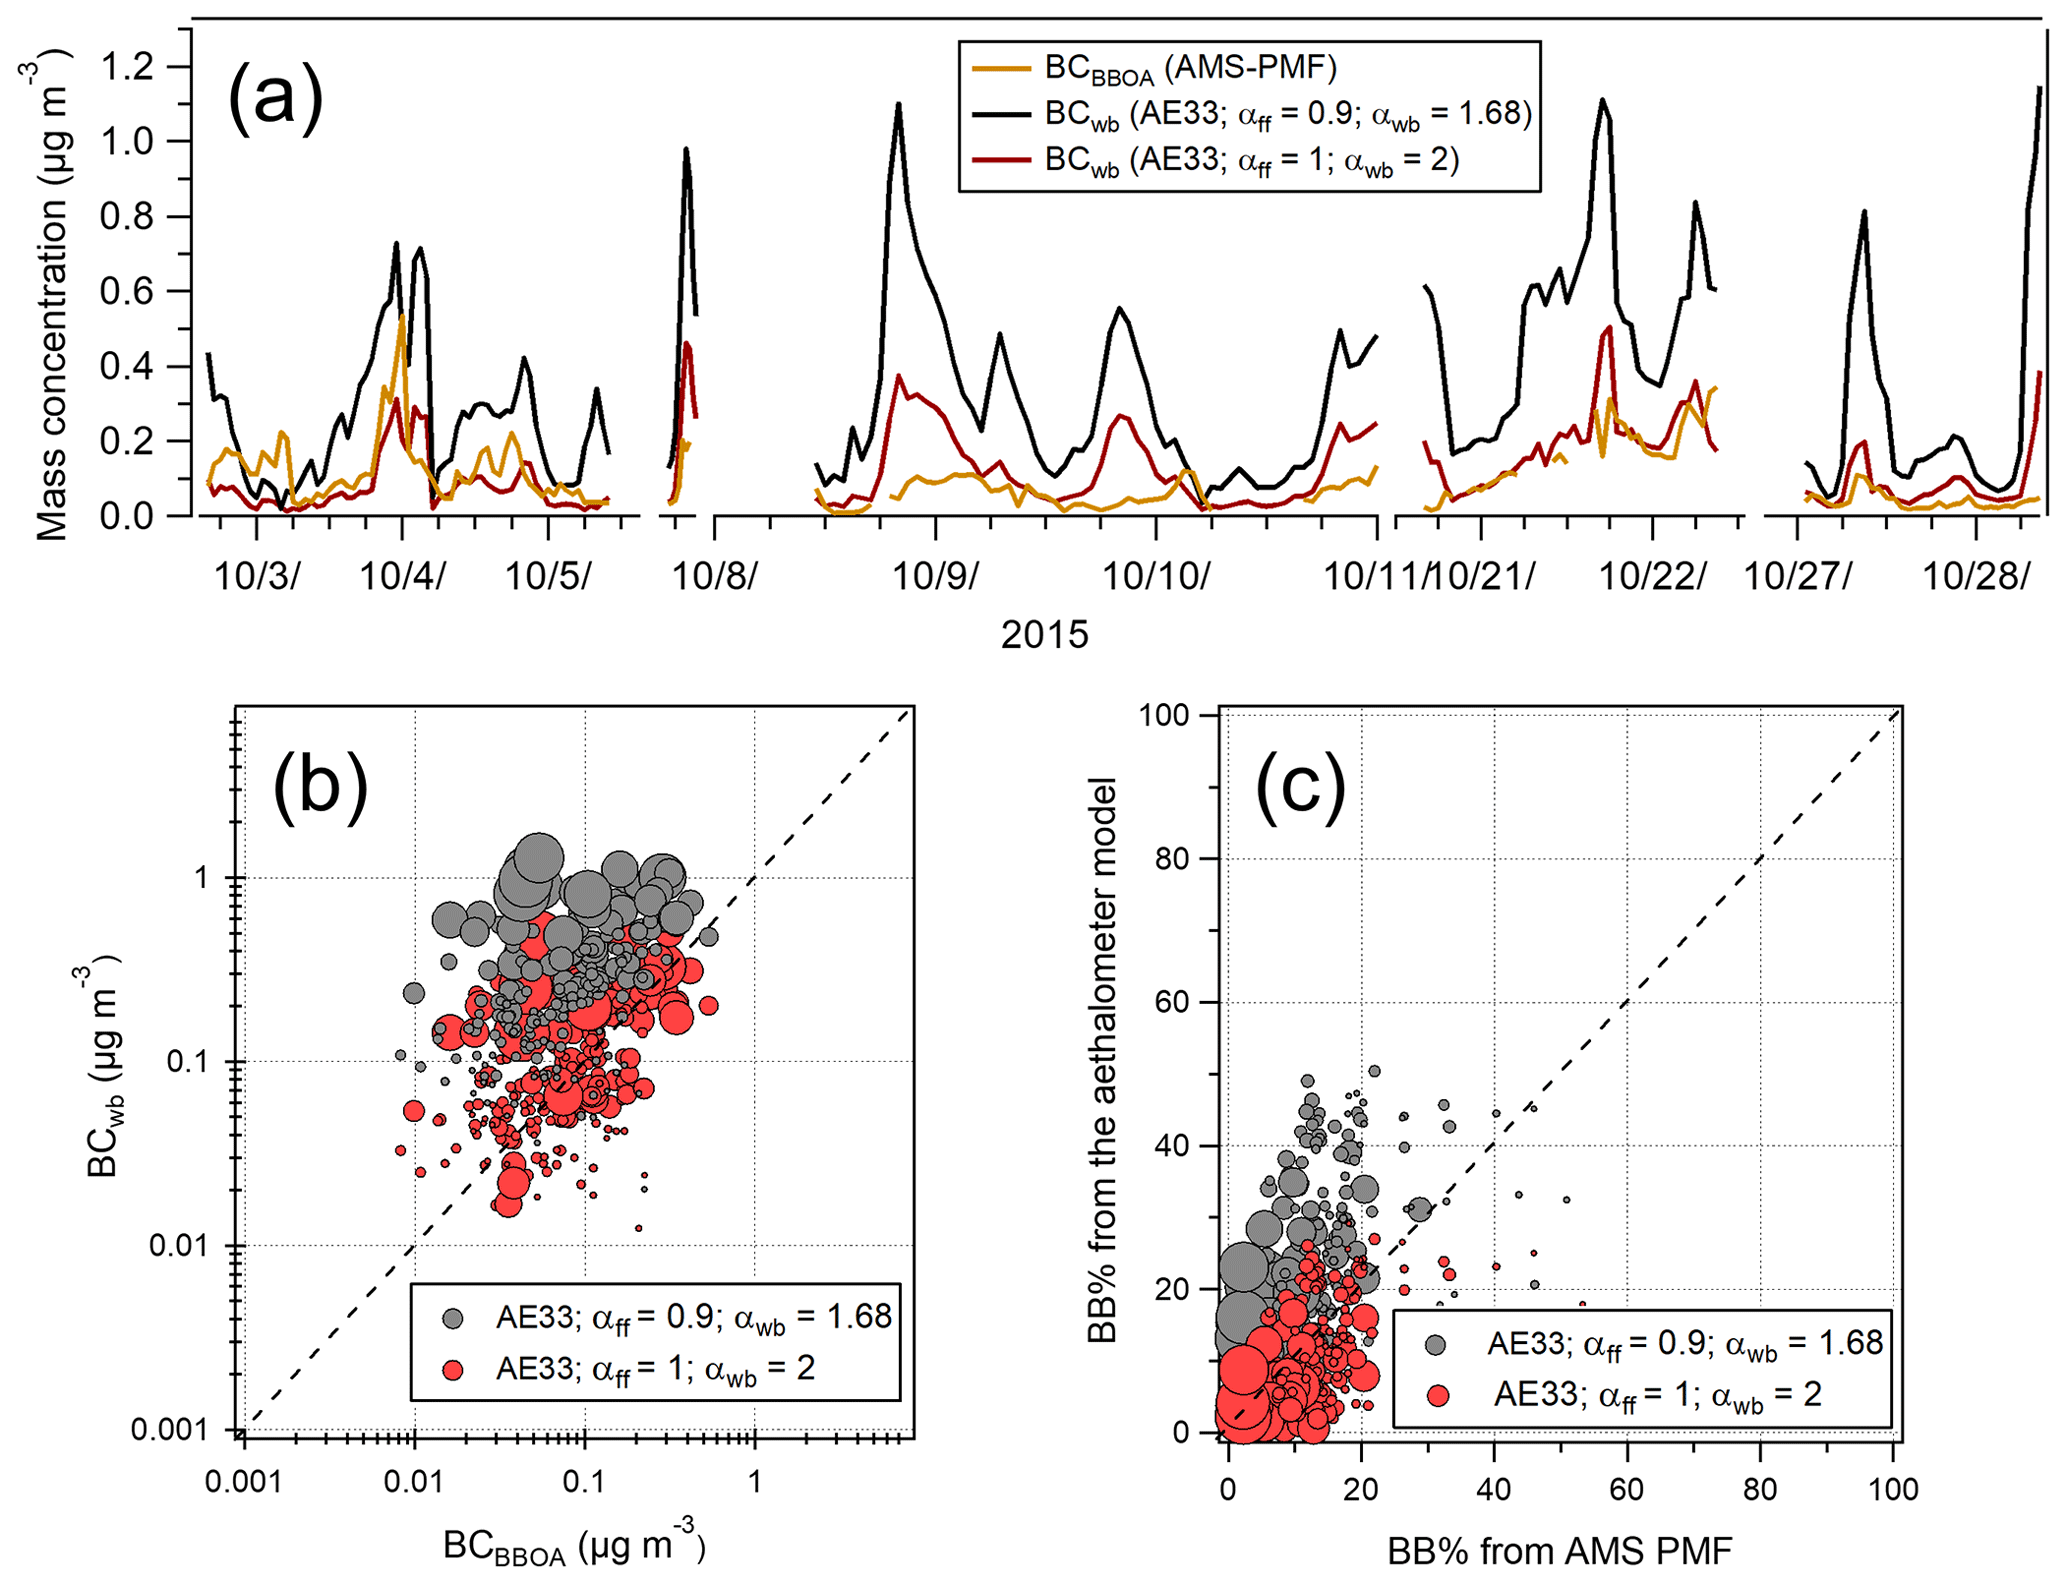
Figure 8Comparison of AMS-PMF with the Aethalometer model source apportionment for BC in the street canyon. Time series (a), the scatter plot of BCwb and BCBBOA concentrations (b), and BB% (c). BB% with the Aethalometer model was calculated by using αff=0.9 and αwb=1.68 and αff=1 and αwb=2. We used 1 h time resolution. The marker size in (b) and (c) illustrates the concentration of total BC. The dotted line in (b) and (c) shows the 1:1 line.
For the street canyon data, BCwb concentrations were mostly larger than BCBBOA concentrations (Fig. 8). In contrast to the residential site, BCwb and BB% values calculated with the Aethalometer model by using the αff and αwb values of 1 and 2 seemed to produce more comparable results with BCBBOA and BB% values from PMF than the αff and αwb values of 0.9 and 1.68. It should be noted here that the measurement campaign in the street canyon was not optimal for the investigation of biomass combustion because biomass burning was not the major source at the site, and the measurement campaign also covered only a short period of time.
The Aethalometer model and PMF source apportionment results can also be compared in terms of BC related to the fossil fuel combustion. At the residential site, BCHOA was much smaller than BCff calculated with both sets of αff–αwb values. This suggests that, besides BCHOA, the regionally distributed BC (mostly BCLV-OOA) originates largely from the fossil fuel combustion at the residential site. Also in the street canyon, BCHOA was much smaller than BCff from the Aethalometer model with both sets of αff–αwb values. Exceptions were the cases when the BC concentrations were large and the contributions of both BCff and BCHOA were close to 100 %, indicating that BC originated probably mostly from diesel vehicles. However, the diurnal pattern of BCff followed that of BCHOA and NOx well, showing both the morning and evening rush hours (Fig. S39). When BCLV-OOA was added to the fossil fuel fraction, PMF and BCff (with both the αff–αwb values) were closer to each other. That suggests that in the street canyon BCLV-OOA was also mostly related to the fossil fuel combustion. Here BCff refers to the fossil fuel combustion; however, it is likely to also include BC from biofuels, e.g., biodiesel and ethanol.
This study investigated the sources of BC at two contrasting locations: in a residential area in winter- and springtime and in a street canyon in autumn. It was shown that PMF applied to the SP-AMS data is a powerful tool to determine the main sources of BC in urban environments. PMF analysis revealed that the largest fraction of BC originated from local biomass burning at the residential site (average 38 %), whereas the main source of BC was vehicular exhaust emissions in the street canyon (57 %). At both sites, a considerable fraction of BC consisted of regional urban background or long-range-transported BC indicated by the high oxidation state of organics related to those PMF factors as well as the comparison with BC detected at the background site outside of Helsinki. On average, the total BC concentration was very similar at the two sites (∼0.9 µg m−3). When comparing the sites, it should be remembered that the measurements were conducted in different years (residential site in 2019 and street canyon in 2015), which may also impact the source contributions. For example, Luoma et al. (2021) have shown that BC related to traffic has decreased in the Helsinki area in recent years, which may overrate traffic-related BC in the street canyon relative to the year 2019.
The source had an impact on the detected size of BC particles. BC from traffic was found at the particle size of ∼100–150 nm, whereas BC from biomass combustion was observed at ∼300 nm. BC was located at the largest particle size (∼500–600 nm) when the impact of the local sources was small; however, during an intense LRT episode, the maximum of BC size distribution was shifted to a slightly smaller size (∼400 nm). Moreover, the coating thickness of BC particles was very different at the residential and street canyon sites. There was a much thicker coating at the residential site (average coating factor 7.4) than in the street canyon (average coating factor 1.6). The size of the BC core and coating thickness and composition have significant impacts on BC climate and health effects.
Comparison of the PMF results with the BC source apportionment from the Aethalometer model indicated that several PMF factors can be related to wood burning and fossil fuel fractions obtained from the Aethalometer model. Moreover, PMF was able to additionally separate local, regional background, and LRT contributions. In general, the Aethalometer model presented smaller variation for the sources within a day than PMF, being less responsive to the fast changes in the BC sources at the site. It is also possible that the Aethalometer model was not able to distinguish between as many sources as PMF due to similar optical properties of the BC sources. It should also be noted here that a constant α value may not be adapted when there are several biomass burning sources at the site, for example local biomass burning and LRT.
The results of this study improve the understanding of the limitations and validity of the Aethalometer model for BC source apportionment in different kinds of environments. Based on the results of this study, the Aethalometer model can provide estimates for the fractions of BC related to biomass combustion and fossil fuel combustion. The Aethalometer model is most suitable for the environment that is mainly impacted by either wood combustion or vehicle emissions, but if there are several sources, the results from the Aethalometer model are more difficult to interpret. The advantage of the Aethalometer model is that BCff and BCwb can be calculated from the data of a reasonably simple BC instrument. However, the uncertainty of the model is related to the unique set of αff–αwb values needed for each measurement site. Additionally, as the Aethalometer relies on the filter-based measurement technique, the filter batch used in the AE33 may affect the results.
In terms of PMF applied to the SP-AMS data, the largest uncertainty is related to the expertise and experience of the PMF user. The selection of an accurate number of factors and the validation of data can be challenging and provide questionable results. Moreover, the quantification of the rBC by the SP-AMS can be tricky as the detection of rBC is strongly influenced by the overlap of particle and laser beams. Due to the much lower detection efficiency of rBC relative to organics, the PMF method for the SP-AMS data is likely to be more suitable for urban environments with more BC in relation to organics than in remote areas.
Overall, the results of this study provide novel information on local, regional, and remote sources of BC in urban environments. Although the measurements were carried out only in Helsinki, the results and the applied measurement and data analysis methods are applicable to other areas as well. The BC source apportionment results are highly valuable for the modelers when calculating the climate and air quality impact of BC as well as for the authorities when directing the emission legislation and emission mitigation actions.
The data shown in the paper are available on request to the corresponding author.
The supplement related to this article is available online at: https://doi.org/10.5194/acp-21-14851-2021-supplement.
SS, JVN, TR, and HT designed the experiments and SS, JVN, and MA performed the measurements. SS, JVN, MA, LP, and AK performed the data analysis. SS wrote the first version of the manuscript, but all authors participated in the writing process. HT, TR, LP, JVN, and SS contributed to the acquisition of funding for the study.
The authors declare that they have no conflict of interest.
Publisher's note: Copernicus Publications remains neutral with regard to jurisdictional claims in published maps and institutional affiliations.
This work was supported by Business Finland, HSY, Valmet Technologies, Vaisala, Tampere City, Pegasor, Dekati, AX-Consulting, AGCO Power, Airmodus, and SSAB Europe in the project Black Carbon Footprint (grant nos. 528/31/2019 and 530/31/2019). We also acknowledge funding from the European Regional Development Fund, Urban Innovative Actions initiative (HOPE; Healthy Outdoor Premises for Everyone, project no. UIA03-240), Academy of Finland Flagship funding Atmosphere and Climate Competence Center, ACCC (grant nos. 337552 and 337551), and COST–COLOSSAL (CA16109).
This research has been supported by Business Finland and participating companies (grant nos. 528/31/2019 and 530/31/2019), the European Regional Development Fund, Urban innovative actions initiative (grant no. UIA03-240), and the Academy of Finland Flagship (grant nos. 337552 and 337551).
This paper was edited by Stefania Gilardoni and reviewed by two anonymous referees.
Alfarra, M. R., Prevot, A. S. H., Szidat, S., Sandradewi, J., Weimer, S., Lanz, V. A., Schreiber, D., Mohr, M., and Baltensperger, U.: Identification of the mass spectral signature of organic aerosols from wood burning emissions, Environ. Sci. Technol., 41, 5770–5777, https://doi.org/10.1021/es062289b, 2007.
AMAP: Summary for Policy-makers: Arctic Climate Issues 2015, Arctic Monitoring and Assessment Programme (AMAP), Oslo, Norway, 16 pp., 2015.
Barreira, L. M. F., Helin, A., Aurela, M., Teinilä, K., Friman, M., Kangas, L., Niemi, J. V., Portin, H., Kousa, A., Pirjola, L., Rönkkö, T., Saarikoski, S., and Timonen, H.: In-depth characterization of submicron particulate matter inter-annual variations at a street canyon site in northern Europe, Atmos. Chem. Phys., 21, 6297–6314, https://doi.org/10.5194/acp-21-6297-2021, 2021.
Becerril-Valle, M., Coz, E., Prévôt, A., Močnik, G., Pandis, S., de la Campa, A. S., Alastuey, A., Díaz, E., Pérez, R., and Artíñano, B.: Characterization of atmospheric black carbon and co-pollutants in urban and rural areas of Spain, Atmos. Environ., 169, 36–53, https://doi.org/10.1016/j.atmosenv.2017.09.014, 2017.
Bibi, Z., Coe, H., Brooks, J., Williams, P. I., Reyes-Villegas, E., Priestley, M., Percival, C. J., and Allan, J. D.: Technical note: A new approach to discriminate different black carbon sources by utilising fullerene and metals in positive matrix factorisation analysis of high-resolution soot particle aerosol mass spectrometer data, Atmos. Chem. Phys., 21, 10763–10777, https://doi.org/10.5194/acp-21-10763-2021, 2021.
Bond, T. C., Doherty, S. J., Fahey, D. W., Forster, P. M., Berntsen, T., DeAngelo, B. J., Flanner, M. G., Ghan, S., Kärcher, B., Koch, D., Kinne, S., Kondo, Y., Quinn, P. K., Sarofim, M. C., Schultz, M. G., Schulz, M., Venkataraman, C., Zhang, H., Zhang, S., Bellouin, N., Guttikunda, S. K., Hopke, P. K., Jacobson, M. Z., Kaiser, J. W., Klimont, Z., Lohmann, U., Schwarz, J. P., Shindell, D., Storelvmo, T., Warren, S. G., and Zender, C. S.: Bounding the role of black carbon in the climate system: A scientific assessment, J. Geophys. Res., 118, 5380–5552, https://doi.org/10.1002/jgrd.50171, 2013.
Carbone, S., Aurela, M., Saarnio, K., Saarikoski, S., Frey, A., Timonen, H., Sueper, D., Ulbrich, I., Jimenez, J.-L., Kulmala, M., Worsnop D., and Hillamo, R.: Wintertime aerosol chemistry in sub-arctic urban air, Aerosol Sci. Tech., 48, 312–322, https://doi.org/10.1080/02786826.2013.875115, 2014.
Carbone, S., Timonen, H., Rostedt, A., Happonen, M., Rönkkö, T., Keskinen, J., Ristimäki, J., Korpi, H., Artaxo, P., Canagaratna, M., Worsnop, D., Canonaco, F., Prévôt, A. S. H., Hillamo, R., and Saarikoski, S.: Distinguishing fuel and lubricating oil combustion products in diesel engine exhaust particles, Aerosol Sci. Tech., https://doi.org/10.1080/02786826.2019.1584389, 2019.
Chen, L.-W. A., Watson, J. G., Chow, J. C., Green, M. C., Inouye, D., and Dick, K.: Wintertime particulate pollution episodes in an urban valley of the Western US: a case study, Atmos. Chem. Phys., 12, 10051–10064, https://doi.org/10.5194/acp-12-10051-2012, 2012.
Cooper, J. A. and Watson, J. G.: Receptor Oriented Methods of Air Particulate Source Apportionment, JAPCA J. Air Waste Ma., 30, 1116–1125, https://doi.org/10.1080/00022470.1980.10465157, 1980.
Corbin, J. C., Sierau, B., Gysel, M., Laborde, M., Keller, A., Kim, J., Petzold, A., Onasch, T. B., Lohmann, U., and Mensah, A. A.: Mass spectrometry of refractory black carbon particles from six sources: carbon-cluster and oxygenated ions, Atmos. Chem. Phys., 14, 2591–2603, https://doi.org/10.5194/acp-14-2591-2014, 2014.
Dasari, S., Andersson, A., Bikkina, S., Holmstrand, H., Budhavant, K., Satheesh, S., Asmi, E., Kesti, J., Backman, J., Salam, A., Bisht, D. S., Tiwari, S., Hameed, Z., and Gustafsson, Ö.: Photochemical degradation affects the light absorption of water-soluble brown carbon in the South Asian outflow, Sci. Adv., 5, eaau8066, https://doi.org/10.1126/sciadv.aau8066, 2019.
Drinovec, L., Močnik, G., Zotter, P., Prévôt, A. S. H., Ruckstuhl, C., Coz, E., Rupakheti, M., Sciare, J., Müller, T., Wiedensohler, A., and Hansen, A. D. A.: The “dual-spot” Aethalometer: an improved measurement of aerosol black carbon with real-time loading compensation, Atmos. Meas. Tech., 8, 1965–1979, https://doi.org/10.5194/amt-8-1965-2015, 2015.
Drinovec, L., Gregorič, A., Zotter, P., Wolf, R., Bruns, E. A., Prévôt, A. S. H., Petit, J.-E., Favez, O., Sciare, J., Arnold, I. J., Chakrabarty, R. K., Moosmüller, H., Filep, A., and Močnik, G.: The filter-loading effect by ambient aerosols in filter absorption photometers depends on the coating of the sampled particles, Atmos. Meas. Tech., 10, 1043–1059, https://doi.org/10.5194/amt-10-1043-2017, 2017.
Enroth, J., Saarikoski, S., Niemi, J., Kousa, A., Ježek, I., Močnik, G., Carbone, S., Kuuluvainen, H., Rönkkö, T., Hillamo, R., and Pirjola, L.: Chemical and physical characterization of traffic particles in four different highway environments in the Helsinki metropolitan area, Atmos. Chem. Phys., 16, 5497–5512, https://doi.org/10.5194/acp-16-5497-2016, 2016.
Friedlander, S. K.: Chemical Element Balances and Identification of Air Pollution Sources, Environ. Sci. Technol., 7, 235–240, https://doi.org/10.1021/es60075a005, 1973.
Fröhlich, R., Crenn, V., Setyan, A., Belis, C. A., Canonaco, F., Favez, O., Riffault, V., Slowik, J. G., Aas, W., Aijälä, M., Alastuey, A., Artiñano, B., Bonnaire, N., Bozzetti, C., Bressi, M., Carbone, C., Coz, E., Croteau, P. L., Cubison, M. J., Esser-Gietl, J. K., Green, D. C., Gros, V., Heikkinen, L., Herrmann, H., Jayne, J. T., Lunder, C. R., Minguillón, M. C., Močnik, G., O'Dowd, C. D., Ovadnevaite, J., Petralia, E., Poulain, L., Priestman, M., Ripoll, A., Sarda-Estève, R., Wiedensohler, A., Baltensperger, U., Sciare, J., and Prévôt, A. S. H.: ACTRIS ACSM intercomparison – Part 2: Intercomparison of ME-2 organic source apportionment results from 15 individual, co-located aerosol mass spectrometers, Atmos. Meas. Tech., 8, 2555–2576, https://doi.org/10.5194/amt-8-2555-2015, 2015.
Gyawali, M., Arnott, W. P., Lewis, K., and Moosmüller, H.: In situ aerosol optics in Reno, NV, USA during and after the summer 2008 California wildfires and the influence of absorbing and non-absorbing organic coatings on spectral light absorption, Atmos. Chem. Phys., 9, 8007–8015, https://doi.org/10.5194/acp-9-8007-2009, 2009.
Hansen, J. and Nazarenko, L.: Soot climate forcing via snow and ice albedos, P. Natl. Acad. Sci. USA, 101, 423–428, https://doi.org/10.1073/pnas.2237157100, 2004.
Healy, R., Sofowote, U., Su, Y., Debosz, J., Noble, M., Jeong, C.-H., Wang, J., Hilker, N., Evans, G., and Doerksen, G.: Ambient measurements and source apportionment of fossil fuel and biomass burning black carbon in Ontario, Atmos. Environ., 161, 34–47, https://doi.org/10.1016/j.atmosenv.2017.04.034, 2017.
Helin, A., Niemi, J. V., Virkkula, A., Pirjola, L., Teinilä, K., Backman, J., Aurela, M., Saarikoski, S., Rönkkö, T., Asmi, E., and Timonen, H.: Characteristics and source apportionment of black carbon in the Helsinki metropolitan area, Finland, Atmos. Environ., 190, 87–98, https://doi.org/10.1016/j.atmosenv.2018.07.022, 2018.
Helin, A., Virkkula, A., Backman, J., Pirjola, L., Sippula, O., Aakko-Saksa, P., Väätäinen, S., Mylläri, F., Järvinen, A., Bloss, M., Aurela, M., Jakobi, G., Karjalainen, P., Zimmermann, R., Jokiniemi, J., Saarikoski, S., Tissari, J., Rönkkö, T., Niemi, J. V., and Timonen, H.: Variation of Absorption Ångström Exponent in Aerosols from Different Emission Sources, J. Geophys. Res., 126, https://doi.org/10.1029/2020JD034094, 2021.
Herich, H., Hueglin, C., and Buchmann, B.: A 2.5 year's source apportionment study of black carbon from wood burning and fossil fuel combustion at urban and rural sites in Switzerland, Atmos. Meas. Tech., 4, 1409–1420, https://doi.org/10.5194/amt-4-1409-2011, 2011.
Heringa, M. F., DeCarlo, P. F., Chirico, R., Tritscher, T., Dommen, J., Weingartner, E., Richter, R., Wehrle, G., Prévôt, A. S. H., and Baltensperger, U.: Investigations of primary and secondary particulate matter of different wood combustion appliances with a high-resolution time-of-flight aerosol mass spectrometer, Atmos. Chem. Phys., 11, 5945–5957, https://doi.org/10.5194/acp-11-5945-2011, 2011.
Hietikko, R., Kuuluvainen, H., Harrison, R. M., Portin, H., Timonen, H., Niemi, J. V., and Rönkkö, T.: Diurnal variation of nanocluster aerosol concentrations and emission factors in a street canyon, Atmos. Environ., 189, 98–106, https://doi.org/10.1016/j.atmosenv.2018.06.031, 2018.
Huang, L., Brook, J. B., Zhang, W., Li, S. M., Graham, L., Ernst, D., Chiculescu, A., and Lu, G.: Stable isotope measurements of carbon fractions (OC/EC) in airborne particulate: A new dimension for source characterization and apportionment, Atmos. Environ., 40, 2690–2705, 2006.
Ikeda, K., Tanimoto, H., Sugita, T., Akiyoshi, H., Kanaya, Y., Zhu, C., and Taketani, F.: Tagged tracer simulations of black carbon in the Arctic: transport, source contributions, and budget, Atmos. Chem. Phys., 17, 10515–10533, https://doi.org/10.5194/acp-17-10515-2017, 2017.
IPCC: Climate Change 2014: Synthesis Report, in: Contribution of Working Groups I, II and III to the Fifth Assessment Report of the Intergovernmental Panel on Climate Change, edited by: Core Writing Team, Pachauri, R. K., and Meyer, L. A., IPCC, Geneva, Switzerland, 151 pp., 2014.
Janssen, N. A. H., Hoek, G., Simic-Lawson, M., Fischer, P., van Bree, L., ten Brink, H., Keuken, M., Atkinson, R. W., Anderson, H. R., Brunekreef, B., and Cassee, F. R.: Black carbon as an additional indicator of the adverse health effects of airborne particles compared with PM10 and PM2.5, Environ. Health Persp., 119, 1691–1699, https://doi.org/10.1289/ehp.1003369, 2011.
Järvinen, A., Timonen, H., Karjalainen, P., Bloss, M., Simonen, P., Saarikoski, S., Kuuluvainen, H., Kalliokoski, J., DalMaso, M., Niemi, J., Keskinen, J., and Rönkkö, T.: Particle emissions of Euro VI, EEV and retrofitted EEV city buses in real traffic, Environ. Pollut., 250, 708–716, https://doi.org/10.1016/j.envpol.2019.04.033, 2019.
Jayne, J. T., Leard, D. C., Zhang, X., Davidovits, P., Smith, K. A., Kolb, C. E., and Worsnop, D. R.: Development of an Aerosol Mass Spectrometer for Size and Composition Analysis of Submicron Particles, Aerosol Sci. Tech., 33, 49–70, https://doi.org/10.1080/027868200410840, 2000.
Kirchstetter, T. W., Novakov, T., and Hobbs, P. V.: Evidence that the spectral dependence of light absorption by aerosols is affected by organic carbon, J. Geophys. Res.-Atmos., 109, D21208, https://doi.org/10.1029/2004JD004999, 2004.
Klimont, Z., Kupiainen, K., Heyes, C., Purohit, P., Cofala, J., Rafaj, P., Borken-Kleefeld, J., and Schöpp, W.: Global anthropogenic emissions of particulate matter including black carbon, Atmos. Chem. Phys., 17, 8681–8723, https://doi.org/10.5194/acp-17-8681-2017, 2017.
Kortelainen, M., Jokiniemi, J., Tiitta, P., Tissari, J., Lamberg, H., Leskinen, J., Grigonyte-Lopez Rodriguez, J., Koponen, H., Antikainen, S., Nuutinen, I., Zimmermann, R., and Sippula, O.: Time-resolved chemical composition of small-scale batch combustion emissions from various wood species, Fuel, 233, 224–236, https://doi.org/10.1016/j.fuel.2018.06.056, 2018.
Kukkonen, J., López-Aparicio, S., Segersson, D., Geels, C., Kangas, L., Kauhaniemi, M., Maragkidou, A., Jensen, A., Assmuth, T., Karppinen, A., Sofiev, M., Hellén, H., Riikonen, K., Nikmo, J., Kousa, A., Niemi, J. V., Karvosenoja, N., Santos, G. S., Sundvor, I., Im, U., Christensen, J. H., Nielsen, O.-K., Plejdrup, M. S., Nøjgaard, J. K., Omstedt, G., Andersson, C., Forsberg, B., and Brandt, J.: The influence of residential wood combustion on the concentrations of PM2.5 in four Nordic cities, Atmos. Chem. Phys., 20, 4333–4365, https://doi.org/10.5194/acp-20-4333-2020, 2020.
Kuula, J., Friman, M., Helin, A., Niemi, J. V., Aurela, M., Timonen, H., and Saarikoski, S.: Utilization of scattering and absorption-based particulate matter sensors in the environment impacted by residential wood combustion, J. Aerosol Sci., 15, https://doi.org/10.1016/j.jaerosci.2020.105671, 2020.
Lack, D. A. and Cappa, C. D.: Impact of brown and clear carbon on light absorption enhancement, single scatter albedo and absorption wavelength dependence of black carbon, Atmos. Chem. Phys., 10, 4207–4220, https://doi.org/10.5194/acp-10-4207-2010, 2010.
Lack, D. A. and Langridge, J. M.: On the attribution of black and brown carbon light absorption using the Ångström exponent, Atmos. Chem. Phys., 13, 10535–10543, https://doi.org/10.5194/acp-13-10535-2013, 2013.
Laskin, A., Laskin, J., and Nizkorodov, S. A.: Chemistry of atmospheric brown carbon, Chem. Rev., 115, 4335–4382, https://doi.org/10.1021/cr5006167, 2015.
Luoma, K., Niemi, J. V., Aurela, M., Fung, P. L., Helin, A., Hussein, T., Kangas, L., Kousa, A., Rönkkö, T., Timonen, H., Virkkula, A., and Petäjä, T.: Spatiotemporal variation and trends in equivalent black carbon in the Helsinki metropolitan area in Finland, Atmos. Chem. Phys., 21, 1173–1189, https://doi.org/10.5194/acp-21-1173-2021, 2021.
Martinsson, J., Eriksson, A. C., Elbæk Nielsen, I., Berg Malmborg, V., Ahlberg, E., Andersen, C., Lindgre, R., Nyström, R., Nordin, E. Z., Brune, W. H., Svenningsson, B., Swietlicki, E., Boman, C., and Pagels, J. H.: Impacts of Combustion Conditions and Photochemical Processing on the Light Absorption of Biomass Combustion Aerosol, Environ. Sci. Technol., 49, 14663–14671, https://doi.org/10.1021/acs.est.5b03205, 2015.
Middlebrook, A. M., Bahreini, R., Jiménez, J. L., and Canagaratna, M. R.: Evaluation of composition-dependent collection efficiencies for the Aerodyne aerosol mass spectrometer using field data, Aerosol Sci. Tech., 46, 258–271, 2012.
Nicolae, D., Nemuc, A., Müller, D., Talianu, C., Vasilescu, J., Belegante, L., and Kolgotin, A.: Characterization of fresh and aged biomass burning events using multiwavelength Raman lidar and mass spectrometry, J. Geophys. Res., 118, 2956–2965, https://doi.org/10.1002/jgrd.50324, 2013.
Niemi, J. V., Saarikoski, S., Aurela, M., Tervahattu, H., Hillamo, R., Westphale, D. L., Aarnio, P., Koskentalo, T., Makkonen, U., Vehkamäki, H., and Kulmala, M.: Long-range transport episodes of fine particles in southern Finland during 1999–2007, Atmos. Environ., 43, 1255–1264, https://doi.org/10.1016/j.atmosenv.2008.11.022, 2009.
Ohtonen, K., Kaski, N., and Niemi, J.: Tulisijojen käyttö ja päästöt pääkaupunkiseudulla vuonna 2018, HSY:n julkaisuja 1/2020, ISSN 978-952-7146-47-7, https://julkaisu.hsy.fi/tulisijojen-kaytto-ja-paastot-paakaupunkiseudulla-vuonna-2018.pdf, last access: 11 December 2020.
Onasch, T. B., Trimborn, A., Fortner, E. C., Jayne, J. T., Kok, G. L., Williams, L. R., Davidovits, P., and Worsnop, D. R.: Soot particle aerosol mass spectrometer: Development, validation, and initial application, Aerosol Sci. Tech., 46, 804–817, https://doi.org/10.1080/02786826.2012.663948, 2012.
Onasch, T. B., Fortner, E. C., Trimborn, A. M., Lambe, A. T., Tiwari, A. J., Marr, L. C., Corbin, J. C., Mensah, A. A., Williams, L. R., Davidovits, P., and Worsnop, D. R.: Investigations of SP-AMS Carbon Ion Distributions as a Function of Refractory Black Carbon Particle Type, Aerosol Sci. Tech., 49, 409–422, https://doi.org/10.1080/02786826.2015.1039959, 2015.
Paatero, P.: Least squares formulation of robust non-negative factor analysis, Chemometr. Intell. Lab., 37, 23–35, https://doi.org/10.1016/S0169-7439(96)00044-5, 1997.
Paatero, P. and Tapper, U.: Positive matrix factorization – A nonnegative factor model with optimal utilization of error- estimates of data values, Environmetrics, 5, 111–126, https://doi.org/10.1002/env.3170050203, 1994.
Pirjola, L., Dittrich, A., Niemi, J. V., Saarikoski, S., Timonen, H., Kuuluvainen, H., Järvinen, A., Kousa, A., Rönkkö, T., and Hillamo, R., Physical and chemical characterization of real-world particle number and mass emissions from city buses in Finland, Environ. Sci. Technol., 50, 294–304, https://doi.org/10.1021/acs.est.5b04105, 2016.
Rivellini, L.-H., Adam, M. G., Kasthuriarachchi, N., and Lee, A. K. Y.: Characterization of carbonaceous aerosols in Singapore: insight from black carbon fragments and trace metal ions detected by a soot particle aerosol mass spectrometer, Atmos. Chem. Phys., 20, 5977–5993, https://doi.org/10.5194/acp-20-5977-2020, 2020.
Saarikoski, S., Sillanpää, M., Sofiev, M., Timonen, H., Saarnio, K., Teinilä, K., Karppinen, A., Kukkonen, J., and Hillamo, R.: Chemical composition of aerosols during a major biomass burning episode over northern Europe in spring 2006: experimental and modelling assessments, Atmos. Environ., 41, 3577–3589, https://doi.org/10.1016/j.atmosenv.2006.12.053, 2007.
Saarikoski, S., Salo, L., Bloss, M., Alanen, J., Teinilä, K., Reyes, F., Vázquez, Y., Keskinen, J., Oyola, P., Rönkkö, T., and Timonen. H.: Sources and Characteristics of Particulate Matter at Five Locations in an Underground Mine, Aerosol Air Qual. Res. 19, 2613–2624, https://doi.org/10.4209/aaqr.2019.03.0118, 2019.
Saarnio, K., Aurela, M., Timonen, H., Saarikoski, S., Teinilä, K., Mäkelä, T., Sofiev, M., Koskinen, J., Aalto, P. P., Kulmala, M., Kukkonen, J., and Hillamo, R.: Chemical composition of fine particles in fresh smoke plumes from boreal wild-land fires in Europe, Sci. Total Environ., 408, 2527–2542, https://doi.org/10.1016/j.scitotenv.2010.03.010, 2010a.
Saarnio, K., Teinilä, K., Aurela, M., Timonen, H., and Hillamo, R.: High-performance anion-exchange chromatography-mass spectrometry method for determination of levoglucosan, mannosan and galactosan in atmospheric fine particulate matter, Anal. Bioanal. Chem., 398, 2253–2264, https://doi.org/10.1007/s00216-010-4151-4, 2010b.
Sandradewi, J., Prévôt, A., Weingartner, E., Schmidhauser, R., Gysel, M., and Baltensperger, U.: A study of wood burning and traffic aerosols in an Alpine valley using a multi-wavelength Aethalometer, Atmos. Environ., 42, 101–112, https://doi.org/10.1016/j.atmosenv.2007.09.034, 2008a.
Sandradewi, J., Prévôt, A. S., Szidat, S., Perron, N., Alfarra, M. R., Lanz, V. A., Weingartner, E., and Baltensperger, U.: Using aerosol light absorption measurements for the quantitative determination of wood burning and traffic emission contributions to particulate matter, Environ. Sci. Technol., 42, 3316–3323, https://doi.org/10.1021/es702253m, 2008b.
Savolahti, M., Karvosenoja, N., Tissari, J., Kupiainen, K., Sippula, O., and Jokiniemi, J.: Black carbon and fine particle emissions in Finnish residential wood combustion: Emission projections, reduction measures and the impact of combustion practices, Atmos. Environ., 140, 495–505, https://doi.org/10.1016/j.atmosenv.2016.06.023, 2016.
Sciare, J., d'Argouges, O., Sarda-Estève, R., Gaimoz, C., Dolgorouky, C., Bonnaire, N., Favez, O., Bonsang, B., and Gros, V.: Large contribution of water-insoluble secondary organic aerosols in the region of Paris (France) during wintertime, J. Geophys. Res., 116, D22, https://doi.org/10.1029/2011JD015756, 2011.
Segersson, D., Eneroth, K., Gidhagen, L., Johansson, C., Omstedt, G., Engström Nylen, A., and Forsberg, B.: Health impact of PM10, PM2.5 and black carbon exposure due to different source sectors in Stockholm, Gothenburg and Umea, Sweden, Int. J. Env. Res. Pub. He., 14, 742, https://doi.org/10.3390/ijerph14070742, 2017.
Szidat, S., Jenk, T. M., Gäggeler, H. W., Synal, H.-A., Fisseha, R., Baltensberger, U., Kalberer, M., Samburova, V., Wacker, L., Saurer, M., Schwikowski, M., and Hajdas, I.: Source apportionment of aerosols by 14C measurements in different carbonaceous particle fractions, Radiocarbon, 46, 475–484, https://doi.org/10.1017/S0033822200039783, 2004.
Tasoglou, A., Saliba, G., Subramanian, R., and Pandis, S. N.: Absorption of chemically aged biomass burning carbonaceous aerosol, J. Aerosol Sci., 113, 141–152, https://doi.org/10.1016/j.jaerosci.2017.07.011, 2017.
Timonen, H., Carbone, S., Aurela, M., Saarnio, K., Saarikoski, S., Ng, N. L., Canagaratna, M. R., Kulmala, M. Kerminen, V.-M., Worsnop, D. R., and Hillamo, R.: Characteristics, sources and water-solubility of ambient submicron organic aerosol in springtime in Helsinki, Finland, J. Aerosol Sci., 56, 61–77, https://doi.org/10.1016/j.jaerosci.2012.06.005, 2013.
Tissari, J., Väätäinen, S., Leskinen, J., Savolahti, M., Lamberg, H., Kortelainen, M., Karvosenoja, N., and Sippula, O.: Fine Particle Emissions from Sauna Stoves: Effects of Combustion Appliance and Fuel, and Implications for the Finnish Emission Inventory, Atmosphere, 10, 775, https://doi.org/10.3390/atmos10120775, 2019.
Ulbrich, I. M., Canagaratna, M. R., Zhang, Q., Worsnop, D. R., and Jimenez, J. L.: Interpretation of organic components from Positive Matrix Factorization of aerosol mass spectrometric data, Atmos. Chem. Phys., 9, 2891–2918, https://doi.org/10.5194/acp-9-2891-2009, 2009.
Virkkula, A.: Modeled source apportionment of black carbon particles coated with a light-scattering shell, Atmos. Meas. Tech., 14, 3707–3719, https://doi.org/10.5194/amt-14-3707-2021, 2021.
Wang, J. M., Jeong, C.-H., Hilker, N., Shairsingh, K. K., Healy, R. M., Sofowote, U., Debosz, J., Su, Y., McGaughey, M., Doerksen, G., Munoz, T., White, L., Herod, D., and Evans, G. J.: Near-Road Air Pollutant Measurements: Accounting for Inter-Site Variability Using Emission Factors, Environ. Sci. Technol., 52, 16, 9495–9504, https://doi.org/10.1021/acs.est.8b01914, 2018.
Wang, Y., Hopke, P. K., Rattigan, O. V., Xia, X., Chalupa, D. C., and Utell, M. J.: Characterization of residential wood combustion particles using the two-wavelength aethalometer, Environ. Sci. Technol., 45, 7387–7393, https://doi.org/10.1021/es2013984, 2011a.
Wang, Y., Hopke, P. K., Rattigan, O. V., and Zhu, Y.: Characterization of ambient black carbon and wood burning particles in two urban areas, J. Environ. Monitor., 13, 1919–1926, https://doi.org/10.1039/c1em10117j, 2011b.
WHO: Health Effects of Black Carbon, World Health Organization, Regional Office for Europe, Copenhagen, 2012.
Yoon, S., Fairley, D., Barrett, T. E., and Sheesley, R. J.: Biomass and fossil fuel combustion contributions to elemental carbon across the San Francisco Bay Area, Atmos. Environ., 195, 229-242, https://doi.org/10.1016/j.atmosenv.2018.09.050, 2018.
Yttri, K. E., Simpson, D., Stenström, K., Puxbaum, H., and Svendby, T.: Source apportionment of the carbonaceous aerosol in Norway – quantitative estimates based on 14C, thermal-optical and organic tracer analysis, Atmos. Chem. Phys., 11, 9375–9394, https://doi.org/10.5194/acp-11-9375-2011, 2011.
Zotter, P., Herich, H., Gysel, M., El-Haddad, I., Zhang, Y., Močnik, G., Hüglin, C., Baltensperger, U., Szidat, S., and Prévôt, A. S. H.: Evaluation of the absorption Ångström exponents for traffic and wood burning in the Aethalometer-based source apportionment using radiocarbon measurements of ambient aerosol, Atmos. Chem. Phys., 17, 4229–4249, https://doi.org/10.5194/acp-17-4229-2017, 2017.