the Creative Commons Attribution 4.0 License.
the Creative Commons Attribution 4.0 License.
 | 02 Feb 2021
Ambient nitro-aromatic compounds – biomass burning versus secondary formation in rural China
Christian Mark Garcia Salvador
Rongzhi Tang
Michael Priestley
Linjie Li
Epameinondas Tsiligiannis
Michael Le Breton
Wenfei Zhu
Limin Zeng
Hui Wang
Ying Yu
Nitro-aromatic compounds (NACs) were measured hourly at a rural site in China during wintertime to monitor the changes due to local and regional impacts of biomass burning (BB). Concurrent and continuous measurements of the concentrations of 16 NACs in the gas and particle phases were performed with a time-of-flight chemical ionization mass spectrometer (CIMS) equipped with a Filter Inlet for Gases and AEROsols (FIGAERO) unit using iodide as the reagent ion. NACs accounted for <2 % of the mass concentration of organic matter (OM) and total particulate matter (PM), but the total particle mass concentrations of these compounds can reach as high as 1000 ng m−3 (299 ng m−3 avg), suggesting that they may contribute significantly to the radiative forcing effects of atmospheric particles. Levels of gas-phase NACs were highest during the daytime (15:00–16:00 local time, LT), with a smaller night-time peak around 20:00 LT. Box-model simulations showed that this occurred because the rate of NAC production from gas-phase sources exceeded the rate of loss, which occurred mainly via the OH reaction and to a lesser degree via photolysis. Data gathered during extended periods with high contributions from primary BB sources (resulting in 40 %–60 % increases in NAC concentrations) were used to characterize individual NACs with respect to gas–particle partitioning and the contributions of regional secondary processes (i.e. photochemical smog). On days without extensive BB, secondary formation was the dominant source of NACs, and NAC levels correlated strongly with the ambient ozone concentration. Analyses of individual NACs in the regionally aged plumes sampled on these days allowed precursors such as phenol and catechol to be linked to their NAC derivatives (i.e. nitrophenol and nitrocatechol). Correlation analysis using the high time resolution data and box-model simulation results constrained the relationships between these compounds and demonstrated the contribution of secondary formation processes. Furthermore, 13 of 16 NACS were classified according to primary or secondary formation process. Primary emission was the dominant source (accounting for 60 %–70 % of the measured concentrations) of 5 of the 16 studied NACs, but secondary formation was also a significant source. Photochemical smog thus has important effects on brown carbon levels even during wintertime periods dominated by primary air pollution in rural China.
- Article
(9230 KB) - Full-text XML
-
Supplement
(1461 KB) - BibTeX
- EndNote


Nitro-aromatic compounds (NACs) are aromatic compounds containing at least one nitro (–NO2) functional group attached directly to a benzene ring. They are considered anthropogenic compounds; there is little or no evidence of their formation from natural sources. The atmospheric production and behaviour of NACs have attracted interest due to their role in the formation of brown carbon (BrC) aerosols (Xie et al., 2017, 2019; Lin et al., 2016; Mohr et al., 2013; Kroflič et al., 2015). Nitro-aromatic compounds such as nitrophenol (NP), nitrocatechol (NC), and dinitrophenol (DNP) absorb light in the near-ultraviolet (UV) and visible regions, which can cause positive radiative forcing (Zhang et al., 2017). While NACs may constitute only a minor fraction of aerosols (<2 %) (Mohr et al., 2013; Wang et al., 2017), they can account for as much as 50 % of the light absorption coefficient of secondary organic aerosol (SOA) at 365 nm (Xie et al., 2017). In addition to their roles as potential climate forcers, NACs can adversely affect human health: exposure to nitrophenol can cause blood disorders that retard the delivery of oxygen to tissues and organs (Agency for Toxic Substances and Disease Registry, 2015). The harmful effects of NACs and their strong effects on radiation balances even at minute concentrations necessitate a robust understanding of their atmospheric behaviour and sources.
The origins of atmospheric NACs can vary depending on the prevailing atmospheric conditions and local levels of precursors and oxidants. Traffic and biomass burning (BB) are the main sources of NACs (Inomata et al., 2016; Perrone et al., 2014; Le Breton et al., 2019; Kitanovski et al., 2012b). BB is considered a major driver of atmospheric NAC formation (Kahnt et al., 2013; Laskin et al., 2015). Here, the combustion of coal and wood leads to thermal degradation and pyrolysis of lignins, which results in strong emission of substituted phenols including 1,2-benzenediols (catechols) and cresol/methylphenols, that in turn are precursors for the formation of NACs. Accordingly, several lab and field studies have demonstrated the formation of NACs originating from wood burning under various atmospheric conditions. For instance, molecular characterization of aged BB plumes from a nationwide bonfire festival revealed a suite of nitro-aromatic compounds that accounted for 50 %–80 % of the total visible light absorption (Lin et al., 2017). Additionally, combustion of pine under high flaming conditions resulted in the emission of 8.1 mg kg−1 of NACs, primarily NC and NP (Hoffmann et al., 2007). A total of 14 NAC species were detected in laboratory simulations of open BB, with nitrocatechol having the highest mass concentration regardless of the choice of wood fuel (Xie et al., 2019). The same study reported a significant contribution of NACs to absorption at 365 nm (Abs365), indicating that NACs are strong brown carbon (BrC) chromophores. Cloud water samples collected during a period of extensive wheat straw burning at a mountain site in North China also showed the presence of NP, NC, and their derivatives (Desyaterik et al., 2013).
The atmospheric abundance of NACs can also be attributed to secondary oxidation of precursor aromatic compounds (Yuan et al., 2016). The photooxidation and subsequent nitration of benzene and toluene yield NP and methylnitrophenol (MNP), respectively. Oxidation of precursors is initiated by hydroxyl (OH) and nitrate (NO3) radicals, which can cause both daytime and night-time formation of NACs. Wood burning processes also emit significant quantities of aromatic compounds with OH substituents such as phenol and catechol, which can be transformed into NP and NC under high NOx conditions (Finewax et al., 2018). In the same way, oxidation of mononitrates generates nitrophenoxy radicals and similar compounds that produce DNP and other dinitrates. In most of these processes, the ambient concentration of NO2 is the main determinant of the rate of NAC formation until the system/site reaches a NOx-saturated regime under which further increases in NO2 levels do not increase NAC formation (Yuan et al., 2016; Wang et al., 2019). In addition to the typical gas-phase photooxidation mechanism, NAC formation can occur via aqueous-phase oxidation, which is favoured by a high atmospheric liquid content and/or the presence of clouds that provide aqueous surfaces on which oxidation reactions can proceed (Lüttke et al., 1997; Vione et al., 2005). In China, it was calculated that domestic and open burning were responsible for the emission of 640 t of NACs (Wang et al., 2017). However, there is considerable uncertainty in this estimate because the amount of material burned varies from year to year. Consequently, there is a clear need for further studies on the emissions of nitro-aromatic compounds in China.
NACs are typically collected using aerosol filters over an extended period (e.g. 12 h to 1 d). Particle-bound NACs can then be extracted and analysed using gas chromatography followed by mass spectrometry (Cecinato et al., 2005) or ultra-pressure/high-pressure liquid chromatography (UP/HPLC) (Wang et al., 2018, 2019; Iinuma et al., 2010; Finewax et al., 2018; Kahnt et al., 2013; Xie et al., 2019; Kitanovski et al., 2012a, b). Recent advances in measurement techniques have enabled fast and semi-continuous measurement of NACs using a high-resolution time-of-flight chemical ionization mass spectrometer (HR-ToF-CIMS) (Le Breton et al., 2019; Mohr et al., 2013; Yuan et al., 2016; Gaston et al., 2016). The high resolving power of CIMS (m∕Δ m>3000) has facilitated the detection of analytes with very low detection limits. Additionally, by using a Filter Inlet for Gases and AEROsols (FIGAERO) unit, the concentrations of NACs and other species in both the gas and aerosol phases can be analysed simultaneously without need for sample preparation (e.g. by solvent extraction) (Lopez-Hilfiker et al., 2014; Gaston et al., 2016; Lee et al., 2014).
In this work, the formation of gas- and particle-phase NACs in a rural area of China was studied using a ToF-CIMS instrument with a FIGAERO unit. NACs were classified based on their similarity to NP, NC, nitrobenzoic acid, and DNP. The measurements were performed in Dezhou, China, where open burning of crop residues is a major source of atmospheric pollutants (Wang et al., 2018). A previous study conducted in this area recorded some of the highest levels of emissions from open burning of crop residues ever observed in Shandong Province (Gao et al., 2017), so it was expected that emissions due to BB events would be captured during the study period.
2.1 Site description
Measurements were conducted in Dezhou, Shandong Province, China (37.4341∘ N, 116.3575∘ E), as part of the “Photochemical Smog in China” project, which aims to evaluate haze formation in China and its implications for air quality policies (Hallquist et al., 2016). Instrumental measurements were performed at the Meteorological Weather Bureau of Pingyuan from November 2017 to January 2018. This season is of specific interest because previous wintertime measurements in this area have indicated that NACs can contribute as much as 50 ng m−3 to the mass concentration of PM2.5 (particulate matter). The temperature and relative humidity during the measurement period ranged from −11.7 to 20.9 ∘C and from 129 %–99 %, with campaign averages of 2.2 ∘C and 50 %, respectively. The wind speed averaged 2.4 m s−1; a time series of the metrological conditions during the experimental campaign is shown in Fig. 1. The daytime mass concentration of particulate matter (PM1.0) measured with an aerosol mass spectrometer typically exceeded the European Air Quality allowable limit for PM2.5 (25 µg m−3), and there were more than 10 pollution episodes with high aerosol loadings (>100 µg m−3). Organic matter comprised 60 % of the PM1.0 on average, and it contributed as much as 80 % in several field measurements. Inorganic nitrate (NO) accounted for 20 % of the measured PM1.0 levels on average. The diurnal profiles of total particulate matter and organic matter were similar, with two distinct peaks at 08:00 and 19:00 (LT) (Fig. 1).
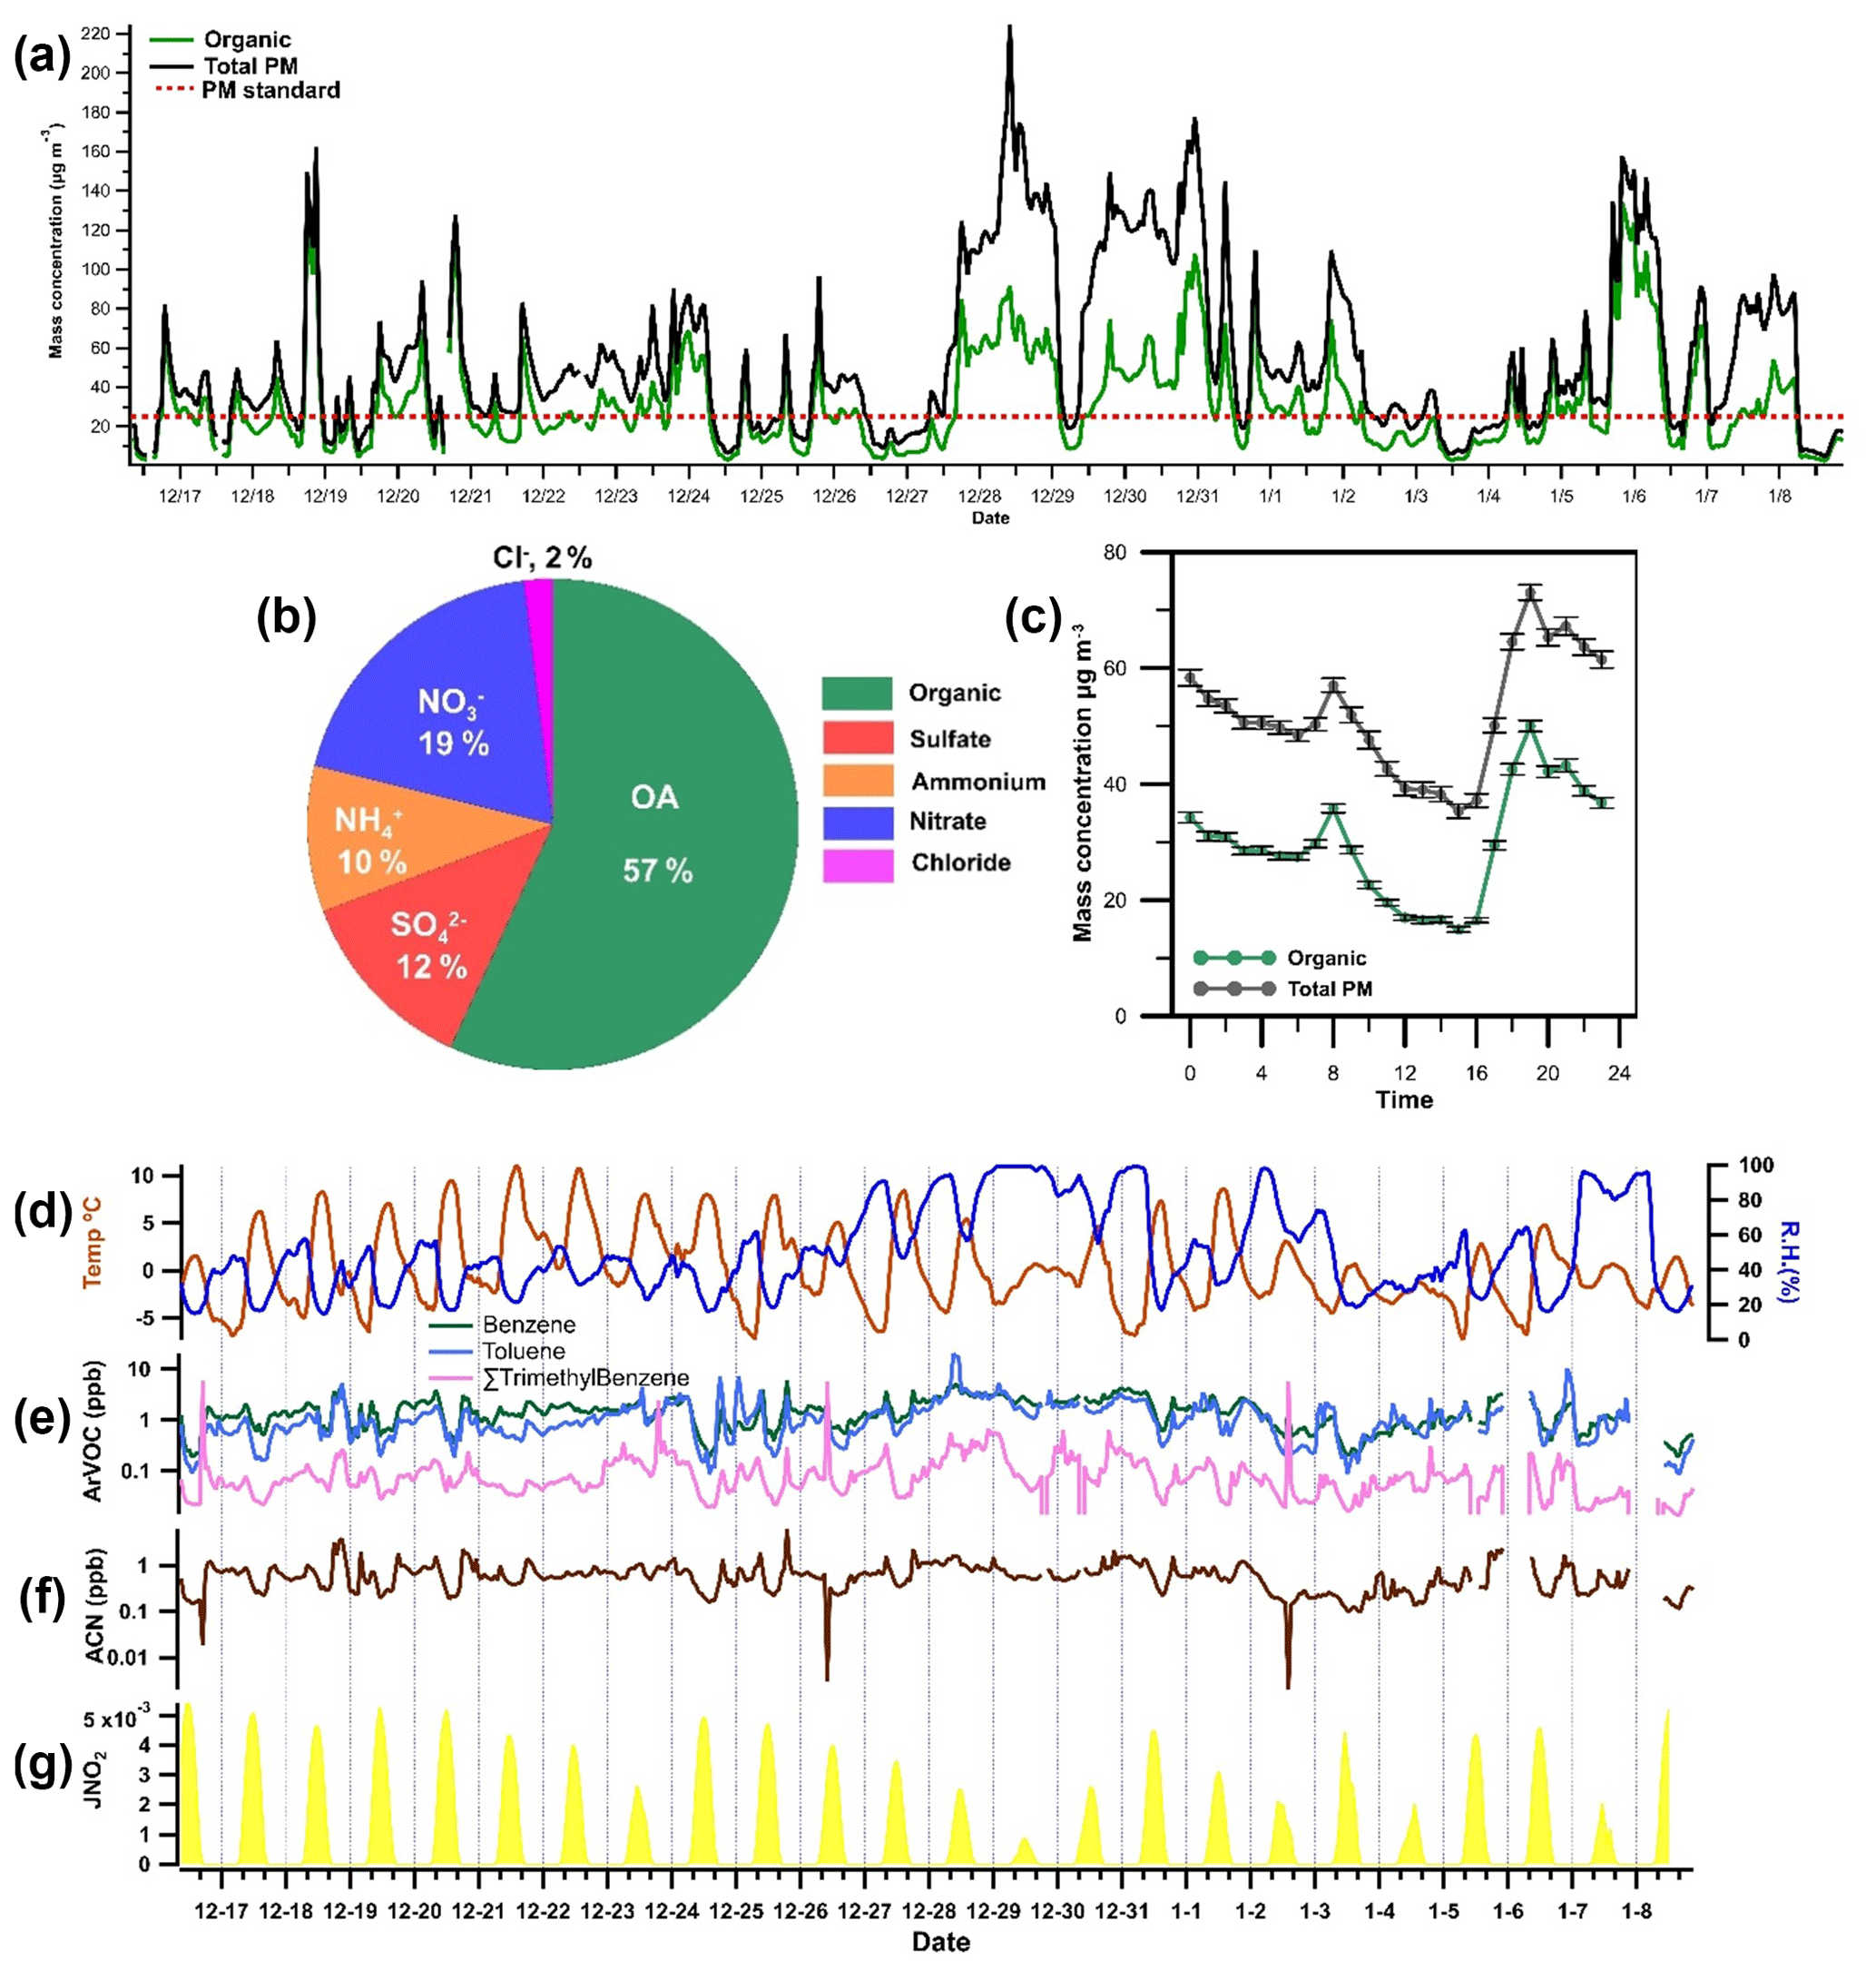
Figure 1(a) Time series profiles of organic matter (OM) and total particulate matter (PM) concentrations during the field campaign. The red reference line at 25 µg m−3 represents a typical PM2.5 mass limit. (b) Contribution of different aerosol components to particulate mass concentration as measured with an aerosol mass spectrometer (AMS). (c) Diurnal variation in levels of organic and total particulate matter during the wintertime measurement period in Dezhou. Error bars indicate standard errors. Time series of (d) temperature and relative humidity (RH) and (e) aromatic VOCs such as benzene, toluene, and trimethylbenzene. Also included in the figure are (f) the mixing ratio of acetonitrile (ACN) and (g) the rate of NO2 photolysis, expressed as j(NO2).
2.2 FIGAERO–CIMS measurement
A Filter Inlet for Gases and AEROsols (FIGAERO) coupled to a time-of-flight mass spectrometer (ToF-CIMS) was utilized to characterize the NAC content of the gas and particle phases. This instrument is described in detail in previous publications (Lopez-Hilfiker et al., 2014; Le Breton et al., 2018, 2019). Teflon tubing and copper tubing were used as sample lines for the gas and particle phases, respectively. The ToF-CIMS was operated in negative ionization mode with iodide (I–) as the reagent ion. High-purity N2 air (99.9 % purity) was flown over a glass vial containing methyl iodide (CH3I) and into a TOFWERK type-P X-ray ion source (operated at 9.5 kV and 150 µA) to create ions to charge compounds (MH) entering the ion–molecule region (IMR). The resulting product ions were identified either as molecular adducts with iodide (MHI−) or deprotonated ions (M−) (Eq. 1):
The ToF-CIMS was optimized to have an average spectral mass resolution (m∕Δ m) of 3000. ToF spectra showing ions with mass-to-charge (m∕z) ratios between 7–620 Da were acquired with a time resolution of 1 s and averaged over 1 min for data analysis The ToF spectra were mass calibrated using four frequently occurring ion peaks: iodide monomer (I−, 126.904 m∕z), dimer (I 253.809 m∕z), and trimer (I, 380.713 m∕z) and the NO ion (61.988 m∕z). The signal of the reagent ion (iodide, ) provided the information on the drift of the signal of the mass spectrometer (MS). The variabilities of the raw iodide signal during the field measurement were less than 10 % and 20 % for the gas- and particle-phase analysis, which indicated the minimal drift of the CIMS signal. During the post-processing of the data, all signals from MS were normalized to the signal of the reagent ion to account for the daily variations/drifts. Gas-phase blank analysis was performed during the post-campaign calibration of the instrument
Aerosol particles were collected for 30 min with a PM1.0 cyclone and deposited on a Zefluor® PTFE membrane filter. Analytes were then desorbed by passing heated N2 gas over the filter, with a temperature cycle from room temperature to 200 ∘C over 20 min, followed by a 10 min soak at 200 ∘C to ensure desorption of the compounds from the filter (a typical desorption profile is shown in the Supplement). The NACs were quantified by doping the PTFE filter of the FIGAERO with known amounts of freshly prepared authentic standards. The standards were analysed using the same thermal desorption procedure as for the aerosol particles. NACs with no available standard were quantified by applying sensitivities for compounds with similar chemical structures.
2.3 Other collocated instruments
A high-resolution time-of-flight aerosol mass spectrometer (HR-ToF-AMS) was used to measure the composition and size distribution of particles with diameters below 1.0 µm (PM1.0). These measurements provided mass concentrations of particle-bound non-refractory species such as organics, sulfates, nitrates, ammonium, and chloride with a 4 min average time resolution (DeCarlo et al., 2006). Volatile organic compounds (VOCs), including some precursors of NACs, were monitored using a combination of two online gas chromatographs (GCs) with a mass spectrometer (MS) and flame ionization (FID) detectors, resulting in the detection of over 100 VOCs. Photolysis rates of ozone (j(O1D)) and NO2 () were measured using a commercial spectroradiometer, which was calibrated using a high-power halogen lamp after the field campaign.
2.4 Box-model simulation of nitrocatechol using the AtChem tool
A series of box-model simulations was conducted to clarify the mechanism of NC formation during the second period of the experimental campaign (see below), when secondary chemistry dominated the formation of NACs. Simulations were performed using AtChem (Sommariva et al., 2020; http://https://atchem.leeds.ac.uk/, last access: 27 January 2021), an online zero-dimensional box model, together with chemical reactions extracted from the Master Chemical Mechanism (MCMv3.3.1) via the website (http://mcm.leeds.ac.uk/MCM, last access: 27 January 2021; Jenkin et al., 2003; Saunders et al., 2003). AtChem was previously utilized to simulate the formation of formic acid and nitrophenol at a site dominated by oil and gas production (Yuan et al., 2016). In our simulations, NC was used as a representative NAC to clarify the potential contribution of compounds emitted during biomass burning (i.e. catechol) to secondary NAC formation. The strong dependence of NC production on the overall rate of secondary formation and its significant mixing ratio during the second period (74 ng m−3) made this compound a suitable representative NAC for this purpose. The MCM (v.3.3.1) assumes that NC is the sole product of catechol, which greatly reduces the complexity of the model's calculations. Measured concentrations of inorganic gases such as CO, O3, NOx, and selected volatile organic compounds were used to constrain the simulations (Table S3). Over 90 VOCs were measured during the field campaign in Dezhou. However, to minimize the computational cost of the modelling process, only the 10 VOCs with the highest mixing ratios were included in the model. Additionally, compounds with multiple isomers (e.g. xylene and trimethylbenzene) were treated as single species to further reduce computational cost. The VOCs with the highest contribution to OH reactivity in four Chinese cities (Tan et al., 2019) were also included in the model to properly simulate the major oxidation reactions in the atmosphere. The VOC concentration assumed in the simulations amounted to 75 % of the total VOC concentration measured in Dezhou. Overall, a total of 1195 species (intermediates, products, etc.) and 3705 reactions (oxidation, photolysis, etc.) were included in the mechanism. The contribution of traffic sources was also analysed; results for these sources are presented in the Supplement.
3.1 Identification and occurrence of NACs in Dezhou
Figure 2 compares mass spectra collected during a strong BB episode (red lines) to those for a typical clean day (black lines) in Dezhou. The intensities of several molecular ion peaks increased significantly during the BB episode, particularly those at 138.019 and 154.014 m∕z, which correspond to the deprotonated masses of NP (C6H4NO) and NC (C6H4NO), respectively. These ions exhibited 6- to 8-fold increases in signal intensity during the BB episode, clearly indicating substantial increases in the concentrations of the corresponding compounds. By analysing the difference between polluted and clear episodes, 16 ions related to nitro-aromatic compounds were identified (see Fig. 2), including nitrobenzoic acid, methoxy/methyl NP, and DNP. The exact positioning and assignment of the functional groups of the nitro-aromatic compounds could not be determined because ToF-CIMS cannot differentiate between isomers, i.e. compounds with the same molecular formulas. High-resolution fitting results for individual peaks are presented in the Supplement.
The campaign-average mixing ratios of NACs measured for the gas and particle phase were 1720 and 299 ng m−3, respectively. The measured fractions of the 16 NACs in the particle phase (Fp) ranged between 9 % and 28 %, with a mean of 16 %; these results are consistent with those obtained in an earlier study that applied the same measurement technique during springtime at a suburban site in Changping near Beijing, China (Le Breton et al., 2018). The overall contribution of particle-phase NACs to the total concentrations of organic matter (mean: 1.9 %; range: 0.0025 %–21 %) and total PM (mean: 1.1 %; range: 0.0013 %–11 %) varied substantially over the campaign, which may indicate that multiple NAC sources and formation pathways influence the concentration of NACs. Since the analytical technique used in this work cannot account for all NACs, the mass loadings reported here should be treated as lower limits. Nevertheless, the mean concentrations measured in Dezhou were higher than the mixing ratios of total NACs reported in other studies (Teich et al., 2017; Wang et al., 2018, 2019; Kahnt et al., 2013), possibly because this work examined a greater number of NACs (16 compounds). Furthermore, concentrations of NACs measured in winter are normally significantly higher than those measured in the summer because the boundary layer is usually more shallow, and BB (wood combustion) occurs more frequently in winter.
The diurnal profile of total gas-phase NACs exhibits two distinct peaks: a broad peak around midday, between 13:00–16:00, and another in the evening (around 20:00 local time), as shown in Fig. 3. The mean daytime concentration of gas-phase NACs in Dezhou (2200 ng m−3) was almost twice the night-time mixing ratio (1400 ng m−3), presumably because either the rate of NAC production was higher during the daytime or the rate of loss was lower. These results stand in contrast to those of an earlier study, in which only night-time peaks were observed due to the daytime photolysis of NACs (Yuan et al., 2016). Mean daytime and night-time concentrations of particle-phase NACs were similar (304 and 300 ng m−3, respectively) but with clear variability, as shown in the corresponding diurnal profiles: there were two diurnal particle-phase peaks (08:00 and 20:00 LT), but both were less pronounced than their gas-phase counterparts. These maxima coincided with the peaks in the diurnal profiles of organic and particulate matter, suggesting that levels of particle-phase NACs were linked to the general occurrence of ambient aerosols. This may be due to enhanced partitioning towards the particle phase caused by increases in the organic aerosol mass. The diurnal profile of particle-phase NACs was comparable with the observed profile of nitrocatechol detected from residential wood smoke (Gaston et al., 2016).
Figure 3 also shows the mass contribution of lumped NAC categories in the gas and particle phases. NACs were assigned to lumped categories based on their structural similarity to the most common NACs reported in previous studies. Both the gas and particle phases exhibited similar percentage contributions for each category. NP and its analogues accounted for almost half of the total NAC concentration in both phases, which was assumed to be due to the strong influence of primary emission from BB events. NC and methylnitrocatechol, both of which are commonly used as biomass tracers (Iinuma et al., 2010; Finewax et al., 2018), individually accounted for as much as 9 % of the total NAC concentration. Interestingly, the diurnal profiles of NP did not follow the general trend of the other measured NACs. This suggests that its formation pathway differs from that of other NACs such as NC; it may be that the contribution of secondary formation is greater than that of direct primary emission from BB for NP.
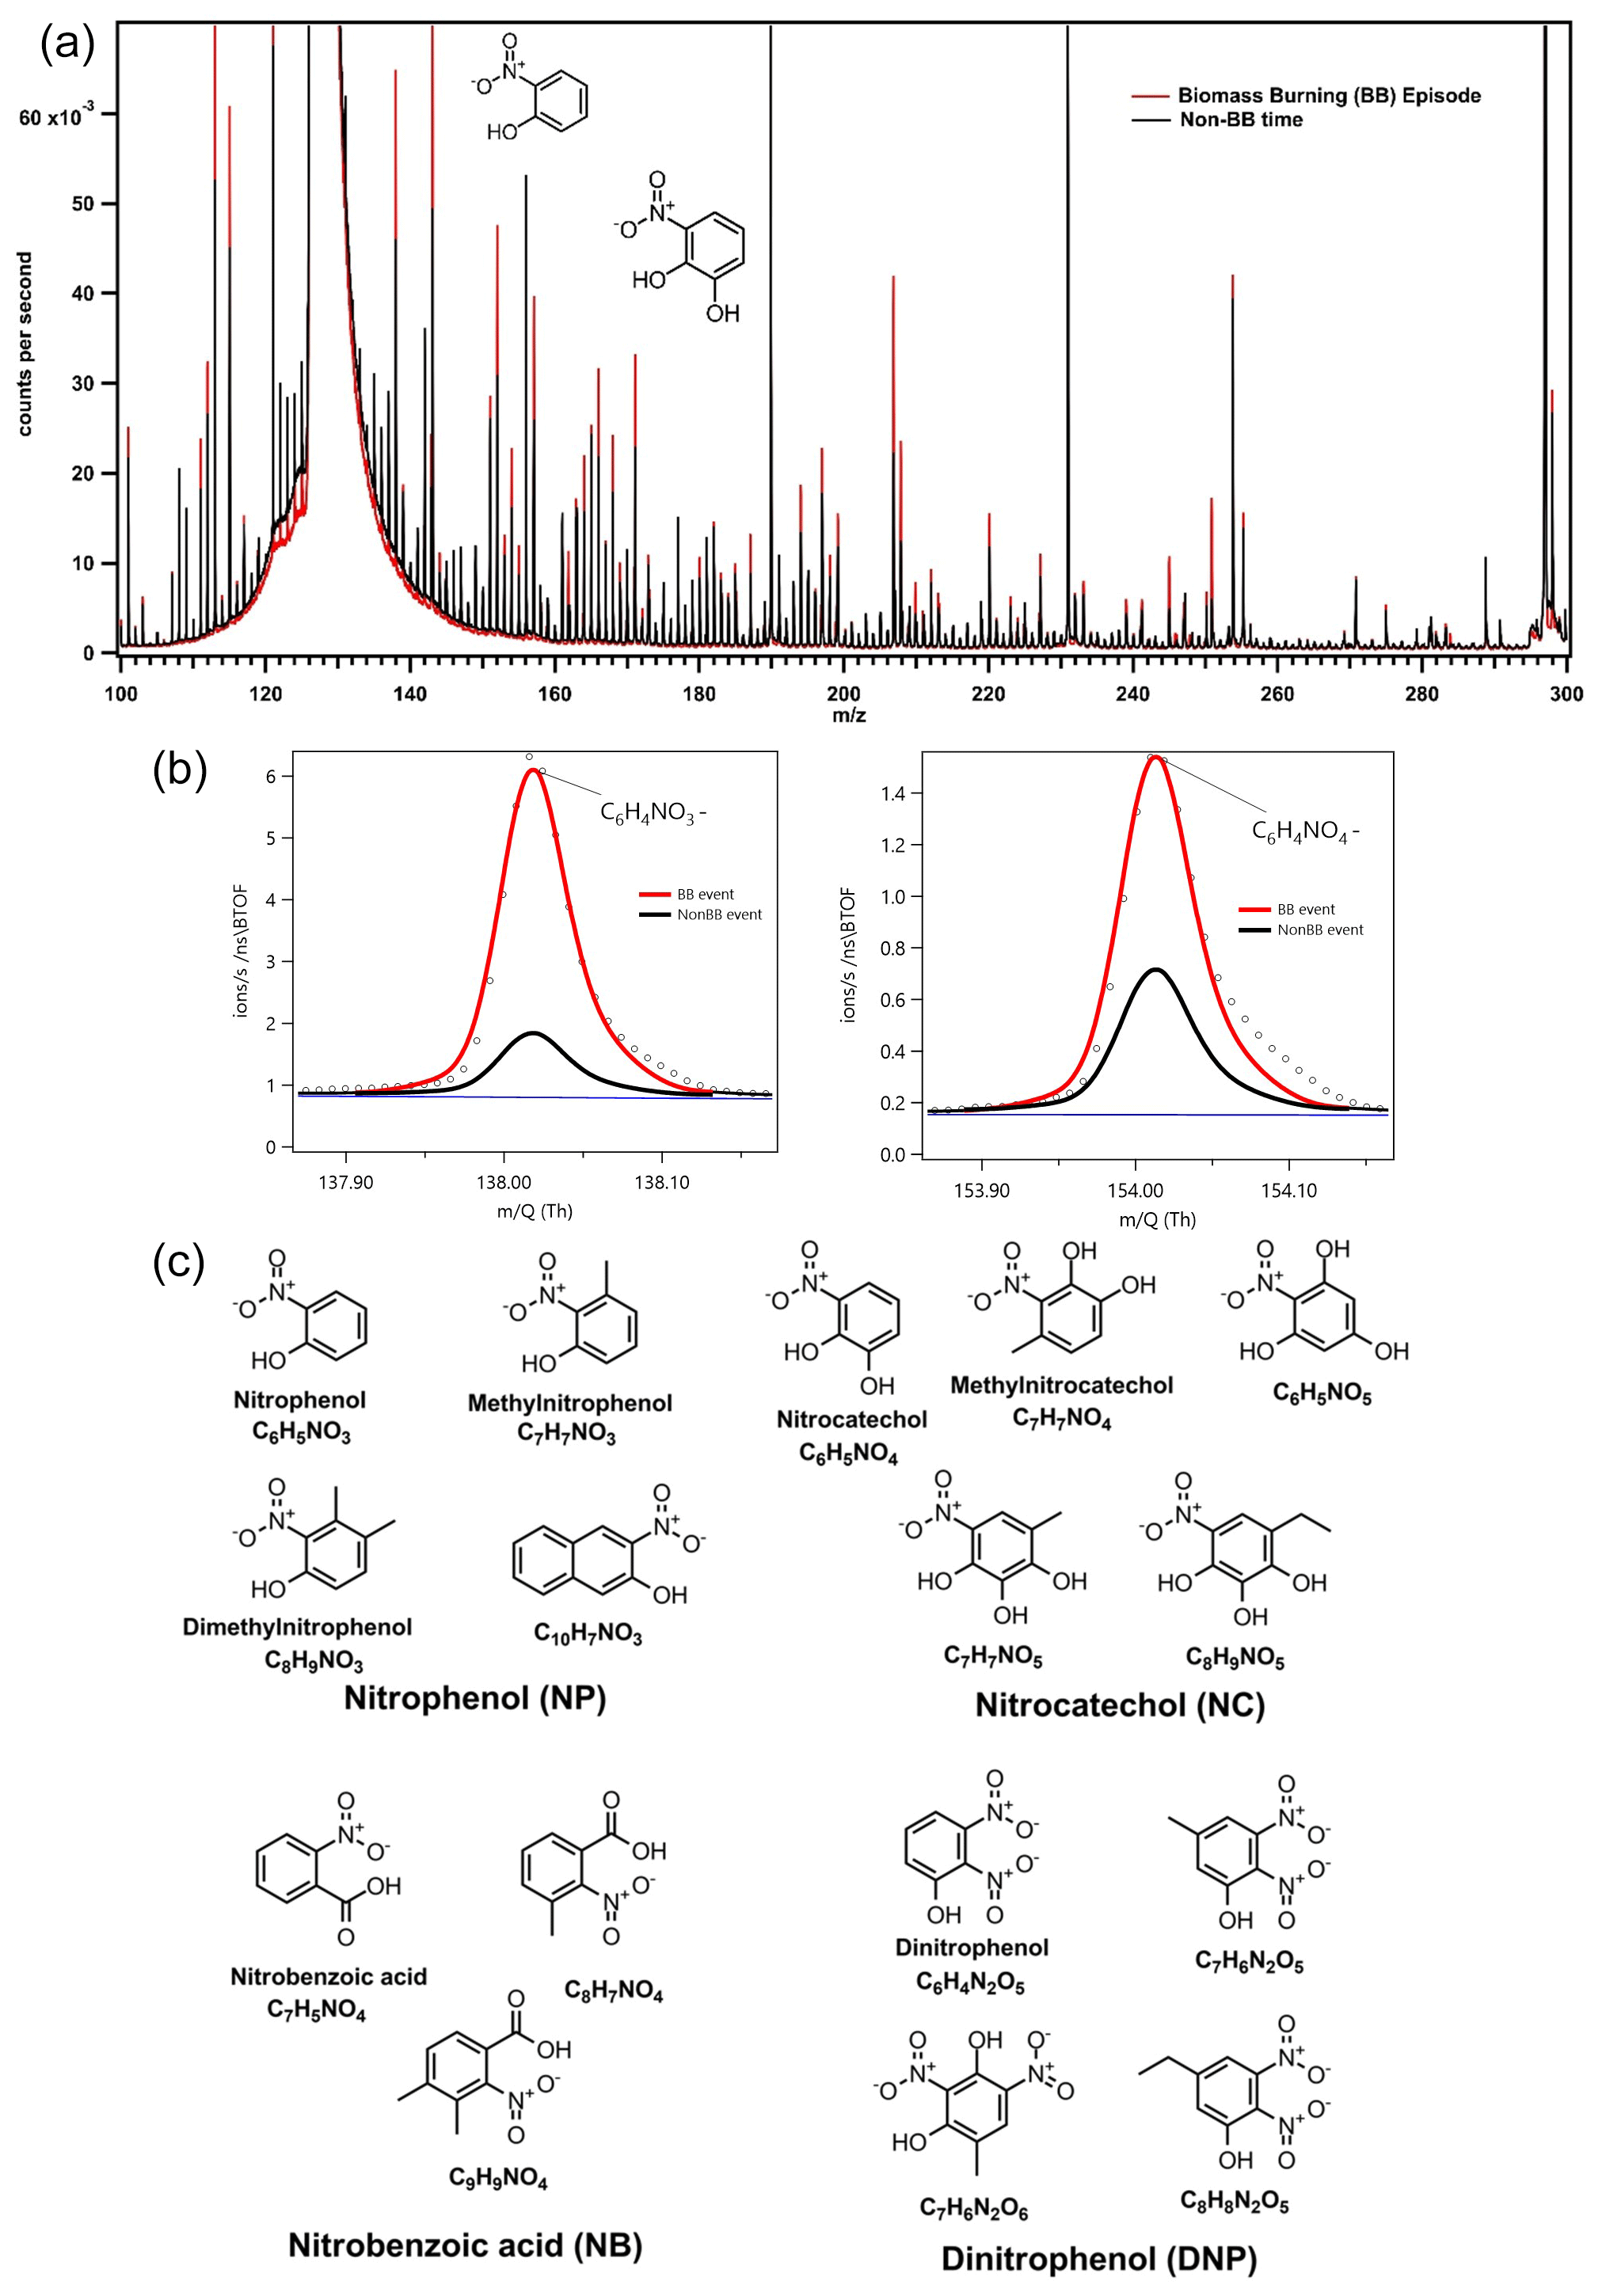
Figure 2(a) Integrated mass spectra during a biomass burning episode (red) and a typical “clean” day. (b) Expansions of the peaks at m∕z 138 and 154, which correspond to deprotonated nitrophenol (NP) and nitrocatechol (NC). The increase in the strength of the NP and NC signals during the biomass burning episode is readily apparent. (c) Molecular structures of the 16 NACs identified in this work, grouped according to structural similarity.
3.2 Sources of nitro-aromatic compounds
Previous studies indicated that NACs mainly originate from BB, traffic, or secondary formation in the gas or condensed phase, with minor contributions from coal combustion (Hanson et al., 1983; Wang et al., 2018; Yuan et al., 2016; Xie et al., 2019; Chow et al., 2016). While previous studies found that traffic has important effects on NAC levels (Cecinato et al., 2005; Tremp et al., 1993), its influence appeared to be limited in this case: there was a weak to negative association between typical automobile exhaust VOCs (benzene, toluene, and trimethylbenzene) (Zhang et al., 2018; Geng et al., 2008; Batterman et al., 2002) and the studied NACs. Furthermore, concentrations of the measured NACs did not peak during or shortly after periods of high traffic intensity, in contrast to results obtained at three sites in Europe during cold and warm seasons (Delhomme et al., 2010).
NACs may also form in aqueous phases, particularly when the atmosphere has a high liquid water content (Harrison et al., 2005b; Vidović et al., 2018, 2020). The contribution of aqueous-phase oxidation to NAC formation was found to be limited based on the negative relationship ( to −0.6) between the relative humidity (RH) and the mixing ratios of NACs in the gas and particle phases. An earlier study found that the relative contribution of aqueous-phase oxidation to NAC formation in Beijing increased as the ambient RH increased (Wang et al., 2019). The conditions in Dezhou during the measurement campaign were relatively dry (the campaign average RH was 50 %), with few days exceeding 70 % RH as shown in Fig. 1.
Given the minor contributions of traffic and aqueous-phase oxidation, most of the subsequent analysis focused on primary BB emissions and secondary formation in the gas and particle phases.
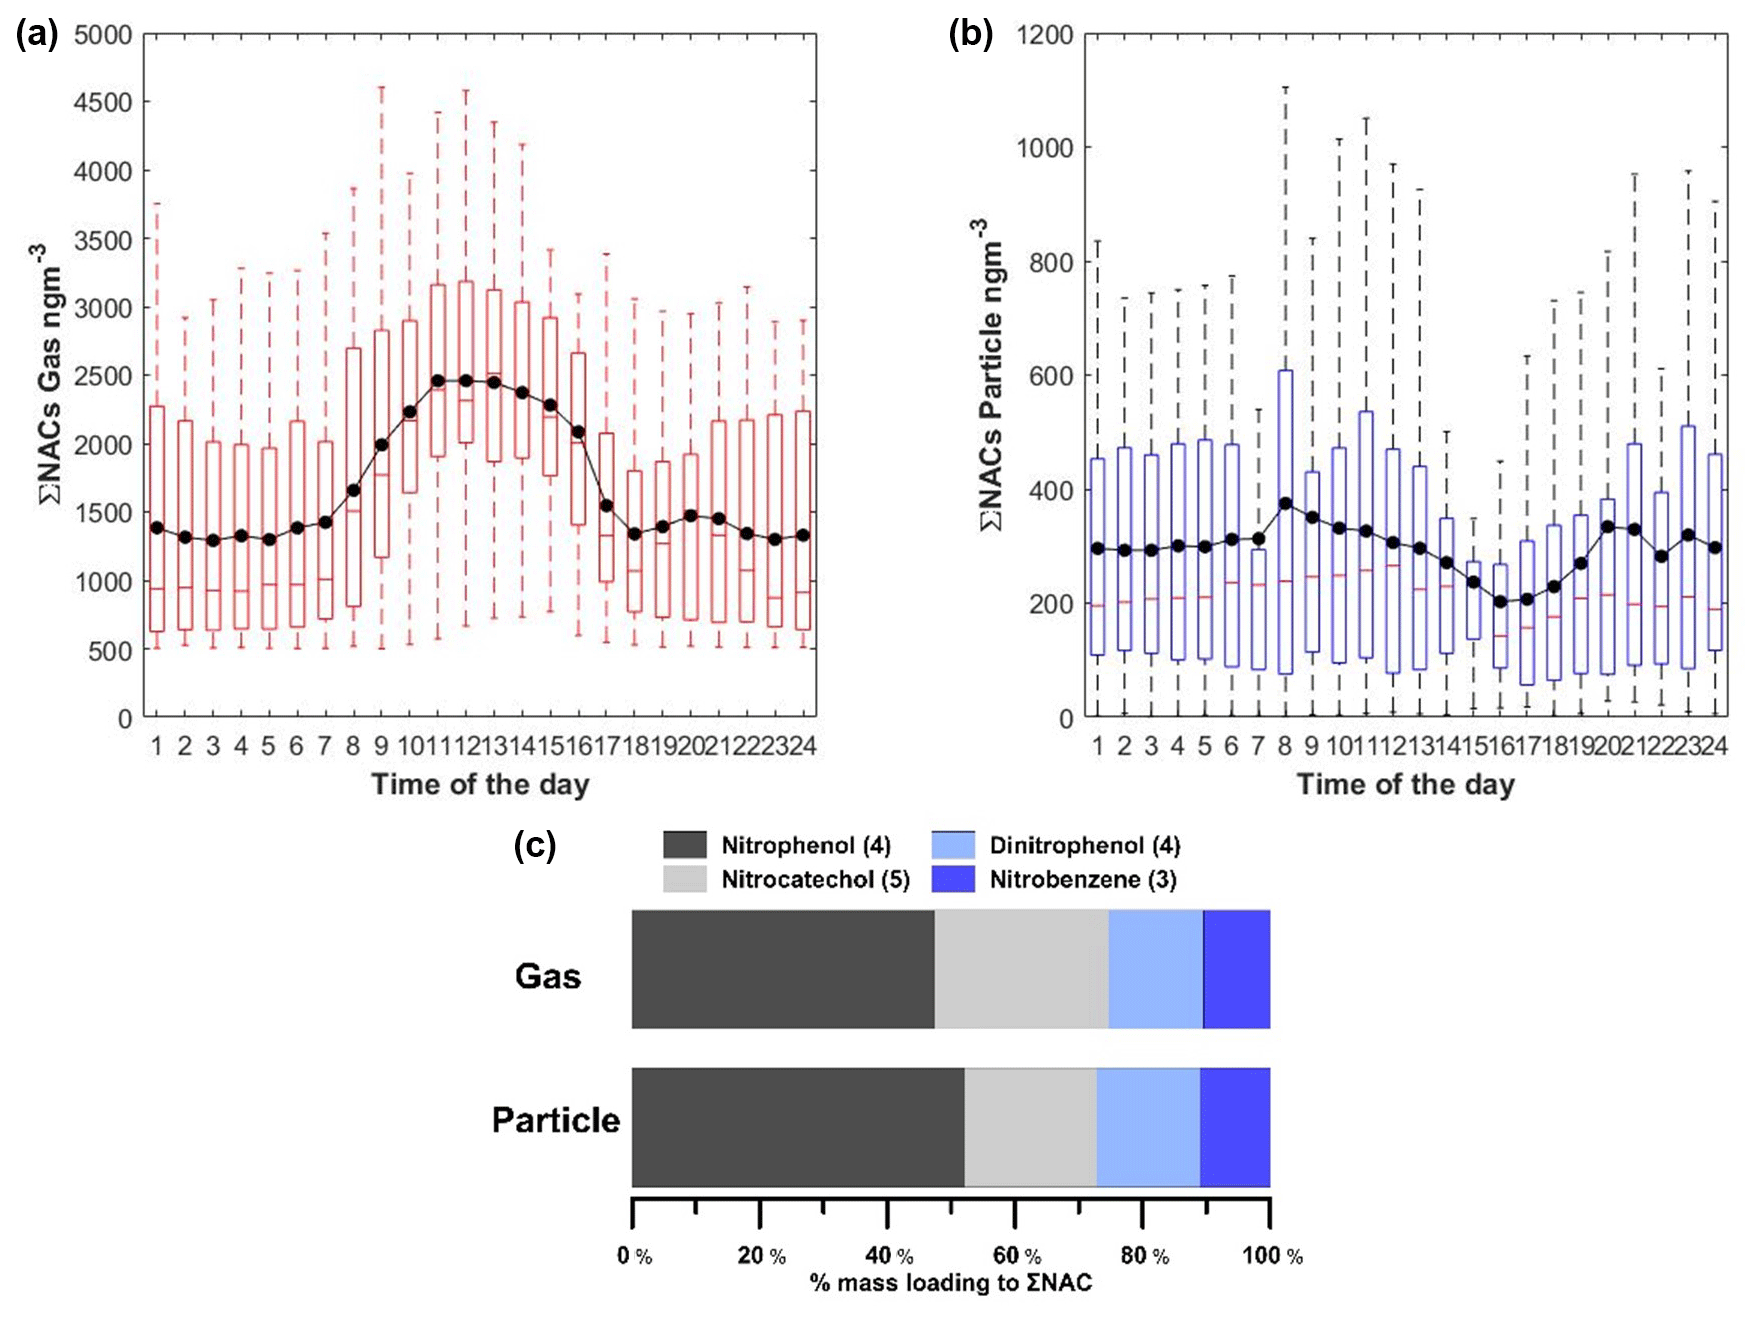
Figure 3(a, b) Diurnal profile of the sum of NACs in the gas (a) and particle (b) phases. The solid black line indicates the hourly average. Note that outliers are not shown in the figure. (c) Molecular distribution of NACs in the gas and particle phases, classified according to similarity to major NACs. Values in parentheses indicate the number of compounds per category.
3.3 Primary emission from biomass burning
The measurement period included many intense BB episodes that increased the concentrations of some NACs, particularly in the particle phase. To verify the association between these elevated concentrations and the observed BB episodes, the atmospheric behaviours of levoglucosan and nitrous acid (HONO) and the ratio of NOx to NOy (NOx ∕ NOy) were used as tracers of BB. Levoglucosan is a commonly used molecular tracer of BB that is superior to other markers such as K+ and black carbon (BC) because it is much less prone to interference from non-BB sources (Zhang et al., 2012; Simoneit et al., 1999). Concentrations of HONO increase during BB episodes because the rate of conversion of NO2 into HONO is elevated in BB plumes due to the presence of aerosols with high surface areas (Nie et al., 2015). The ratio of NOx and NOy reflects the freshness of the emissions from combustion; levels of NOx in plumes originating from local BB are high, typically resulting in a ratio close to 1. The atmospheric transformation of NOx leads to the formation of NOz components such as HNO3 and organonitrates, causing the ratio of NOx to NOy to deviate from unity. In Fig. 4, the 3-week measurement campaign is separated into four periods corresponding to four distinct NAC formation regimes. Regimes 1 and 3 are associated with strong BB episodes based on the profiles of the three previously mentioned tracers. Levels of NACs in the condensed phase mirrored those of levoglucosan, which exhibited two strong peaks at 08:00 and 20:00 LT. Moreover, during apparent BB events, the timing of the peaks in NAC concentrations agreed well with that of the peaks in the diurnal OM profile. This demonstrates the apparently strong contribution of NACs to submicron aerosols in the studied city in rural China
Figure 4 also shows the gas and particle concentration time series of three representative NACs (NP, NC, and DNP). NP and NC are frequently reported to be the dominant NACs in field- and laboratory-based BB studies (Xie et al., 2019; Wang et al., 2017, 2018). Figure 4 clearly shows that the three NACs behave in quite different ways under the regimes linked to strong BB episodes. In these regimes, gas-phase NP concentrations correlated strongly () with those in the particle phase. This may be because there was a common dominant source of NP in the gas and particle phases or because of fast partitioning of NP between these phases during BB events. There was also good agreement between the gas- and particle-phase time series for the methoxy/methyl (C7H7NO3) and ethoxy/ethyl (C8H9NO3) derivatives of NP during BB regimes. NP and its analogues thus appear to be good direct tracers of primary emissions from BB events in Dezhou.
Conversely, the correlations between the gas- and particle-phase concentrations of NC and DNP were very weak (), indicating that BB events had different effects on the formation and partitioning of these NACs (see Supplement for a complete correlation analysis). During typical clean days, particularly from 20 to 30 December (regime 2), the average correlation coefficient between the gas and particle phases for all NACs fell to less than 0.5, possibly because the contribution of photochemical processes to NAC formation was high relative to that of primary BB sources.
Secondary NAC formation may also occur during periods of extensive BB, resulting in mixed contributions to the observed NAC concentration. Differences in the mixing ratios and mass concentrations of NACs between BB regimes and relatively clean regimes can shed light on the relative contributions of primary emissions from BB and secondary production during each regime type. This can be demonstrated by considering the average NAC concentrations under regimes 1 (a strong BB regime) and 2 (a non-BB regime); pronounced differences (>50 %) in NAC concentration between these regimes can be considered indicative of the influence of BB on NAC production in Dezhou. The average recorded signal intensities for levoglucosan in the gas and particle phases under regime 2 were 52 % and 72 % lower, respectively, than those for regime 1. Moreover, some compounds, particularly NP and its methoxy/methyl and ethoxy/ethyl derivatives, exhibited significantly reduced mixing ratios in both gas and particle phases under regime 2. This supports the position that these compounds may be useful direct tracers of BB in Dezhou. Some NACs exhibited lesser declines (<30 %) in the gas-phase mixing ratio, suggesting that BB may not be their dominant source; for example, they may be primarily formed via secondary production. This behaviour was observed for dinitrated aromatic compounds such as C6H4N2O5 and C7H6N2O5, which can be formed via nitration of mononitrates (C6H5NO3 and C7H7NO3) (Yuan et al., 2016; Vione et al., 2005). Such nitration processes are mainly driven by secondary photochemical or multiphase reactions, explaining the comparatively small difference in the mixing ratios of these compounds between regimes 1 and 2.
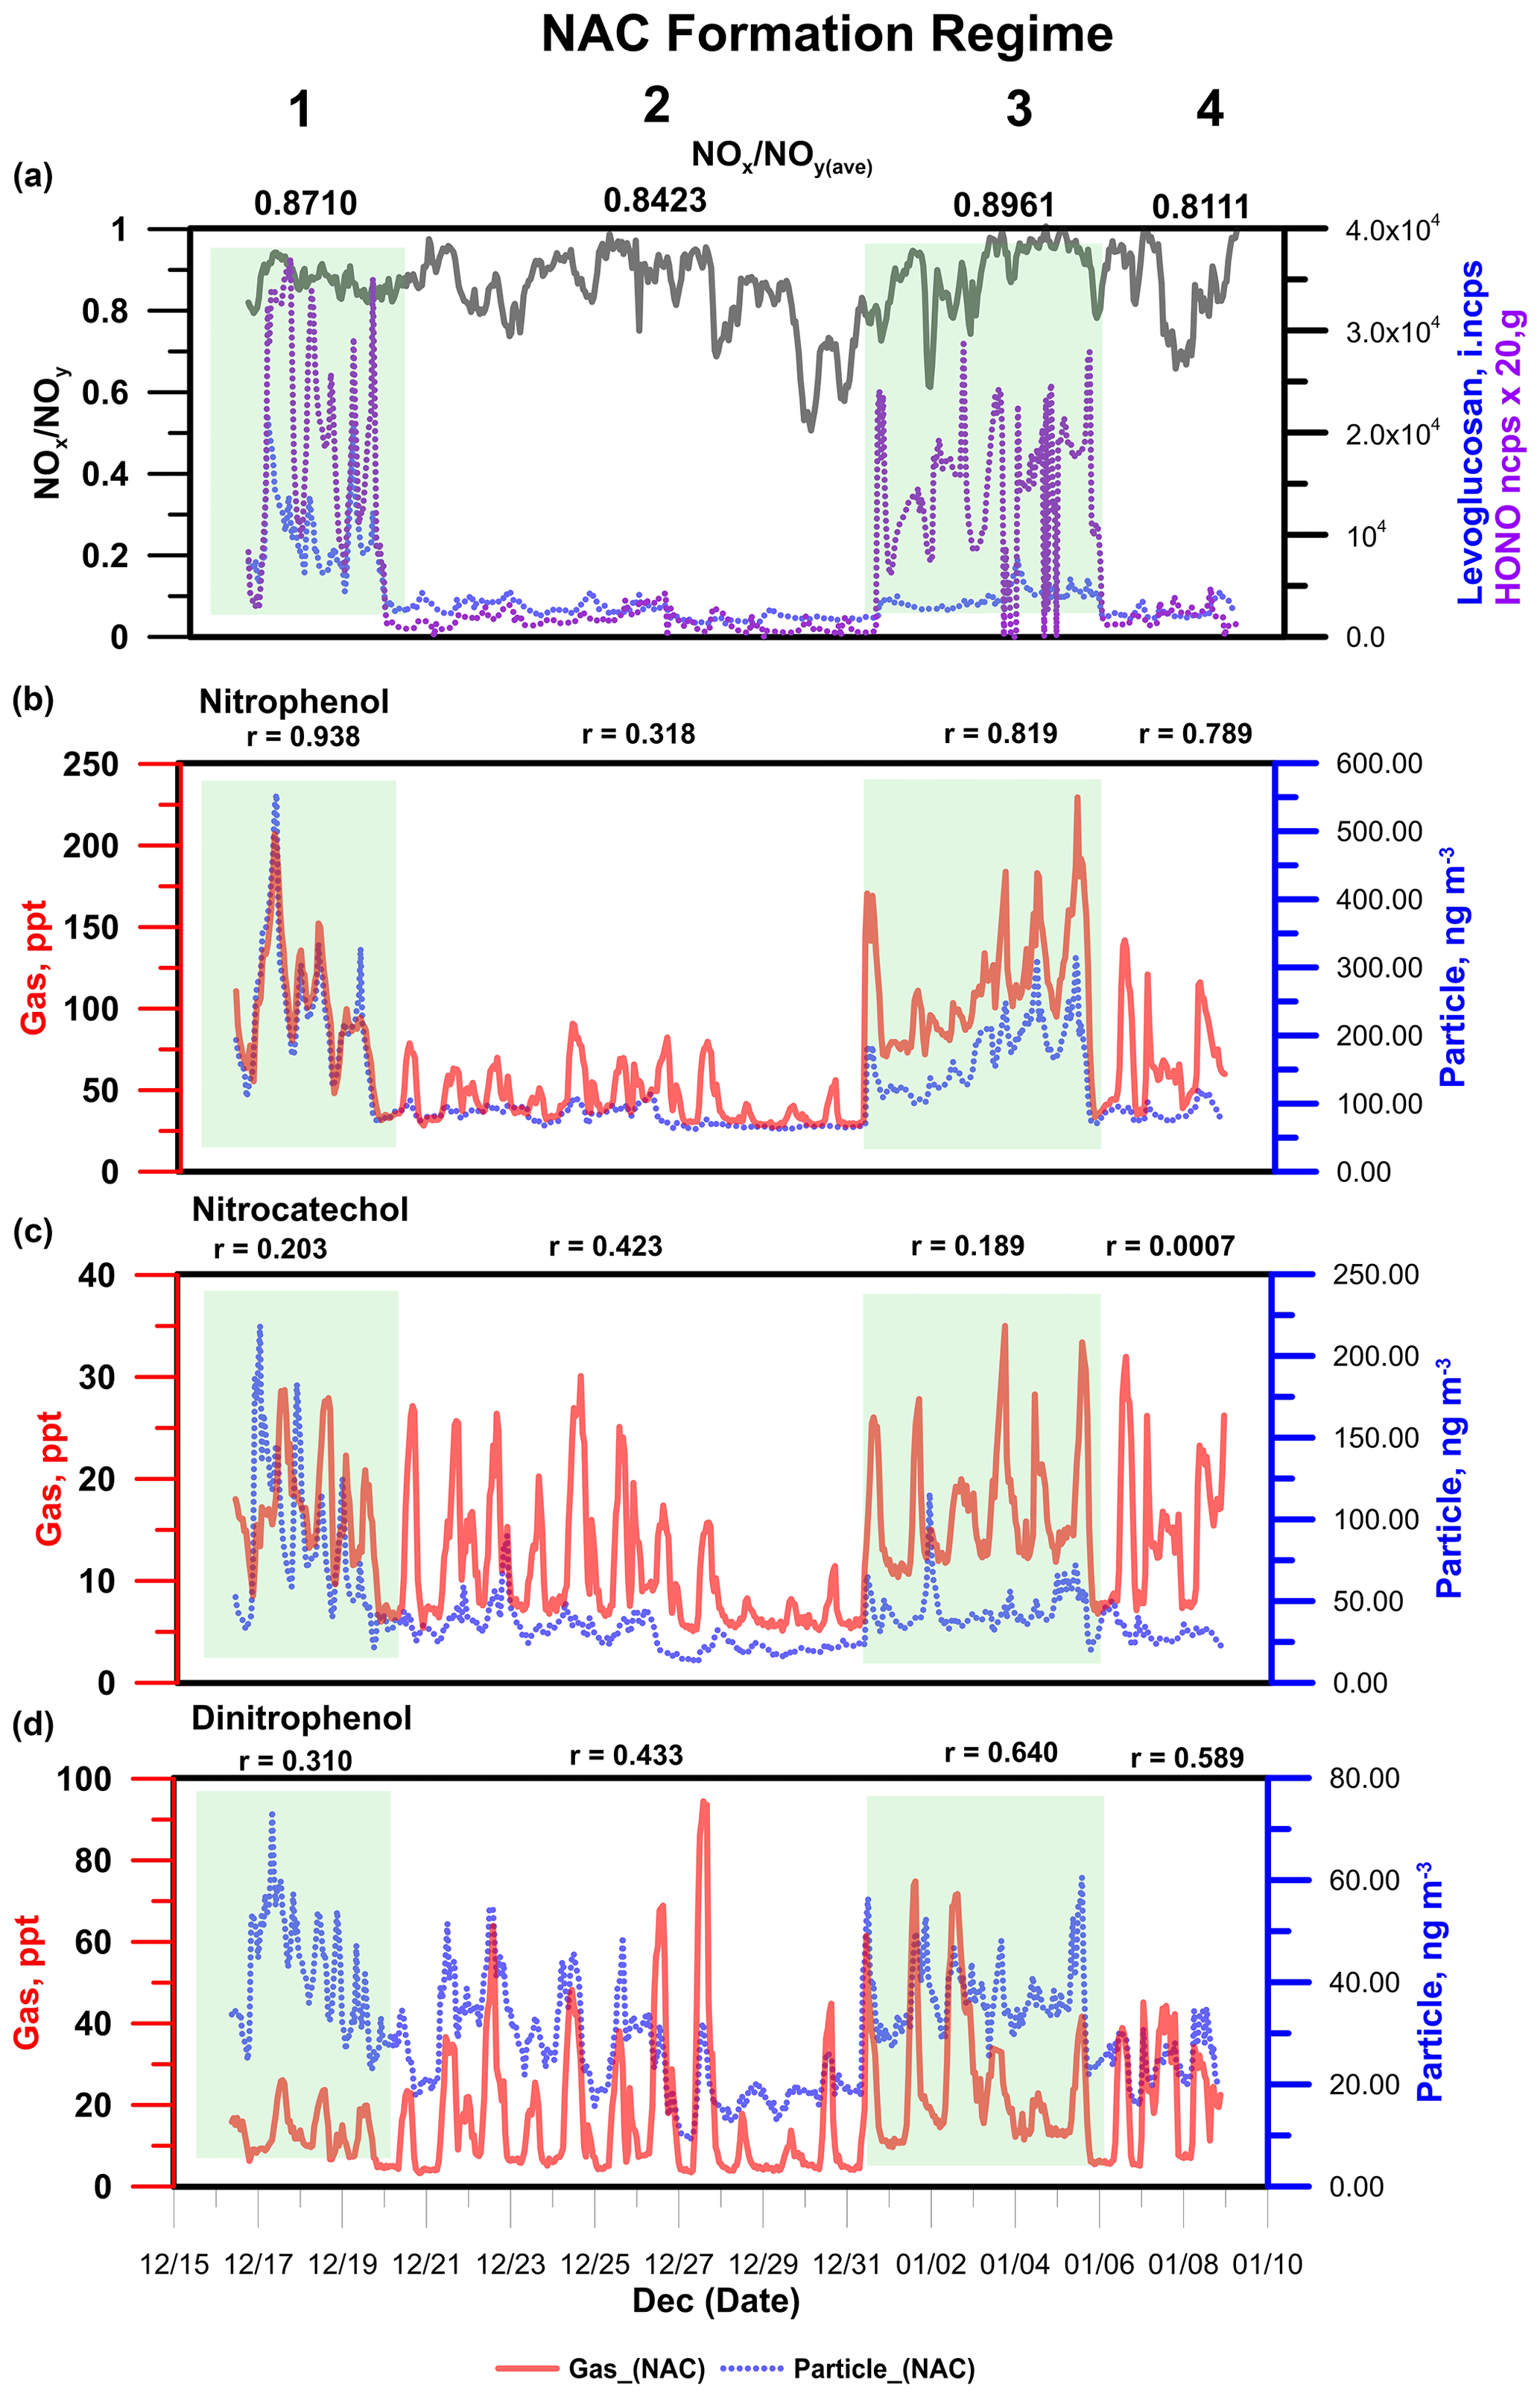
Figure 4(a) Time series of particle-phase concentrations of levoglucosan, gas-phase concentrations of HONO, and ratios of NOx to NOy as markers of BB episodes during field measurements. (b, c, d) Mixing ratios of nitrophenol, nitrocatechol, and dinitrophenol under regimes corresponding to BB episodes and non-BB episodes. The coefficient of correlation (r) reflects the agreement between the gas- and particle-phase concentrations.
3.4 Secondary formation of gas-phase NACs
Under regime 2, concentrations of BB markers fell dramatically, indicating that the influence of primary biomass emissions was limited (as shown in Fig. 4). Here, the diurnal profiles of gas-phase NACs (as shown in Fig. 5) exhibit increases in concentration at 14:00–15:00 LT and a minor night-time peak at 20:00 LT. Similarly, in contrast to the events during regime 1, the peak in particle-phase NAC concentrations occurred also in the afternoon at 14:00–15:00 LT. These peaks in the daily mixing ratios NACs coincided with the daily peak ozone concentration. Secondary photochemical formation was therefore probably the dominant NAC formation process under regimes 2 and 4. This conclusion is supported by the fact that the coefficient of determination (r2) between ozone and nitrophenol (see Fig. 5) under regime 2 (r2=0.7) is substantially higher than that for the full data set including BB regimes 1 and 3 (r2=0.1). The most pronounced reductions in r2 were observed for compounds expected to originate mainly from primary sources (e.g. NP); for compounds expected to be formed mainly via secondary production (e.g. NC and DNP), the r2 with ozone remained relatively high throughout the campaign (see Fig. 5).
Secondary production of NACs can be linked to the presence of specific precursor compounds (Harrison et al., 2005a). Figure 6 shows the correlations between levels of NP, NC, and DNP and those of their proposed precursors – phenol (C6H6O), catechol/dihydroxybenzene (C6H6O2), and NP. Phenol and catechol are primarily formed by the pyrolysis of lignins and can be precursors for secondary formation of NACs, particularly during BB events (Yee et al., 2013; Finewax et al., 2018; Gaston et al., 2016). Levels of NACs correlated strongly (r2=0.7–0.8) with those of their primary precursors (i.e. phenol and catechol). This indicates that nitration of these precursor phenolic compounds in the presence of OH or NO3 radicals was an important route of NP and NC formation. The figure showing the correlation between precursors and final products also shows the observed ozone mixing ratio, which is a measure of secondary photochemical activity. This further underscores the significance of photochemical oxidation in the formation of NC and NP from catechol and phenol. A similar relationship was observed for the secondary formation of DNP via further oxidation of nitrophenol. DNP is formed by the reaction of nitrophenol with OH or NO3 radicals to form nitrophenoxy radicals (NO2C6H5O•), whose subsequent nitration yields DNP (Yuan et al., 2016).
As shown in Fig. 4, the ratio of NOx to NOy, which is an indicator of plume freshness, was lower under regime 2 than regime 1, suggesting that an older plume was sampled in the former case. This aged plume may have contained residual traces of regional photochemical smog containing phenol, catechol, and their derivatives that were formed as primary emissions during BB events outside the studied region.
The yield of NACs produced by secondary formation is known to depend on the NO2 concentration (Wang et al., 2018, 2019; Yuan et al., 2016). For instance, NP is formed by the nitration of phenoxy radicals (C6H5O•), which are themselves formed by the OH∕NO3-mediated oxidation of phenol (Berndt and Böge, 2003). Mechanistically, the formation of NACs such as NP should be heavily dependent on the atmospheric concentration of NO2. However, NACs such as NP and nitrosalicylic acid were formed consistently in a mountainous region of China, even when the NO2 concentration was below 5 ppb (Wang et al., 2018). The campaign NO2 average for this work in Dezhou was 23 ppb, with daytime and night-time means of 17 and 26 ppb, respectively. These mixing ratios may have been high enough to sustain the nitration of aromatic VOCs. However, a negative correlation was observed between NO2 and NACs in the gas () and particle phases () under regime 2, when secondary formation was the dominant source of NACs. In aged air masses such as those sampled during regime 2, NOx will be transformed into nitrated compounds (and HNO3), which may explain this negative correlation.
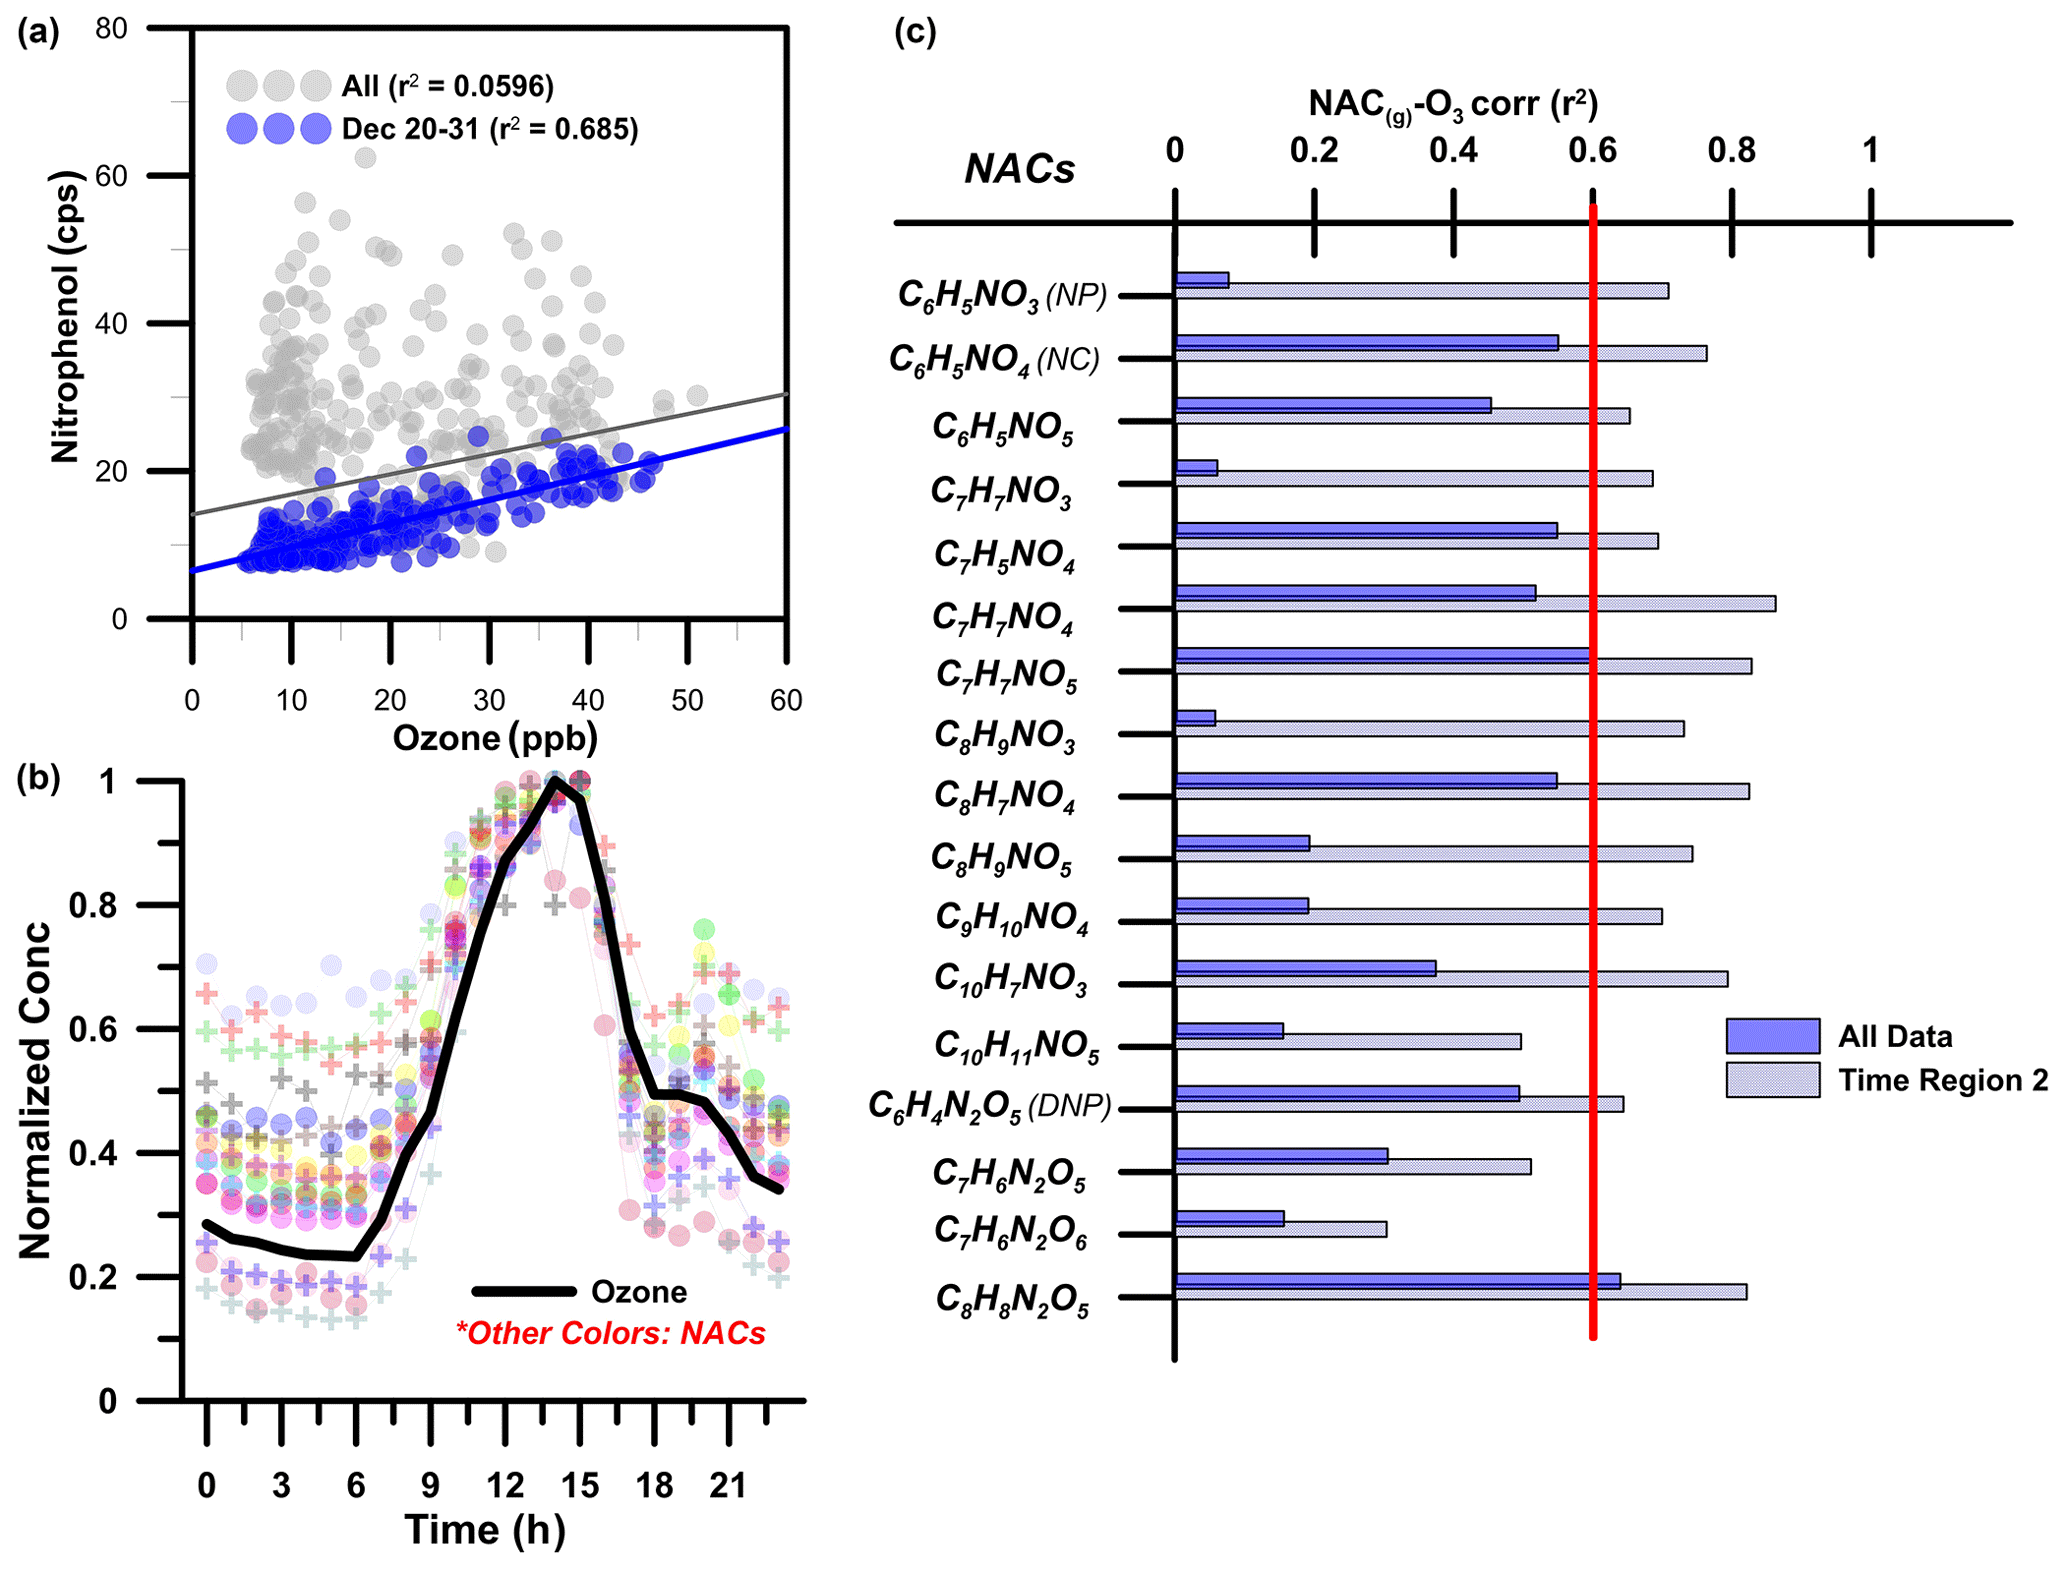
Figure 5(a) Correlation between levels of nitrophenol and ozone (O3). (b) Normalized diurnal profiles of gas-phase NACs and ozone under the second NAC formation regime observed during the field campaign. (c) Coefficients of determination (r2) between gas-phase NACs and O3 for the whole data set and for regime 2 only.

Figure 63D scatter plots showing the variation of the concentrations of NP, NC, and DNP with the concentrations of their precursors, together with the corresponding ozone mixing ratios.
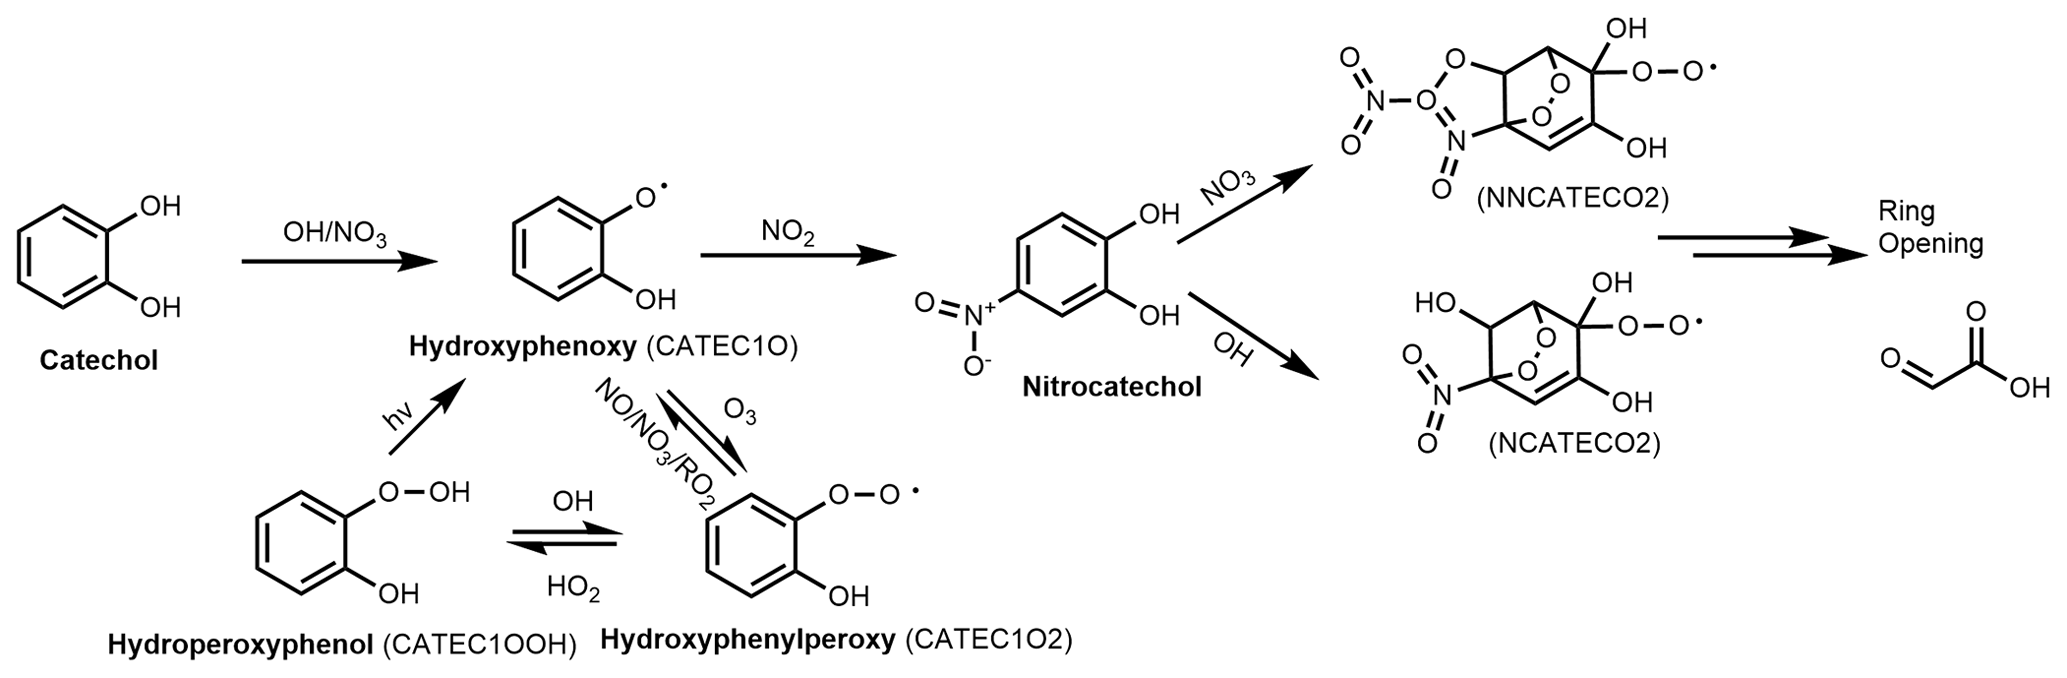
Figure 7Schematic depiction of the atmospheric formation and loss of nitrocatechol in the gas phase based on the reaction pathways included in the Master Chemical Mechanism (MCMv3.3.1). Species names used in the MCM are given in parentheses.
3.5 Analysis of NAC production and loss pathways
To further investigate the secondary production of NAC during the experimental campaign, box-model simulations were performed to model NC formation and loss using the AtChem tool and atmospheric oxidation chemistry models from MCMv3.3.1. Figure 7 shows the reaction pathway for the formation of NC by catechol oxidation initiated by OH or NO3 radicals. Unlike in the case of NP, only one precursor – catechol – can generate the intermediates (i.e. CATEC1O, CATEC1O2, and CATEC1OOH) in NC formation. Sinks of NC are its further oxidation by NO3 or OH radicals, which lead to stable ring-opening products such as 2-oxoacetic acid. Photolysis and deposition/dilution of NC were also accounted for in the simulation because of their reported importance in the gas-phase atmospheric loss of formic acid and NP (Yuan et al., 2015, 2016). The photolysis frequency of NC used in the simulations was based on the reported value for NP (1.4 % of the photolysis frequency of NO2). A sensitivity analysis (see Supplement) of the box model against variation of the effective physical loss rates (due to dispersion and deposition) indicated that a high loss rate (1 h) provided the best estimate of the observed NC mixing ratios. Physical loss terms with equivalent lifetimes above 1 h (e.g. 3 h) overestimated the measured NC concentrations by at least 50 %. As a result, the tail of the modelled daytime peak extended well into the night when using low physical loss rates. The loss rate used in this work was higher than the rates used in previous box-model analyses of formic acid and NP (Yuan et al., 2015, 2016) but is reasonable given the low vapour pressure of NC ( Pa) (Finewax et al., 2018), which favours partitioning into the condensed phase.
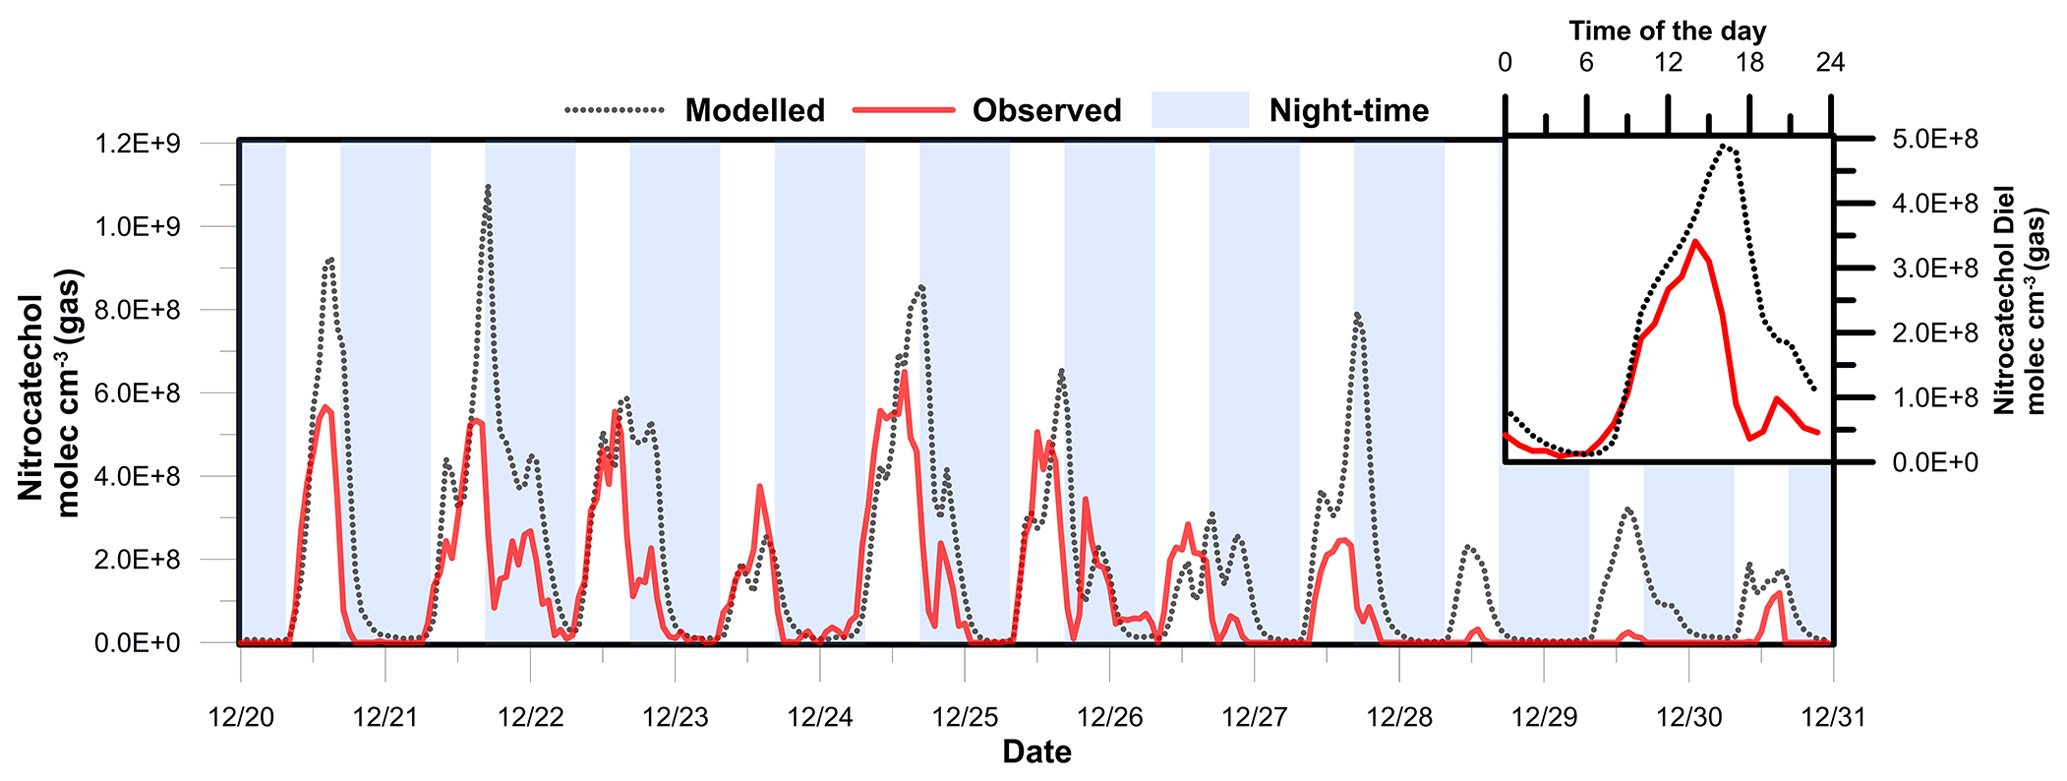
Figure 8Modelled and observed nitrocatechol concentration time series. The inset shows the diurnal profile of the observed and modelled nitrocatechol concentrations.
Figure 8 shows time series of the observed and modelled mixing ratios of nitrocatechol under regime 2. The simulated mixing ratio profile agrees reasonably well with the experimental data, as indicated by the mean ratio of the modelled concentration to the observed concentration (Model∕Obsavg=1.25) and the coefficient of determination (r2=0.51) between the two data sets. These results clearly show the explicit dependence of the secondary formation of NACs such as nitrocatechol on the oxidation of thermal degradation and pyrolysis products of lignins (e.g. catechol) in aged plumes. The modelling procedure overestimated the observed concentration from 27 to 31 December, which was attributed to the elevated mass aerosol mass concentration and increased RH which would favour the partitioning of the gas-phase NACs to the particle phase and a potential loss by condensed-phase processes/deposition. Additionally, the presence of the simulated daytime peak confirms that the rate of daytime production of NC (source) exceeded its rate of photolysis (sink) during the second period of the field campaign. If the daytime loss rate of NC due to photolysis is disregarded, the mixing ratio will only increase by 10 %, clearly showing the weak contribution of photolysis to the overall loss of NC. The primary pathways of NC loss were thus oxidation by OH radicals and night-time oxidation by NO3 radicals.
Figure 8 also shows the diurnal profiles of the modelled and observed NC concentrations. The modelled profile features prominent peaks at 10:00 (shoulder), 16:00, and 20:00 local time, but the experimentally observed afternoon peak in NC levels occurred around 14:00 LT. This discrepancy can be explained by the change of wind direction from north-west to north-east observed after 14:00 LT. It should be noted that the parametrization of AtChem does not account for meteorological effects and that it only partially accounts for dispersion via the effective physical loss rate parameter. The three daily maxima were attributed to the contributions of different sources of the intermediate hydroxyphenoxy radicals (CATEC1O) throughout the day. As shown in Fig. 7, the nitration of CATEC1O radicals is the only source of NC, so the production of hydroxyphenoxy radicals will dictate the overall rate of NC formation under excess NOx conditions. Figure 9 shows the relative contributions of the three major CATEC1O formation pathways. Note that CATEC1O can also be produced through photolysis of hydroperoxylphenol (CATEC1OOH) and the reaction of hydroxyphenylperoxy (CATEC1O2) with NO3 and RO2 radicals, as shown in Fig. 7. However, these pathways account for less than 0.05 % of the total CATEC1O production and were therefore disregarded. The daytime shoulder peak of NC at 10:00 was due to OH radical oxidation of catechol and accordingly coincides with the diurnal peak in the OH concentration (∼ 4.5×10⁶ molec cm−3). The major formation pathways of OH radicals in Dezhou during wintertime were HONO photolysis and the reaction of HO2 with NO, causing measured OH production to peak in the afternoon rather than at midday, as is more common. Ozone photolysis, which is typically a major source of OH radicals, made a negligible contribution under the studied wintertime conditions. The simulated diurnal profiles of major oxidants are presented in the Supplement. Additionally, the box model indicated that the high levels of CATEC1O at 13:00 were predominantly due to the reaction of NO with hydroxyphenylperoxy radicals (∼ 50 %). Finally, the elevated levels of NC at 20:00 were primarily attributed to the very efficient (∼ 90 % conversion) NO3 night-time chemistry after sunset (16:30).
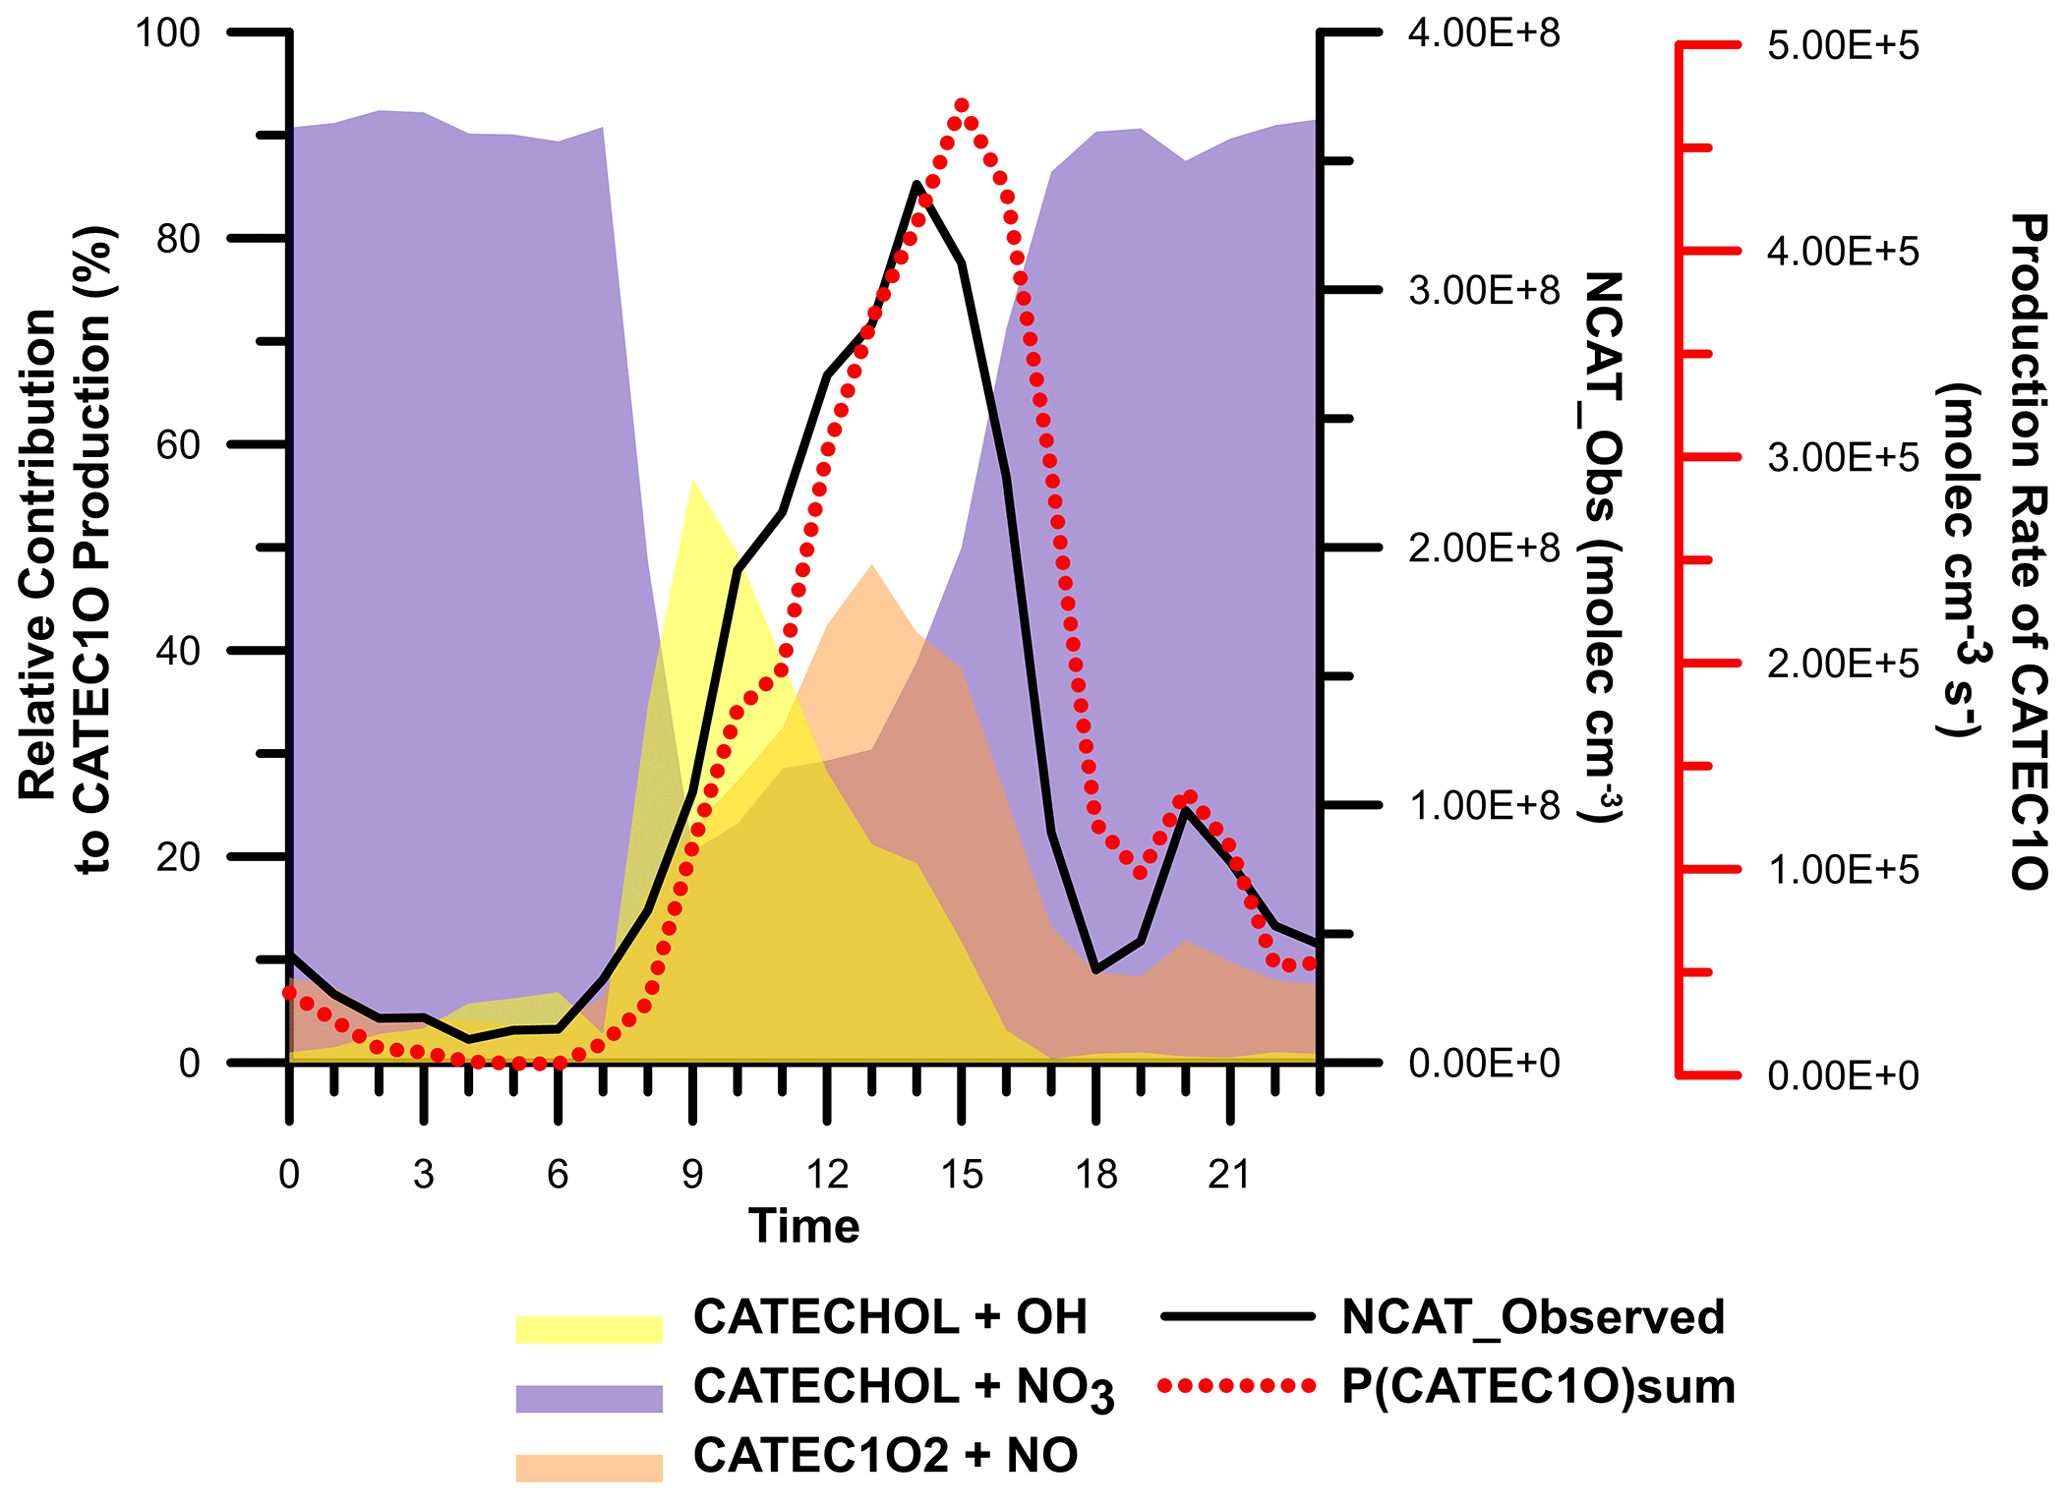
Figure 9Diurnal variation in the relative contribution of the hydroxyphenoxy (CATEC1O) pathway to overall nitrocatechol formation. Also shown are the observed concentrations of nitrocatechol and the summed rates of CATEC1O production.
3.6 Classification and quantification of sources of nitro-aromatic compounds
The general sources of NACs have been explored in previous works (Wang et al., 2017, 2019). The 16 NACs found in Dezhou were further categorized based on their main formation routes: primary BB and secondary formation. As noted above, secondary processes were dominant under regime 2, whereas both routes contributed under regime 1. The NACs detected under regime 1 were further classified based on the correlation between their gas-phase and condensed-phase concentrations. A strong correlation between the gas and particle phase (rg∕p) was taken to indicate either that primary BB was the dominant source of the NAC in question or that it underwent rapid partitioning between phases. Five NACs exhibited rg∕p values above 0.75 and thus behaved like NP. The gas- and particle-phase concentrations fell by at least 55 % and 85 % when the major source of NACs shifted from primary BB under regime 1 to secondary formation under regime 2. However, these five compounds were also formed under regime 2, suggesting that secondary formation does contribute to their presence. To assess the impact of each formation pathway under regime 1, two approaches were used. In the first approach, it was assumed that the degree of secondary formation was similar under regimes 1 and 2, which is reasonable based on the average ozone levels under each regime (O3 avg=20 ppb). Both regimes had similar total gas and particle-phase concentrations of DNP, a product only formed by secondary oxidation, further supporting the validity of this assumption. This first approach was referred to as the DNP method based on the similar DNP profiles observed under regimes 1 and 2. By subtracting the concentrations of the five BB compounds under regime 2 from those under regime 1, it was determined that primary BB combustion processes accounted for 70 % of the observed concentrations of these compounds. The second approach used to estimate the contribution of primary BB to the measured NAC concentrations involved using levoglucosan as a primary source tracer. This approach is analogous to the widely used EC (elemental carbon) tracer approach, in which EC is used to distinguish the primary organic carbon (POC) fraction from secondary organic carbon (SOC) in total organic carbon (OC) measurements (Day et al., 2015; Cabada et al., 2004). The high time resolution levoglucosan (lev.) measurements were performed using the same instrument and conditions as the NAC measurements, so they provided good data coverage, making lev. a suitable tracer for primary BB. The relative contributions of primary emission (BB) and secondary (sec) formation for each NAC were estimated using the following expression:
Table 1Classification of the detected nitro-aromatic compounds based on their major formation pathways.
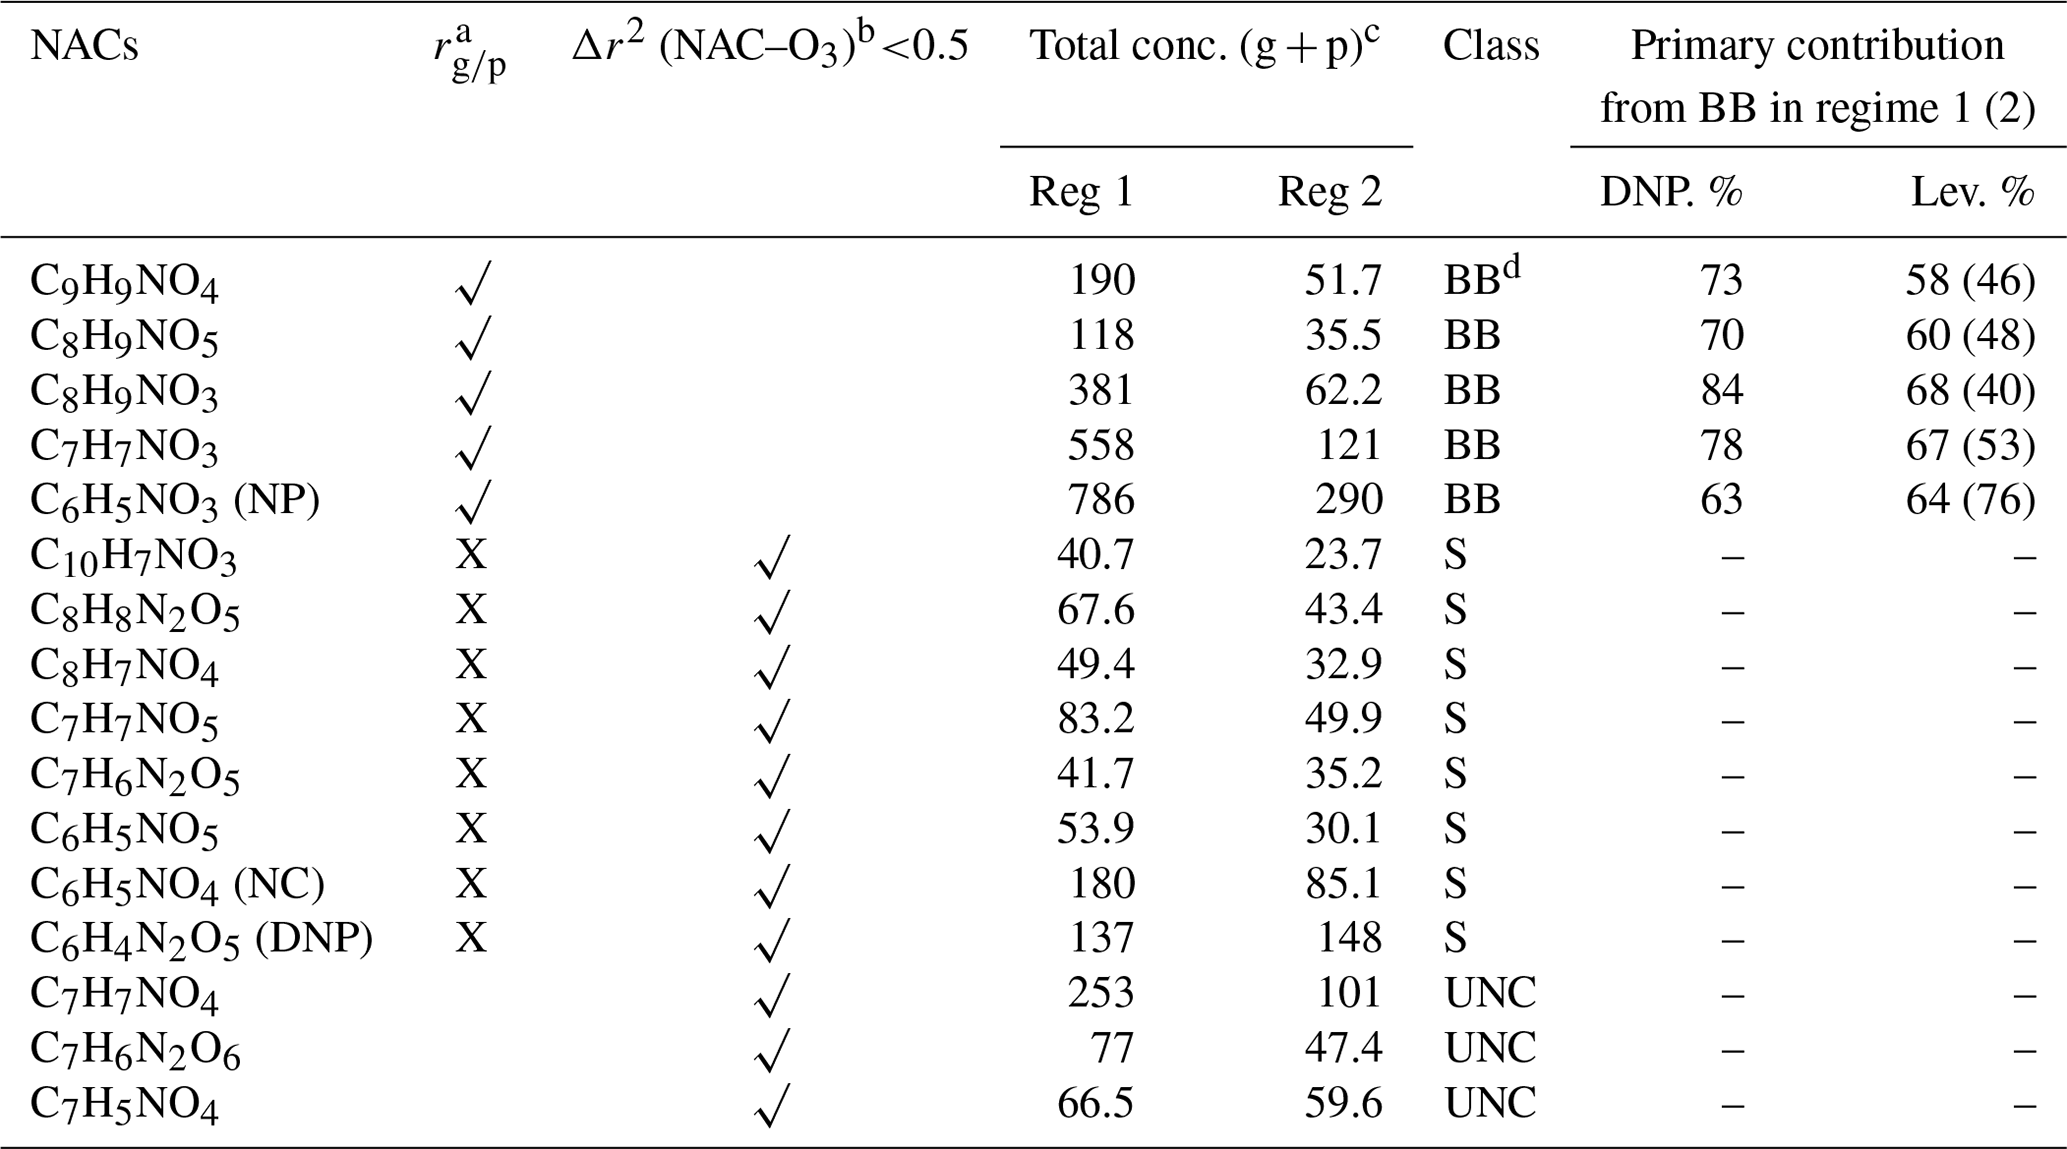
a rg∕p is the correlation coefficient between the gas and particle phases under regime 1 (√>0.75; X <0.5). b Δr2 (NAC–O3) is the difference between the correlation of determination between NAC and ozone under regime 2 and that for the complete data set. c g is gas, and p is particle. d BB is biomass burning, S is secondary formation, and UNC is unclassified. DNP is the dinitrophenol method, and lev. is the levoglucosan tracer method. Values in parentheses are for regime 2.
Here, ([NAC] ∕ [lev.])BB is the ratio of the concentration of the NAC to that of lev. during strong primary combustion emission, and NACBB and NACsec are the fractions of NACs generated through biomass burning and secondary production, respectively. NACTot and lev. are the measured concentrations of NACs and levoglucosan in ambient measurements, respectively. Using this approach, primary BB combustion processes were found to account for 60 % of the total production of BB-related compounds under regime 1, in good agreement with the estimate obtained using the DNP method.
The secondary compounds were categorized as such based on the weak correlations between their gas- and condensed-phase concentrations (rg∕p<0.5) under regime 1 and their association with ozone (Δr2 (NAC–O3)), which is indicative of formation via secondary chemistry. For NACs mainly formed via secondary oxidation (e.g. nitrocatechol), the coefficient of determination (r2) between ozone and NACs under regime 2 was similar to that for the full data set. This suggests that the formation pathways of these compounds did not change over the measurement period, regardless of the occurrence of combustion episodes. Table 1 shows the classifications of 13 of the 16 NACs examined in this work, including their total concentrations under regimes 1 and 2. The classifications were further supported by the correlations between the concentrations of the 16 NACs (Fig. 10), which clearly divide the NACs into different groups based on their behaviour in the gas phase under regime 1. The data in Table 1 were used to estimate the relative contributions of primary and secondary processes under the two regimes (Fig. 10), revealing that the relative abundance of NACs associated with secondary formation processes increased to 40 % in both the gas and particle phases under regime 2.
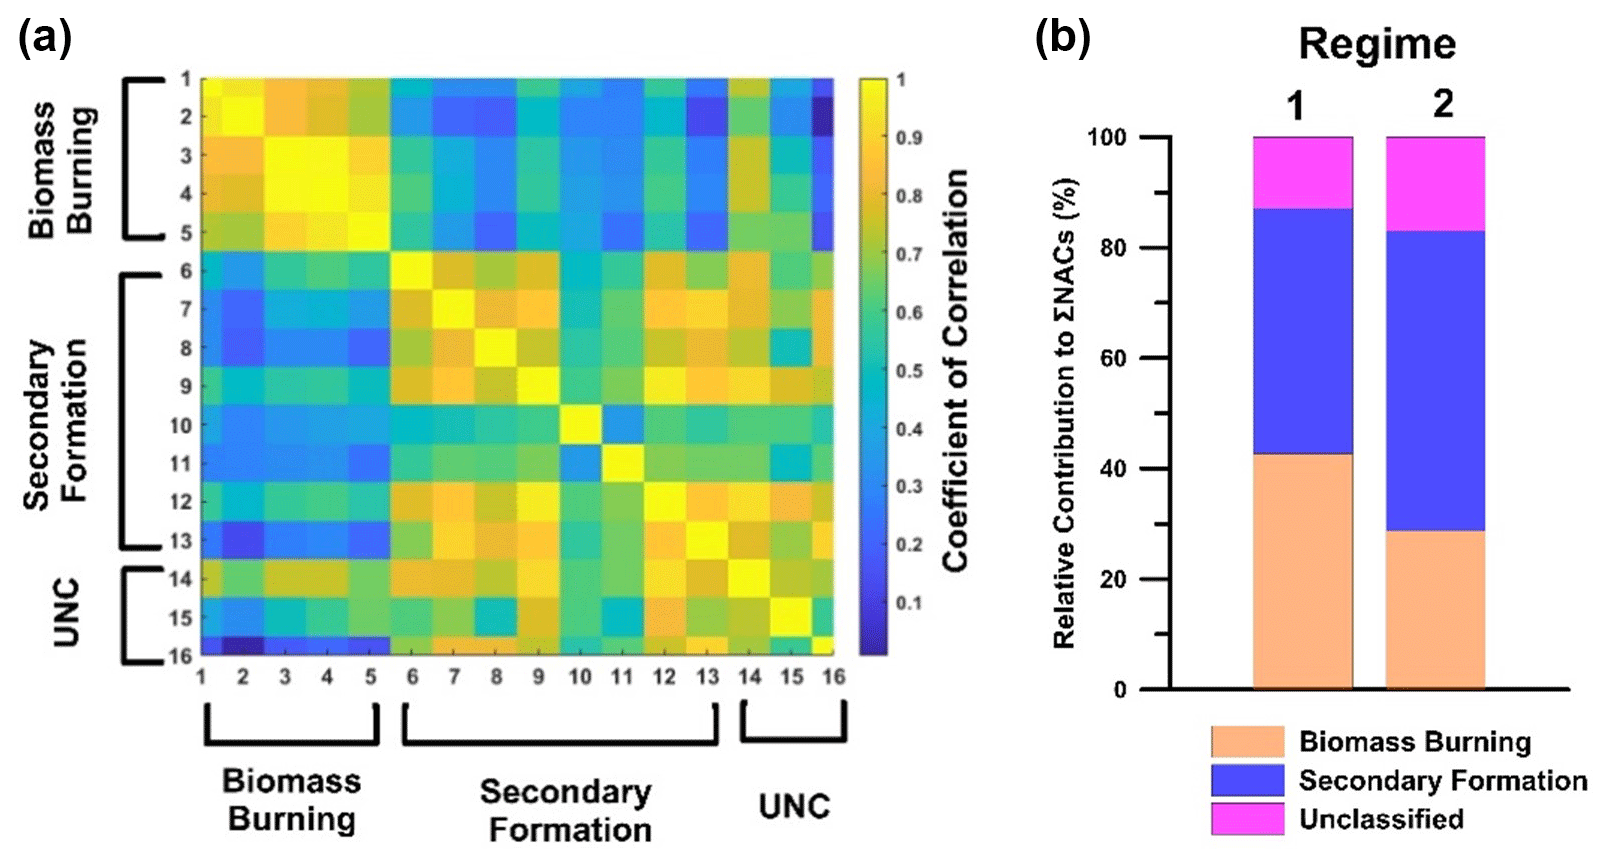
Figure 10(a) Correlation matrix for gas-phase NACs under regime 1. (b) Relative contributions of the identified NAC classes under regimes 1 and 2.
High concentrations of 16 NACs were observed during an aerosol measurement campaign using a FIGAERO–ToF-CIMS at a rural site in China during wintertime where biomass burning is predominant. The mean overall NAC concentration during the measurement period was 2020 ng m−3, with nitrophenol and its analogues accounting for around half of this total. NACs accounted for 1.8 % and 1.1 % of the total mass of airborne organic matter and total PM, respectively. These results can be compared to measurements performed downwind of London (Mohr et al., 2013), where the mean ratio of the mass of NACs to that of OM (the ΣNACs ∕ OM ratio) was only about 0.5 %. The very high contribution of NACs in Dezhou can be attributed to the extensive use of biofuels such as wood and straw for cooking and heating among the rural population of China, particularly during the cold season (Chen et al., 2017). Surveys of the studied area during the field campaign accordingly revealed heavy use of wood fuels when cooking, which coincided with strong peaks in the measured levels of nitro-aromatic compounds and organic matter.
The measured levels of NACs in the gas and particle phases revealed that on average, 16 % of the formed NACs were present in the particle phase (Fp). The gas-phase levels of some NACs correlated strongly with their particle-phase concentrations, suggesting rapid gas to particle partitioning of primary emissions. Conversely, some typical secondary products exhibited weaker correlations between the two phases, presumably due to the contribution of strong gas-phase sources.
The measurement campaign was divided into four different periods associated with different NAC formation regimes; in some periods, primary BB was the dominant source of atmospheric NACs, while in other periods secondary formation processes played a greater role. The contributions of other sources such as traffic and aqueous-phase processes were found to be negligible. The mixing ratios of NP and its derivatives increased markedly under regimes coinciding with primary BB events, indicating that these combustion processes contribute strongly to the formation of nitrophenolic compounds. The concentrations of gas and particle-phase NACs decreased by 40 % and 60 % on average (max: 80 % and 88 %) upon shifting from a regime dominated by primary emission to one dominated by secondary formation, clearly indicating that the contributions of fresh biomass burning events to NAC formation significantly outweigh those of secondary formation processes.
During periods with low concentrations of biomass burning indicators such as levoglucosan, the diurnal profiles of gas-phase NACs clearly mirrored those of the atmospheric ozone concentration. This was attributed to dominant NAC formation via regional secondary chemistry (photochemical smog). Under these conditions, the concentrations of precursors such as catechol and phenol correlated strongly with those of the corresponding secondarily produced NACs (e.g. NC and NP). Secondary formation was scrutinized using box-model simulations of NC formation and loss to link the observed results to specific chemical mechanisms. The three peaks in the experimentally observed diurnal NC concentration profiles were attributed to variation in the production of the hydroxyphenoxy radical intermediate over the course of the day. The daytime increase in NAC levels observed in this work was higher than in previous studies, possibly because of a high production rate relative to the rate of primary loss via OH-mediated oxidation, which in turn was considerably higher than the rate of loss via photolysis (which accounted for only 10 % of the observed loss).
The individual NACs identified here were classified and quantified based on the trends in their gas- and condensed-phase mixing ratios. Five of the 16 NACs, mainly the NP analogues, were classified as typical primary products of BB, while 8 were classified as originating mainly from secondary production. However, it was clear that secondary formation processes also contributed appreciably to the observed concentrations of the five primary BB compounds. These contributions were estimated using two approaches – the dinitrophenol (DNP) and levoglucosan tracer methods. Both methods indicated that primary combustion processes accounted for at least 60 % of the total production of the five NACs classified as primary BB products during the regime dominated by primary BB. However, the contribution of secondary processes was clearly significant, which may explain the high observed levels of other secondary compounds. This suggests that photochemical smog plays a significant role in NAC formation, even during wintertime air pollution events in rural China that are dominated by primary emissions. This is consistent with the evident contribution of secondary formation in high PM episodes in North China, where oxidation of other oxidation anthropogenic tracers, such as SO2, plays an important role during severe haze events (An et al., 2019; Huang et al., 2019).
Continuous and concurrent measurement of NACs in the gas and particle phases with high time resolution has enabled us to understand the formation of compounds that induce radiative forcing in the atmosphere by absorbing near-UV and visible light. The finding that primary emission and secondary formation were the dominant NAC-forming processes during the measurement period highlights the dominant contribution of combustion of vegetation and indoor fuels to the warming effect of brown carbon in the atmosphere. Additionally, the NAC production and loss pathways identified in this work provide insight into the climate impact of brown carbons, which partially depends on the lifetime of their light-absorbing components (Hems and Abbatt, 2018). Some oxygenated VOCs emitted during BB (e.g. catechol) were shown to have extended atmospheric lifespans, allowing them to persist beyond the combustion events in which they were formed and serve as precursors for secondary formation of NACs, further exacerbating the warming effects of BB episodes. In this work, NACs were found to comprise less than 2 % of the sampled aerosol by mass, so one might expect their overall impact to be minimal. However, heavy pollution episodes (PMmass>100 µg m−3) such as those caused by biomass burning during wintertime may increase the formation of NACs that can induce climate forcing and pose health hazards. There is thus a need for further research on the mechanisms of oxidation of these anthropogenic aromatic compounds under different scenarios, potentially building on the classification and quantification of NACs presented in this work, to better understand their global budgets and roles in climate forcing.
The data used in this publication are available to the community, and they can be accessed by request to the corresponding authors.
The supplement related to this article is available online at: https://doi.org/10.5194/acp-21-1389-2021-supplement.
MaH, MiH, and SG were the project leaders for this measurement campaign. CMS, MLB, RT, and HW operated the CIMS. CMS, LL, MP, and ET performed the calibration procedures and modelling/simulation experiments. WZ, LZ, and YY supported with the analysis of other inorganic and organic pollutants. CMS and MaH wrote the paper. All authors commented on the paper and were involved in the scientific interpretation and discussion.
The authors declare that they have no conflict of interest.
This article is part of the special issue “Multiphase chemistry of secondary aerosol formation under severe haze”. It is not associated with a conference.
The work was done under the framework of the research programme “Photochemical Smog in China”, financed by the Swedish Research Council (2013-6917). In addition, the National Natural Science Foundation of China (21677002, 41977179), the National Key Research and Development Programme of China (2016YFC0202003), and the Swedish Research Council (2018-04430) are acknowledged for financial support.
This research has been supported by the Vetenskapsrådet (grant nos. 2018-04430 and 2013-06917), the National Natural Science Foundation of China (grant nos. 41977179 and 21677002), and the National Key Research and Development Programme of China (grant no. 2016YFC0202003).
The article processing charges for this open-access
publication were covered by the Gothenburg University Library.
This paper was edited by Daniel Knopf and reviewed by two anonymous referees.
Agency for Toxic Substances and Disease Registry: https://www.atsdr.cdc.gov/phs/phs.asp?id=878&tid=172 (last access: 27 January 2021), 2015.
An, Z., Huang, R.-J., Zhang, R., Tie, X., Li, G., Cao, J., Zhou, W., Shi, Z., Han, Y., Gu, Z., and Ji, Y.: Severe haze in northern China: A synergy of anthropogenic emissions and atmospheric processes, P. Natl. Acad. Sci. USA, 116, 8657–8666, https://doi.org/10.1073/pnas.1900125116, 2019.
Batterman, S. A., Peng, C. Y., and Braun, J.: Levels and composition of volatile organic compounds on commuting routes in Detroit, Michigan, Atmos. Environ., 36, 6015–6030, https://doi.org/10.1016/s1352-2310(02)00770-7, 2002.
Berndt, T. and Böge, O.: Gas-phase reaction of OH radicals with phenol, Phys. Chem. Chem. Phys., 5, 342–350, https://doi.org/10.1039/B208187C, 2003.
Cabada, J. C., Pandis, S. N., Subramanian, R., Robinson, A. L., Polidori, A., and Turpin, B.: Estimating the Secondary Organic Aerosol Contribution to PM2.5 Using the EC Tracer Method Special Issue of Aerosol Science and Technology on Findings from the Fine Particulate Matter Supersites Program, Aerosol Sci. Tech., 38, 140–155, https://doi.org/10.1080/02786820390229084, 2004.
Cecinato, A., Di Palo, V., Pomata, D., Tomasi Scianò, M. C., and Possanzini, M.: Measurement of phase-distributed nitrophenols in Rome ambient air, Chemosphere, 59, 679–683, https://doi.org/10.1016/j.chemosphere.2004.10.045, 2005.
Chen, J., Li, C., Ristovski, Z., Milic, A., Gu, Y., Islam, M. S., Wang, S., Hao, J., Zhang, H., He, C., Guo, H., Fu, H., Miljevic, B., Morawska, L., Thai, P., Lam, Y. F., Pereira, G., Ding, A., Huang, X., and Dumka, U. C.: A review of biomass burning: Emissions and impacts on air quality, health and climate in China, Sci. Total Environ., 579, 1000–1034, https://doi.org/10.1016/j.scitotenv.2016.11.025, 2017.
Chow, K. S., Huang, X. H. H., and Yu, J. Z.: Quantification of nitroaromatic compounds in atmospheric fine particulate matter in Hong Kong over 3 years: field measurement evidence for secondary formation derived from biomass burning emissions, Environ. Chem., 13, 665-673, https://doi.org/10.1071/EN15174, 2016.
Day, M. C., Zhang, M., and Pandis, S. N.: Evaluation of the ability of the EC tracer method to estimate secondary organic carbon, Atmos. Environ., 112, 317–325, https://doi.org/10.1016/j.atmosenv.2015.04.044, 2015.
DeCarlo, P. F., Kimmel, J. R., Trimborn, A., Northway, M. J., Jayne, J. T., Aiken, A. C., Gonin, M., Fuhrer, K., Horvath, T., Docherty, K. S., Worsnop, D. R., and Jimenez, J. L.: Field-Deployable, High-Resolution, Time-of-Flight Aerosol Mass Spectrometer, Anal. Chem., 78, 8281–8289, https://doi.org/10.1021/ac061249n, 2006.
Delhomme, O., Morville, S., and Millet, M.: Seasonal and diurnal variations of atmospheric concentrations of phenols and nitrophenols measured in the Strasbourg area, France, Atmos. Pollut. Res., 1, 16–22, https://doi.org/10.5094/APR.2010.003, 2010.
Desyaterik, Y., Sun, Y., Shen, X., Lee, T., Wang, X., Wang, T., and Collett Jr., J. L.: Speciation of “brown” carbon in cloud water impacted by agricultural biomass burning in eastern China, J. Geophys. Res.-Atmos., 118, 7389–7399, https://doi.org/10.1002/jgrd.50561, 2013.
Finewax, Z., de Gouw, J. A., and Ziemann, P. J.: Identification and Quantification of 4-Nitrocatechol Formed from OH and NO3 Radical-Initiated Reactions of Catechol in Air in the Presence of NOx: Implications for Secondary Organic Aerosol Formation from Biomass Burning, Environ. Sci. Tech., 52, 1981–1989, https://doi.org/10.1021/acs.est.7b05864, 2018.
Gao, R., Jiang, W., Gao, W., and Sun, S.: Emission inventory of crop residue open burning and its high-resolution spatial distribution in 2014 for Shandong province, China, Atmos. Pollut. Res., 8, 545–554, https://doi.org/10.1016/j.apr.2016.12.009, 2017.
Gaston, C. J., Lopez-Hilfiker, F. D., Whybrew, L. E., Hadley, O., McNair, F., Gao, H., Jaffe, D. A., and Thornton, J. A.: Online molecular characterization of fine particulate matter in Port Angeles, WA: Evidence for a major impact from residential wood smoke, Atmos. Environ., 138, 99–107, https://doi.org/10.1016/j.atmosenv.2016.05.013, 2016.
Geng, F. H., Tie, X. X., Xu, J. M., Zhou, G. Q., Peng, L., Gao, W., Tang, X., and Zhao, C. S.: Characterizations of ozone, NOx, and VOCs measured in Shanghai, China, Atmos. Environ., 42, 6873–6883, https://doi.org/10.1016/j.atmosenv.2008.05.045, 2008.
Hallquist, M., Munthe, J., Hu, M., Wang, T., Chan, C. K., Gao, J., Boman, J., Guo, S., Hallquist, A. M., Mellqvist, J., Moldanova, J., Pathak, R. K., Pettersson, J. B. C., Pleijel, H., Simpson, D., and Thynell, M.: Photochemical smog in China: scientific challenges and implications for air-quality policies, Natl. Sci. Rev., 3, 401–403, https://doi.org/10.1093/nsr/nww080, 2016.
Hanson, R. L., Henderson, T. R., Hobbs, C. H., Clark, C. R., Carpenter, R. L., Dutcher, J. S., Harvey, T. M., and Hunt, D. F.: Detection of nitroaromatic compounds on coal combustion particles, J. Tox. Env. Health, 11, 971–980, https://doi.org/10.1080/15287398309530400, 1983.
Harrison, M. A. J., Barra, S., Borghesi, D., Vione, D., Arsene, C., and Iulian Olariu, R.: Nitrated phenols in the atmosphere: a review, Atmos. Environ., 39, 231–248, https://doi.org/10.1016/j.atmosenv.2004.09.044, 2005a.
Harrison, M. A. J., Heal, M. R., and Cape, J. N.: Evaluation of the pathways of tropospheric nitrophenol formation from benzene and phenol using a multiphase model, Atmos. Chem. Phys., 5, 1679–1695, https://doi.org/10.5194/acp-5-1679-2005, 2005b.
Hems, R. F. and Abbatt, J. P. D.: Aqueous Phase Photo-oxidation of Brown Carbon Nitrophenols: Reaction Kinetics, Mechanism, and Evolution of Light Absorption, ACS Earth Space Chem., 2, 225–234, https://doi.org/10.1021/acsearthspacechem.7b00123, 2018.
Hoffmann, D., Iinuma, Y., and Herrmann, H.: Development of a method for fast analysis of phenolic molecular markers in biomass burning particles using high performance liquid chromatography/atmospheric pressure chemical ionisation mass spectrometry, J. Chromatogr. A, 1143, 168–175, https://doi.org/10.1016/j.chroma.2007.01.035, 2007.
Huang, R.-J., Wang, Y., Cao, J., Lin, C., Duan, J., Chen, Q., Li, Y., Gu, Y., Yan, J., Xu, W., Fröhlich, R., Canonaco, F., Bozzetti, C., Ovadnevaite, J., Ceburnis, D., Canagaratna, M. R., Jayne, J., Worsnop, D. R., El-Haddad, I., Prévôt, A. S. H., and O'Dowd, C. D.: Primary emissions versus secondary formation of fine particulate matter in the most polluted city (Shijiazhuang) in North China, Atmos. Chem. Phys., 19, 2283–2298, https://doi.org/10.5194/acp-19-2283-2019, 2019.
Iinuma, Y., Böge, O., Gräfe, R., and Herrmann, H.: Methyl-Nitrocatechols: Atmospheric Tracer Compounds for Biomass Burning Secondary Organic Aerosols, Environ. Sci. Tech., 44, 8453–8459, https://doi.org/10.1021/es102938a, 2010.
Inomata, S., Yamada, H., and Tanimoto, H.: Investigation on VOC Emissions from Automobile Sources by Means of Online Mass Spectrometry, Current Pollut. Rep., 2, 188–199, https://doi.org/10.1007/s40726-016-0032-6, 2016.
Jenkin, M. E., Saunders, S. M., Wagner, V., and Pilling, M. J.: Protocol for the development of the Master Chemical Mechanism, MCM v3 (Part B): tropospheric degradation of aromatic volatile organic compounds, Atmos. Chem. Phys., 3, 181–193, https://doi.org/10.5194/acp-3-181-2003, 2003.
Kahnt, A., Behrouzi, S., Vermeylen, R., Safi Shalamzari, M., Vercauteren, J., Roekens, E., Claeys, M., and Maenhaut, W.: One-year study of nitro-organic compounds and their relation to wood burning in PM10 aerosol from a rural site in Belgium, Atmos. Environ., 81, 561–568, https://doi.org/10.1016/j.atmosenv.2013.09.041, 2013.
Kitanovski, Z., Grgić, I., Vermeylen, R., Claeys, M., and Maenhaut, W.: Liquid chromatography tandem mass spectrometry method for characterization of monoaromatic nitro-compounds in atmospheric particulate matter, J. Chromatogr. A, 1268, 35–43, https://doi.org/10.1016/j.chroma.2012.10.021, 2012a.
Kitanovski, Z., Grgić, I., Yasmeen, F., Claeys, M., and Čusak, A.: Development of a liquid chromatographic method based on ultraviolet–visible and electrospray ionization mass spectrometric detection for the identification of nitrocatechols and related tracers in biomass burning atmospheric organic aerosol, Rapid Commun. Mass Sp., 26, 793–804, https://doi.org/10.1002/rcm.6170, 2012b.
Kroflič, A., Grilc, M., and Grgić, I.: Does toxicity of aromatic pollutants increase under remote atmospheric conditions?, Sci. Rep.-UK, 5, 8859, https://doi.org/10.1038/srep08859, 2015.
Laskin, A., Laskin, J., and Nizkorodov, S. A.: Chemistry of Atmospheric Brown Carbon, Chem. Rev., 115, 4335–4382, https://doi.org/10.1021/cr5006167, 2015.
Le Breton, M., Wang, Y., Hallquist, Å. M., Pathak, R. K., Zheng, J., Yang, Y., Shang, D., Glasius, M., Bannan, T. J., Liu, Q., Chan, C. K., Percival, C. J., Zhu, W., Lou, S., Topping, D., Wang, Y., Yu, J., Lu, K., Guo, S., Hu, M., and Hallquist, M.: Online gas- and particle-phase measurements of organosulfates, organosulfonates and nitrooxy organosulfates in Beijing utilizing a FIGAERO ToF-CIMS, Atmos. Chem. Phys., 18, 10355–10371, https://doi.org/10.5194/acp-18-10355-2018, 2018.
Le Breton, M., Psichoudaki, M., Hallquist, M., Watne, Å. K., Lutz, A., and Hallquist, Å. M.: Application of a FIGAERO ToF CIMS for on-line characterization of real-world fresh and aged particle emissions from buses, Aerosol Sci. Tech., 53, 244–259, https://doi.org/10.1080/02786826.2019.1566592, 2019.
Lee, B. H., Lopez-Hilfiker, F. D., Mohr, C., Kurtén, T., Worsnop, D. R., and Thornton, J. A.: An Iodide-Adduct High-Resolution Time-of-Flight Chemical-Ionization Mass Spectrometer: Application to Atmospheric Inorganic and Organic Compounds, Environ. Sci. Tech., 48, 6309–6317, https://doi.org/10.1021/es500362a, 2014.
Lin, P., Aiona, P. K., Li, Y., Shiraiwa, M., Laskin, J., Nizkorodov, S. A., and Laskin, A.: Molecular Characterization of Brown Carbon in Biomass Burning Aerosol Particles, Environ. Sci. Tech., 50, 11815–11824, https://doi.org/10.1021/acs.est.6b03024, 2016.
Lin, P., Bluvshtein, N., Rudich, Y., Nizkorodov, S. A., Laskin, J., and Laskin, A.: Molecular Chemistry of Atmospheric Brown Carbon Inferred from a Nationwide Biomass Burning Event, Environ. Sci. Tech., 51, 11561–11570, https://doi.org/10.1021/acs.est.7b02276, 2017.
Lopez-Hilfiker, F. D., Mohr, C., Ehn, M., Rubach, F., Kleist, E., Wildt, J., Mentel, Th. F., Lutz, A., Hallquist, M., Worsnop, D., and Thornton, J. A.: A novel method for online analysis of gas and particle composition: description and evaluation of a Filter Inlet for Gases and AEROsols (FIGAERO), Atmos. Meas. Tech., 7, 983–1001, https://doi.org/10.5194/amt-7-983-2014, 2014.
Lüttke, J., Scheer, V., Levsen, K., Wünsch, G., Neil Cape, J., Hargreaves, K. J., Storeton-West, R. L., Acker, K., Wieprecht, W., and Jones, B.: Occurrence and formation of nitrated phenols in and out of cloud, Atmos. Environ., 31, 2637–2648, https://doi.org/10.1016/S1352-2310(96)00229-4, 1997.
Mohr, C., Lopez-Hilfiker, F. D., Zotter, P., Prévôt, A. S. H., Xu, L., Ng, N. L., Herndon, S. C., Williams, L. R., Franklin, J. P., Zahniser, M. S., Worsnop, D. R., Knighton, W. B., Aiken, A. C., Gorkowski, K. J., Dubey, M. K., Allan, J. D., and Thornton, J. A.: Contribution of Nitrated Phenols to Wood Burning Brown Carbon Light Absorption in Detling, United Kingdom during Winter Time, Environ. Sci. Tech., 47, 6316-6324, https://doi.org/10.1021/es400683v, 2013.
Nie, W., Ding, A. J., Xie, Y. N., Xu, Z., Mao, H., Kerminen, V.-M., Zheng, L. F., Qi, X. M., Huang, X., Yang, X.-Q., Sun, J. N., Herrmann, E., Petäjä, T., Kulmala, M., and Fu, C. B.: Influence of biomass burning plumes on HONO chemistry in eastern China, Atmos. Chem. Phys., 15, 1147–1159, https://doi.org/10.5194/acp-15-1147-2015, 2015.
Perrone, M. G., Carbone, C., Faedo, D., Ferrero, L., Maggioni, A., Sangiorgi, G., and Bolzacchini, E.: Exhaust emissions of polycyclic aromatic hydrocarbons, n-alkanes and phenols from vehicles coming within different European classes, Atmos. Enviro., 82, 391–400, https://doi.org/10.1016/j.atmosenv.2013.10.040, 2014.
Saunders, S. M., Jenkin, M. E., Derwent, R. G., and Pilling, M. J.: Protocol for the development of the Master Chemical Mechanism, MCM v3 (Part A): tropospheric degradation of non-aromatic volatile organic compounds, Atmos. Chem. Phys., 3, 161–180, https://doi.org/10.5194/acp-3-161-2003, 2003.
Simoneit, B. R. T., Schauer, J. J., Nolte, C. G., Oros, D. R., Elias, V. O., Fraser, M. P., Rogge, W. F., and Cass, G. R.: Levoglucosan, a tracer for cellulose in biomass burning and atmospheric particles, Atmos. Environ., 33, 173–182, https://doi.org/10.1016/S1352-2310(98)00145-9, 1999.
Sommariva, R., Cox, S., Martin, C., Borońska, K., Young, J., Jimack, P. K., Pilling, M. J., Matthaios, V. N., Nelson, B. S., Newland, M. J., Panagi, M., Bloss, W. J., Monks, P. S., and Rickard, A. R.: AtChem (version 1), an open-source box model for the Master Chemical Mechanism, Geosci. Model Dev., 13, 169–183, https://doi.org/10.5194/gmd-13-169-2020, 2020.
Tan, Z., Lu, K., Jiang, M., Su, R., Wang, H., Lou, S., Fu, Q., Zhai, C., Tan, Q., Yue, D., Chen, D., Wang, Z., Xie, S., Zeng, L., and Zhang, Y.: Daytime atmospheric oxidation capacity in four Chinese megacities during the photochemically polluted season: a case study based on box model simulation, Atmos. Chem. Phys., 19, 3493–3513, https://doi.org/10.5194/acp-19-3493-2019, 2019.
Teich, M., van Pinxteren, D., Wang, M., Kecorius, S., Wang, Z., Müller, T., Močnik, G., and Herrmann, H.: Contributions of nitrated aromatic compounds to the light absorption of water-soluble and particulate brown carbon in different atmospheric environments in Germany and China, Atmos. Chem. Phys., 17, 1653–1672, https://doi.org/10.5194/acp-17-1653-2017, 2017.
Tremp, J., Mattrel, P., Fingler, S., and Giger, W.: Phenols and nitrophenols as tropospheric pollutants: Emissions from automobile exhausts and phase transfer in the atmosphere, Water Air Soil Pollut., 68, 113-123, https://doi.org/10.1007/bf00479396, 1993.
Vidovic, K., Kroflic, A., Sala, M., and Grgic, I.: Aqueous-Phase Brown Carbon Formation from Aromatic Precursors under Sunlight Conditions, Atmosphere-Basel, 11, 15, https://doi.org/10.3390/atmos11020131, 2020.
Vidović, K., Lašič Jurković, D., Šala, M., Kroflič, A., and Grgić, I.: Nighttime Aqueous-Phase Formation of Nitrocatechols in the Atmospheric Condensed Phase, Environ. Sci. Tech., 52, 9722–9730, https://doi.org/10.1021/acs.est.8b01161, 2018.
Vione, D., Maurino, V., Minero, C., and Pelizzetti, E.: Aqueous Atmospheric Chemistry: Formation of 2,4-Dinitrophenol upon Nitration of 2-Nitrophenol and 4-Nitrophenol in Solution, Environ. Sci. Tech., 39, 7921–7931, https://doi.org/10.1021/es050824m, 2005.
Wang, L., Wang, X., Gu, R., Wang, H., Yao, L., Wen, L., Zhu, F., Wang, W., Xue, L., Yang, L., Lu, K., Chen, J., Wang, T., Zhang, Y., and Wang, W.: Observations of fine particulate nitrated phenols in four sites in northern China: concentrations, source apportionment, and secondary formation, Atmos. Chem. Phys., 18, 4349–4359, https://doi.org/10.5194/acp-18-4349-2018, 2018.
Wang, X., Gu, R., Wang, L., Xu, W., Zhang, Y., Chen, B., Li, W., Xue, L., Chen, J., and Wang, W.: Emissions of fine particulate nitrated phenols from the burning of five common types of biomass, Environ. Pollut., 230, 405–412, https://doi.org/10.1016/j.envpol.2017.06.072, 2017.
Wang, Y., Hu, M., Wang, Y., Zheng, J., Shang, D., Yang, Y., Liu, Y., Li, X., Tang, R., Zhu, W., Du, Z., Wu, Y., Guo, S., Wu, Z., Lou, S., Hallquist, M., and Yu, J. Z.: The formation of nitro-aromatic compounds under high NOx and anthropogenic VOC conditions in urban Beijing, China, Atmos. Chem. Phys., 19, 7649–7665, https://doi.org/10.5194/acp-19-7649-2019, 2019.
Xie, M., Chen, X., Hays, M. D., Lewandowski, M., Offenberg, J., Kleindienst, T. E., and Holder, A. L.: Light Absorption of Secondary Organic Aerosol: Composition and Contribution of Nitroaromatic Compounds, Environ. Sci. Tech., 51, 11607–11616, https://doi.org/10.1021/acs.est.7b03263, 2017.
Xie, M., Chen, X., Hays, M. D., and Holder, A. L.: Composition and light absorption of N-containing aromatic compounds in organic aerosols from laboratory biomass burning, Atmos. Chem. Phys., 19, 2899–2915, https://doi.org/10.5194/acp-19-2899-2019, 2019.
Yee, L. D., Kautzman, K. E., Loza, C. L., Schilling, K. A., Coggon, M. M., Chhabra, P. S., Chan, M. N., Chan, A. W. H., Hersey, S. P., Crounse, J. D., Wennberg, P. O., Flagan, R. C., and Seinfeld, J. H.: Secondary organic aerosol formation from biomass burning intermediates: phenol and methoxyphenols, Atmos. Chem. Phys., 13, 8019–8043, https://doi.org/10.5194/acp-13-8019-2013, 2013.
Yuan, B., Veres, P. R., Warneke, C., Roberts, J. M., Gilman, J. B., Koss, A., Edwards, P. M., Graus, M., Kuster, W. C., Li, S.-M., Wild, R. J., Brown, S. S., Dubé, W. P., Lerner, B. M., Williams, E. J., Johnson, J. E., Quinn, P. K., Bates, T. S., Lefer, B., Hayes, P. L., Jimenez, J. L., Weber, R. J., Zamora, R., Ervens, B., Millet, D. B., Rappenglück, B., and de Gouw, J. A.: Investigation of secondary formation of formic acid: urban environment vs. oil and gas producing region, Atmos. Chem. Phys., 15, 1975–1993, https://doi.org/10.5194/acp-15-1975-2015, 2015.
Yuan, B., Liggio, J., Wentzell, J., Li, S.-M., Stark, H., Roberts, J. M., Gilman, J., Lerner, B., Warneke, C., Li, R., Leithead, A., Osthoff, H. D., Wild, R., Brown, S. S., and de Gouw, J. A.: Secondary formation of nitrated phenols: insights from observations during the Uintah Basin Winter Ozone Study (UBWOS) 2014, Atmos. Chem. Phys., 16, 2139–2153, https://doi.org/10.5194/acp-16-2139-2016, 2016.
Zhang, Y.-N., Zhang, Z.-S., Chan, C.-Y., Engling, G., Sang, X.-F., Shi, S., and Wang, X.-M.: Levoglucosan and carbonaceous species in the background aerosol of coastal southeast China: case study on transport of biomass burning smoke from the Philippines, Environ. Sci. Pollut. Res., 19, 244–255, https://doi.org/10.1007/s11356-011-0548-7, 2012.
Zhang, Y., Forrister, H., Liu, J., Dibb, J., Anderson, B., Schwarz, J. P., Perring, A. E., Jimenez, J. L., Campuzano-Jost, P., Wang, Y., Nenes, A., and Weber, R. J.: Top-of-atmosphere radiative forcing affected by brown carbon in the upper troposphere, Nat. Geosci., 10, 486–489, https://doi.org/10.1038/ngeo2960, 2017.
Zhang, Y. L., Yang, W. Q., Simpson, I., Huang, X. Y., Yu, J. Z., Huang, Z. H., Wang, Z. Y., Zhang, Z., Liu, D., Huang, Z. Z., Wang, Y. J., Pei, C. L., Shao, M., Blake, D. R., Zheng, J. Y., Huang, Z. J., and Wang, X. M.: Decadal changes in emissions of volatile organic compounds (VOCs) from on-road vehicles with intensified automobile pollution control: Case study in a busy urban tunnel in south China, Environ. Pollut., 233, 806–819, https://doi.org/10.1016/j.envpol.2017.10.133, 2018.