the Creative Commons Attribution 4.0 License.
the Creative Commons Attribution 4.0 License.
 | 31 Aug 2021
Does the coupling of the semiannual oscillation with the quasi-biennial oscillation provide predictability of Antarctic sudden stratospheric warmings?
Viktoria J. Nordström
Annika Seppälä
During September 2019 a minor sudden stratospheric warming took place over the Southern Hemisphere (SH), bringing disruption to the usually stable winter vortex. The mesospheric winds reversed and temperatures in the stratosphere rose by over 50 K. Whilst sudden stratospheric warmings (SSWs) in the SH are rare, with the only major SSW having occurred in 2002, the Northern Hemisphere experiences about six per decade. Amplification of atmospheric waves during winter is thought to be one of the possible triggers for SSWs, although other mechanisms are also possible. Our understanding, however, remains incomplete, especially with regards to SSW occurrence in the SH. Here, we investigate the effect of two equatorial atmospheric modes, the quasi-biennial oscillation (QBO) at 10 hPa and the semiannual oscillation (SAO) at 1 hPa during the SH winters of 2019 and 2002. Using MERRA-2 reanalysis data we find that the easterly wind patterns resembling the two modes merge at low latitudes in the early winter, forming a zero-wind line that stretches from the lower stratosphere into the mesosphere. This influences the meridional wave guide, resulting in easterly momentum being deposited in the polar atmosphere throughout the polar winter, decelerating the westerly winds in the equatorward side of the polar vortex. As the winter progresses, the momentum deposition and wind anomalies descend further down into the stratosphere. We find similar behaviour in other years with early onset SH vortex weakening events. The magnitude of the SAO and the timing of the upper stratospheric (10 hPa) easterly QBO signal was found to be unique in these years when compared to the years with a similar QBO phase. We were able to identify the SSW and weak vortex years from the early winter location of the zero-wind line at 1 hPa together with Eliassen–Palm flux divergence in the upper stratosphere at 40–50∘ S. We propose that this early winter behaviour resulting in deceleration of the polar winds may precondition the southern atmosphere for a later enhanced wave forcing from the troposphere, resulting in an SSW or vortex weakening event. Thus, the early winter equatorial upper stratosphere–mesosphere, together with the polar upper atmosphere, may provide early clues to an imminent SH SSW.
- Article
(19239 KB) - Full-text XML
-
Supplement
(2300 KB) - BibTeX
- EndNote


During the austral winter of 2019, the Southern Hemisphere (SH) experienced a minor sudden stratospheric warming (SSW) (for a recent comprehensive review on SSWs see Baldwin et al., 2021, and references therein): Between 5 and 11 September, temperatures in the Antarctic stratosphere at 10 hPa warmed by 50 K (Yamazaki et al., 2020). Furthermore, the polar zonal-mean zonal winds reversed, and the easterly anomalies around 60∘ S at 10 hPa reached their peak around 18 September (Rao et al., 2020c). The drivers of this minor SSW have been attributed to enhanced stationary planetary wave activity (Yamazaki et al., 2020).
The impacts of SSWs can influence the atmosphere from the polar region to mid-latitudes for months (see e.g. Baldwin and Dunkerton, 2001). For example, SSWs contribute to the size of the ozone hole via two different mechanisms. First, the warming of the stratosphere suppresses the formation of polar stratospheric clouds (Shen et al., 2020), which play a critical part in stratospheric ozone depletion (Solomon, 1999). Furthermore, the weakening of the vortex allows the mixing of ozone rich mid-latitude air into the pole. These effects in combination lead to a smaller ozone hole (Solomon et al., 1986). The anomalous winds from SSWs can also influence stratosphere–troposphere coupling, impacting the Southern Annular Mode and Northern Annular Mode (SAM and NAM) (Taguchi and Hartmann, 2005; Shen et al., 2020; Baldwin et al., 2021; Rao et al., 2020a).
In 2019, the SSW's influence propagates down through the atmosphere for months following its occurrence. The minor SSW pushed the SAM into a negative phase (Rao et al., 2020c), signifying a shift of polar westerlies towards the Equator (Doddridge and Marshall, 2017). This movement of strong westerly winds is believed to have impacted the Australian wildfires, which began in the following November (Lim et al., 2019). Furthermore, the changes in polar temperatures and winds shrunk the ozone hole to its smallest size since its onset in 1980s (Eswaraiah et al., 2020a). Most of our understanding about SSWs comes from their occurrence in the Northern Hemisphere (NH), where they take place almost every other year (Charlton and Polvani, 2007). Due to the rarity of Southern Hemisphere (SH) SSW events (Rao et al., 2020c), the 2019 case provides a unique opportunity to investigate the atmospheric conditions leading up to SH SSWs.
SSWs in the Southern Hemisphere are infrequent. The most notable occurred in September 2002 (Allen et al., 2003), when the vortex shifted off the pole and eventually split into two. Later, one piece reformed into a weakened polar vortex (Ricaud et al., 2005). This impacted the ozone hole, which experienced 20 % less ozone loss compared to previous years (Hoppel et al., 2003). An earlier SSW has been reported to have occurred in August–September 1988 (Schoeberl et al., 1989; Kanzawa and Kawaguchi, 1990). While it is unclear if this even filled the World Meteorological Organization (WMO) criteria for major or minor (Charlton and Polvani, 2007) SSW, Thompson et al. (2005); Kwon et al. (2020) have found this event to be one of the larger early polar vortex weakening events.
In September 2019 a SSW occurred again. Within days, temperatures in the stratosphere increased by 50 K (Yamazaki et al., 2020). Whilst the 2002 SSW was classified as major, according to the WMO definition, the 2019 event was minor (Yamazaki et al., 2020). Due to their rarity, the causes of a SSW in the SH are not well understood. Eswaraiah et al. (2016, 2020a, b) have further reported a minor SH warming in September 2010. Whilst the 2019 and 2010 are both deemed minor, their dynamics were very different. The 2010 event included a reversal of the temperature gradient poleward of 60∘ S from 15 September, and the temperature increased by about 30 K at 80∘ S and 10 hPa (Eswaraiah et al., 2018). The zonal winds at 60∘ S at 10 hPa weakened by only 20–25 ms−1 (Eswaraiah et al., 2016). Hence, the dynamical situation in 2010 was unlike that in 2002 and 2019, as in the latter two years, rapid warmings and wind reversals occurred. Instead of the WMO criteria, Kwon et al. (2020) have for example identified southern stratospheric polar vortex weakening events, showing that these happen more frequently than SSW events and with an increasing occurrence frequency since the 2000s.
Numerous investigations have demonstrated that SSWs are the product of an interaction between planetary waves and the atmospheric mean flow (Matsuno, 1971). The NH has higher winter planetary wave activity and variability than the SH, thus leading to higher SSW occurrence in the NH. de la Cámara et al. (2019) have reported that about one-third of sudden stratospheric deceleration events (events similar to SSWs) are preceded by anomalous wave activity from the troposphere. In two-thirds of the events, the anomalous amplification of wave activity in the stratosphere that lead to the events did not originate from the troposphere but was likely linked to dynamics in the lower stratosphere and vortex geometry. As discussed by the recent comprehensive review of Baldwin et al. (2021, and references therein), the occurrence of SSW may be linked to various large-scale oscillation modes in the atmosphere, including the quasi-biennial oscillation (QBO, see e.g. Anstey and Shepherd, 2014), the semiannual oscillation (SAO), the El Niño–southern oscillation (ENSO; see, e.g. Domeisen et al., 2019b), the Madden–Julian oscillation (MJO; see, e.g. Wheeler and Hendon, 2004; Schwartz and Garfinkel, 2017), solar cycle, and extratropical blocking. Rao et al. (2019) also discuss these in detail and provide an analysis of how each provided favourable conditions in the case of the NH 2019 SSW. Here, we will focus on the QBO and SAO in the SH context and will not consider the others in detail.
The QBO is manifested in the reversal of zonal winds in the equatorial stratosphere. The eastward and westward winds alternate every 22–34 months, with an average period of 28 months (Baldwin et al., 2001). This oscillation dominates the variability of the equatorial stratosphere; however, its influence stretches to both poles (Baldwin et al., 2001). The phases of the QBO have been found to influence the polar vortex and occurrence of NH SSWs. Holton and Tan (1980) were the first to propose that the QBO at 40–50 hPa modulates the subtropical zero-wind line, which influences the propagation on waves in the stratosphere – a phenomenon known as the Holton–Tan effect (see Watson and Gray, 2014, and references therein). It was later discovered (concerning the NH) that the easterly QBO phase coincides with more SSWs (Richter et al., 2011). Other known nonlinear interactions with the QBO and SSW occurrence in the NH include those with the solar cycle (Labitzke, 2005) (for QBO at 45 hPa). Due to the scarcity of SH SSW events, similar relationships connecting the solar cycle, QBO, and SSW occurrence have not been identified.
The semiannual oscillation is an alternation of zonal winds in the equatorial mesosphere. These winds swap between westerly and easterly, with a complete cycle taking 6 months. These wind shears descend down from above the mesopause into the upper stratosphere (Kawatani et al., 2020). The SAO amplitude has two peaks: one near the stratopause (1 hPa) and another close to the mesopause (0.01 hPa) (Kawatani et al., 2020). Westerlies near the stratopause maximise close to the equinoxes, whilst the easterlies maximise near the solstices. The SAO maxima at 1 hPa exhibit a seasonal asymmetry, where the “first cycle”, which begins in December with the NH easterly phase, is stronger than the “second cycle”, which starts with the SH easterly, roughly in June (Garcia et al., 1997; Peña-Ortiz et al., 2010). This behaviour arises from differences in extratropical wave forcing, which is stronger in the NH winter (Garcia et al., 1997). The drivers of the SAO are not well understood. The prevailing theories suggest that the westerly accelerations, in March and September, are caused by kelvin and high-frequency gravity waves, whilst the easterlies maximise, during December and June, from advection of easterly momentum across the Equator, via the upper branch of the Brewer–Dobson circulation (Smith et al., 2020).
Recent work by Gray et al. (2020) noted the importance of the equatorial mesosphere and upper stratosphere on forecasting Northern Hemisphere SSWs. Their modelling study showed that SSWs were only reproduced realistically when the flow in the equatorial upper stratosphere was constrained, simulating the two atmospheric modes in this region, the SAO and the QBO. Similar results were previously presented by Pascoe et al. (2006). In a troposphere–stratosphere–mesosphere global circulation model with forced QBO and SAO like variability, the timing of the NH mid-winter warming advanced by about 1 month.
Whilst many studies have investigated the troposphere for answers to the questions raised by SSWs, we are here following suggestions that the upper atmosphere may be key to understand the drivers of SSWs. The works of Pascoe et al. (2006) and Gray et al. (2020) discussed above draw attention to the upper atmosphere in the formation of a SSW with a focus on the NH. In the present study, we analyse the behaviour of the QBO and SAO in the Southern Hemisphere during the winters of 2002 and 2019 and two additional weak vortex event years based on reanalysis data.
2.1 MERRA-2
The second Modern-Era Retrospective analysis for Research and Applications (MERRA Version 2, MERRA-2) is a National Aeronautics and Space Administration (NASA) atmospheric reanalysis product that begins in 1980 (Bosilovich et al., 2016). MERRA-2 has a horizontal resolution of 0.5∘ × 0.625∘ with 42 levels in the vertical from the surface to 0.01 hPa (Gelaro et al., 2017).
To investigate the connections between the SAO, QBO, and SSW we used the four-times-daily zonal wind, geopotential height and temperature information of MERRA-2, averaged into daily means. We focus on the vertical pressure range of 550 to 0.1 hPa and the austral winter (June–September). Our analysis focuses mainly on the years 2019 and 2002, when SSW events took place in the Southern Hemisphere.
2.2 Semiannual oscillation
Here, we focus our investigation on the easterly SAO maxima that occurs in the upper stratosphere close to 1 hPa. The SAO is locked into the seasonal cycle (Kawatani et al., 2020) and is known to have a period of 6 months, but it has appreciable inter-annual variability (Smith et al., 2020). Smith et al. (2017) report from multiyear satellite observations that the first easterly maxima, which occurs during the Northern Hemisphere winter, has climatological equatorial zonal-mean zonal winds between 20 and 30 m s−1 at 1 hPa, while the second maxima, occurring during the Southern Hemisphere winter, peak between 0 and 20 m s−1.
At 1 hPa MERRA-2 has been found to represent the easterly SAO in qualitative agreement with satellite-derived winds (Kawatani et al., 2020). However, MERRA-2 has westerly bias compared to other reanalysis data and observations above 20 hPa. For the months considered here (June–September), Kawatani et al. (2020) show that the interannual variability in MERRA-2 SAO is comparable to other reanalysis datasets, suggesting that for our analysis changes from year to year should be captured at a reasonable level.
For our analysis, will calculate the SAO equatorial wind amplitude at 1 hPa level by averaging over the equatorial latitudes 5∘ S–5∘ N from June to September. We will further estimate how far into the Southern Hemisphere the easterly wind pattern extends by finding the latitude where the zonal-mean zonal winds reverse.
2.3 Quasi-biennial Oscillation
Here, we focus on years with easterly QBO (eQBO) phase in the equatorial upper stratosphere zonal-mean zonal wind during June–July. Analogously to Rao et al. (2020c), we take the QBO phase at the 10 hPa pressure level, which Rao et al. (2020c) have shown to provide favourable conditions for SSW occurrence in the SH. QBO structure and dynamics in MERRA-2 reanalysis are discussed in detail by Coy et al. (2016), who conclude that MERRA-2 displays a realistic QBO behaviour. We verified this by contrasting the zonal winds to radiosonde measurements from Singapore and found the two to be consistent, as expected (Coy et al., 2016).
For this study, eQBO is taken to be present if the mean June–July 10 hPa equatorial (5∘ S–5∘ N) zonal-mean flow is easterly. The years fulfilling these conditions are 1980, 1983, 1985, 1988, 1990, 1993, 1995, 1997, 1999, 2002, 2004, 2006, 2008, 2011, 2014, 2017, and 2019. We will discuss magnitudes of the eQBO winds during the eQBO years in the following sections.
To contrast the SSW years of 2019 and 2002 to others with similar large-scale equatorial flow conditions, other years with equivalent, i.e. eQBO phase, conditions during the austral winter months were analysed as a reference. Additionally, for the reference dataset, we leave out the early onset date (August onset) weak vortex years of 1988 and 2017 (Kwon et al., 2020). Thus, the 13 reference eQBO years in the MERRA-2 period are 1980, 1983, 1985, 1990, 1993, 1995, 1997, 1999, 2004, 2006, 2008, 2011, and 2014.
All years were initially analysed separately to check for conditions similar to year 2002 and 2019. As noted above, the years 1988 and 2017 were considered separately from the reference dataset due to the early vortex weakening events. In 2017 the polar vortex was reported to have experienced a disruption due to enhanced planetary wave activity throughout winter (Klekociuk et al., 2020). This lead to a smaller than average spring ozone hole (Klekociuk et al., 2020). There have also been reports of a SSW occurrence in 1988 (Schoeberl et al., 1989; Kanzawa and Kawaguchi, 1990); however, Thompson et al. (2005); Kwon et al. (2020) find this year to instead correspond to a weak vortex rather than fulfilling SSW criteria.
2.4 Wave propagation
We use the quasi-geostrophic Eliassen–Palm flux (EP flux) to visualise wave propagation and momentum deposition (as indicated by the divergence of the EP flux). Stationary and transient wave components are not separated, instead we analyse the total contribution from both. The convergence (negative values) and divergence (positive values) of the EP flux correspond to deceleration and acceleration of zonal westerly winds, respectively. The EP flux results shown here were calculated from the MERRA-2 data according to Edmon et al. (1980), with additional scaling for display purposes as described by Bracegirdle (2011).
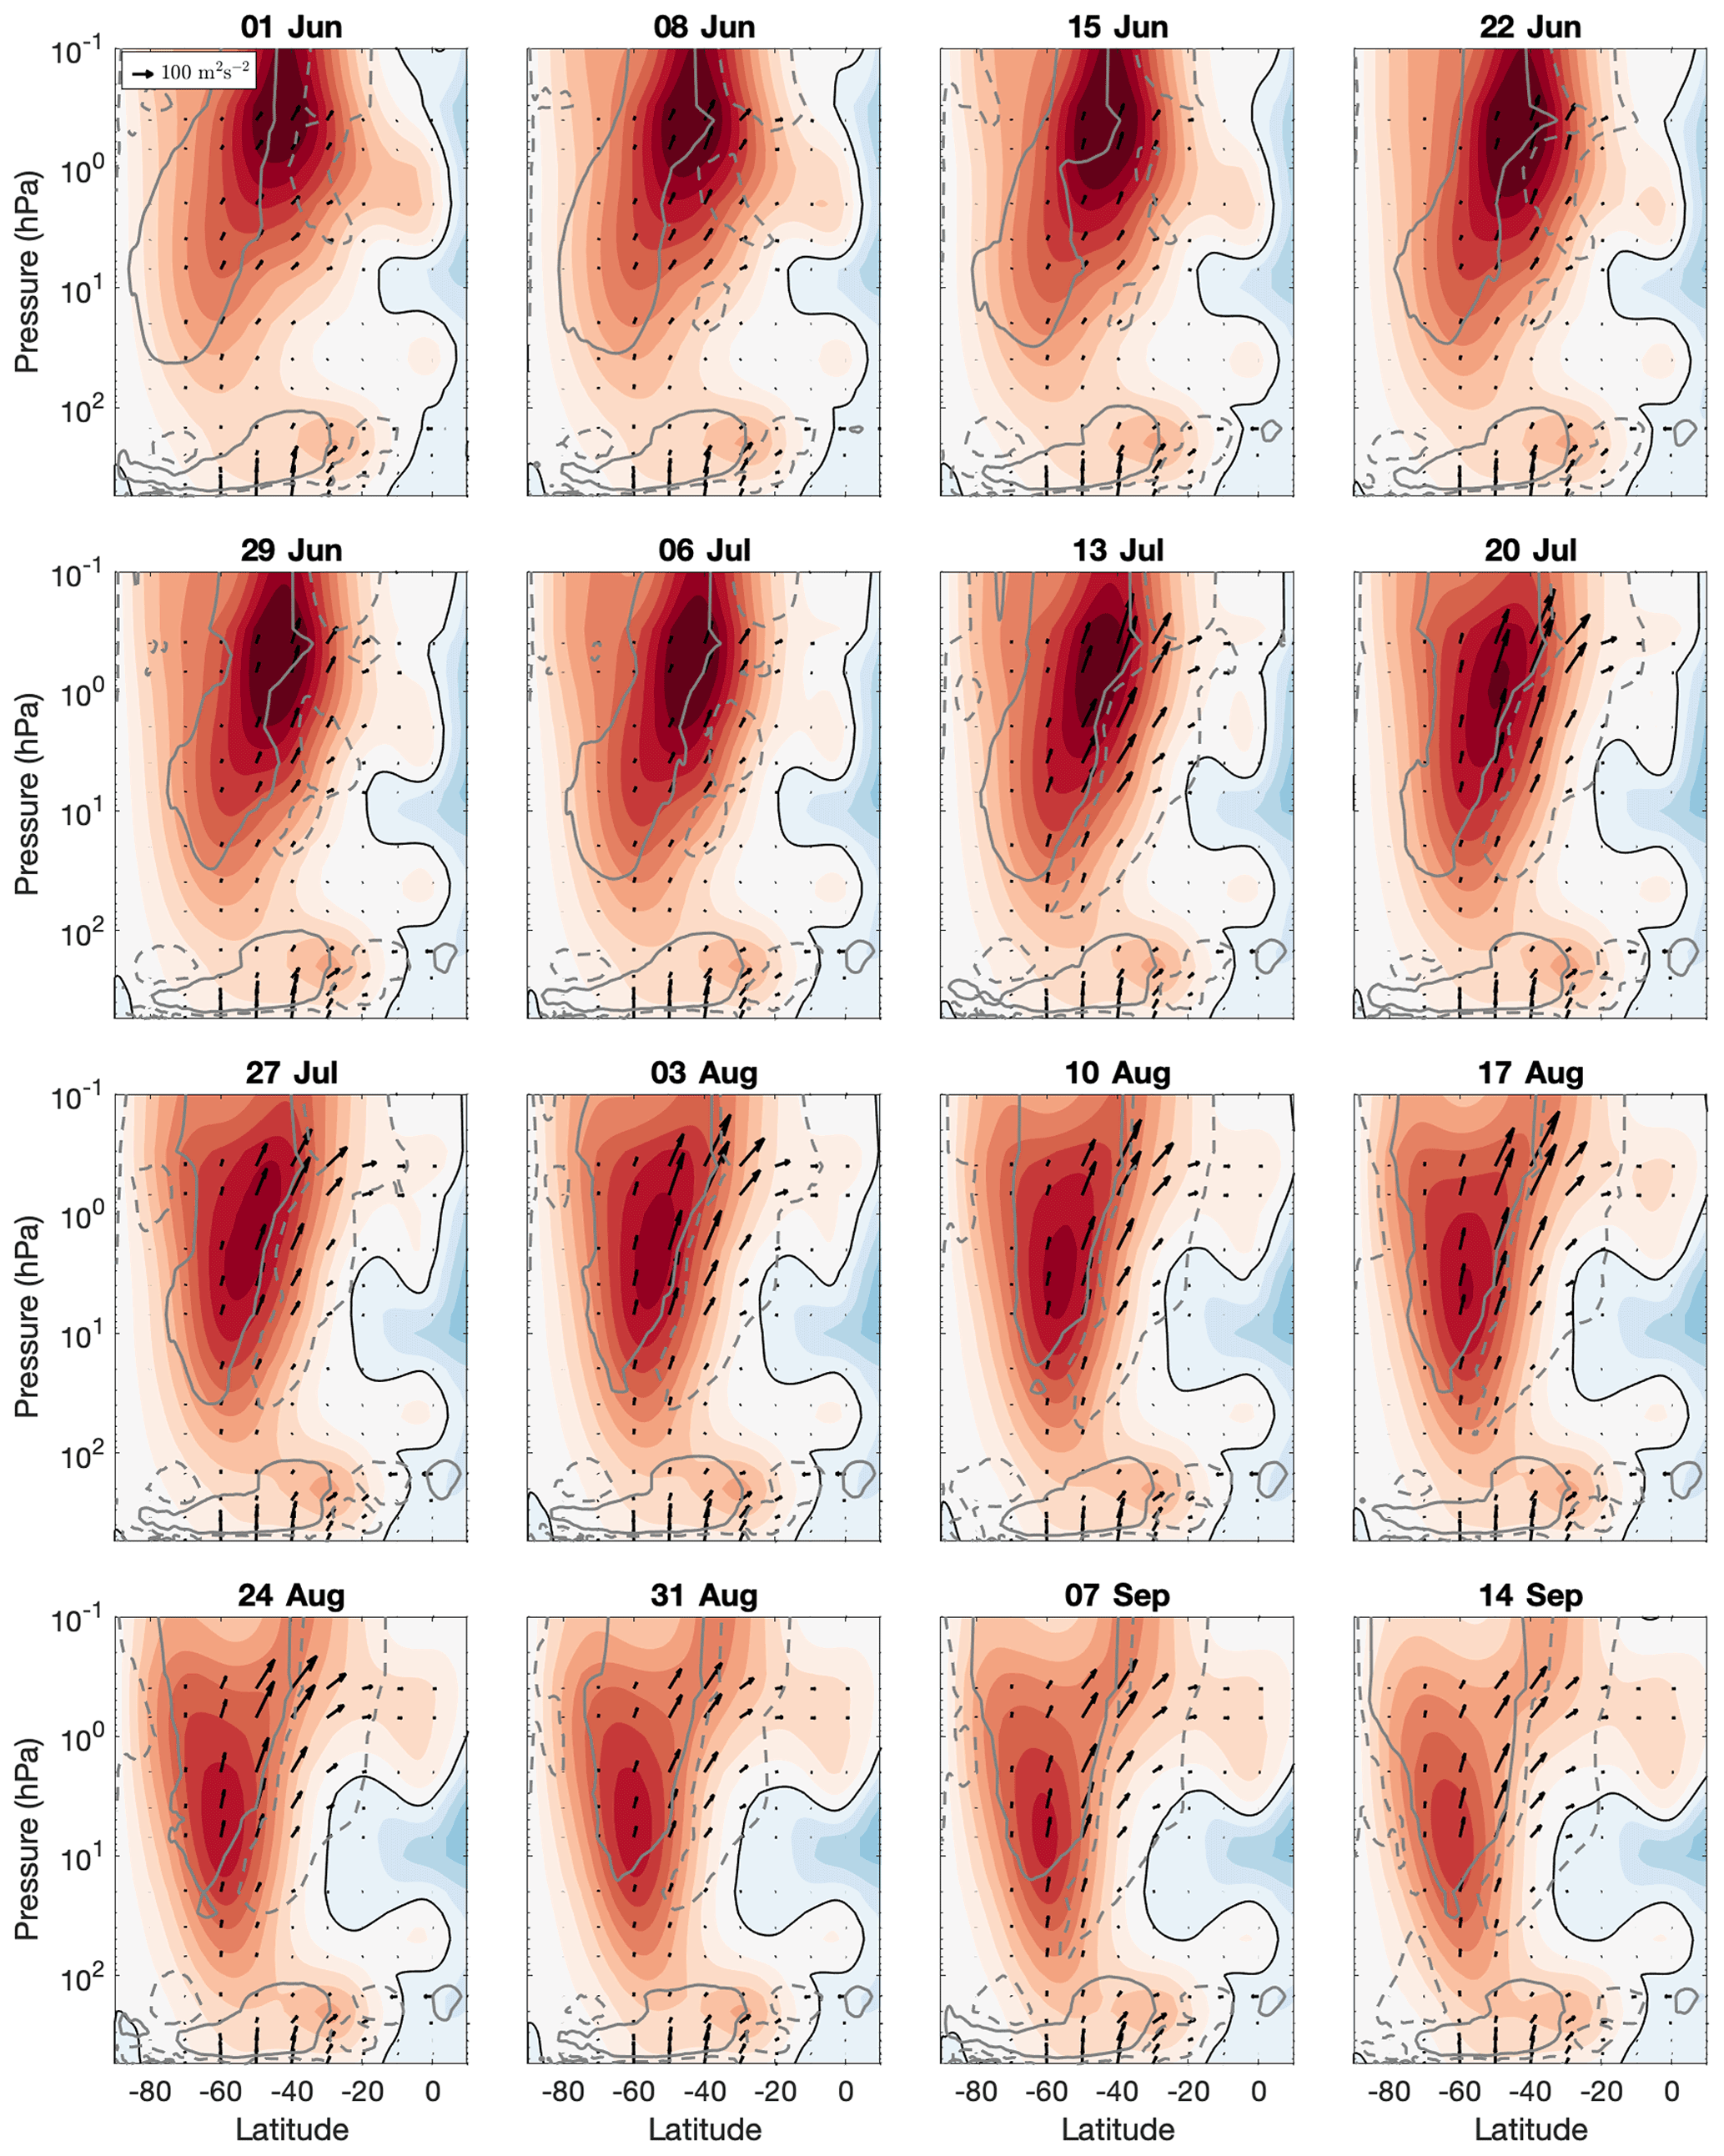
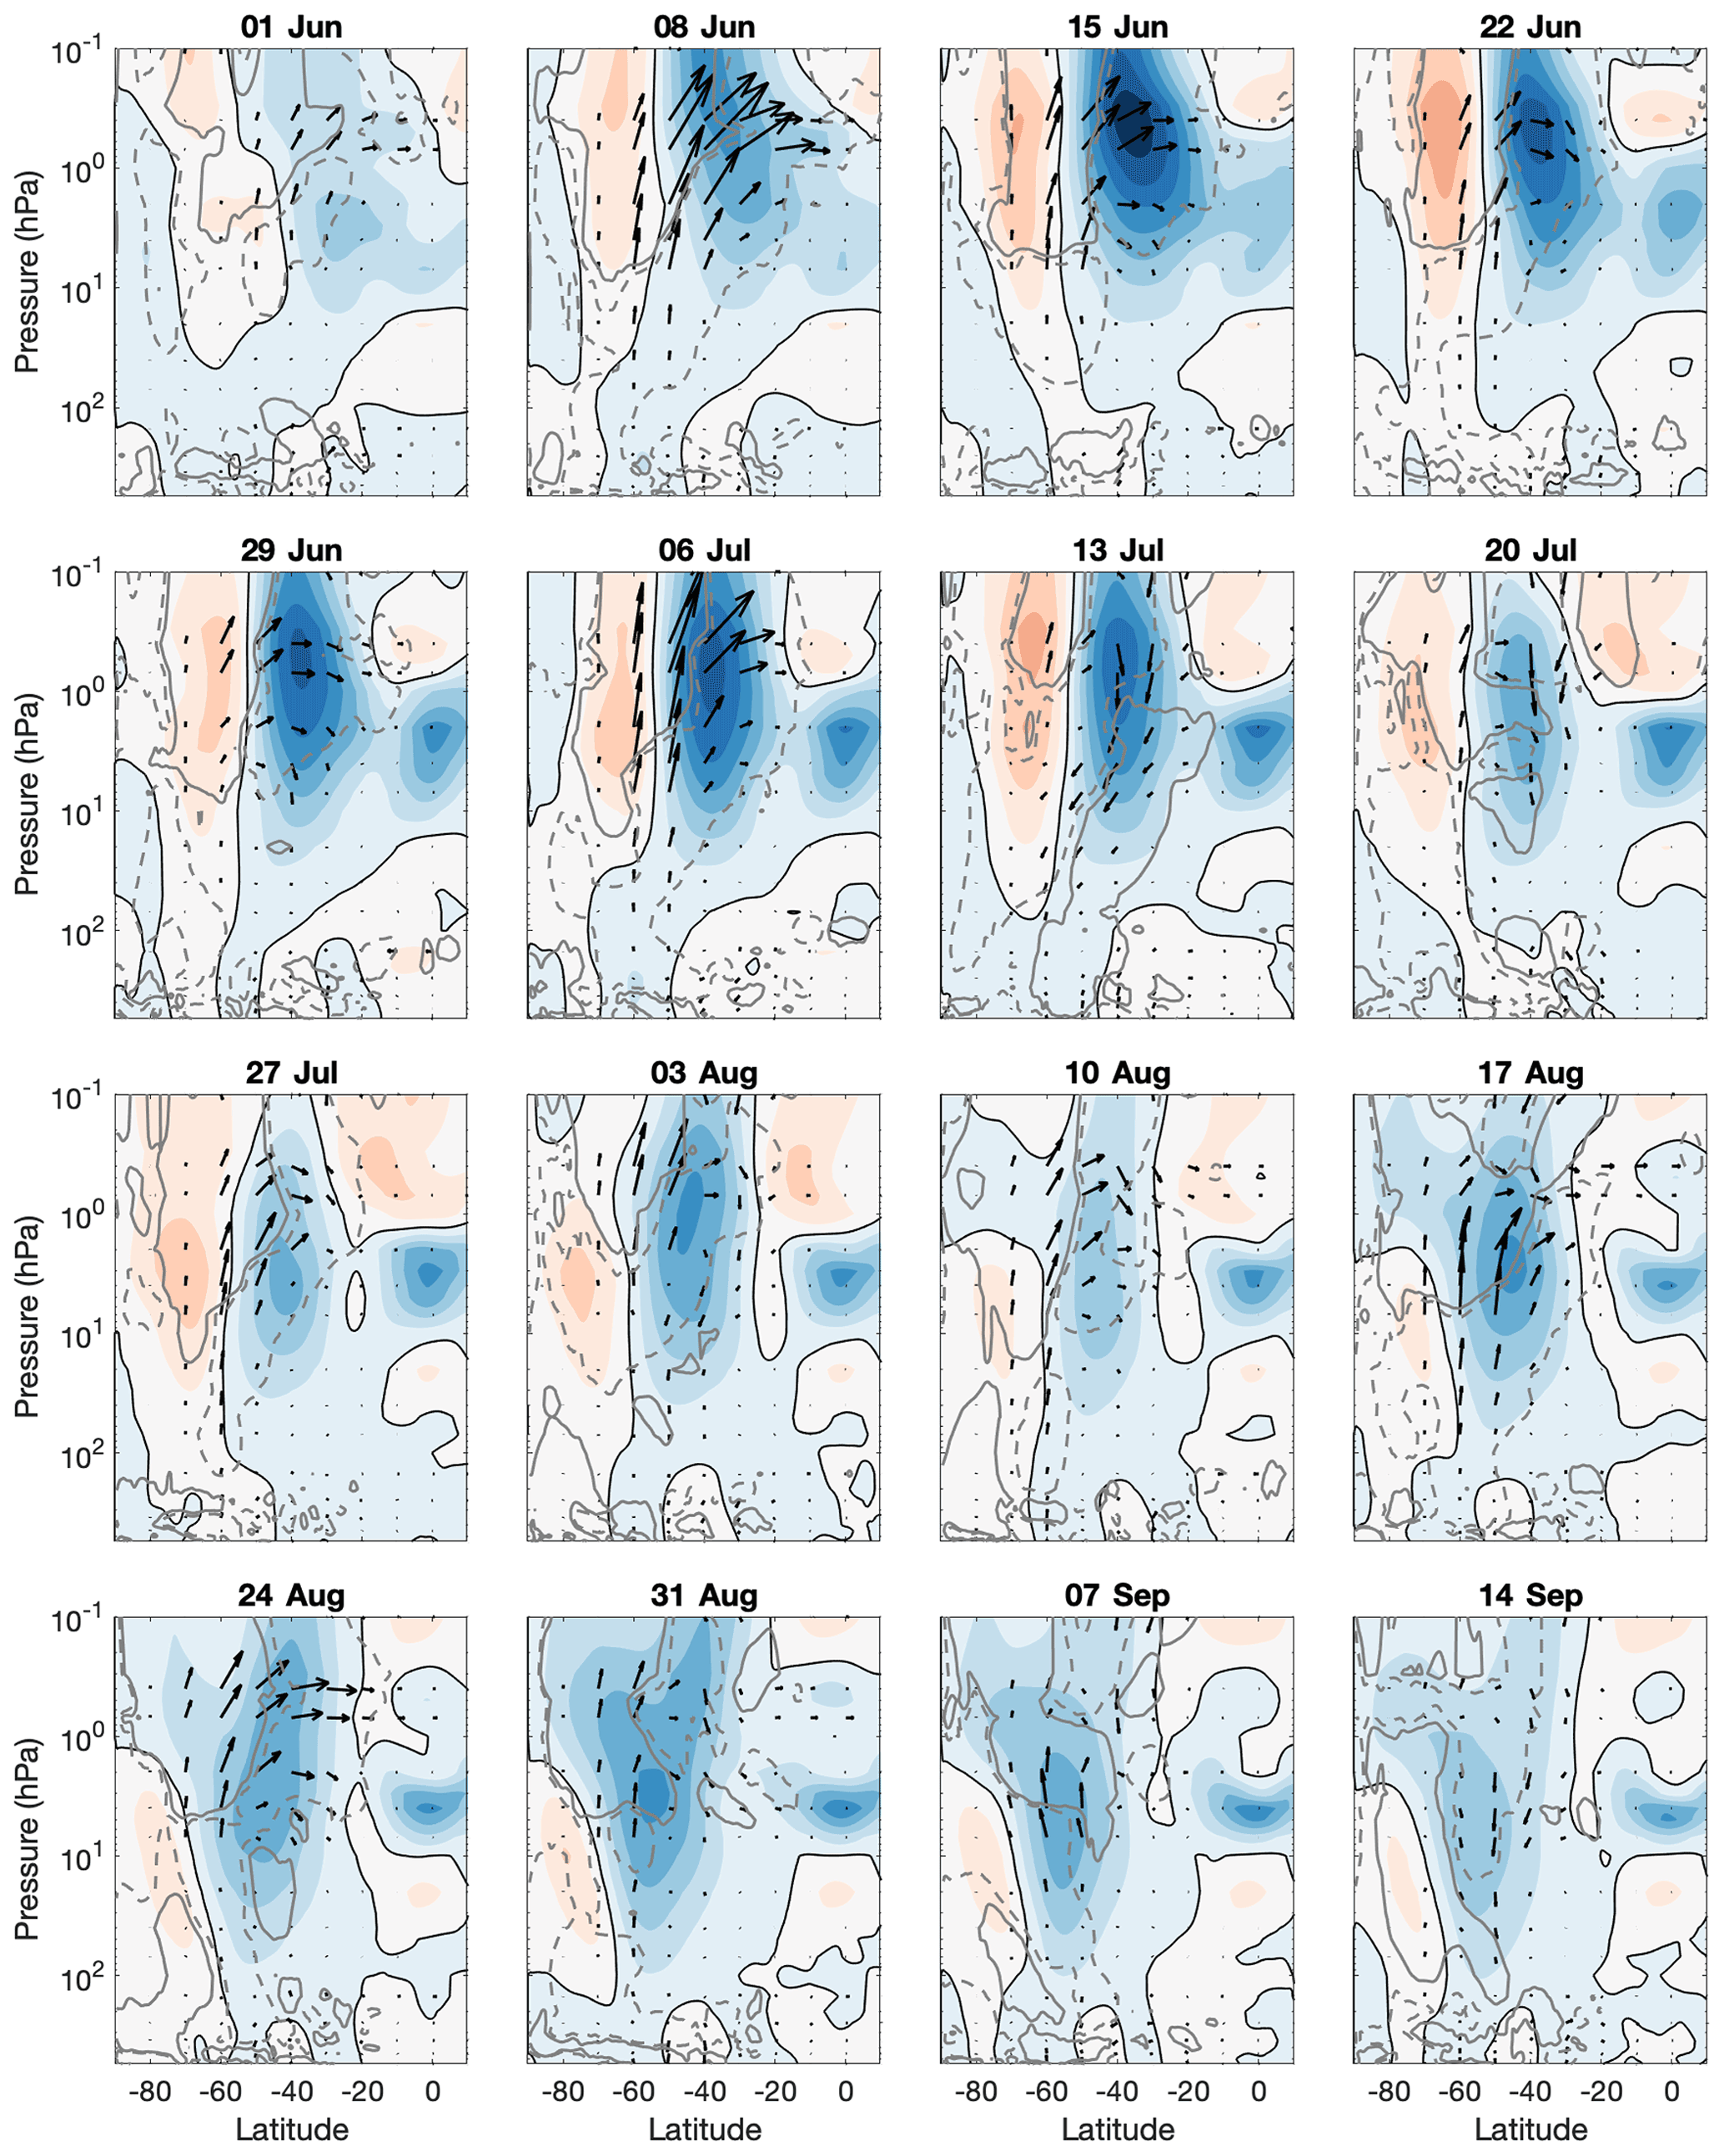
Figure 1The 7 d average zonal-mean zonal wind (contours, interval 10 ms−1), Eliassen–Palm (EP) flux (arrows, m2 s−2, reference arrow shown in first panel) and EP flux divergence (± 2 , convergence is indicated by dashed grey lines, and divergence is indicated by solid grey lines) for the reference eQBO years (excluding 1988, 2002, 2017, and 2019). Each panel covers the latitudinal range of 90∘ S to 10∘ N and the vertical range of 550 to 0.1 hPa. The solid black line shows the location of the zero-wind line. The first day of averaging in each figure is given in the title.
Figure 1 presents the 7 d averages of zonal-mean zonal wind (m s−1), EP flux (arrows, m2 s−2, reference arrow shown in the first panel), and EP flux divergence (grey contours, ± 2 contour levels included) averaged for the reference years 1980, 1983, 1985, 1990, 1993, 1995, 1997, 1999, 2004, 2006, 2008, 2011, and 2014. The MERRA-2 zonal-mean zonal wind reaches westerly velocities of over 100 ms−1 in the polar vortex in the upper stratosphere around 1 hPa in June–July, after which the wind maximum descends down towards 10 hPa, with peak velocities of 70 ms−1 by mid-September. Consistent with the selection of eQBO years, we can see the easterly wind signature at 10 hPa at the Equator, persisting throughout the time period and remaining well below the 1 hPa level. The easterly SAO wind pattern presents at around 1 hPa from June to early July, after which it subsides as the SAO annual cycle shifts to westerlies (Kawatani et al., 2020). There is no clear merging of the eQBO and SAO wind structures. The panels also indicate the location where the zonal winds changes from easterly to westerly with a solid black contour (0 ms−1, zero-wind line). Propagation of stationary waves requires westerly flow, and thus the zero-wind line forms a barrier for stationary wave propagation.
The EP flux and its divergence indicate that from June to early July the waves are generally acting to accelerate the zonal flow in the poleward side of the polar vortex and decelerating it on the equatorward side. This deceleration happens more consistently from mid-July onwards, at the same time as wave propagation upwards and equatorwards is enhanced above 100 hPa. The zero-wind line at 10 hPa is initially located between 10 and 20∘ S, extending to 30∘ S from mid-August.
3.1 SH polar winter 2019
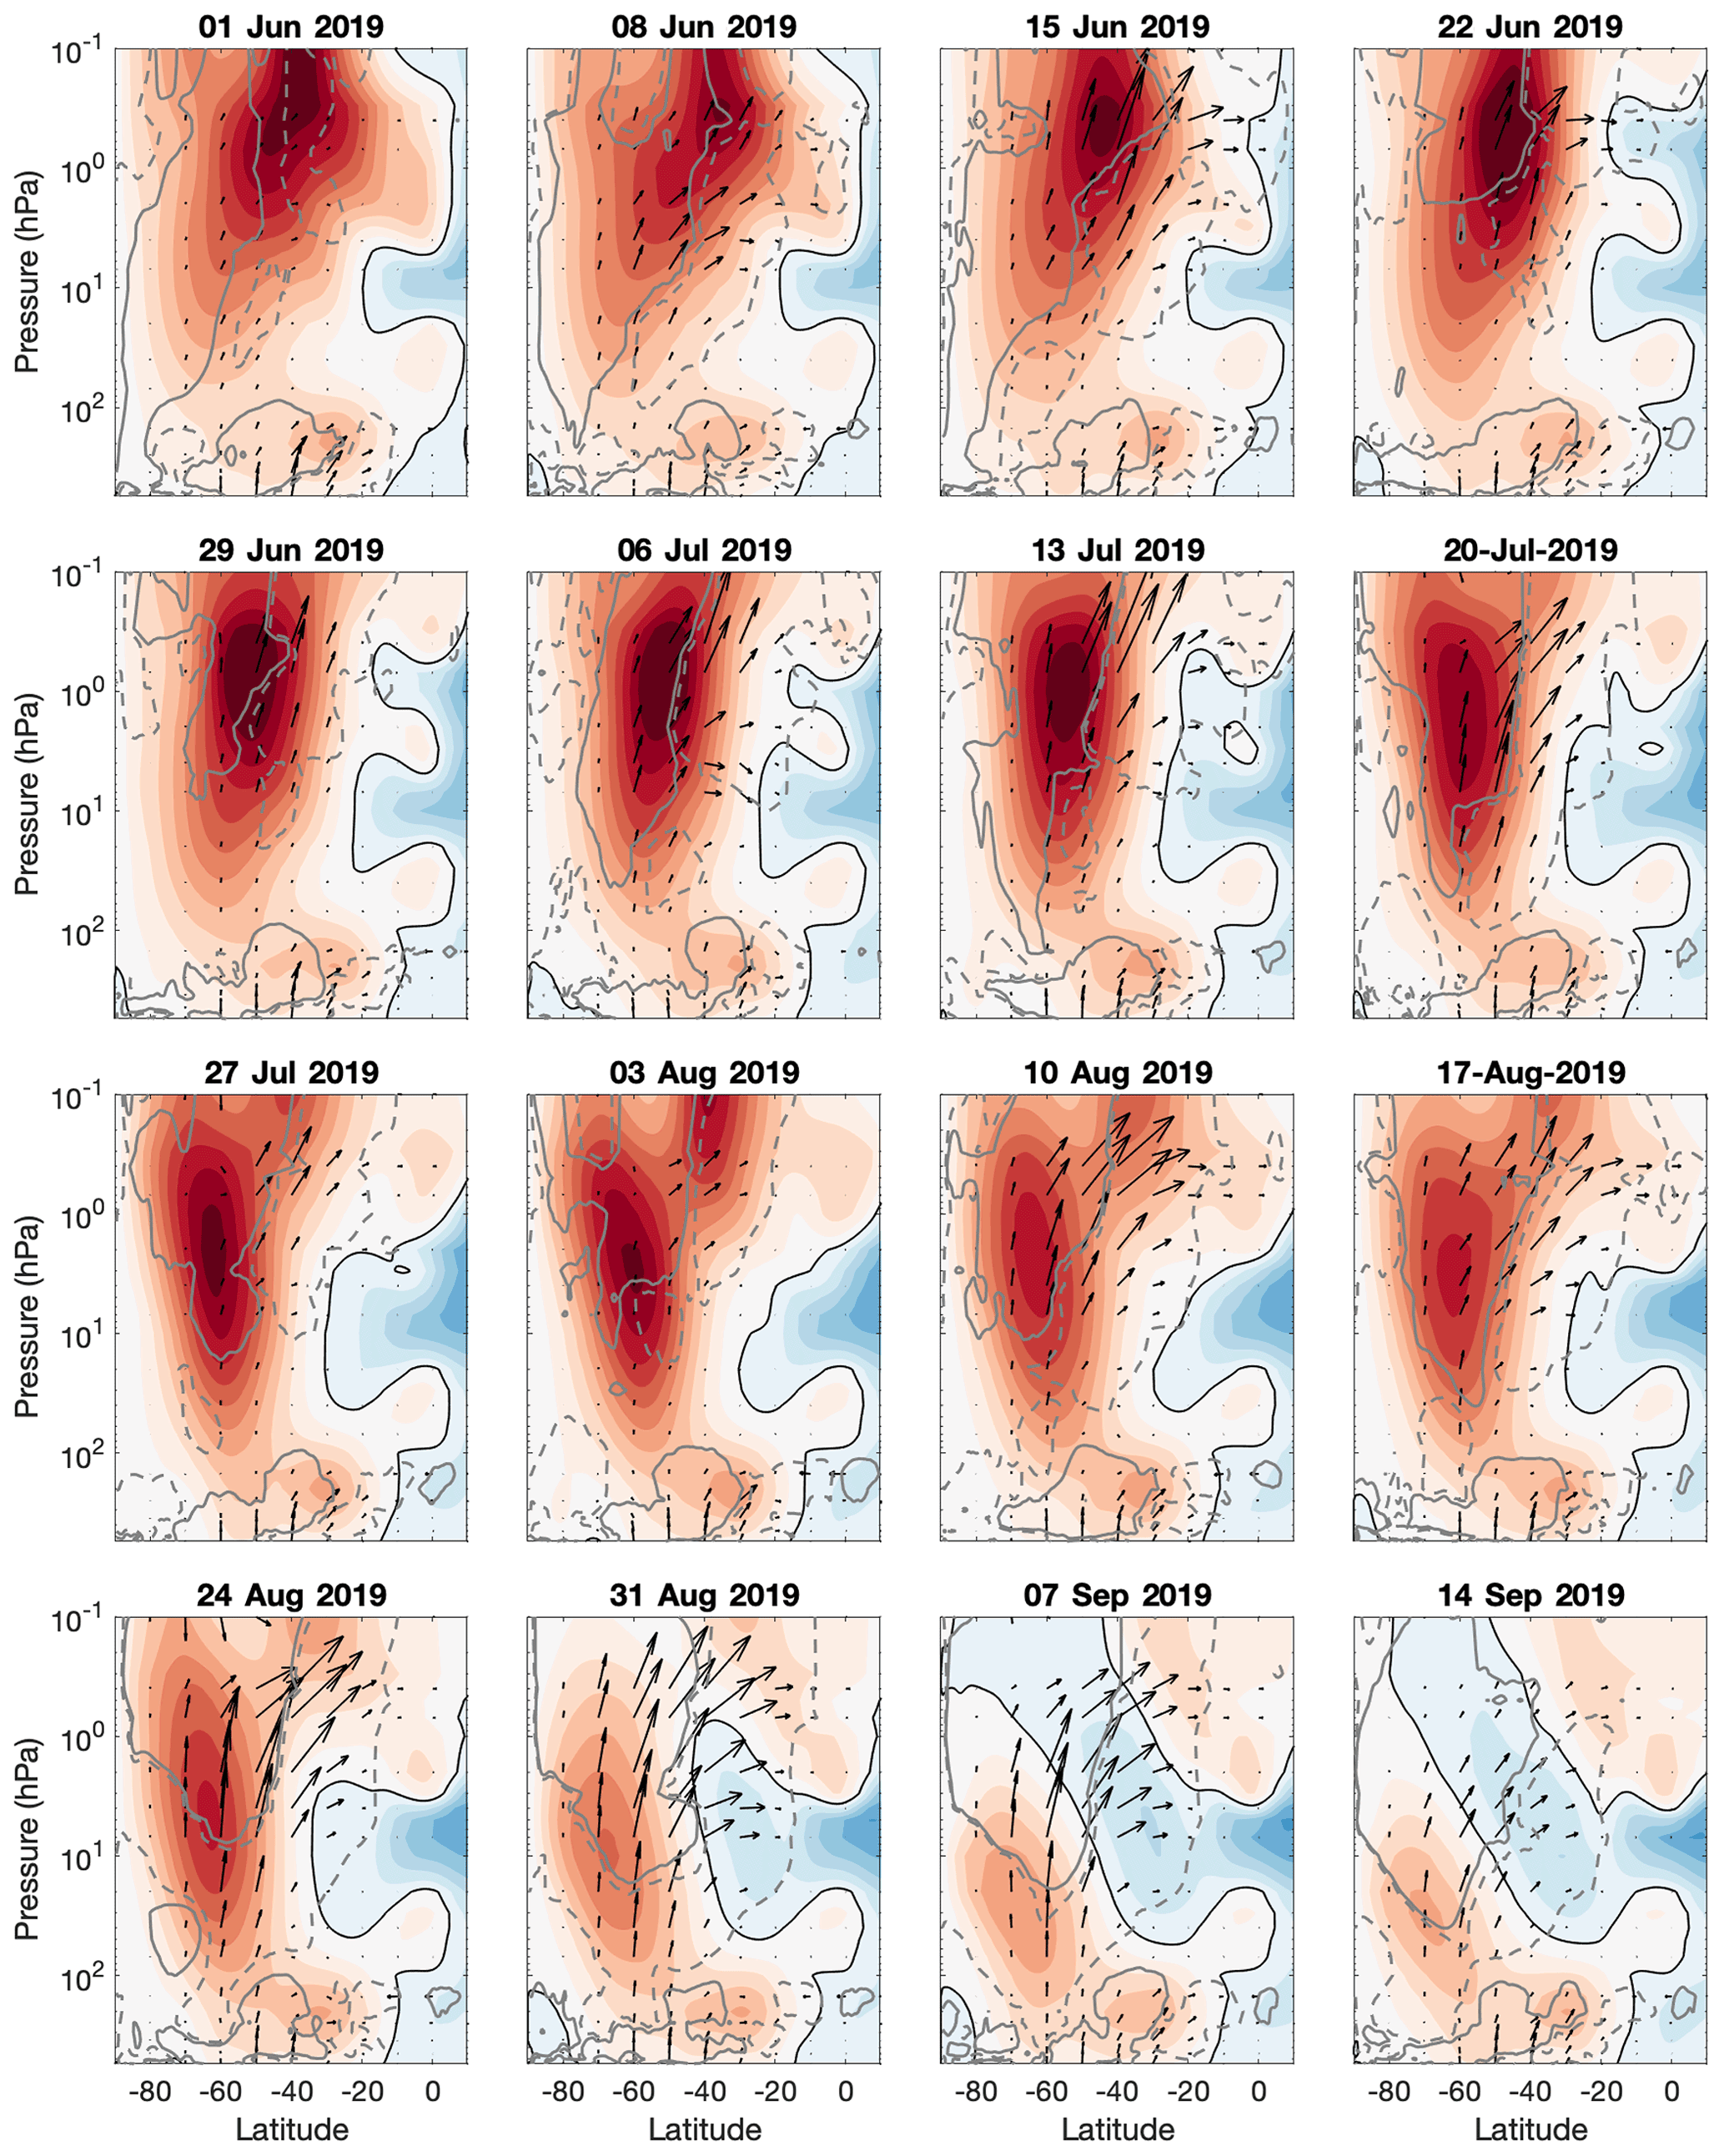
Figure 2 shows how the 7 d averaged zonal-mean zonal wind evolves with time, along with the propagation of planetary-scale waves during the austral winter of 2019, with the EP flux arrows illustrating the direction of wave movement. Presentation and timing is analogous to Fig. 1. As before, the location of the zero-wind line (contour of 0 ms−1 zonal-mean zonal wind) is indicated as a thick black line. The EP flux divergence is shown with the dashed grey line indicating where the waves dissipate and deposit easterly momentum to atmospheric flow, acting to decelerate it at a rate of 2 , and the solid grey line indicating where acceleration is taking place at a rate of 2 .
Throughout the winter, the equatorial atmosphere around 10 hPa shows a easterly zonal-mean zonal wind structure, with peak velocities of 30–40 ms−1, indicating the presence of QBO in the easterly phase. This eQBO wind signal is present around 10 hPa from early June and is not initiated by the descending easterly SAO (seen here above 1 hPa), as may happen with westerly SAO and westerly QBO (Kuai et al., 2009). In contrast to the reference (Fig. 1), the equatorial SAO around 1 hPa is evident from mid-June, with zonal-mean zonal winds of up to −20–30 ms−1. The easterly wind structure extends further into the Southern Hemisphere (20∘ S by late June) than in the reference and persists into mid-July, when it merges with the easterly wind structure that originates from the 10 hPa eQBO easterly wind structure.
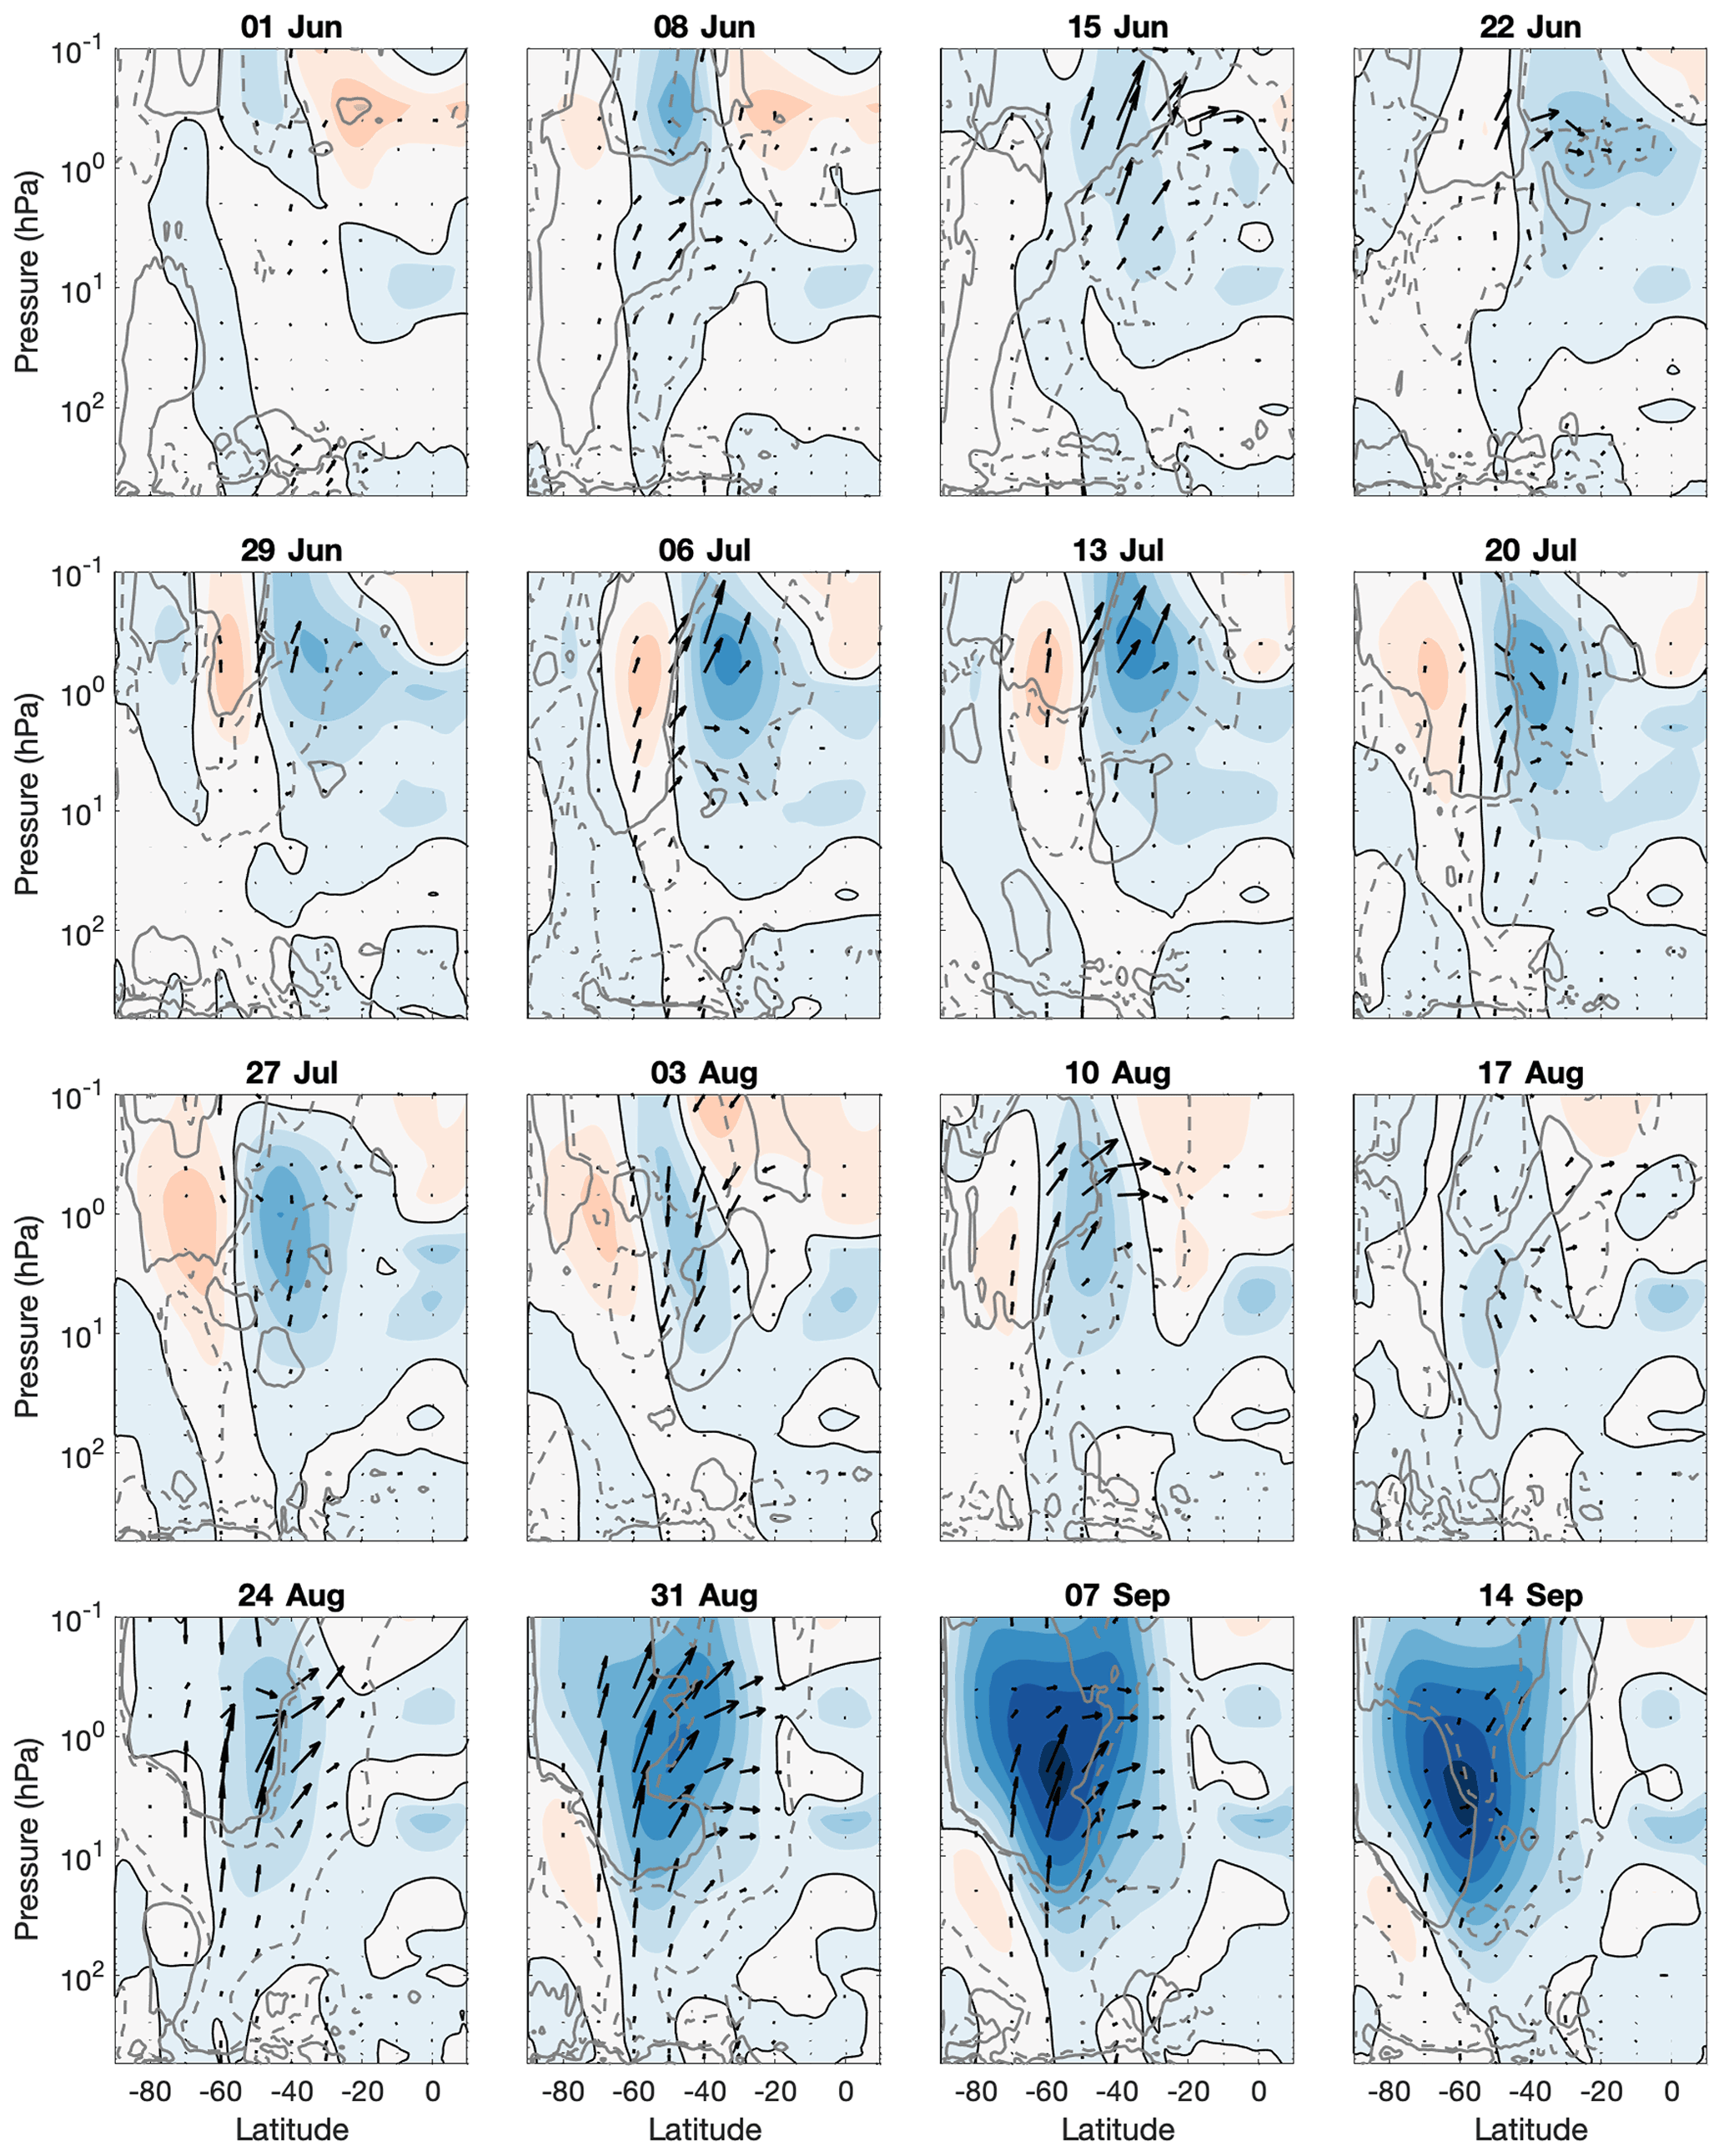
Figure 3Difference between 2019 and the reference eQBO years. Zonal wind contour intervals, EP-flux vectors, and EP flux divergence (divEP) levels are the same as in Fig. 1.
From mid-June onwards, enhanced upwards wave propagation takes place above 10 hPa, and the wave convergence drives enhanced deceleration on the equatorward side of the polar vortex. This can be seen clearly in Fig. 3, which presents the 2019 deviation from the eQBO reference mean (Fig. 2 − Fig. 1). Unlike in late August, when enhanced upwards wave flux originating from the troposphere (Eswaraiah et al., 2020a; Shen et al., 2020; Yamazaki et al., 2020) takes place across the stratosphere, the earlier enhanced upwards flux is limited to 10 hPa and above.
Initially in early June, enhanced easterly momentum deposition takes place between 40 and 60∘ S, decelerating the flow above 1 hPa. This extends downwards and equatorwards, resulting in consistent deceleration of the upper stratospheric flow between 20 and 50∘ S from mid-June throughout July. At the same time, the zonal wind is accelerated by 10–20 ms−1 around 60∘ S. This leads to a more vertically aligned structure of the polar vortex zonal-mean zonal wind, rather than the typical structure, which we can see in Fig. 1, tilted towards the Equator in the upper stratosphere. This appears to correspond to a vortex shape Albers and Birner (2014) found to be typical for NH split type SSW events.
From late June the direction of wave propagation in the upper stratosphere is guided by the easterly wind structure near 1 hPa. By early July the convergence of the EP flux contributes to deceleration of the stratospheric flow above 10 hPa around 20∘ S, leading to a structure that resembles merging of the previously separate easterly wind structures of the SAO and eQBO. The formed zero-wind line guides more waves upwards. Throughout July and into August the zonal-mean zonal wind is consistently weaker by 10–20 ms−1 across the stratosphere between latitudes of 60 and 40∘ S. By late August, when we observe enhanced upwards wave propagation from the troposphere, the zonal flow is further rapidly decelerated above 10 hPa, leading to the SSW conditions in September.
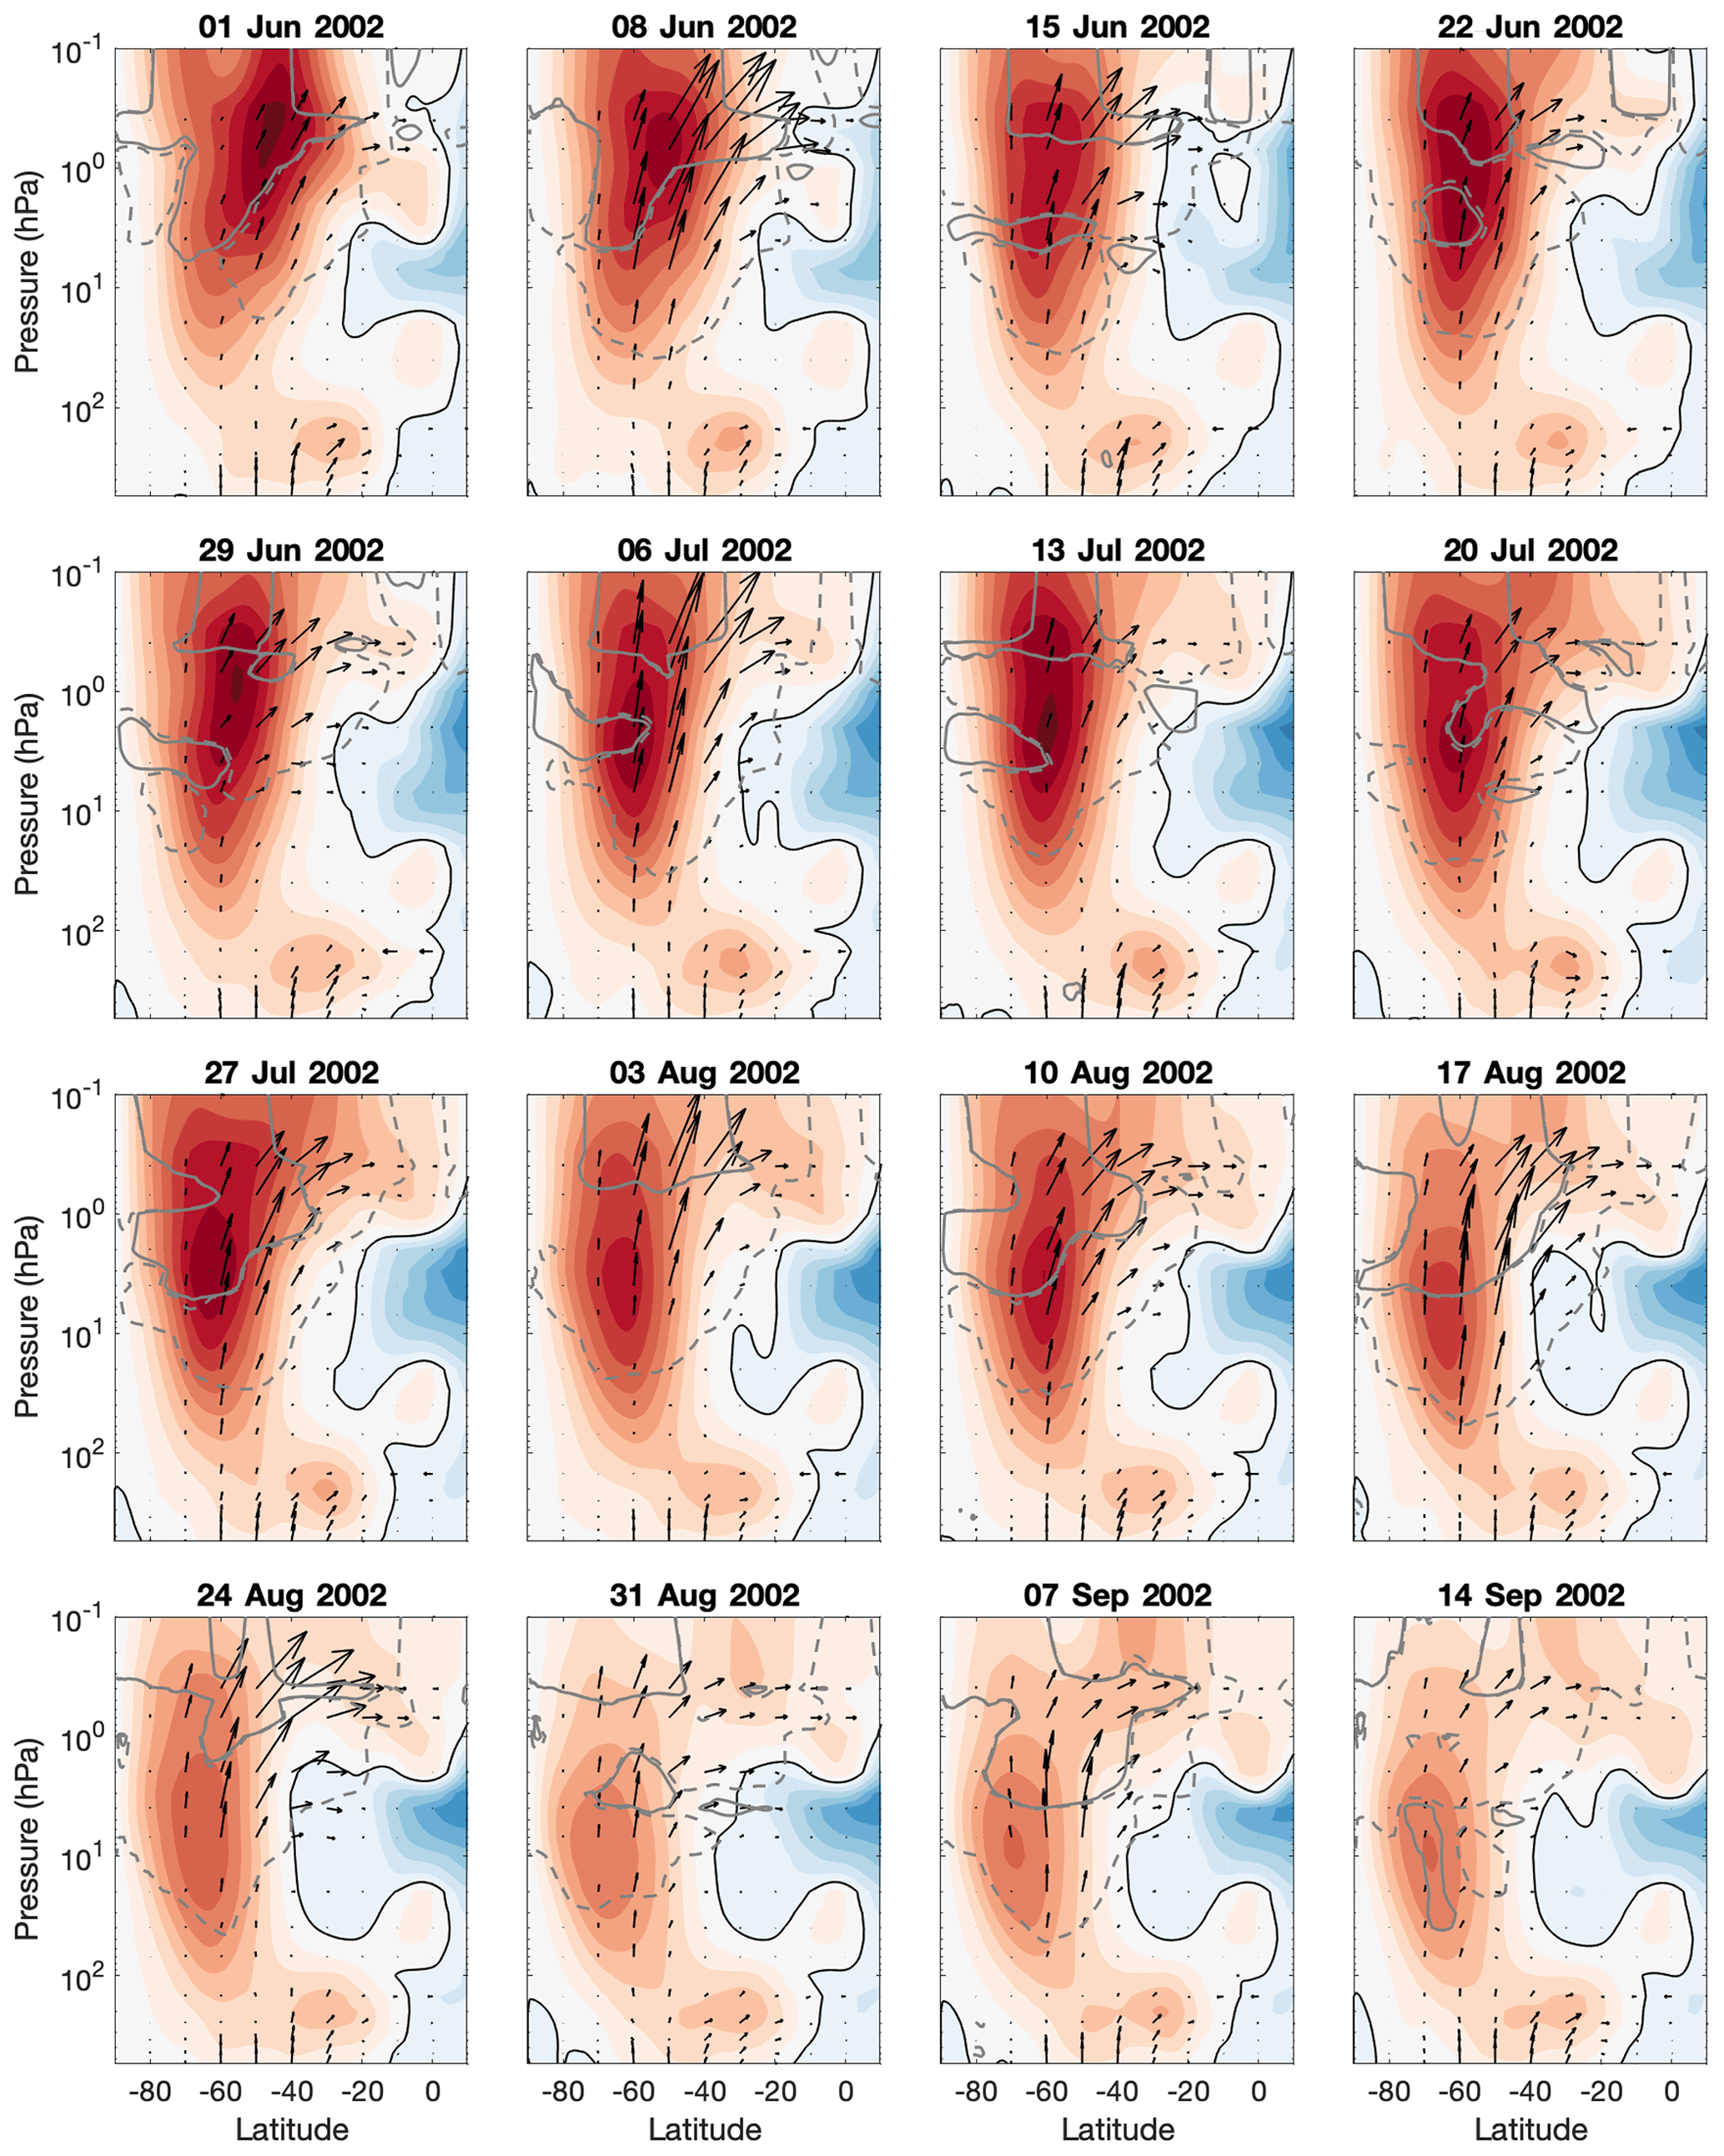
3.2 SH polar winter 2002
Figures 4 and 5 are analogous to Figs. 2 and 3 but show the austral winter of 2002. Again we observed the eQBO wind structure at 10 hPa from early June, similar to 2019. From 8 June onwards, the easterly oscillation of the SAO is present around 1 hPa, and upwards wave propagation is enhanced throughout the stratosphere above 100 hPa. Between about 40 and 60∘ S, enhanced easterly momentum deposition throughout the atmosphere above 10 hPa leads to deceleration of the zonal winds in this region throughout the time period. As in the case of the winter of 2019, we see a merging of the previously separate easterly wind structures of the SAO and eQBO. This now takes place in mid-June, approximately 4 weeks earlier than in 2019. The zero-wind line of the zonal-mean zonal wind formed as a result extends to 30∘ S, cutting across ∼ 0.4–30 hPa.
This vertical extent is not maintained for extended periods of time. However, as in 2019, the latitudinal location of the zero-wind line between 1 and 50 hPa is shifted about 10∘ polewards from its typical location (Fig. 1) throughout July to about 30∘ S.
In both cases, the following features appear notable: (1) the merging of the two initially separate easterly wind patterns, (2) the resulting shift in the zero-wind line across the month of July (well before the SSW onsets took place in September), and (3) the enhanced zonal flow deceleration above 10 hPa.
Overall, the atmospheric response above 10 hPa is remarkably similar to 2019. Both years show sustained wave-driven deceleration of zonal-mean wind between 40 and 60∘ S from June, throughout July, and simultaneous acceleration between about 60 and 70∘ S. By early to mid-August the zonal winds have decelerated across the polar region above 1 hPa.
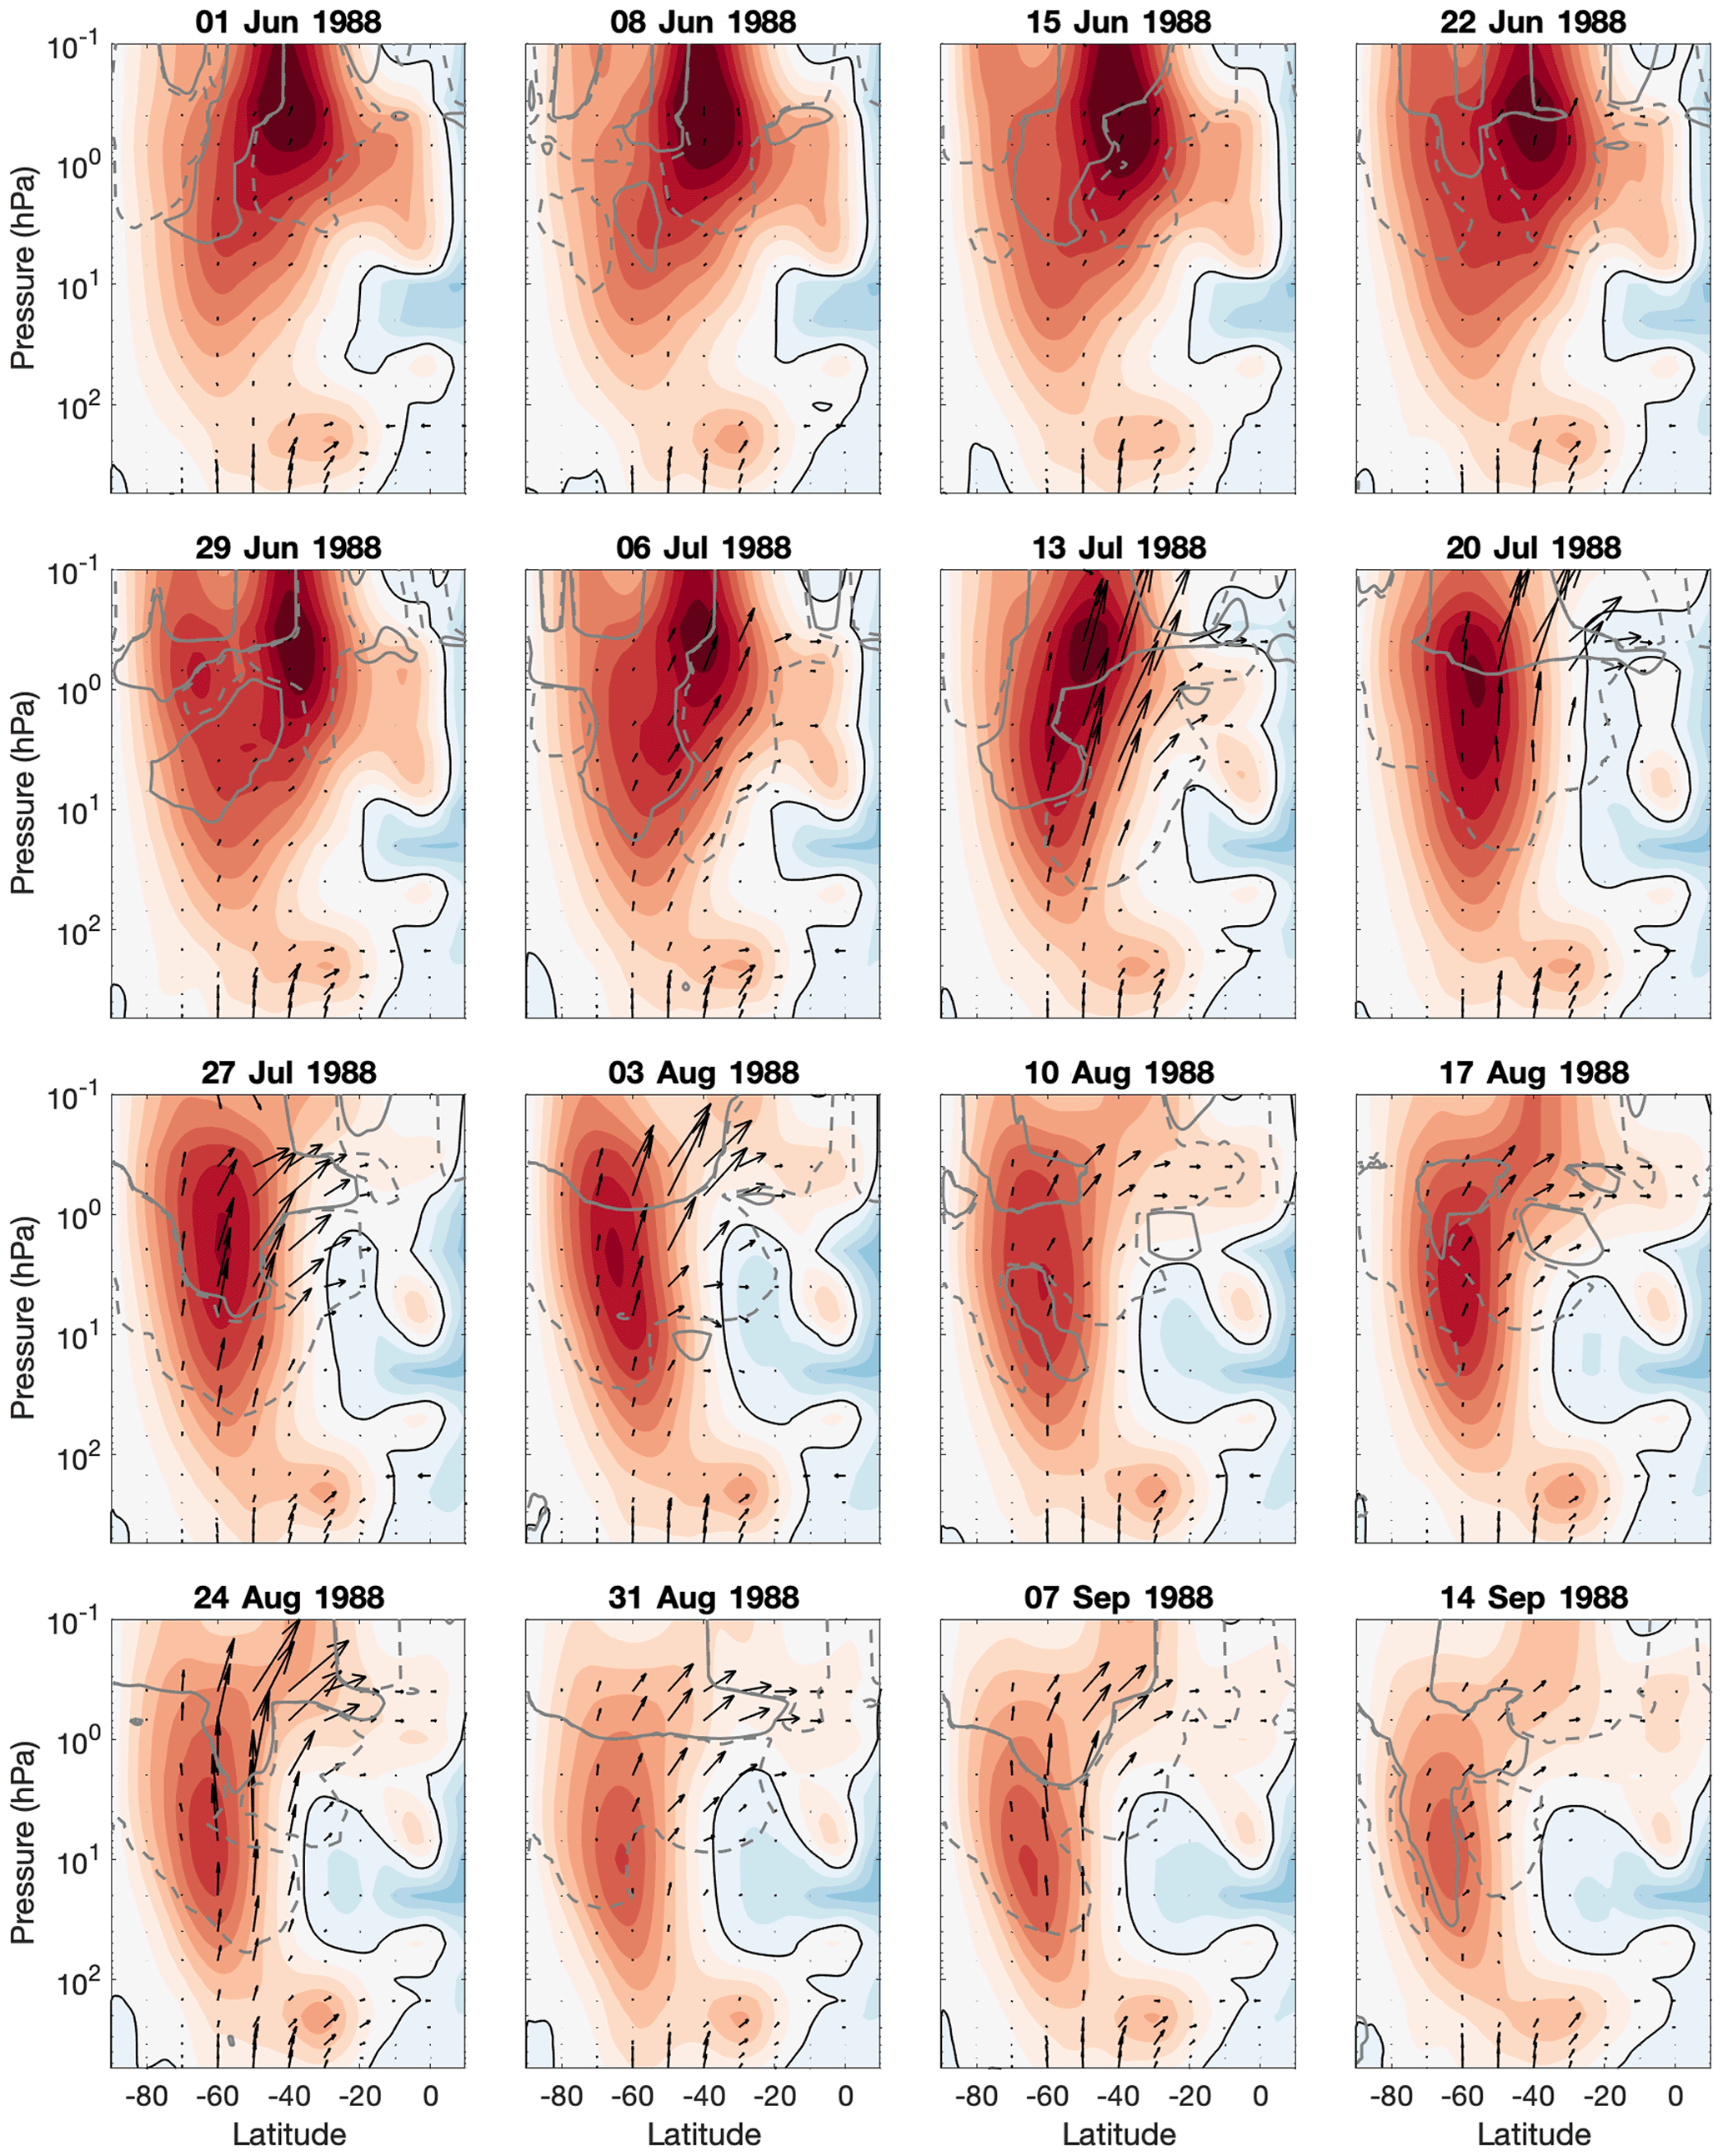
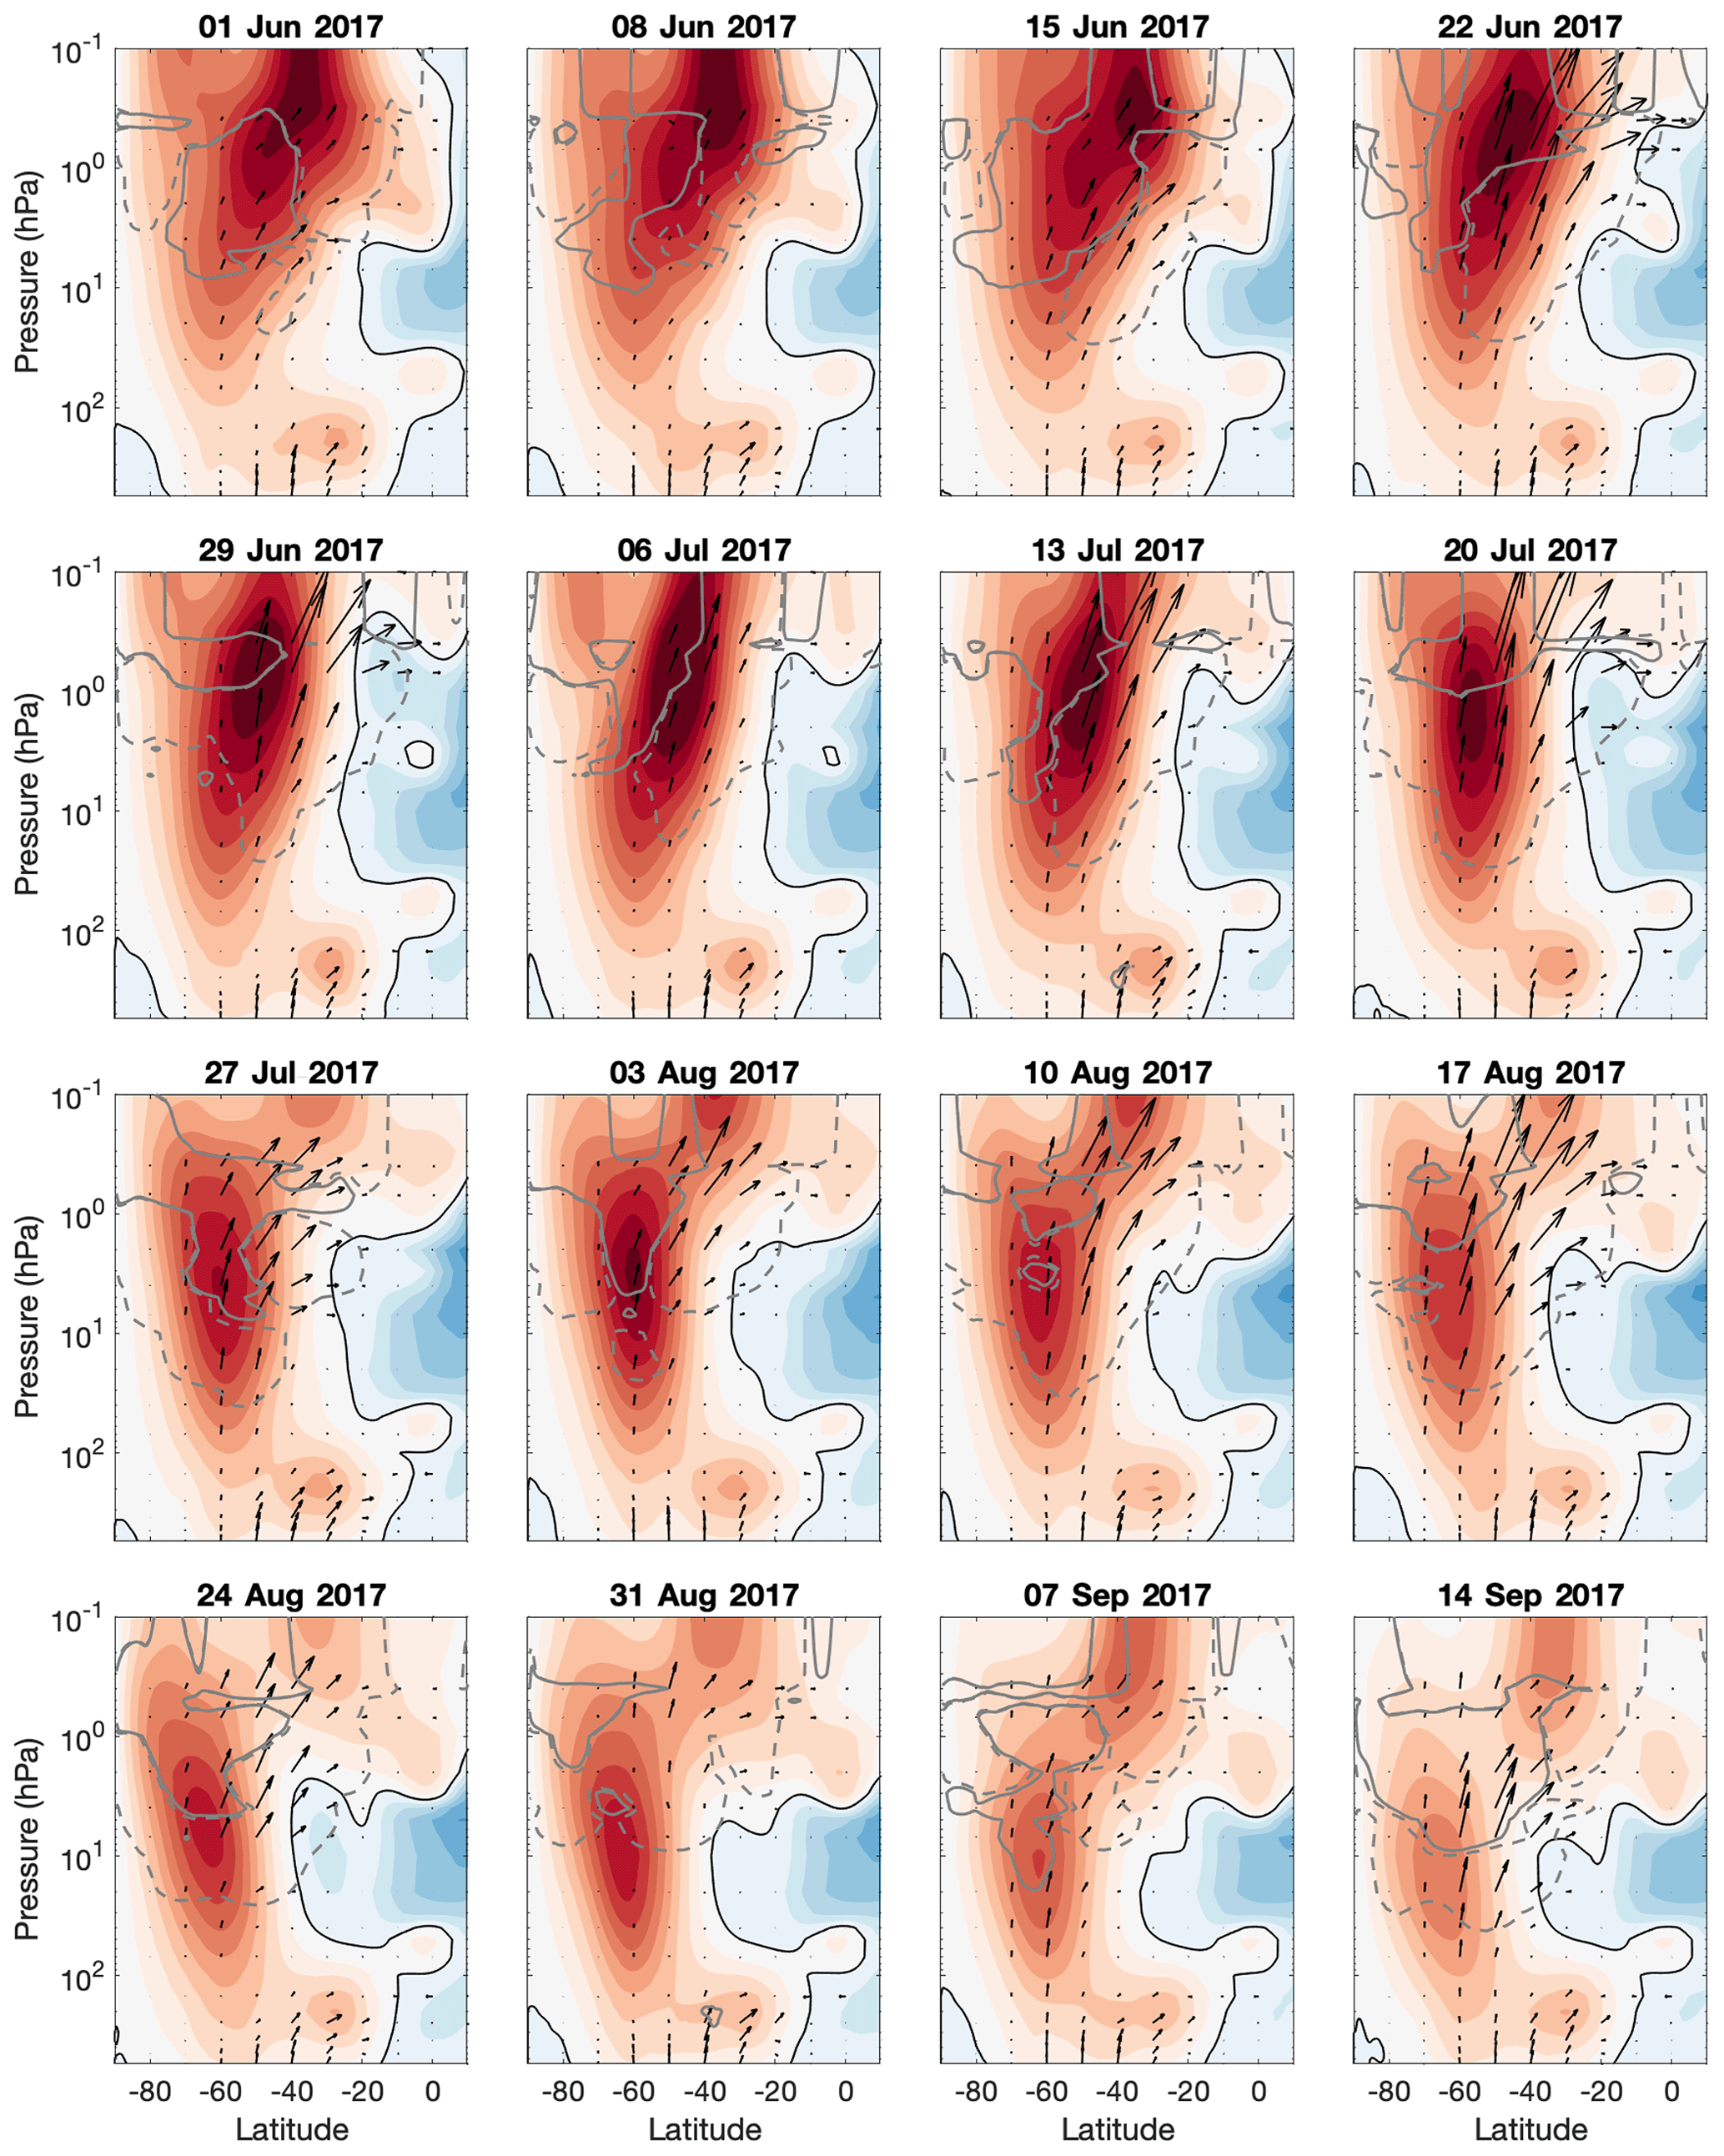
Identical analyses for the previously identified early weak vortex event years of 1988 and 2017 show that similar equatorial easterly wind pattern mergers took place during both winters (figures included in the Supplement). In 2017 this happened in late June, accompanied by enhanced upwards EP flux and followed by a poleward shift in the zero-wind line latitudinal location. In 1988 this happened much later, i.e. from 20 July onwards. In 1988, however, there is no indication of enhanced upwards wave propagation in June, as was the case for 2002, 2017, and 2019.
3.3 Weak vortex events in context of other eQBO years
When analysing all the eQBO years individually the type of equatorial wind pattern merger reported above either did not take place or took place much later and, like in 1988, was not accompanied by enhanced upwards wave flux.
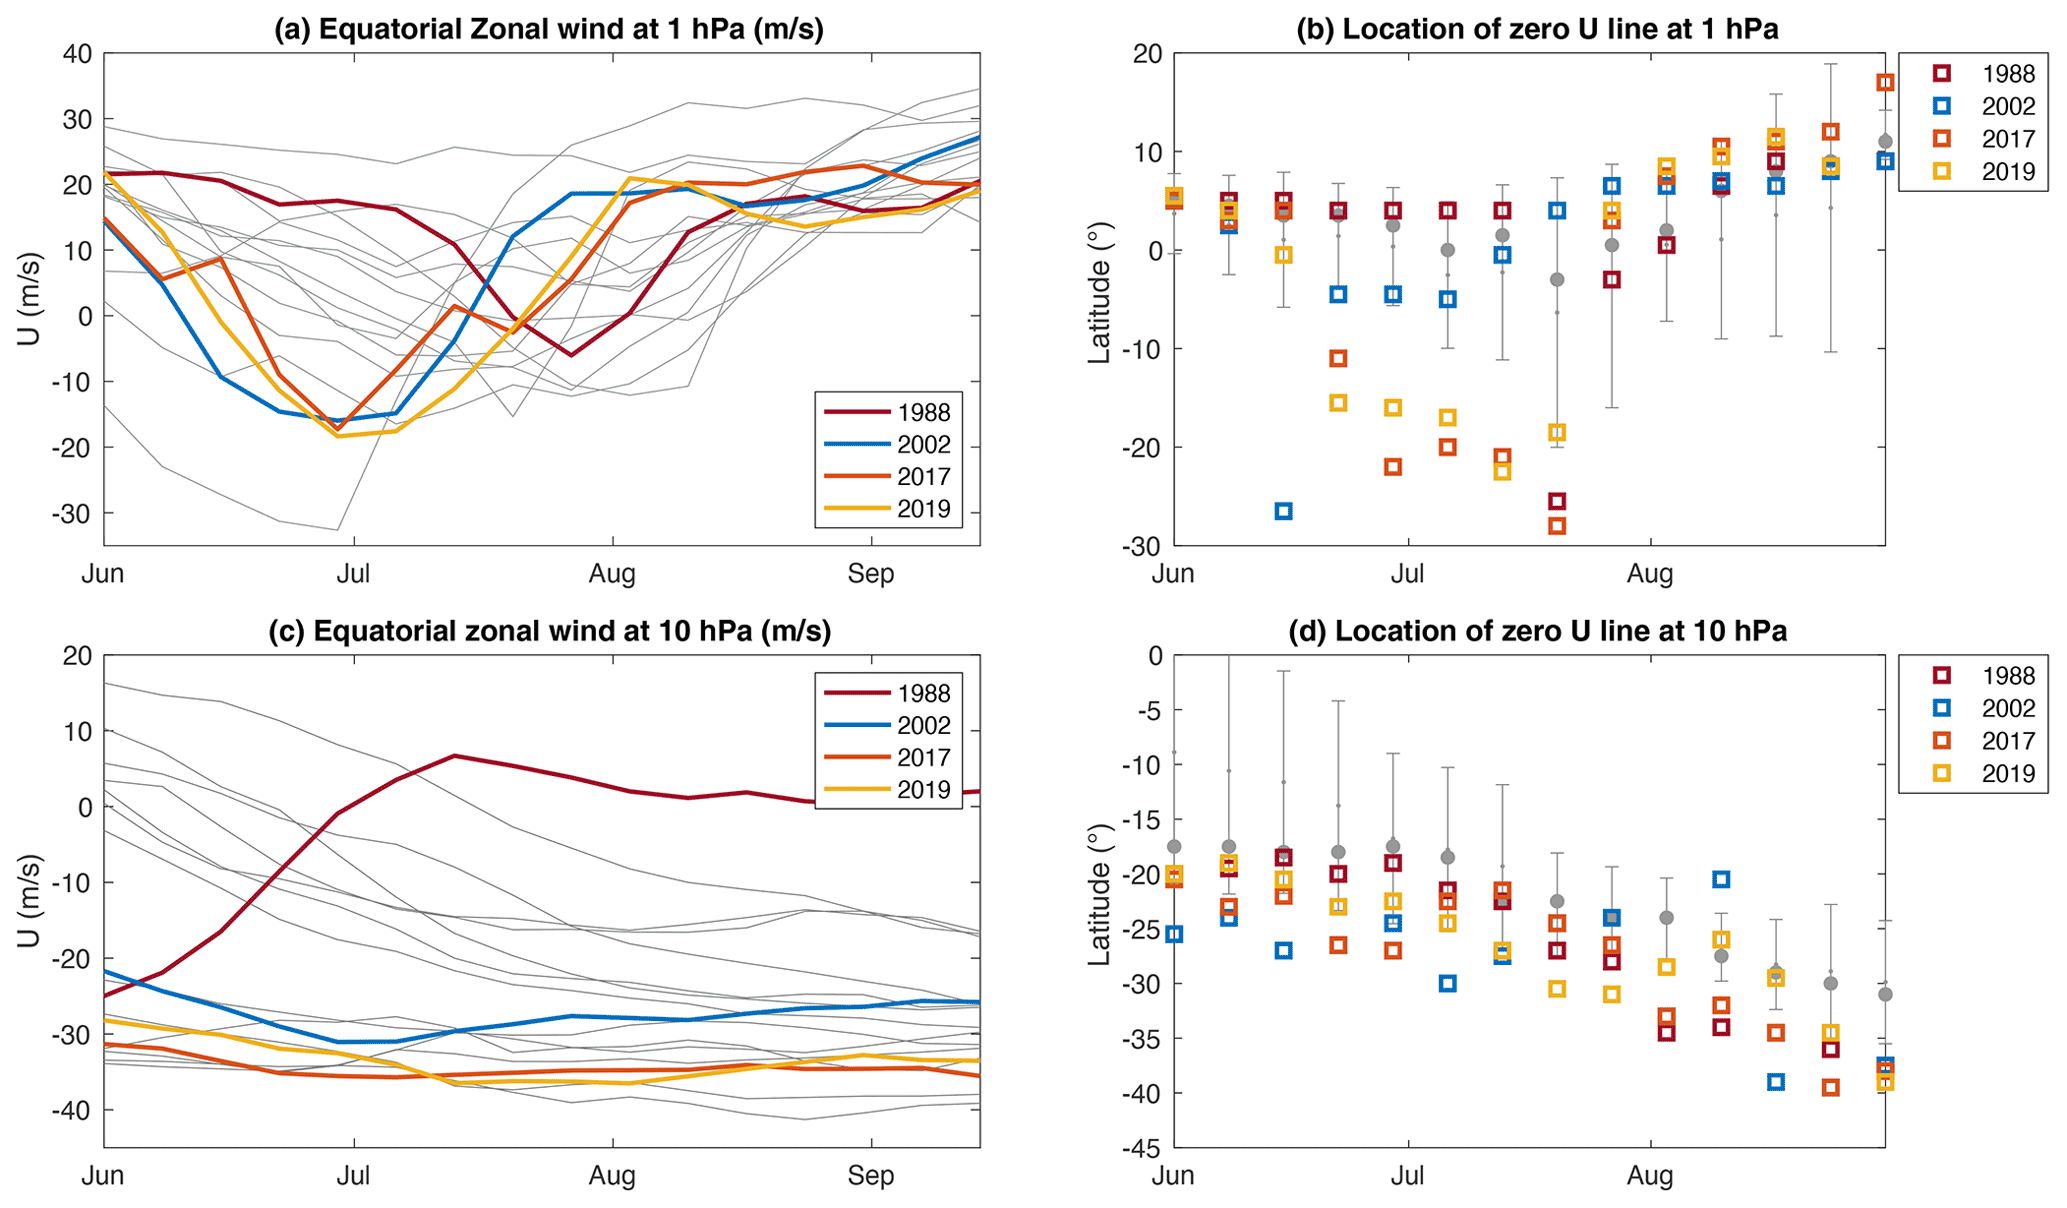
Figure 6(a) Evolution of the equatorial (5∘ S–5∘ N) SAO zonal wind at 1 hPa level (ms−1) from June to September. The grey lines show the wind for all eQBO years with the years 1988, 2002, 2017, and 2019 highlighted with red, blue, orange, and yellow lines, respectively. (b) Latitudinal location of the zero zonal wind line at 1 hPa level. The small grey dot indicates the mean location while the large grey circle indicates the median location during the eQBO years. For clarity, the grey bars show the 1×σ deviation around the mean location. Years 1988, 2002, 2017, and 2019 are highlighted with red, blue, orange, and yellow markers, respectively. (c, d) The same as above but for the zonal wind at the 10 hPa level for QBO.
Based on these results it appears that for the SSW cases and the weak vortex cases there is an interplay of early winter wave forcing and the wave guide formed by the zonal-mean zonal wind structures to do with the equatorial easterly winds related to the SAO around 1 hPa and the equatorial easterly winds related to the QBO around 10 hPa. We will now proceed to investigate if these factors together provide predictability for the weak vortex events.
Figure 6a presents the temporal evolution of the 7 d mean magnitude of the equatorial zonal-mean zonal wind averaged over 5∘ S–5∘ N for the 1 hPa level, representing the upper stratospheric SAO. The years 1988, 2002, 2017, and 2019 have been labelled separately, while all other eQBO years are shown as grey lines. The years 2002, 2017, and 2019 have some of the highest easterly wind velocities, reaching 10 ms−1 and higher in June. In this context we should again note that the results of Kawatani et al. (2020) suggest that interannual variability in MERRA-2 is consistent with other reanalysis datasets but that MERRA-2 also has a westerly bias above 20 hPa. The year when the June velocities reach −30 ms−1 corresponds to the first MERRA-2 year (1980).
Figure 6c presents a similar zonal wind temporal evolution (averaged over 5∘ S–5∘ N) but for the QBO level of 10 hPa. Again, the years 2002, 2017, and 2019 show some of the largest easterly velocities, i.e. between −20 and −40 ms−1 in June–July. While the SAO is known to occur regularly but with appreciable inter-annual variability (Smith et al., 2020), as we see in Fig. 6, the QBO has an average period of 28 months. We can see this in the temporal evolution of the equatorial 10 hPa winds: in some cases the winds remain westerly for much of June before a shift to the easterly phase, while in 1988 the phase changes from easterly to westerly in July.
Figure 6b and d show the mean and median latitudinal locations of the zero-wind line (zero U) at 1 hPa (Fig 6b) and 10 hPa (Fig 6d). The grey error bars indicate 1 standard deviation (1σ) around the mean latitudinal location. As before, the years 1988, 2002, 2017, and 2019 have been labelled separately.
At 1 hPa, the years 2002, 2017, and 2019 all show significant (beyond 2σ) southward shift of the location where winds turn from westerly to easterly in the meridional direction. While the mean location remains close to the Equator, for 2002, 2017, and 2019 we see a shift to locations between 15 and about 27∘ S. This takes place in June, while for 1988 the shift is seen later, at a time when there is in general more variability, as shown by the large 1σ bar.
At 10 hPa there is not as clear of a shift as at 1 hPa. However, in all cases the latitudinal location where the 10 hPa winds change direction is clearly in the SH poleward range between 18 and 30∘ S in June–July. This could suggest that the SSW events in the SH are sensitive to the timing of the eQBO phase during the polar winter.
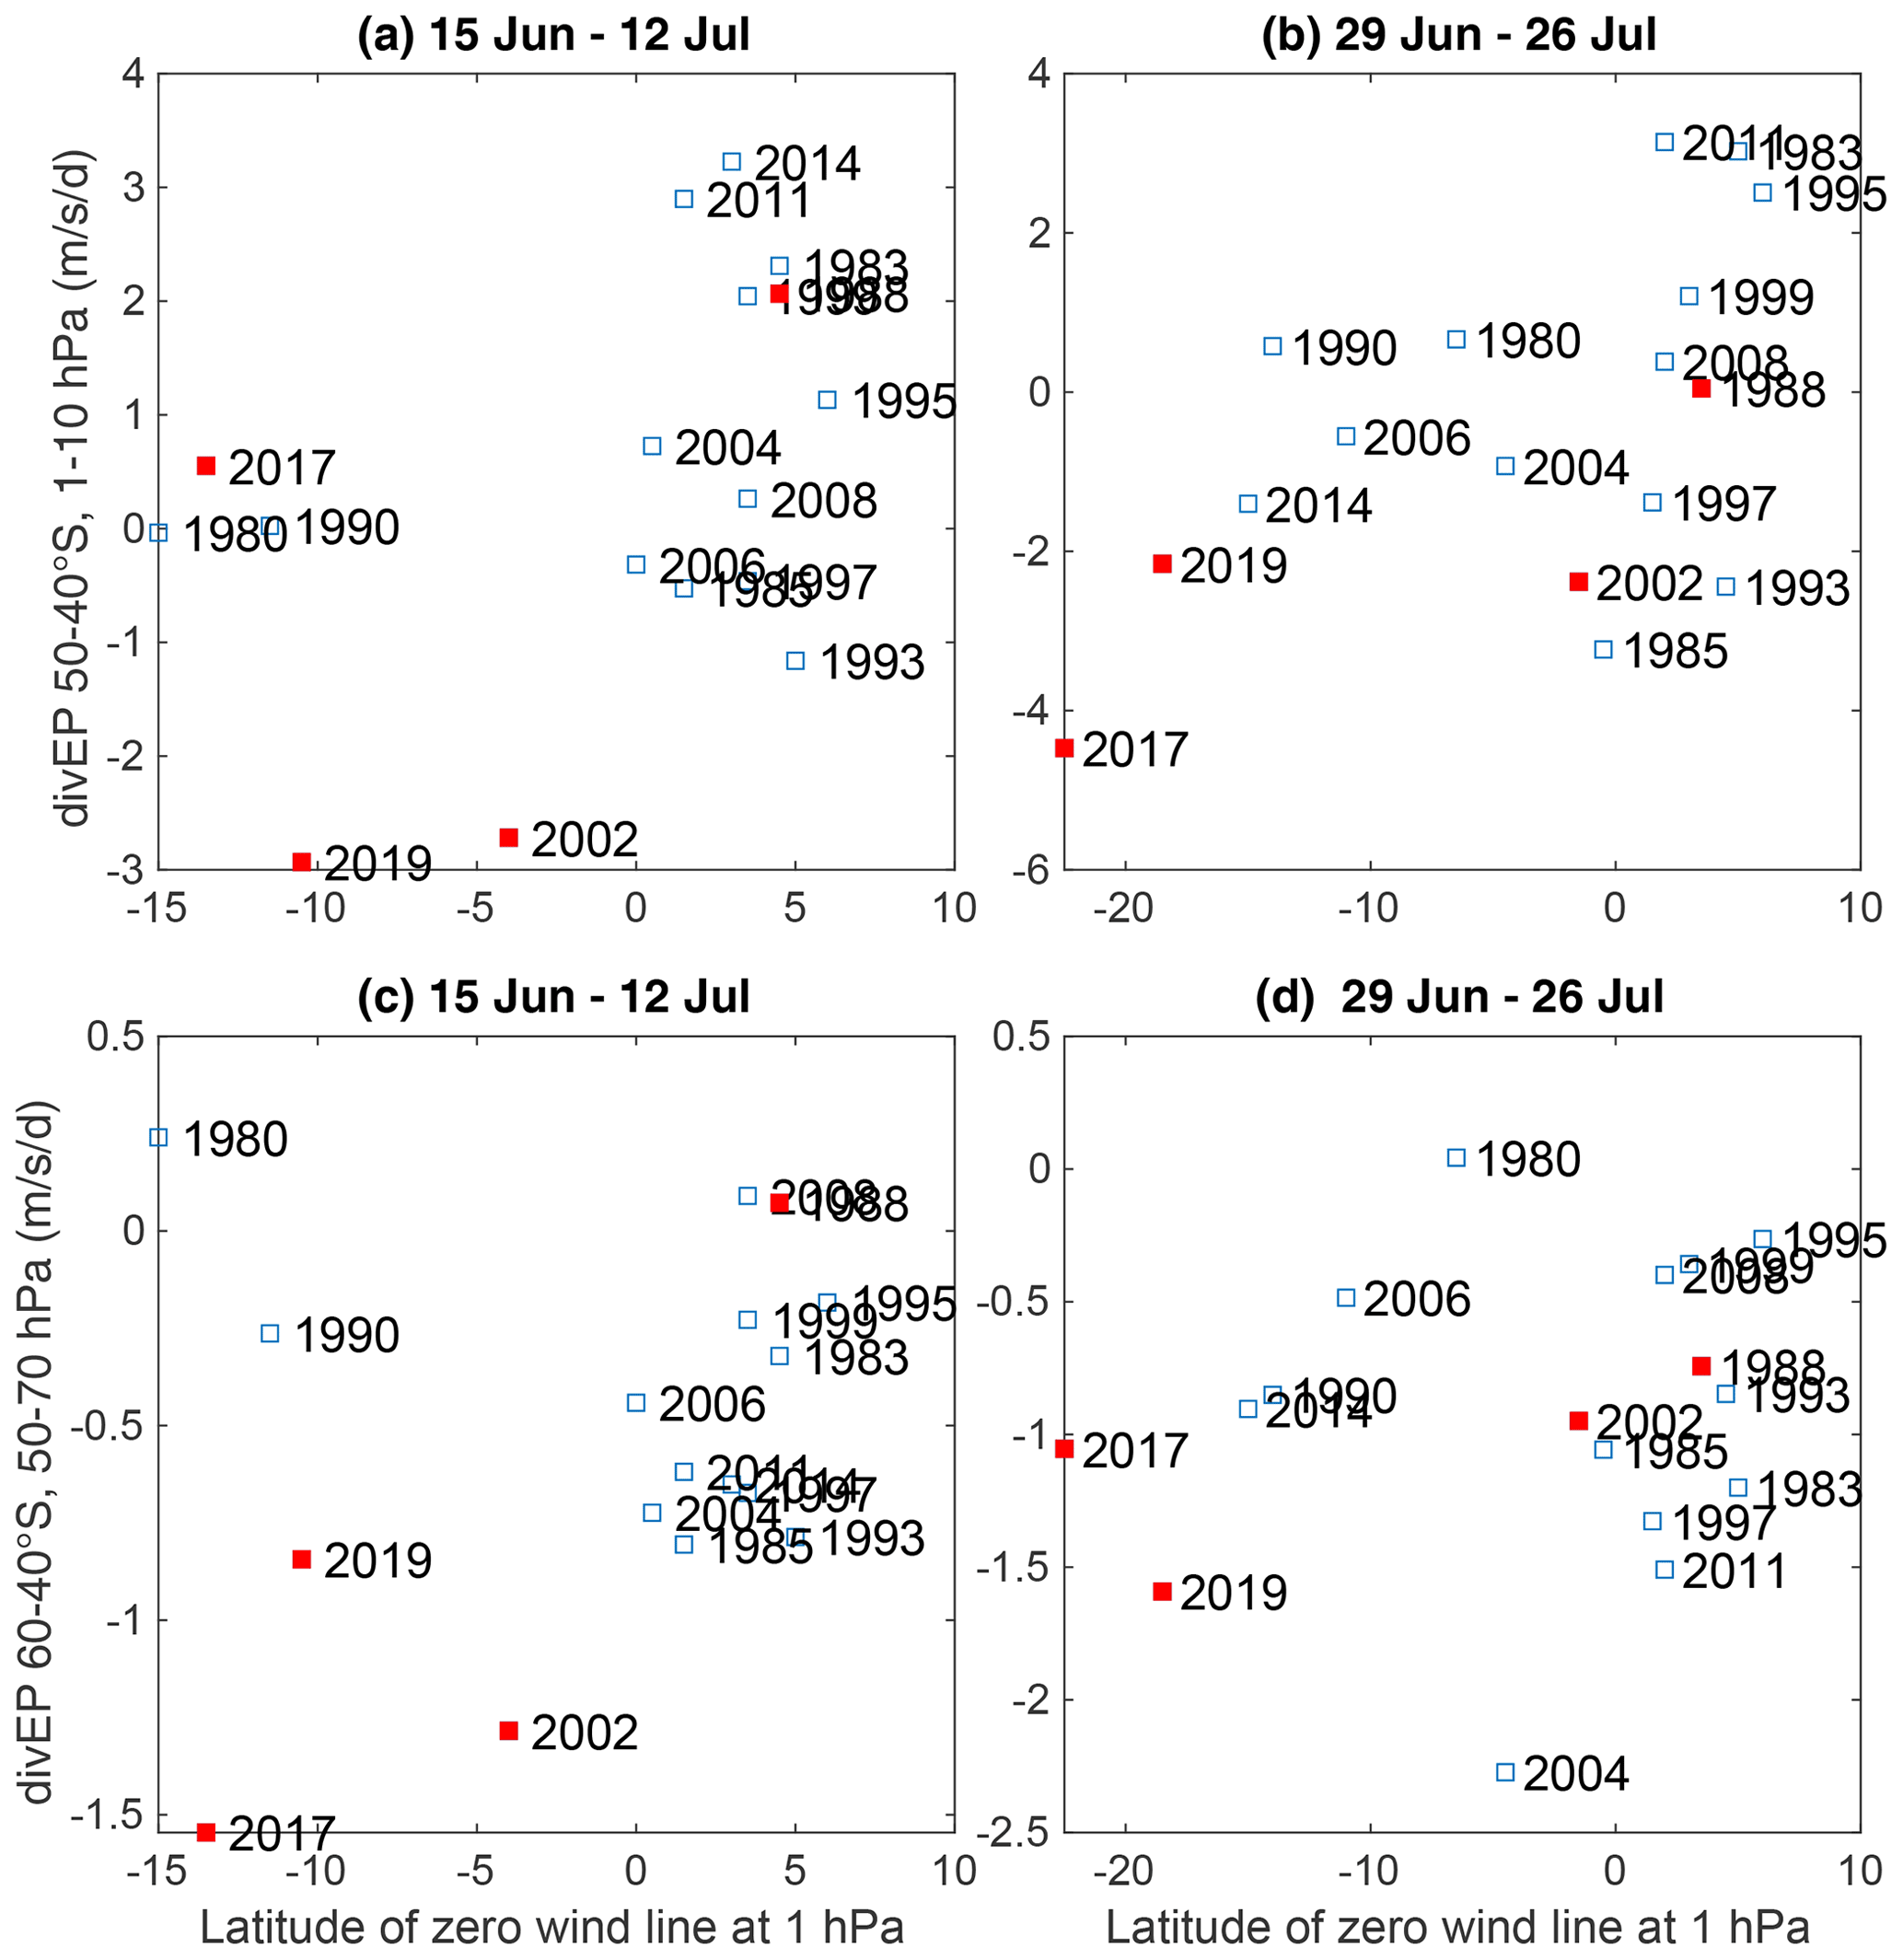
Figure 7Latitude of the zero-wind line (x axis) at 1 hPa level vs. EP flux divergence (divEP, , y axis). The left panels (a, c) show the means for 15 June–12 July, while the right panels (b, d) show the means for 29 June–26 July. In panels (a, b) the mean EP flux divergence is presented for 50–40∘ S and between 1 and 10 hPa, while in panels (c, d) the mean EP flux divergence is for 60–40∘ S and between 50 and 70 hPa.
Considering the shift in the location of the zero-wind line at 1 hPa, we now examine if this could be used with a measure of the wave forcing to identify SH SSW and weak vortex events. Figure 7a shows the upper stratospheric EP flux divergence on the Equator side of the polar vortex edge (see Fig. 1), averaged between 1 and 10 hPa and between 50 and 40∘ S (in units of ) vs. the average latitude of the zero-wind line at 1 hPa. Both variables are averaged from mid-June to mid-July, identified as a potential key timing from Fig. 6. In Fig. 7b the averaging period is shifted by 14 d to 29 June–26 July. Figure 7c and d are analogous to Fig. 7a and b, except now the EP flux divergence is averaged for the lower stratosphere (50–70 hPa), again on the Equator side of the polar vortex edge (60–40∘ S).
In mid-June to mid-July in the upper stratosphere (Fig. 7a) the zero-wind line is located north of the Equator but has moved clearly southward in 2002 and 2019, with EP flux divergence between −3 and −2.5 . We also see a large southward shift of over 10∘ in 1980, 1990, and 2017, but these years no not exhibit similar zonal flow deceleration from wave forcing. As discussed earlier, the year 1980 had the largest amplitude of the SAO zonal wind (Fig. 6), and upon further investigation the year 1990 is also amongst the large June amplitude SAO wind years, with peak wind easterly velocities of 10–15 ms−1. However, both have a changing 10 hPa QBO phase in June, unlike 2002, 2017, and 2019, which show eQBO from start of June. This suggests that the SAO amplitude alone is not sufficient to understand later vortex weakening events but should be viewed in context of the QBO phase in early winter.
Shifting the time period later (Fig. 7b) shows a similar response for the year 2017, with an average zonal flow deceleration of over 4 along with a shift in the zero-wind line latitude to south of 20∘ S.
In the lower stratosphere the early winter period (Fig. 7c) now clearly separates the weak vortex years of 2002, 2017, and 2019 by southward shift of the zero-wind line location accompanied by EP flux convergence. In the later time period (Fig. 7d), we find the years to be much more scattered overall, with no clear distinction of the weak vortex events.
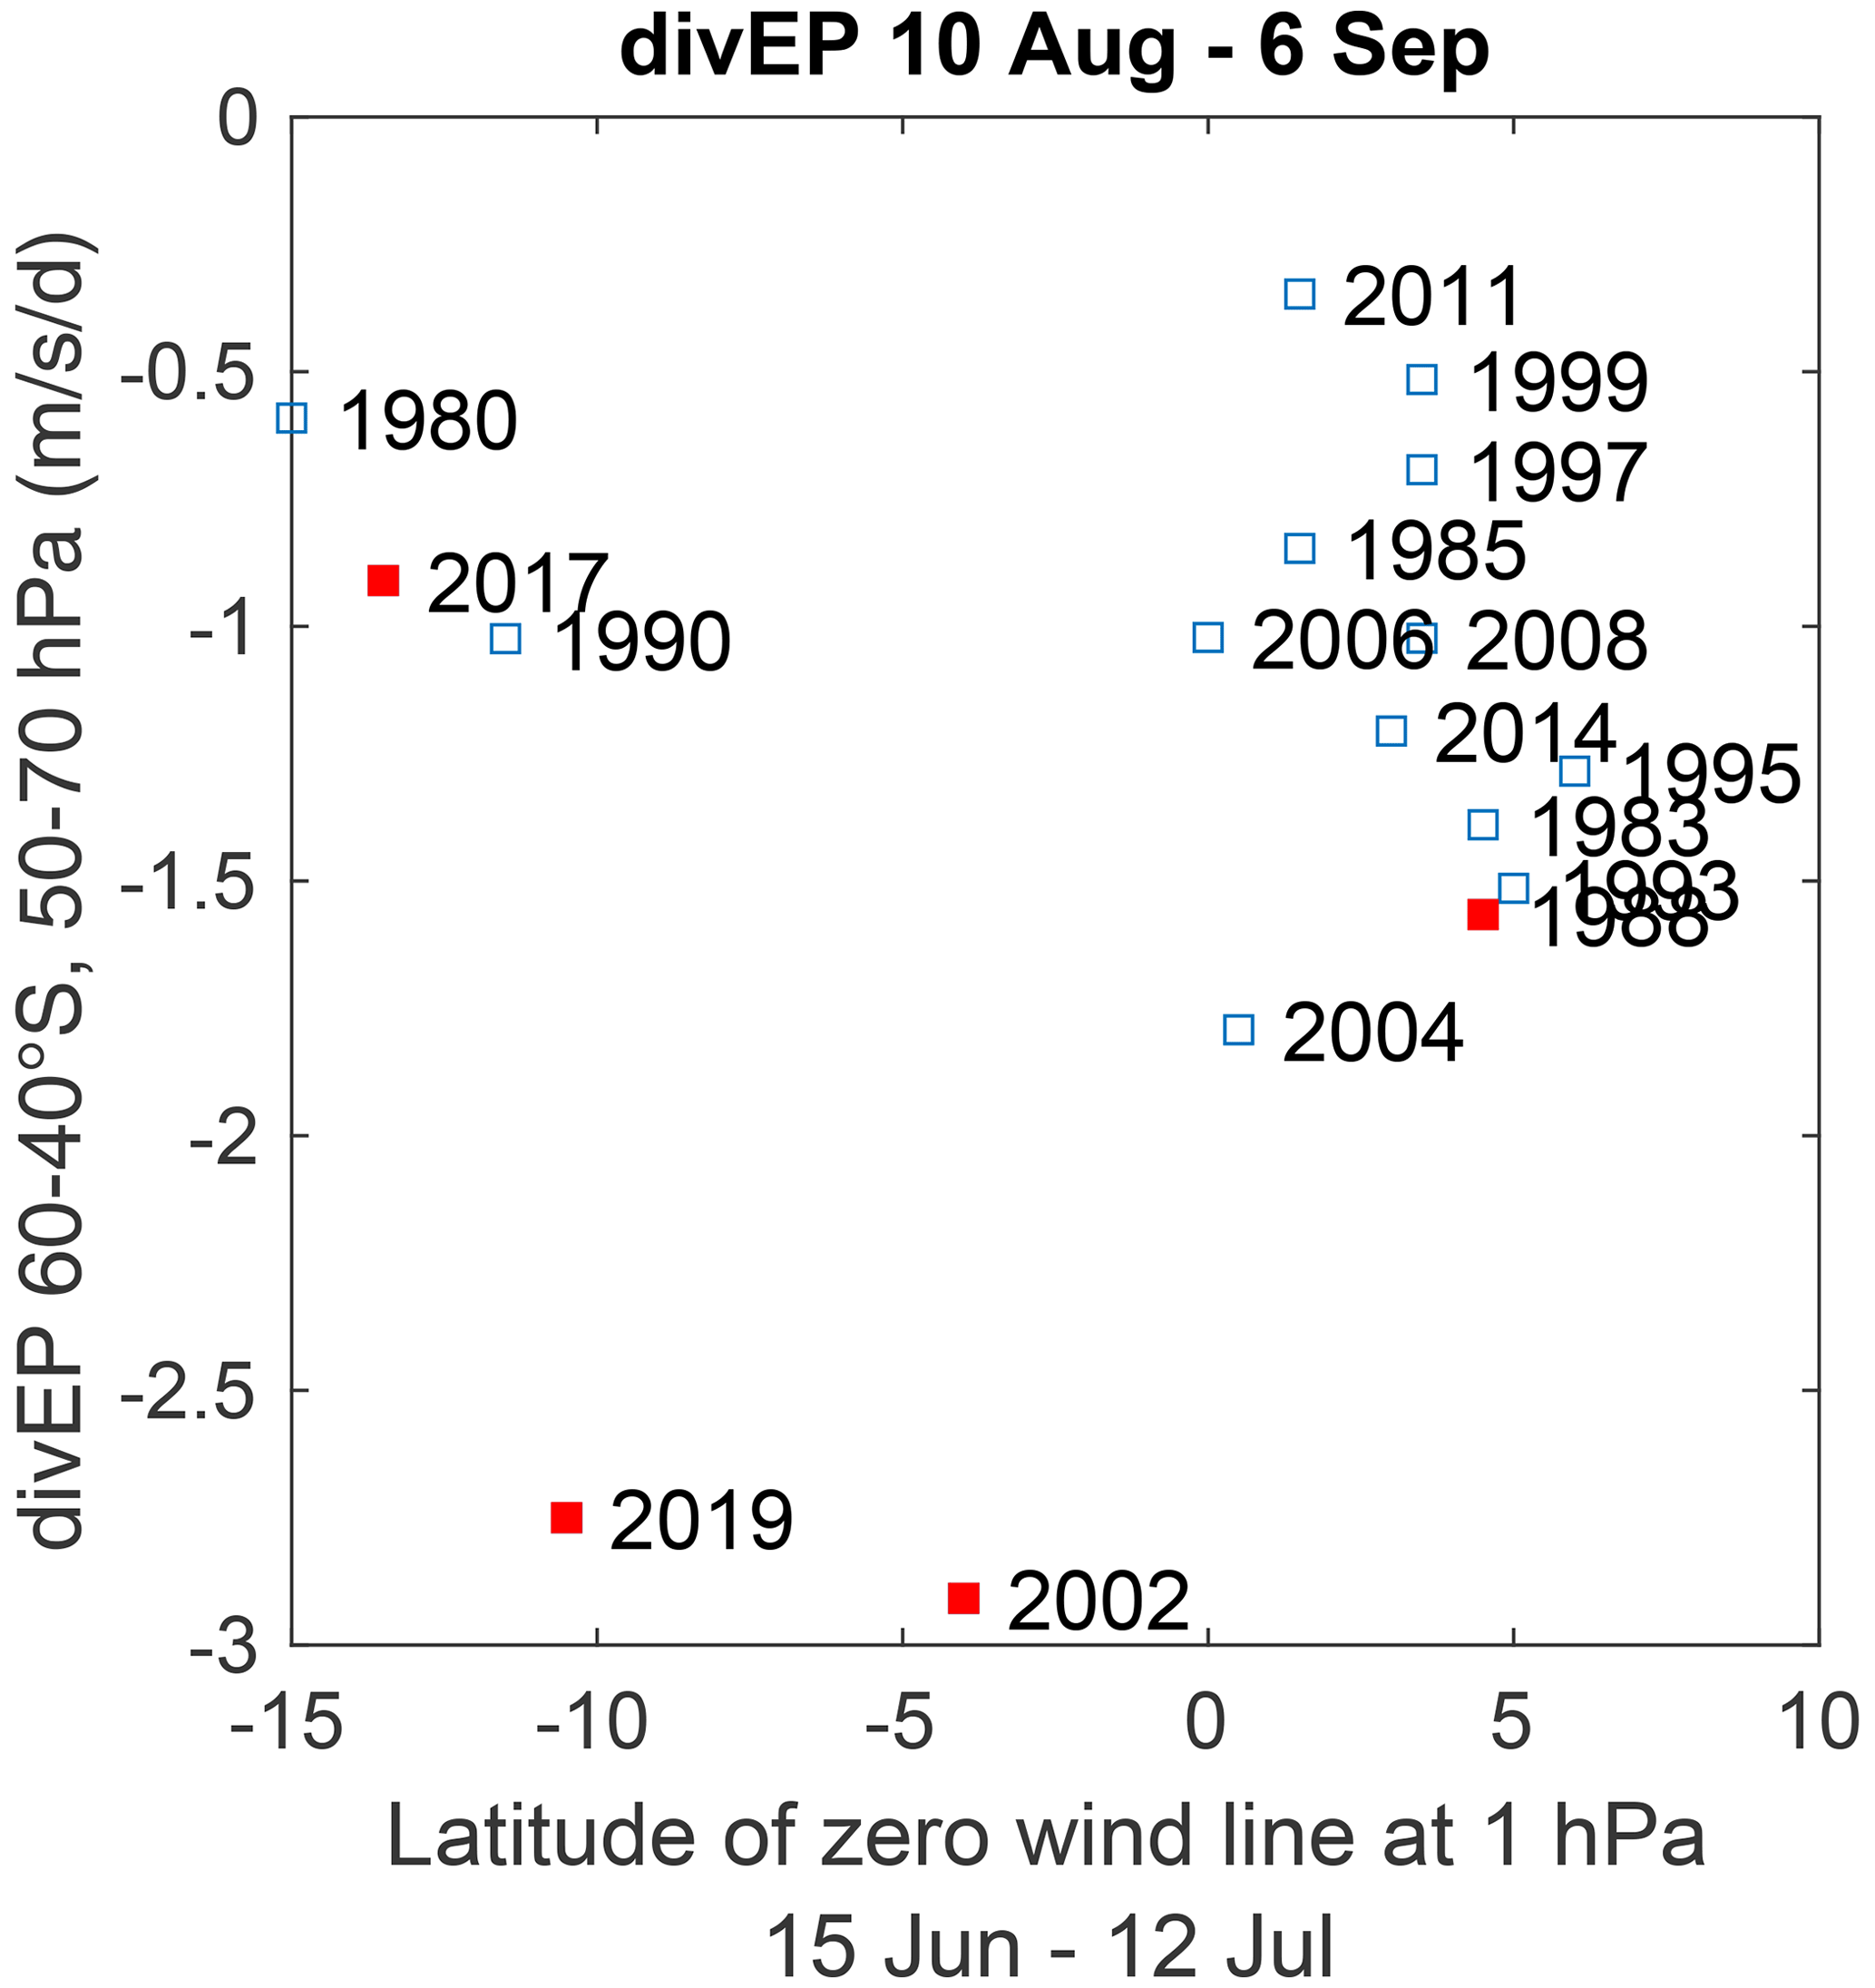
Figure 8The same as Fig. 7c, but the mean EP flux divergence is now for 10 August–6 September.
Finally, we examined if the early winter zero-wind line at 1 hPa could be used to identify the SSW years based on the August–September EP flux divergence in the lower stratosphere. Figure 8 shows the EP flux divergence averaged for the time period of 10 August–6 September, while the zero-wind line time period is 15 June–12 July (same as Fig. 7a and c). We can now see that the years 2002 and 2019 have a very close resemblance to the early winter in the upper stratosphere (Fig. 7a), being clearly separated from the other years both in the zero-wind line location and the wave momentum deposition. However, this is not the case for the weak vortex year of 2017. Kwon et al. (2020) report the 2017 vortex weakening onset date as 22 August. We proceeded to test delayed time periods for the EP flux divergence, as well as the 29 June–26 July period for the zero-wind line, but these did not indicate change beyond the roughly −1 range for the year 2017.
We also tested the used of the 10 hPa zero-wind line location to see if a measure of the eQBO wind pattern horizontal extent would provide similar results (not shown). As could be expected from Fig. 6, this was unsuccessful and the years were simply separated by the difference in EP flux divergence (identical to separation on the y axis in Fig. 7).
While the EP flux convergence in early winter would on its own provide some predictability for later conditions (particularly in the upper stratosphere), the zero-wind line location at 1 hPa appears to add additional separation, particularly when used for the lower stratospheric EP flux divergence (Fig. 7c).
The sudden stratospheric warmings over Antarctica in 2002 and 2019 both have an early winter equatorial SAO- and QBO-like wind pattern interaction and coinciding easterly momentum deposition in the polar atmosphere, as indicated by the EP flux convergence. For both years the SAO is present as a feature of easterly winds (of over 10 ms−1) extending into the SH from early winter. Change in the latitudinal location where winds shift from westerly to easterly influences the waveguide in the upper stratosphere–lower mesosphere, resulting in easterly momentum being deposited on the equatorward side of the polar vortex from early winter. When the QBO and SAO easterly wind features merge, they generate a zero-wind line that stretches from the lower stratosphere into the mesosphere (∼ 30 to 0.3 hPa) near 30∘ S latitude, now modulating the wave guide across the whole vertical range. This feature continues to be extended towards the pole into August, with continued easterly momentum deposition in the polar atmosphere, decelerating the prevailing westerlies on the equatorward side of the polar vortex. In 2002, the zonal-mean zonal winds between about 40 and 60∘ S decelerate down to below 10 hPa, eventually triggering major SSW conditions. In contrast, in 2019 the zonal-mean zonal wind reversal is less focused on specific latitudes, taking place across a wider range of latitudes, and major SSW conditions are not fulfilled. In our zonal-mean analysis, this suggests that vertical wave propagation from the source regions at high latitudes and mid-latitudes is significantly affected, with the movement of the zero-wind line creating a barrier for wave propagation.
We found that the weak vortex years of 1988 and 2017 show a similar SAO and QBO wind pattern like merging in July. However, neither of these years show a poleward shift in the zero-wind line location as early as was seen for 2002 and 2019. Causes of these differences could be investigated further in a detailed study. We note that in 2017, the changes in dynamics were enough to stifle the growth of the ozone hole (Klekociuk et al., 2020). Our analysis of all other years with similar background QBO conditions in MERRA-2 did not reveal similar behaviour, with early winter sustained momentum deposition and similar merging of SAO- and QBO-like easterly wind patterns in early winter.
Recently, Gray et al. (2020) reported that in order to accurately predict NH SSWs in an atmospheric model, it was necessary to constrain the model's global tropospheric winds and temperatures and to further constrain the zonal wind in the equatorial atmosphere above 5 hPa to reanalysis fields. These model results further emphasise those of Gray (2003), who showed similar results for a middle-atmosphere-only model, i.e. that the high-altitude equatorial atmosphere plays an important role in NH SSWs. Although our analysis focuses on the SH SSWs in 2002 and 2019, our results present a possible mechanism for this connection. The early winter equatorial SAO and QBO wind pattern interaction with the simultaneous EP flux convergence, and subsequent modulation of the waveguide, guides mid-latitude waves upward and poleward, resulting in deceleration of the equatorward side of the polar vortex above 100 hPa. The SAO- and QBO-like interaction was not unique to 2019 and 2002 and was found to happen during other easterly QBO years. However the early timing and extent of the zero-wind line poleward shift did not occur in these other years. Our results suggest that this may be a reflection of variations not only in QBO but also in the amplitude and descent of the SAO, the latter of which, to our knowledge, are not well understood (see, e.g. Moss et al., 2016; Kawatani et al., 2020). While we focused particularly in scarce SH SSW and weak vortex events here, the seasonal evolution of the SH polar vortex and predictability of related climate patterns has been investigated by Lim et al. (2018) and Byrne and Shepherd (2018) for example.
We propose that this early winter behaviour may aid in identifying conditions that lead to deceleration of the polar winds, which could then precondition the atmosphere for a SSW. For example, in 2019, when there was enhanced upwards wave flux in August (Shen et al., 2020), the modulated waveguide in the stratosphere and above may have provided further optimal conditions for large disturbance to take place. It may also partially explain why SSWs are less common in the Southern Hemisphere: if the early and large SAO- and QBO-like merging contribute to optimal conditions for SSW, this is dependent not only on the QBO being in the correct phase but also the SAO having a large amplitude during early winter to mid-winter. The SH winter typically experiences smaller-amplitude SAO easterlies, while the NH winter experiences much larger easterly winds (Smith et al., 2017). However, this hypothesis would need to be tested separately for the NH. It is also important to note again that the NH has higher winter planetary wave activity and variability than the SH.
As we find that these early patterns start occurring 2–3 months before the SSW or vortex weakening events, the behaviour of the equatorial middle atmosphere along with the polar response at this stage may signal an imminent SSW event, potentially providing predictability beyond the typical 10–15 d window in SSW prediction in the NH (Domeisen et al., 2020), with some signals possibly appearing as early as 30 d in advance (Lawrence and Manney, 2020). As reported by Rao et al. (2020c), for the 2019 SH minor SSW, the predictive limit from forecast models was 18 d. The results reported here could potentially aid subseasonal to seasonal (S2S) prediction (Domeisen et al., 2019a, 2020). However, as the motivation for this study was to better understand early signals for the 2019 SH event, this will need to be tested in detail for the NH atmosphere first. We note that the results presented by Gray et al. (2020) (their Fig. 3–4) suggest that coupling of the SAO and QBO zonal wind patterns, similar to our SH cases, took place in their simulation approximately 2 months before the onset of the NH January 2009 SSW. As noted by Gray et al. (2020), the atmospheric region where the SAO originates (mesosphere) tends to be neglected in model development. Our results provide further evidence that these altitudes are not only important for understanding the NH but also the SH extreme dynamical events. As noted by the multi-model study of Rao et al. (2020b), representation of the QBO is also remains a challenge.
As mentioned earlier, much work has been done in understanding both causes and implications of SSWs, particularly in the NH. Many interactions with large-scale atmospheric modes or external forcing have been found to influence NH SSW occurrence, including the QBO, the ENSO, solar cycle, and the MJO. Due to the scarcity of SH SSW events, we were unable to investigate the potential individual influences of these. However, we note that ENSO conditions, based on the Multivariate ENSO Index (MEI v2, Zhang et al., 2019; NOAA, 2020), were neutral, while the MJO index amplitude (Wheeler and Hendon, 2004; NOAA, 2021) was positive, during both 2002 and 2019. Note that the MJO index amplitude corresponds to , as defined by Wheeler and Hendon (2004), and does not account for the MJO phase. For the weak vortex years of 1988 and 2017, the MJO was generally variable during the austral winter, while the ENSO index was negative and thus opposite to the two generally recognised SSW years.
Sudden stratospheric warmings are disruptions to the seasonal cycle of the polar winds. Only two well-documented events of this type have occurred over Antarctica: a major SSW in 2002 and a minor one in 2019, although Kwon et al. (2020) have noted an increasing trend in the number of southern stratospheric polar vortex weakening events in the last 2 decades. Here we present results based on the MERRA-2 reanalysis, showing the following events during both years (2002 and 2019).
-
From early winter, waves deposit momentum in the equatorward side of the upper stratospheric–lower mesospheric polar vortex in a manner that is consistent with the equatorial upper stratospheric SAO-like wind structure pushing the waveguide boundary into the SH extratropics.
-
In early winter, SAO- and QBO-like wind patterns merge in the equatorial atmosphere, driving further momentum deposition, and thus zonal wind deceleration, in the polar vortex.
-
Changing zonal wind further influences wave propagation conditions, ultimately transferring the signal to the lower stratosphere, likely contributing to favourable propagation conditions for enhanced tropospheric wave forcing later in the winter, resulting in the observed SSWs.
The years 2002, 2019, and the early onset vortex weakening event year of 2017 all depict some of the highest easterly equatorial upper stratospheric SAO zonal-mean zonal winds () in June. These are accompanied by a significant (> 2σ) southward shift of the latitudinal location where zonal winds reverse direction from (polar) westerly to (equatorial) easterly. Along with the high-amplitude SAO winds, these years also show easterly 10 hPa QBO throughout June (−35 ms−1 < U10 hPa < −20 ms−1), suggesting that the SAO amplitude alone is not sufficient to understand these SH vortex weakening events, but the QBO phase in early winter also plays a role.
Previous work focused on the more frequent NH SSWs has pointed to the role of the equatorial upper stratosphere and mesosphere, particularly when predicting the timings of NH SSW (Gray et al., 2020). Our analysis of the two SH SSWs suggest, at least for the Southern Hemisphere, that the merging of the eQBO and the SAO-like wind patterns in the equatorial upper stratosphere–mesosphere seems critical in triggering the polar disturbances. The wind pattern in 2002 and 2019 is not unique; however, this occurs much earlier in the season than other easterly QBO years, leading to early winter deposition of momentum, as indicated by the EP flux divergence, that decelerates the winds in the equatorward side of the polar vortex by −3 to −2.5 from mid-June onwards.
When considering the early winter EP flux divergence together with the latitudinal location of the zero-wind line at 1 hPa, we were able to identify the SSW and early onset vortex weakening event years up to 60 d before the events. We postulate that this early winter behaviour may be a key physical process in decelerating the polar vortex winds, leading to preconditioning of the polar atmosphere for a SSW. The occurrence of these patterns in the equatorial atmosphere and in the polar upper atmosphere during early winter could provide extended predictability of SSWs from the typical 10–18 d window (Domeisen et al., 2020; Lawrence and Manney, 2020; Rao et al., 2020c).
As our present analysis is focused on events that took place in the SH, further work would be needed to test to what extent these SAO- and QBO-like patterns might play a role in NH SSWs. This future work may help shed light on the different roles background flow and wave enhancement have on triggering the SH and NH SSWs.
The MERRA-2 dataset is freely available at https://doi.org/10.5067/A7S6XP56VZWS (Global Modeling and Assimilation Office (GMAO), 2015). The ENSO Index MEI v2 (Zhang et al., 2019) is freely available at https://psl.noaa.gov/enso/mei/ (NOAA, 2020). The MJO index (Wheeler and Hendon, 2004) is freely available at https://www.cpc.ncep.noaa.gov/products/precip/CWlink/MJO/whindex.shtml (NOAA, 2021).
The supplement related to this article is available online at: https://doi.org/10.5194/acp-21-12835-2021-supplement.
AS and VJN planned the study, analysed the MERRA-2 data, and contributed to the writing of the article.
The authors declare that they have no conflict of interest.
Publisher's note: Copernicus Publications remains neutral with regard to jurisdictional claims in published maps and institutional affiliations.
We are grateful for the open access to the MERRA-2 reanalysis data products provided by GES DISC. The work of Viktoria J. Nordström has been supported by a postgraduate scholarship provided by the University of Otago Physics Department.
This paper was edited by Martin Dameris and reviewed by Anne Smith and three anonymous referees.
Albers, J. R. and Birner, T.: Vortex Preconditioning due to Planetary and Gravity Waves prior to Sudden Stratospheric Warmings, J. Atmos. Sci., 71, 4028–4054, https://doi.org/10.1175/jas-d-14-0026.1, 2014. a
Allen, D. R., Bevilacqua, R. M., Nedoluha, G. E., Randall, C. E., and Manney, G. L.: Unusual stratospheric transport and mixing during the 2002 Antarctic winter, Geophys. Res. Lett., 30, 1599, https://doi.org/10.1029/2003GL017117, 2003. a
Anstey, J. A. and Shepherd, T. G.: High-latitude influence of the quasi-biennial oscillation, Q. J. Roy. Meteor. Soc., 140, 1–21, https://doi.org/10.1002/qj.2132, 2014. a
Baldwin, M. P. and Dunkerton, T. J.: Stratospheric Harbingers of Anomalous Weather Regimes, Science, 294, 581–584, https://doi.org/10.1126/science.1063315, 2001. a
Baldwin, M. P., Gray, L. J., Dunkerton, T. J., Hamilton, K., Haynes, P. H., Randel, W. J., Holton, J. R., Alexander, M. J., Hirota, I., Horinouchi, T., Jones, D. B. A., Kinnersley, J. S., Marquardt, C., Sato, K., and Takahashi, M.: The quasi-biennial oscillation, Rev. Geophys., 39, 179–229, https://doi.org/10.1029/1999RG000073, 2001. a, b
Baldwin, M. P., Ayarzagüena, B., Birner, T., Butchart, N., Butler, A. H., Charlton-Perez, A. J., Domeisen, D. I. V., Garfinkel, C. I., Garny, H., Gerber, E. P., Hegglin, M. I., Langematz, U., and Pedatella, N. M.: Sudden Stratospheric Warmings, Rev. Geophys., 59, e2020RG000708, https://doi.org/10.1029/2020RG000708, 2021. a, b, c
Bosilovich, M. G., Lucchesi, R., and Suarez, M.: 2016: MERRA-2: File Specification. GMAO Office Note No. 9 (Version 1.1), Tech. rep., Global Modeling and Assimilation Office Earth Sciences Division NASA Goddard Space Flight Center, Greenbelt, Maryland 20771, http://gmao.gsfc.nasa.gov/pubs/office_notes (last access: 24 November 2020), 2016. a
Bracegirdle, T. J.: The seasonal cycle of stratosphere-troposphere coupling at southern high latitudes associated with the semi-annual oscillation in sea-level pressure, Clim. Dynam., 37, 2323–2333, https://doi.org/10.1007/s00382-011-1014-4, 2011. a
Byrne, N. J. and Shepherd, T. G.: Seasonal persistence of circulation anomalies in the Southern Hemisphere stratosphere, and its implications for the troposphere, J. Climate, 31, 3467–3483, https://doi.org/10.1175/jcli-d-17-0557.1, 2018. a
Charlton, A. J. and Polvani, L. M.: A New Look at Stratospheric Sudden Warmings. Part I: Climatology and Modeling Benchmarks, J. Climate, 20, 449–469, https://doi.org/10.1175/JCLI3996.1, 2007. a, b
Coy, L., Wargan, K., Molod, A. M., McCarty, W. R., and Pawson, S.: Structure and Dynamics of the Quasi-Biennial Oscillation in MERRA-2, J. Climate, 29, 5339–5354, https://doi.org/10.1175/JCLI-D-15-0809.1, https://doi.org/10.1175/JCLI-D-15-0809.1, 2016. a, b
de la Cámara, A., Birner, T., and Albers, J. R.: Are Sudden Stratospheric Warmings Preceded by Anomalous Tropospheric Wave Activity?, J. Climate, 32, 7173–7189, https://doi.org/10.1175/jcli-d-19-0269.1, 2019. a
Doddridge, E. W. and Marshall, J.: Modulation of the Seasonal Cycle of Antarctic Sea Ice Extent Related to the Southern Annular Mode, Geophys. Res. Lett., 44, 9761–9768, https://doi.org/10.1002/2017GL074319, 2017. a
Domeisen, D. I. V., Butler, A. H., Perez, A. J. C., Ayarzagüena, B., Baldwin, M. P., Sigouin, E. D., Furtado, J. C., Garfinkel, C. I., Hitchcock, P., Karpechko, A. Y., Kim, H., Knight, J. R., Lang, A. L., Lim, E. P., Marshall, A., Roff, G., Schwartz, C., Simpson, I. R., Son, S.-W., and Taguchi, M.: The role of the stratosphere in subseasonal to seasonal prediction Part II: Predictability arising from stratosphere - troposphere coupling, J. Geophys. Res.-Atmos., 125, e2019JD030923 , https://doi.org/10.1029/2019JD030923, 2019a. a
Domeisen, D. I. V., Garfinkel, C. I., and Butler, A. H.: The Teleconnection of El Ni no Southern Oscillation to the Stratosphere, Rev. Geophys., 57, 5–47, https://doi.org/10.1029/2018RG000596, 2019b. a
Domeisen, D. I. V., Butler, A. H., Perez, A. J. C., Ayarzagüena, B., Baldwin, M. P., Sigouin, E. D., Furtado, J. C., Garfinkel, C. I., Hitchcock, P., Karpechko, A. Y., Kim, H., Knight, J. R., Lang, A. L., Lim, E. P., Marshall, A., Roff, G., Schwartz, C., Simpson, I. R., Son, S.-W., and Taguchi, M.: The Role of the Stratosphere in Subseasonal to Seasonal Prediction: 1. Predictability of the Stratosphere, J. Geophys. Res.-Atmos., 125, e2019JD030920, https://doi.org/10.1029/2019jd030920, 2020. a, b, c
Edmon, H. J., Hoskins, B. J., and McIntyre, M. E.: Eliassen–Palm Cross Sections for the Troposphere, J. Atmos. Sci., 37, 2600–2616, 1980. a
Eswaraiah, S., Kim, Y. H., Hong, J., Kim, J.-H., Ratnam, M. V., Chandran, A., Rao, S., and Riggin, D.: Mesospheric signatures observed during 2010 minor stratospheric warming at King Sejong Station (62∘ S, 59∘ W), J. Atmos. Sol.-Terr. Phy., 140, 55–64, https://doi.org/10.1016/j.jastp.2016.02.007, 2016. a, b
Eswaraiah, S., Kim, Y. H., Lee, J., Ratnam, M. V., and Rao, S. V. B.: Effect of Southern Hemisphere Sudden Stratospheric Warmings on Antarctica Mesospheric Tides: First Observational Study, J. Geophys. Res.-Space, 123, 2127–2140, https://doi.org/10.1002/2017JA024839, 2018. a
Eswaraiah, S., Kim, J.-H., Lee, W., Hwang, J., Kumar, K. N., and Kim, Y. H.: Unusual Changes in the Antarctic Middle Atmosphere During the 2019 Warming in the Southern Hemisphere, Geophys. Res. Lett., 47, e2020GL08919, https://doi.org/10.1029/2020GL089199, 2020a. a, b, c
Eswaraiah, S., Lee, C., Lee, W., Kim, Y. H., Kumar, K. N., and Medineni, V. R.: Temperature tele-connections between the tropical and polar middle atmosphere in the Southern Hemisphere during the 2010 minor sudden stratospheric warming, Atmos. Sci. Lett., 22, e1010, https://doi.org/10.1002/asl.1010, 2020b. a
Garcia, R. R., Dunkerton, T. J., Lieberman, R. S., and Vincent, R. A.: Climatology of the semiannual oscillation of the tropical middle atmosphere, J. Geophys. Res.-Atmos., 102, 26019–26032, https://doi.org/10.1029/97JD00207, 1997. a, b
Gelaro, R., McCarty, W., Suárez, M. J., Todling, R., Molod, A., Takacs, L., Randles, C. A., Darmenov, A., Bosilovich, M. G., Reichle, R., Wargan, K., Coy, L., Cullather, R., Draper, C., Akella, S., Buchard, V., Conaty, A., Silva, A. M. D., Gu, W., Kim, G.-K., Koster, R., Lucchesi, R., Merkova, D., Nielsen, J. E., Partyka, G., Pawson, S., Putman, W., Rienecker, M., Schubert, S. D., Sienkiewicz, M., and Zhao, B.: The Modern-Era Retrospective Analysis for Research and Applications, Version 2 (MERRA-2), J. Climate, 30, 5419–5454, https://doi.org/10.1175/JCLI-D-16-0758.1, 2017. a
Global Modeling and Assimilation Office (GMAO): MERRA-2 inst6_3d_ana_Np: 3d,6-Hourly,Instantaneous,Pressure-Level,Analysis,Analyzed Meteorological Fields V5.12.4, Goddard Earth Sciences Data and Information Services Center (GES DISC) [data set], Greenbelt, MD, USA, https://doi.org/10.5067/A7S6XP56VZWS, 2015. a
Gray, L.: The influence of the equatorial upper stratosphere on stratospheric sudden warmings, Geophys. Res. Lett., 30, 1166, https://doi.org/10.1029/2002GL016430, 2003. a
Gray, L. J., Brown, M. J., Knight, J., Andrews, M., Lu, H., O'Reilly, C., and Anstey, J.: Forecasting extreme stratospheric polar vortex events, Nat. Commum., 11, 4630, https://doi.org/10.1038/s41467-020-18299-7, 2020. a, b, c, d, e, f
Holton, J. R. and Tan, H.-C.: The Influence of the Equatorial Quasi-Biennial Oscillation on the Global Circulation at 50 mb, J. Atmos. Sci., 37, 2200–2208, https://doi.org/10.1175/1520-0469(1980)037<2200:TIOTEQ>2.0.CO;2, 1980. a
Hoppel, K., Bevilacqua, R., Allen, D., Nedoluha, G., and Randall, C.: POAM III observations of the anomalous 2002 Antarctic ozone hole, Geophys. Res. Lett., 30, 1394, https://doi.org/10.1029/2003GL016899, 2003. a
Kanzawa, H. and Kawaguchi, S.: Large stratospheric sudden warming in Antarctic late winter and shallow ozone hole in 1988, Geophys. Res. Lett., 17, 77–80, https://doi.org/10.1029/GL017i001p00077, 1990. a, b
Kawatani, Y., Hirooka, T., Hamilton, K., Smith, A. K., and Fujiwara, M.: Representation of the equatorial stratopause semiannual oscillation in global atmospheric reanalyses, Atmos. Chem. Phys., 20, 9115–9133, https://doi.org/10.5194/acp-20-9115-2020, 2020. a, b, c, d, e, f, g, h
Klekociuk, A., Tully, M., Krummel, P., Kravchenko, V., Henderson, S., Alexander, S., Querel, R., Nichol, S., Smale, D., Milinevsky, G., Grytsai, A., Fraser, P., Xiangdong, Z., Gies, H., Schofield, R., and Shanklin, J.: The Antarctic ozone hole during 2017, Journal of Southern Hemisphere Earth Systems Science, 69, 29–51, https://doi.org/10.1071/ES19019, 2020. a, b, c
Kuai, L., Shia, R.-L., Jiang, X., Tung, K. K., and Yung, Y. L.: Nonstationary Synchronization of Equatorial QBO with SAO in Observations and a Model, J. Atmos. Sci., 66, 1654–1664, https://doi.org/10.1175/2008JAS2857.1, 2009. a
Kwon, H., Choi, H., Kim, B.-M., Kim, S.-W., and Kim, S.-J.: Recent weakening of the southern stratospheric polar vortex and its impact on the surface climate over Antarctica, Environ. Res. Lett., 15, 094072, https://doi.org/10.1088/1748-9326/ab9d3d, 2020. a, b, c, d, e, f
Labitzke, K.: On the solar cycle–QBO relationship: a summary, J. Atmos. Sol.-Terr. Phy., 67, 45–54, https://doi.org/10.1016/j.jastp.2004.07.016, 2005. a
Lawrence, Z. D. and Manney, G. L.: Does the Arctic Stratospheric Polar Vortex Exhibit Signs of Preconditioning Prior to Sudden Stratospheric Warmings?, J. Atmos. Sci., 77, 611–632, https://doi.org/10.1175/JAS-D-19-0168.1, 2020. a, b
Lim, E.-P., Hendon, H. H., and Thompson, D. W. J.: Seasonal Evolution of Stratosphere-Troposphere Coupling in the Southern Hemisphere and Implications for the Predictability of Surface Climate, J. Geophys. Res.-Atmos., 123, 12002–12016, https://doi.org/10.1029/2018JD029321, 2018. a
Lim, E. P., Hendon, H. H., Boschat, G., Hudson, D., Thompson, D. W. J., Dowdy, A. J., and Arblaster, J. M.: Australian hot and dry extremes induced by weakenings of the stratospheric polar vortex, Nat. Geosci., 12, 896–901, https://doi.org/10.1038/s41561-019-0456-x, 2019. a
Matsuno, T.: A Dynamical Model of the Stratospheric Sudden Warming, J. Atmos. Sci., 28, 1479–1494, https://doi.org/10.1175/1520-0469(1971)028<1479:ADMOTS>2.0.CO;2, 1971. a
Moss, A. C., Wright, C. J., Davis, R. N., and Mitchell, N. J.: Gravity-wave momentum fluxes in the mesosphere over Ascension Island (8∘ S, 14∘ W) and the anomalous zonal winds of the semi-annual oscillation in 2002, Ann. Geophys., 34, 323–330, https://doi.org/10.5194/angeo-34-323-2016, 2016. a
NOAA: Multivariate ENSO Index Version 2 (MEI.v2), Physical Sciences Laboratory [data set], available at: https://psl.noaa.gov/enso/mei/, last access: 3 December 2020. a, b
NOAA: Madden–Julian oscillation index (MJO), Climate Prediction Center [data set], available at: https://www.cpc.ncep.noaa.gov/products/precip/CWlink/MJO/whindex.shtml, last access: 24 May 2021. a, b
Pascoe, C. L., Gray, L. J., and Scaife, A. A.: A GCM study of the influence of equatorial winds on the timing of sudden stratospheric warmings, Geophys. Res. Lett., 33, L06825, https://doi.org/10.1029/2005GL024715, 2006. a, b
Peña-Ortiz, C., Schmidt, H., Giorgetta, M. A., and Keller, M.: QBO modulation of the semiannual oscillation in MAECHAM5 and HAMMONIA, J. Geophys. Res.-Atmos., 115, D21106, https://doi.org/10.1029/2010JD013898, 2010. a
Rao, J., Garfinkel, C. I., Chen, H., and White, I. P.: The 2019 New Year Stratospheric Sudden Warming and Its Real-Time Predictions in Multiple S2S Models, J. Geophys. Res.-Atmos., 124, 11155–11174, https://doi.org/10.1029/2019jd030826, 2019. a
Rao, J., Garfinkel, C. I., and White, I. P.: Predicting the Downward and Surface Influence of the February 2018 and January 2019 Sudden Stratospheric Warming Events in Subseasonal to Seasonal (S2S) Models, J. Geophys. Res.-Atmos., 125, e2019JD031919, https://doi.org/10.1029/2019jd031919, 2020a. a
Rao, J., Garfinkel, C. I., and White, I. P.: How does the Quasi-Biennial Oscillation affect the boreal winter tropospheric circulation in CMIP5/6 models?, J. Climate, 33, 1–54, https://doi.org/10.1175/jcli-d-20-0024.1, 2020b. a
Rao, J., Garfinkel, C. I., White, I. P., and Schwartz, C.: The Southern Hemisphere Minor Sudden Stratospheric Warming in September 2019 and its Predictions in S2S Models, J. Geophys. Res.-Atmos., 125, e2020JD032723, https://doi.org/10.1029/2020JD032723, 2020c. a, b, c, d, e, f, g
Ricaud, P., Lefèvre, F., Berthet, G., Murtagh, D., Llewellyn, E. J., Mégie, G., Kyrölä, E., Leppelmeier, G. W., Auvinen, H., Boonne, C., Brohede, S., Degenstein, D. A., de La Noë, J., Dupuy, E., El Amraoui, L., Eriksson, P., Evans, W. F. J., Frisk, U., Gattinger, R. L., Girod, F., Haley, C. S., Hassinen, S., Hauchecorne, A., Jimenez, C., Kyrö, E., Lautié, N., Le Flochmoën, E., Lloyd, N. D., McConnell, J. C., McDade, I. C., Nordh, L., Olberg, M., Pazmino, A., Petelina, S. V., Sandqvist, A., Seppälä, A., Sioris, C. E., Solheim, B. H., Stegman, J., Strong, K., Taalas, P., Urban, J., von Savigny, C., von Scheele, F., and Witt, G.: Polar vortex evolution during the 2002 Antarctic major warming as observed by the Odin satellite, J. Geophys. Res.-Atmos., 110, D05302, https://doi.org/10.1029/2004JD005018, 2005. a
Richter, J. H., Matthes, K., Calvo, N., and Gray, L. J.: Influence of the quasi-biennial oscillation and El Ni no–Southern Oscillation on the frequency of sudden stratospheric warmings, J. Geophys. Res.-Atmos., 116, D20111, https://doi.org/10.1029/2011JD015757, 2011. a
Schoeberl, M. R., Stolarski, R. S., and Krueger, A. J.: The 1988 Antarctic ozone depletion: Comparison with previous year depletions, Geophys. Res. Lett., 16, 377–380, https://doi.org/10.1029/GL016i005p00377, 1989. a, b
Schwartz, C. and Garfinkel, C. I.: Relative roles of the MJO and stratospheric variability in North Atlantic and European winter climate, J. Geophys. Res.-Atmos., 122, 4184–4201, https://doi.org/10.1002/2016JD025829, 2017. a
Shen, X., Wang, L., and Osprey, S.: The Southern Hemisphere sudden stratospheric warming of September 2019, Sci. Bull., 65, 1800–1802, https://doi.org/10.1016/j.scib.2020.06.028, 2020. a, b, c, d
Smith, A. K., Garcia, R. R., Moss, A. C., and Mitchell, N. J.: The Semiannual Oscillation of the Tropical Zonal Wind in the Middle Atmosphere Derived from Satellite Geopotential Height Retrievals, J. Atmos. Sci., 74, 2413–2425, https://doi.org/10.1175/jas-d-17-0067.1, 2017. a, b
Smith, A. K., Holt, L. A., Garcia, R. R., Anstey, J. A., Serva, F., Butchart, N., Osprey, S., Bushell, A. C., Kawatani, Y., Kim, Y.-H., Lott, F., Braesicke, P., Cagnazzo, C., Chen, C.-C., Chun, H.-Y., Gray, L., Kerzenmacher, T., Naoe, H., Richter, J., Versick, S., Schenzinger, V., Watanabe, S., and Yoshida, K.: The equatorial stratospheric semiannual oscillation and time-mean winds in QBOi models, Q. J. Roy. Meteor. Soc., pp. 1–17, https://doi.org/10.1002/qj.3690, 2020. a, b, c
Solomon, S.: Stratospheric ozone depletion: A review of concepts and history, Rev. Geophys., 37, 275–316, https://doi.org/10.1029/1999RG900008, 1999. a
Solomon, S., Garcia, R. R., Rowland, F. S., and Wuebbles, D. J.: On the depletion of Antarctic ozone, Nature, 321, 755–758, https://doi.org/10.1038/321755a0, 1986. a
Taguchi, M. and Hartmann, D. L.: Interference of extratropical surface climate anomalies induced by El Ni no and stratospheric sudden warmings, Geophys. Res. Lett., 32, L04709, https://doi.org/10.1029/2004GL022004, 2005. a
Thompson, D. W. J., Baldwin, M. P., and Solomon, S.: Stratosphere–Troposphere Coupling in the Southern Hemisphere, J. Atmos. Sci., 62, 708–715, https://doi.org/10.1175/jas-3321.1, 2005. a, b
Watson, P. A. G. and Gray, L. J.: How does the quasi-biennial oscillation affect the stratospheric polar vortex?, J. Atmos. Sci., 71, 391–409, https://doi.org/10.1175/JAS-D-13-096.1, 2014. a
Wheeler, M. C. and Hendon, H. H.: An All-Season Real-Time Multivariate MJO Index: Development of an Index for Monitoring and Prediction, Mon. Weather Rev., 132, 1917–1932, https://doi.org/10.1175/1520-0493(2004)132<1917:AARMMI>2.0.CO;2, 2004. a, b, c, d
Yamazaki, Y., Matthias, V., Miyoshi, Y., Stolle, C., Siddiqui, T., Kervalishvili, G., Laštovička, J., Kozubek, M., Ward, W., Themens, D. R., Kristoffersen, S., and Alken, P.: September 2019 Antarctic Sudden Stratospheric Warming: Quasi-6-Day Wave Burst and Ionospheric Effects, Geophys. Res. Lett., 47, e2019GL086577, https://doi.org/10.1029/2019GL086577, 2020. a, b, c, d, e
Zhang, T., Hoell, A., Perlwitz, J., Eischeid, J., Murray, D., Hoerling, M., and Hamill, T. M.: Towards Probabilistic Multivariate ENSO Monitoring, Geophys. Res. Lett., 46, 10532–10540, https://doi.org/10.1029/2019GL083946, 2019. a, b