the Creative Commons Attribution 4.0 License.
the Creative Commons Attribution 4.0 License.
 | 19 Aug 2021
Projections of shipping emissions and the related impact on air pollution and human health in the Nordic region
Morten Winther
Camilla Andersson
Jukka-Pekka Jalkanen
Jørgen Brandt
Lise M. Frohn
Wing Leung
Jesper H. Christensen
International initiatives have successfully brought down the emissions, and hence also the related negative impacts on environment and human health, from shipping in Emission Control Areas (ECAs). However, the question remains as to whether increased shipping in the future will counteract these emission reductions. The overall goal of this study is to provide an up-to-date view on future ship emissions and provide a holistic view on atmospheric pollutants and their contribution to air quality in the Nordic (and Arctic) area. The first step has been to set up new and detailed scenarios for the potential developments in global shipping emissions, including different regulations and new routes in the Arctic. The scenarios include a Baseline scenario and two additional SOx Emission Control Areas (SECAs) and heavy fuel oil (HFO) ban scenarios. All three scenarios are calculated in two variants involving Business-As-Usual (BAU) and High-Growth (HiG) traffic scenarios. Additionally a Polar route scenario is included with new ship traffic routes in the future Arctic with less sea ice. This has been combined with existing Current Legislation scenarios for the land-based emissions (ECLIPSE V5a) and used as input for two Nordic chemistry transport models (DEHM and MATCH). Thereby, the current (2015) and future (2030, 2050) air pollution levels and the contribution from shipping have been simulated for the Nordic and Arctic areas. Population exposure and the number of premature deaths attributable to air pollution in the Nordic area have thereafter been assessed by using the health assessment model EVA (Economic Valuation of Air pollution). It is estimated that within the Nordic region approximately 9900 persons died prematurely due to air pollution in 2015 (corresponding to approximately 37 premature deaths for every 100 000 inhabitants). When including the projected development in both shipping and land-based emissions, this number is estimated to decrease to approximately 7900 in 2050. Shipping alone is associated with about 850 premature deaths during present-day conditions (as a mean over the two models), decreasing to approximately 600 cases in the 2050 BAU scenario. Introducing a HFO ban has the potential to lower the number of cases associated with emissions from shipping to approximately 550 in 2050, while the SECA scenario has a smaller impact. The “worst-case” scenario of no additional regulation of shipping emissions combined with a high growth in the shipping traffic will, on the other hand, lead to a small increase in the relative impact of shipping, and the number of premature deaths related to shipping is in that scenario projected to be around 900 in 2050. This scenario also leads to increased deposition of nitrogen and black carbon in the Arctic, with potential impacts on environment and climate.
- Article
(13921 KB) - Full-text XML
-
Supplement
(587 KB) - BibTeX
- EndNote


The shipping sector plays a key role for tourism and the transportation of goods in Europe and beyond (EEA, 2017). Due to the use of fossil fuels, shipping activities lead to emissions of important air pollutants like nitrogen oxides (NOx), sulfur dioxide (SO2), primary particles with a diameter of less than 2.5 µm (PPM2.5) and black carbon (BC). The many negative impacts related to these air pollutants and compounds subsequently formed in the atmosphere are well established. Nitrogen deposition is a threat to sensitive ecosystems, and increasing deposition is associated with loss of biodiversity (Bobbink et al., 2010), while compounds such as ozone (O3), nitrogen dioxide (NO2) and fine particulate matter (PM2.5) are known to have negative impacts on human health (as reviewed in, e.g. WHO, 2013; Pope et al., 2020), even in the Nordic area where there are relatively low exposure levels (Raaschou-Nielsen et al., 2020). Components like BC are also very important in relation to the climate system (Bond et al., 2013) and lead to warming, especially in the Arctic region (AMAP, 2011). In recognition of the negative impacts, sulfur emissions from ships have been regulated by establishing Sulfur Emission Control Areas (SECAs) for the Baltic and North seas, as well as close to the North American coastline and Puerto Rico. In addition to these regional reductions, a global shift to low-sulfur fuels was required from 2020 onwards. This reduction was decided by the Marine Environment Protection Committee under the International Maritime Organization in 2016, considering the health and climate impact of reducing sulfur emissions (Sofiev et al., 2018). Further, a NOx Emission Control Area (NECA) was established for North America, and new ships built after 2016 will need to comply with IMO Tier III emission requirements, which will reduce NOx emissions from these ships by 80 % when compared to Tier I level. Similar rules will be applied to the Baltic Sea and North Sea areas from 2021 onwards. Shipping activity is nevertheless predicted to increase (e.g. Corbett et al., 2010), and the global Fourth IMO Greenhouse Gas (GHG) study (Faber et al., 2020) projects a strong growth up to 2050, with GHG emission levels ranging from 90 %–150 % of 2008 levels regardless of the measures currently in force.
According to a recent study of Sofiev et al. (2018), shipping is responsible for about 266 000 premature deaths globally, even after the 2020 sulfur reduction is implemented. This reduction is estimated to decrease the human health effects by 137 000 deaths, especially in Asia and India but to a significantly lower extent in the Northern Hemisphere, where sulfur emissions are already regulated by existing SECAs. For Europe, an earlier study estimated that up to 50 000 premature deaths per year can be associated with emissions from shipping (Brandt et al., 2013b). More recently, a study zoomed in on the Baltic Sea region and estimated that Baltic PM2.5 emissions from shipping caused up to 2300 premature deaths in the surrounding countries in 2016, which was a reduction of 37 % compared to before a SECA was enforced in the Baltic (Barregard et al., 2019). Overall, the impacts will be largest in coastal areas, and a review has previously found that shipping emissions contribute to 1 %–14 % of the PM2.5 levels and 7 %–24 % of the NO2 levels in coastal areas in Europe (Viana et al., 2014). Aksoyoglu et al. (2016) found the contribution from shipping to the total PM2.5 to be largest in the western part of the Mediterranean (up to 45 %) and along the northern European coast (10 %–15 %). However, a significant contribution from ships to air quality was also reported in Madrid area, Spain, despite the inland location of the city (Nunes et al., 2020). A health assessment for eight European Mediterranean coastal cities found that shipping emissions can be related to about 5.5 premature deaths per year for every 100 000 inhabitants in the eight cities (Viana et al., 2020).
In the Arctic, shipping can also be an important source for pollution in an otherwise clean and pristine environment (Schmale et al., 2018). With decreasing sea ice extent in a warming Arctic, new trans-Arctic shipping routes are becoming more likely (Corbett et al., 2010), and this can increase the traffic in the area and add to the air pollution levels in the high Arctic (Winther et al., 2014, 2017).
In the current study, we take on a Nordic perspective in order to make an updated analyses of future shipping emissions and the impacts these emissions have on health and environment. We have the following two overall aims.
-
We aim to set up shipping emission scenarios that include several options to limit ship emissions, ranging from additional fuel quality requirements (Heavy fuel Oil ban), which go beyond the already agreed global sulfur cap, and an expansion of the existing ECA areas. Thus, the scenarios include a Baseline scenario and two additional SOx Emission Control Area (SECA) and heavy fuel oil (HFO) ban scenarios. All three scenarios are calculated in two variants involving Business-As-Usual (BAU) and High-Growth (HiG) traffic scenarios and an additional Polar route scenario is also included, which includes new ship traffic routes due to less Arctic sea ice in the future. The work reported here is based on vessel-level modelling of ship emissions using realistic traffic data to describe the spatio-temporal variation of traffic patterns.
-
We also aim to assess the contribution from shipping emissions to air pollution in the Nordic and Arctic area and the potential benefits of the mitigation options included in the shipping emission scenarios. This is done by applying two chemical transport models (DEHM and MATCH) set up with land-based and shipping emissions and analysing maps of the modelled air pollution concentrations resulting from all emissions and the share related to shipping. It is expected that models with different physical descriptions and setups show some differences in modelled air pollution, and by using two models an indication of the related uncertainties is displayed. The included emissions represent present-day conditions and future projections towards 2050. For the Nordic area, we focus mainly on total PM2.5 (the sum of primary emitted components, e.g. black carbon and secondary formed aerosols), while for the Arctic we focus on the deposition of nitrogen and black carbon. Furthermore, the modelled concentration maps serve as input to the health impact assessment system EVA (Economic Valuation of Air pollution) in order to assess the overall impacts of air pollution on the human health in the Nordic area and the changes in health impacts resulting from the different ship emission scenarios. The focus here is on mortality and the number of premature deaths associated with exposure to air pollution.
2.1 Setup of shipping emission inventories
The background data for the emission scenarios is traffic data for the area north of 60∘ N, emission factors, and scenario-specific emission inventories from the ship emission model developed at the Danish Centre for Environment and Energy (DCE) at Aarhus University (Winther et al., 2017). In order to obtain a spatial coverage of the entire Nordic area and the Arctic, the DCE emission inventories are combined with a global CO2 ship emission inventory produced with the Ship Traffic Emissions Assessment Model (STEAM) for 2015 (Johansson et al., 2017).
2.1.1 STEAM model
Global emission data from the STEAM model (developed at the Finnish Meteorological Institute) from an earlier study (Johansson et al., 2017) were applied in this work. The model uses global Automatic Identification System (AIS) data to describe shipping activity and it applies vessel-level modelling using technical descriptions of each ship in the global fleet (Jalkanen et al., 2009, 2012; Johansson et al., 2013, 2017). Details of the method and the numerical results for emissions used in this study can be found in Johansson et al. (2017). The AIS data from terrestrial and satellite networks were purchased from Orbcomm Ltd. (Rochelle Park, USA), and the technical details database was acquired from IHS Markit (IHS Markit Global Headquarters, fourth floor Ropemaker Place, 25 Ropemaker Street, London EC2Y 9LY, UK). Emissions for ships were modelled without considering weather effects (wind, waves, ice, currents) and thus represent ideal conditions, which may introduce uncertainties when compared to real emissions and fuel consumption. Regardless, average absolute deviation of the STEAM-predicted fuel consumption for any single ship is around 19 %, whereas inventory-level totals are equivalent to those reported in the EU Monitoring, Reporting and Verification system (EU, 2015). These comparisons were made for more than 2550 vessels reporting their fuel consumption during the reporting year 2019.
2.1.2 Traffic activity data in the DCE ship emission model
The ship activity data used in the DCE ship emission model are provided by the Danish Maritime Authority (DMA) based on AIS signals received from terrestrial base stations and from satellites equipped with AIS receivers for the area north of 60∘ N. The data represent the years 2012–2016, divided into 0.5∘ longitude × 0.225∘ latitude grid cells with a monthly resolution. The ships are classified into 14 ship types and 16 ship length categories, and data for total sailed distance and average sailing speeds are provided stratified into the different ship type–length–average speed combinations that have been recorded in the individual cells.
A weighted and consolidated ship activity data set for a base year was prepared for the DCE ship emission model based on the 5-year ship activity data provided by DMA in order to avoid inexpedient temporal and spatial specific fluctuations in traffic records and in order to achieve a uniform grid cell reference system for the emission projection calculations.
The traffic scaling factors used in the DCE ship emission model for traffic projections are derived from traffic growth factors in the Corbett et al. (2010) Business-As-Usual (BAU) and High-Growth (HiG) scenarios by referring the DCE ship types to the Corbett et al. (2010) ship types and by using Corbett traffic growth factors evolved from the base year. Fuel efficiency improvements for future ships are modelled from EEDI fuel efficiency regulations agreed by Marpol 83/78 Annex VI and mandatory from 1 January 2013 for newly built ships larger than 400 GT. For further explanations regarding ship activity data, traffic scaling factors and EEDI factors, see Winther et al. (2017).
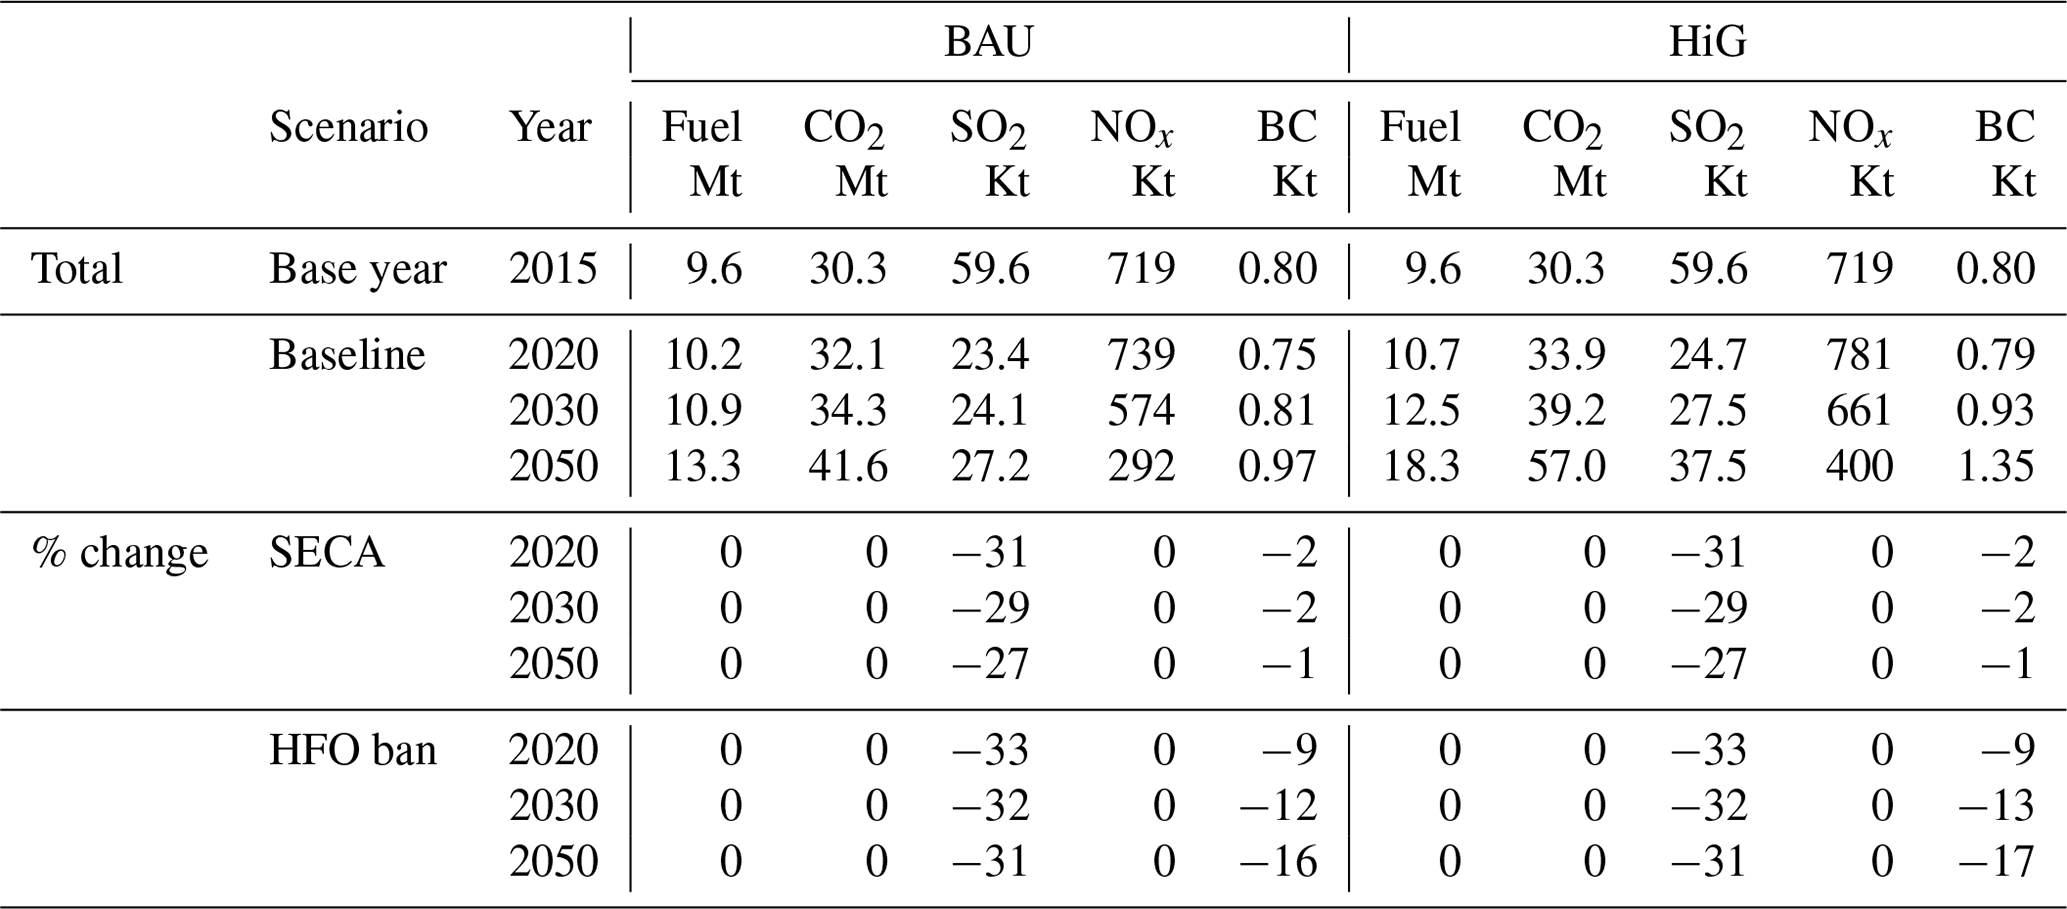
Table 1Total shipping emissions for the Nordic (d03) domain for the base year 2015; the Baseline, SECA, and HFO ban BAU scenarios in 2020, 2030, and 2050; and percent changes between Baseline and SECA/HFO ban scenario results in 2020, 2030, and 2050.
2.1.3 Scenarios
The current study includes a Baseline emission projection scenario and two additional emission projections: a SECA (Sulfur Emission Control Area) scenario and an HFO (heavy fuel oil) ban scenario (see Table 1). The Baseline scenario forms the basis for the SECA and HFO ban scenarios.
All three scenarios use the BAU and HiG traffic activity projections explained above in Sect. 2.1.2, and the scenarios further assume an increasing amount of liquefied natural gas (LNG) fuel being used as a substitution for heavy fuel oil in the inventory area throughout the projection years. The scenarios use the “low case” LNG fuel share of total marine fuel consumption, which is 2 %, 4 % and 8 % in the years 2020, 2030 and 2050, respectively, as described in the IMO third GHG study published by IMO (2015).
The Baseline scenario assumes an increase in the use of exhaust gas cleaning systems (EGCS) for SO2 emission abatement in the case of ships using HFO with a high content of sulfur. In the Baseline scenario inside the existing SECA zones (i.e. American, North Sea and Baltic Sea SECAs), the fuel type switches from HFO to marine diesel and marine gas oil (MDO/MGO) for ships using HFO that do not have an EGCS installed (Winther et al., 2017). Outside the existing SECAs, the latter ships use 0.5 % HFO after the global sulfur cap introduction in 2020.
In the SECA scenario, the existing SECA zones (i.e. American, North Sea and Baltic Sea SECAs) are expanded to cover the entire inventory area. The SECA scenario takes into account the Baseline shares of LNG fuel consumption and EGCS installations. Further into the SECA scenario, the fuel shifts from HFO to MDO/MGO outside the existing SECAs to ships using HFO and not using EGCS.
In the HFO ban scenario, no use of HFO by ships is allowed at all in the inventory area. The HFO ban scenario includes the consumption of LNG as assumed in the Baseline scenario. The remaining part of the HFO consumption not being substituted by LNG is assumed to switch to MDO/MGO in the entire inventory area.
2.1.4 Emission factors
The specific fuel consumption factors (SFCs) and NOx emission factors (g kWh−1) for HFO and MDO/MGO used in the calculations are classified according to engine type and engine production year (Ministry of Transport, 2015; MAN Energy Solutions, 2012). The CO2 emission factors (g kg−1 fuel) come from Nielsen et al. (2019). For LNG, the source of SFCs, NOx and CO2 emission factors is IMO (2015).
The SO2 emission factors are proportional with the fuel sulfur content (Fs), or the sulfur removal efficiency in cases regarding ships with EGCS installed. For HFO-fuelled ships without EGCS installed, Fs corresponds to the global IMO monitoring value of 2.45 % for 2015 (IMO, 2016) and the global fuel sulfur cap of 0.5 % for 2020 onwards. For HFO-fuelled ships with EGCS installed, by assumption 2.45 % HFO is used with a removal efficiency equivalent to Fs = 0.1 %. EGCS systems are included in the emission projections from 2020 onwards (Sect. 2.2.3). For MDO/MGO, Fs equals 0.08 %, as monitored by IMO (2016).
The BC emission factors used in this project are measured values by Aakko-Saksa et al. (2016). The BC emission factors for 2.45 % HFO, 0.5 % HFO and MDO/MGO are 0.155, 0.065 and 0.056 g kg−1 fuel, respectively. For HFO-fuelled ships with EGCS, an average BC removal efficiency of 40 % is assumed (i.e. 0.093 g kg−1 fuel) based on the available data from the literature (ICCT, 2015; Lack and Corbett, 2012; Johnson et al., 2016). For LNG, a BC emission factor of 0.00155 g kg−1 fuel is used, derived as 1 % of the BC emissions for HFO (ICCT, 2015).
The full set of basis emission factors is not shown here, but they are explained in more detail in Winther et al. (2017). However, aggregated from ship type, engine type, fuel type and engine production year, fuel-related emission factors for 2015 and the forecast years 2020, 2030 and 2050 are shown in Fig. S1 in the Supplement that have been derived from the fuel and emission results presented above. The development of the emission factors reflects the emission technology improvements (for NOx) and fuel sulfur content and the Baseline shares of LNG fuel consumption and EGCS installations (for SO2 and BC). The emission factors applied (Fig. S1) include the emission factor adjustments made in the calculations in order to account for engine load variations (Winther et al., 2017).
2.1.5 Scaling of the global CO2 ship emission inventory
In order to cover the entire Nordic area and the Arctic and make use of already well-defined and elaborated scenarios for shipping in the Arctic, the global CO2 ship emission inventory produced with the STEAM model for 2015 is used in combination with the Arctic fuel consumption and emission scenarios calculated with the DCE ship emission model for 2015, 2020, 2030 and 2050 (Winther et al., 2017). The STEAM data stops at 74∘ N, and thus the area beyond this is covered by the DCE model.
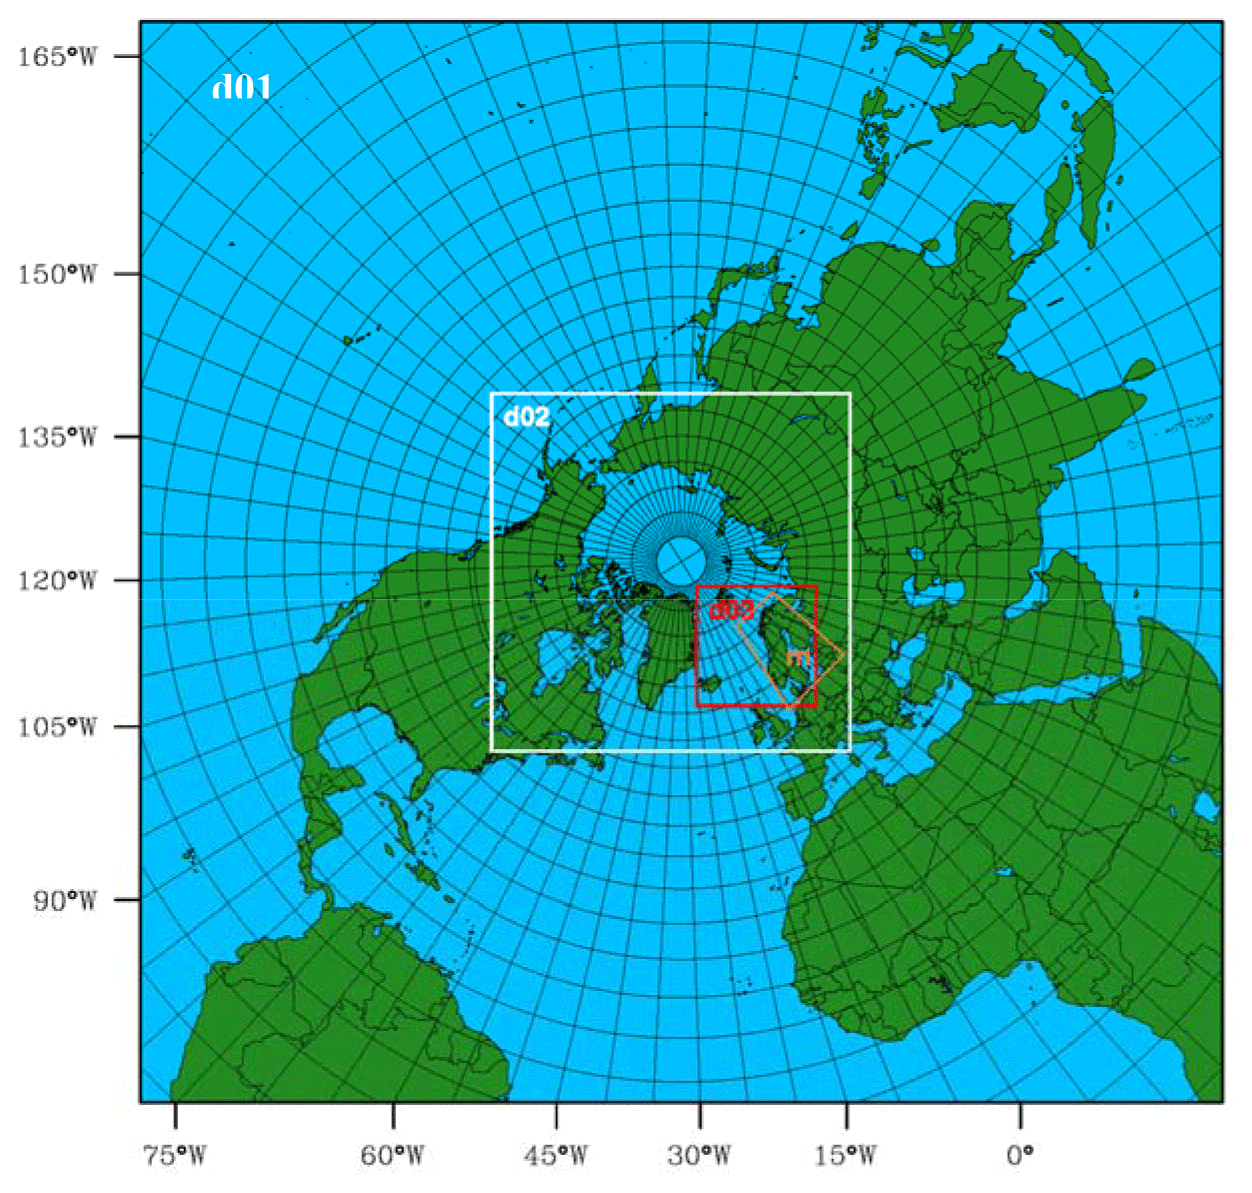
Figure 1The study area as defined by the three domains used in the DEHM model (d01–d03) and the domain used in the MATCH model (m).
The ship types defined in the DCE ship emission model are mapped into the ship types defined in the STEAM model. Subsequently, the STEAM 2015 CO2 emission results per ship type, together with aggregated fuel-related CO2 emission factors per ship type for 2015 derived from the DCE model, are used to calculate fuel consumption results specific for each ship type. A spatial distinction is made between SECA and non-SECA sea areas in the calculations.
In each of the scenarios, for a given scenario year and ship type, the percentage change in total fuel consumption obtained with the DCE model from 2015 to the scenario year is then used to scale the 2015 STEAM model fuel consumption, in order to calculate STEAM-related fuel consumption results for the scenario year in question.
STEAM-related emission results are subsequently obtained as the product of (1) the aggregated emission factors obtained with the DCE ship emission model for each scenario, scenario year, and STEAM ship type and (2) the corresponding fuel consumption. The final emission data set for 2015 and the scenario years are monthly files with a spatial resolution of 0.1∘ × 0.1∘.
2.2 The DEHM model
The Danish Eulerian Hemispheric Model (DEHM) is a state-of-the-art three-dimensional, Eulerian, atmospheric chemistry transport model (CTM) originally developed in the early 1990s to study the atmospheric transport of sulfur dioxide and sulfate into the Arctic (Christensen, 1997). The model has been modified, extended and updated continuously since then and now includes a comprehensive chemical scheme, detailing 80 chemical species and 158 chemical reactions, including a Volatile Basis Set (VBS) for describing secondary organic aerosols (SOA) (see, e.g. Brandt et al., 2012, for a detailed description of DEHM, and Bergstrøm et al., 2012, for a description of the VBS part). In the current study, DEHM has been set up with a main domain covering the Northern Hemisphere and part of the Southern Hemisphere and a resolution of 150 km × 150 km. Within this domain, a nested domain (d02) with a resolution of 50 km × 50 km covers the Arctic and Europe and a second nested domain (d03) with a resolution of 16.67 km × 16.67 km covers the Nordic region (see Fig. 1).
The meteorological data driving DEHM are calculated using the WRF model (Skamarock et al., 2008), set up with the same domains and nests as DEHM, and forced with ERA-Interim meteorology (Dee et al., 2011). Natural emissions like sea salt and biogenic volatile organic compounds (VOCs) are calculated online in the model as a function of meteorological parameters (described in Soares et al., 2016; Zare et al., 2012, 2014). The anthropogenic emissions for the current and future periods are based on the global 0.5∘ × 0.5∘ ECLIPSE V5a data sets including sectoral emissions (https://www.iiasa.ac.at/web/home/research/researchPrograms/air/Global_emissions.html, last access: 16 July 2015). We apply the future Baseline scenario assuming current legislation (CLE) for the air pollution components (see Klimont et al., 2017, for an overview). The projected changes in the land-based emissions in the applied domains in DEHM are given in Table S1 in the Supplement. The shipping emissions in ECLIPSE V5a have been replaced with the new shipping emissions described in Sect. 2.1. We have run the model for the meteorological year 2015 (with December 2014 as spin up) with a combination of land-based ECLIPSE V5a and new shipping emissions representing the years 2015, 2030 and 2050. This is done in order to isolate the impact from emission changes. Additionally, we have made simulations with and without a new polar diversion route and simulations where the shipping emissions have been reduced by 30 % (i.e. multiplied by 0.7). By scaling the results afterwards, the impact from shipping alone can be analysed, but non-linear effects of atmospheric chemistry are still included. In total, 22 simulations have been made with the DEHM model (an overview of model runs is given in Table S2 in the Supplement). The Baseline simulation with 2015 BAU emissions has been evaluated by comparison to European observations of the components relevant for the health assessment (PM2.5, NO2 and O3), and a sufficiently good agreement between model and observations is seen both in terms of level (fractional bias for daily values in 2015: −0.09, 0.03 and 0.05 for PM2.5, NO2, and O3) and variability (correlations for daily values in 2015: 0.79, 0.73 and 0.93; see the Supplement for details). Furthermore, the DEHM model is one of the core models in the Copernicus Atmosphere Monitoring Service (CAMS) providing daily air pollution forecasts and analyses, which are continuously evaluated online against European observations (see https://www.regional.atmosphere.copernicus.eu/, last access: 16 December 2020).
The study area and the included model domains are shown in Fig. 1.
2.3 The MATCH model
The MATCH (Multi-scale Atmospheric Transport and CHemistry) model (Robertson et al., 1999; Andersson et al., 2007, 2015) is a state-of-the-art Eulerian chemistry and transport model, including wet, thermal and photochemical reactions, to describe the sulfur and nitrogen cycle, tropospheric ozone chemistry, and particle formation and transformation. The version used in the current set up is the same as was used in the EURODELTA-Trends exercise (Colette et al., 2017). It includes online emissions of sea salt as described in Soares et al. (2016). Secondary organic aerosol formation is modelled through a volatility basis set, and biogenic VOC emissions are modelled online, both as described by Simpson et al. (2012). Further details on the model configuration are described in Colette et al. (2017). The driving meteorological forcing data used was the HIRLAM operational weather data for 2015 for the domain covering Fennoscandia (11 km resolution). The lateral and top boundaries of this domain were fed every 6 h by results from the DEHM model, i.e. domain d01 (see Fig. 1). The anthropogenic and shipping emissions were the same as for DEHM, but with MATCH we simulate the current scenario (2015) and a selection of 2050 shipping scenarios. The MATCH grid is smaller than the DEHM d03 grid with a finer horizontal resolution (11 km × 11 km). The shipping attribution was conducted in the same manner as with the DEHM model, i.e. by reducing the shipping emissions by 30 % and using the corresponding DEHM simulation on the boundary of the MATCH grid. In total, 12 simulations have been made with the MATCH model (Table S2 in the Supplement).
The current model configuration is extensively evaluated with in situ observations and compared to the performance of other models in numerous papers in similar setups as in this study for ozone, particles and nitrogen and sulfur deposition in Europe (Otero et al., 2018; Theobald et al., 2019; Vivanco et al., 2018, Ciarelli et al., 2019a, b). The conclusion is that MATCH in the current configuration performs among the best models for near-surface ozone, as well as nitrogen and sulfur deposition, and for particles it displays high correlation with observations (fractional bias of daily mean O3, and correlation coefficients are 6 % and 0.80 in Scandinavia in 2015), while PM concentrations are somewhat underestimated (for Europe fractional bias and correlation coefficients of daily mean PM10, PM2.5, O3 and NO2 are −11 %/0.59, −13 %/0.67, 1.6 %/0.70 and −5.9 %/0.58, respectively). An evaluation of MATCH for the Fennoscandia region for the year 2015 is included in the Supplement of this paper. MATCH is also a core model in the operational CAMS (Marécal et al., 2015; https://www.regional.atmosphere.copernicus.eu/, last access: 16 December 2020) and includes daily updates of daily air pollution forecasts, fused measurement and modelling of atmospheric concentrations (through data assimilation), as well as model performance scores. MATCH is a building block in the MATCH Sweden system for environmental surveillance (Andersson et al., 2017) and includes measurement model fusion of total atmospheric deposition (MMF-TDEP) of ozone, nitrogen, sulfur and base cations.
2.4 The EVA system
The EVA (Economic Valuation of Air pollution; Brandt et al., 2013a, b; Geels et al., 2015, Im et al., 2018) model system is based on the impact pathway chain (Friedrich and Bickel, 2001), wherein modelled air pollution levels are coupled to population data for calculation of human exposure, health impacts (both mortality and morbidity) and related external costs. In the current study, we focus on the health impacts and do not include the assessment of the cost. The health impacts are calculated using linear exposure–response functions, which in the applied model version (EVAv5.2) are based on the HRAPIE recommendations (WHO, 2013). The number of premature deaths in the system is calculated from short-term exposure to O3, NO2, SO2 and PM2.5, as well as long-term exposure to PM2.5 and NO2. The EVA model system can be used to estimate the health impacts due to the total air pollution levels or due to contributions from various model scenario runs, where, e.g. specific emission sectors are reduced or the weather and climate scenarios are changed. In this study, the population exposure has been assessed for the d03 DEHM domain by combining the concentration maps from both DEHM and MATCH with gridded population data from EUROSTAT for 2015 (see Table S4) with the national total populations and a map (Fig. S5) of the population distribution in the applied 16.67 km × 16.67 km grid). In order to do so, the MATCH 11 km × 11 km gridded data have been aggregated to the d03 grid. The EVA model system has been compared to other similar models (Anenberg et al., 2015; Lehtomäki et al., 2020), is part of the Danish monitoring programme (Ellermann et al., 2020) and has been used routinely in numerous advisory projects for public authorities. In Sect. 3.2 the current results for 2015 are compared with EEA's results for the same year (EEA, 2018).

Figure 2CO2, NOx, SO2 and BC emissions for 2015 and Baseline scenario results for 2020, 2030 and 2050, which have been further split into SECA and non-SECA parts of domain d03.
In this section we first describe the projected developments in the shipping emissions in the different scenarios within the Nordic area. Thereafter we describe the modelled present-day air pollution levels with a focus on total PM2.5 and the overall health impact related to air pollution in the Nordic area. We then move on to the future developments in PM2.5 levels as simulated by the two models based on the shipping scenarios and the projected development of land-based emissions. The related impacts on the number of premature deaths are then analysed. Next we focus more directly on the contributions from shipping in terms of the PM2.5 levels and health impacts. Finally we move to the Arctic and demonstrate how the deposition of BC and nitrogen will be affected by the projected developments in emissions.
3.1 Development in shipping emissions
Table 1 shows the shipping emissions for the domain area d03 for the base year 2015 and the Baseline, SECA and HFO ban BAU scenarios in 2020, 2030 and 2050. The percent changes between Baseline and SECA and HFO ban scenario results in 2020, 2030 and 2050 are also shown in Table 1.
3.1.1 Baseline results
The emission development relies on the development in fuel consumption and the corresponding emission factors. Figure 2 shows the emissions of CO2, NOx, SO2 and BC for 2015 and Baseline scenario results for 2020, 2030 and 2050, which have been further split into the current ECA and non-ECA parts of domain d03.
In terms of total fuel consumption, the projected growth in ship traffic during the forecast period more than outweighs the future fuel efficiency improvements for ships. From 2015 to 2050, the fuel consumption changes for total [SECA, non-SECA] becomes 39 % [43 %, 20 %] for BAU traffic and 91 % [98 %, 51 %] for HiG traffic, respectively. Almost identical percentage changes are calculated for CO2 emissions from 2015 to 2050 due to the almost constant fuel-dependent emission factors for CO2 in the projection period (Fig. S1).
For NOx the Total [NECA, non-NECA] emission changes from 2015 to 2050 are −59 % [−70 %, 1 %] for BAU traffic and −44 % [−58 %, 30 %] for HiG traffic, respectively. The total NOx emission reductions during the forecast period are due to the decrease in NOx emission factors (Fig. S1). NOx emission reductions are most significant for the existing NECA area, where new engines installed on ships from 1 January 2021 must comply with the most stringent IMO Tier III NOx emission standards.

Figure 3Emissions for domain d03 calculated in the Baseline, SECA and HFO ban BAU scenarios (CO2, NOx, SO2 and BC) and the HiG scenarios (SO2 and BC).
The Total [SECA, non-SECA] SO2 emission changes from 2015 to 2050 are −54 % [32 %, −78 %] for BAU traffic and −37 % [86 %, −71 %] for HiG traffic, respectively. For BC, the Total [SECA, non-SECA] emission changes from 2015 to 2050 become 21 % [45 %, −39 %] for BAU traffic and 69 % [105 %, −22 %] for HiG traffic, respectively.
For SO2 and BC, the major reason for the emission reductions outside SECA from 2015 to 2050 is the shift from HFO with a sulfur content of 2.45 % in 2015 to HFO with 0.5 % sulfur from 2020 onwards and the consequently reduced emission factors. Compared with the HFO 2.45 % sulfur fuel, the less heavy 0.5 % sulfur fuel has a smaller amount of heavy organic compounds; hence, the fuel combustion becomes more complete and BC emission factors consequently lower.
Inside SECA, the emissions of BC increase somewhat more than what is expected from the changes in fuel consumption due to higher BC emission factors for HFO in combination with EGCS compared with the emission factors for the MDO/MGO fuel being replaced. The SO2 emissions increase slightly less than fuel consumption due to the gradually increased consumption of liquefied natural gas (LNG) in the Baseline scenario.
3.1.2 Emission and fuel consumption results across scenarios
The fuel consumption and NOx emission totals calculated for the SECA and HFO ban scenario equal the results obtained in the Baseline scenario (Table 1; Fig. 3, NOx). The main reason for this is that the engine-specific fuel consumption and NOx emission factors are unaffected by the fuel switch from HFO to MDO/MGO, and the same shares of LNG of total fuel consumption per forecast year are also assumed in both scenarios (scenario definitions). Very small CO2 emission differences between the Baseline, SECA and HFO ban scenarios are the result of small differences in the fuel-related CO2 emission factors for HFO and MDO/MGO.
Table 2Estimated emissions of CO2, SO2, NOx and BC for the polar diversion routes in domain d03 in 2020, 2030 and 2050.

In all scenario years for SO2, the calculated emissions for the SECA and HFO ban scenarios are close to 30 % lower than the emissions calculated for the Baseline scenario (Table 1). In the SECA scenario, HFO is only used by ships with EGCS, with a sulfur removal efficiency equivalent Fs = 0.1 (Sect. 2.1.3). The 0.5 % fuel oil used outside the original SECA area, which is not being replaced by LNG, is replaced by MDO/MGO (Fs = 0.08) according to the scenario definitions. In the HFO ban scenario, all HFO consumption by ships not being replaced by LNG is replaced by MGO/MDO.
For BC in 2020 [2030, 2050], the SECA scenario emissions are 2 % [2 %, 1 %] lower than the Baseline results (Table 1) in both traffic growth cases. For the HFO ban scenario in 2020 [2030, 2050] with BAU traffic scenario, the BC emissions are 9 % [12 %, 16 %] smaller than the Baseline results (Table 1). For HiG traffic, the BC emissions become 9 % [13 %, 17 %] smaller than the Baseline results.
Apart from LNG with similar fuel consumption shares assumed in all three scenarios, in the HFO ban scenario, only the fuel type MDO/MGO with the smallest BC emission factor (0.053 g kg−1 fuel, before load adjustment) is used. In the Baseline and SECA scenarios similar shares of EGCS are used with a higher BC emission factor (0.093 g kg−1 fuel, before load adjustment). In the SECA scenario, however, the BC emissions from MDO/MGO fuel that replaces 0.5 % fuel oil are smaller due to the level of the BC emission factors.
3.1.3 Results for diversion routes
Potential changes in polar sea ice distribution and quantity due to a future warming can open up for additional ship traffic in the Arctic diverted from current shipping routes. Therefore, scenario estimates of CO2 (proxy for fuel consumption), BC, NOx and SO2 for so-called “diversion traffic” are made based on the Business-As-Usual (BAU) and High-Growth (HiG) scenario emission results for the diversion routes1 from Corbett et al. (2010). Based on the CO2 emissions for the diversion routes and the fuel-related emission factor for CO2 from Corbett et al. (2010), the diversion route fuel consumption is calculated. Fuel consumptions are then further modified by taking into account future fuel efficiency improvements for ships.
Next, the diversion route emissions related to the Baseline, SECA and HFO ban scenarios for BAU traffic and the Baseline scenario for HiG traffic are calculated as the product of the diversion route fuel consumption and the emission factors derived from each of the four scenarios.
Table 2 shows the estimated emissions of CO2, SO2, NOx and BC for the polar diversion routes passing through domain d03 in 2020, 2030 and 2050 for the Baseline, SECA and HFO ban emission scenarios based on the BAU traffic scenario and the Baseline emission scenario based on the HiG traffic scenario. The diversion emission results are also shown in Fig. S2 in the Supplement with the totals that do not include the diversion emission contribution (Table 1) for each scenario case.
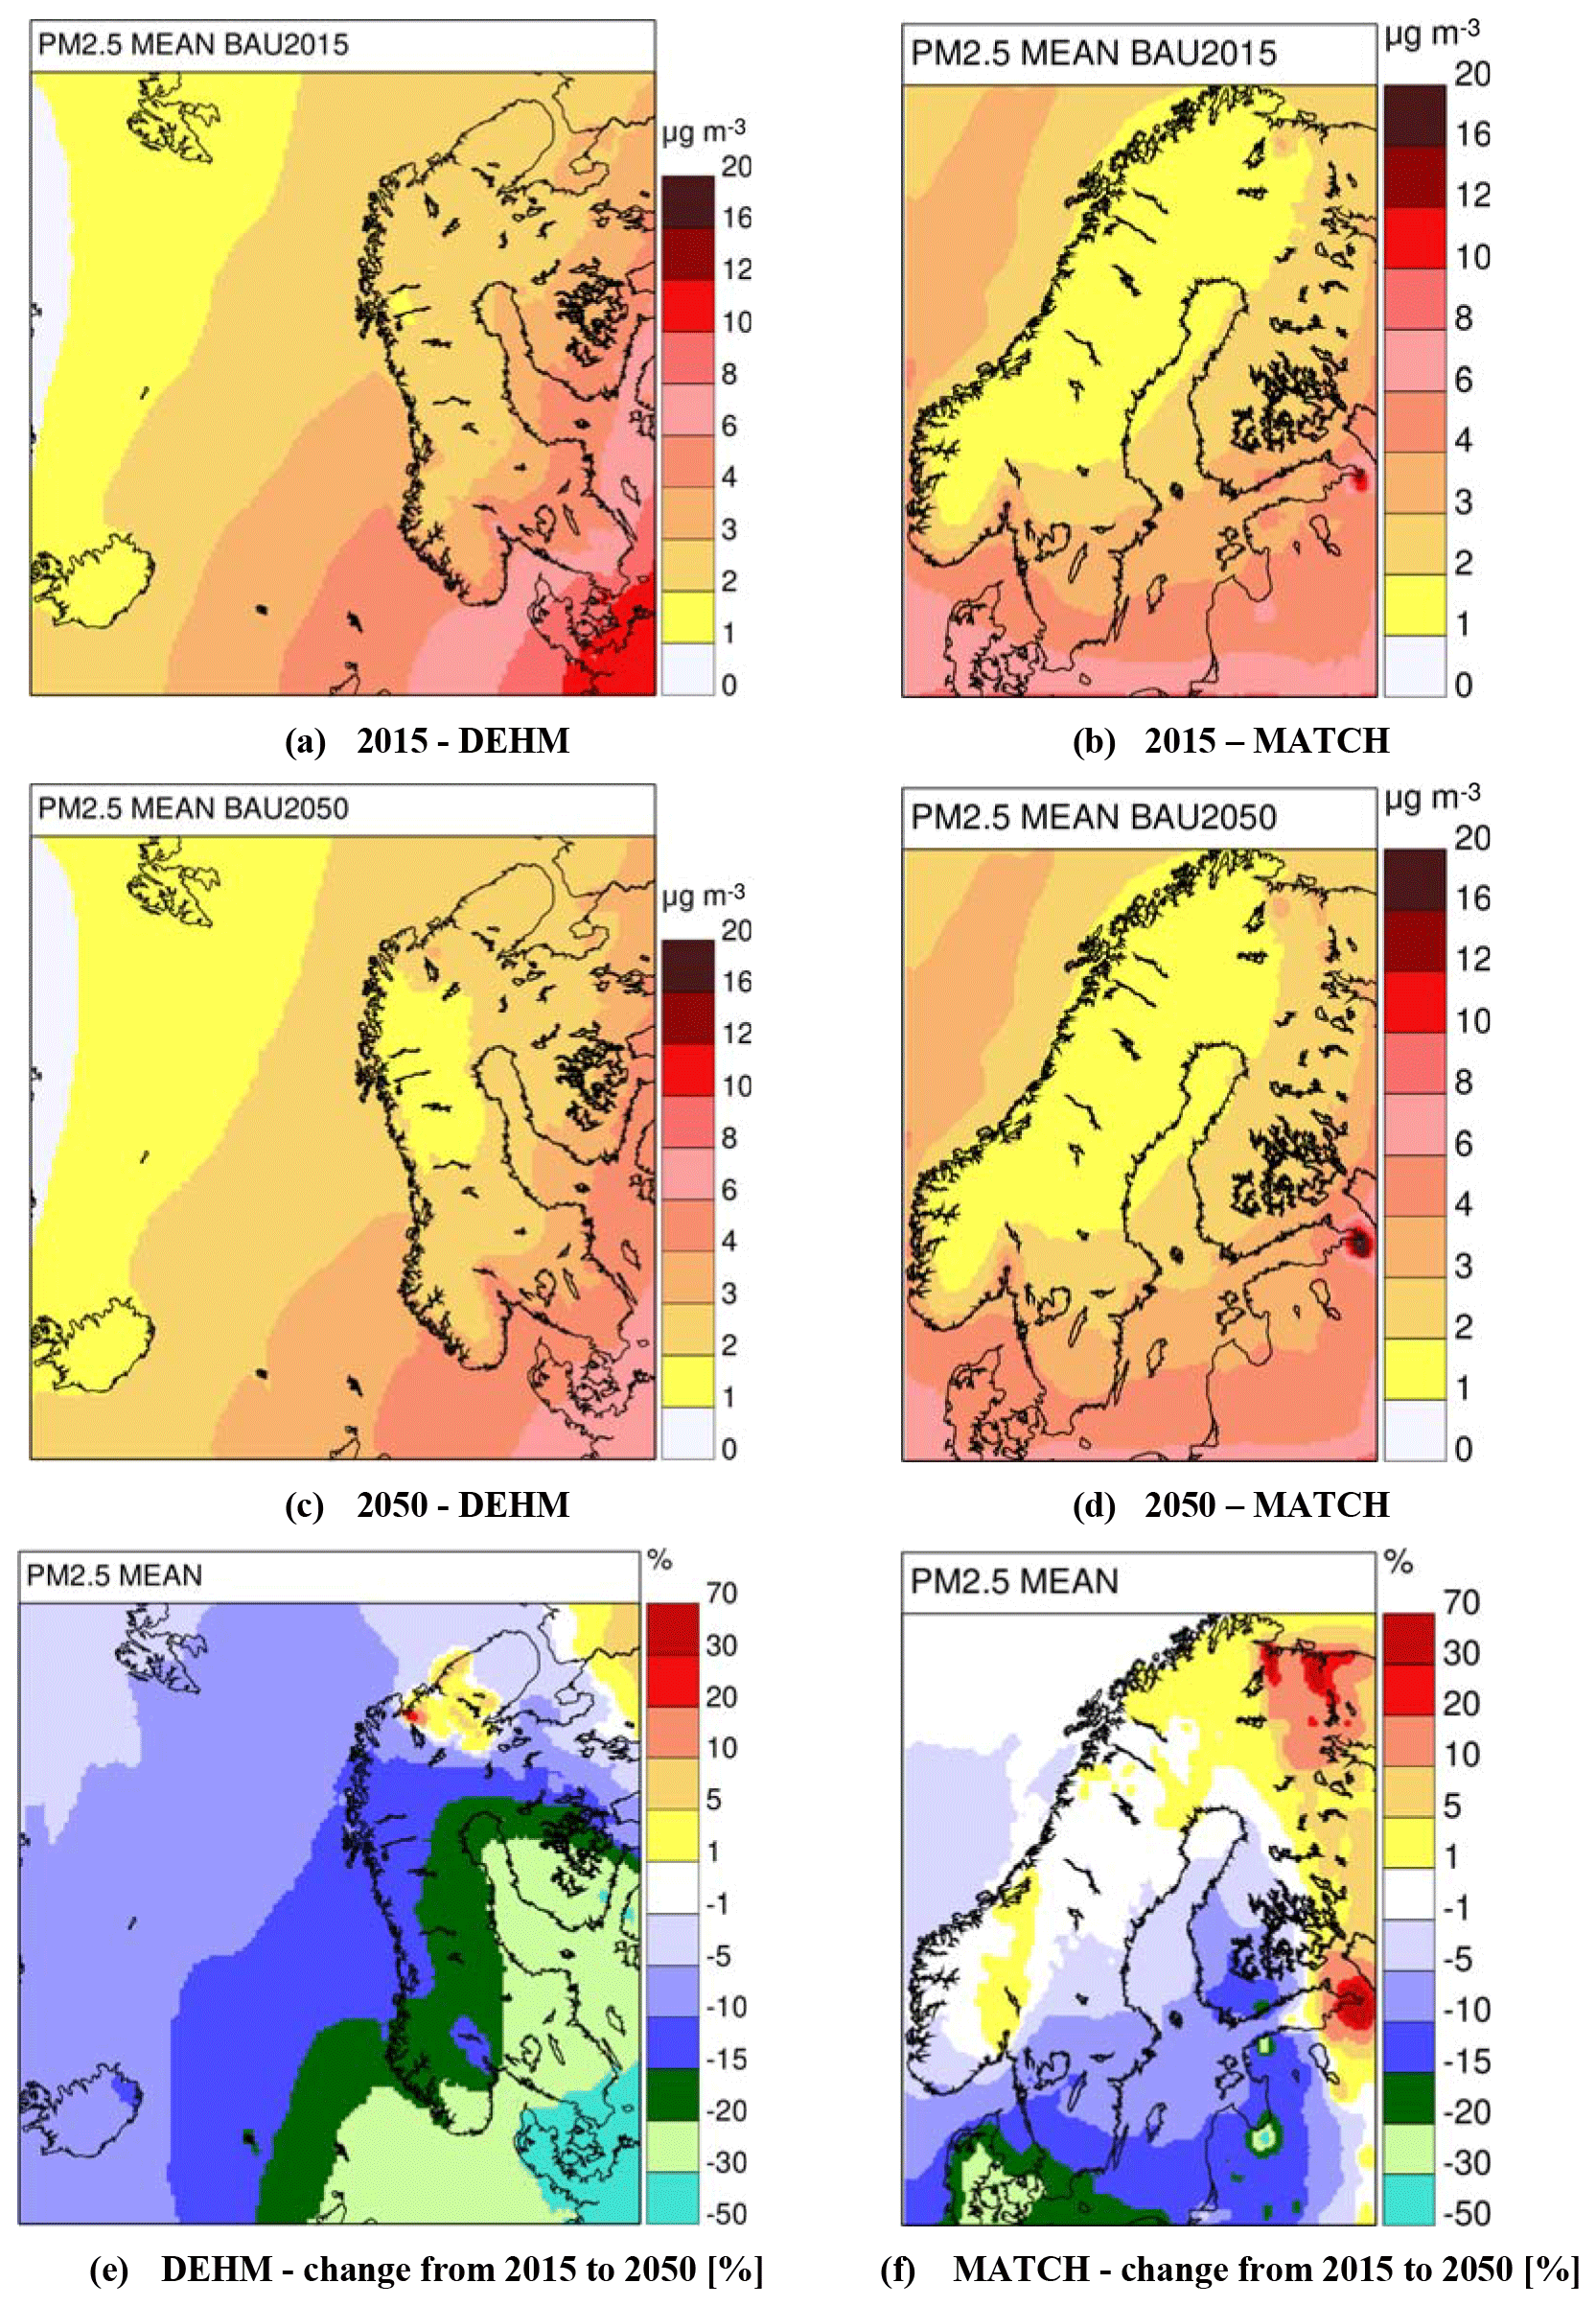
Figure 4The annual mean surface PM2.5 concentration [µg m−3] for 2015, 2050 and the percentage change as simulated by the two models.
Based on the BAU diversion traffic scenarios for the forecast years 2020 [2030, 2050], the additional percentage of emissions from ship traffic following the Arctic diversion routes in all three scenarios is +3 % [+3 %, +9 %] for CO2 and BC, +3 % [+4 %, +16 %] for NOx, +6 % [+6 %, +18 %] for SO2 (Baseline) and +3 % [+3 %, +9 %] for SO2 (SECA and HFO ban).
The additional percentage of emissions from ship traffic on Arctic diversion routes based on HiG diversion traffic for the forecast years 2020 [2030, 2050] becomes +4 % [+8 %, +33 %] for CO2, +4 % [+8 %, +33 %] for BC, +7 % [+16 %, +65,%] for SO2 and +4 % [+10 %, +62 %] for NOx.
3.2 Present-day Nordic air pollution and health effects
The annual mean PM2.5 concentration as modelled with the two models in the Baseline current situation (2015) is shown in Fig. 4a and b. This includes all anthropogenic and natural emissions as described in Sect. 2.1. The same overall pattern is seen in the two maps with the highest PM2.5 levels in the southern part of the domain and lower values towards the north. Thus, land-based emissions and long-range transport are major contributing factors to the overall PM2.5 levels and hence human exposure in the Nordic region in 2015. The concentration levels are highest in the DEHM results for 2015, while the MATCH results are somewhat lower than DEHM.
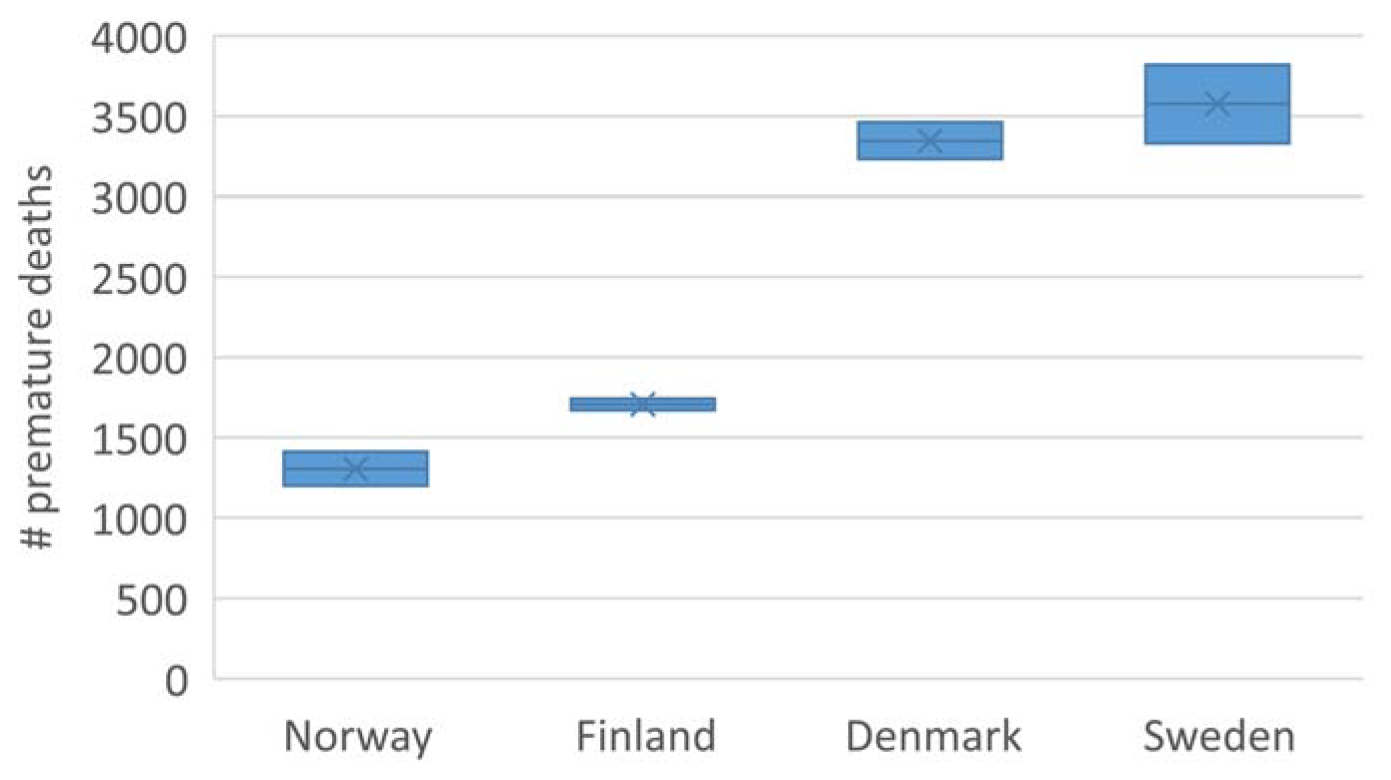
Figure 5Premature deaths attributable to NO2, O3, SO2 and PM2.5 exposure in the four largest Nordic countries in the base case for 2015 (including all of the main anthropogenic emission sources). The results are given as box plots, where the “x” indicates the central estimate and the size of the box shows the difference between the DEHM-EVA and MATCH-EVA assessments.
The total number of premature deaths attributable to short-term exposure to O3, NO2, SO2 and PM2.5 (acute effects), as well as long-term exposure to PM2.5 (chronic effects), for the base year 2015 are shown in Fig. 5 for Norway, Finland, Denmark and Sweden. Concentration fields from both the DEHM and the MATCH model have been used as input to the EVA model, and the results are given as box plots in order to show the central (mean) estimate as well as the range between the two models. The upper estimate is for all countries obtained by the DEHM-EVA setup, while the MATCH-EVA setup gives a slightly lower estimate. The total number of premature deaths in the Nordic region in 2015 is estimated to be between ca. 9400 (MATCH-EVA) and ca. 10 400 (DEHM-EVA) (or 9900 ± 10 % – given as the average of the two models and the difference as percent). The number is lowest for Norway (1300 ± 8 %) and Finland (1700 ± 2 %), while it is highest for Sweden (3600 ± 7 %).
For Denmark the total number of premature deaths is only slightly lower (3300 ± 3 %). Part of the difference between the countries is of course related to difference in the population numbers, where Sweden with a population of about 9.9 million (in 2015) is by far is the largest in the Nordic region (see Table S4). The high number of premature deaths in Denmark, where the total population is only slightly higher than in Norway, can be explained by the higher air pollution levels across Denmark (see Fig. 4a and b). In all countries the number of premature deaths attributable to long-term exposure to PM2.5 is a factor of 2–4 higher than the number of premature deaths attributable to acute effects. The DEHM-EVA setup also covers Iceland and the Faroe Islands, where the total number of premature deaths are estimated to be approximately 40 and approximately 15, respectively, in 2015. MATCH-EVA excludes these regions to the benefit of a higher resolution in a smaller domain.
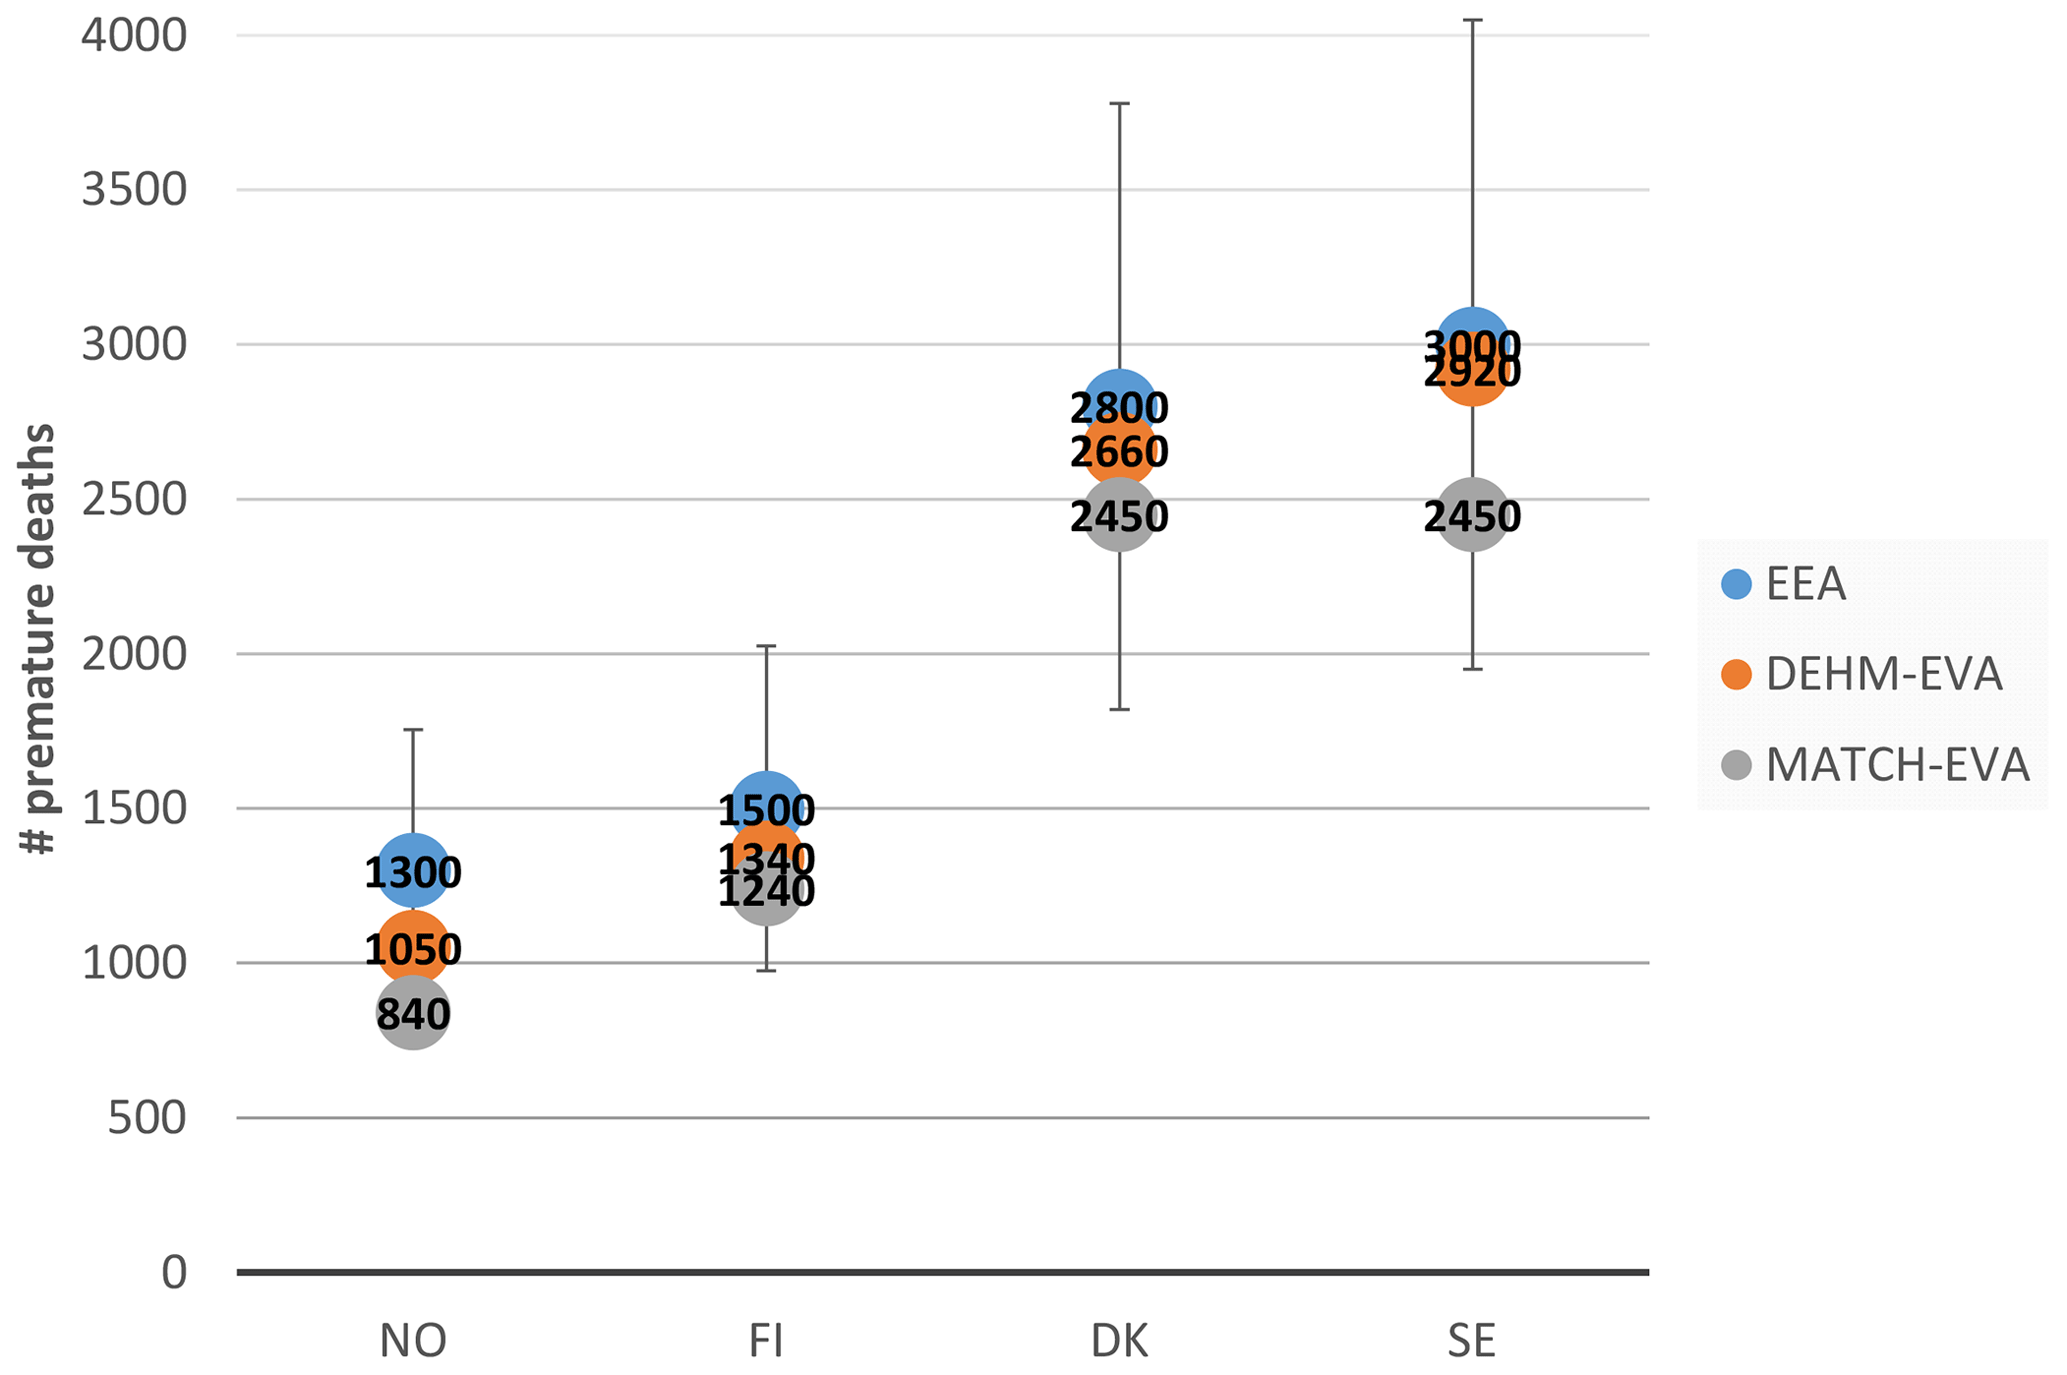
Figure 6Comparison between the assessment of premature deaths reported by EEA for 2015 and the current assessment (base case 2015) for effects related to PM2.5 exposure. The EEA number includes an error bar displaying the assumed uncertainty (± 35 %).
The current assessment can be compared to the recent European Environment Agency (EEA) “Air quality in Europe — 2018 report” (EEA, 2018), where premature deaths attributable to total PM2.5, NO2 and O3 exposure are estimated for 41 European countries for the year 2015. The EEA specifies that the uncertainty related to the health estimates is ± 35 % (PM2.5), ± 45 % (NO2) and ± 50 % (O3). In Fig. 6 the EEA estimates for PM2.5 mortality in four of the Nordic countries are compared to the current DEHM-EVA and MATCH-EVA estimates based on the Baseline 2015 simulations, including both land-based and shipping emissions. Overall, the estimates are very similar for the four countries, and some differences should be expected due to methodological differences. The DEHM-EVA and MATCH-EVA estimates are both within the error interval of the EEA estimates, but the MATCH-EVA numbers are for all countries lower than EEA and DEHM-EVA. This is in line with the underestimation the MATCH model shows for PM in the applied setup.
3.3 Future developments in Nordic air pollution and health effects
The annual mean PM2.5 concentration as simulated by both models for the BAU Baseline 2050 scenario is seen in Fig. 4c and d. The land-based emissions of, e.g. NOx and SOx, are projected to decrease in most of Europe in the applied ECLIPSE V5a scenarios (see Table S1). This leads to significant general reductions in the annual mean PM2.5 levels in most parts of the Nordic region towards 2050 (see Fig. 4e and f for the change in percentage). Parts of Russia (e.g. around Murmansk and Saint Petersburg) and parts of Norway stand out as exceptions, where the emissions, and hence the PM2.5 concentration, are projected to increase. In the MATCH results, the concentration in the Oslo region is projected to increase by a few percent. This is not seen in the DEHM results. Potential causes to this are the slightly lower resolution in the DEHM setup, differences in chemical scheme and differences in long-range-transported (LRT) component from continental Europe (the LRT component is weaker in MATCH), possibly partly due to differences in meteorological forcing. Thus, although there is a general decrease in exposure to PM2.5, some areas are projected to possibly experience increased exposure.
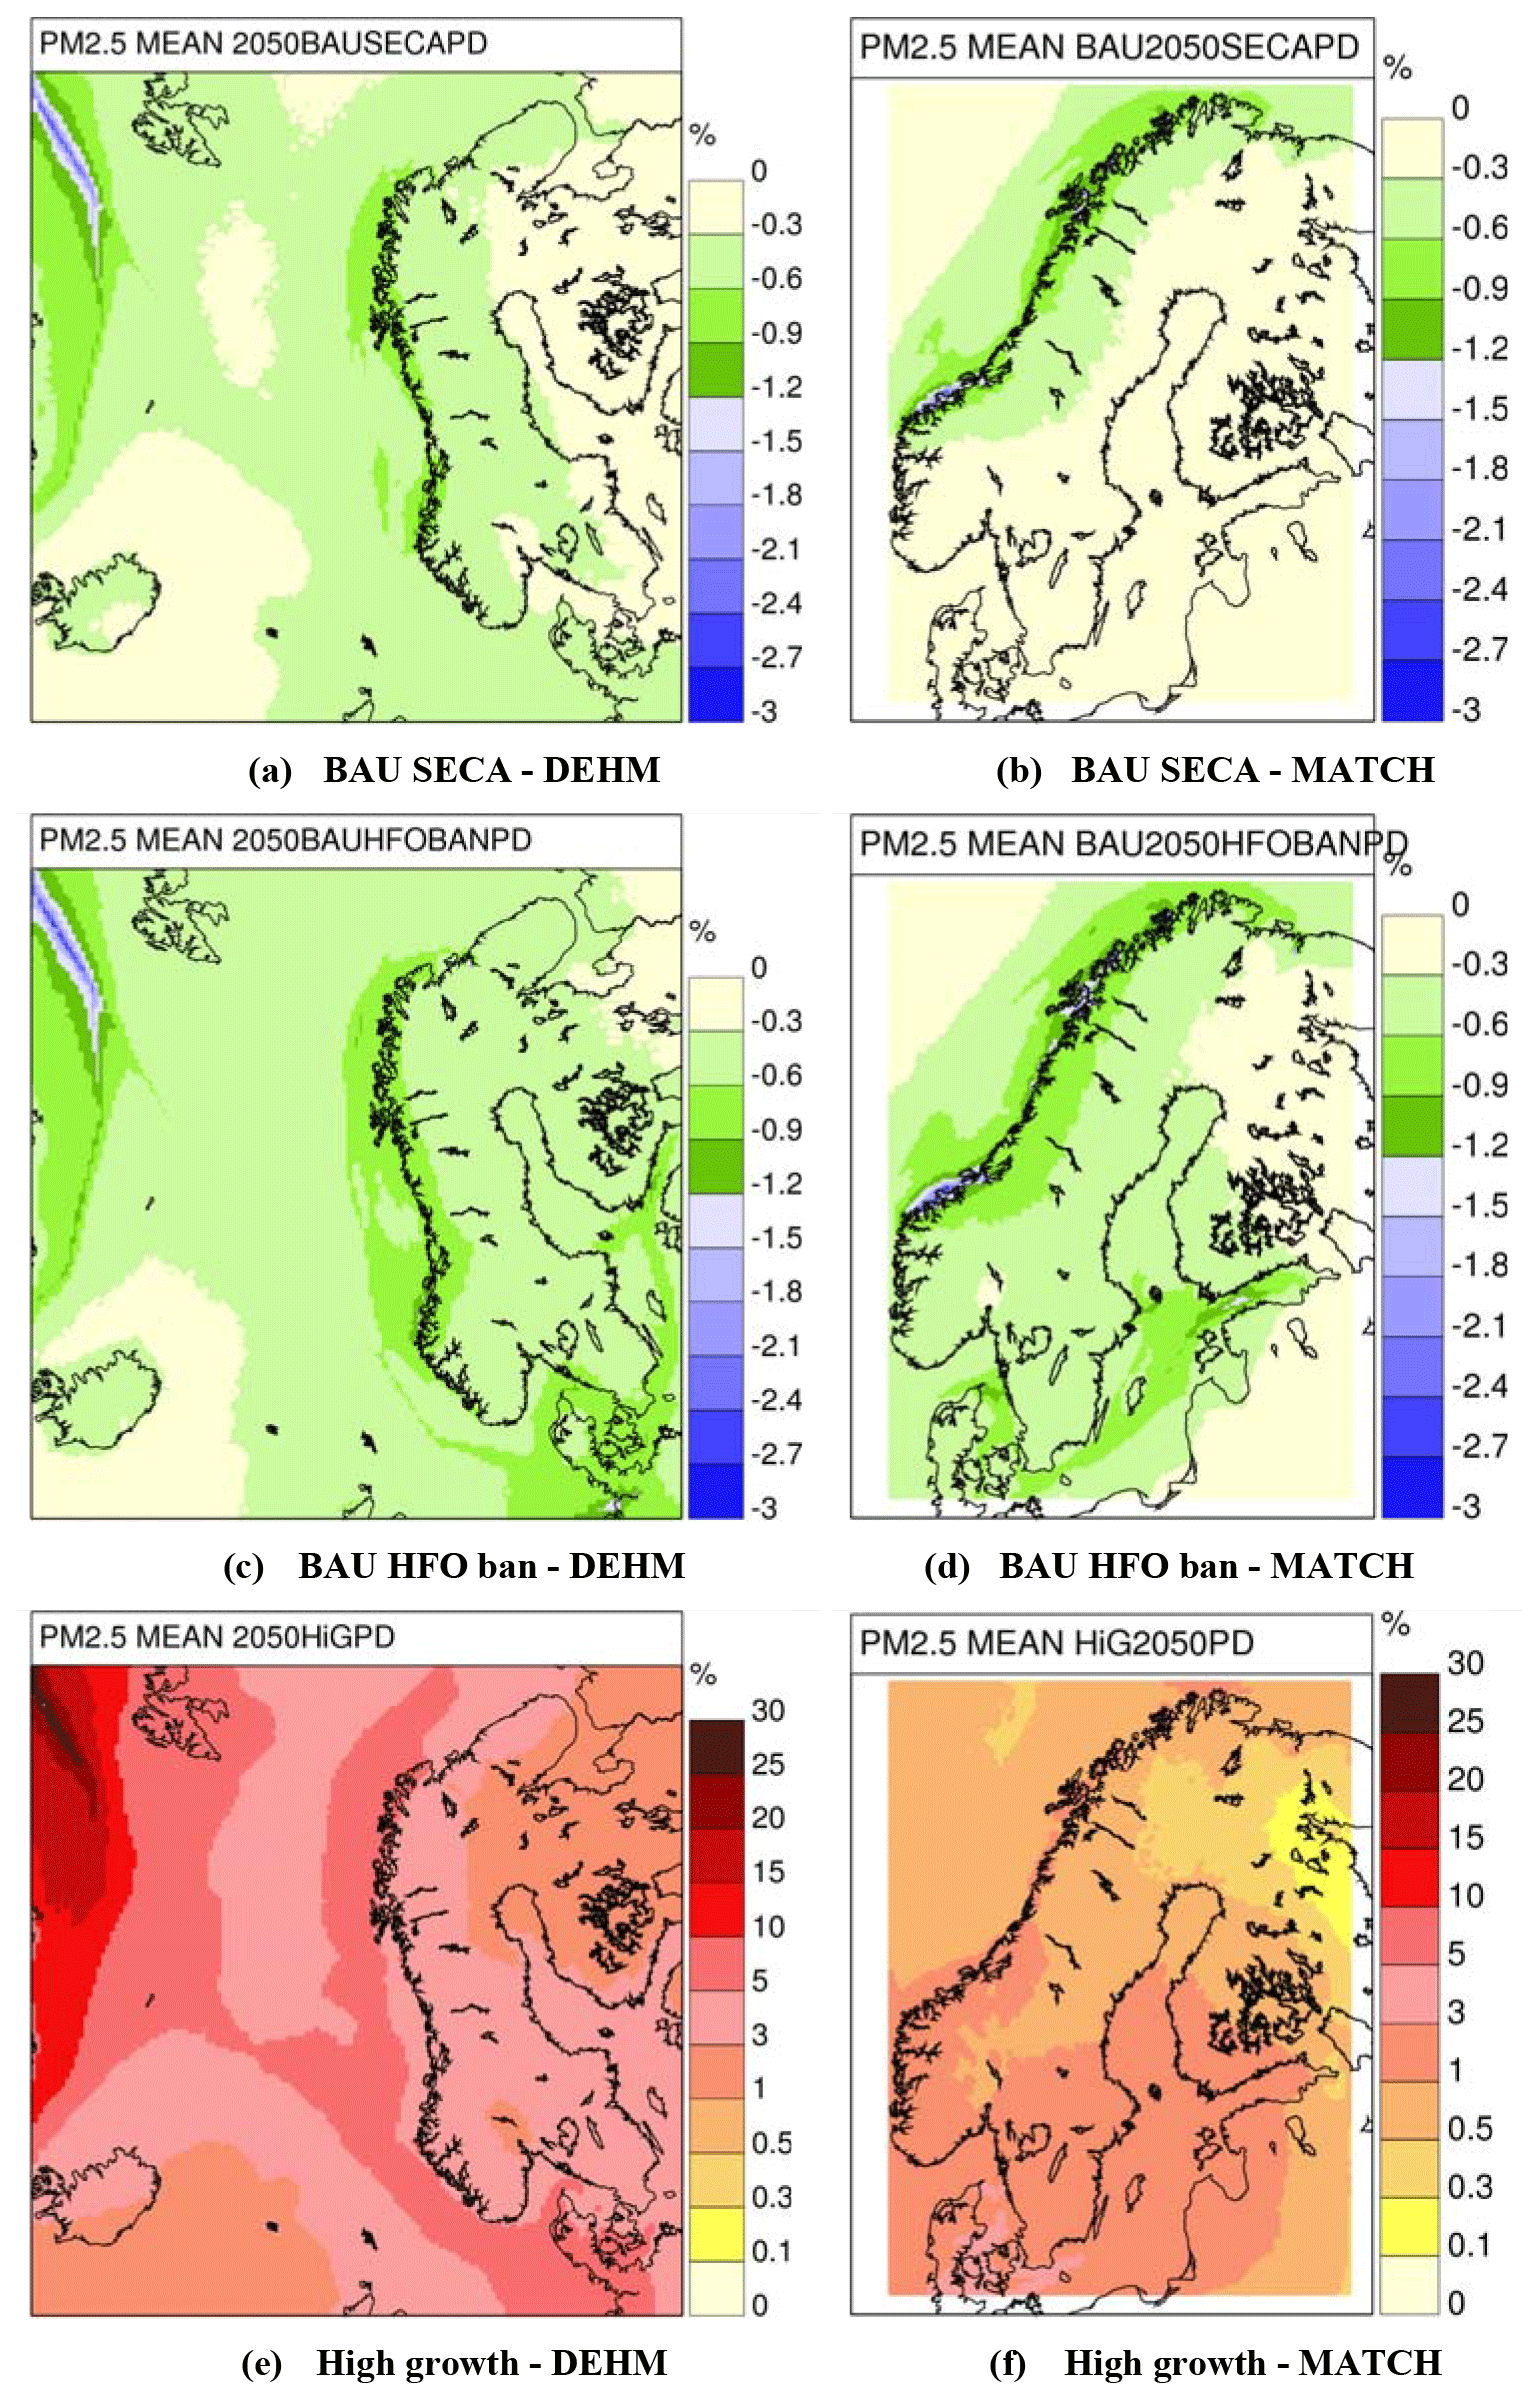
Figure 7The percentage difference between the BAU Baseline 2050 simulation and the three different ship emission scenarios (including the polar diversion route) as simulated by the two models DEHM (a, c, e) and MATCH (b, d, f). Calculated as, e.g. (2050BAU_SECA − 2050BAU) 2050BAU ⋅ 100 %.
For 2050 the difference between the BAU Baseline simulations and the simulations including the BAU SECA, BAU HFO ban and HiG Baseline shipping scenarios (land-based emissions are unchanged in all scenarios) can be analysed in detail based on the percentage difference maps given in Fig. 7.
With the SECA scenario (Fig. 7a and b), a small decrease in the PM2.5 concentration is seen outside the current Baltic Sea and North Sea SECA areas compared to the BAU scenario. Along the Norwegian coast, the two models project a decrease in PM2.5 concentration between 0.6 %–1.5 %, whereas smaller changes are seen across the other countries.
In the HFO ban scenario (7c and d) a slightly larger decrease is seen in most of the domain, and the PM2.5 levels along shipping routes in the Baltic and around Denmark are up to 1.5 % lower than in the Baseline, and like in the SECA scenario the largest decrease (ca. 2 %) is seen along part of the Norwegian coast in the MATCH simulation. These changes in the PM2.5 levels are, as described in Sect. 3.1.2, linked to decreased SO2 emission in both the SECA and HFO ban shipping scenario, which leads to a decrease in the formation of secondary inorganic aerosols and hence total PM mass. The HFO ban scenario also includes a decrease in the BC, which leads to small decrease in the primary PM part in the models.
The HiG scenario will, on the other hand, result in an increase in the PM2.5 concentration compared to the BAU scenario (Fig. 7e and f). Here an increase in the PM2.5 levels of up to 1 %–5 % is seen across Finland, Norway and Sweden and is even higher over Denmark according to the DEHM results. Somewhat lower values are seen in the MATCH results.
In terms of health impacts resulting from the developments in total BAU emissions the total number of 9900 ± 10 % (mean of DEHM-EVA and MATCH-EVA) in 2015 is projected to decrease to about 8300 (only DEHM-EVA) in 2030 and further to 7900 ± 6 % in 2050 in the current study. The MATCH-EVA setup gives the highest number of premature deaths in 2050 (8200 premature deaths), mainly due to larger areas of predicted increases in PM2.5 than DEHM (7700 premature deaths).
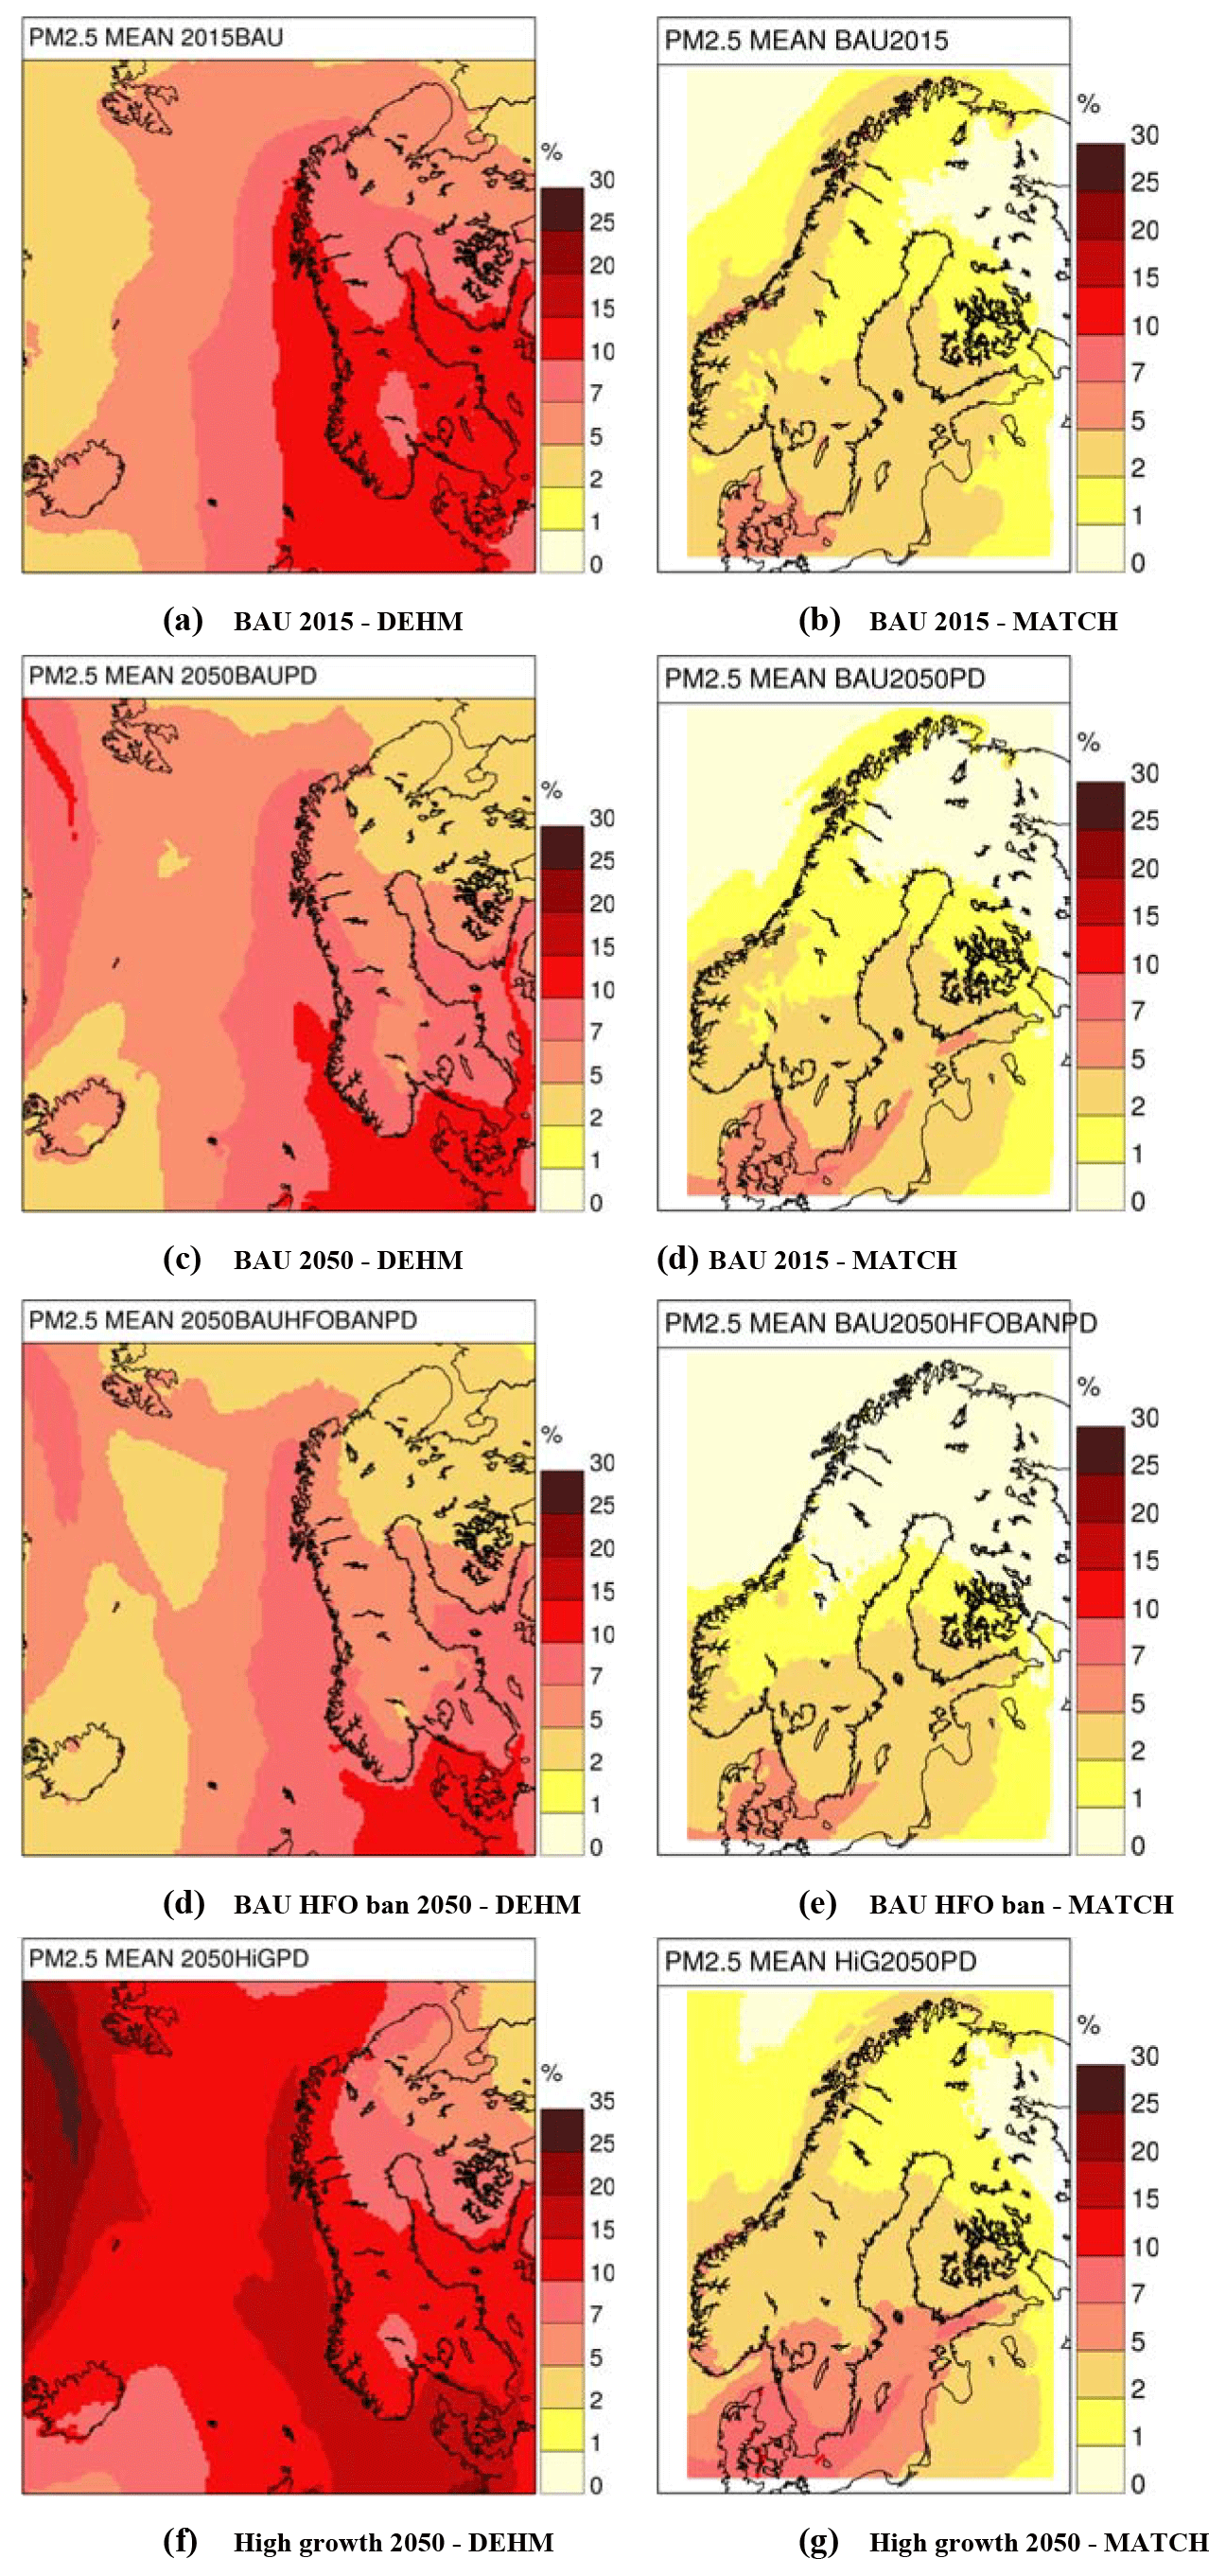
Figure 8The contribution from shipping to the PM2.5 annual levels as simulated by the two models for the present day and three different shipping emission scenarios for 2050. Calculated using, e.g. (2015BAU − 2015BAU_70 % 0.3) 2015BAU ⋅ 100 %, where 2015BAU_70 is a run where the shipping emissions have been reduced to 70 %.)
3.4 The contributions from shipping
The specific model simulations with shipping emissions reduced by 30 %, can for each scenario be used to quantify the contributions from shipping to both the air pollution levels and the related health impacts. In terms of the annual PM2.5 concentration, the contribution from shipping for all scenarios (given as % of total PM2.5 in Fig. 8) is highest along shipping routes and in coastal regions, giving a similar spatial pattern for both the DEHM and the MATCH models. For the current 2015 Baseline, about 7 %–15 % of the annual mean PM2.5 concentration over the majority of the Nordic land area is linked to shipping in the DEHM results, while the MATCH results point to 1 %–10 % for the same areas. This is in line with a recent study based on the EMEP model, where the contribution from shipping to the averaged PM2.5 concentration in the Nordic countries ranged from about 5 % in Finland to about 13 % in Denmark (Jonson et al., 2020).
From Fig. 8c–g it can be seen that only small changes are projected for this contribution in the future according to the MATCH model, while the DEHM results for both the BAU 2050 scenario and the HFO ban 2050 scenario show a decrease in part of the area. The increased traffic in the HiG Baseline scenario increases the overall contribution from shipping, and thus it is higher than in 2015.
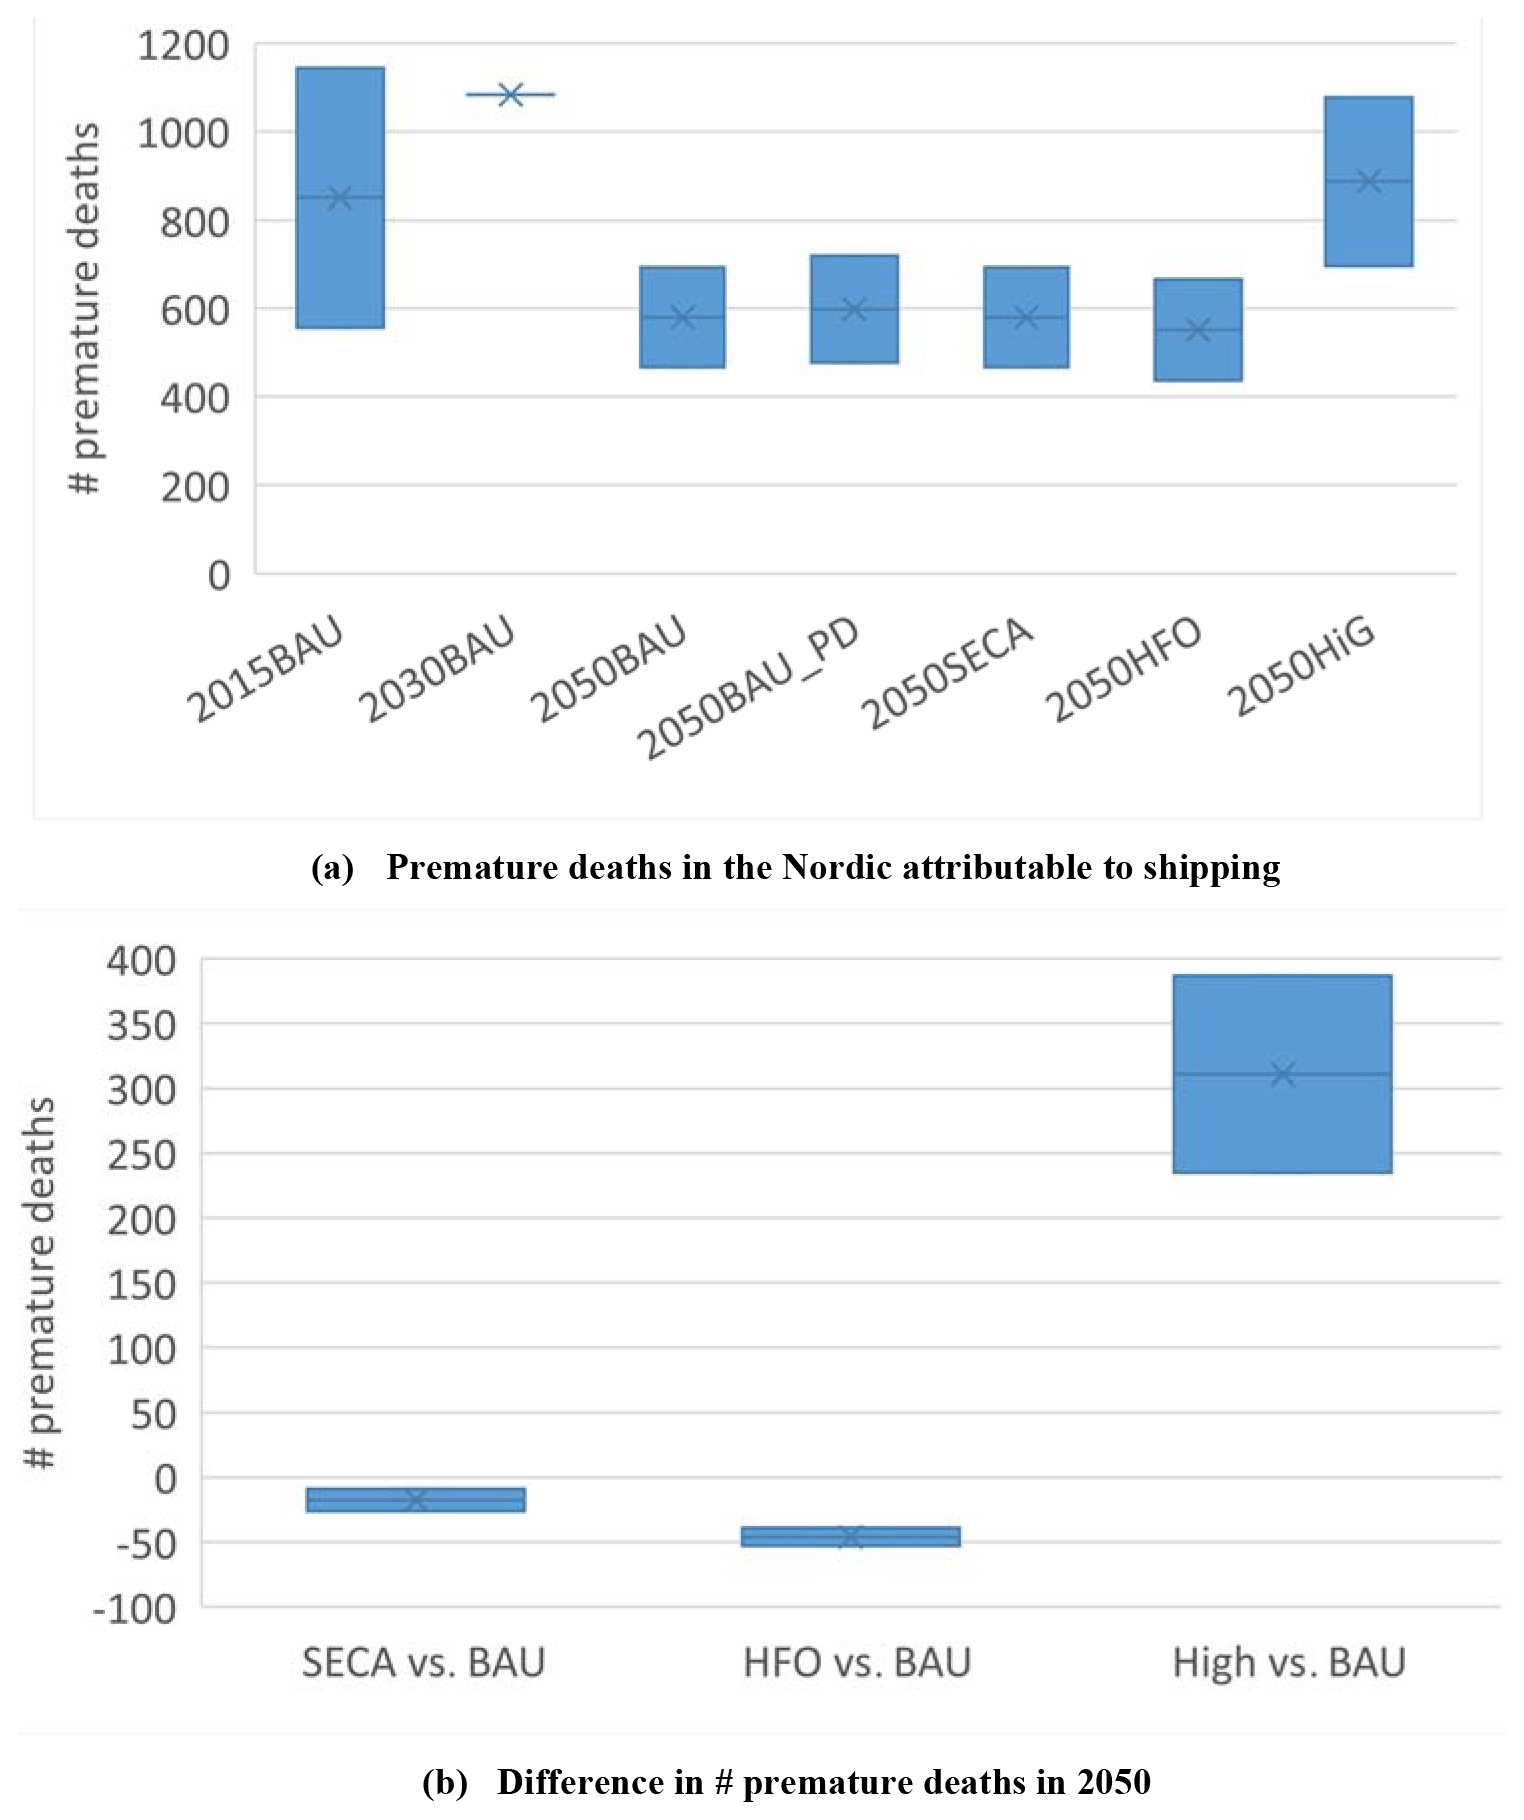
Figure 9(a) The estimated number of premature deaths attributable to shipping. The difference between 2050BAU and 2050BAU_PD shows the impact from polar diversion routes. Note that the 2030BAU and the SECA, HFO and HiG scenarios also includes the polar diversion routes. (b) Zoom in on the difference between the scenarios and BAU in 2050.
The estimated number of premature deaths attributable to shipping can be seen in Fig. 9a. As a mean over the two models this amounts to approximately 850 premature deaths under present-day conditions, decreasing to just below 600 cases in the 2050 BAU Baseline scenario and to about 580 and 550 in the BAU SECA and BAU HFO ban scenarios. In the HiG Baseline scenario this number is projected to increase to almost 900 cases and hence to a value that is slightly higher than today. Details on numbers for each country are given in Fig. S6 in the Supplement. In Fig. 9b the resulting differences in the number of premature deaths in 2050 is shown. Only a small decrease (> −20 premature deaths) is seen for the SECA scenario. The HFO ban scenario has a somewhat larger effect and would decrease the number of premature deaths in 2050 with almost 50 cases in the Nordic area compared to the BAU Baseline. The HiG scenario, on the other hand, is projected to increase the number of premature deaths in the Nordic area by approximately 300 cases in 2050.
A recent study finds that long-term exposure to PM2.5 from shipping can be associated with 5.5 premature deaths per 100 000 inhabitants per year in eight Mediterranean coastal cities (Viana et al., 2020). For comparison, the 850 deaths in the Nordic area corresponds to approximately 3.2 premature deaths per year per 100 000 inhabitants. This is somewhat lower than the number for the Mediterranean cities, but this seems reasonable since several of the included cities in Spain and Italy are located in areas with significant shipping activity.
Like for PM2.5 described above, the contribution from ships is around 11 % of the total number of premature deaths when based on the DEHM-EVA simulation for 2015. When based on the parallel MATCH-EVA results, the estimated contribution from shipping is ca. 6 %. In the DEHM BAU Baseline, BAU SECA and BAU HFO ban simulations for 2030 this fraction increases somewhat to about 13 %, before it decreases to ca. 9 % in the 2050 scenarios. In the HiG Baseline scenario the fraction is ca. 15 % in 2030, with a decrease to 13 % in 2050.
The future scenarios discussed here all include the polar diversion as described in Sect. 3.1.3. To isolate the effect of this, simulations have been made with the 2050 BAU Baseline scenario with and without the polar diversion. In terms of health effects, the additional emission leads to 10–30 premature deaths in the Nordic area.
3.5 Shipping and related depositions in the Arctic
The second domain in the DEHM model (d02) covers the Arctic region, and in the following the impact of the shipping scenarios are briefly analysed for two components (BC and total nitrogen (N) deposition) within the Arctic area, where we here focus on the modelled deposition of these components.
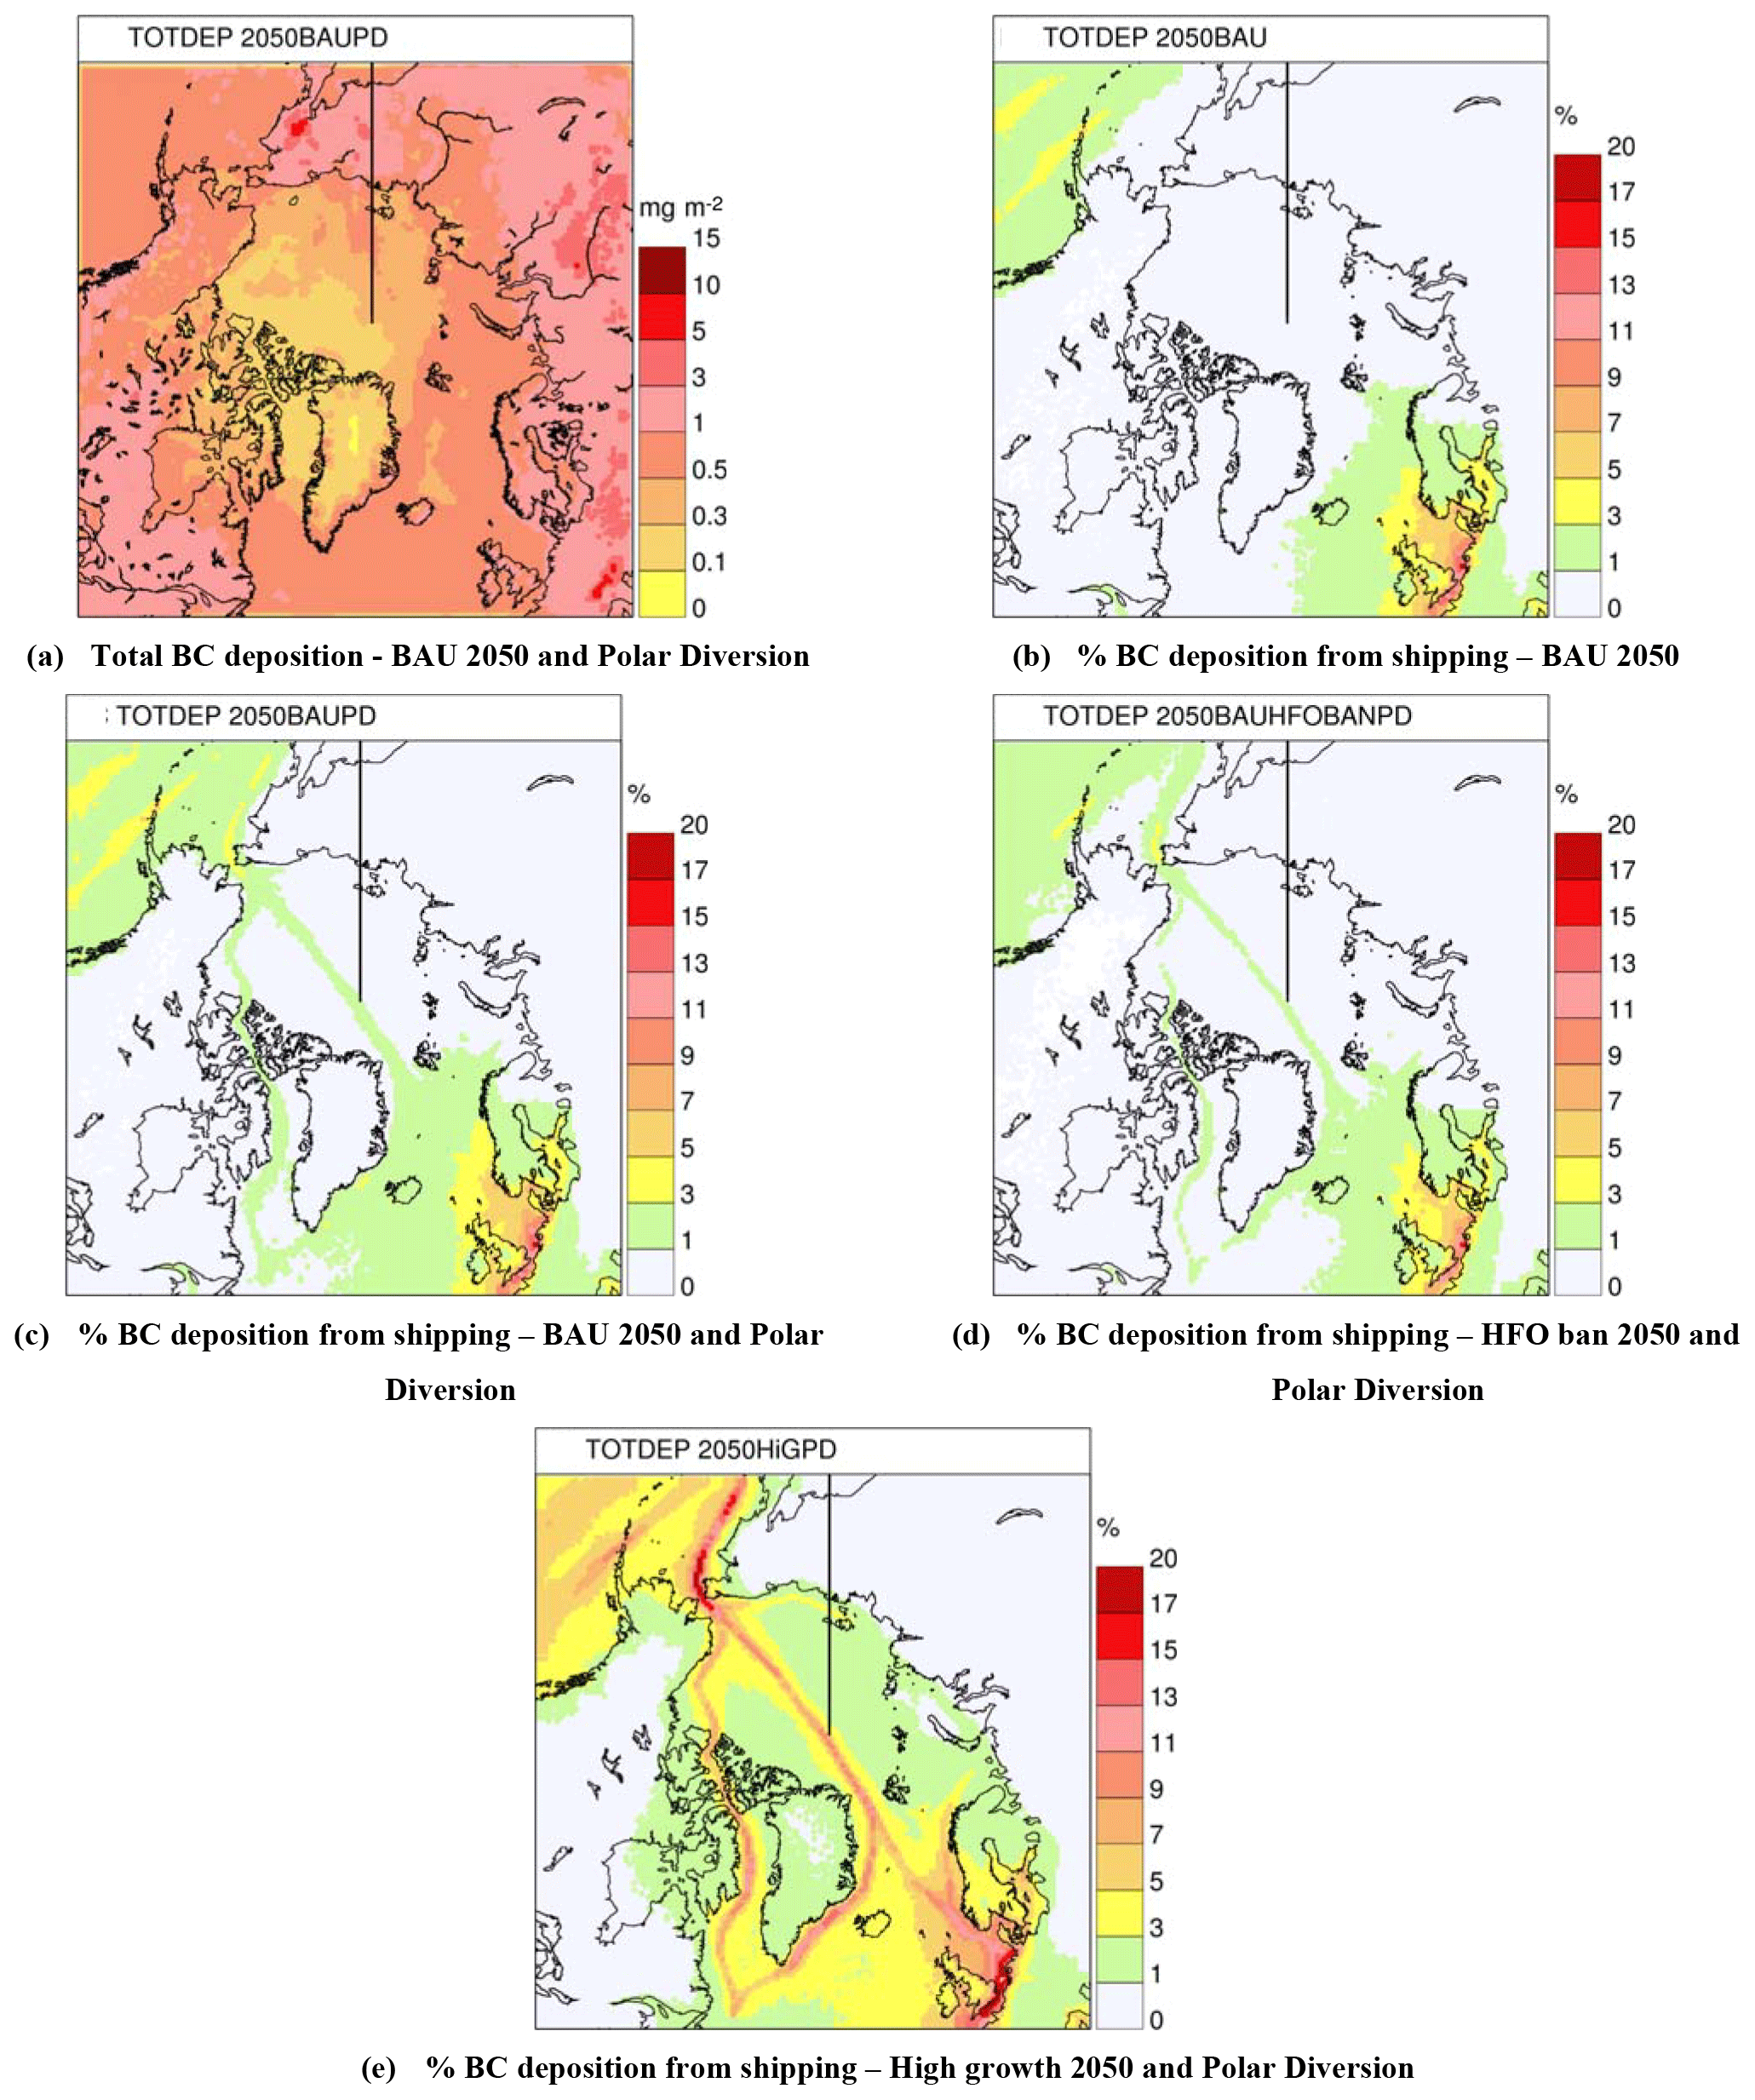
Figure 10(a) The total BC deposition across the Arctic and Nordic regions in the BAU 2050 scenario in the DEHM d02 domain. Panels (b) and (c) display the contribution from shipping without and with the polar diversion, while panels (e) and (d) display the contribution in the HFO ban and High-Growth traffic scenarios (both including the polar diversion).
A map of the BC deposition is given in Fig. 10a for the DEHM BAU Baseline 2050 simulation (for the d02 domain with a horizontal resolution of 50 km × 50 km). The deposition of BC under both present day and future conditions show the same overall pattern, with a gradient towards the Arctic area, where the deposition level is low (< 1 mg m−2). With the included emissions in the Baseline scenario (including both land-based and shipping emissions), the deposition is projected to decrease by −1 % to −10 % across the Arctic towards 2050. The overall contribution from shipping to the BC deposition in the Arctic is very low and below 1 % in most of the Arctic area, as can be seen from Fig. 10b (the pattern is very similar for the 2015 simulation). In the simulation including the new diversion shipping routes (Fig. 10c), contributions of up to 3 % can be seen along the ship routes across the Arctic Sea and in Baffin Bay, along the coast of Ellesmere Island, Canada and Northwest Greenland. The contribution will be higher during summer, when the shipping activity along these routes peaks. In 2050 the emission along the new diversion routes will constitute approximately 50 % of the BC related to shipping in the area.
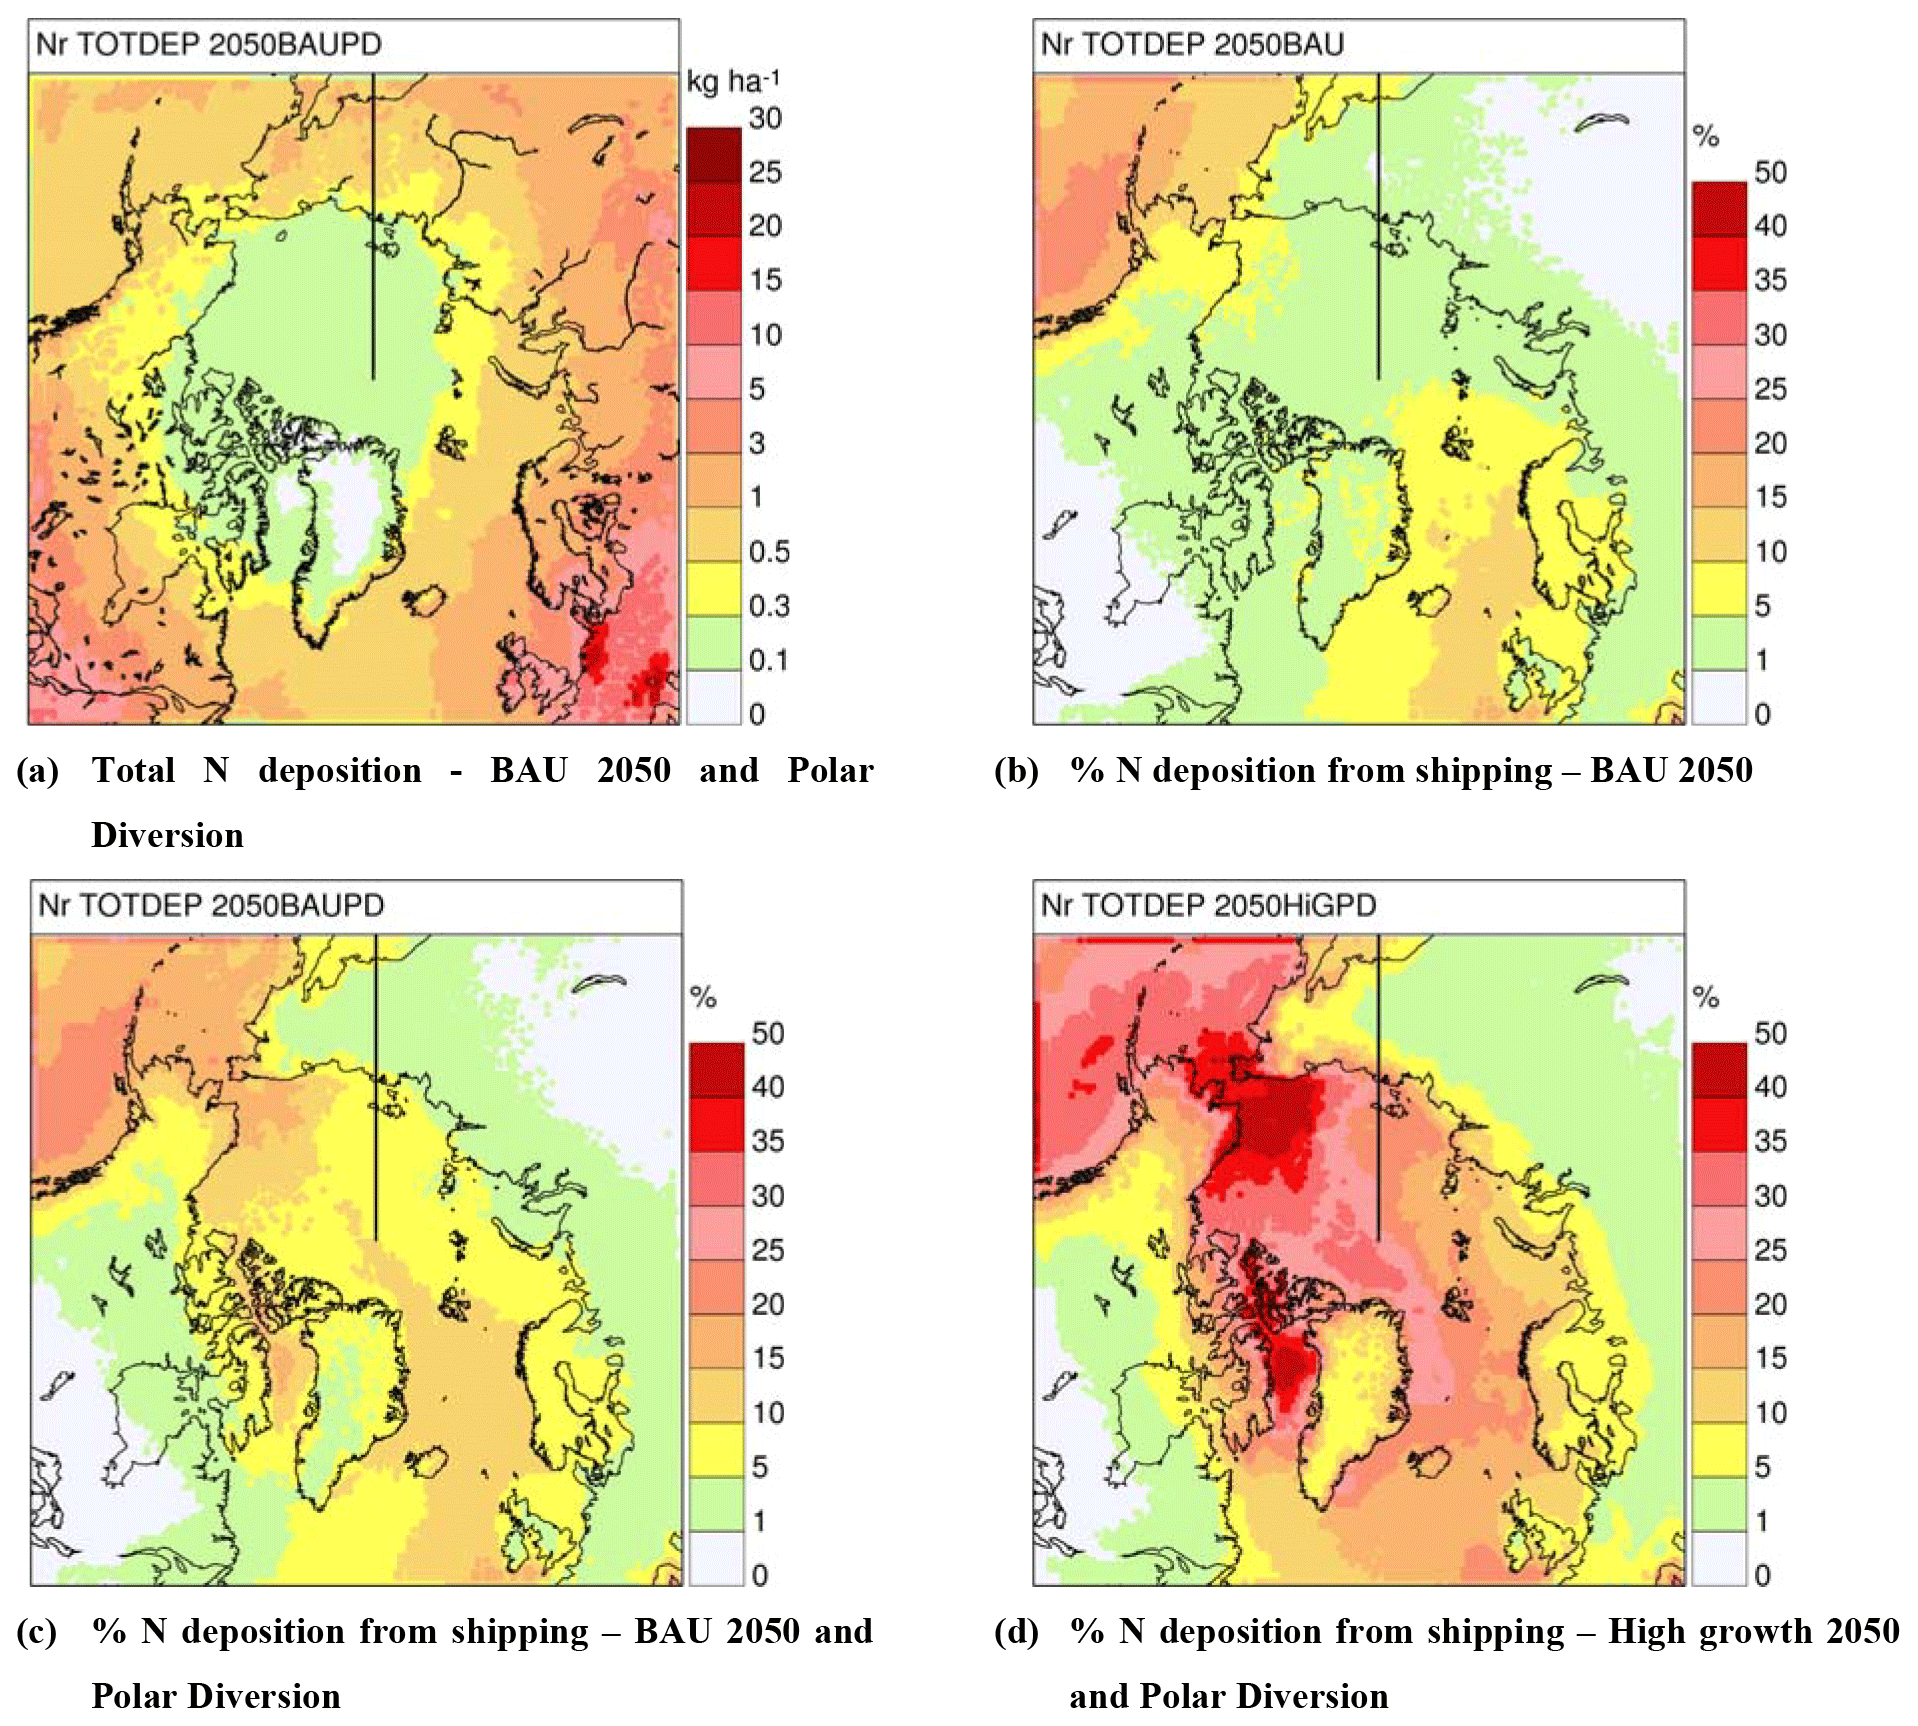
Figure 11(a) The total nitrogen deposition across the Arctic and Nordic region in the BAU 2050 Polar diversion scenario in the DEHM d02 domain. Panels (b) and (c) display the contribution from shipping without and with the polar diversion, while (d) displays the contribution in the High-Growth traffic scenario (including the polar diversion).
As described in Sect. 3.1 for the Nordic region, the future mitigation scenario with an HFO ban will have the largest impact on the BC emissions, and for the Arctic this scenario leads to a decrease of about 12 % compared to the BAU Baseline for 2050 (see Winther et al., 2017 for details). When comparing the simulations, where the polar diversion route is included, the results show that an HFO ban will lead to reductions of a few percent in the BC deposition in the Arctic, mainly along the shipping routes (Fig. 10d).
In the scenario describing a high growth in the shipping traffic (HiG), the contribution can increase to 5 %–15 % along the shipping routes as seen in Fig. 10e. Also in areas further away from the routes, a general increase in the contribution from shipping is seen. In an earlier study using a global model and a similar HiG scenario, Browse et al. (2013) found comparable increases in the contribution from shipping towards 2050 and they conclude that shipping could have a significant impact on the albedo in this area. The deposition of BC on snow and ice decreases the albedo and increases the absorption of incoming solar radiation, which can lead to earlier melting (AMAP, 2011).
Globally, observations and modelling results indicate that radiative forcing (RF) induced by BC on snow and ice is highest in the mid-latitudes (Bond et al., 2013; Kang et al., 2020). While BC in the atmosphere can lead to a direct RF of +0.71 W m2, its semi- and indirect effects can be up to +0.23 W m2. Sand et al. (2013) showed the Arctic (> 60∘ N) sources of BC lead to a surface warming of 2.3 K, 1.6 K of which is attributed to the effect from BC deposited on snow and sea ice. Sand et al. (2016) estimated that BC in the atmosphere and snow leads to an Arctic warming of 0.48 K. Sand et al. (2013, 2016) showed for per unit emissions that sources in the Arctic have a factor of 2 higher impact on Arctic warming compared to sources outside the Arctic. These findings imply that increased BC emissions from shipping activities in the Arctic can have a large effect on the Arctic climate even though these emissions are small compared to global emissions.
Overall, the BC emissions in the Arctic are projected to increase towards 2050 in the current study. The SECA scenario will limit the BC emission by about 3 % in the Arctic (north of 60∘ N) in both traffic scenarios, while the HFO ban will have a higher impact and limit the emissions by up to about 14 % in the HiG traffic scenario (Winther et al., 2017). A HFO ban can thereby limit part of the emissions increase following the HiG traffic scenario but not all of it.
The map of total nitrogen (N) deposition is given in Fig. 11a for the DEHM BAU Baseline 2050 simulation (the d02 domain, 50 km × 50 km resolution). Like for BC, the deposition of N under both present-day and future conditions shows a clear gradient towards the Arctic area and is generally low (< 1 ) across the Arctic. Within the d02 model domain, the changed emissions between 2015 and 2050 lead to an overall decreasing N deposition across North America and Europe and towards the north but an increase in the Russian area. This is reflected in the projected deposition to the Arctic area, where the largest decrease of about 20 % is seen towards the North Atlantic, while a decrease of only a few percent is seen for the high Arctic (as the distribution is very similar in 2015 and 2050, only the latter is shown in Fig. 11a).
In a previous modelling study with a focus on the Canadian Arctic, Gong et al. (2018) estimated the present day annual N deposition to be on the order of 0.2–1 kg N ha−1 within the Canadian sub-Arctic and 0.05–0.2 kg N ha−1 over the Canadian high Arctic, which overall is similar to the levels estimated in the present study.
The shipping scenarios set up in the current study only impact the NOx emissions through developments in ship traffic and new diversion routes. The contribution from shipping in 2050 without (Fig. 11b) and with the new routes (Fig. 11c) is seen to be slightly higher than for BC and more “widespread” due a lower lifetime of the N components. The contribution is on the order of 1 %–10 % without the new routes, whereas the contribution reaches up to about 15 %–20 % along the new diversion route in Baffin Bay, and hence along the coast of Ellesmere Island, Canada and Northwest Greenland. If the traffic develops along the HiG traffic scenario (Fig. 11c), the contribution from shipping increases to more than 20 % in large parts of the Arctic and to even above 40 % in Baffin Bay and in part of the Arctic Sea. The Arctic ecosystems are adapted to nutrient-poor conditions, and critical loads for N depositions are hardly exceeded during present-day conditions (Forsius et al., 2010). But as also outlined by Forsius and colleagues, the N cycle in ecosystems is very complex and highly sensitive to increasing N depositions that can lead to significance changes in, e.g. inter-species relationships.
Future projections and health assessments are inherently associated with uncertainties. In the following section, some of the uncertainties and limitations of the presents study are discussed.
Future developments in shipping traffic are in this study based on Corbett et al. (2010), which to our knowledge was the only dedicated shipping traffic forecast for the Arctic available when our scenarios were developed. They assume a strong growth of shipping in the Arctic areas. There are, however, several factors that will have an impact on the popularity of the Arctic ship routes and hence on the future traffic growth. First is the extent of receding sea ice, which will make Arctic routes more manoeuvrable and viable for ships. Second is the geopolitical situation, as local icebreaker assistance may be necessary for safe navigation in Arctic waters. Third are the expenses, fuel, personnel and insurance (Sarrabezoles et al., 2016) costs, which complicate the evaluations of economic viability of the Arctic sea routes. However, the assumed traffic scenarios of Corbett et al. are used here for consistency with other previous studies and to study the magnitude of changes concerning the fuel restrictions in the scenarios.
In terms of likelihood, the HFO ban scenario seems most likely at the moment as the IMO has recently (at the MEPC75 meeting in November 2020) adopted a HFO ban. This ban includes use and carriage of HFO in Arctic waters from 1 July 2024 onwards. However, there are exemptions to this for countries with coastlines bordering Arctic waters. The HFO ban will enter into force for all vessels from July 2029. This will, however, require that vessels operating at higher latitudes move away from the use of, e.g. hybrid fuels, like very-low-sulfur fuel oil, and the use of these fuels has increased considerably since the introduction of global 2020 sulfur cap.
We then combine the shipping scenarios with the ECLIPSE V5a (current legislation) land-based emission scenario to project future impacts on air pollution levels and human health. However, emission changes are not the only factor that have an impact on future developments in air pollution levels. A changed climate will also impact future levels, both directly through altered transport patterns; changed temperatures, precipitation, and sunshine impacting chemical transformations; and removal processes, as well as indirectly through changed biogenic emissions and deposition due to changes in growing season of vegetation (Andersson and Engardt, 2010), which is an important sink of many reactive tropospheric trace gases such as O3. Numerous previous studies have been conducted to investigate the impact of climate change on air pollution levels in Europe; e.g. Colette et al. (2015) summarizes the climate penalty of O3 in Europe. The studies are conclusive: although climate change until 2050 has an impact on near-surface O3 concentrations (e.g. Langner et al., 2012), particle concentrations (Hedegaard et al., 2013; Lacressoniere et al., 2017) and deposition of N (Simpson et al., 2014), the main factor of future evolution until mid-century is overall the emission changes.
There are differences in the results for the current and future scenarios from the two CTMs. MATCH projects a lower exposure in general, and the changes in the future differ. For example, MATCH projects a wider spread increase in PM2.5 in the Nordic area than DEHM. The fact that we are using two models should be seen as a benefit to illustrate uncertainties in the projections. The main message is robust, but spatial patterns differ and are more uncertain. There may be various reasons for these differences, ranging from the higher resolution in the MATCH setup, differences in chemical scheme and differences in the long-range transported (LRT) component from continental Europe. The LRT component is weaker in MATCH, which could partly be due to differences in meteorological forcing but also due to differences in parameterized deposition processes. It is expected that models with different physical descriptions and setups give some differences in the resulting air pollution distributions and that the inclusion of several models hence provides valuable insight into CTM uncertainty. An ensemble of models usually performs better than individual models (Marecal et al., 2015), and an interval gives an indication of the uncertainties involved. This has been used in other studies, e.g. HTAP/AQMEII (Solazzo et al., 2012a, b; Im et al., 2015a, b), EDTRENDS (Colette et al., 2017; Vivanco et al., 2018; Ciarelli et al., 2019b) and ENSCLIM (e.g. Simpson et al., 2014; Soares et al., 2016).
As illustrated in Figs. 8 and 9, the differences between the two models are also clearly seen in the percentage contribution from shipping to the overall PM2.5 level and the estimated number of premature deaths attributable to shipping. This was also seen in a recent study focusing on the Baltic Sea region. Here three different CTMs were compared and significant differences were found in the estimated contribution from shipping, which was mainly linked to differences in the schemes for inorganic aerosol formation (Karl et al., 2019).
The health assessment in the current study is based on the modelled air pollution maps with a resolution of 16.67 km × 16.67 km grid across the Nordic area. The estimated number of premature deaths related to air pollution can therefore be somewhat underestimated as the high air pollution levels in urban areas with high population density will not be fully resolved at this resolution. National assessments of health effects for Denmark (see, e.g. Ellermann et al., 2020) and the Nordic area (Lehtomaki et al., 2020) made with the same EVA system as applied here but based on higher-resolution air pollution modelling (1 km × 1 km with the Danish UBM model) point towards a higher number of premature deaths than in the present study. Additionally, as described earlier, the EVA system employs a linear exposure–response relationship based on the recommendations of WHO (WHO, 2013). However, recent studies show that the shape of the relative risk vs. pollutant concentration can change from region to region and may not be linear (e.g. Burnett et al., 2018). Some studies have shown that in low-pollutant regions, such as the Nordic region, non-linear functions give higher negative impact from air pollution than linear functions, while in high-pollutant regions, i.e. China or Africa, linear functions give the highest numbers (Im et al., 2018; Bauer et al., 2019).
Finally, it should also be noted that in the projected health assessment we keep the population data constant (at the 2015 number and distribution), even if previous studies have shown that, e.g. an ageing population in both the Nordic area and in Europe in general will lead to a higher sensitivity to air pollution (Geels et al., 2015; Tarín-Carrasco, 2021).
Our focus has been on the Nordic and Arctic region, where we, e.g. find increased deposition of N and BC in the Arctic due to new shipping routes in the future. But these new routes also have the potential to limit the overall CO2 emissions compared to longer routes (Corbett et al., 2010), and air pollution levels and negative health impacts could be lowered in other parts of the world. The study by Sofiev et al. (2018) has previously shown that the population of Asia would especially benefit from ship emission reductions.
The full climatic effects of BC emissions are very complex. As described in Kühn et al. (2020) BC in the Arctic atmosphere and on snow and ice can lead to a general warming of the climate. But part of this warming can be counteracted by other processes, as aged BC particle can impact cloud dynamics that have a cooling effect. It is outside the scope of the current work to make an assessment of the different climate feedbacks related to BC in the Arctic.
We have set up new global shipping emission scenarios including potential mitigation options either based on additional fuel quality requirements (heavy fuel oil ban) or on an expansion of the existing ECA areas. The scenarios are considered in terms of two alternatives for the development in traffic: a Business-As-Usual (BAU) and a High-Growth (HiG) traffic scenario and for the years 2015 (our base year), 2020, 2030 and 2050. Overall, the projected increase in traffic is to some degree counteracting the effects of technological developments and fuel requirements, leading to different trends for the different components. When focusing on the Nordic area, the projections display that Baseline NOx emissions will go down by approximately 40 % (HiG traffic) to 60 % (BAU traffic) towards 2050 due to improved technology. The fuel consumption and NOx emission totals calculated for the SECA and HFO ban scenario equal the Baseline scenario. For SO2 the Baseline projections include a decrease on the order of 40 %–50 % in 2050 compared to 2015. Here the largest drop is seen from 2020 due to the global 0.5 % sulfur cap. In all scenario years, for SO2 the calculated emissions for the SECA and HFO ban scenarios are close to 30 % lower than the emissions calculated for the Baseline scenario within the Nordic domain. Due to a different development in BC emission factors, the BC emissions increases are 20 %–70 % in the Baseline for 2050 and only a small (1 %–2 %) reduction is obtained in the future years in the SECA scenario in both traffic growth cases. For the HFO ban scenario in 2020 [2030, 2050] with BAU traffic, the BC emissions are 9 % [12 %, 16 %] smaller than the Baseline results, while slightly larger emission reductions are obtained in the HiG traffic scenario.
In combination with a scenario for the land-based emissions, the two chemistry transport models DEHM and MATCH have been used to simulate the developments in the overall air pollution towards 2050 and also the contribution related to shipping alone. By using the health assessment model EVA, we estimate that for the Nordic area the number of premature deaths related to air pollution will decrease from approximately 9900 (9400–10 400) in 2015 to 7900 (7700–8200) in 2050. This correspond to a decrease from approximately 37 premature deaths for every 100 000 Nordic inhabitants in 2015 and to approximately 30 in 2050. The range of the numbers given in brackets represents the results for the two models and illustrates the uncertainties related to this kind of assessment, e.g. related to differences in the setup of the two CTMs. Changes in climate and population demography are disregarded here, where meteorological and population data for 2015 are used in all simulations.
Shipping contributes to 1 %–15 % of the PM2.5 levels in the Nordic region, with the highest contribution along the shipping routes and in coastal areas. In terms of health impact, we estimate that shipping emissions lead to about 850 (560–1100) premature deaths during present-day conditions (as a mean over the two models). With the 2050 Baseline BAU scenario this number will decrease to approximately 600 (480–720) cases. Seen in relation to the total population in the Nordic region this corresponds to about 3 premature deaths per 100 000 inhabitants in 2015, decreasing to about 2 in 2050. Introducing additional mitigation options as assumed in the heavy fuel oil (HFO) ban scenario, the number of premature deaths attributable to shipping emissions will be on the order of 550 (440–670) in 2050. The SECA scenario will have less impact in the Nordic area. If the shipping traffic follows a High-Growth (HiG) path and no additional mitigation options are introduced, the negative health impact will increase, and the number of premature deaths will be on the order of 890 (700–1080) in 2050. In terms of health impacts in the Nordic area, the HFO ban BAU traffic scenario can be regarded as the “best case”, while the Baseline HiG traffic scenario must be regarded as the “worst case”.
When moving the focus further towards the north, we investigate the impacts of new potential ship traffic routes in the future Arctic and the effect of expanding requirements from current SECA areas and a HFO ban to the full Arctic region. The new diversion routes will make shipping traffic a more important source for BC and N in parts of Arctic, especially along the shipping routes. If the development in traffic follows the High-Growth path, the simulations show significant increases in the deposition. The mitigation scenarios will limit the contribution from shipping slightly, but the deposition is in general low in the Arctic.
This study addresses this topic, which was recently debated at the International Maritime Organization, and reports the results for various emission mitigation options for ships operating in Arctic areas. Health benefits of an Arctic HFO ban and an Arctic SECA have been quantified by considering the health effects in Nordic countries. It is very likely that full benefits of fuel restrictions in Arctic areas will be delayed because of the recent decision of IMO MEPC75 to relax the fuel requirements for some ships belonging to the Arctic fleets and postpone the full HFO ban until 2029. By setting up these new shipping emissions scenarios that follow on-going discussions for mitigation options and evaluate the impacts in terms of health impacts in the Nordic region and depositions in the Arctic, this study can add to the science-based evaluation of potential mitigation strategies for shipping emissions. It also adds to the recent work of the IMO Fourth GHG study (Faber et al., 2020) and updates regional Arctic emission scenarios and BC emissions from ships, considering the atmospheric transport of pollutants.
The global shipping emission scenarios have been published at https://doi.org/10.5281/zenodo.4322247; see Geels et al. (2020).
The supplement related to this article is available online at: https://doi.org/10.5194/acp-21-12495-2021-supplement.
CAG, MW, JPJ, CA designed the study. MW, JC and JPJ made the shipping emission scenarios. CAG and CA carried out the simulations and model evaluations with DEHM and MATCH. CAG made the health assessment with contributions from UI, LMF and JBR. WL prepared the plots. All authors contributed to the analysis of the results. CAG prepared the paper with contributions from all co-authors.
The authors declare that they have no conflict of interest.
Publisher's note: Copernicus Publications remains neutral with regard to jurisdictional claims in published maps and institutional affiliations.
The authors thank the Nordic Council of Ministers for funding the project Emissions from shiPs and the Impacts on human healTh and envirOnMEnt in the Nordic/Arctic – now and in the future (EPITOME); NordForsk under the Nordic Programme on Health and Welfare (Project 75007: Understanding the link between Air pollution and Distribution of related Health Impacts and Welfare in the Nordic countries, NordicWelfAir); the European Union's Horizon 2020 research and innovation programme under grant agreement no. 820655 (EXHAUSTION) and no. 874990 (EMERGE); the 2017–2018 Belmont Forum and BiodivERsA joint call for research proposals, under the BiodivScen ERA-Net COFUND programme BioDiv-Support project; and the funding organizations AKA (Academy of Finland contract no. 326328), ANR (ANR-18-EBI4-0007), BMBF (KFZ 01LC1810A), FORMAS (contract nos. 2018-02434, 2018-02436, 2018-02437, 2018-02438) and MICINN (through APCIN PCI2018-093149).
This paper was edited by Pedro Jimenez-Guerrero and reviewed by two anonymous referees.
Aakko-Saksa, P., Murtonen, T., Vesala, H., Koponen, P., Nyyssönen, S., Puustinen, H., Lehtoranta, K., Timonen, H., Teinilä, K., Hillamo, R., Karjalainen, P., Kuittinen, N., Simonen, P., Rönkkö, T., Keskinen, J., Saukko, E., Tutuianu, M., Fischerleitner, R., Pirjola, L., Brunila, O.-P., and Hämäläinen, E.: Black carbon measurements using different marine fuels, in: 28th CIMAC world conference, 6–10 June 2016, Helsinki, 2016.
Aksoyoglu, S., Baltensperger, U., and Prévôt, A. S. H.: Contribution of ship emissions to the concentration and deposition of air pollutants in Europe, Atmos. Chem. Phys., 16, 1895–1906, https://doi.org/10.5194/acp-16-1895-2016, 2016.
AMAP: The Impact of Black Carbon on Arctic Climate, edited by: Quinn, P. K., Stohl, A., Arneth, A., Berntsen, T., Burkhart, J. F., Christensen, J., Flanner, M., Kupiainen, K., Lihavainen, H., Shepherd, M., Shevchenko, V., Skov, H., and Vestreng, V., Arctic Monitoring and Assessment Programme (AMAP), Oslo, 72 pp., 2011.
Andersson, C. and Engardt, M.: European ozone in a future climate: Importance of changes in dry deposition and isoprene emissions, J. Geophys. Res., 115, D02303, https://doi.org/10.1029/2008JD011690, 2010.
Andersson, C., Langner, J., and Bergström, R.: Interannual variation and trends in air pollution over Europe due to climate variability during 1958-2001 simulated with a regional CTM coupled to the ERA40 reanalysis, Tellus B, 59, 77–98, https://doi.org/10.1111/j.1600-0889.2006.00196.x, 2007.
Andersson, C., Bergström, R., Bennet, C., Robertson, L., Thomas, M., Korhonen, H., Lehtinen, K. E. J., and Kokkola, H.: MATCH-SALSA – Multi-scale Atmospheric Transport and CHemistry model coupled to the SALSA aerosol microphysics model – Part 1: Model description and evaluation, Geosci. Model Dev., 8, 171–189, https://doi.org/10.5194/gmd-8-171-2015, 2015.
Andersson, C., Alpfjord, H., Robertson, L., Karlsson, P. E., and Engardt, M.: Reanalysis of and attribution to near-surface ozone concentrations in Sweden during 1990–2013, Atmos. Chem. Phys., 17, 13869–13890, https://doi.org/10.5194/acp-17-13869-2017, 2017.
Anenberg, S. C., Belova, A., Brandt, J., Fann, N., Greco, S., Guttikunda, S., Heroux, M.-E., Hurley, F., Krzyzanowski, M., Medina, S., Miller, B., Pandey, K., Roos, J., and Van Dingenen R.: Survey of ambient air pollution health risk assessment tools, Risk Anal., 36, 1718–1736, https://doi.org/10.1111/risa.12540, 2015.
Barregard, L., Molnar, P., Jonson, J. E., and Stockfelt, L.: Impact on Population Health of Baltic Shipping Emissions, Int. J. Env. Res. Pub. He., 16, 1954, https://doi.org/10.3390/ijerph16111954, 2019.
Bauer, S. E., Im, U., Mezuman, K., and Gao, C. Y.: Desert dust, industrialization, and agricultural fires: Health impacts of outdoor air pollution in Africa, J. Geophys. Res.-Atmos., 124, 4104–4120. https://doi.org/10.1029/2018JD029336, 2019.
Bergström, R., Denier van der Gon, H. A. C., Prévôt, A. S. H., Yttri, K. E., and Simpson, D.: Modelling of organic aerosols over Europe (2002–2007) using a volatility basis set (VBS) framework: application of different assumptions regarding the formation of secondary organic aerosol, Atmos. Chem. Phys., 12, 8499–8527, https://doi.org/10.5194/acp-12-8499-2012, 2012.
Bobbink, R., Hicks, K., Galloway, J., Spranger, T., Alkemade, R., Ashmore, M., Bustamante, M., Cinderby, S., Davidson, E., Dentener, F., Emmett, B., Erisman, J. W., Fenn, M., Gilliam, F., Nordin, A., Pardo, L., and de Vries, W.: Global assessment of nitrogen deposition effects on terrestrial plant diversity: a synthesis, Ecol. Appl., 20, 30–59, 2010.
Bond, T. C., Doherty, S. J., Fahey, D. W., Forster, P. M., Berntsen, T., DeAngelo, B. J., Flanner, M. G., Ghan, S., Kärcher, B., Koch, D., Kinne, S., Kondo, Y., Quinn, P. K., Sarofim, M. C., Schultz, M. G., Schulz, M., Venkataraman, C., Zhang, H., Zhang, S., Bellouin, N., Guttikunda, S. K., Hopke, P. K., Jacobson, M. Z., Kaiser, J. W., Klimont, Z., Lohmann, U., Schwarz, J. P., Shindell, D., Storelvmo, T., Warren, S. G., and Zender, C. S.: Bounding the role of black carbon in the climate system: A scientific assessment, J. Geophys. Res.-Atmos., 118, 5380–5552, https://doi.org/10.1002/jgrd.50171, 2013.
Brandt, J., Silver, J., Frohn, L. M., Geels, C., Gross, A., Hansen, A. B., Hansen, K. M., Hedegaard, G. B., Skjøth, C. A., Villadsen, H., Zare, A., and Christensen, J. H.: An integrated model study for Europe and North America using the Danish Eulerian Hemispheric Model with focus on intercontinental transport of air pollution, Atmos. Environ., 53, 156–176, https://doi.org/10.1016/j.atmosenv.2012.01.011, 2012.
Brandt, J., Silver, J. D., Christensen, J. H., Andersen, M. S., Bønløkke, J. H., Sigsgaard, T., Geels, C., Gross, A., Hansen, A. B., Hansen, K. M., Hedegaard, G. B., Kaas, E., and Frohn, L. M.: Contribution from the ten major emission sectors in Europe and Denmark to the health-cost externalities of air pollution using the EVA model system – an integrated modelling approach, Atmos. Chem. Phys., 13, 7725–7746, https://doi.org/10.5194/acp-13-7725-2013, 2013a.
Brandt, J., Silver, J. D., Christensen, J. H., Andersen, M. S., Bønløkke, J. H., Sigsgaard, T., Geels, C., Gross, A., Hansen, A. B., Hansen, K. M., Hedegaard, G. B., Kaas, E., and Frohn, L. M.: Assessment of past, present and future health-cost externalities of air pollution in Europe and the contribution from international ship traffic using the EVA model system, Atmos. Chem. Phys., 13, 7747–7764, https://doi.org/10.5194/acp-13-7747-2013, 2013b.
Browse, J., Carslaw, K. S., Schmidt, A., and Corbett, J. J.: Impact of future Arctic shipping on high-latitude black carbon deposition, Geophys. Res. Lett., 40, 4459–4463, https://doi.org/10.1002/grl.50876, 2013.
Burnett, R., Chen, H., Szyszkowicz, M., Fann, N., Hubbell, B., Pope, C. A., Apte, J. S., Brauer, M., Cohen, A., Weichenthal, S., Coggins, J., Di, Q., Brunekreef, B., Frostad, J., Lim, S. S., Kan, H., Walker, K. D., Thurston, G. D., Hayes, R. B., Lim, C. C., Turner, M. C., Jerrett, M., Krewski, D., Gapstur, S. M., Diver, W. R., Ostro, B., Goldberg, D., Crouse, D. L., Martin, R. V., Peters, P., Pinault, L., Tjepkema, M., van Donkelaar, A., Villeneuve, P. J., Miller, A. B., Yin, P., Zhou, M., Wang, L., Janssen, N. A. H., Marra, M., Atkinson, R. W., Tsang, H., Quoc Thach, T., Cannon, J. B., Allen, R. T., Hart, J. E., Laden, F., Cesaroni, G., Forastiere, F., Weinmayr, G., Jaensch, A., Nagel, G., Concin, H., and Spadaro, J. V.: Global estimates of mortality associated with long-term exposure to outdoor fine particulate matter, P. Natl. Acad. Sci. USA, 115, 9592–9597, https://doi.org/10.1073/pnas.1803222115, 2018.
Christensen, J. H.: The Danish Eulerian hemispheric model – A three-dimensional air pollution model used for the Arctic, Atmos. Environ., 31, 4169–4191, 1997.
Ciarelli, G., Colette, A., Schucht, S., Beekmann, M., Andersson, C., Manders-Groot, A., Mircea, M., Tsyro, S., Fagerli, H., Ortiz, A. G., Adani, M., Briganti, G., Cappelletti, A., D'Isidoro, M., Cuvelier, C., Couvidat, F., Meleux, F., and Bessagnet, B.: Long-term health impact assessment of total PM2.5 in Europe during the 1990–2015 period, Atmospheric Environment: X, 3, 100032, https://doi.org/10.1016/j.aeaoa.2019.100032, 2019a.
Ciarelli, G., Theobald, M. R., Vivanco, M. G., Beekmann, M., Aas, W., Andersson, C., Bergström, R., Manders-Groot, A., Couvidat, F., Mircea, M., Tsyro, S., Fagerli, H., Mar, K., Raffort, V., Roustan, Y., Pay, M.-T., Schaap, M., Kranenburg, R., Adani, M., Briganti, G., Cappelletti, A., D'Isidoro, M., Cuvelier, C., Cholakian, A., Bessagnet, B., Wind, P., and Colette, A.: Trends of inorganic and organic aerosols and precursor gases in Europe: insights from the EURODELTA multi-model experiment over the 1990–2010 period, Geosci. Model Dev., 12, 4923–4954, https://doi.org/10.5194/gmd-12-4923-2019, 2019b.
Colette, A., Andersson, C., Baklanov, A., Bessagnet, B., Brandt, J., Christensen, J. H., Doherty, R., Engardt, M., Geels, C., Giannakopoulos, C., Hedegaard, G. B., Katragkou, E., Langner, J., Lei, H., Manders, A., Melas, D., Meleux, F., Rouïl, L., Sofiev, M., Soares, J., Stevenson, D. S., Tombrou-Tzella, M., Varotsos, K. V., and Young, P.: Is the ozone climate penalty robust in Europe?, Environ. Res. Lett., 10, 084015, https://doi.org/10.1088/1748-9326/10/8/084015, 2016.
Colette, A., Andersson, C., Manders, A., Mar, K., Mircea, M., Pay, M.-T., Raffort, V., Tsyro, S., Cuvelier, C., Adani, M., Bessagnet, B., Bergström, R., Briganti, G., Butler, T., Cappelletti, A., Couvidat, F., D'Isidoro, M., Doumbia, T., Fagerli, H., Granier, C., Heyes, C., Klimont, Z., Ojha, N., Otero, N., Schaap, M., Sindelarova, K., Stegehuis, A. I., Roustan, Y., Vautard, R., van Meijgaard, E., Vivanco, M. G., and Wind, P.: EURODELTA-Trends, a multi-model experiment of air quality hindcast in Europe over 1990–2010, Geosci. Model Dev., 10, 3255–3276, https://doi.org/10.5194/gmd-10-3255-2017, 2017.
Corbett, J. J., Lack, D. A., Winebrake, J. J., Harder, S., Silberman, J. A., and Gold, M.: Arctic shipping emissions inventories and future scenarios, Atmos. Chem. Phys., 10, 9689–9704, https://doi.org/10.5194/acp-10-9689-2010, 2010.
Dee, D. P., Uppala, S. M., Simmons, A. J., Berrisford, P., Poli, P., Kobayashi, S., Andrae, U., Balmaseda, M. A., Balsamo, G., Bauer, P., Bechtold, P., Beljaars, A. C. M., van de Berg, L., Bidlot, J., Bormann, N., Delsol, C., Dragani, R., Fuentes, M., Geer, A. J., Haimberger, L., Healy, S. B., Hersbach, H., Hólm, E. V., Isaksen, L., Kållberg, P., Köhler, M., Matricardi, M., McNally, A. P., Monge-Sanz, B. M., Morcrette, J.-J., Park, B.-K., Peubey, C., de Rosnay, P., Tavolato, C., Thépaut, J.-N., and Vitart, F.: The ERA-Interim reanalysis: configuration and performance of the data assimilation system, Q. J. Roy. Meteor. Soc., 137, 553–597, https://doi.org/10.1002/qj.828, 2011.
EEA: Aviation and shipping — impacts on Europe's environment, TERM 2017: Transport and Environment Reporting Mechanism (TERM) report, No. 22/2017, Luxembourg, 2017.
EEA: Air quality in Europe — 2018 report, No. 12/2018, Luxembourg, 2018.
Ellermann, T., Nygaard, J., Nøjgaard, J. K., Nordstrøm, C., Brandt, J., Christensen, J., Ketzel, M., Massling, A., Bossi, R., Frohn, L. M., Geels, C., and Jensen, S. S.: The Danish Air Quality Monitoring Programme. Annual Summary for 2018, Scientific Report from DCE – Danish Centre for Environment and Energy, No. Aarhus University, DCE – Danish Centre for Environment and Energy, 360, 83 pp., available at: http://dce2.au.dk/pub/SR360.pdf, last access: 16 Decmeber 2020.
EU: Regulation (EU) 2015/757 of the European Parliament and of the Council of 29 April 2015 on the monitoring, reporting and verification of carbon dioxide emissions from maritime transport, and amending Directive 2009/16/EC, European Union, Luxembourg, 2015.
Faber, J., Hanayama, S., Zhang, S., Pereda, P., Comer, B., Hauerhof, E., Schim van der Loeff W., Smith, T., Zhang, Y., Kosaka, H., Adachi, M., Bonello, J-M., Galbraith, C., Gong, Z., Hirata, K., Hummels, D., Kleijn, A., Lee, D. S., Liu, Y., Lucchesi, A., Mao, X., Muraoka, E., Osipova, L., Qian, H., Rutherford, D., Suárez de la Fuente, S., Yuan, H., Perico, C. V., Wu, L., Sun, D., Yoo D-H., and Xing, H.: Fourth IMO GHG Study, International Maritime Organization, London, UK, 2020.
Forsius, M., Posch, M., Aherne, J., Reinds, G. J., Christensen, J., and Hole, L.: Assessing the Impacts of Long-Range Sulfur and Nitrogen Deposition on Arctic and Sub-Arctic Ecosystems, Ambio, 39, 136–147, 2010.
Friedrich, R. and Bickel, P.: Estimation of External Costs using the Impact-Pathway Approach, Journal of Technology Assessment in Theory and Practice, 10, 74–82, 2001.
Geels, C., Andersson, C., Hanninen, O., Lanso, A. S., Schwarze, P. E., Skjoth, C. A., and Brandt, J.: Future Premature Mortality Due to O3, Secondary Inorganic Aerosols and Primary PM in Europe – Sensitivity to Changes in Climate, Anthropogenic Emissions, Population and Building Stock, Int. J. Env. Res. Pub. He., 12, 2837–2869, https://doi.org/10.3390/ijerph120302837, 2015.
Geels, C., Winther, M., Andersson, C., Jalkanen, J.-P., Brandt, J., Frohn, L. M., and Christensen, J. H.: EPITOME ship emissions: Projections of shipping emissions towards 2050 (Version 1) [Data set], Zenodo, https://doi.org/10.5281/zenodo.4322247, 2020.
Gong, W., Beagley, S. R., Cousineau, S., Sassi, M., Munoz-Alpizar, R., Ménard, S., Racine, J., Zhang, J., Chen, J., Morrison, H., Sharma, S., Huang, L., Bellavance, P., Ly, J., Izdebski, P., Lyons, L., and Holt, R.: Assessing the impact of shipping emissions on air pollution in the Canadian Arctic and northern regions: current and future modelled scenarios, Atmos. Chem. Phys., 18, 16653–16687, https://doi.org/10.5194/acp-18-16653-2018, 2018.
Hedegaard, G. B., Christensen, J. H., and Brandt, J.: The relative importance of impacts from climate change vs. emissions change on air pollution levels in the 21st century, Atmos. Chem. Phys., 13, 3569–3585, https://doi.org/10.5194/acp-13-3569-2013, 2013.
ICCT: Database for marine black carbon emissions reduction strategies and technologies, available at: https://www.theicct.org, last access: 9 December 2015.
Im, U., Bianconi, R., Solazzo, E., Kioutsioukis, I., Badia, A., Balzarini, A., Baró, R., Bellasio, R., Brunner, D., Chemel, C., Curci, G., Denier van der Gon, H., Flemming, J., Forkel, R., Giordano, L., Jiménez-Guerrero, P., Hirtl, M., Hodzic, A., Honzak, L., Jorba, O., Knote, C., Makar, P. A., Manders-Groot, A., Neal, L., Pérez, J. L., Pirovano, G., Pouliot, G., San Jose, R., Savage, N., Schroder, W., Sokhi, R. S., Syrakov, D., Torian, A., Tuccella, P., Wang, K., Werhahn, J., Wolke, R., Zabkar, R., Zhang, Y., Zhang, J., Hogrefe, C., and Galmarini, S.: Evaluation of operational online-coupled regional air quality models over Europe and North America in the context of AQMEII phase 2. Part II: Particulate matter, Atmos. Environ., 115, 421–441, https://doi.org/10.1016/j.atmosenv.2014.08.072, 2015a.
Im, U., Bianconi, R., Solazzo, E., Kioutsioukis, I., Badia, A., Balzarini, A., Baró, R., Bellasio, R., Brunner, D., Chemel, C., Curci, G., Flemming, J., Forkel, R., Giordano, L., Jiménez-Guerrero, P., Hirtl, M., Hodzic, A., Honzak, L., Jorba, O., Knote, C., Kuenen, J. J. P., Makar, P. A., Manders-Groot, A., Neal, L., Pérez, J. L., Pirovano, G., Pouliot, G., San Jose, R., Savage, N., Schroder, W., Sokhi, R. S., Syrakov, D., Torian, A., Tuccella, P., Werhahn, J., Wolke, R., Yahya, K., Zabkar, R., Zhang, Y., Zhang, J., Hogrefe, C., and Galmarini, S.: Evaluation of operational on-line-coupled regional air quality models over Europe and North America in the context of AQMEII phase 2. Part I: Ozone, Atmos. Environ., 115, 404–420, https://doi.org/10.1016/j.atmosenv.2014.09.042, 2015b.
Im, U., Brandt, J., Geels, C., Hansen, K. M., Christensen, J. H., Andersen, M. S., Solazzo, E., Kioutsioukis, I., Alyuz, U., Balzarini, A., Baro, R., Bellasio, R., Bianconi, R., Bieser, J., Colette, A., Curci, G., Farrow, A., Flemming, J., Fraser, A., Jimenez-Guerrero, P., Kitwiroon, N., Liang, C.-K., Nopmongcol, U., Pirovano, G., Pozzoli, L., Prank, M., Rose, R., Sokhi, R., Tuccella, P., Unal, A., Vivanco, M. G., West, J., Yarwood, G., Hogrefe, C., and Galmarini, S.: Assessment and economic valuation of air pollution impacts on human health over Europe and the United States as calculated by a multi-model ensemble in the framework of AQMEII3, Atmos. Chem. Phys., 18, 5967–5989, https://doi.org/10.5194/acp-18-5967-2018, 2018.
IMO: Third IMO GHG Study 2014, edited by: Smith, T. W. P., Jalkanen, J. P., Anderson, B. A., Corbett, J. J., Faber, J., Hanayama, S., O'Keeffe, E., Parker, S., Johansson, L., Aldous, L., Raucci, C., Traut, M., Ettinger, S., Nelissen, D., Lee, D. S., Ng, S., Agrawal, A., Winebrake, J. J., Hoen, M., Chesworth, S., and Pandey, A., International Maritime Organization, (IMO) London, UK, April 2015, available at: https://wwwcdn.imo.org/localresources/en/OurWork/Environment/Documents/Third Greenhouse Gas Study/GHG3 Executive Summary and Report.pdf (last access: 16 December 2020), 2015.
IMO: Air pollution and Energy Efficiency – Sulphur monitoring for 2015, 7 pp., MEPC 69/5/7, IMO Marine Environment Protection Committee, London, UK, 2016.
Jalkanen, J.-P., Brink, A., Kalli, J., Pettersson, H., Kukkonen, J., and Stipa, T.: A modelling system for the exhaust emissions of marine traffic and its application in the Baltic Sea area, Atmos. Chem. Phys., 9, 9209–9223, https://doi.org/10.5194/acp-9-9209-2009, 2009.
Jalkanen, J.-P., Johansson, L., Kukkonen, J., Brink, A., Kalli, J., and Stipa, T.: Extension of an assessment model of ship traffic exhaust emissions for particulate matter and carbon monoxide, Atmos. Chem. Phys., 12, 2641–2659, https://doi.org/10.5194/acp-12-2641-2012, 2012.
Johansson, L., Jalkanen, J.-P., Kalli, J., and Kukkonen, J.: The evolution of shipping emissions and the costs of regulation changes in the northern EU area, Atmos. Chem. Phys., 13, 11375–11389, https://doi.org/10.5194/acp-13-11375-2013, 2013.
Johansson, L., Jalkanen, J.-P., and Kukkonen, J.: Global assessment of shipping emissions in 2015 on a high spatial and temporal resolution, Atmos. Environ., 167, 403–415, https://doi.org/10.1016/j.atmosenv.2017.08.042, 2017.
Johnson, K., Miller, W., Durbin, T., Jiang, Y., Yang, J., Karavalakis, G., and Cocker, D.: Black Carbon Measurement Methods and Emission Factors from Ships, Report prepared for: International Council on Clean Transportation, Report Prepared by: University of California, Riverside, December, 184 pp., 2016.
Jonson, J. E., Gauss, M., Schulz, M., Jalkanen, J.-P., and Fagerli, H.: Effects of global ship emissions on European air pollution levels, Atmos. Chem. Phys., 20, 11399–11422, https://doi.org/10.5194/acp-20-11399-2020, 2020.
Kang, S., Zhang, Y., Qian, Y., and Wang, H.: A review of black carbon in snow and ice and its impact on the cryosphere, Earth-Sci. Rev., 210, 103346, https://doi.org/10.1016/j.earscirev.2020.103346, 2020.
Karl, M., Jonson, J. E., Uppstu, A., Aulinger, A., Prank, M., Sofiev, M., Jalkanen, J.-P., Johansson, L., Quante, M., and Matthias, V.: Effects of ship emissions on air quality in the Baltic Sea region simulated with three different chemistry transport models, Atmos. Chem. Phys., 19, 7019–7053, https://doi.org/10.5194/acp-19-7019-2019, 2019.
Klimont, Z., Kupiainen, K., Heyes, C., Purohit, P., Cofala, J., Rafaj, P., Borken-Kleefeld, J., and Schöpp, W.: Global anthropogenic emissions of particulate matter including black carbon, Atmos. Chem. Phys., 17, 8681–8723, https://doi.org/10.5194/acp-17-8681-2017, 2017.
Kühn, T., Kupiainen, K., Miinalainen, T., Kokkola, H., Paunu, V.-V., Laakso, A., Tonttila, J., Van Dingenen, R., Kulovesi, K., Karvosenoja, N., and Lehtinen, K. E. J.: Effects of black carbon mitigation on Arctic climate, Atmos. Chem. Phys., 20, 5527–5546, https://doi.org/10.5194/acp-20-5527-2020, 2020.
Lack, D. A. and Corbett, J. J.: Black carbon from ships: a review of the effects of ship speed, fuel quality and exhaust gas scrubbing, Atmos. Chem. Phys., 12, 3985–4000, https://doi.org/10.5194/acp-12-3985-2012, 2012.
Lacressonnière, G. Watson, L., Gauss, M., Engardt, M., Andersson, C., Beekmann, M., Colette, A., Foret, G., Josse, B., Marécal, V., Nyiri, A., Siour, G., Sobolowski, S., and Vautard, R.: Particulate matter air pollution in Europe in a +2 ∘C warming world, Atmos. Environ., 154, 129–140, https://doi.org/10.1016/j.atmosenv.2017.01.037, 2017.
Langner, J., Engardt, M., and Andersson, C.: European summer surface ozone 1990–2100, Atmos. Chem. Phys., 12, 10097–10105, https://doi.org/10.5194/acp-12-10097-2012, 2012.
Lehtomaki, H., Geels, C., Brandt, J., Rao, S., Yaramenka, K., Astrom, S., Andersen, M. S., Frohn, L. M., Im, U., and Hanninen, O.: Deaths Attributable to Air Pollution in Nordic Countries: Disparities in the Estimates, Atmosphere-Basel, 11, 467, https://doi.org/10.3390/atmos11050467, 2020.
MAN Energy Solutions: Data tilsendt af Michael Finch Petersen, Low Speed Marine R&D, (tidligere MAN Diesel & Turbo), Copenhagen, 2012.
Marécal, V., Peuch, V.-H., Andersson, C., Andersson, S., Arteta, J., Beekmann, M., Benedictow, A., Bergström, R., Bessagnet, B., Cansado, A., Chéroux, F., Colette, A., Coman, A., Curier, R. L., Denier van der Gon, H. A. C., Drouin, A., Elbern, H., Emili, E., Engelen, R. J., Eskes, H. J., Foret, G., Friese, E., Gauss, M., Giannaros, C., Guth, J., Joly, M., Jaumouillé, E., Josse, B., Kadygrov, N., Kaiser, J. W., Krajsek, K., Kuenen, J., Kumar, U., Liora, N., Lopez, E., Malherbe, L., Martinez, I., Melas, D., Meleux, F., Menut, L., Moinat, P., Morales, T., Parmentier, J., Piacentini, A., Plu, M., Poupkou, A., Queguiner, S., Robertson, L., Rouïl, L., Schaap, M., Segers, A., Sofiev, M., Tarasson, L., Thomas, M., Timmermans, R., Valdebenito, Á., van Velthoven, P., van Versendaal, R., Vira, J., and Ung, A.: A regional air quality forecasting system over Europe: the MACC-II daily ensemble production, Geosci. Model Dev., 8, 2777–2813, https://doi.org/10.5194/gmd-8-2777-2015, 2015.
Ministry of Transport: TEMA2015 – et værktøj til at beregne transporters energiforbrug og emissioner i Danmark (TEMA2015 – a calculation tool for transport related fuel use and emissions in Denmark), Technical report, Ministry of Transport, Copenhagen, 135 pp., 2015.
Nielsen, O.-K., Plejdrup, M. S., Winther, M., Nielsen, M., Gyldenkærne, S., Mikkelsen, M. H., Albrektsen, R., Thomsen, M., Hjelgaard, K., Fauser, P., Bruun, H. G., Johannsen, V. K., Nord-Larsen, T., Vesterdal, L., Callesen, I., Caspersen, O. H., Scott-Bentsen, N., Rasmussen, E., Petersen, S. B., Olsen, T. M., and Hansen, M. G.: Denmark's National Inventory Report 2019. Emission Inventories 1990-2017 – Submitted under the United Nations Framework Convention on Climate Change and the Kyoto Protocol, Scientific Report No. 318, Aarhus University, DCE – Danish Centre for Environment and Energy, 886 pp. available at: http://dce2.au.dk/pub/SR318.pdf (last access: 16 December 2020), 2019.
Nunes, R. A. O., Alvim-Ferraz, M. C. M., Martins, F. G., Calderay-Cayetano, F., Durán-Grados, V., Moreno-Gutiérrez, J., Jalkanen, J.-P., Hannuniemi, H., and Sousa, S. I. V.: Shipping emissions in the Iberian Peninsula and the impacts on air quality, Atmos. Chem. Phys., 20, 9473–9489, https://doi.org/10.5194/acp-20-9473-2020, 2020.
Otero, N., Sillmann, J., Mar, K. A., Rust, H. W., Solberg, S., Andersson, C., Engardt, M., Bergström, R., Bessagnet, B., Colette, A., Couvidat, F., Cuvelier, C., Tsyro, S., Fagerli, H., Schaap, M., Manders, A., Mircea, M., Briganti, G., Cappelletti, A., Adani, M., D'Isidoro, M., Pay, M.-T., Theobald, M., Vivanco, M. G., Wind, P., Ojha, N., Raffort, V., and Butler, T.: A multi-model comparison of meteorological drivers of surface ozone over Europe, Atmos. Chem. Phys., 18, 12269–12288, https://doi.org/10.5194/acp-18-12269-2018, 2018.
Pope, C. A., Coleman, N., Pond, Z. A., and Burnett, R. T.: Fine particulate air pollution and human mortality: 25+ years of cohort studies, Environ. Res., 183, 108924, https://doi.org/10.1016/j.envres.2019.108924, 2020.
Raaschou-Nielsen, O., Thorsteinson, E., Antonsen, S., Holst, G. J., Sigsgaard, T., Geels, C., Frohn, L. M., Christensen, J. H., Brandt, J., Pedersen, C. B., and Hvidtfeldt, U. A.: Long-term exposure to air pollution and mortality in the Danish population a nationwide study, EClinicalMedicine, 28, 100605, https://doi.org/10.1016/j.eclinm.2020.100605, 2020.
Robertson, L., Langner, J., and Engardt, M.: An Eulerian Limited-Area Atmospheric Transport Model, J. Appl. Meteorol., 38, 190–210. https://doi.org/10.1175/1520-0450(1999)038<0190:AELAAT>2.0.CO;2, 1999.
Sand, M., Berntsen, T. K., Kay, J. E., Lamarque, J. F., Seland, Ø., and Kirkevåg, A.: The Arctic response to remote and local forcing of black carbon, Atmos. Chem. Phys., 13, 211–224, https://doi.org/10.5194/acp-13-211-2013, 2013.
Sand, M., Berntsen, T. K., von Salzen, K., Flanner, M. G., Langner, J., and Victor, D. G.: Response of Arctic temperature to changes in emissions of short-lived climate forcers, Nat. Clim. Change, 6, 286–289, https://doi.org/10.1038/nclimate2880, 2016.
Sarrabezoles, A., Lasserre, F., and Hagouagn'rin, Z.: Arctic shipping insurance: Towards a harmonisation of practices and costs?, Polar Rec., 52, 393–398, https://doi.org/10.1017/S0032247414000552, 2016.
Schmale, J., Arnold, S. R., Law, K. S., Thorp, T., Anenberg, S., Simpson, W. R., Mao, J., and Pratt, K. A.: Local Arctic air pollution: A neglected but serious problem, Earths Future, 6, 1385–1412, https://doi.org/10.1029/2018EF000952, 2018.
Simpson, D., Benedictow, A., Berge, H., Bergström, R., Emberson, L. D., Fagerli, H., Flechard, C. R., Hayman, G. D., Gauss, M., Jonson, J. E., Jenkin, M. E., Nyíri, A., Richter, C., Semeena, V. S., Tsyro, S., Tuovinen, J.-P., Valdebenito, Á., and Wind, P.: The EMEP MSC-W chemical transport model – technical description, Atmos. Chem. Phys., 12, 7825–7865, https://doi.org/10.5194/acp-12-7825-2012, 2012.
Simpson, D., Andersson, C., Christensen, J. H., Engardt, M., Geels, C., Nyiri, A., Posch, M., Soares, J., Sofiev, M., Wind, P., and Langner, J.: Impacts of climate and emission changes on nitrogen deposition in Europe: a multi-model study, Atmos. Chem. Phys., 14, 6995–7017, https://doi.org/10.5194/acp-14-6995-2014, 2014.
Skamarock, W. C., Klemp, J. B., Dudhia, J., Gill, D. O., Barker, D. M., Duda, M. G., Huang, X-Y, Wang, W., and Powers, J. G.: A Description of the Advanced Research WRF Version 3 (No. NCAR/TN-475+STR), University Corporation for Atmospheric Research, https://doi.org/10.5065/D68S4MVH, 2008.
Soares, J., Sofiev, M., Geels, C., Christensen, J. H., Andersson, C., Tsyro, S., and Langner, J.: Impact of climate change on the production and transport of sea salt aerosol on European seas, Atmos. Chem. Phys., 16, 13081–13104, https://doi.org/10.5194/acp-16-13081-2016, 2016.
Sofiev, M., Winebrake, J. J., Johansson, L., Carr, E. W., Prank, M., Soares, J., Vira, J., Kouznetsov, R., Jalkanen, J. P., and Corbett, J. J.: Cleaner fuels for ships provide public health benefits with climate tradeoffs, Nat. Commun., 9, 406, https://doi.org/10.1038/s41467-017-02774-9, 2018.
Solazzo, E., Bianconi, R., Vautard, R., Wyat Appel, K., Moran, M. D., Hogrefe, C., Bessagnet, B., Brandt, J., Christensen, J. H., Chemel, C., Coll, I., Denier van der Gon, H., Ferreira, J., Forkel, R., Francis, X. V., Grell, G., Grossi, P., Hansen, A. B., Jericevi, A., Kraljevi, L., Miranda, A. I., Nopmongcol, U., Pirovano, G., Prank, M., Riccio, A., Sartelet, K. N., Schaap, M., Silver, J. D., Sokhi, R. S., Vira, J., Werhahn, J., Wolkem, R., Yarwood, G., Zhang, J., Trivikrama Rao, S., and Galmarini, S.: Model evaluation and ensemble modelling of surface-level ozone in Europe and North America in the context of AQMEII, Atmos. Environ., 53, 60–74, https://doi.org/10.1016/j.atmosenv.2012.01.003, 2012a.
Solazzo, E., Bianconi, R., Pirovano, G., Matthias, V., Vautard, R., Wyat Appel, K., Bessagnet, B., Brandt, J., Christensen, J. H., Chemel, C., Coll, I., Ferreira, J., Forkel, R., Francis, X. V,. Grell, G., Grossi, P., Hansen, A., Miranda, A. I., Moran, M. D., Nopmongco, U., Parnk, M., Sartelet, K. N., Schaap, M., Silver, J. D., Sokhi, R. S., Vira, J., Werhahn, J., Wolke, R., Yarwood, G., Zhang, J., Rao, S. T., and Galmarin S.: Operational model evaluation for particulate matter in Europe and North America in the context of the AQMEII project, Atmos. Environ., 53, 75–92, https://doi.org/10.1016/j.atmosenv.2012.02.045, 2012b.
Tarín-Carrasco, P., Im, U., Geels, C., Palacios-Peña, L., and Jiménez-Guerrero, P.: Reducing future air pollution-related premature mortality over Europe by mitigating emissions: assessing an 80 % renewable energies scenario, Atmos. Chem. Phys. Discuss. [preprint], https://doi.org/10.5194/acp-2021-86, in review, 2021.
Theobald, M. R., Vivanco, M. G., Aas, W., Andersson, C., Ciarelli, G., Couvidat, F., Cuvelier, K., Manders, A., Mircea, M., Pay, M.-T., Tsyro, S., Adani, M., Bergström, R., Bessagnet, B., Briganti, G., Cappelletti, A., D'Isidoro, M., Fagerli, H., Mar, K., Otero, N., Raffort, V., Roustan, Y., Schaap, M., Wind, P., and Colette, A.: An evaluation of European nitrogen and sulfur wet deposition and their trends estimated by six chemistry transport models for the period 1990–2010, Atmos. Chem. Phys., 19, 379–405, https://doi.org/10.5194/acp-19-379-2019, 2019.
Viana, M., Hammingh, P., Colette, A., Querol, X., Degraeuwe, B., de Vlieger, I., and van Aardenne, J.: Impact of maritime transport emissions on coastal air quality in Europe, Atmos. Environ., 90, 96–105, 2014.
Viana, M., Rizza, V., Tobías, A., Carr, E., Corbett, J., Sofiev, M., Karanasiou, A., Buonanno, G., and Fann, N.: Estimated health impacts from maritime transport in the Mediterranean region and benefits from the use of cleaner fuels, Environ. Int., 138, 105670, https://doi.org/10.1016/j.envint.2020.105670, 2020.
Vivanco, M. G., Theobald, M. R., García-Gómez, H., Garrido, J. L., Prank, M., Aas, W., Adani, M., Alyuz, U., Andersson, C., Bellasio, R., Bessagnet, B., Bianconi, R., Bieser, J., Brandt, J., Briganti, G., Cappelletti, A., Curci, G., Christensen, J. H., Colette, A., Couvidat, F., Cuvelier, C., D'Isidoro, M., Flemming, J., Fraser, A., Geels, C., Hansen, K. M., Hogrefe, C., Im, U., Jorba, O., Kitwiroon, N., Manders, A., Mircea, M., Otero, N., Pay, M.-T., Pozzoli, L., Solazzo, E., Tsyro, S., Unal, A., Wind, P., and Galmarini, S.: Modeled deposition of nitrogen and sulfur in Europe estimated by 14 air quality model systems: evaluation, effects of changes in emissions and implications for habitat protection, Atmos. Chem. Phys., 18, 10199–10218, https://doi.org/10.5194/acp-18-10199-2018, 2018.
WHO: Health risks of air pollution in Europe – HRAPIE project. Recommendations for concentration–response functions for cost–benefit analysis of particulate matter, ozone and nitrogen dioxide, WHO Regional Office for Europe, UN City, Copenhagen Ø, Denmark, 60 pp., 2013.
Winther, M., Christensen, J. H., Plejdrup, M. S., Ravn, E. S., Eriksson, O. F., and Kristensen, H. O.: Emission inventories for ships in the arctic based on satellite sampled AIS data, Atmos. Environ., 91, 1–14, https://doi.org/10.1016/j.atmosenv.2014.03.006, 2014.
Winther, M., Christensen, J. H., Angelidis, I., and Ravn, E. S.: Emissions from shipping in the Arctic from 2012-2016 and emission projections for 2020, 2030 and 2050, Scientific Report from DCE – Danish Centre for Environment and Energy No. 252, Aarhus University, DCE – Danish Centre for Environment and Energy, 125 pp., available at: http://dce2.au.dk/pub/SR252.pdf (last access: 16 December 2020), 2017.
Zare, A., Christensen, J. H., Irannejad, P., and Brandt, J.: Evaluation of two isoprene emission models for use in a long-range air pollution model, Atmos. Chem. Phys., 12, 7399–7412, https://doi.org/10.5194/acp-12-7399-2012, 2012.
Zare, A., Christensen, J. H., Gross, A., Irannejad, P., Glasius, M., and Brandt, J.: Quantifying the contributions of natural emissions to ozone and total fine PM concentrations in the Northern Hemisphere, Atmos. Chem. Phys., 14, 2735–2756, https://doi.org/10.5194/acp-14-2735-2014, 2014.
In Corbett et al. (2010), BAU diversion traffic is 1 %, 1 % and 1.8 % of global shipping in the forecast years 2020, 2030 and 2050, respectively, and HiG diversion traffic is 1 %, 2 % and 5 % of global shipping in the forecast years 2020, 2030 and 2050, respectively.