the Creative Commons Attribution 4.0 License.
the Creative Commons Attribution 4.0 License.
 | 18 Aug 2021
Observation and modeling of the historic “Godzilla” African dust intrusion into the Caribbean Basin and the southern US in June 2020
Qian Tan
Lillian Zhou
Yaping Zhou
Huisheng Bian
Mian Chin
Claire L. Ryder
Robert C. Levy
Yaswant Pradhan
Yingxi Shi
Qianqian Song
Zhibo Zhang
Peter R. Colarco
Dongchul Kim
Lorraine A. Remer
Tianle Yuan
Olga Mayol-Bracero
Brent N. Holben
This study characterizes a massive African dust intrusion into the Caribbean Basin and southern US in June 2020, which is nicknamed the “Godzilla” dust plume, using a comprehensive set of satellite and ground-based observations (including MODIS, CALIOP, SEVIRI, AERONET, and EPA Air Quality network) and the NASA GEOS global aerosol transport model. The MODIS data record registered this massive dust intrusion event as the most intense episode over the past 2 decades. During this event, the aerosol optical depth (AOD) observed by AERONET and MODIS peaked at 3.5 off the coast of West Africa and 1.8 in the Caribbean Basin. CALIOP observations show that the top of the dust plume reached altitudes of 6–8 km in West Africa and descended to about 4 km altitude over the Caribbean Basin and 2 km over the US Gulf of Mexico coast. The dust intrusion event degraded the air quality in Puerto Rico to a hazardous level, with maximum daily PM10 concentration of 453 µg m−3 recorded on 23 June. The dust intrusion into the US raised the PM2.5 concentration on 27 June to a level exceeding the EPA air quality standard in about 40 % of the stations in the southern US. Satellite observations reveal that dust emissions from convection-generated haboobs and other sources in West Africa were large albeit not extreme on a daily basis. However, the anomalous strength and northern shift of the North Atlantic Subtropical High (NASH) together with the Azores low formed a closed circulation pattern that allowed for accumulation of the dust near the African coast for about 4 d. When the NASH was weakened and wandered back to the south, the dust outflow region was dominated by a strong African easterly jet that rapidly transported the accumulated dust from the coastal region toward the Caribbean Basin, resulting in the record-breaking African dust intrusion. In comparison to satellite observations, the GEOS model reproduced the MODIS observed tracks of the meandering dust plume well as it was carried by the wind systems. However, the model substantially underestimated dust emissions from haboobs and did not lift up enough dust to the middle troposphere for ensuing long-range transport. Consequently, the model largely missed the satellite-observed elevated dust plume along the cross-ocean track and underestimated the dust intrusion into the Caribbean Basin by a factor of more than 4. Modeling improvements need to focus on developing more realistic representations of moist convection, haboobs, and the vertical transport of dust.
- Article
(33209 KB) - Full-text XML
-
Supplement
(2088 KB) - BibTeX
- EndNote


Trans-Atlantic transport of African dust to the Caribbean Basin and the Americas is a year-round phenomenon (Yu et al., 2013; Prospero et al., 2014) that imposes far-reaching impacts on air quality and human health, the radiation budget, clouds and weather systems, soil development, snow melting, and terrestrial and aquatic ecosystems (Swap et al., 1992; Prospero, 1999; DeMott et al., 2003; Miller et al., 2004; Okin et al., 2004; Jickells, et al., 2005; Chin et al., 2007; Muhs et al., 2007; Evan et al., 2011; Yu et al., 2015b; Yuan et al., 2016; Song et al., 2018; Tao et al., 2018). On average, it has been estimated that about 180 million metric tons of dust from North Africa is carried by the trade winds each year to sweep across the tropical North Atlantic Ocean. This dust lands in different parts of the Americas and the Caribbean Basin (Yu et al., 2015a), which is modulated by the seasonal migration of the intertropical convergence zone (ITCZ).
Dust uplift during the Saharan summertime dust season is primarily driven by two mechanisms: low level jets (LLJs) and haboobs (Marsham and Ryder, 2021). LLJs occur when nocturnal jets are mixed down towards the surface as the daytime boundary layer develops with surface heating. Haboobs occur due to cold-pool outflows in the form of density currents from convective systems, with high wind speeds and dust uplift. These high-wind events play an important role in dust lifting and make the largest contribution to interannual variability of dust generation (Cowie et al., 2015). Marsham et al. (2013) found that haboobs accounted for as much as 50 % of Saharan summertime dust uplift. Convective mixing resulting from intense solar heating gradually mixes dust vertically as the convective boundary layer grows, eventually mixing it throughout the entire Saharan boundary layer up to 6–8 km (e.g., Engelstaedter et al., 2015; Ryder et al. 2015). Easterly mid-level winds then advect the dust westwards over the Atlantic Ocean, where it overrides the marine boundary layer, becoming the elevated Saharan Air Layer (SAL) (e.g., Karyampudi, 1999; Carlson and Prospero, 1972).
It is worth noting that these dust events are episodic in nature and vary substantially in intensity from event to event. Because of the high intensity and broad reach of extreme dust events, they can impose enormous albeit intermittent impacts on the environment on a large spatial scale. Often a few extreme dust events could make disproportionally large contributions to the annual dust budget. It is thus important to characterize such extraordinary events with comprehensive observations and understand their underlying processes. It is also critical to assess to what extent global aerosol models can capture such extreme intercontinental transport events.
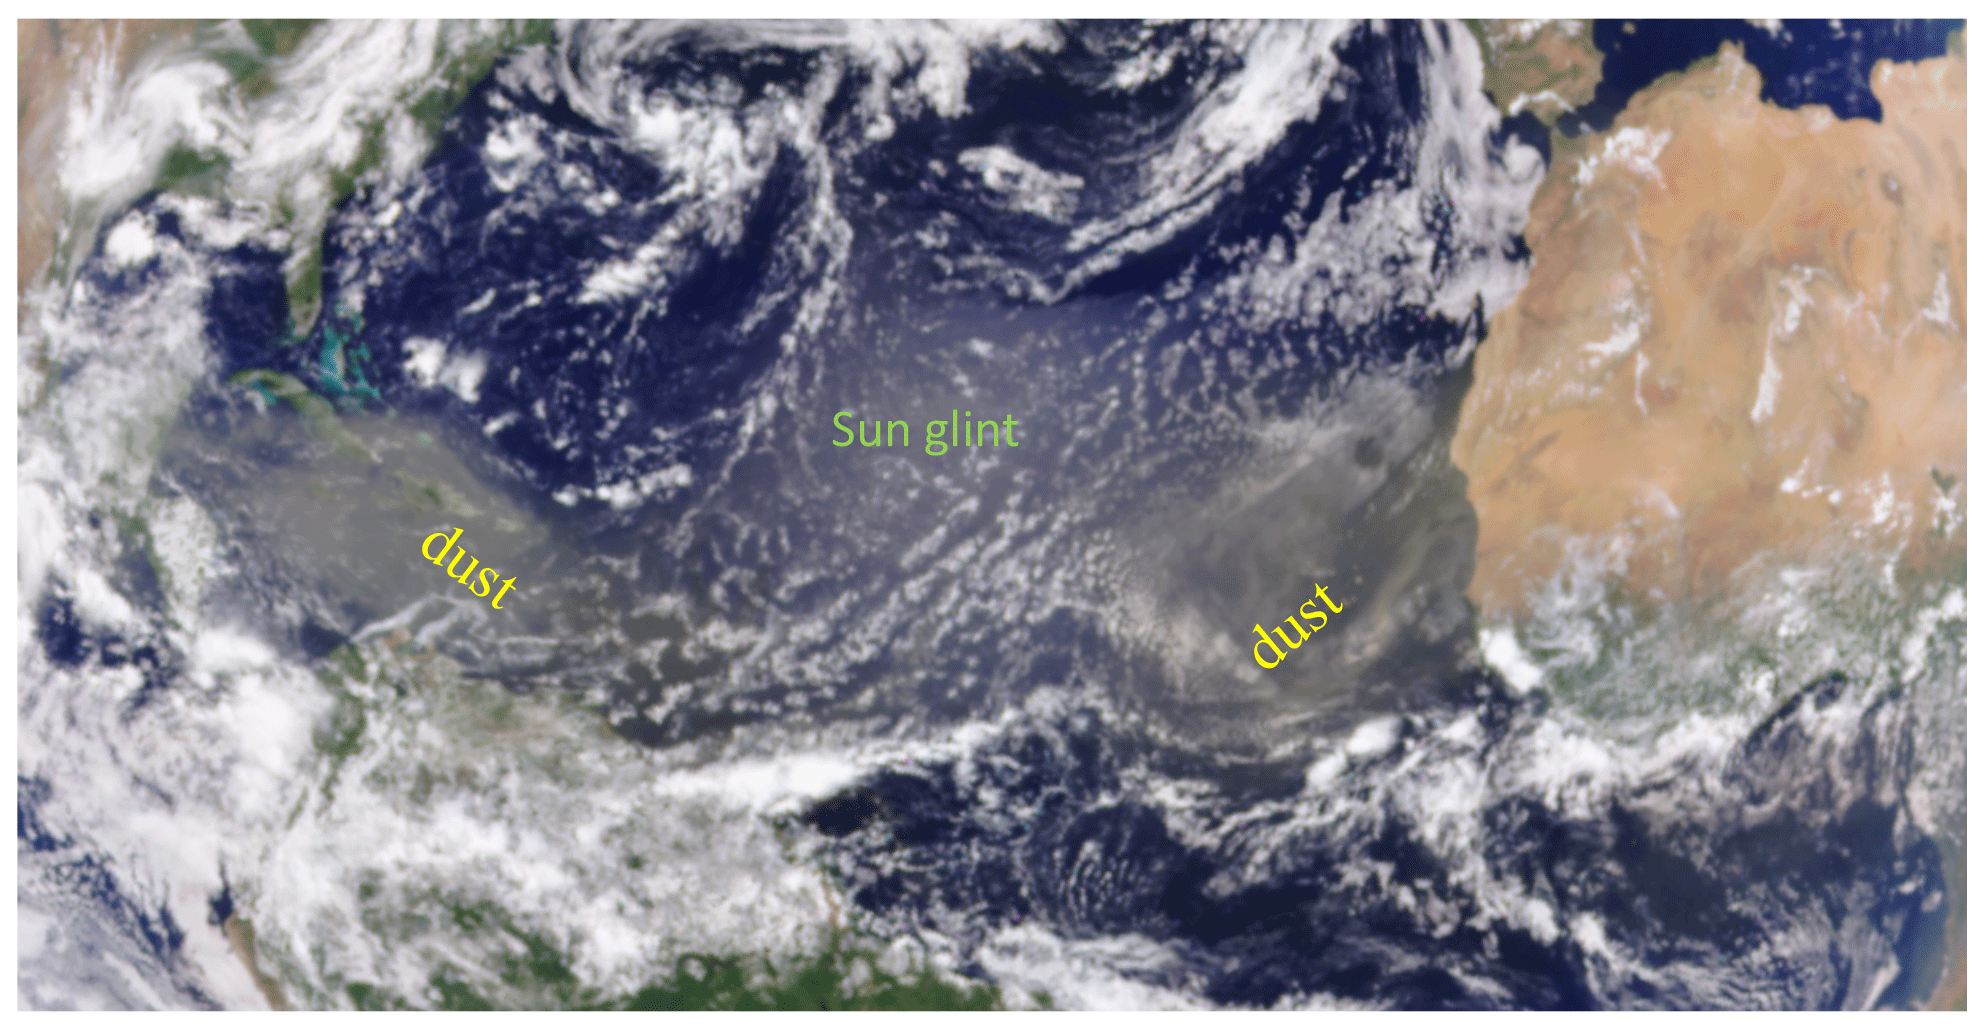
Figure 1A panorama of dual dust plumes from 2.5 × 10⁹ m above the Earth's surface snapped by the EPIC/DSCOVR at 14:47:32 GMT on 23 June 2020 (https://epic.gsfc.nasa.gov, last access: 20 January 2021).
In late June 2020, a gigantic dust plume was observed to intrude into the Caribbean Basin and the southern US. Figure 1 shows a snapshot panorama of dust plumes observed at 14:47:32 GMT on 23 June 2020, taken by the Earth Polychromatic Imaging Camera (EPIC) on board the Deep Space Climate Observatory (DSCOVR) at the first Lagrange point (L1) between Earth and the sun (about 2.5 × 10⁹ m above the Earth's surface) (Marshak et al., 2018). Featured in the image is a dense dust plume over the Caribbean Basin followed by another just off the African coast in the eastern North Atlantic Ocean. These two dust plumes are about 5000 km apart but appear to be comparable in intensity. The dust over the Caribbean Basin during this period has attracted considerable interest from the scientific community and media because of its huge extent and massive amount, thus called the “Godzilla” dust plume (https://phys.org/news/2020-06-sahara-blankets-caribbean-air-quality.html, last access: 21 January 2021) and “a dust plume to remember” (https://earthobservatory.nasa.gov/images/146913/a-dust-plume-to-remember, last access: 21 January 2021) for its extraordinary characteristics. Francis et al. (2020) examined the atmospheric circulation characteristics that drove the formation and transport of this dust storm. Pu and Jin (2021) analyzed satellite measurements of aerosol and reanalysis of atmospheric circulations and showed that the association of this extreme dust event with enhanced dust emissions and atmospheric circulation extremes favored westward transport of dust. Both studies have focused on anomalies in large-scale circulations without elucidating potential roles of mesoscale circulations in producing and transporting dust. Pu and Jin (2021) assessed that the increased surface wind speed and reduced vegetation cover only contributed to less than half of the observed anomaly in aerosol optical depth for this event.
In this study, we will use a variety of remote sensing and in situ observations and simulations with the NASA Goddard Earth Observing System (GEOS) model to characterize the gigantic dust plume and assess its impact on the air quality in the southern US. Specifically, we will (1) characterize the evolution of the three-dimensional structure of the dust plumes along their cross-ocean transit, (2) place the intensity of the Godzilla dust plume in a context of the last 2 decades, (3) understand major synoptic processes that resulted in the gigantic dust intrusion into the Caribbean Basin, (4) assess its impact on particulate matter (PM) air quality in the southern US, and (5) evaluate the Goddard Earth Observing System (GEOS) model simulation of the dust event with the observations. The rest of the paper is organized as follows. Section 2 describes the data and model we use to characterize the dust event, including aerosol retrievals from the Moderate Resolution Imaging Spectroradiometer (MODIS), aerosol vertical profiles from the Cloud-Aerosol Lidar with orthogonal Polarization (CALIOP), surface PM2.5 (PM with aerodynamic diameter less than 2.5 µm) concentration from the U.S. Environmental Protection Agency (EPA) air quality network, dust and deep clouds from the Spinning Enhanced Visible and InfraRed Imager (SEVIRI), and aerosol simulations with the model. Section 3 presents major results of the data analysis and addresses several important questions, including the following. (a) How did the three-dimensional structure of the dust plumes evolve during the trans-Atlantic journey? (b) Is this episode a historic event over the past 2 decades? (c) What are major meteorological factors responsible for the huge dust intrusion? (d) What is the adverse impact of the dust event on the PM2.5 air quality in the southern US? (e) To what extent does the GEOS model capture the observed characteristics and quantities of the dust plume? Major conclusions are summarized in Sect. 4.
2.1 MODIS aerosol optical depth
The MODIS instruments on board both the NASA Terra (morning) and Aqua (afternoon) satellites acquire near-global, daily observations of aerosols with a wide swath of ∼ 2330 km. Because of its wide spectral range and the simplicity of the dark ocean surface, the MODIS Dark Target (DT) algorithm (Remer et al., 2005, 2020; Levy et al., 2013) has the capability of retrieving AOD with a relatively high accuracy over ocean, as well as information on particle size (in the form of Ångström exponent, effective radius, or fine-mode fraction – FMF). The FMF measures the contribution of fine-mode particles to total AOD at 0.55 µm (Remer et al., 2005). In the operational DT aerosol retrieval, dust is assumed to be spherical, which introduces errors in the aerosol retrievals downwind of the dust source regions. Most recently, an enhanced DT retrieval algorithm has been developed to improve dust retrievals by accounting for non-sphericity of dust particles (Zhou et al., 2020a). It has been shown that this enhanced dust retrieval algorithm significantly improves the retrievals of AOD and FMF over ocean (Zhou et al., 2020b). For this study exclusively, the enhanced DT algorithm has been applied to the identified dust scenes over ocean from 10–30 June 2020. Although the DT algorithm is also applied to retrieval of AOD over vegetated lands, it does not retrieve aerosol over deserts because of interference of strong surface signal. The Deep Blue (DB) algorithm was initially developed to retrieve AOD and other aerosol properties over bright surfaces and then extended to vegetated lands and oceans (Hsu et al., 2013), which complements the DT retrievals. The DT and DB products have been combined, on the basis of their performance in reproducing the Aerosol Robotic Network (AERONET) observations, to characterize the global aerosol system (Levy et al., 2013). For this study, we aggregate the enhanced DT over-ocean retrievals into 1∘ × 1∘ grids. Over land, we use the MODIS Collection 6.1 daily data. We also combine MODIS AOD at 550 nm from Terra and Aqua to acquire a better spatial coverage of daily aerosol distribution than each satellite alone. When both Terra and Aqua have AOD retrievals, they are averaged. In this study, we will use the AERONET data to validate the MODIS AOD retrieval for this intense dust event. AERONET is a ground-based network with equipped well-calibrated sun photometers that have been measuring AOD (with an accuracy of 0.01) and retrieving a set of particle properties around the globe (Holben et al., 2001).
2.2 CALIOP aerosol extinction profiles
CALIOP is a two-wavelength polarization lidar on board the Cloud-Aerosol Lidar and Infrared Pathfinder Satellite Observation (CALIPSO) satellite with an Equator crossing time of about 13:30 and 01:30 and a 16 d repeat cycle. Since June 2006, CALIOP has been almost continuously collecting high-vertical-resolution (e.g., 30 m) profiles of the attenuated backscatter by aerosols and clouds at 532 and 1064 nm wavelengths along with polarized backscatter at 532 nm between 82∘ N and 82∘ S (Winker et al., 2009). Currently, CALIOP is the only spaceborne lidar in orbit that provides this key information about the vertical distribution of aerosol. The unprecedented long data record of CALIOP aerosol profiles accumulated over more than a decade has contributed to a revolutionary understanding of aerosols in the Earth system. It is worth noting that CALIOP can detect aerosol layers in clear sky, below thin cirrus clouds, and above opaque low-level clouds during both day and night, although the nighttime data have better accuracy than the daytime data (Winker et al., 2010; Yu and Zhang, 2013). In this study, we will use the CALIOP version 4.20 aerosol extinction profile data at a nominal horizontal resolution of 5 km supplemented by the vertical feature masks in both daytime and nighttime, which represents significant improvements over the previous data versions (Kim et al., 2018). We only use high-quality aerosol data with the cloud aerosol discrimination (CAD) score between −100 and −90 following Yu et al. (2019).
2.3 SEVIRI dust RGB composite imagery
SEVIRI on board the Meteosat Second Generation (MSG) satellite series in geostationary orbit (36 000 km) and centered at (0∘ N, 0∘ E) provides images of Europe and Africa at a frequency of every 15 min, day and night (Schmetz et al., 2002). This allows for monitoring the genesis and movement of dust clouds at high temporal resolution (Schepanski et al., 2007; Ashpole and Washington, 2012). The brightness temperature (BT) at 10.8 µm and two BT differences (between 8.7 and 10.8 µm and between 12.0 and 10.8 µm) are rendered to red–green–blue (RGB) beams to highlight the presence of dust and different cloud phases (deep clouds, middle clouds, and low clouds) (Lensky and Rosenfeld, 2008; Brindley et al., 2012). In this study, we use SEVIRI RGB imagery to illustrate the genesis and movement of mesoscale convective systems, haboobs, and dust plumes from other sources.
2.4 PM concentrations from EPA air quality network
The EPA of the United States has established a comprehensive network across the nation (including Puerto Rico, and the US Virgin Islands) to monitor the outdoor air quality of ozone, PM, and other chemical species. In this study, we will use the measured daily PM2.5 data in June 2020 over nine southern states of the US, including Florida, South Carolina, Georgia, Alabama, Mississippi, Louisiana, Arkansas, Oklahoma, and Texas. This wide swath of states captured the major influence of the massive dust intrusion on air quality. Unfortunately, most of EPA measuring sites in Puerto Rico were not active during the period of this study, except Canato where PM10 (PM with aerodynamic diameter of smaller than 10 µm) concentration was measured during the 22–30 June period. Given that in the southern US the EPA network currently only collects PM10 concentration at a very limited number of sites, our analysis will focus on PM2.5.
2.5 GEOS simulations of aerosol
The NASA GEOS is a global Earth system model that includes components for atmospheric circulation and composition, ocean circulation and biogeochemistry, land surface processes, and data assimilation (Rienecker et al., 2011). The coupled atmospheric constituent module within the GEOS architecture most relevant to this study is an aerosol module based on the Goddard Chemistry Aerosol Radiation Transport (GOCART) model (Colarco et al., 2010). GOCART simulates major components of aerosols (with diameter between 0.02 and 20 µm) and some gaseous precursors, including dust, sea salt, sulfate, nitrate, ammonium, organic carbon, black carbon, SO2, dimethyl sulfide, and NH3 (Chin et al., 2002, 2009, 2014; Ginoux et al., 2001; Bian et al., 2017). The model runs in a replay mode, with meteorological fields being taken from the Modern-Era Retrospective analysis for Research and Applications – version 2 (MERRA-2) reanalysis (Gelaro et al., 2017) every 6 h. The model has a horizontal resolution of 1∘ × 1∘ and 72 layers in the vertical. The GEOS hourly outputs of aerosol are used in this study. Note that the model run does not assimilate satellite aerosol observations.
In the GOCART dust modeling, bulk dust emissions are calculated online based on 10 m wind speed and a pre-determined dust source function. The dust source function is a dynamic one that uses the topographic depression and the dynamic surface bareness derived from the satellite observations (Ginoux et al., 2001; Kim et al., 2013). This dynamic dust source function accounts for the seasonal and interannual variations in the surface bareness and soil moisture, which improves simulated temporal variation in dust aerosols over some semi-arid areas (Kim et al., 2013). Currently, dust particle size distribution (PSD) in the GEOS model is described with five size bins (i.e., 0.2–2, 2–3.6, 3.6–6, 6–12, and 12–20 µm in diameter) (Ginoux et al., 2001; Chin et al., 2009). The size distribution of emitted dust is empirically prescribed following Tegen and Fung (1994). Emitted dust is transported by winds and removed from the atmosphere via gravitational settling, dry deposition by turbulence, and scavenging by large-scale and convective rain. The gravitational settling is calculated with an assumption of spherical particles following a method described in Ginoux et al. (2001). The model parameterizes large-scale in-cloud and below-cloud scavenging as a function of rainfall production rate and precipitation fluxes, respectively, and the scavenging in convective updrafts as a function of the updraft mass flux. Dust optical properties in the model are based on the Meng et al. (2010) database that incorporates Mie, T-matrix, DDA (discrete dipole approximation), and geometric optics (depending on size parameter), as described in Colarco et al. (2014). The shape distribution presently used is the spheroidal distribution proposed by Dubovik et al. (2006).
2.6 Uncertainties
Both observations and model simulations are subject to significant uncertainties, which have been extensively assessed in previous studies. Here we provide a summary of major uncertainties associated with observational datasets and GEOS dust modeling.
Satellite retrievals can have large uncertainties resulting from instrument calibration, cloud contamination, and aerosol models assumed in the retrieval algorithms, among others. Previous validations show that the MODIS DT and DB AOD has an uncertainty of ± (0.05 + 0.15 ⋅ AOD) (Levy et al., 2013) and ± (0.03 ± 0.20 ⋅ AOD) (Sayer et al., 2013), respectively. Generally, the MODIS retrievals tend to bias high at low AOD but bias low at high AOD. In this study, we use the new MODIS DT algorithm that accounts for non-sphericity of dust particles, which significantly improves MODIS DT retrievals (Zhou et al., 2020b). In the next section we will also evaluate the MODIS AOD retrievals with the AERONET measurements during this event. For CALIOP retrievals, the assumptions of aerosol-type-dependent lidar ratio could result in large uncertainty in the aerosol extinction retrieval, in particular when aerosol loading is high (Winker et al., 2009; Yu et al., 2010; Schuster et al., 2012). On the one hand, the CALIOP aerosol detection algorithm tends to miss tenuous features with signal below the instrument sensitivity. On the other hand, the lidar signal can be completely attenuated when the aerosol layer is optically thick (e.g., AOD greater than 2–3), which leads to missing the lower part of the aerosol plume. In either case, the AOD is biased low. In the CALIOP version 4 retrieval, the lidar ratio for dust is increased from 40 sr in the early versions to 44 sr, resulting in an increase in dust extinction and a smaller low bias with respect to AERONET AOD (Kim et al., 2018).
Uncertainties in the GEOS dust simulations can come from a variety of sources, including dust emissions, atmospheric transport and removal processes, and assumptions of dust particle size, shape, and refractive indices. The GEOS dust simulations have been validated with a variety of observations and compared with other models, largely in terms of the climatology (e.g., Huneeus et al., 2011; Kim et al., 2014, 2019; Kok et al., 2017; Yu et al., 2010, 2019). Like many other models, the GEOS model overestimates fine dust but underestimates coarse and giant dust (Kok et al., 2017). Comparisons against satellite observations for the trans-Atlantic dust transport also show that the model tends to remove dust from the atmosphere too efficiently (Kim et al., 2014; Yu et al., 2019). In this study we will use the MODIS and CALIOP observations to evaluate how the GEOS model performs in simulating the Godzilla dust event.
3.1 Observational characterizations of the dust event
In this section we use satellite and ground-based observations to characterize the dust event, including the evolution of trans-Atlantic dust plumes, strength of the dust intrusion event in the context of the last 2 decades, impacts of the dust intrusion event on air quality in Puerto Rico and the southern US, and synoptic meteorological conditions controlling the dust event.
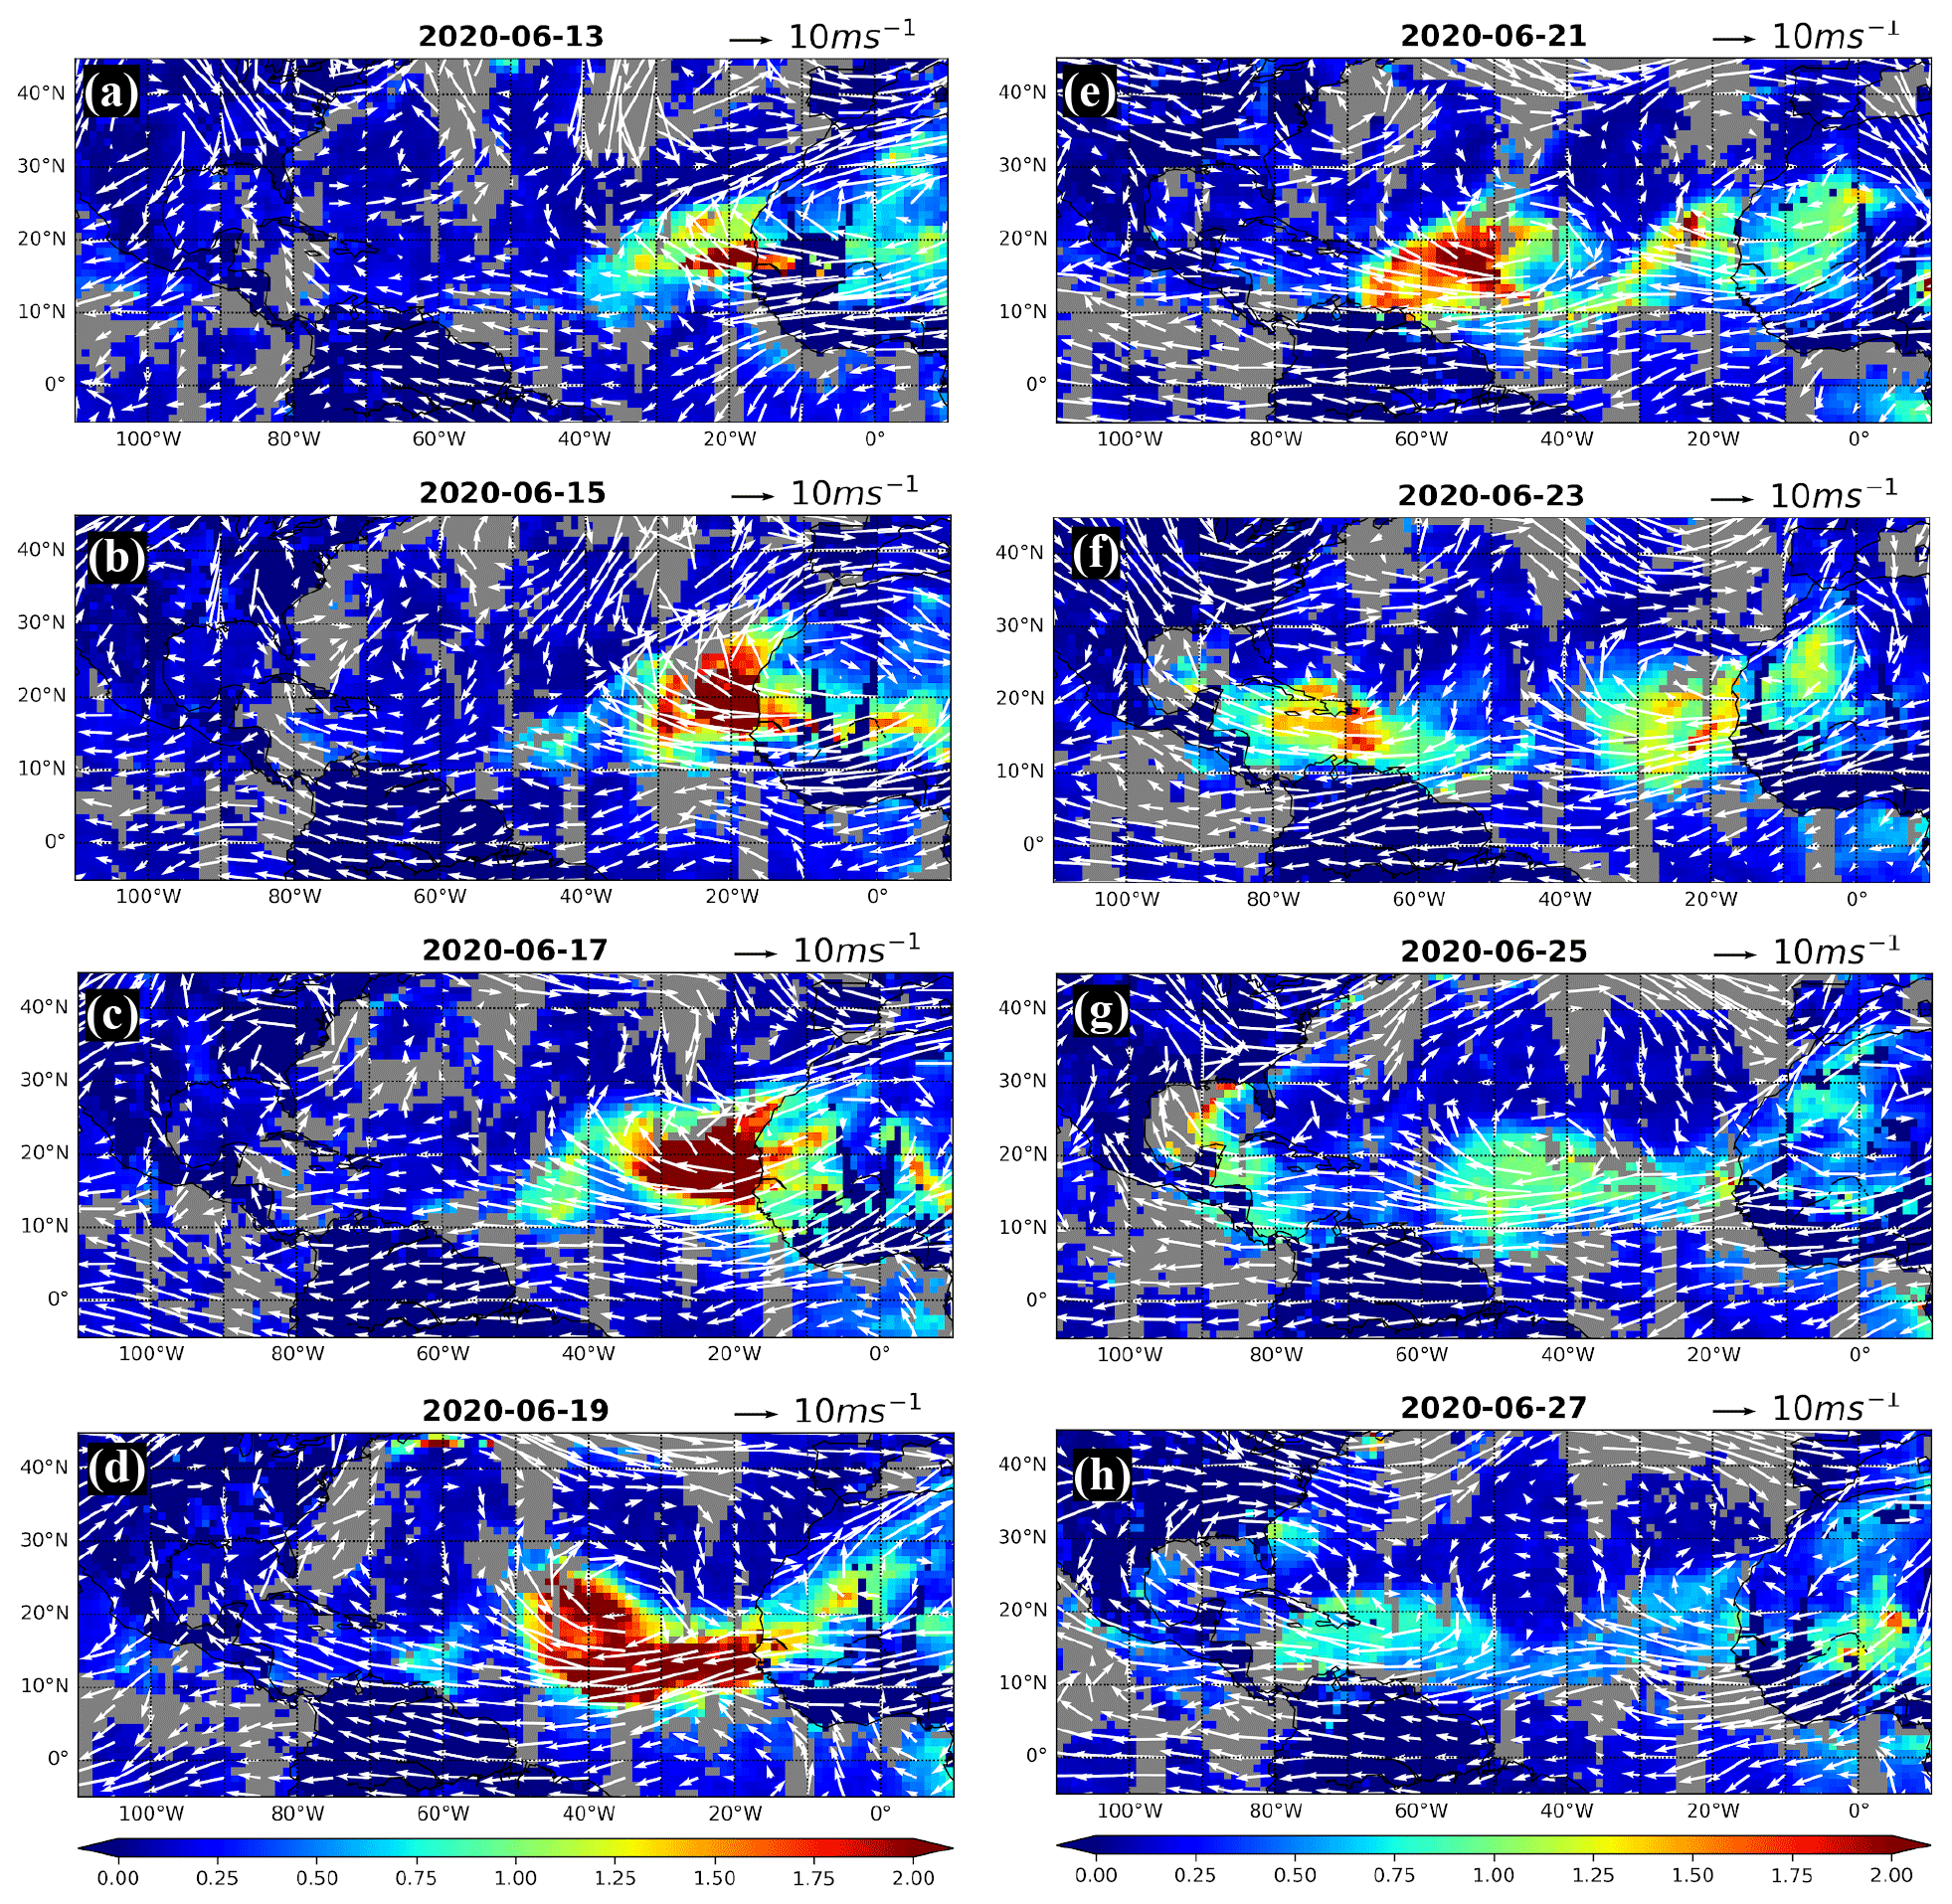
Figure 2Evolution of dust plumes as revealed by MODIS AOD (color map) from 13 to 27 June 2020. Overlaid on the AOD is the MERRA-2 wind vectors at about 4 km altitude, which illustrates how the dust plumes are carried by atmospheric circulations from the coast of North Africa to the Caribbean Basin and the southern US. Gray areas indicate MODIS data gaps due to the presence of clouds or other unfavorable conditions for the retrieval.
3.1.1 Evolution of the trans-Atlantic dust plumes
Horizontal variations in trans-Atlantic dust plumes are characterized by MODIS aerosol retrievals. Figure 2 shows the MODIS daily AOD maps from 13 to 27 June at a frequency of every other day (a full day-to-day variation in AOD can be seen in an animation in Yu et al., 2021, https://doi.org/10.5446/50830). Here MODIS observations from both Terra and Aqua are combined to represent daily AOD with a better spatial coverage. Overlaid on the AOD map is horizontal wind vectors at about 4 km altitude from the MERRA-2 reanalysis. Clearly seen in these maps are the dust plumes as wide as 2500 km (confined within 5–30∘ N latitude belt) being transported across the tropical Atlantic Ocean in a meandering path and ultimately reaching the Gulf of Mexico and the southern US. A discontinuity in AOD along the West African coastline reflects the difference between the MODIS DT and DB algorithms. In the early days (13–15 June), the dust plume was largely confined to the African coastal region (east of 35∘ W), which is consistent with the presence of a strong meridional wind component in the region. This coastal accumulation of dust led to a peak AOD of about 3.5 on 17 June. Although the plume had already started moving westward on 17 June as a result of a much weakened meridional wind, the rapid ventilation of dust away from the African coast took place on 18 June. On 19 June, the plume extended from the African coast to 50∘ W with more dust coming out of West African deserts. The dust plume front was swirling around a weak anticyclone with its front moving northward to nearly 30∘ N. In the following days, the dust plume drifted south and reached the northern coast of South America on 21 June. The plume with its front at 70∘ W was followed by another narrow dust plume located near the coast of West Africa with AOD generally smaller than 1. It appears that significant dust in the plume had been deposited into the ocean during the period of 19–21 June. Some new dust sources were also evident over West Africa (e.g., southern Algeria, Mali, and Mauritania). On 23 June dual dust plumes appeared on the map, the primary Godzilla dust plume over the Caribbean Basin (centered around 15∘ N and 68∘ W) and the secondary dust plume near the African coast. The primary dust plume veered into the Gulf of Mexico towards the northwest on 25 June, potentially striking a large swath of the southern US. While a branch of the dust plume appeared to enter the Florida panhandle, the plume structure off the gulf coast from Texas to Louisiana was not visible from MODIS due to the presence of clouds. Meanwhile, the secondary dust plume was approaching the eastern Caribbean Sea at about 60∘ W. On 27 June, the secondary dust plume reached the Gulf of Mexico, but did not move toward the southern US due to the dominant zonal winds in the gulf region.

Figure 3Tracks of trans-Atlantic dust plumes over 10–30 June 2020 as revealed in the longitude–time Hovmöller diagrams of MODIS daily AOD (a) and FMF (b). AOD and FMF are averaged over 5–30∘ N.
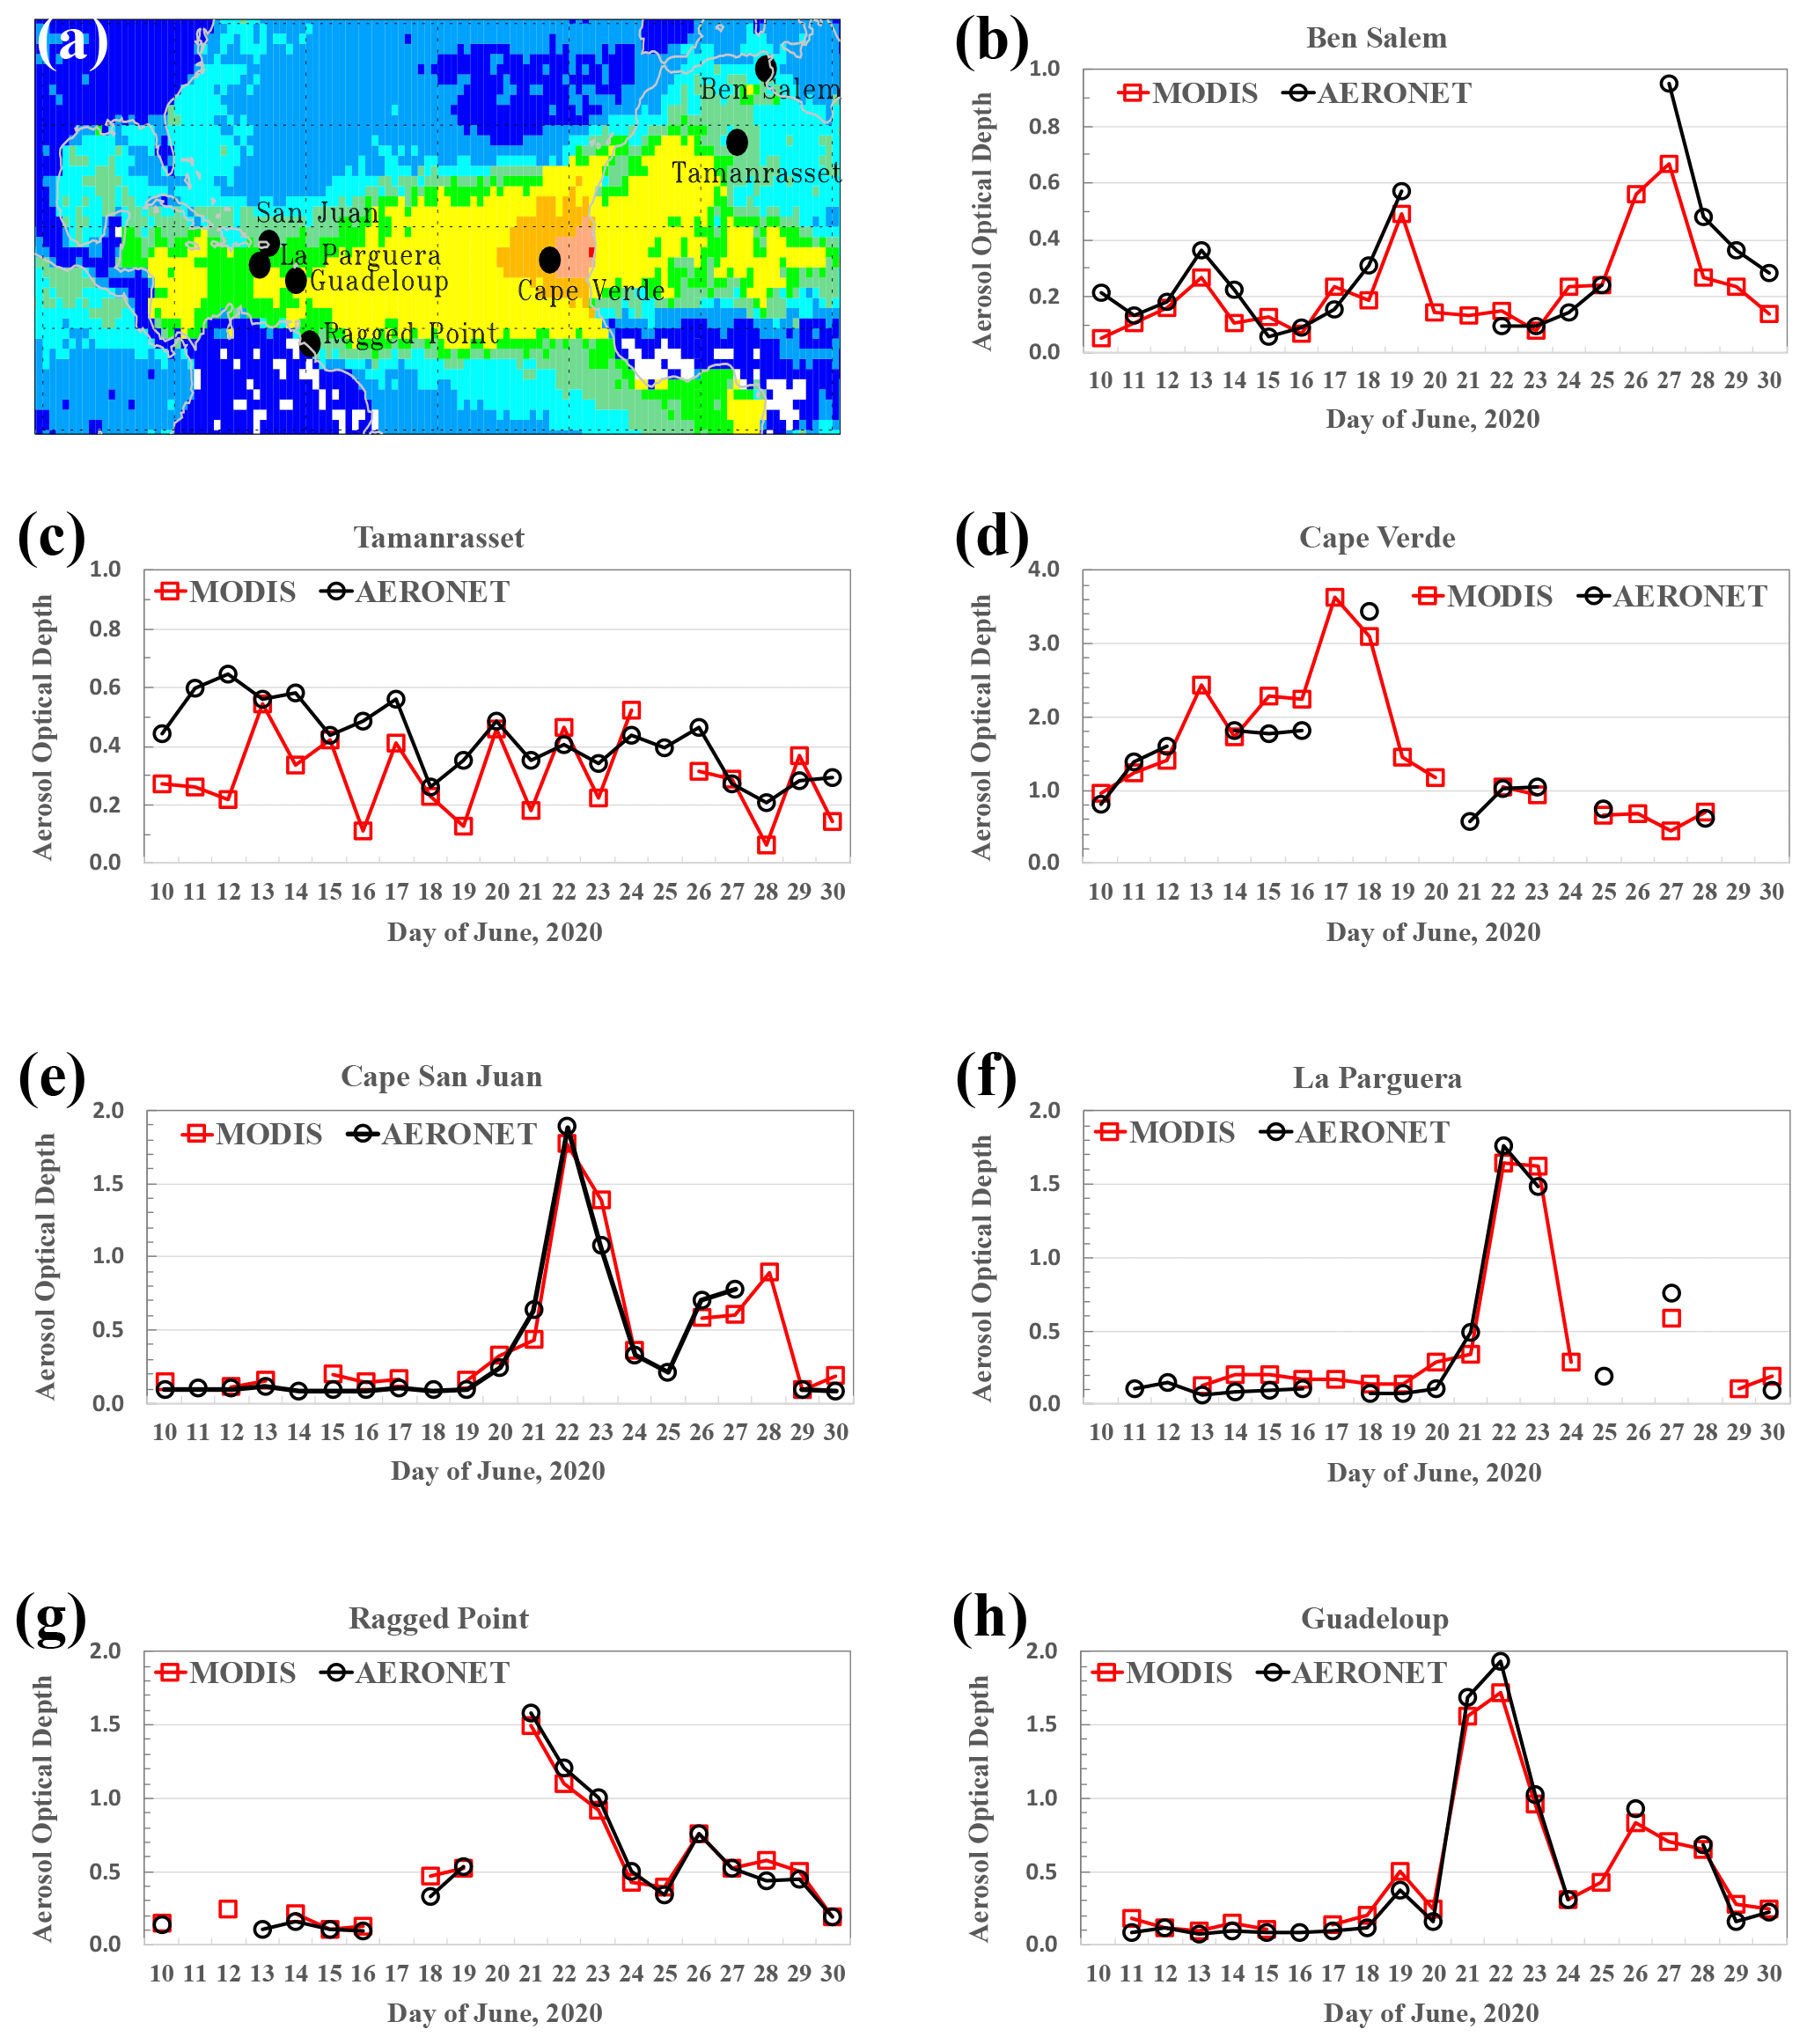
Figure 4Time series (10 to 30 June 2020) of MODIS and AERONET daily AOD at 550 nm at seven AERONET sites, as illustrated in (a) over MODIS AOD map, including (b) Ben Salem, (c) Tamanrasset, (d) Cape Verde, (e) Cape San Juan, (f) La Parguera, (g) Ragged Point, and (h) Guadeloupe.
To track the progression of dust plumes across the tropical North Atlantic Ocean, we present MODIS daily AOD and FMF averaged over 5–30∘ N in the time–longitude Hovmöller diagrams, as shown in Fig. 3. During the 10–30 June 2020 period, three distinct dust plumes stand out with high AOD and low FMF (dust particles are coarse and have smaller values of FMF than background marine aerosol and combustion aerosol). The most prominent dust plume, i.e., the Godzilla dust plume, started to build up along the African coast on 13–15 June. Initially the dust plume was generally confined and accumulated to the coastal region east of 35∘ W. As such over the coastal water off West Africa, high AOD (1.5–2.0) and small FMF (0.1–0.2) persisted for several days. On 17–18 June, the intense dust plume was transported westward rapidly by an African easterly wave, reaching the eastern Caribbean (at 60∘ W) on 21 June with an AOD of 0.9–1.3 and FMF of about 0.2 and then the Gulf of Mexico (at 90∘ W) on 25 June with an AOD of about 1.0 and FMF of 0.3. AOD did not undergo a significant decrease from the eastern Caribbean to the Gulf of Mexico, which would yield a strong influence on the southern US. Additionally, two weaker but still notable dust plumes are also displayed in the Hovmöller diagrams. One plume started its trans-Atlantic journey from the coast of North Africa (at 15∘ W) with an AOD of ∼ 1.2 and FMF of ∼ 0.1 on 10 June. The AOD of this plume decreased rapidly to ∼ 0.3 at 45∘ W on 15 June. No clear plume can be seen beyond this point, suggesting that this dust plume had been quickly removed from the atmosphere and did not reach the Caribbean Basin. On the other hand, another dust plume originating at the coast on 22 June with a smaller AOD of about 0.9 was transported all the way to the Caribbean Basin and Gulf of Mexico. The plume reached the eastern Caribbean Basin (at 60∘ W) on 26 June and the Gulf of Mexico (at 90∘ W) on 30 June.

Figure 5Curtains of CALIOP–CALIPSO aerosol extinction at 532 nm (colored) in the North African coastal region (a – 17 June and b – 18 June) and the Caribbean Basin (c – 23 June and d – 24 June). Light gray, dark gray, and black represent cloudy, clear and clean (below the detection limit), and totally attenuated, respectively. The x axis denotes latitude and longitude of the CALIPSO track.
Figure 4 shows the time series of MODIS and AERONET daily AOD from 10 to 30 June 2020 at seven AERONET sites in West Africa and the Caribbean Basin, including Cape Verde, Tamanrasset, Ben Salem, Cape San Juan, La Parguera, Guadeloupe, and Ragged Point. These comparisons show that MODIS retrievals captured the time evolution of the dust events observed by AERONET sun photometers well, in particular over the Caribbean Basin.
The vertical structures of the dust plumes are characterized by CALIOP observations. Figure 5 displays the CALIOP aerosol extinction curtains over West Africa (17 June), the African coast (18 June), and the Caribbean Basin (23 and 24 June). In West Africa and along the coast, the top of the dust plume is at 6–8 km, which is higher in the north than in the south. This dust plume top altitude is higher than the climatology of summertime extreme dust events (∼ 5 km) (Huang et al., 2010). The intense dust layers stay above the low-level clouds (light gray shading) (Fig. 5a and b). Also, the heavy dust layer attenuates the CALIOP beam entirely so that no signal (black shading) is apparent below 2 km in some locations (Fig. 5b). After being transported to the Caribbean Basin, the top of the dust plume is at about 4 km, and the dust layer appears to mix with marine aerosol in the boundary layer. The mixing leads to the maximum extinction near the surface. Because the aerosol loading was significantly reduced through deposition processes along the transport, totally attenuated features do not exist over the Caribbean Basin. The CALIOP high-resolution measurements also show fine structures in the dust plume, including several sandwiched layers of high aerosol extinction of greater than 0.5 km−1 between 1.5 and 4 km near the African coast and about 0.3 km−1 between 1 and 3 km in the Caribbean Basin.
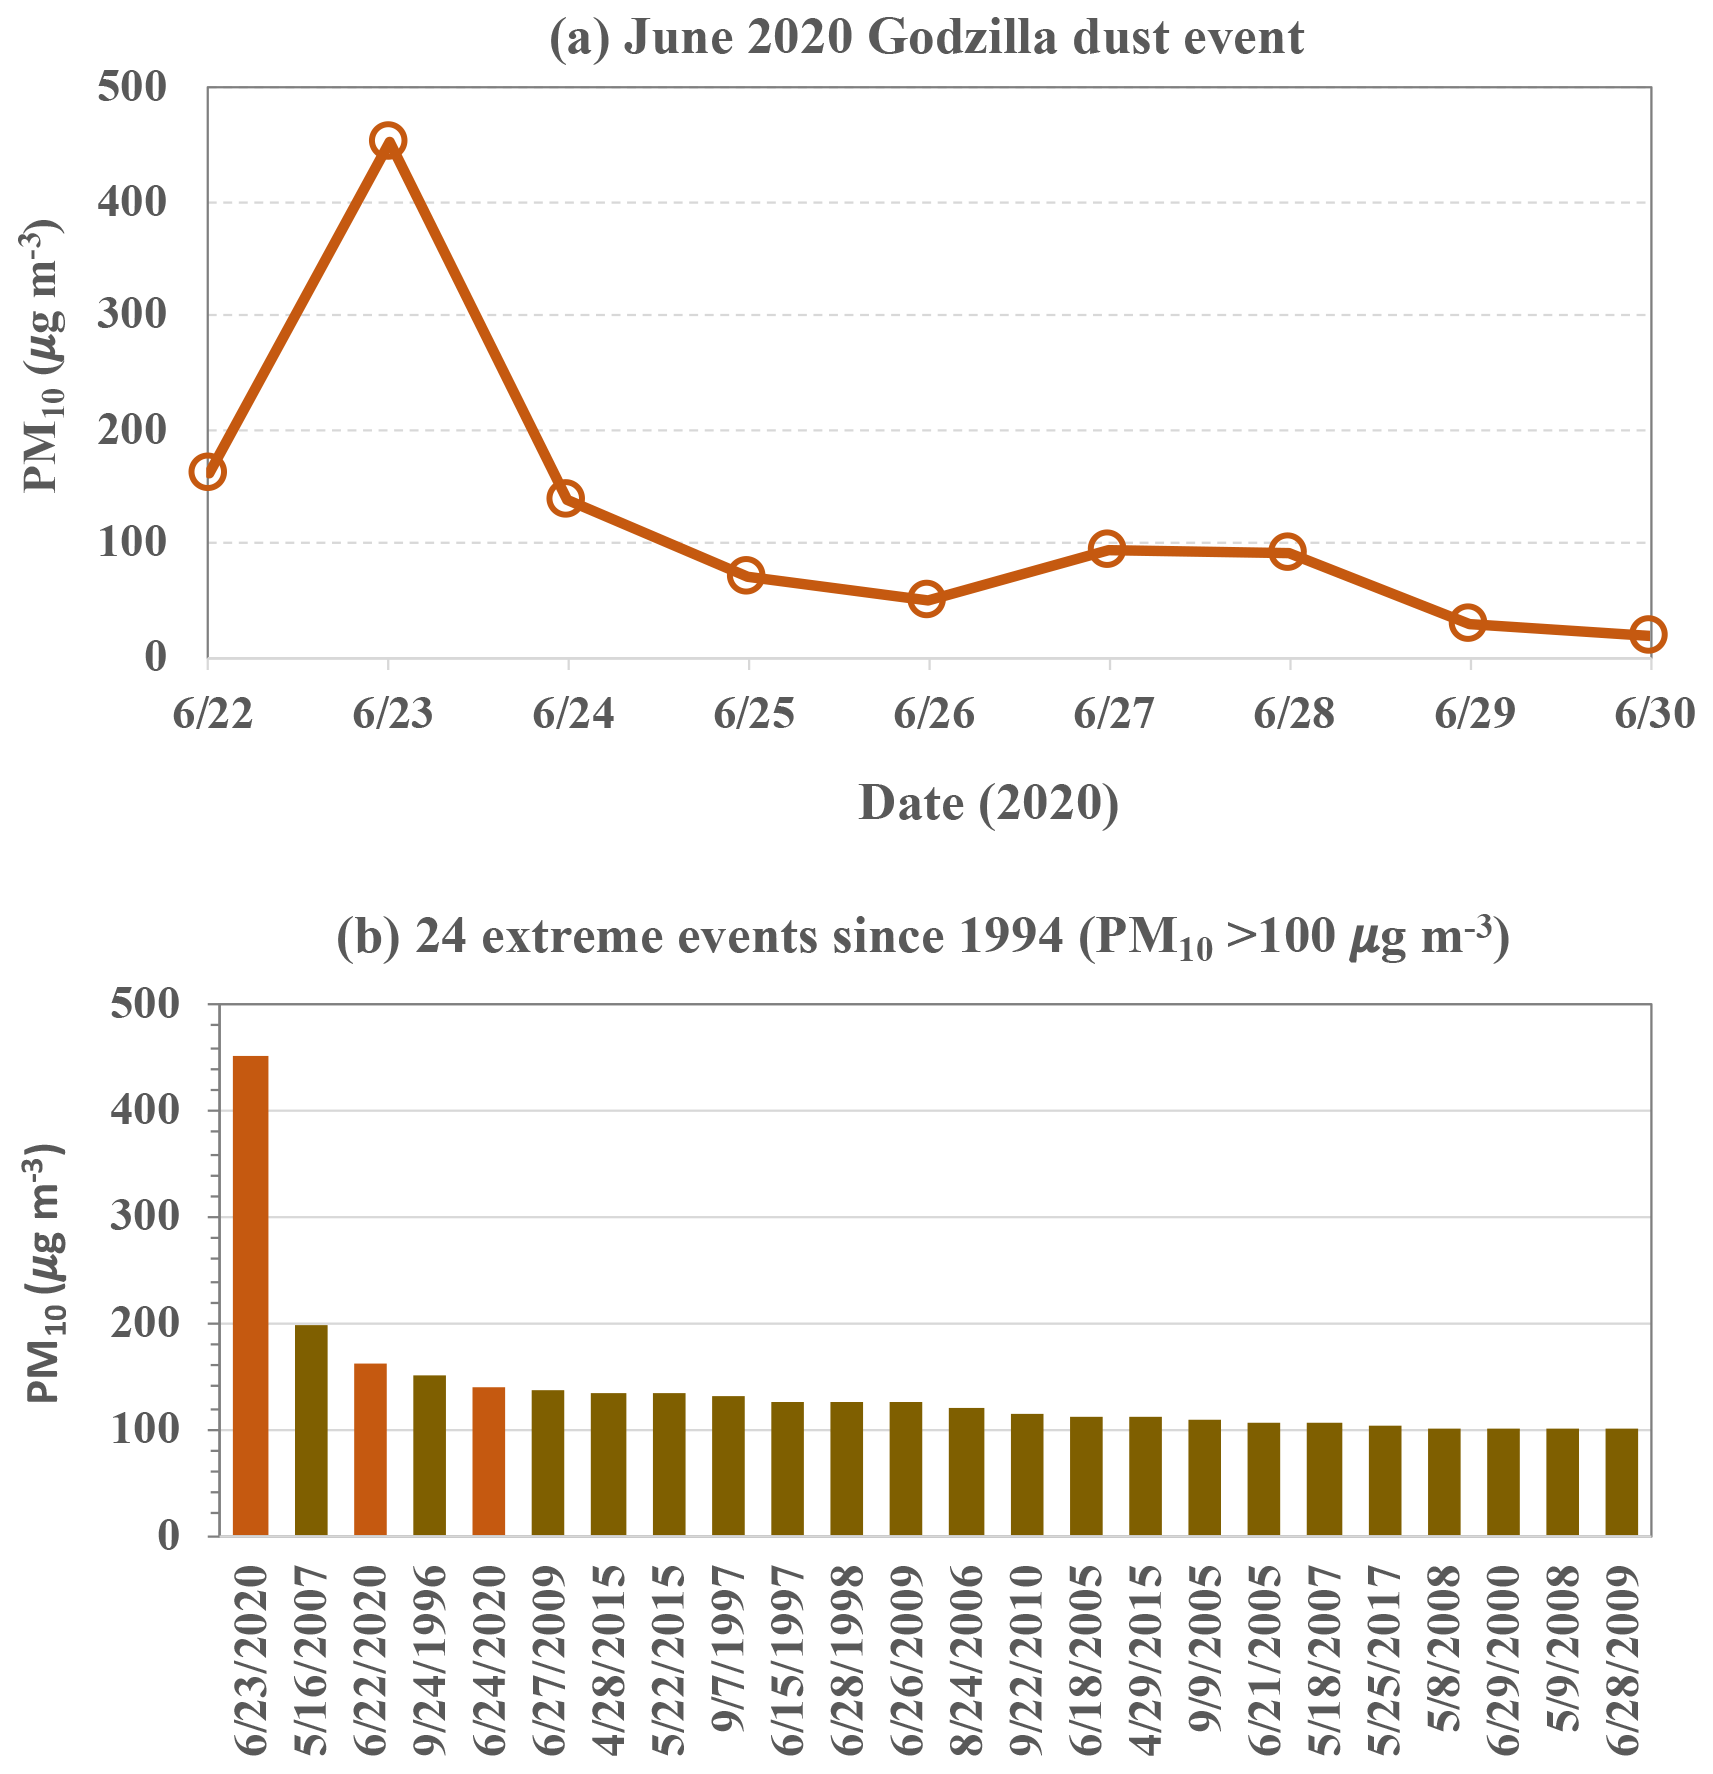
Figure 6(a) PM10 concentration measured at Catano, Puerto Rico, during the June 2020 dust event, (b) 24 extreme dust events (PM10 > 100 µg m−3) at this site since 1994.
3.1.2 Impacts on air quality in Puerto Rico and the southern US
As shown in Fig. 2, the gigantic dust plume swept across Puerto Rico. During this dust event PM10 was sampled only at the EPA Catano site (18.43∘ N, 66.14∘ W) (Fig. 6a). PM10 peaked on 23 June, with the concentration of 453 µg m−3. The PM10 concentration was also higher than the statistical average a day before (161 µg m−3 on 22 June) and after (139 µg m−3 on 24 June). On 27 and 28 June, PM10 concentration was 95 and 91 µg m−3, respectively, indicating the influence of the secondary dust plume discussed earlier. This day-to-day variation in PM10 concentration is different than AOD variation in Cape San Juan and La Parguera where AOD peaked on 22 June (Fig. 4). This difference can be explained by the aerosol vertical distribution, as shown in Fig. S1 in the Supplement. Generally, the dust layer was elevated in altitude on 22 June but touched the ground on 23 and 24 June, although CALIOP tracks were not always close to the surface site. By examining the PM10 data record since 1994 at the Catano site, we identified 24 d with daily PM10 > 100 µg m−3 (Fig. 6b). Clearly, 23 June 2020 had the highest PM10 in the whole record, while 22 and 24 June had the third and fifth highest PM10, respectively.
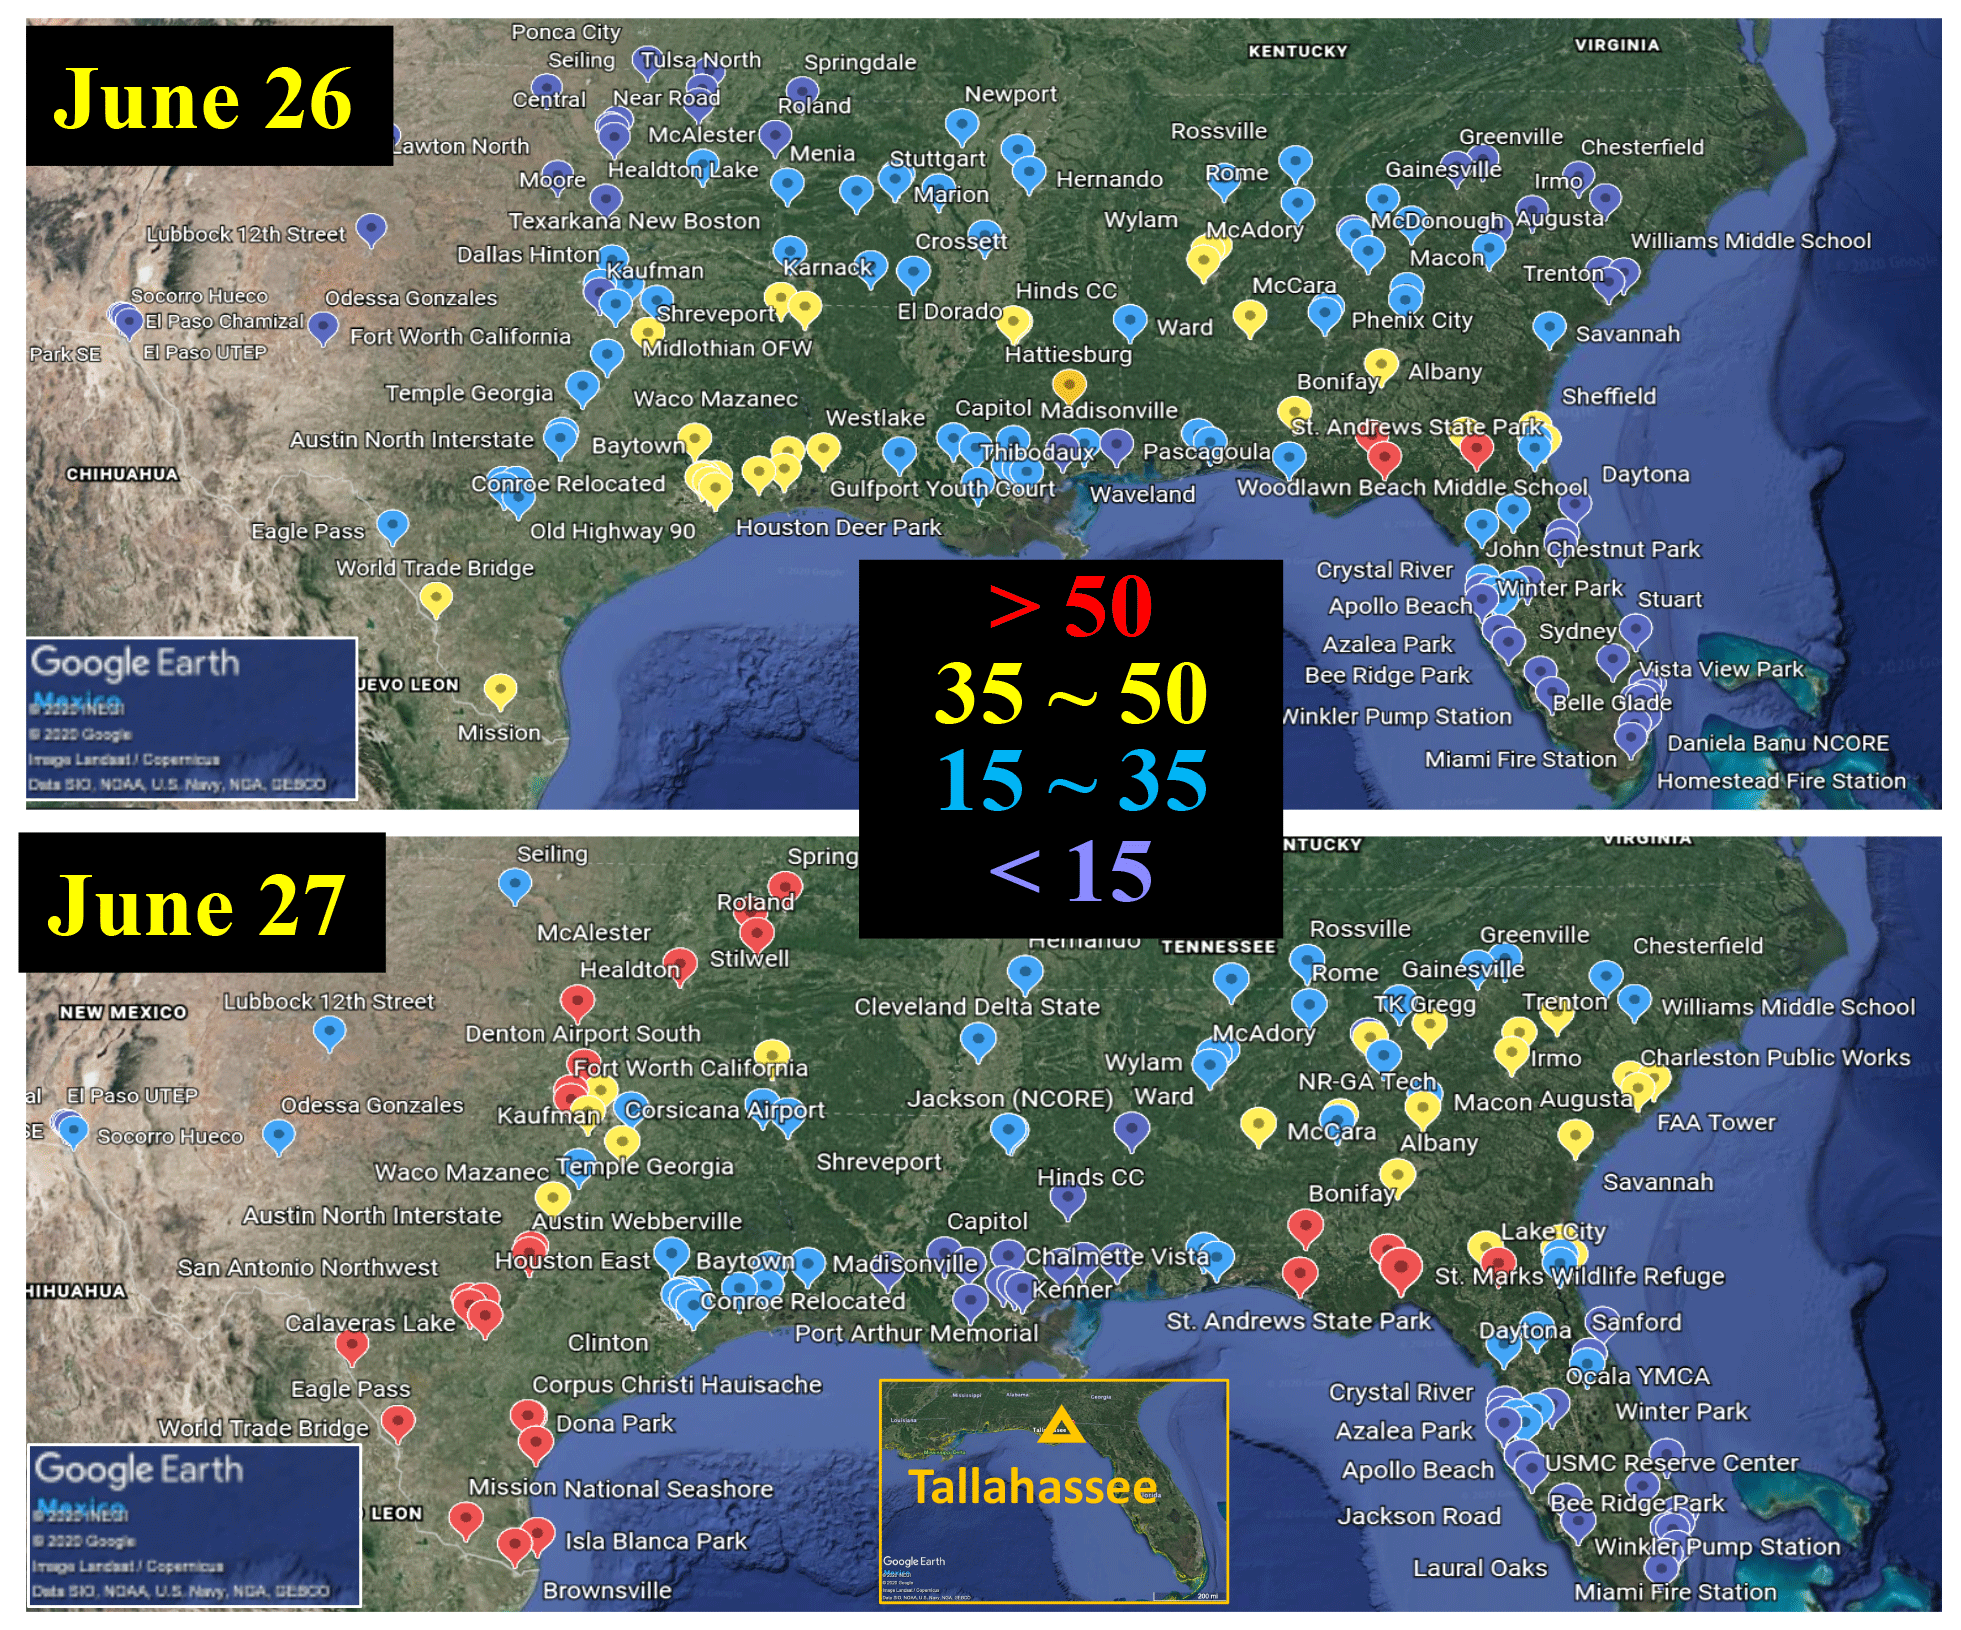
Figure 7Observed PM2.5 concentrations at the EPA air quality network over the southern US on 26 (top) and 27 June (bottom). PM2.5 concentrations are categorized and marked with color in four ranges: < 15 (purple), 15–35 (blue), 35–50 (yellow), and > 50 (red) µg m−3. Note that the EPA air quality standard for 24 h PM2.5 is 35 µg m−3. The location of Tallahassee is shown in the inset of the 27 June map. The background maps are copyrighted by © Google Earth.
The dust plume intruded into the southern US through the Gulf of Mexico pathway, affecting PM levels and thus possibly air quality in the southern US states. We examined daily PM2.5 concentrations in June 2020 at all available EPA air quality sites (∼ 150) in the nine southern US states and found that the surface PM2.5 concentrations at a number of sites were substantially elevated on 26 and 27 June in comparison to the days before and after. We categorized the PM2.5 data into four ranges, <15, 15–35, 35–50, and > 50 µg m−3, and marked with different colors, as illustrated in Fig. 7. On 26 June, 31 out of 158 sites (or 20 %) observed PM2.5 exceeding the EPA air quality standard of 35 µg m−3. On 27 June, 62 out of 150 sites (or 41 %) exceeded the EPA standard. The maximum PM2.5 concentration observed was 73.9 µg m−3 (St. Marks, Florida) and 73.5 µg m−3 (Eagle Pass, Texas) on 26 and 27 June, respectively. Although only a few sites have PM10 concentration available, three sites observed PM10 greater than 100 µg m−3, including 136 µg m−3 in North Tulsa, Oklahoma (27 June); 135 µg m−3 in Jackson NCORE, Mississippi (26 June); and 113 µg m−3 in OKC North, Oklahoma (27 June).
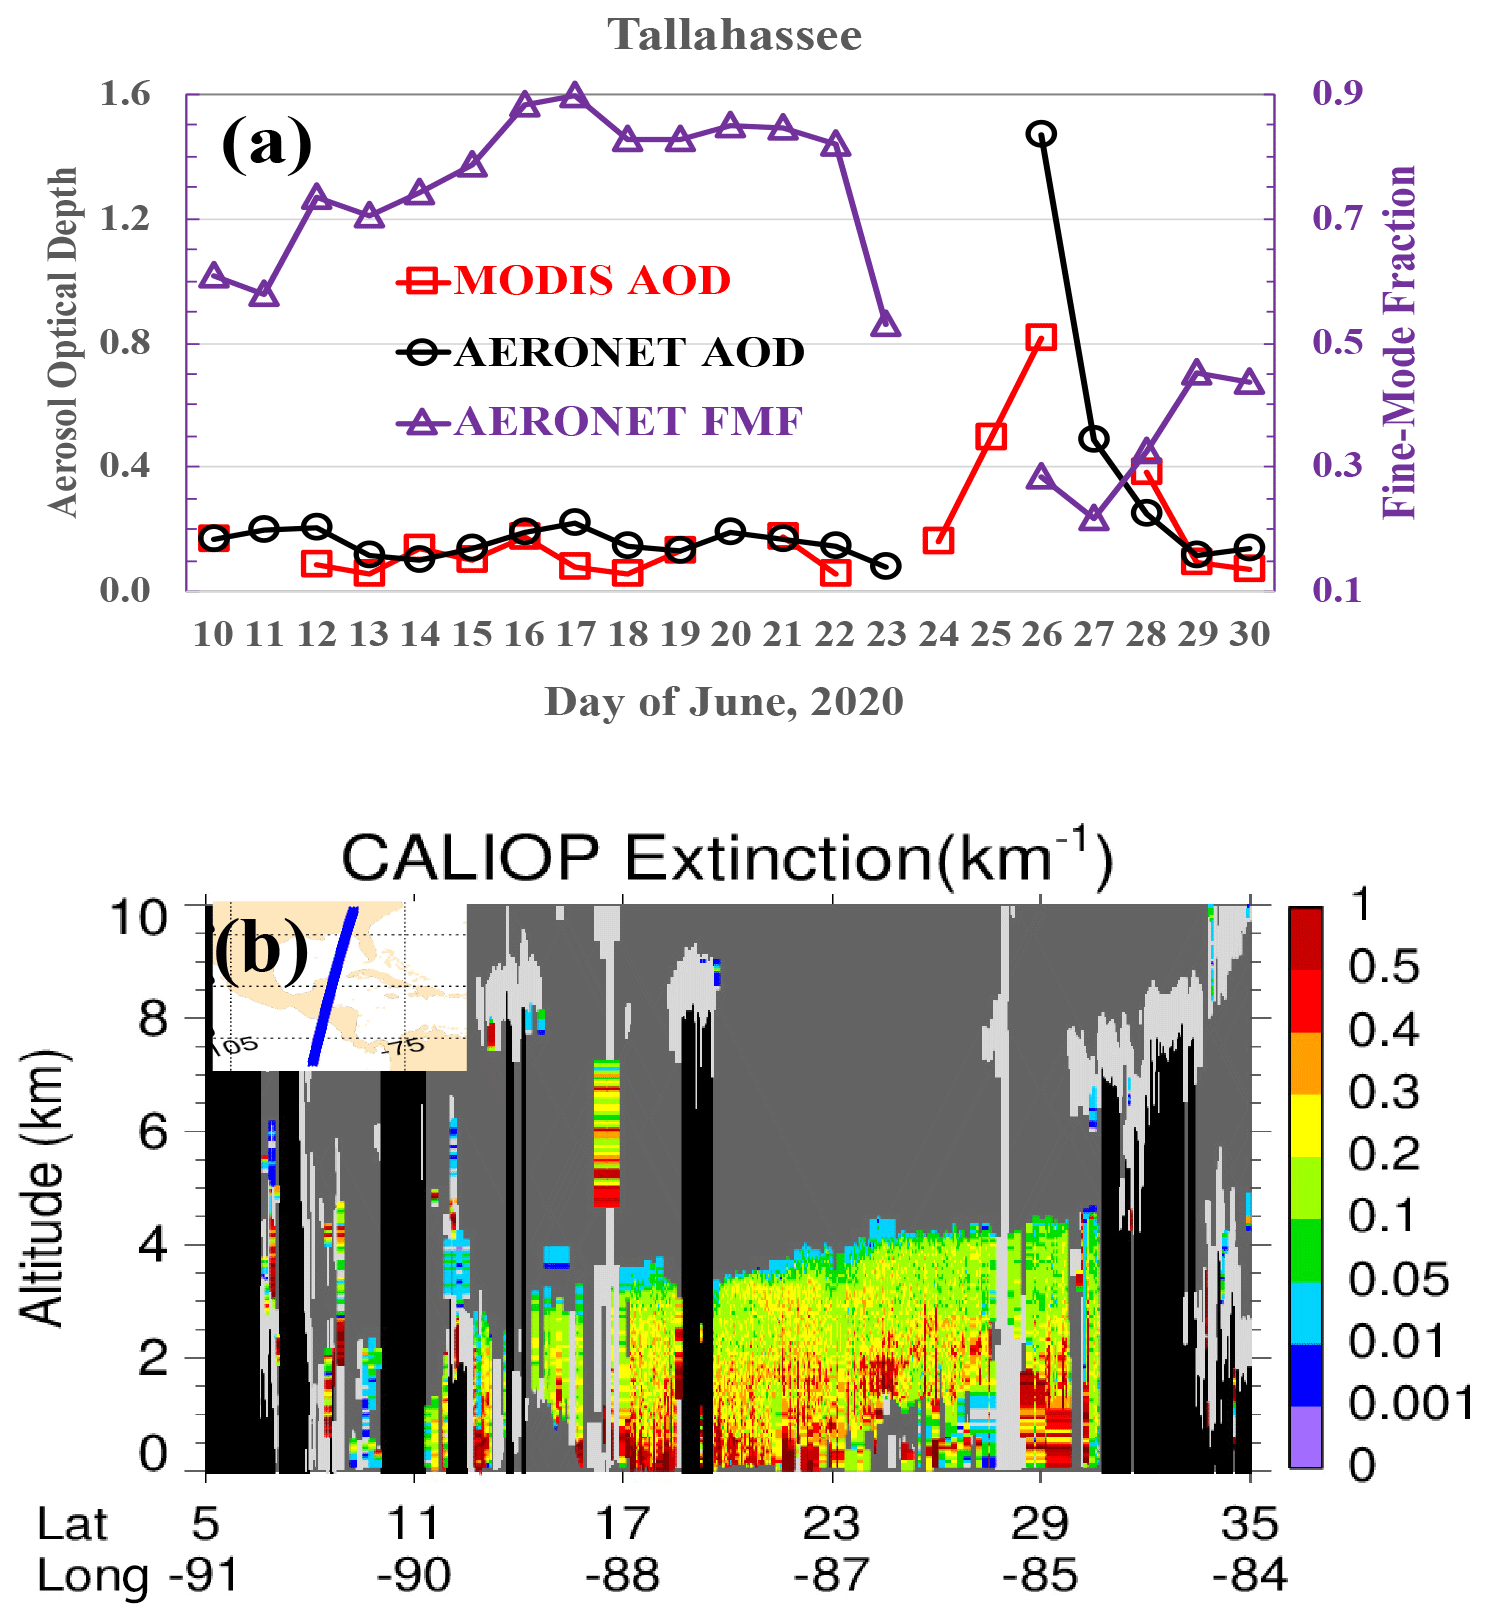
Figure 8The intrusion of African dust into the Florida panhandle as evidenced in remote sensing observations: (a) evolution of AOD (black from AERONET and red from MODIS, left axis) and FMF (purple from AERONET, right axis) over Tallahassee, Florida, during 10–30 June 2020; (b) curtain of CALIOP–CALIPSO aerosol extinction (at 532 nm) along a CALIPSO track overpassing the Florida panhandle on 25 June 2020. The x axis denotes latitude and longitude of the CALIPSO track.
A notable feature in Fig. 7 is that a number of sites in the Florida panhandle region detected PM2.5 concentration > 50 µg m−3 for both days, although PM2.5 concentrations remained low (< 15 µg m−3) in southern and central Florida. This suggests that the dust plume took the Gulf of Mexico pathway and affected the gulf coast in particular, which is corroborated by remote sensing measurements of dust plume intrusion to the region (Fig. 8). The AERONET measurements at Tallahassee (illustrated in the inset of 27 June map) show maximum AOD of 1.47 on 26 June, which is substantially higher than 0.1–0.2 during the 10–23 June period. Meanwhile the FMF on 27 June was 0.28, which represented a substantial drop from 0.82 on 22 June. MODIS AOD around Tallahassee shows an increase from about 0.2 on 24 June to 0.5 and 0.8 on 25 and 26 June, respectively. On 25 June, CALIOP also passed through the region with the aerosol extinction coefficient of 0.1–0.5 km−1 from the surface to about 4 km. These measurements provide clear evidence that large amounts of dust did intrude into the panhandle region and degrade the air quality significantly.

Figure 9MODIS Terra daily AOD for 2020 (red dot and thick line) in comparison to 2000–2019 climatology (the median and range of daily AOD are represented by the thick black line and gray vertical bar, respectively) in seven regions defined in (a), including (b) NAFC, (c) SCRB, (d) NCRB, (e) NCSA, (f) GMEX, (g) TEPO, and (h) SAHD. The insets in (b–h) zoom in on the day-to-day variations in regional AOD from 10 to 30 June 2020.
3.1.3 A historic event in the past 2 decades and its synoptic control
The June 2020 event of African dust intrusion into the Caribbean Basin and the Americas is a historic one projecting above the climatology from the past 2 decades, as registered in the MODIS Terra data record since 2000 (Fig. 9). We carried out regional analysis of MODIS Terra daily AOD since 2000 in seven regions as defined in Fig. 9a: Saharan deserts (SAHD), North African Coast (NAFC), the northeast coast of South America (NCSA), the southern Caribbean Basin (SCRB), the northern Caribbean Basin (NCRB), the Gulf of Mexico (GMEX), and the tropical eastern Pacific Ocean (TEPO). Results of the regional analysis are shown in Fig. 9b–h. In each region, daily AOD for January–June 2020 is marked as red dots and lines, with the evolution of daily AOD from 10 to 30 June 2020 being elaborated on in the inset. For visual clarity, we present the 2000–2019 daily AOD climatology in the form of the 20-year average (black line) plus its range (gray vertical bar). Clearly, the dust event in June 2020 has the highest AOD over the past 2 decades over the North African coast (Fig. 9b), the southern Caribbean Basin (Fig. 9c), and the northern Caribbean Basin (Fig. 9d). In the northeast coast of South America (Fig. 9e), the dust transport to this region peaks in March–June with a minimum in August–November, which is determined by the seasonal migration of ITCZ (Yu et al., 2015a, b; Prospero et al., 2014). Despite this, the 2020 June event had the second highest AOD over the past 2 decades and was the highest in June. The Gulf of Mexico (Fig. 9f) and the tropical eastern Pacific Ocean (Fig. 9g) are highly impacted by biomass burning smoke from Central America in spring. Although the June 2020 dust event had lower AOD than for some extreme springtime biomass burning events, it was indeed the highest in June. Moreover, it is very rare for African dust to make it into the tropical eastern Pacific because observations have suggested a Central American barrier to dust transport (Nowottnick et al., 2011). Therefore, for all six regions affected by trans-Atlantic dust transport, the June 2020 dust is a historic event over the past 2 decades when seasonal variations in dust and smoke transport are factored in. On the contrary, the MODIS AOD over the Saharan desert (Fig. 9h) does not indicate that daily dust emissions from North Africa were particularly large in early and mid-June. In fact, it was smaller than AOD in late May and 6–8 June 2020. Although the 2020 June AOD was higher than the climatological average in June, it was not the highest. An analysis in West Africa (10–30∘ N, 17∘ W–10∘ E), which is a part of the SAHD and likely the major source region for this dust event, displays similar AOD variations (see Fig. S2 in the Supplement).
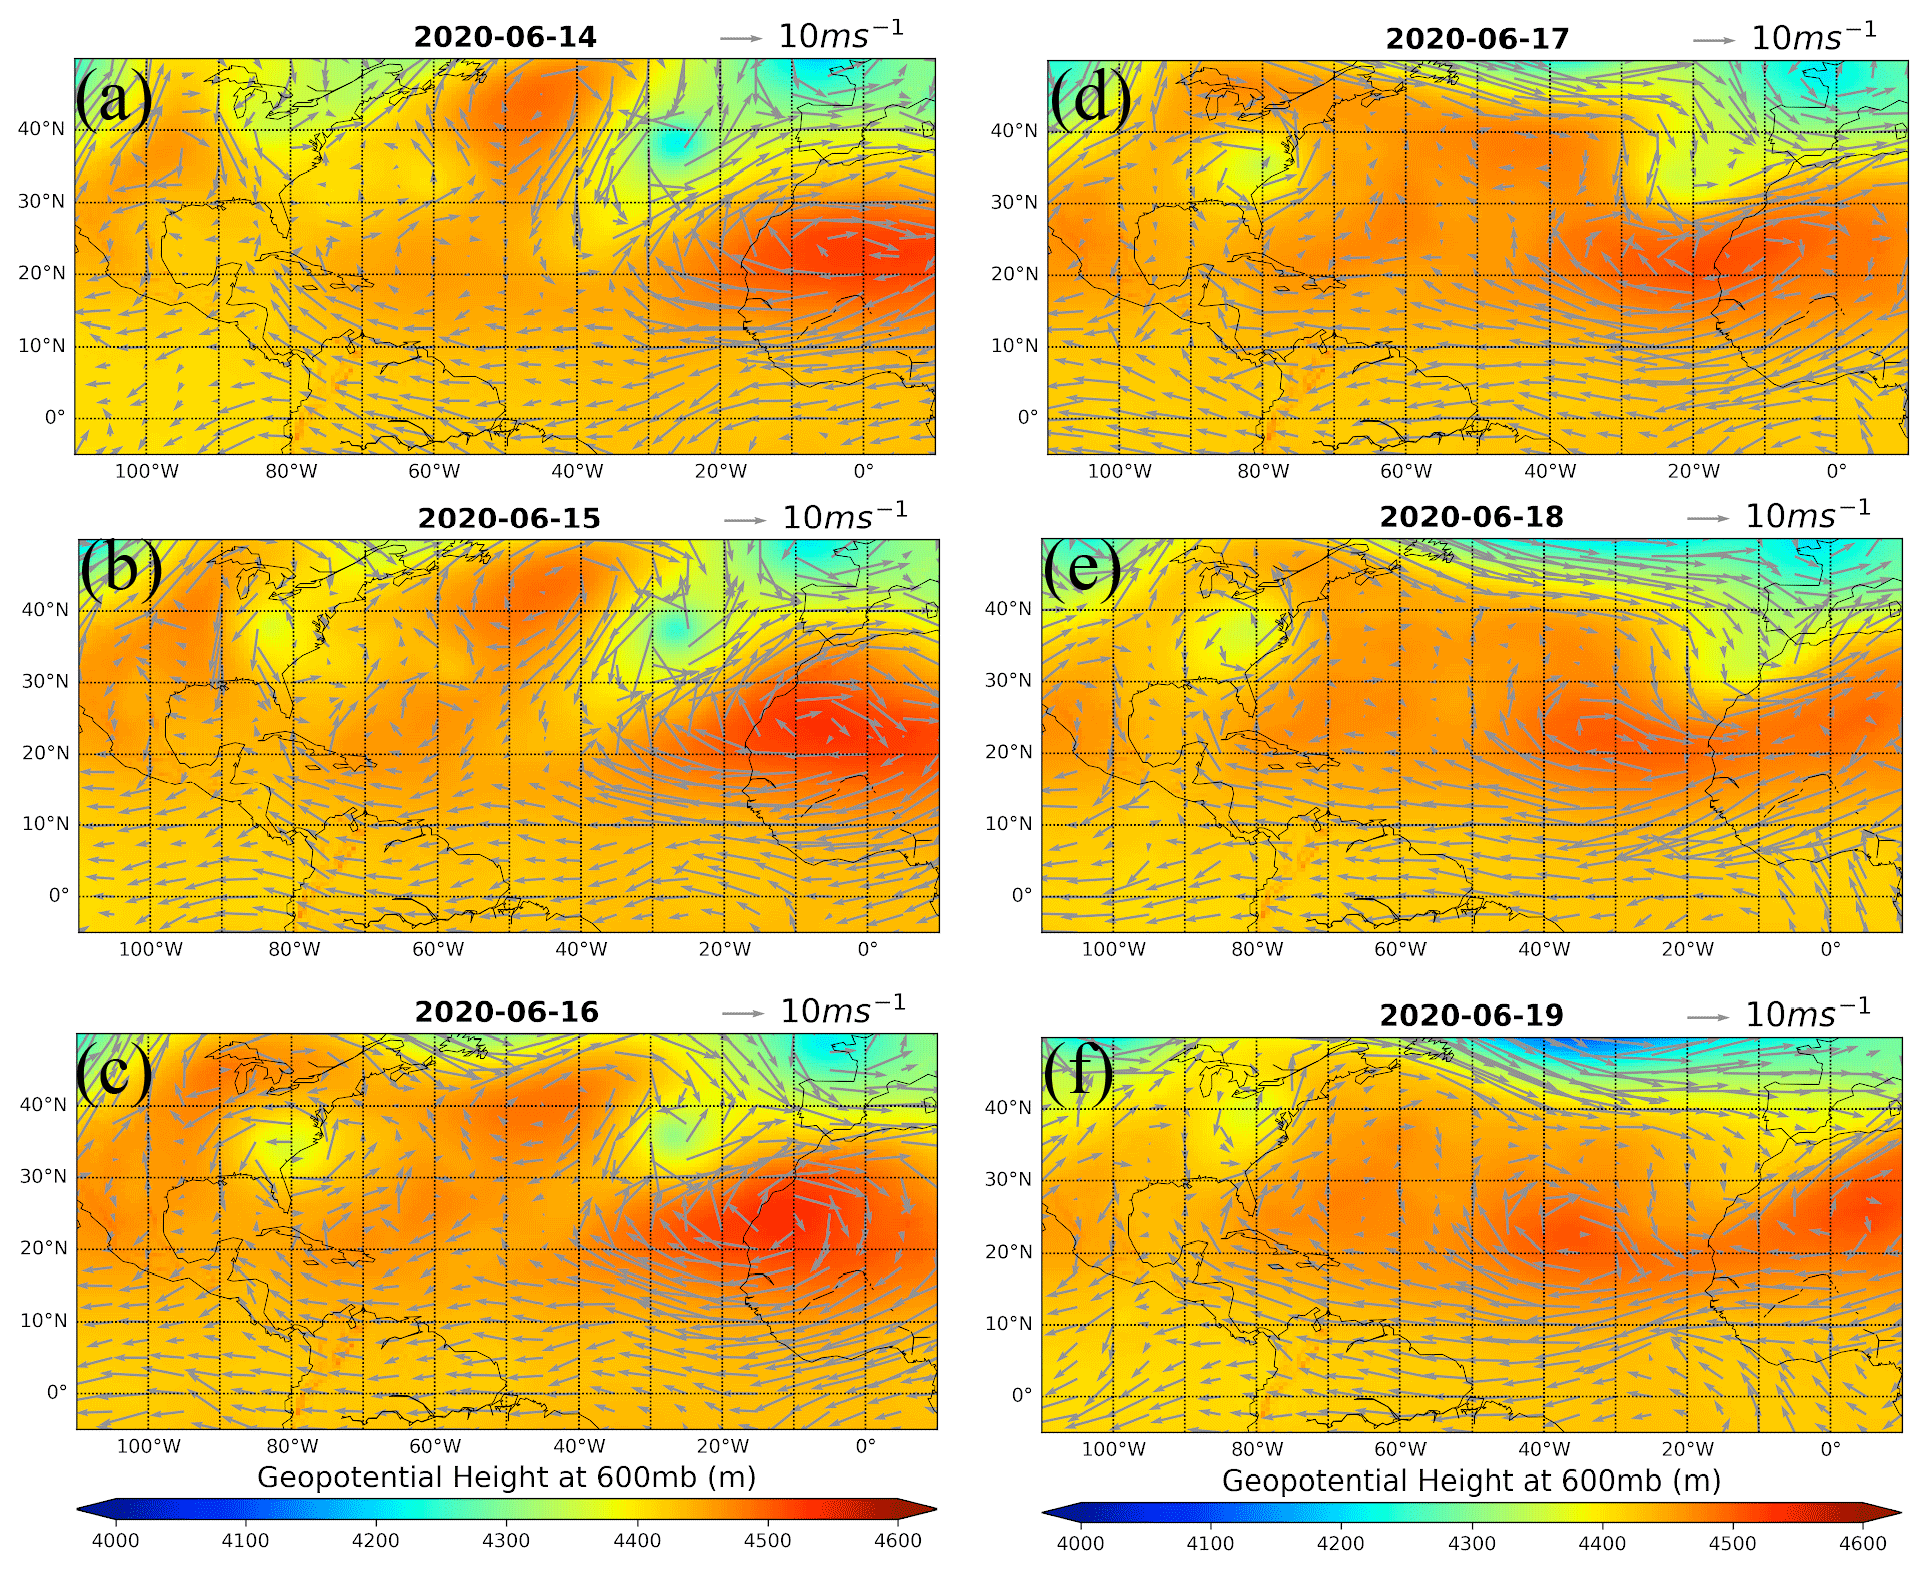
Figure 10Patterns of MERRA-2 geopotential height (color) and wind vector (gray arrow) at the 600 hPa level on 14 (a), 15 (b), 16 (c), 17 (d), 18 (e), and 19 June (f) 2020.
Given that the dust loading in source regions in June 2020 was large albeit not historic (Figs. 9h and S2), the observed historic intrusion of African dust into the Caribbean Basin and the southern US should have been modulated by meteorological conditions. The North Atlantic subtropical high (NASH), also known as the Bermuda–Azores high, is a semi-persistent synoptic system that affects the meteorology and atmospheric circulations in West Africa and the tropical Atlantic Ocean. The variation in NASH location and intensity would affect how the dust is transported across the tropical Atlantic Ocean. Here we analyze the MERRA-2 meteorology associated with the dust episode by focusing on geopotential height and wind. Figure 10 displays the evolving spatial patterns of the geopotential height and wind vectors at 600 hPa from 14 to 19 June. On 14 June, the subtropical high was centered at 43∘ N, 45∘ W with a maximum height of about 4500 m. This ridge system was accompanied by a low-pressure system or trough to its southeast around the Azores and an extensive high-pressure system (∼ 4550 m) over West Africa. This setting of synoptic systems created an unfavorable atmospheric circulation condition for trans-Atlantic transport of dust. At the lower latitudes (south to ∼ 20∘ N), West Africa was dominated by strong northeasterly winds, which rapidly exported dust from Sahara–Sahel transit to the eastern Atlantic Ocean. But the easterly veered to the north in the coastal ocean (15–35∘ W), to the east at the northern fringe of the African continent (30–35∘ N), and eventually to the south in central Africa. This created a nearly closed atmospheric circulation system over West Africa and the eastern North Atlantic Ocean that could recirculate and trap the dust in the West African coast. The unfavorable synoptic systems persisted through 15 and 16 June, although they were gradually weakened. By 17–19 June, the subtropical high weakened further and drifted southward; meanwhile the trough over the Azores was gradually filled up. The midlatitude westerly pushed southward along the African coastline and broke up the closed atmospheric circulation over West Africa and the coastal ocean. As a result, the dust outflow region was dominated by a strong African easterly jet (AEJ), which would favor the rapid transport of the accumulated dust from the African coast toward the Caribbean Basin.
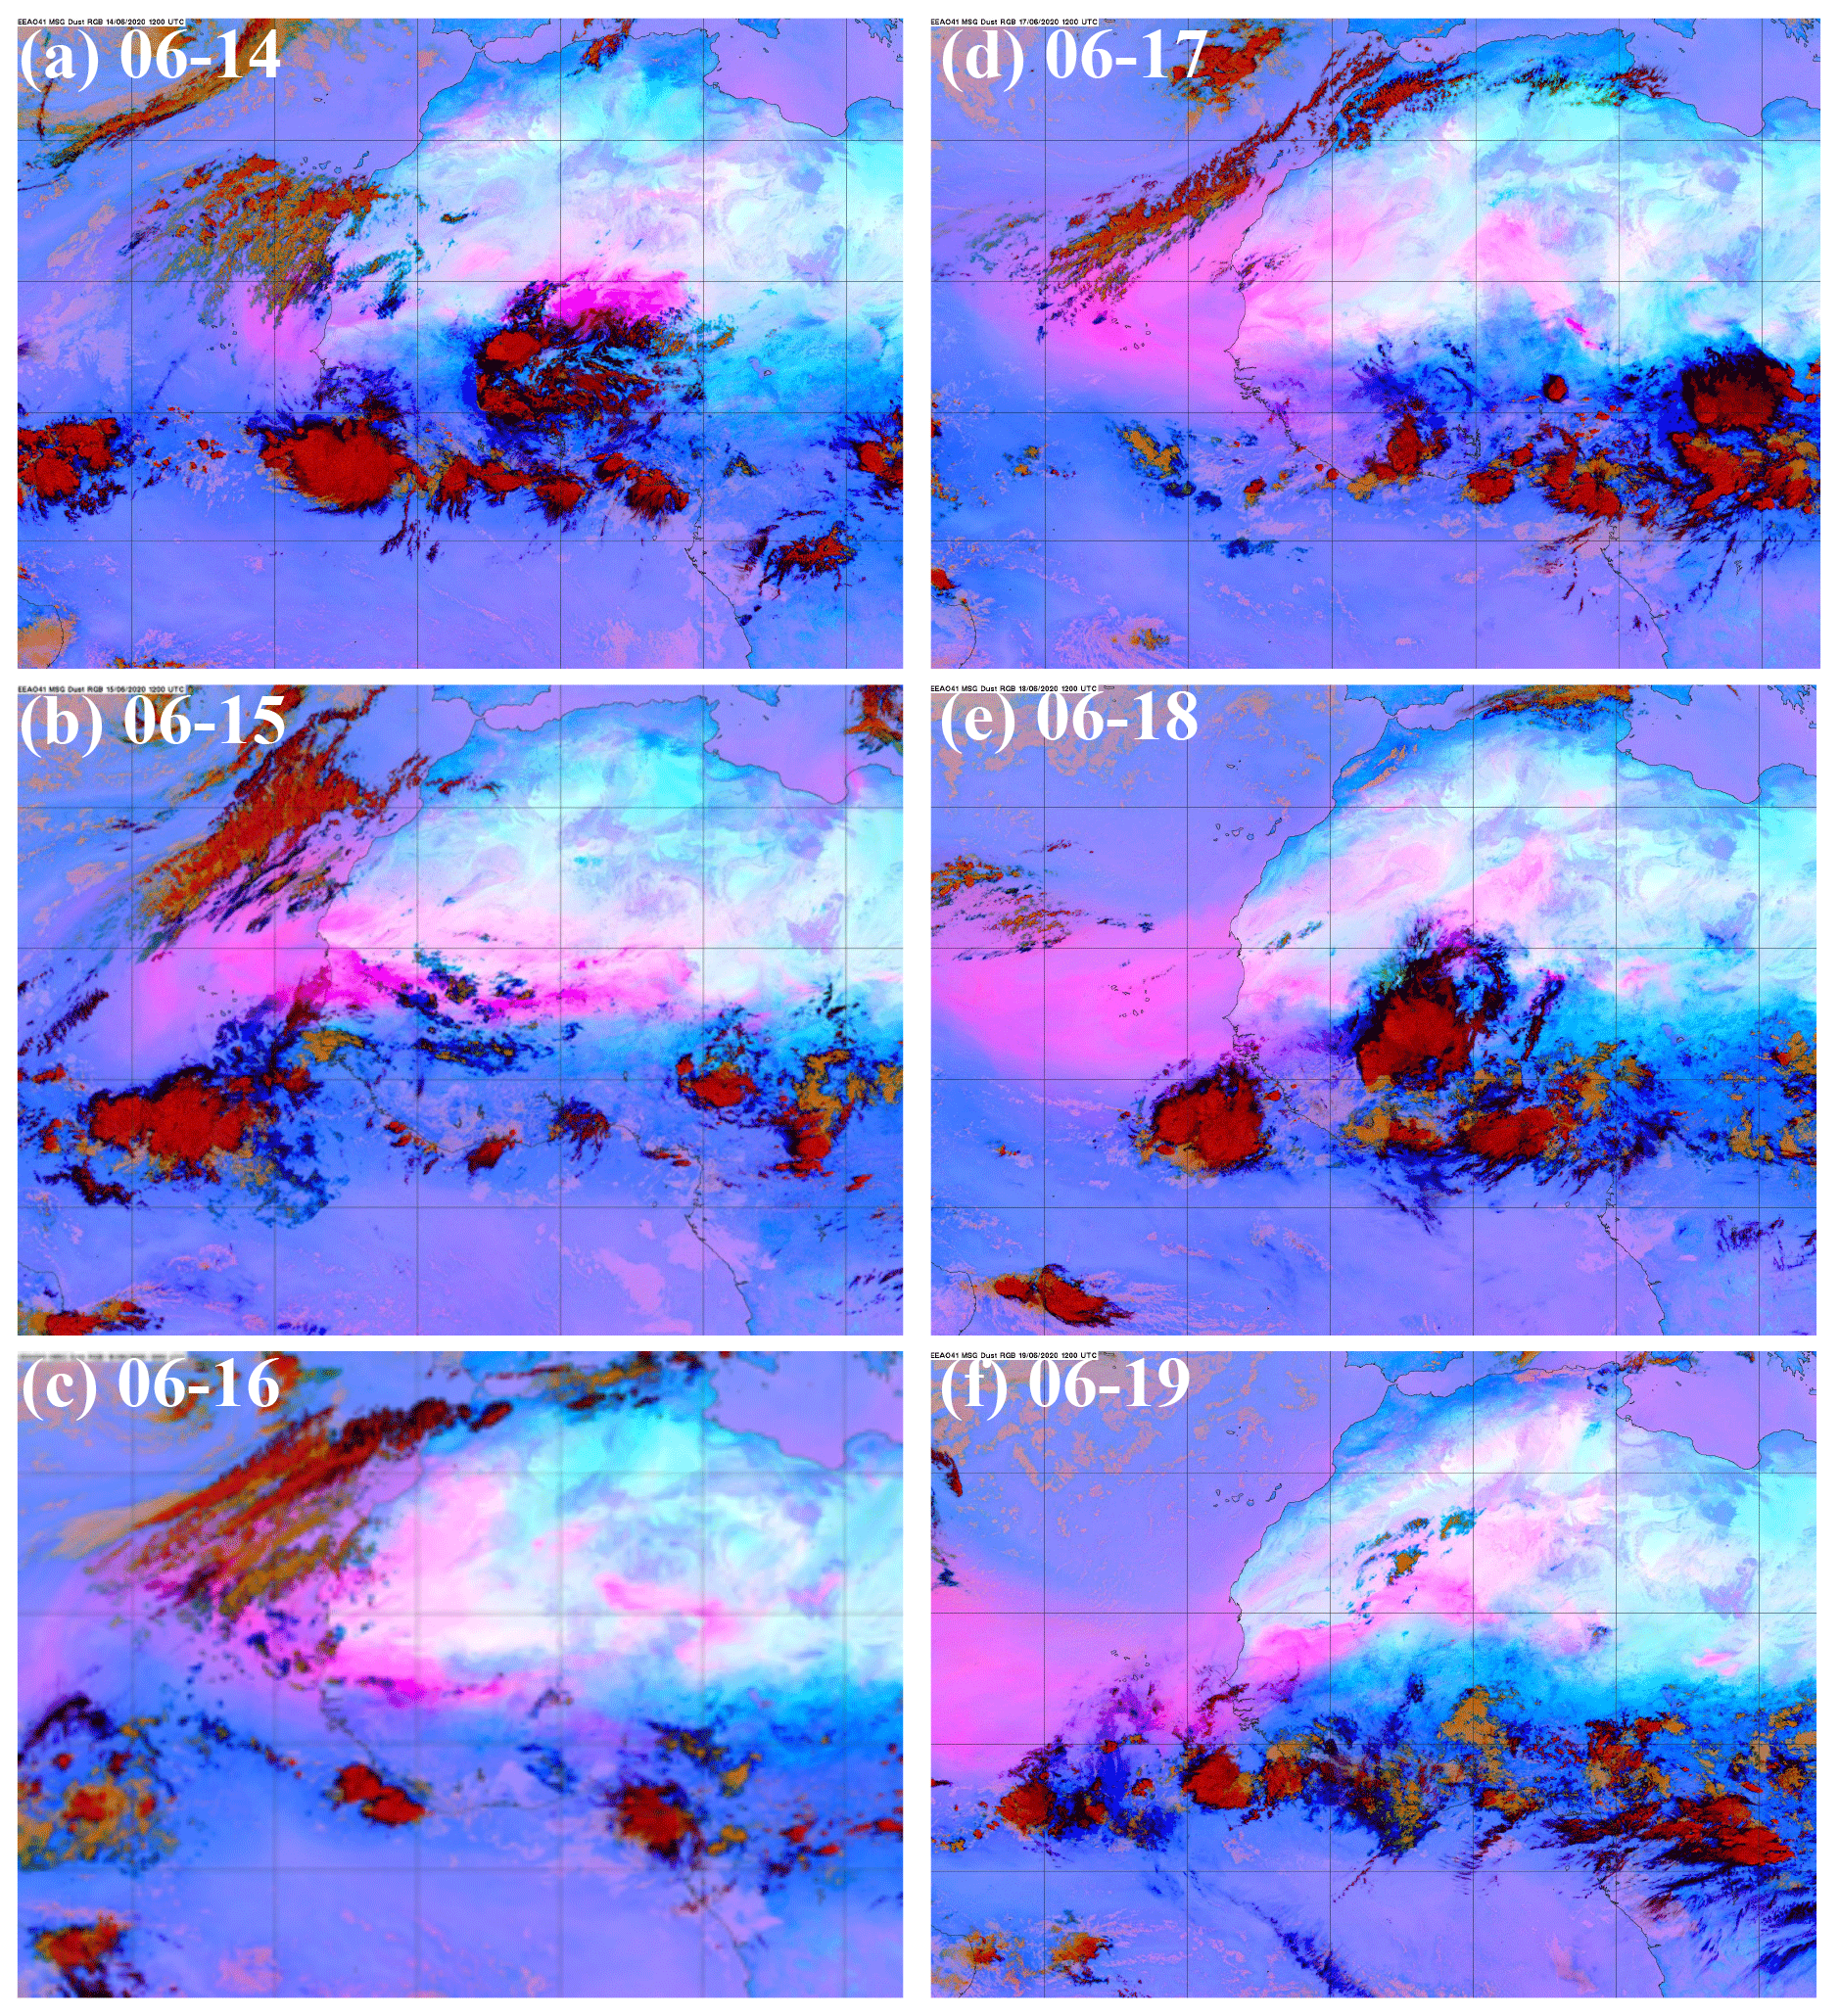
Figure 11Coastal accumulation and ventilation of dust plumes (magenta) from haboobs (associated with mesoscale convection systems, dark red) and other meteorological processes in West Africa as revealed by SEVIRI RGB dust images at 12:00 Z of (a) 06–14, (b) 06–15, (c) 06–16, (d) 06–17, (e) 06–18, and (f) 06–19. An animation of the SEVIRI images every 30 min covering 12–25 June (https://doi.org/10.5446/51548) clearly shows the evolution of haboobs and their radial outflow behavior, driven by outflows from convective downdrafts.
Satellite observations corroborate the above analysis of the potential control of the synoptic systems on distributing African dust. As shown earlier in Figs. 2 and 3, MODIS AOD started to build up on 13 June but a majority of the dust did not transport westward beyond 35∘ W until 18 June. The highest AOD near the coast occurred on 17 June. Moreover, the dust distribution modulated by the synoptic systems can be vividly displayed in an animation of SEVIRI full-disk RGB dust imageries once every 30 min over the 12–25 June period (https://doi.org/10.5446/51548, Tan et al., 2021). The animation clearly shows the evolution of haboobs and their radial outflow behavior, driven by outflows from convective downdrafts, which is not always evident in the still images. Here we show a sequence of SEVIRI still images (zoomed in North Africa) at 12:00 Z of 14–19 June 2020 to illustrate the day-to-day evolution of the dust plumes (Fig. 11). In these images, magenta, dark red, orange, and dull pink denote dust, deep clouds, middle clouds, and low clouds, respectively. On 14 June, SEVIRI detected two dust plumes (Fig. 11a). One plume originating from the southern Mauritania was dispersed over a small coastal area (22–16∘ W and 12–20∘ N). The other dust plume originated from a haboob developing over Niger due to strong downdrafts associated with a mesoscale convection system (dark red). The dust plume was situated north of the track of the convective system and was trailing the rapidly moving deep clouds because of the much weaker wind speed than in the convective core (refer to Fig. 10). The convective systems swept swiftly across West Africa and reached the coastal ocean by the early hours of 15 June. This formed an extensive dust belt between 15–22∘ N that extended from Niger to the coast of Mauritania, as shown in Fig. 11b. The haboob-generated dust mixed with that produced from West African deserts and stayed over coastal water (east to 30∘ W and 15–30∘ N). The extensive dust belt continued to proceed towards the ocean on 16 June, and more dust was accumulated into the coastal region (east to 40∘ W, Fig. 11c). These images clearly show that dust emerging from the continent accumulated over the coastal region for more than 3 d, yielding the heaviest dust plume on 17 June. Then this amplified dust plume was ventilated out of the coastal region by the easterlies on 18 and 19 June (Fig. 11e and f), leading to the historic intrusion of African dust into the Caribbean Basin and southern US. Note also that additional dust plumes from haboobs (18 June) and other West African sources (19 June) were added to the trans-Atlantic transport.
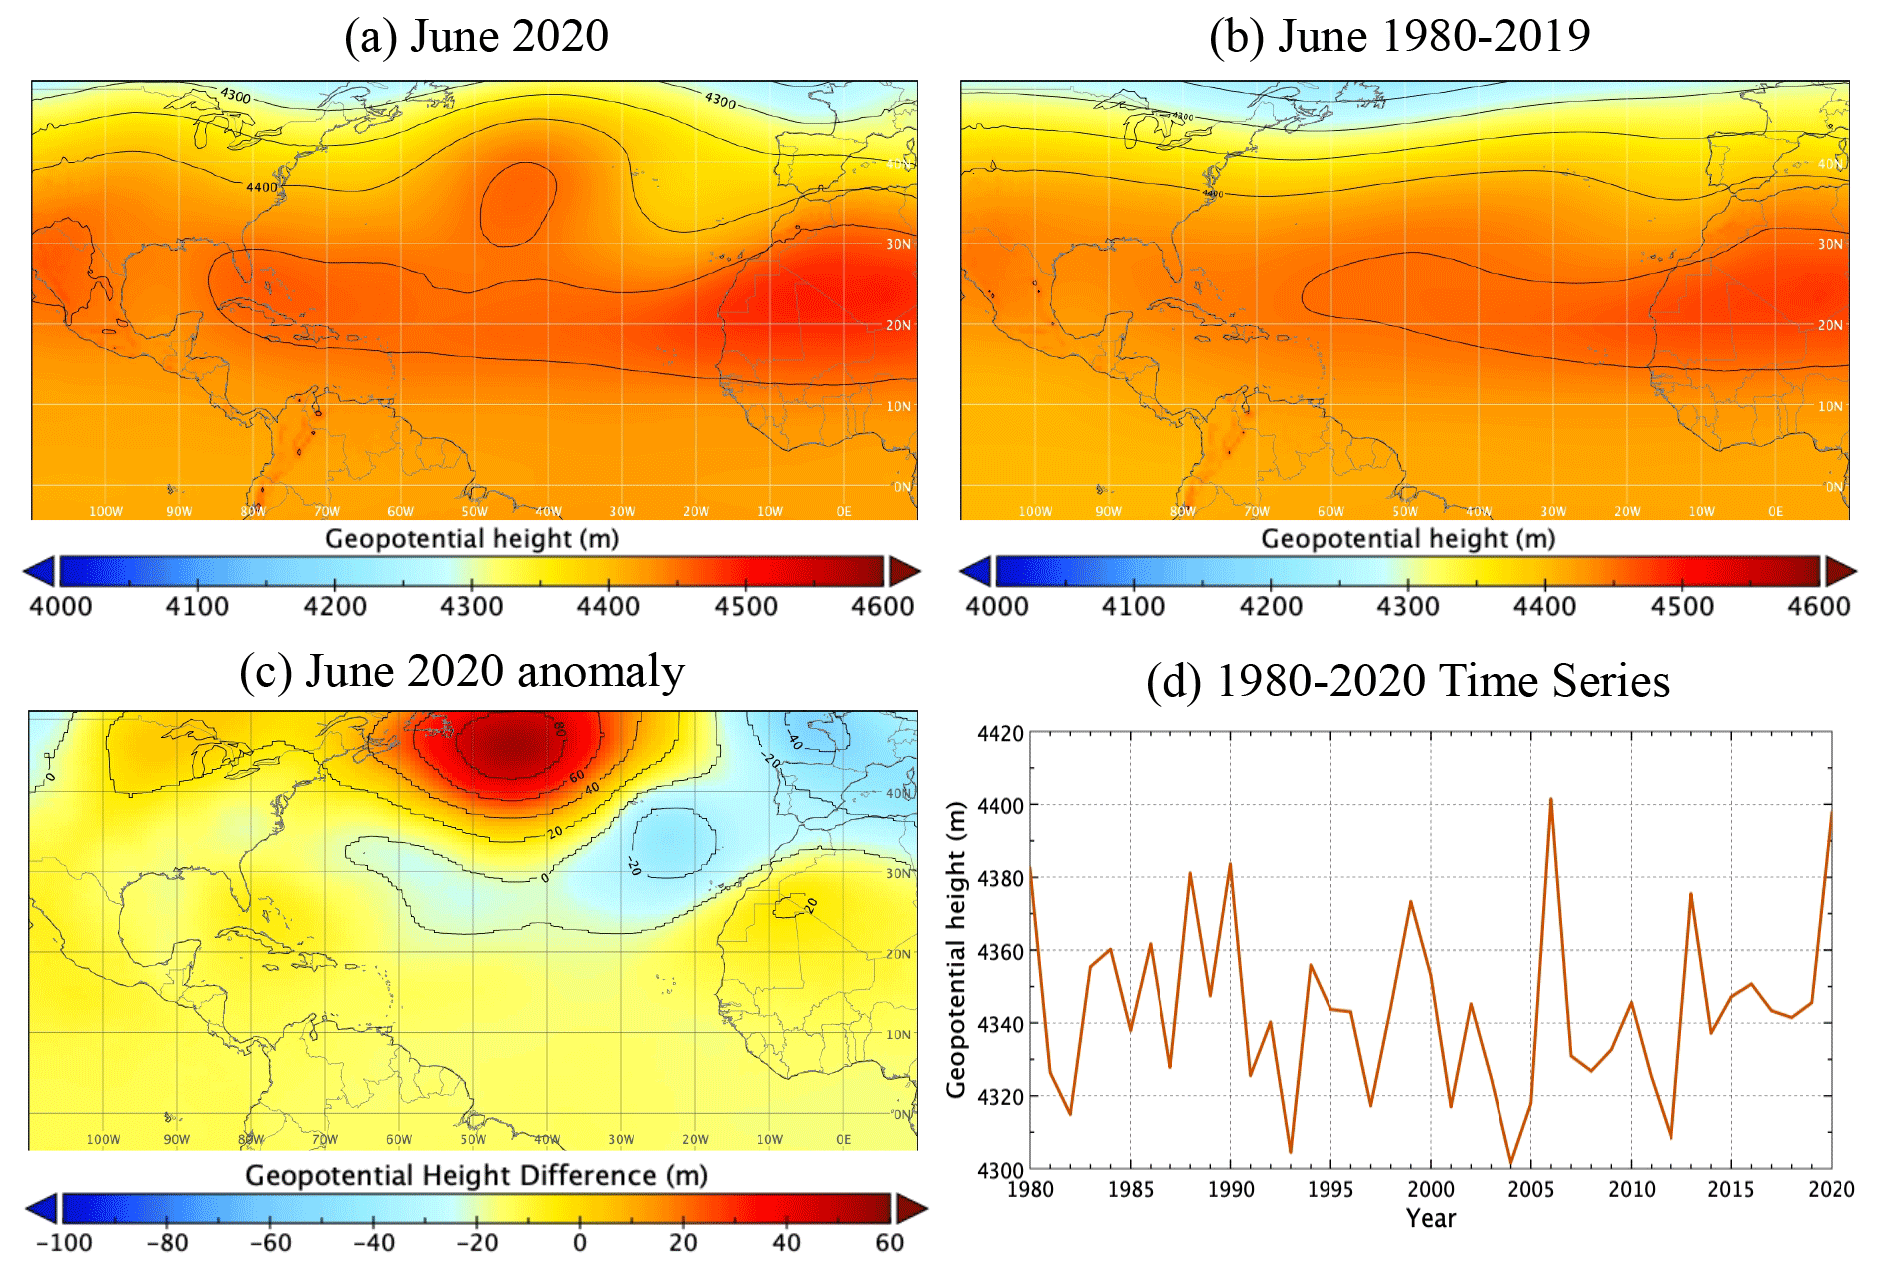
Figure 12MERRA-2 reanalysis geopotential height at 600 hPa: (a) June 2020, (b) June climatology (1980–2019), (c) June 2020 anomaly, and (d) 1980–2020 time series averaged over 35–50∘ N and 60–30∘ W.
The above analysis suggests that the strength and location of NASH plays an important role in modulating the trans-Atlantic dust transport during this historic dust intrusion event. It is intriguing to compare the June 2020 NASH with other years. Figure 12 compares the June geopotential height at 600 hPa between 2020 (Fig. 12a) and 1980–2019 climatology (Fig. 12b). Clearly, the NASH in June 2020 was stronger and located further north in comparison to the 40-year climatology. As shown in (Fig. 12c), the geopotential height in 2020 is more than 80 m higher than the climatology. South of this high anomaly is a low anomaly that extends from Bermuda to western Europe, with the lowest taking place off the coast of western Europe and the second lowest between the Azores and Canary Islands. Over West Africa, the geopotential height in 2020 is higher than the climatology by up to 20 m over northwestern Africa. Over the last 4 decades, the 2020 geopotential height over the high-anomaly center (35–50∘ N, 60–30∘ W) is the second highest, slightly lower than in 2006 (Fig. 12d). This analysis suggests that the subtropical high in June 2020 was highly anomalous in both the intensity and position. In comparison to the 40-year climatology, the high-pressure system over the tropical Atlantic Ocean extended further west to the Gulf of Mexico in 2020, which could have contributed to the historic intrusion of dust plume to the southern US (Pu and Jin, 2021) and the tropical eastern Atlantic Ocean.
3.2 GEOS model simulations of the dust intrusion event
In Sect. 3.1, we have characterized the evolution of the historic dust plume in three dimensions associated with synoptic systems and assessed its impact on air quality in the southern US by using a set of satellite and ground-based observations. Here we assess to what extent the GEOS model can reproduce the observed characteristics of this historic event. Similar to Fig. 9, we analyze GEOS AOD from 1 January 2000 to 30 June 2020 on a regional basis (see Fig. S3 in the Supplement). It shows that although the model characterizes the June 2020 event as a historic one over the North African coast (NAFC) and the southern Caribbean Basin (SCRB), the magnitude is more than a factor of 2 smaller than the MODIS AOD. Similar to the MODIS observations, the GEOS AOD over the desert (SAHD) during the event is not historically high. Unlike the MODIS observations, GEOS simulations of AOD over the other four regions are not the highest even after accounting for seasonal variations in dust and smoke transport. In the following, we further compare the GEOS simulations of three-dimensional aerosol distributions with MODIS and CALIOP observations over the dust source region and along the trans-Atlantic transport route.
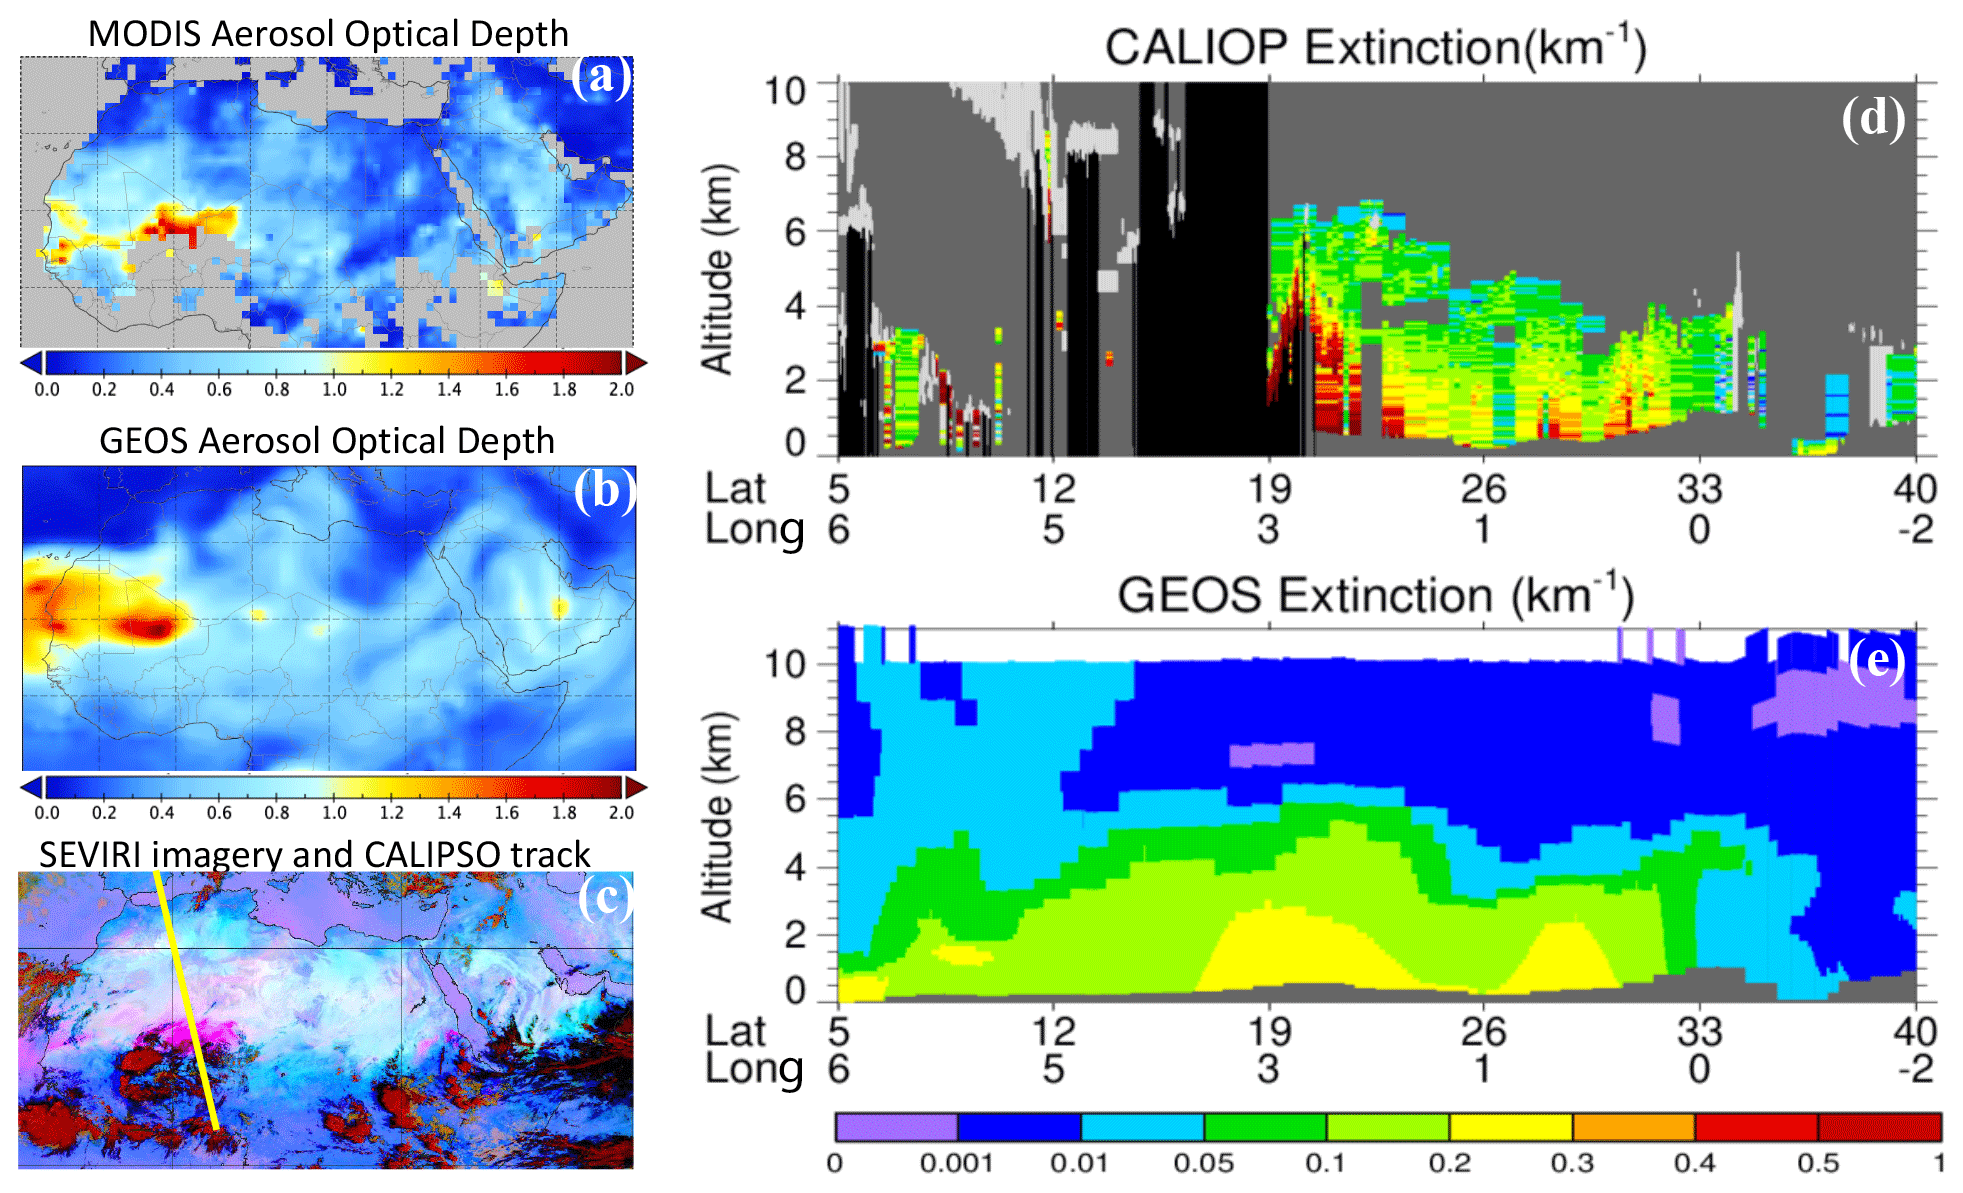
Figure 13Satellite and GEOS characterizations of dust over North Africa on 14 June 2020: (a) MODIS DB AOD at 550 nm, (b) GEOS AOD at 550 nm, (c) SEVIRI RGB image (with magenta and dark red denoting dust and mesoscale convective system, respectively) with CALIPSO track (yellow line), and altitude–latitude curtains of aerosol extinction coefficient (unit: km−1) from CALIOP at 532 nm (d) and GEOS at 550 nm (e). Hourly GEOS outputs close to the satellite overpassing time are used.
3.2.1 Dust source region
As discussed earlier and displayed in the SEVIRI animation, the major source of the Godzilla dust plume is associated with intense haboobs generated by a strong and fast-moving convective system over the southern Sahara from 13 to 15 June. How does the GEOS model perform in simulating haboobs associated with mesoscale convective systems? Figure 13 shows an example comparing the GEOS modeling with MODIS and CALIOP observations on 14 June. Clearly, GEOS (Fig. 13b) underestimates MODIS AOD (Fig. 13a) in Niger where the haboobs originated, although the GEOS AOD is higher than MODIS AOD near the coast. The GEOS-simulated dust plume also drifts northwards over Mauritania, in comparison to the MODIS observation. There was a CALIPSO track passing through the convective system and associated dust haboob at 13:14 Z (Fig. 13c). CALIPSO observation shows that the dust extinction within the haboob is nearly uniform from the surface up to about 4 km (Fig. 13d). In contrast, the GEOS model simulates the maximum aerosol extinction near the surface, which decreases by a factor of about 4 from the surface to 4 km altitude (Fig. 13e).
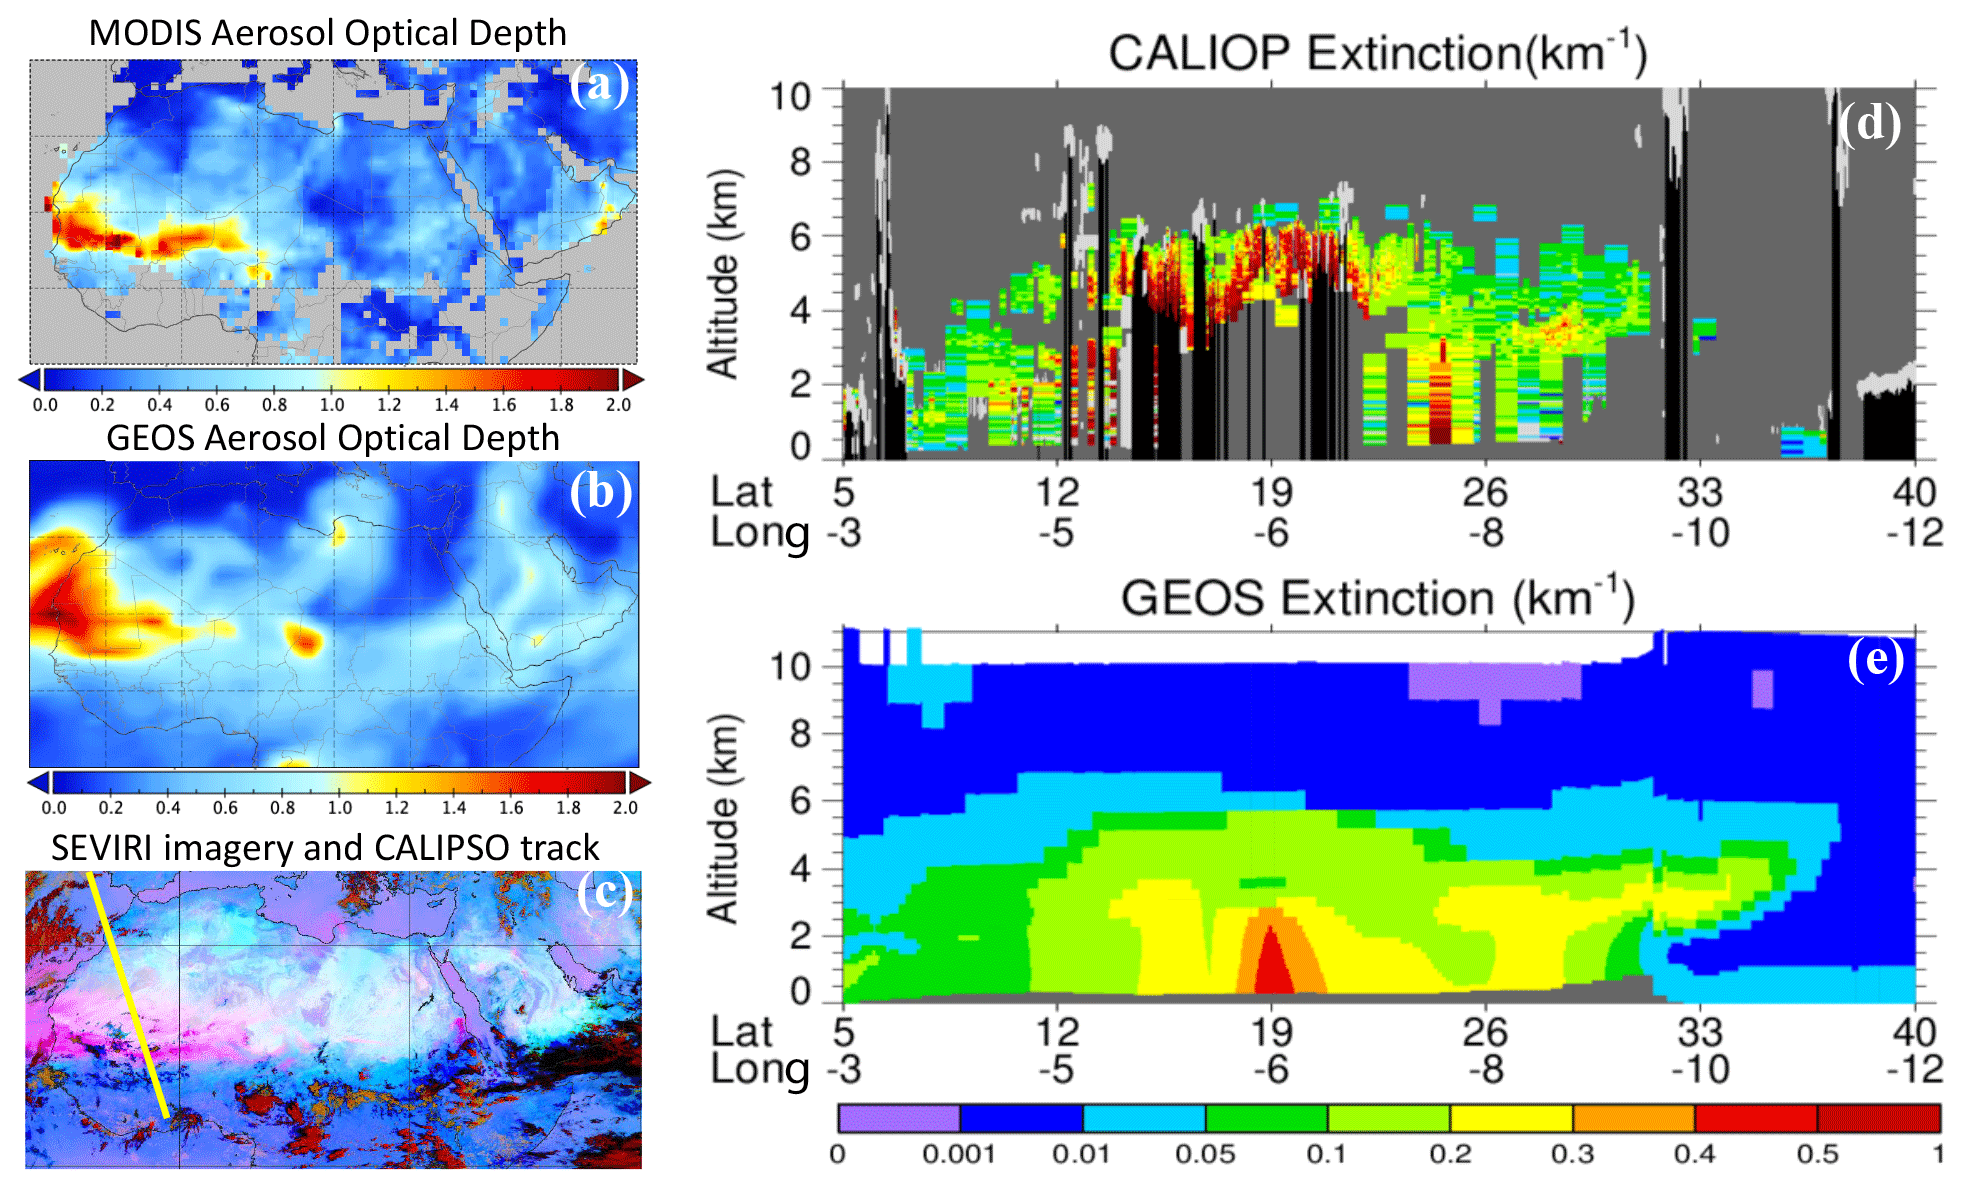
Figure 14Same as Fig. 13 except for 15 June 2020.
A similar comparison for the 15 June case was displayed in Fig. 14. On this day, the long-stretched dust plume extending from Niger to the African coast (Fig. 14a) was a remanent of the haboobs from the previous day. Again, the GEOS model underestimates the AOD and simulates a plume transported northwards by about 800 km over Mali (Fig. 14b), extending further north than the MODIS AOD observation. Although the top of the dust plume simulated by GEOS is largely consistent with the CALIOP observation, the vertical distribution of aerosol extinction within the plume is quite different. Although CALIOP reveals the elevated dust plume (either above clouds or totally attenuated features) with the highest extinction at the altitude of 4–6 km, the GEOS model displays a rapid decrease in aerosol extinction with increasing altitude.
Both comparisons confirm that the model with a horizontal resolution of 1∘ has a grand challenge to realistically simulate the mesoscale convection and haboobs. The model substantially underestimates dust loading over the desert, implying a very substantial underestimate of dust emissions. The model also drifts the dust plume northwards and fails to pump up dust from the surface to higher altitudes for ensuing long-range transport. These modeling deficiencies affect the simulation of trans-Atlantic dust transport as discussed in the next section.
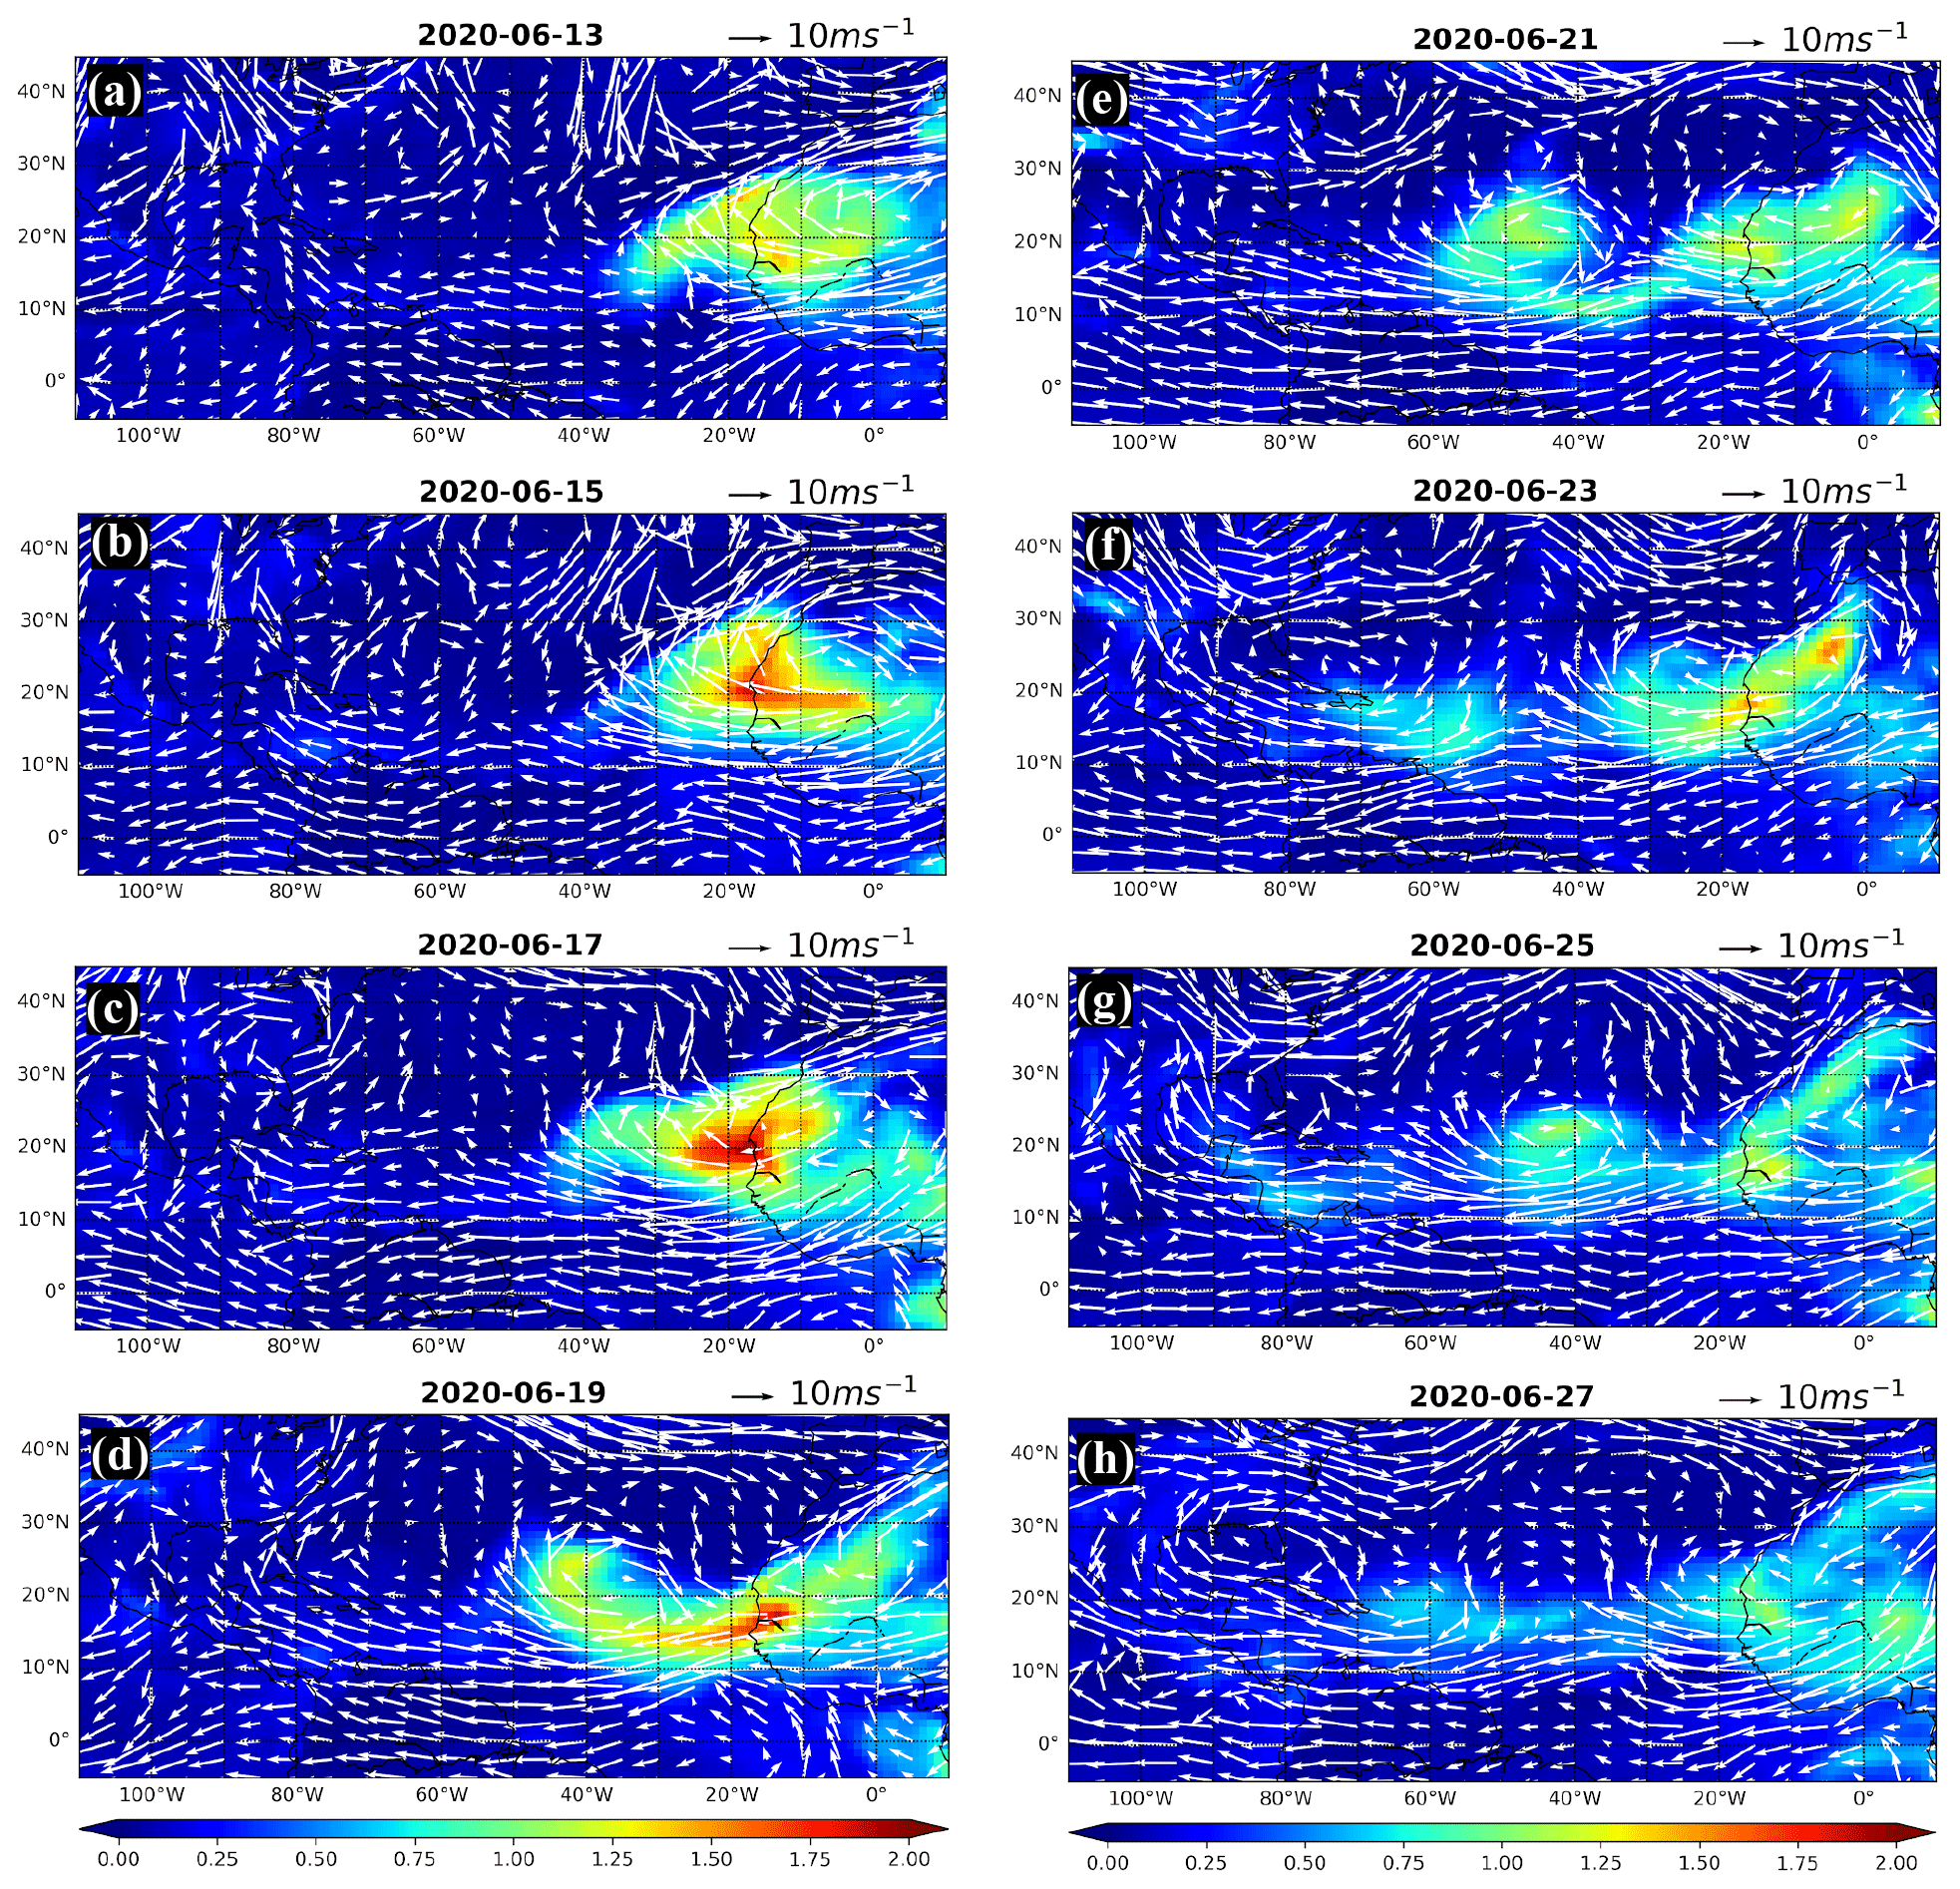
Figure 15GEOS-simulated evolution of trans-Atlantic AOD (color map) during the period of 13–27 June 2020. Overlaid on the AOD map are MERRA-2 wind vectors at an altitude of about 4 km.
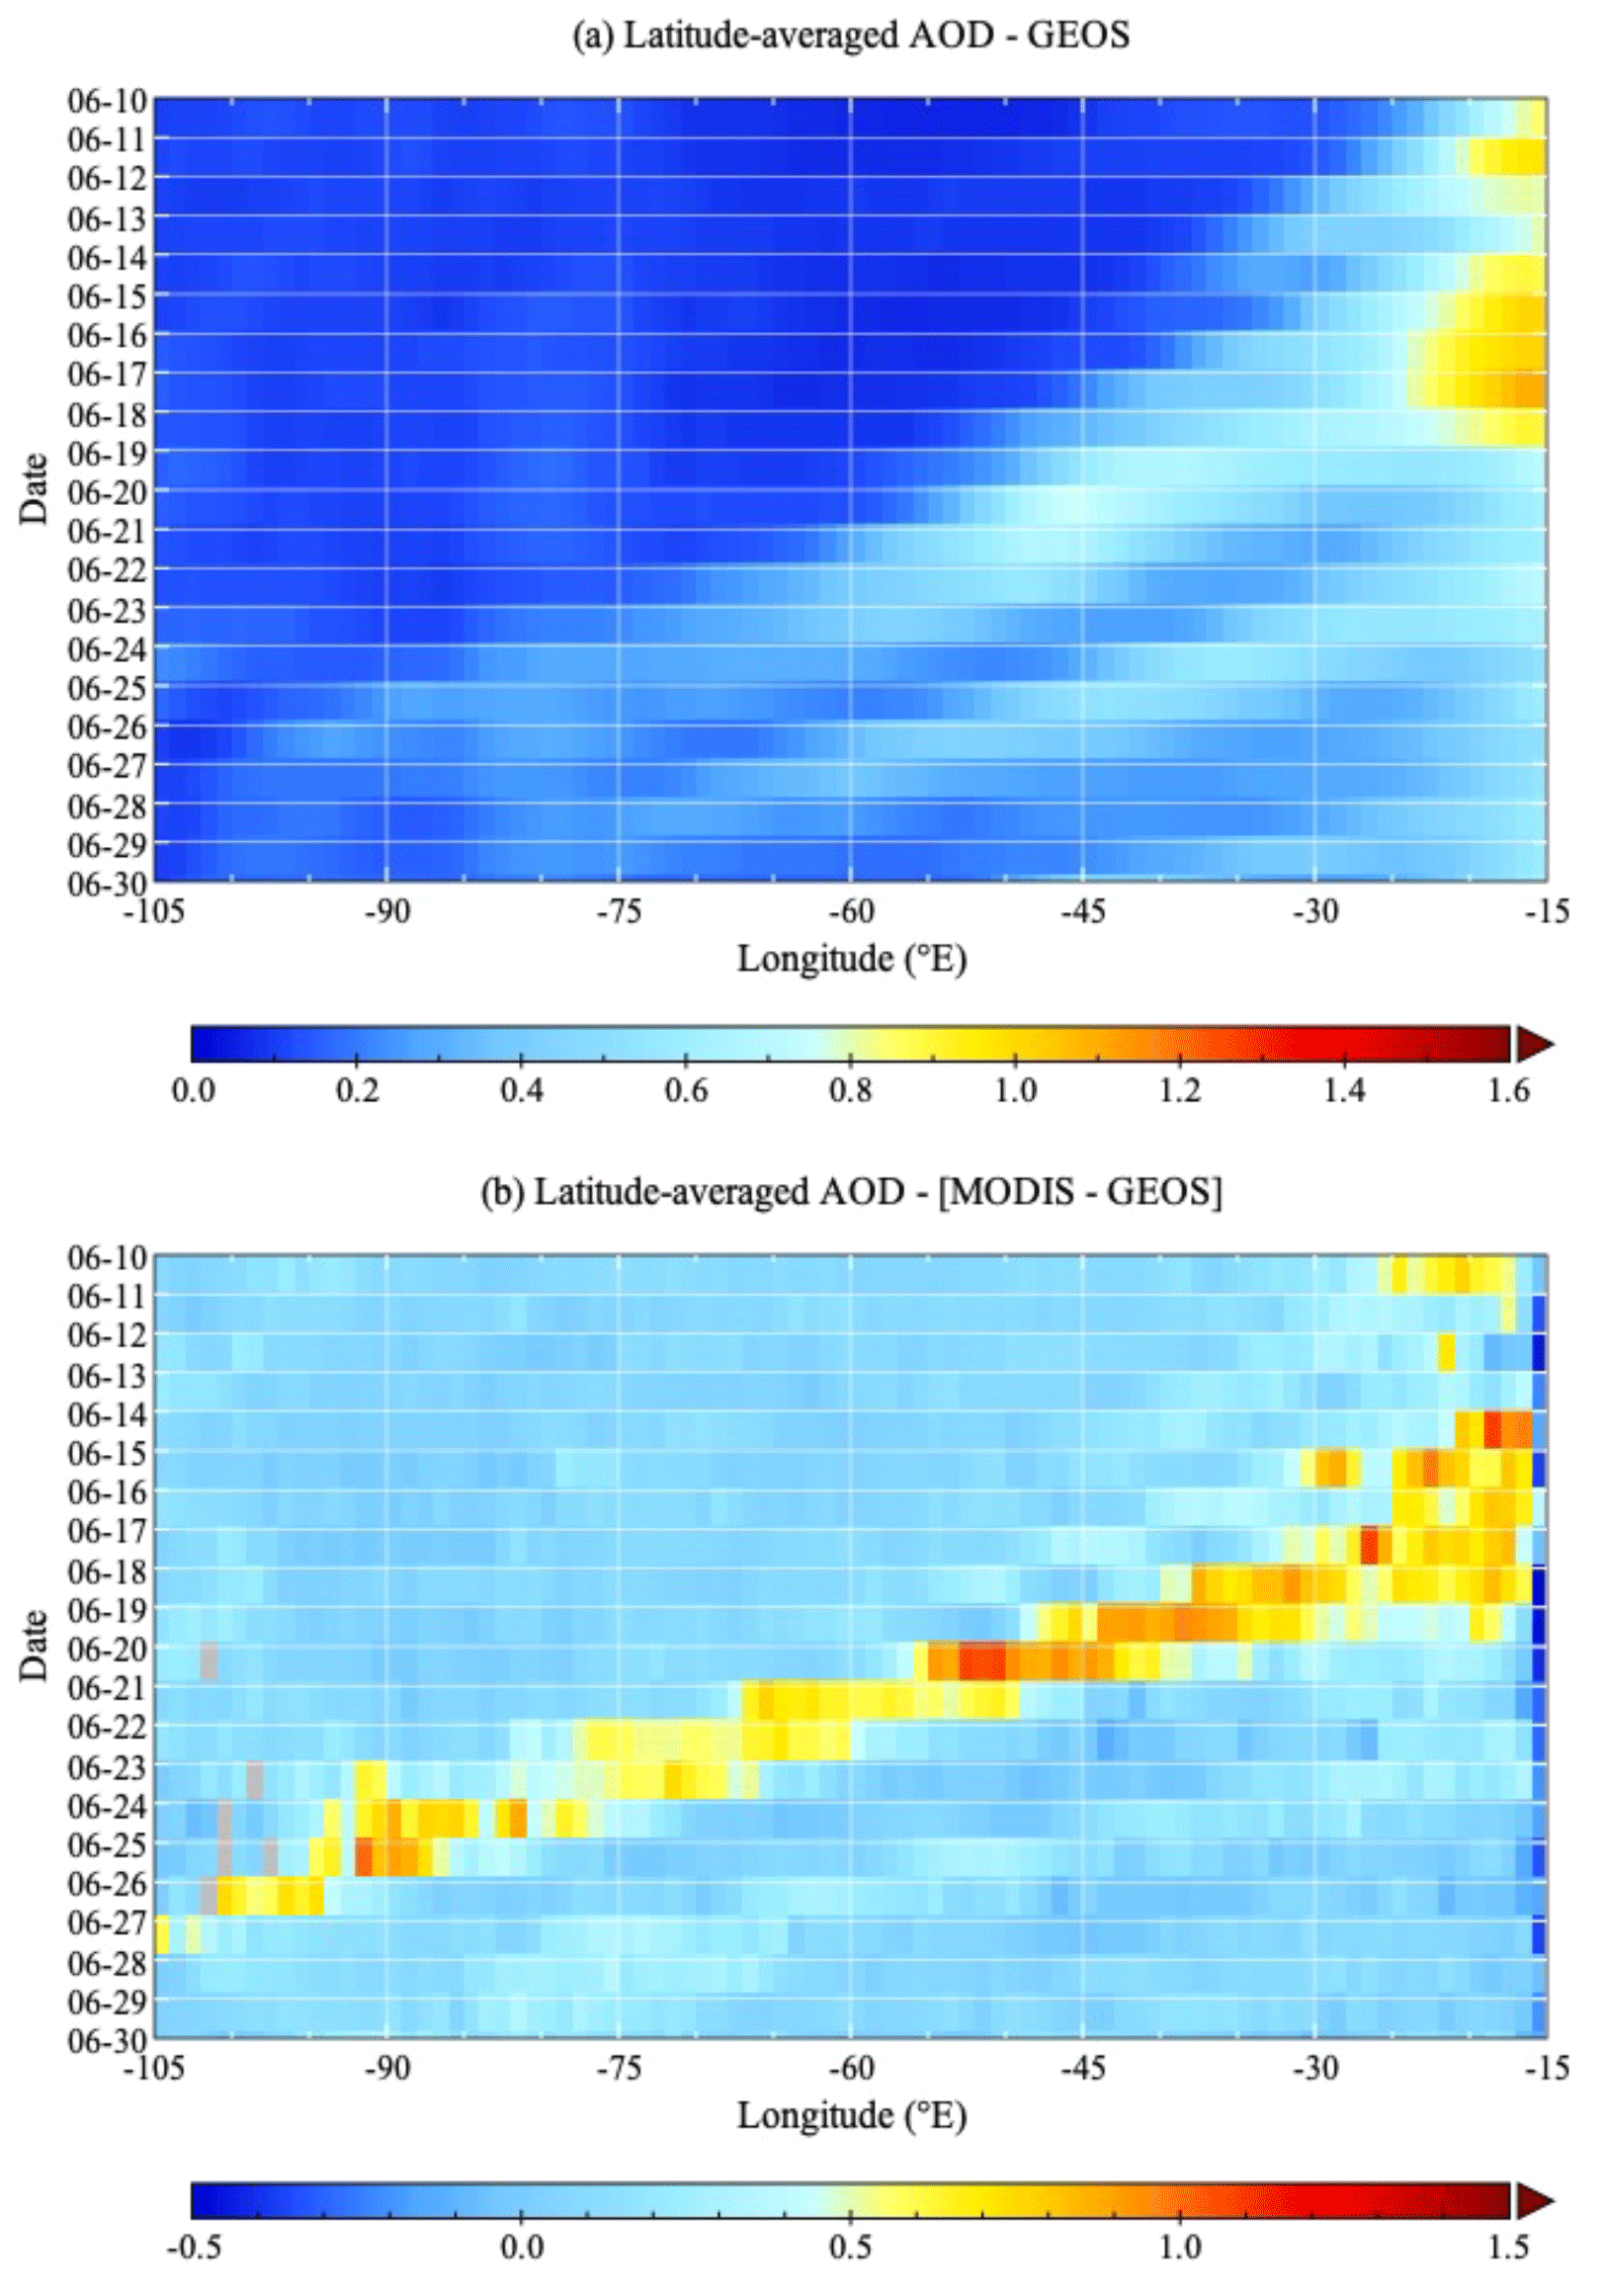
Figure 16Time–longitude Hovmöller diagrams for GEOS latitude-averaged (5–30∘ N) AOD (a) and the difference between MODIS and GEOS AOD (b).
3.2.2 Trans-Atlantic dust transport
Figure 15 shows GEOS simulation of the evolving dust plume during the period of 13–27 June 2020, similar to the MODIS characterization as shown in Fig. 2. A comparison of Figs. 15 and 2 shows that the model reproduces the MODIS observed track of meandering dust plume carried by the wind systems well, although the modeled plume center shifts northwards by about 2∘. However, the model substantially underestimates the MODIS-observed AOD, which becomes more pronounced with increasing transport distance. To further quantify the difference between GEOS and MODIS, we create the Hovmöller diagrams for GEOS AOD and AOD difference between MODIS and GEOS (MODIS − GEOS), as shown in Fig. 16. The GEOS AOD Hovmöller diagram clearly shows that the model reproduces the distinct trans-Atlantic dust plume tracks as observed by MODIS (Fig. 3). However, the GEOS substantially underestimated the MODIS observations. For the primary or Godzilla dust plume, the MODIS AOD is higher by up to 1 (corresponding to a factor of 2) near the African coast and by up to 0.6 (corresponding to a factor of 5) in the Caribbean Basin than the model simulation. The increasing MODIS and GEOS discrepancy with increasing transport distance suggests that the GEOS model removes the dust too efficiently from the atmosphere, consistent with previous findings (Yu et al., 2019; Kim et al., 2014). For the secondary dust plume with weaker intensity, the GEOS model performs better; generally, MODIS AOD is larger than GEOS AOD by a factor of no more than 2. A more complete view of MODIS and GEOS AOD evolution during the 10–30 June period is displayed in an animation (https://doi.org/10.5446/50830, Yu et al., 2021). Finally, the long-term GEOS model simulations do not show that the Godzilla dust plume is historic over the past 2 decades.
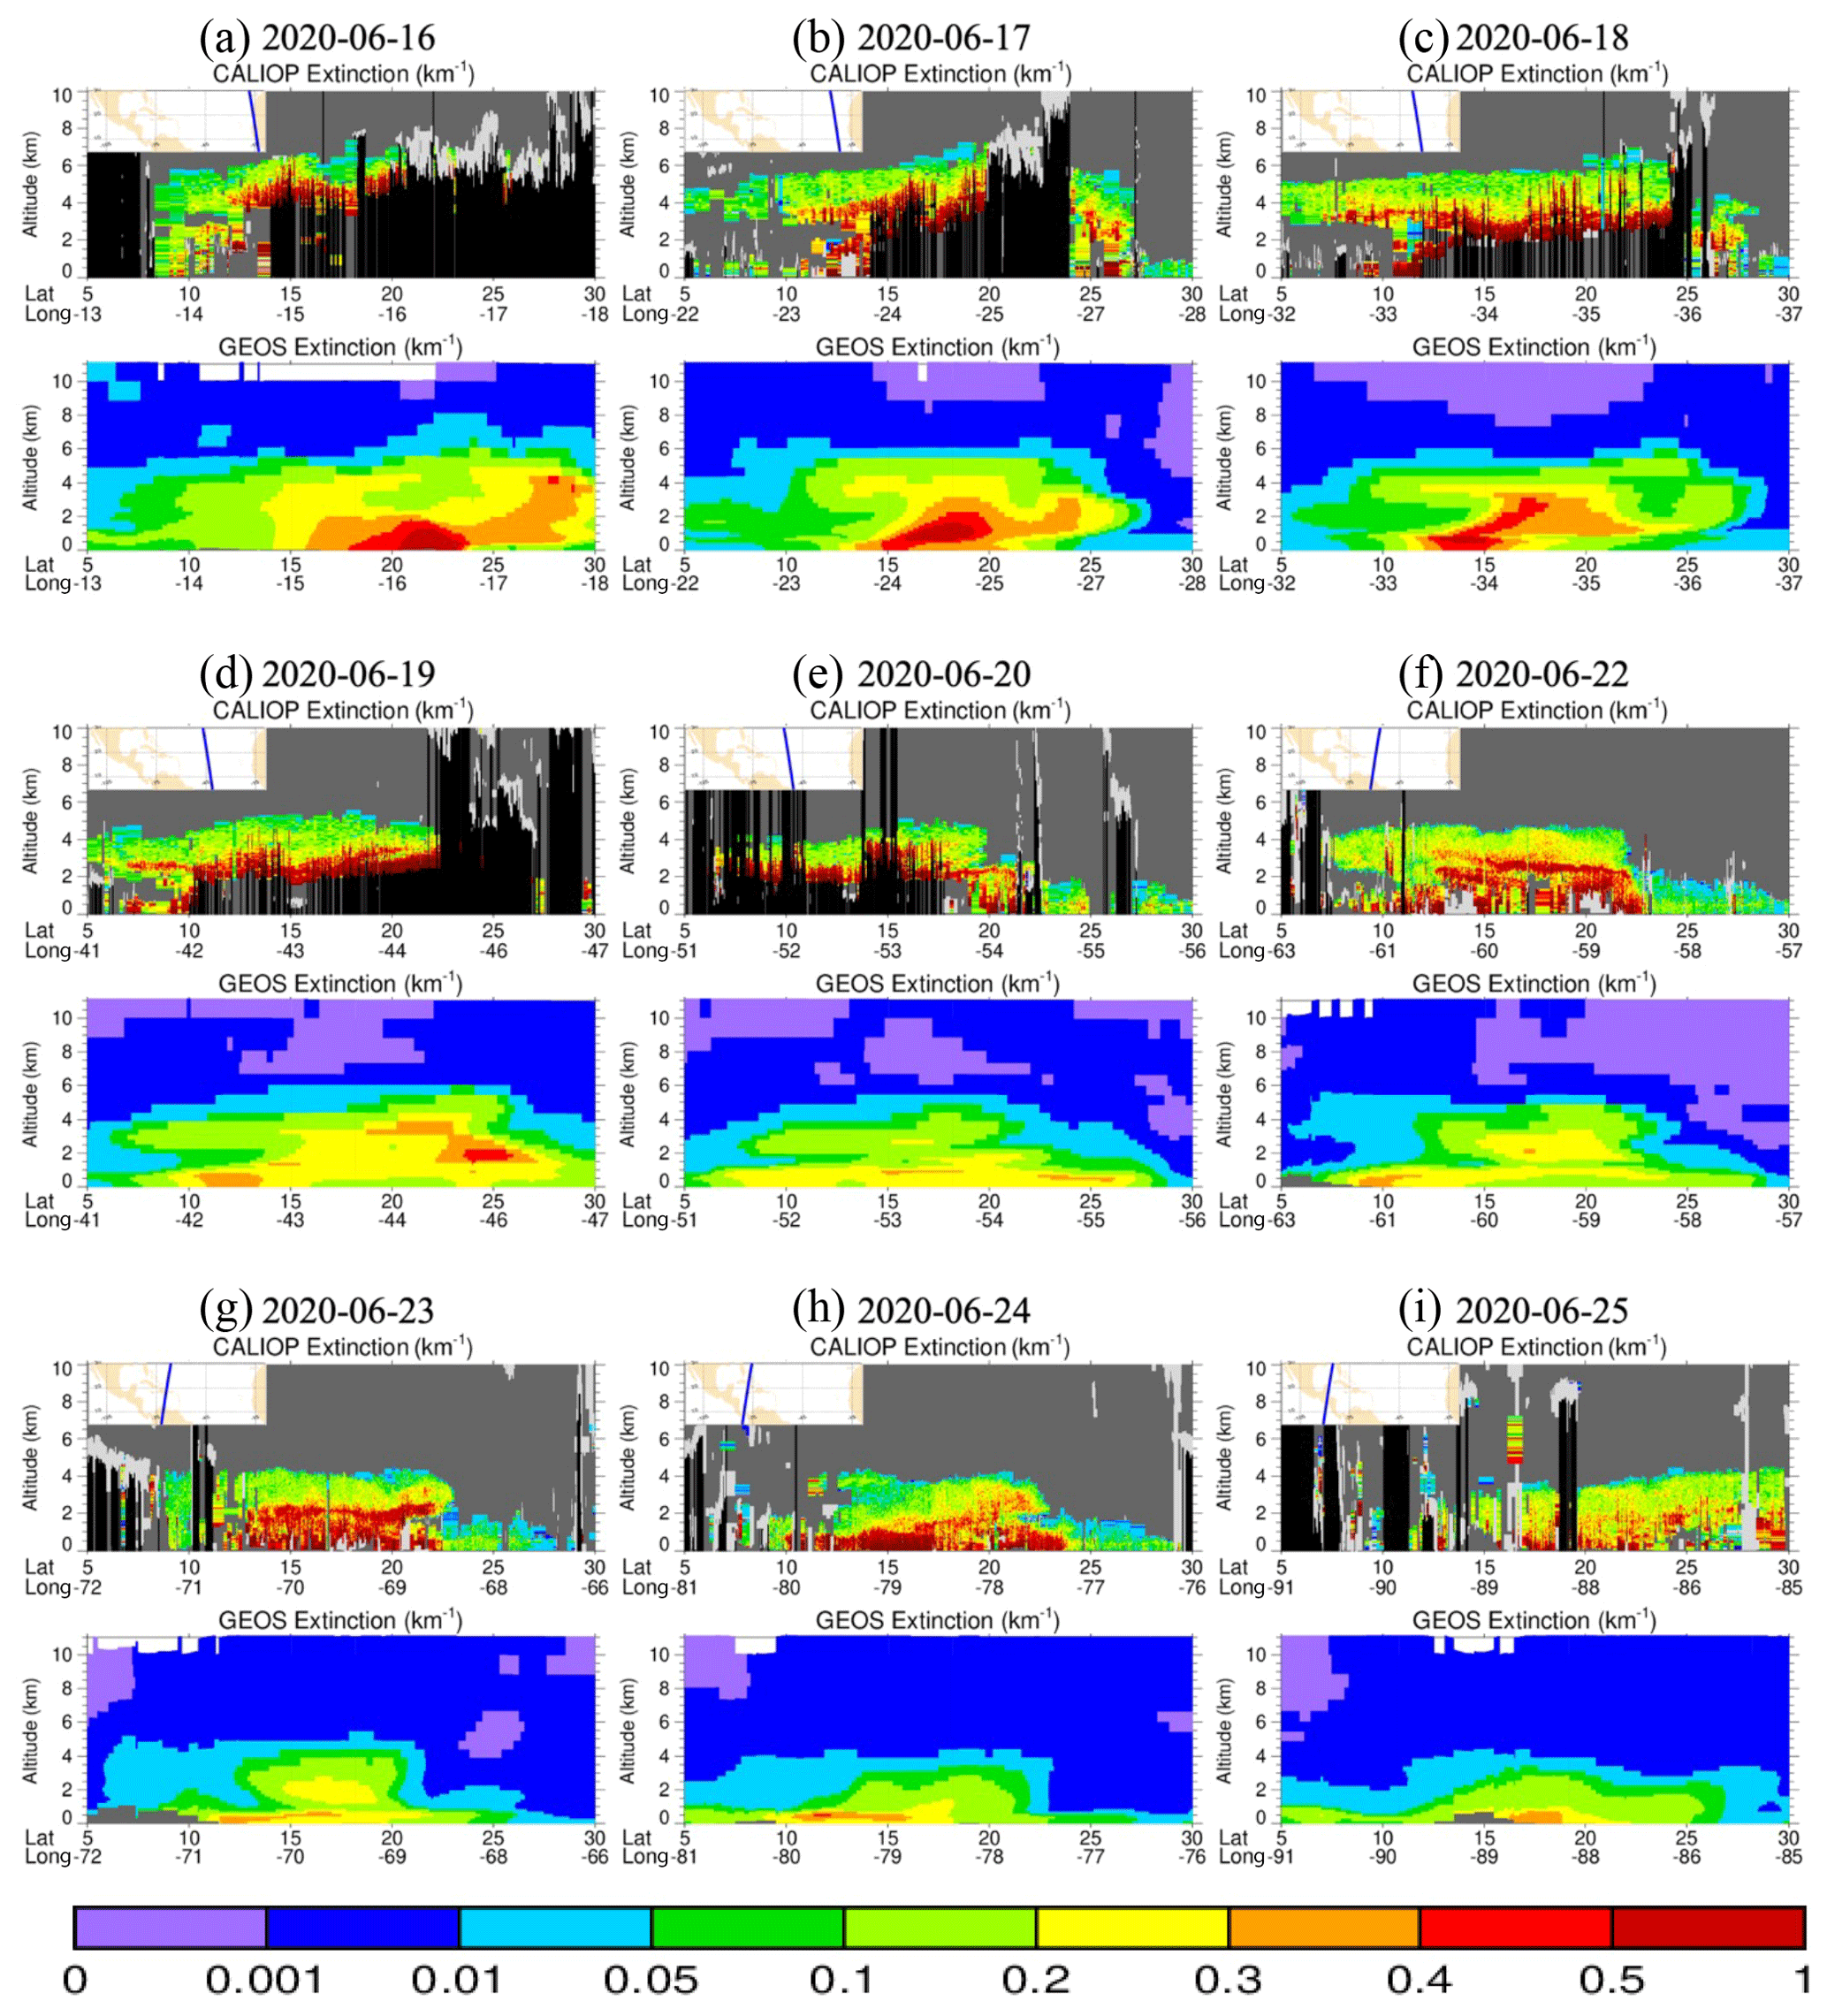
Figure 17Comparison of altitude–latitude–longitude curtain of aerosol extinction coefficient (km−1) between CALIOP (at 532 nm) and GEOS (at 550 nm) along the dust plume transit for 9 selected days. GEOS model outputs were sampled along the CALIPSO track shown as the blue line overlying the geographical map (see insets). For CALIOP curtains, the cloudy scene, clear–clean scene, and totally attenuated feature are marked as light gray, dark gray, and black, respectively.

Figure 18Latitude-averaged (5–30∘ N) aerosol extinction (km−1) profiles from CALIOP (black) and GEOS (red) (corresponding to CALIPSO tracks illustrated in Fig. 17), showing the evolution of vertical structure of the dust plume in the course of trans-Atlantic transport from the coast of North Africa (16 June) to the Gulf of Mexico (25 June). CALIOP AOD and GEOS AOD are also denoted in the plots (numbers in parentheses are AOD above the 500 m altitude). GEOS model outputs were excluded in the averaging when CALIOP detected clouds or the laser was totally attenuated (marked as light gray and black in Fig. 17, respectively).
The vertical structure of the “Godzilla” dust plume exhibits striking differences between GEOS and the CALIOP observations, as shown in Figs. 17 and 18. The nine CALIPSO curtains are selected along the track of the trans-Atlantic dust plume (Fig. 3). GEOS hourly outputs closer to CALIOP overpass time are extracted along the CALIPSO track. While the along-CALIPSO track curtain plots in Fig. 17 resolve the meridional and vertical distributions of the dust plume over the course of the trans-Atlantic transport, Fig. 18 contrasts the differences between GEOS and CALIOP by averaging over the meridional extent (5–30∘ N) of the dust plume. When calculating average profiles, GEOS hourly outputs are sampled based on CALIOP observations of aerosol and clear–clean features only (that means the cloudy and fully attenuated features are excluded in averaging). Figures 17 and 18 collectively show several major discrepancies between CALIOP and GEOS. The GEOS model does not reproduce CALIOP-observed fine dust plume structure, presumably because of the model's coarse vertical resolution. East to the middle ridge of the tropical Atlantic Ocean (16–20 June), CALIOP observed an elevated dust layer of 1–2 km thick in the mid-troposphere with an extinction coefficient of greater than 0.4 km−1 and a total attenuated layer just beneath the dust plume. This elevated dust plume descends continuously during the westward transport, with the peak aerosol extinction occurring at an altitude of 4 km near the coast (15∘ W) on 16 June to about 2 km on 20 June when entering the Caribbean at ∼ 55∘ W. This suggests that the dust plume travels westward at an average speed of 1000 km d−1 (∼ 11.6 m s−1) and descends at a rate of about 500 m d−1 (∼ 20 m h−1), which agrees well with the climatology of the extreme dust events (Kaufman et al., 2005; Huang et al., 2010). The GEOS model misses or substantially underestimates the elevated dust plume, although it generally agrees better with CALIOP at lower altitudes. During 22–25 June and in the west Atlantic Ocean and Caribbean Basin, the dust plume continues descending with distance, mixing with background marine aerosol in the boundary layer, and touches the surface. Compared to the tropical eastern Atlantic Ocean, the CALIOP–GEOS discrepancy becomes much larger in the lower atmosphere (Fig. 18). When integrating aerosol extinction in the vertical column, the CALIOP-to-GEOS AOD ratio increases from 1.43 near the coast (16 June) to 1.84 in the middle ridge (20 June) and 3.46 in the Gulf of Mexico (25 June), suggesting that the CALIOP–GEOS discrepancy increases with distance. This feature is consistent with that between MODIS and GEOS as revealed and discussed earlier (Fig. 16). The missing of the elevated dust layer by GEOS over the upwind ocean and desert regions contributes to the large discrepancies observed in the downwind regions as the dust plume descends. It is also possible that CALIOP-observed high values of aerosol extinction in the lowest ∼ 500 m layer may be prone to interference by surface signal and/or cloud contamination. When the lowest 500 m layer is excluded in the calculation of AOD, the CALIOP-to-GEOS AOD ratio ranges from 1.54 to 3.84, slightly larger than that for the whole column. Excluding the lowest 500 m layer does not reduce the discrepancy between CALIOP and GEOS.
We have used a set of remote sensing observations, including MODIS, CALIOP, SEVIRI, and AERONET, to characterize the three-dimensional evolution of the gigantic African dust intrusion into the Caribbean Basin and southern US in late June 2020 (13–27 June 2020). For this gigantic dust event the aerosol optical depth broke the MODIS record of the past 2 decades, with AOD of more than 3.5 at the African coast and 1.8 in the Caribbean Basin. The dust plume, originating from the convectively generated haboobs over sources in West Africa (mainly Niger, Mali, and Mauritania), was lifted from the desert surface to altitudes of up to 6–8 km, which is higher than the 5 km for the climatological summertime extreme dust events (Huang et al., 2010). Due to the persistence of a closed atmospheric circulation system over West Africa, the large but not extreme daily dust loading from the Sahara accumulated in the African coastal region (east to 35∘ W) for about 4 d. The average transport speed of the dust plume is 1000 km d−1, which agrees very well with the climatology of summertime extreme dust events (Kaufman et al., 2005; Huang et al., 2010). During trans-Atlantic transport, the top of the dust plume descended from 6–8 km over the West African coast to about 4 km altitude over the Caribbean Basin and 2 km over the US gulf coast. The descent of dust plume imposes important implications for air quality in the Caribbean Basin and the southern US. In Puerto Rico, the Godzilla dust plume caused a record-breaking PM10 concentration of 453 µg m−3. The dust intrusion into the southern US raised the PM2.5 concentration to a level exceeding the EPA air quality standard in about 20 % and 40 % of the EPA stations in nine southern states on 26 and 27 June, respectively. The poorest air quality with PM2.5 as high as 74 µg m−3 occurred in the Florida panhandle region and western Texas.
The analysis of MERRA-2 meteorology suggests that the unfavorable ventilation conditions and the resultant dust accumulation along the African coast in the early stage of the dust storm were associated with the anomalous strength and northward shift of the North Atlantic subtropical high (NASH) that was accompanied by the low-pressure system over the Azores and the high-pressure system over West Africa. In fact, June 2020 had the second strongest NASH over the past 4 decades, only slightly weaker than the 2006 record. When the NASH became weaker and wandered back south, the dust outflow region was dominated by the African easterly jet (AEJ), which carried the accumulated dust plume rapidly, and maintaining its high concentrations from the coastal region toward the Caribbean Basin, within 4 d, resulting in the extraordinary dust loading observed. Our results do not fully agree with what previous studies found on the atmospheric drivers of the dust storm. For example, Francis et al. (2020) argued that the development of a subtropical high off the coast of West Africa generated anomalously strong northeasterlies over the Sahara (19–30∘ N, 20–0∘ W) that caused continuous dust emissions over 4 d and high dust loading in the eastern tropical Atlantic Ocean. Pu and Jin (2021) also found increased surface wind speed over West Africa 2 weeks prior to the event. But the increased wind speed along with a small reduction of vegetation cover only contributed to no more than half of the observed aerosol variances (Pu and Jin, 2021). Our analysis of the SEVIRI dust images showed that intense haboobs swept through the Niger–Mali–Mauritania corridor (south of 20∘ N generally) and contributed significantly to the dust event. The dust emissions associated with these haboobs cannot be adequately explained by the large-scale meteorology used in Francis et al. (2020), because the reanalysis cannot capture such strong winds accurately (Cowie et al., 2015; Roberts et al., 2017) and their focused dust source region is largely outside the corridor of the intense haboobs identified in the SEVIRI images. We also found that the unique synoptic setting associated with anomalous NASH strength and position created the closed atmospheric circulations over West Africa and its adjacent coastal ocean for several days, which trapped the continuously emitted dust in the African coast. In addition, Francis et al. (2020) and Pu and Jin (2021) found that the AEJ was much strengthened by the anticyclonic circulation associated with the anomalous sub-tropical high, which favored a rapid westward transport of dust toward the Americas. However, our estimated trans-Atlantic transport speed of 1000 km d−1 is more or less the same as the speed for the summertime dust events during 2003–2007 (Huang et al., 2010), suggesting that the strong AEJ in June 2020 was unlikely to be a major factor for the highest-on-record dust detected in the Caribbean Basin.
In comparison to satellite observations, the GEOS model substantially underestimated dust loading over the desert, which was strongly related to emissions from haboobs. The model also did not lift up enough dust to the middle troposphere for ensuing long-range transport. These deficiencies likely resulted from unrealistic representations of moist convection, haboobs, and the vertical transport of dust in the model, possibly related to the model's coarse horizontal and vertical resolutions. As a result, the model largely failed to capture the satellite-observed elevated dust plume along the cross-ocean track and underestimated the dust intrusion into the Caribbean Basin and the Americas by a factor of 4 or more for AOD. Nevertheless, the model reproduced the plume track reasonably well on a daily basis, suggesting that large-scale meteorological fields that drove the aerosol transport modeling are accurate. Assimilating satellite observations of aerosol optical depth into the model can significantly improve the model's prediction of column aerosol loading (Randles et al., 2017; Buchard et al., 2017). Given the substantial differences in the aerosol vertical distribution between GEOS and CALIOP, however, if the assimilation only normalizes the modeled vertical distribution by the column AOD, the assimilation will continue to put too much of the dust in the lower layers. This may continue to artificially enhance the dust deposition along the transport path and introduce high bias in the surface dust concentration, which is of concern for air quality applications. Modeling improvement needs to focus on developing more realistic representations of moist convections, haboobs, and the vertical transport of dust (e.g., Roberts et al., 2018).
This work has focused on characterizing the evolution of atmospheric loading or optical depth of the trans-Atlantic dust plume. Such intense dust events also provide a great opportunity to follow the full life cycle of dust plumes and investigate changes of dust particle properties along the trans-Atlantic transit. A follow-on study is made available by routine and large-scale satellite measurements of particle size and shape properties, such as the depolarization ratio and color ratio from CALIOP, Ångström exponent and fine-mode fraction from MODIS, and non-spherical fraction from Multi-angle Imaging SpectroRadiometer (MISR). For intense events, tracking the dust plume is more feasible, and satellite observations of dust properties tend to have higher accuracy. The altitude-resolved observations from lidar are particularly useful because the data allow us to follow dust plumes in the free atmosphere where the interference of marine aerosol is minimized. Such studies should also benefit from the adoption of more advanced technology and hence improved particle property retrievals in future satellite missions.
This work demonstrates that haboobs and convective systems over Africa have the ability to impact conditions far downstream. It is vital that models possess a capability of simulating convective outflows driving dust uplift, followed by accurately redistributing this emitted dust vertically throughout the Saharan boundary layer up to ∼ 6–8 km as the haboobs decay. This study shows that if models are not able to represent dust up to the high observed altitudes over source regions, the resulting long-range transport will be incorrect. O'Sullivan et al. (2020) recently found that modeled summertime dust in the tropical eastern Atlantic region was too low in the atmosphere compared to in situ aircraft observations and that part of the problem was that the coarser dust particles were both not lifted to high enough altitudes and also settled out of the atmosphere too rapidly. It is clear that in order to improve dust models' ability to represent dust transport, efforts are needed to improve the representation of processes controlling dust uplift (such as haboobs), dust redistribution through the Saharan boundary layer, and processes controlling their emission, transport, and deposition, as a function of size. It is vital that future evaluations incorporate observations of vertical distribution of dust in order to fully understand and evaluate dust models. There is a clear need to acquire routine observations of aerosol vertical distribution at a temporal resolution finer than CALIPSO (e.g., hourly) after the decommission of the CALIPSO satellite.
All datasets of aerosol and meteorology were obtained from a variety of sources with public access: the MODIS aerosol data were obtained from the NASA Level-1 and Atmosphere Archive and Distribution System (LAADS) web page (https://doi.org/10.5067/MODIS/MYD04_L2.006, Levy et al., 2015). The CALIOP aerosol products were obtained from the NASA Langley Research Center Atmospheric Science Data Center (https://doi.org/10.5067/CALIOP/CALIPSO/CAL_LID_L2_05kmAPro-Standard-V4-21, NASA/LARC/SD/ASDC, 2018). SEVIRI RGB images were produced by Yaswant Pradhan of the Met Office and are provided in the Supplement. EPA PM2.5 and PM10 data were downloaded from https://www.epa.gov/airdata (US Environmental Protection Agency, 2020). MERRA-2 data are available at MDISC, managed by the NASA Goddard Earth Sciences (GES) Data and Information Services Center (DISC). The AERONET data were downloaded from https://aeronet.gsfc.nasa.gov/cgi-bin/webtool_aod_v3 (Giles et al., 2019).
The animation of Tan et al. (2021, https://doi.org/10.5446/51548) was created with SEVIRI full-disk RGB dust images once every 30 min over the 12–25 June period to illustrate how outflows from convective downdrafts drive the evolution of haboobs and their radial outflow behavior.
The animation of Yu et al. (2021, https://doi.org/10.5446/50830) compares MODIS retrievals (top) and GEOS simulations (bottom) of aerosol optical depth during the 10–30 June 2020 period.
The supplement related to this article is available online at: https://doi.org/10.5194/acp-21-12359-2021-supplement.
HY and MC conceived the study. HY, QT, LZ, QS, YS, and DK analyzed satellite and surface observations as well as model outputs. YZ and RCL produced the MODIS enhanced dust retrievals for the event. HB performed the GEOS simulations. YP and CLR provided SEVIRI dust imagery. All co-authors participated in discussion of the analysis. The paper was written by HY and commented on and revised by all co-authors.
The authors declare that they have no conflict of interest.
Publisher's note: Copernicus Publications remains neutral with regard to jurisdictional claims in published maps and institutional affiliations.
This work was supported by the National Aeronautics and Space Administration (NASA) Radiation Sciences Program and the CALIPSO/CloudSat mission administered by Hal Maring and David Considine, respectively. Olga Mayol-Bracero acknowledges support from NASA ROSES no. 80NSSC19K0194. We thank the NASA Center for Climate Simulation for their support of the GEOS model simulation. The AERONET project at NASA GSFC is supported by the Earth Observing System Project Science Office cal–val, Radiation Sciences Program at NASA headquarters, and various field campaigns. We are grateful to two reviewers for their insightful comments and helpful discussions.
This research has been supported by the National Aeronautics and Space Administration, Earth Sciences Division (The Science of Terra, Aqua, and SNPP; CALIPSO/CloudSat Science Team).
This paper was edited by Joshua Fu and reviewed by two anonymous referees.
Ashpole, I. and Washington, R.: An automated dust detection using SEVIRI: A multi-year climatology of summertime dustiness in the central and western Sahara, J. Geophys. Res., 117, D08202, https://doi.org/10.1029/2011JD016845, 2012.
Bian, H., Chin, M., Hauglustaine, D. A., Schulz, M., Myhre, G., Bauer, S. E., Lund, M. T., Karydis, V. A., Kucsera, T. L., Pan, X., Pozzer, A., Skeie, R. B., Steenrod, S. D., Sudo, K., Tsigaridis, K., Tsimpidi, A. P., and Tsyro, S. G.: Investigation of global particulate nitrate from the AeroCom phase III experiment, Atmos. Chem. Phys., 17, 12911–12940, https://doi.org/10.5194/acp-17-12911-2017, 2017.
Brindley, H. E., Knippertz, P., Ryder, C., and Ashpole, I.: A critical evaluation of the ability of the Spinning Enhanced Visible and InfraRed Imager (SEVIRI) thermal infrared red-green-blue rendering to identify dust events: Theoretical analysis, J. Geophys. Res., 117, D07201, https://doi.org/10.1029/2011JD017326, 2012.
Buchard, V., Randles, C. A., da Silva, A. M., Darmenov, A., Colarco, P. R., Govindaraju, R., Ferrare, R., Hair, J., Beyersdorf, A. J., Ziemba, L. D., and Yu, H.: The MERRA-2 aerosol reanalysis, 1980 onward. Part II: Evaluation and case studies, J. Climate, 30, 6851–6872, https://doi.org/10.1175/JCLI-D-16-0613.1, 2017.
Carlson, T. and Prospero, J. M.: The Large-Scale Movement of Saharan Air Outbreaks over the Northern Equatorial Atlantic, J. Appl. Meteorol., 11, 283–297, https://doi.org/10.1175/1520-0450(1972)011<0283:TLSMOS>2.0.CO;2, 1972.
Chin, M., Ginoux, P., Kinnes, S., Torres, O., Holben, B. N., Duncan, B. N., Martin, R. V., Logan, J. A., Higurashi, A., and Nakajima, T.: Tropospheric aerosol optical thickness from the GOCART model and comparisons with satellite and sun photometer measurements, J. Atmos. Sci., 59, 461–483, https://doi.org/10.1175/1520-0469(2002)059<0461:TAOTFT>2.0.CO;2, 2002.
Chin, M., Diehl, T., Ginoux, P., and Malm, W.: Intercontinental transport of pollution and dust aerosols: implications for regional air quality, Atmos. Chem. Phys., 7, 5501–5517, https://doi.org/10.5194/acp-7-5501-2007, 2007.
Chin, M., Diehl, T., Dubovik, O., Eck, T. F., Holben, B. N., Sinyuk, A., and Streets, D. G.: Light absorption by pollution, dust, and biomass burning aerosols: a global model study and evaluation with AERONET measurements, Ann. Geophys., 27, 3439–3464, https://doi.org/10.5194/angeo-27-3439-2009, 2009.
Chin, M., Diehl, T., Tan, Q., Prospero, J. M., Kahn, R. A., Remer, L. A., Yu, H., Sayer, A. M., Bian, H., Geogdzhayev, I. V., Holben, B. N., Howell, S. G., Huebert, B. J., Hsu, N. C., Kim, D., Kucsera, T. L., Levy, R. C., Mishchenko, M. I., Pan, X., Quinn, P. K., Schuster, G. L., Streets, D. G., Strode, S. A., Torres, O., and Zhao, X.-P.: Multi-decadal aerosol variations from 1980 to 2009: a perspective from observations and a global model, Atmos. Chem. Phys., 14, 3657–3690, https://doi.org/10.5194/acp-14-3657-2014, 2014.
Colarco, P., da Silva, A. M., Chin, M., and Diehl, T.: On-line simulations of global aerosol distributions in the NASA GEOS-4 model and comparisons to satellite and ground-based aerosol optical depth, J. Geophys. Res., 115, D14207, https://doi.org/10.1029/2009JD012820, 2010.
Colarco, P., Nowottnick, E., Randles, C. A., Yi, B., Yang, P., Kim, K., Smith, J., and Bardeen, C.: Impact of radiatively interactive dust aerosols in the NASA GEOS-5 climate model: Sensitivity to dust particle shape and refractive index, J. Geophys. Res.-Atmos., 119, 753–786, https://doi.org/10.1002/2013jd020046, 2014.
Cowie, S. M., Marsham, J. H., and Knippertz, P.: The importance of rare, high-wind events for dust uplift in North Africa, Geophys. Res. Lett., 42, 8208–8215, https://doi.org/10.1002/2015GL065819, 2015.
DeMott, P. J., Sassen, K., Poellot, M. R., Baumgardner, D., Rogers, D. C., Brooks, S. D., Prenni, A. J., and Kreidenweis, S. M.: African dust aerosols as atmospheric ice nuclei, Geophys. Res. Lett., 30, 1732, https://doi.org/10.1029/2003GL017410, 2003.
Dubovik, O., Sinyuk, A., Lapyonok, T., Holben, B. N., Mishchenko, M. I., Yang, P., Eck, T. F., Volten, H., Munoz, O., Veihelmann, B., van der Zande, W. J., Leon, J.-F., Sorokin, M., and Slutsker, I.: Application of spheroid models to account for aerosol particle nonsphericity in remote sensing of desert dust, J. Geophys. Res.-Atmos., 111, D11208, https://doi.org/10.1029/2005JD006619, 2006.
Engelstaedter, S., Washington, R., Flamant, C., Parker, D. J., Allen, C. J. T., and Todd, M. C.: The Saharan heat low and moisture transport path-ways in the central Sahara–Multiaircraft observations and Africa-LAM evaluation, J. Geophys. Res.-Atmos., 120, 4417–4442, https://doi.org/10.1002/2015JD023123, 2015.
Evan, A. T., Foltz, G. R., Zhang, D., and Vimont, D. J.: Influence of African dust on ocean-atmosphere variability in the tropical Atlantic, Nat. Geosci., 4, 762–765, 2011.
Francis, D., Fonseca, R., Nelli, N., Cuesta, J., Weston, M., Evan, A., and Temimi, M.: The atmospheric drivers of the major Saharan dust storm in June 2020, Geophys. Res. Lett., 47, e2020GL090102, https://doi.org/10.1029/2020GL090102, 2020.
Gelaro, R., McCarty, W., Suárez, M. J., Todling, R., Molod, A., Takacs, L., Randles, C., Darmenov, A., Bosilovich, M. G., Reichle, R., Wargan, K., Coy, L., Cullather, R., Draper, C., Akella, S., Buchard, V., Conaty, A., da Silva, A., Gu, W., Kim, G.-K., Koster, R., Lucchesi, R., Merkova, D., Nielsen, J. E., Partyka, G., Pawson, S., Putman, W., Rienecker, M., Schubert, S. D., Sienkiewicz, M., and Zhao, B.: The Modern-Era Retrospective Analysis for Research and Application, Version 2 (MERRA-2), J. Climate, 30, 5419–5454, 2017.
Giles, D. M., Sinyuk, A., Sorokin, M. G., Schafer, J. S., Smirnov, A., Slutsker, I., Eck, T. F., Holben, B. N., Lewis, J. R., Campbell, J. R., Welton, E. J., Korkin, S. V., and Lyapustin, A. I.: Advancements in the Aerosol Robotic Network (AERONET) Version 3 database – automated near-real-time quality control algorithm with improved cloud screening for Sun photometer aerosol optical depth (AOD) measurements, Atmos. Meas. Tech., 12, 169–209, https://doi.org/10.5194/amt-12-169-2019, 2019 (data available at: https://aeronet.gsfc.nasa.gov/cgi-bin/webtool_aod_v3, last access: 15 October 2020).
Ginoux, P., Chin, M., Tegen, I., Prospero, J., Holben, B. N., Dubovik, O., and Lin, S.-J.: Sources and global distributions of dust aerosols simulated with the GOCART model, J. Geophys. Res., 106, 20255–20273, 2001.
Holben, B. N., Tanré, D., Smirnov, A., Eck, T. F., Slutsker, I., Abuhassan, N., Newcomb, W. W., Schafer, J. S., Chatenet, B., Lavenu, F., Kaufman, Y. J., Castle, V., Setzer, A., Markham, B., Clark, D., Frouin, R., Halthore, R., Karneli, A., O'Neill, N. T., Pietras, C., Pinker, R. T., Voss, K., and Zibordi, G.: An emerging ground-based aerosol climatology: aerosol optical depth from AERONET, J. Geophys. Res.-Atmos., 106, 12067–12097, 2001.
Hsu, N. C., Jeong, M. J., Bettenhausen, C., Sayer, A. M., Hansell, R., Seftor, C. S., Huang, J., and Tsay, S. C.: Enhanced Deep Blue Aerosol Retrieval Algorithm: The Second Generation, J. Geophys. Res.-Atmos., 118, 9296–9315, 2013.
Huang, J., Zhang, C., and Prospero, J. M.: African dust outbreaks: A satellite perspective of temporal and spatial variability over the tropical Atlantic Ocean, J. Geophys. Res., 115, D05202, https://doi.org/10.1029/2009JD012516, 2010.
Huneeus, N., Schulz, M., Balkanski, Y., Griesfeller, J., Prospero, J., Kinne, S., Bauer, S., Boucher, O., Chin, M., Dentener, F., Diehl, T., Easter, R., Fillmore, D., Ghan, S., Ginoux, P., Grini, A., Horowitz, L., Koch, D., Krol, M. C., Landing, W., Liu, X., Mahowald, N., Miller, R., Morcrette, J.-J., Myhre, G., Penner, J., Perlwitz, J., Stier, P., Takemura, T., and Zender, C. S.: Global dust model intercomparison in AeroCom phase I, Atmos. Chem. Phys., 11, 7781–7816, https://doi.org/10.5194/acp-11-7781-2011, 2011.
Jickells, T. D., An, Z. S., Andersen, K. K., Baker, A. R., Bergametti, G., Brooks, N., Cao, J. J., Boyd, P. W., Duce, R. A ., Hunter, K. A., Kawahata, H., Kubilay, N., laRoche, J., Liss, P. S., Mahowald, N., Prospero, J. M., Ridgwell, A. J., Tegen, I., and Torres, R.: Global iron connections between desert dust, ocean biogeochemistry, and climate, Science, 308, 67–71, https://doi.org/10.1126/science.1105959, 2005.
Karyampudi, V. M., Palm, S. P., Reagen, J. A., Fang, H., Grant, W. B., Hoff, R. M., Moulin, C., Pierce, H. F., Torres, O., Browell, E. V., and Melfi, S. H.: Validation of the Saharan Dust Plume Conceptual Model Using Lidar, Meteosat, and ECMWF Data, B. Am. Meteorol. Soc., 80, 1045–1076, https://doi.org/10.1175/1520-0477(1999)080<1045:VOTSDP>2.0.CO;2, 1999.
Kaufman, Y. J., Koren, I., Remer, L. A., Tanre, D., Ginoux, P., and Fan, S.: Dust transport and deposition observed from the Terra-Moderate Resolution Imaging Spectroradiometer (MODIS) spacecraft over the Atlantic Ocean, J. Geophys. Res.-Atmos., 110, D10S12, https://doi.org/10.1029/2003JD004436, 2005.
Kim, D., Chin, M., Bian, H., Tan, Q., Brown, M. E., Zheng, T., You, R., Diehl, T., Ginoux, P., and Kucsera, T.: The effect of the dynamic surface bareness to dust source function, emission, and distribution, J. Geophys. Res., 118, 1–16, https://doi.org/10.1029/2012JD017907, 2013.
Kim, D., Chin, M., Yu, H., Diehl, T., Tan, Q., Kahn, R. A., Tsigaridis, K., Bauer, S. E., Takemura, T., Pozzoli, L., Bellouin, N., Schulz, M., Peyridieu, S., Chedin, A., and Koffi, B.: Sources, sinks, and transatlantic transport of North African dust aerosol: A multimodel analysis and comparison with remote sensing data, J. Geophys. Res.-Atmos., 119, 6259–6277, https://doi.org/10.1002/2013JD021099, 2014.
Kim, D, Chin, M., Yu, H., Pan, X., Bian, H., Tan, Q., Kahn, R. A., Tsigaridis, K., Bauer, S. E., Takemura, T., Pozzoli, L., Bellouin, N., and Schulz, M.: Asian and trans-Pacific dust: a multi-model and multi-remote sensing observation analysis, J. Geophys. Res.-Atmos., 124, 13534–13559, https://doi.org/10.1029/2019JD030822, 2019.
Kim, M.-H., Omar, A. H., Tackett, J. L., Vaughan, M. A., Winker, D. M., Trepte, C. R., Hu, Y., Liu, Z., Poole, L. R., Pitts, M. C., Kar, J., and Magill, B. E.: The CALIPSO version 4 automated aerosol classification and lidar ratio selection algorithm, Atmos. Meas. Tech., 11, 6107–6135, https://doi.org/10.5194/amt-11-6107-2018, 2018.
Kok, J. F., Ridley, D. A., Zhou, Q., Miller, R. L., Zhao, C., Heald, C. L., Ward, D. S., Albani, S., and Haustein, K.: Smaller desert dust cooling effect estimated from analysis of dust size and abundance, Nat. Geosci., 10, 274–278, https://doi.org/10.1038/ngeo2912, 2017.
Lensky, I. M. and Rosenfeld, D.: Clouds-Aerosols-Precipitation Satellite Analysis Tool (CAPSAT), Atmos. Chem. Phys., 8, 6739–6753, https://doi.org/10.5194/acp-8-6739-2008, 2008.
Levy, R. C., Mattoo, S., Munchak, L. A., Remer, L. A., Sayer, A. M., Patadia, F., and Hsu, N. C.: The Collection 6 MODIS aerosol products over land and ocean, Atmos. Meas. Tech., 6, 2989–3034, https://doi.org/10.5194/amt-6-2989-2013, 2013.
Levy, R., Hsu, C., Sayer, A., Mattoo, S., and Lee, J.: MODIS Atmosphere L2 Aerosol Product. NASA MODIS Adaptive Processing System, Goddard Space Flight Center [data set], https://doi.org/10.5067/MODIS/MOD04_L2.006, 2015.
Marshak, A., Herman, J., Szabo, A., Blank, K., Carn, S., Cede, A., Geogdzhayev, I., Huang, D., Huang, L.-K., Knyazikhn, Y., Kowaewski, M., Krotkov, N., Lyapustin, A., McPeters, R., Meyer, K. G., Torres, O., and Yang, Y.: Earth Observations from DSCOVR/EPIC Instrument, B. Am. Meteorol. Soc., 99, 1829–1830, https://doi.org/10.1175/bams-d-17-0223.1, 2018.
Marsham, J. H. and Ryder, C. L.: Weather Insight – dust storms and haboobs, Weather, https://doi.org/10.1002/wea.4071, online first, 2021.
Marsham, J. H., Hobby, M., Allen, C. J. T., Banks, J. R., Brocks, B. J., Cavazos-Guerra, C., Engelstaedter, S., Gascoyne, M., Lima, A. R., Martins, J. V., McQuaid, J. B., O'Leary, A., Ouchene, B., Ouladichir, A., Parker D. J., Saci, A., Salah-Ferroudj, M., Todd, M. C., and Washington, R.: Meteorology and dust in the central Sahara: Observations from Fennec supersite-1 during the June 2011 Intensive Observation Period, J. Geophys. Res., 118, 4069–4089, https://doi.org/10.1002/jgrd.50211, 2013.
Meng, Z., Yang, P., Kattawar, G., Bi, L., Liou, K., and Laszlo, I.: Single-scattering properties of tri-axial ellipsoidal mineral dust aerosols: A database for application to radiative transfer calculations, J. Aerosol Sci., 41, 501–512, https://doi.org/10.1016/j.jaerosci.2010.02.008, 2010.
Miller, R. L., Tegen, I., and Perlwitz, J.: Surface radiative forcing by soil dust aerosols and the hydrological cycle, J. Geophys. Res.-Atmos., 109, D04203, https://doi.org/10.1029/2003JD004085, 2004.
Muhs, D. R., Budhan, J. R., Prospero, J. M., and Carey, S. N.: Geochemical evidence for African dust inputs to soils of western Atlantic islands: Barbados, the Bahamas, and Florida, J. Geophys. Res., 112, F02009, https://doi.org/10.1029/2005JF000445, 2007.
NASA/LARC/SD/ASDC: CALIPSO Lidar Level 2 Aerosol Profile, V4-21 [data set], https://doi.org/10.5067/CALIOP/CALIPSO/CAL_LID_L2_05kmAPro-Standard-V4-21, 2018.
Nowottnick, E., Colarco, P., da Silva, A., Hlavka, D., and McGill, M.: The fate of saharan dust across the atlantic and implications for a central american dust barrier, Atmos. Chem. Phys., 11, 8415–8431, https://doi.org/10.5194/acp-11-8415-2011, 2011.
Okin, G. S., Mahowald, N., Chadwick, O. A., and Artaxo, P.: Impact of desert dust on the biogeochemistry of phosphorus in terrestrial ecosystems, Global Biogeochem. Cy., 18, GB2005, https://doi.org/10.1029/2003GB002145, 2004.
O'Sullivan, D., Marenco, F., Ryder, C. L., Pradhan, Y., Kipling, Z., Johnson, B., Benedetti, A., Brooks, M., McGill, M., Yorks, J., and Selmer, P.: Models transport Saharan dust too low in the atmosphere: a comparison of the MetUM and CAMS forecasts with observations, Atmos. Chem. Phys., 20, 12955–12982, https://doi.org/10.5194/acp-20-12955-2020, 2020.
Prospero, J. M.: Long-range transport of mineral dust in the global atmosphere: Impact of African dust on the environment of the southeastern United States, P. Natl. Acad. Sci. USA., 96, 3396–3403, 1999.
Prospero, J. M., Collard, F.-X., Molinie, J., and Jeannot, A.: Characterizing the annual cycle of African dust transport to the Caribbean Basin and South America and its impact on air quality and the environment, Global Biogeochem. Cy., 29, 757–773, https://doi.org/10.1002/2013GB004802, 2014.
Pu, B. and Jin, Q.: A record-breaking trans-Atlantic African dust plume associated with atmospheric circulation extremes in June 2020, B. Am. Meteorol. Soc., 102, E1340–E1356, https://doi.org/10.1175/BAMS-D-21-0014.1, 2021.
Randles, C. A., da Silva, A. M., Buchard, V., Colarco, P. R., Darmenov, A., Govindaraju, R., Smirnov, A., Holen, B., Ferrare, R., Hair, J., Shinozuka, Y., and Flynn, C. J.: The MERRA-2 aerosol reanalysis, 1980 onward, Part I: System description and data assimilation evaluation, J. Climate, 30, 6823–6850, https://doi.org/10.1175/JCLI-D-16-0609.1, 2017.
Remer, L. A., Kaufman, Y. J., Tanre, D., Mattoo, S., Chu, D. A., Martins, J. V., Li, R.-R., Ichoku, C., Levy, R. C., Kleidman, R. G., Eck, T. F., Vermote, E., and Holben, B. N.: The MODIS aerosol algorithm, products, and validation, J. Atmos. Sci., 62, 947–973, 2005.
Remer, L. A., Levy, R. C., Mattoo, S, Tanré, D., Gupta, P., Shi, Y., Sawyer, V., Munchak, L. A., Zhou, Y., Kim M., Ichoku, C., Patadia, F., Li, R.-R., Gasso, S., Kleidman, R. G., and Holben, B. N.: The Dark Target Algorithm for Observing the Global Aerosol System: Past, Present, and Future, Remote Sens.-Basel, 12, 2900, https://doi.org/10.3390/rs12182900, 2020.
Rienecker, M. M., Suarez, M. J., Gelaro, R., Todling, R., Bacmeister, J., Liu, R., Bosilovich, M. G., Schubert, S. D., Takacs, L., Kim, G.-K., Bloom, S., Chen, J., Collins, D., Conaty, A., da Silva, A., Gu, W., Joiner, J., Koster, R. D., Lucchesi, R., Molod, A., Owens, T., Pawson, S., Pegion, P., Redder, C. R., Reichle, R., Robertson, F. R., Ruddick, A. G., Sienkiewicz, M., and Woollen, J.: MERRA: NASA's Modern-Era Retrospective Analysis for Research and Applications, J. Climate, 24, 3624–3648, 2011.
Roberts, A. J., Marsham, J. H., Knippertz, P., Parker, D. J., Bart, M., Garcia-Carreras, L., Hobby, M., McQuaid, J. B., Rosenberg, P. D., and Walker, D.: New Saharan wind observations reveal substantial biases in analysed dust-generating winds, Atmos. Sci. Let., 18, 366–372, 2017.
Roberts, A. J., Woodage, M. J., Marsham, J. H., Highwood, E. J., Ryder, C. L., McGinty, W., Wilson, S., and Crook, J.: Can explicit convection improve modelled dust in summertime West Africa?, Atmos. Chem. Phys., 18, 9025–9048, https://doi.org/10.5194/acp-18-9025-2018, 2018.
Ryder, C. L., McQuaid, J. B., Flamant, C., Rosenberg, P. D., Washington, R., Brindley, H. E., Highwood, E. J., Marsham, J. H., Parker, D. J., Todd, M. C., Banks, J. R., Brooke, J. K., Engelstaedter, S., Estelles, V., Formenti, P., Garcia-Carreras, L., Kocha, C., Marenco, F., Sodemann, H., Allen, C. J. T., Bourdon, A., Bart, M., Cavazos-Guerra, C., Chevaillier, S., Crosier, J., Darbyshire, E., Dean, A. R., Dorsey, J. R., Kent, J., O'Sullivan, D., Schepanski, K., Szpek, K., Trembath, J., and Woolley, A.: Advances in understanding mineral dust and boundary layer processes over the Sahara from Fennec aircraft observations, Atmos. Chem. Phys., 15, 8479–8520, https://doi.org/10.5194/acp-15-8479-2015, 2015.
Sayer, A., Hsu, N. C., Bettenhausen, C., and Jeong, M.-J.: Validation and uncertainty estimates for MODIS Collection 6 “Deep Blue” aerosol data, J. Geophys. Res.-Atmos., 118, 7864–7873, https://doi.org/10.1002/jgrd.50600, 2013.
Schepanski, K., Tegen, I., Laurent, B., Heinold, B., and Macke, A.: A new Saharan dust source activation frequency map derived from MSG-SEVIRI IR channels, Geophys. Res. Lett., 34, L18803, https://doi.org/10.1029/2007GL030168, 2007.
Schmetz, J., Pili, P., Tjemkes, S., Just, D., Kerkmann, J., Rota, S., and Ratier, A.: An introduction to Meteosat Second Generation (MSG), B. Am. Meteorol. Soc., 83, 977–992, 2002.
Schuster, G. L., Vaughan, M., MacDonnell, D., Su, W., Winker, D., Dubovik, O., Lapyonok, T., and Trepte, C.: Comparison of CALIPSO aerosol optical depth retrievals to AERONET measurements, and a climatology for the lidar ratio of dust, Atmos. Chem. Phys., 12, 7431–7452, https://doi.org/10.5194/acp-12-7431-2012, 2012.
Song, Q., Zhang, Z., Yu, H., Kato, S., Yang, P., Colarco, P., Remer, L. A., and Ryder, C. L.: Net radiative effects of dust in the tropical North Atlantic based on integrated satellite observations and in situ measurements, Atmos. Chem. Phys., 18, 11303–11322, https://doi.org/10.5194/acp-18-11303-2018, 2018.
Swap, R., Garstang, M., Greco, S., Talbot, R., and Kallbert, P.: Saharan dust in the Amazon Basin, Tellus B, 44, 133–149, 1992.
Tan, Q., Yu, H., and Pradhan, Y.: The Godzilla dust event as seen by SEVIRI, TIB, https://doi.org/10.5446/51548, 2021.
Tao, Z., Braun, S. A., Shi, J. J., Chin, M., Kim, D., Matsui, T., and Peters-Lidard, C. D.: Microphysics and Radiation Effect of Dust on Saharan Air Layer: An HS3 Case Study, Mon. Weather Rev., 146, 1813–1835, https://doi.org/10.1175/mwr-d-17-0279.1, 2018.
Tegen, I. and Fung, I.: Modeling of mineral dust in the atmosphere: Sources, transport, and optical thickness, J. Geophys. Res.-Atmos., 99, 22897–22914, 1994.
US Environmental Protection Agency: Air Quality System Data Mart [internet database], available at: https://www.epa.gov/airdata, last access: 1 September 2020.
Winker, D., Vaughan, M. A., Omar, A. H., Hu, Y., Powell, K. A., Liu, Z., Hunt, W. H., and Young, S. A.: Overview of the CALIPSO mission and CALIOP data processing algorithms, J. Atmos. Ocean. Tech., 26, 2310–2323. https://doi.org/10.1175/2009JTECHA1281.1, 2009.
Winker, D. M., Pelon, J., Coakley Jr., J. A., Ackerman, S. A., Charlson., R. J., Colarco, P. R., Flamant, P., Fu, Q., Hoff, R. M., Kittaka, C., Kubar, T. L., Le Treut, H., McCormick, M. P., Megie, G., Poole, L., Powell, K., Trepte, C., Vaughan, M. A., and Wielicki, B. A.: The CALIPSO Mission: A Global 3D View of Aerosols and Clouds, B. Am. Meteorol. Soc., 91, 1211–1229, 2010.
Yu, H. and Zhang, Z.: New Directions: Emerging satellite observations of above-cloud aerosols and direct radiative forcing, Atmos. Environ., 72, 36–40, 2013.
Yu, H., Chin, M., Winker, D. M., Omar, A. H., Liu, Z., Kittaka, C., and Diehl, T.: Global view of aerosol vertical distributions from CALIPSO lidar measurements and GOCART model simulations: Regional and seasonal variations, J. Geophys. Res.-Atmos., 115, D00H30, https://doi.org/10.1029/2009JD013364, 2010.
Yu, H., Remer, L. A., Kahn, R. A., Chin, M., and Zhang, Y.: Satellite perspective of aerosol intercontinental transport: from qualitative tracking to quantitative characterization, Atmos. Res., 124, 73–100, 2013.
Yu, H., Chin, M., Yuan, T. L., Bian, H., Remer, L. A., Prospero, J. M., Omar, A., Winker, D., Yang, Y., Zhang, Y., Zhang, Z., and Zhao, C.: The fertilizing role of African dust in the Amazon rainforest: A first multiyear assessment based on CALIPSO lidar observations, Geophys. Res. Lett., 42, 1984–1991, https://doi.org/10.1002/2015GL063040, 2015a.
Yu, H., Chin, M., Bian, H., Yuan, T., Prospero, J. M., Omar, A. H., Remer, L. A., Winker, D., Yang, Y., Zhang, Y., and Zhang, Z.: Quantification of trans-Atlantic dust transport from seven-year (2007-2013) record of CALIPSO lidar measurements, Remote Sens. Environ., 159, 232–249, https://doi.org/10.1016/j.rse.2014.12.010, 2015b.
Yu, H., Tan, Q., Chin, M., Remer, L. A., Kahn, R. A., Bian, H., Kim, D., Zhang, Z., Yuan, T., Omar, A. H., Winker, D. M., Levy, C., Kalashnikova, O., Crepeau, L., Capelle, V., and Chedin, A.: Estimates of African dust deposition along the trans-Atlantic transit using the decade-long record of aerosol measurements from CALIOP, MODIS, MISR, and IASI, J. Geophys. Res.-Atmos., 124, 7975–7996, https://doi.org/10.1029/2019JD030574, 2019.
Yu, H., Zhou, Y., Bian, H., and Song, Q.: Godzilla dust plume: Evolution of MODIS and GEOS AOD from June 10 to 30, 2020, TIB, https://doi.org/10.5446/50830, 2021.
Yuan, T. L., Oreopoulos, L., Zelinka, M., Yu, H., Norris, J., Chin, M., Platnick, S. E., and Meyer, K.: Positive low cloud and dust feedbacks amplify tropical North Atlantic multidecadal oscillation, Geophys. Res. Lett., 43, 1349–1356, https://doi.org/10.1002/2016gl067679, 2016.
Zhou, Y., Levy, R. C., Remer, L. A. Mattoo, S., and Espinosa, W. R.: Dust aerosol retrieval over the oceans with the MODIS/VIIRS dark-target algorithm: 1. Dust detection, Earth and Space Science, 7, e2020EA001221, https://doi.org/10.1029/2020EA001221, 2020a.
Zhou, Y., Levy, R. C., Remer, L. A., Mattoo, S., Shi, Y., and Wang, C.: Dust aerosol retrieval over the oceans with the MODIS/VIIRS dark-target algorithm: 2. Nonspherical dust model, Earth Space Sci., 7, e2020EA001222, https://doi.org/10.1029/2020EA001222, 2020b.