the Creative Commons Attribution 4.0 License.
the Creative Commons Attribution 4.0 License.
 | 16 Aug 2021
Kinetics and impacting factors of HO2 uptake onto submicron atmospheric aerosols during the 2019 Air QUAlity Study (AQUAS) in Yokohama, Japan
Yu Bai
Yukiko Fukusaki
Yuka Kousa
Sathiyamurthi Ramasamy
Akinori Takami
Ayako Yoshino
Tomoki Nakayama
Yasuhiro Sadanaga
Yoshihiro Nakashima
Kentaro Murano
Nanase Kohno
Yosuke Sakamoto
Yoshizumi Kajii
HO2 uptake kinetics onto ambient aerosols play pivotal roles in tropospheric chemistry but are not fully understood. Field measurements of aerosol chemical and physical properties should be linked to molecular-level kinetics; however, given that the HO2 reactivity of ambient aerosols is low, traditional analytical techniques are unable to achieve this goal. We developed an online approach to precisely investigate the lower-limit values of (i) the HO2 reactivities of ambient gases and aerosols and (ii) HO2 uptake coefficients onto ambient aerosols (γ) during the 2019 Air QUAlity Study (AQUAS) in Yokohama, Japan. We identified the effects of individual chemical components of ambient aerosols on γ. The results were verified in laboratory studies on individual chemical components: transition metals play a key role in HO2 uptake processes, and chemical components indirectly influence such processes (i.e., by altering aerosol surface properties or providing active sites), with smaller particles tending to yield higher γ values than larger particles owing to the limitation of gas-phase diffusion being smaller with micrometer particles and the distribution of depleting species such as transition metal ions being mostly distributed in accumulation mode of aerosol. The modeling of γ utilized transition metal chemistry derived by previous studies, further confirming our conclusion. However, owing to the high NO concentrations in Yokohama, peroxy radical loss onto submicron aerosols has a negligible impact on O3 production rate and sensitivity regime.
- Article
(2355 KB) - Full-text XML
-
Supplement
(2954 KB) - BibTeX
- EndNote


As an important atmospheric trace gas, the hydroperoxyl radical (HO2) links many of the key oxidants in the troposphere, including the hydroxyl radical (OH), nitrate radical (NO), ozone (O3), and hydrogen peroxide (H2O2) (Logan et al., 1981; Chen et al., 2001; Jaeglé et al., 2000; Sommariva et al., 2004; Jacob, 2000). However, the observed HO2 concentration in field measurements has not yet been fully explained by sophisticated models (known as the “HOx dilemma”) (Stone et al., 2012; Creasey et al., 1997; Kanaya et al., 2007b; Whalley et al., 2010; Millán et al., 2015), although it can be mostly solved in the conditions of clean marine air where NO concentration is low or aerosol loading is low enough to make the heterogeneous reaction of HO2 unimportant (Sommariva et al., 2004; Kanaya et al., 2007a). Owing to the short atmospheric lifetime of HOx (= OH + HO2 + RO2), the HOx reactivity measurement can provide a robust test of its complex chemistry (Heard and Pilling, 2003). The HO2 uptake kinetics onto ambient aerosols, including HO2 reactivity (ka) and uptake coefficient (γ), influence many atmospheric processes, including ozone formation rate, ozone formation sensitivity to NOx, and H2O2 formation (Sakamoto et al., 2019; Thornton et al., 2008). With γ>0.1, HO2 concentration can also be influenced under conditions such as low [NO] or high aerosol loading (Lakey et al., 2015; Mao et al., 2013b; Martínez et al., 2003; Tie et al., 2001; Jacob, 2000; Matthews et al., 2014). These effects make the HO2 uptake onto ambient aerosols indirectly influence human health and climate change.
From laboratory, field, and modeling studies, HO2 uptake coefficients onto different types of aerosol can span several orders of magnitude (∼ 0.002–1), which can be affected by many parameters, such as droplet/particle size and composition, the presence of dissolved reactive gases, and environmental conditions (i.e., relative humidity (RH), pH, and T) (Taketani et al., 2012, 2008; Bedjanian et al., 2005; Thornton et al., 2008; George et al., 2013; Lakey et al., 2016a, b; Matthews et al., 2014; Cooper and Abbatt, 1996; Hanson et al., 1992; Thornton and Abbatt, 2005; González Palacios et al., 2016; Mozurkewich et al., 1987; Remorov et al., 2002; Jaeglé et al., 2000; Loukhovitskaya et al., 2009; Stone et al., 2012). In the absence of metals, the uptake of HO2 by ambient aerosols is believed to occur via the acid–base dissociation of HO2 (, pKa = 4.7), followed by electron transfer from O to HO2 (aq) (), producing H2O2 (Jacob, 2000; Thornton et al., 2008; Zhou et al., 2019b). However, laboratory studies have shown that certain transition metals, i.e., Cu(II) and Fe(II), can act as catalysts and accelerate HO2 uptake rates onto many chemical compounds (Thornton et al., 2008; Taketani et al., 2008, 2012; Cooper and Abbatt, 1996). Owing to the sufficiently high metal concentrations in tropospheric aerosols, as shown in previous field measurements (Hofmann et al., 1991; Wilkinson et al., 1997; Guieu et al., 1997; Manoj et al., 2000; Halstead et al., 2000; Siefert et al., 1998; Sedlak and Hoigné, 1993; Guo et al., 2014), recent studies have proposed that γ may be dominated by metals contained in the aerosol. This can lead to the HO2 destruction (Mao et al., 2013a; George et al., 2013), forming H2O2, HO2–water complexes, or water and sulfate (Mozurkewich et al., 1987; Cooper and Abbatt, 1996; Gonzalez et al., 2010; Loukhovitskaya et al., 2009; Mao et al., 2010; Macintyre and Evans, 2011), which are important in the evolution of the chemical composition and physical properties of particles (George and Abbatt, 2010; George et al., 2008). The available data concerning HO2 uptake kinetics onto ambient aerosols are insufficient for quantitative consideration owing to the much lower ka value as compared with the HO2 reactivity of ambient gases (kg). Therefore, they are below the detection limits of the current instruments.
To our knowledge, aside from us, only one study has measured γ, using an offline method that integrated ambient aerosols over size and time (Taketani et al., 2012). Considering that the offline method may distort γ, we developed an online approach to evaluate HO2 uptake kinetics onto ambient aerosols. This method was successfully applied in Kyoto, Japan, in summer 2018, using a versatile aerosol concentration enrichment system (VACES) and a technique combining laser-flash photolysis with laser-induced fluorescence (LFP–LIF) (Zhou et al., 2019b). The obtained average γ value (∼ 0.24) was comparable with the previous values used for modeling studies (∼ 0.2) (Stadtler et al., 2018; Jacob, 2000). However, the large standard deviation (± 0.20, 1σ) of γ along with the measurement time suggest that many other parameters might play a role, e.g., the measurement setup, aerosol characteristics, T, and RH.
In this study, we chose Yokohama (Japan), a coastal city with higher pollutant levels than Kyoto and different properties of the air masses from mainland Japan and the coast, as the measurement site. This is part of the Air QUAlity Study (AQUAS) campaign. The chemical and physical properties of ambient aerosols were quantified in real time. To test their influence on ka and γ, we conducted correlation matrix analysis coupled with the bootstrap method and classified the arriving air masses from different directions. Further, the main mechanism of γ was investigated by comparing the real-time quantified γ values with the modeled values. The impact of the peroxy radical's loss onto ambient aerosols on air quality is evaluated through their impact on ozone formation rates and their sensitivity to NOx. The results obtained here will better estimate the heterogeneous reaction between HO2 and ambient aerosols in sophisticated air quality models.
2.1 Sampling sites
The measurement campaign was conducted at the Yokohama Environmental Science Research Institute in Yokohama, Japan (location: 35∘28′52.8′′ N, 139∘39′30.3′′ E), from 24 July to 3 August 2019. The sampling ports of the instruments were placed approximately 25 m above the ground. Figure S1 shows the air mass directions during the campaign, which can be classified into two categories: (i) from the sea to the north, toward Yokohama (∼ 19 % of the experimental period: from 12:00 25 July to 12:00 27 July 2019), and (ii) from the mainland toward Yokohama (∼ 81 % of the experimental period). This classification was intended to distinguish the chemical properties of aerosols arriving from the mainland and the ocean and to consequently quantify their impacts on ka and γ.
2.2 Measurement strategies, instrumentation, and related data analysis
2.2.1 LFP–LIF
In situ ambient air HO2 reactivity was measured using LFP–LIF, which was adapted from a laser-induced pump and probe OH reactivity measurement technique. This approach has been successfully employed for gas- and aerosol-phase HOx (= OH + HO2) reactivity measurements (Sadanaga et al., 2004; Miyazaki et al., 2013; Sakamoto et al., 2018). Further details concerning the HO2 reactivity measurements are given in the Supplement.
2.2.2 VACES
To compensate for the relatively low ambient aerosol concentrations and thus the low ka and the low limit of detection (LOD) for the HO2 reactivity measurement (∼ 0.003 s−1 with 240 decay integrations), a setup with VACES and an auto-switching aerosol filter were used before LFP–LIF. The VACES was built according to Sioutas et al. (1999), and the ambient air sample was drawn into a tank (containing ultra-pure water heated up to ∼ 32 ∘C) of VACES through a PM2.5 cyclone at a flow rate of over ∼ 100 L min−1, where the ambient air stream was saturated and subsequently cooled down in a condenser connected above the tank (with a temperature of 2 ∘C). During this process, the water droplets with diameters > 2 µm formed on the collected ambient aerosols, which were then enriched by a virtual impactor (with a 50 % cutoff point less than 1 µm) and dried by passing through a diffusion dryer connected right after the condenser in sequence. The concentration enrichment of the ambient aerosols can be estimated using the total intake flow of VACES and the minor output flow of the virtual impactor that connected to the aerosol instrumentations (more details are given in the Supplement: the enrichment of the ambient aerosols). Wang et al. (2013, 2014) claimed that when using the same technique as VACES for the online measurement of copper in ambient aerosols, equivalent copper concentrations were obtained compared to those measured by an inductively coupled plasma mass spectrometer (ICP–MS) for both total and water-soluble components, which indicates that the impact of the VACES system on the solubility of Cu contained in ambient aerosol is negligible. Furthermore, previous studies found that the liquid–liquid phase separation RH ranged from 60 % to 100 % in atmospherically relevant particles consisting of organic species and inorganic salts (Yu et al., 2014), and the organic component appears to be the most useful parameter for estimating the liquid–liquid phase separation, which was always observed for oxygen-to-carbon elemental ratio (O:C < 0.5 and was never observed for O:C ≥ 0.8 (Bertram et al., 2011). In this study, the ambient aerosol O:C ranged from 0.1 to 0.7, with the RH changing from ∼ 80 % (in ambient air) to >100 % (in the water tank) and then to ∼ 75 % (in the reaction cell), suggesting that the phase separation may have already happened before entering the VACES system, and thus we assume that the morphology of the ambient aerosols did not change during the concentration enrichment process. Unfortunately, we did not measure the chemical composition after the VACES, and thus we are not able to compare the chemical composition of the post-VACES aerosols to ambient aerosol. However, previous tests using the ambient aerosol fractions including coarse and fine PM indicated that the enrichment process of the VACES system does not differentially affect the chemical composition of ambient PM (Kim et al., 2001), and thus we assume that the chemical composition changing due to the enrichment process of the VACES can be neglected. The enrichment factor of the ambient aerosol surface area (E) was calculated from the difference between the surface areas measured before and after VACES by two scanning mobility particle sizers (SMPSs).
2.2.3 Aerosol physical properties and the enrichment factor of VACES
The mass concentration and surface area of ambient aerosols (before VACES) were determined using a SMPS1 (model 3936L72, TSI, measure particle size distribution at 14.1–736.5 nm, 5 min intervals). The mass concentration of PM2.5 was measured using a palm-sized optical PM2.5 sensor (Nakayama et al., 2018). In order to test the enrichment factor of the VACES, a SMPS2 (model 3936L75, TSI, measure particle size distribution at 14.6–661.2 nm, 5 min intervals) was used to measure the enriched mass concentration and surface area of ambient aerosols (after VACES) for ∼ 2 h every day for 6 d. The enrichment factor of VACES for the surface area was estimated as 12.5 ± 2.5 from the ratio between S2 and S1, where S2 and S1 are the averaged surface areas measured by SMPS2 and SMPS1 of each day, respectively. According to the test from previous study of the VACES system, there is no distortion of the size distribution of the original ultrafine aerosols as the particle concentration enrichment occurs without any coagulation (Sioutas et al., 1999); here, we listed the mean radius and geometric standard deviation (Geo. SD) of the ambient aerosols before and after VACES during the enrichment factor measurement periods, as shown in Table 1. We could see that the mean radii before and after VACES are not statistically different within the standard deviation.
Table 1The mean radius and geometric standard deviation of ambient aerosols before and after VACES.
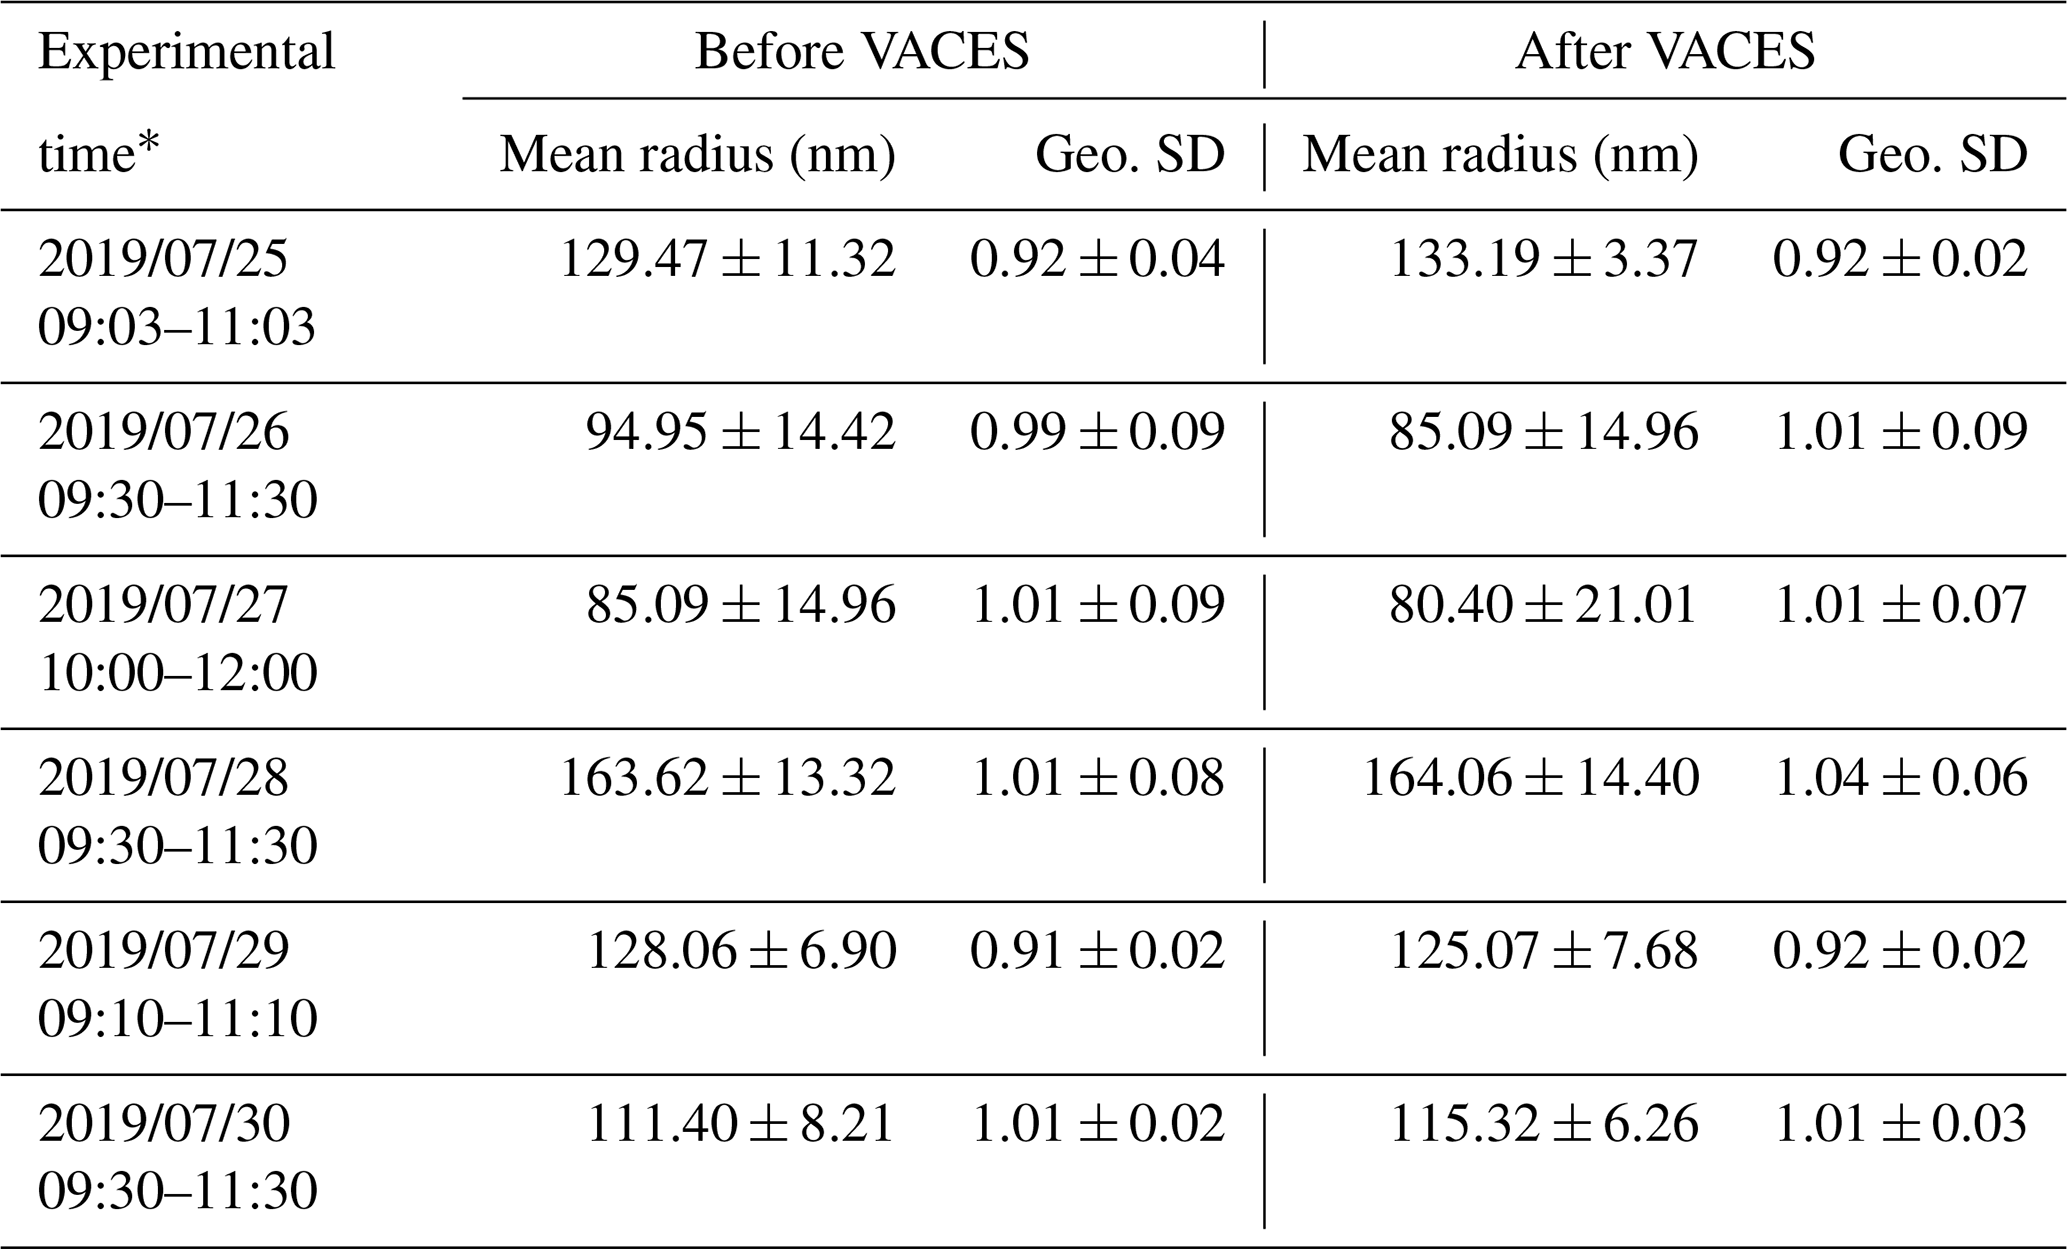
∗ These represent the time period of the enrichment factor measurements; ± represents the standard deviation of the averaged values of mean radius and Geo. SD.
The enriched surface area of ambient aerosols with aerodynamic diameter < 0.74 µm (PM0.74) was calculated from the surface area of ambient aerosol measured by SMPS1 and the enrichment factor. The enriched surface area of PM2.5 was then calculated by multiplying the enriched surface area of PM0.74 by the mass ratio between PM2.5 and PM0.75 (∼ 1.1), where we assume that the surface areas are increased in proportion to the mass concentration. However, as the larger particles (here referring to particles ranging from 0.74 to 2.5 µm) tend to have a lower surface area than the smaller particles, we consider the obtained enriched surface area of PM2.5 to be the upper-limit value. More details can be found in the Supplement.
2.2.4 HO2 uptake kinetics
After passing through the VACES system, the ambient air was sampled using a three-port valve (Bolt, Flon Industry Co., Ltd) and injected into the LFP–LIF system. The valve was switched automatically between two sampling lines, one with the aerosol filter on and the other one with the aerosol filter off, and HO2 reactivities in ambient air caused by two modes were measured: (a) the gas-phase mode with the aerosol filter on, where the HO2 reactivities are represented as kg, and (b) the gas + enriched aerosol-phase mode with the aerosol filter off, where the HO2 reactivities are represented as kg + Eka, where E represents the enrichment factor of ka, Eka represents the total HO2 reactivities caused by enriched ambient aerosols, and the usage of Eka is based on the assumption that HO2 uptake with aerosol particles follows the pseudo-first-order rate law. We modeled kg in both modes using a theory identified previously (see Supplement: HO2 reactivity of the ambient gas phase) (Zhou et al., 2019b) and compared it with the measured values. The differences between measured and modeled kg in mode (a) enabled us to establish their interrelationship and to check instrument stability. The differences between (kg +Eka) and the modeled kg in mode (b) are considered the enriched aerosol-phase HO2 reactivity (Eka). The total HO2 reactivity decay profile follows single-exponential decay:
where kbg denotes the zero air background obtained by injecting zero air with the same RH as the real-time ambient value into the reaction cell every 24 h for 30 min. The RH was controlled by passing some of the zero air through a water bubbler. The value of kbg was subtracted separately on each day. The variability of kbg (i.e., the reproducibility of the laser system) was calculated as the standard deviation of the response of repeated measurements on different days. It was found to be ∼ 4 %, which is slightly higher than the instrument precision (3 %). A 30 min average calculation was applied to the data to reduce data fluctuation. The observed HO2 uptake coefficients onto ambient aerosols (γobs) can be calculated from the dependence of Eka on γobs:
where ES and represent the enriched surface area of ambient aerosol after VACES and the mean thermal velocity of HO2 (∼ 437.4 m s−1), respectively. The uncertainty of the enriched surface area was estimated from the instrument systematic error of SMPS (∼ 8 %) and the uncertainty of the enrichment factor (± 2.5), which are shown in Fig. 1b (see Supplement). The HO2 reactivity of ambient aerosol (ka) can be obtained from Eka by dividing by the enrichment factor E.
2.2.5 High resolution–time of flight–aerosol mass spectrometry (HR–ToF–AMS)
A field-deployable HR–ToF–AMS (Aerodyne Research Inc.) (DeCarlo et al., 2006) was used for the characterization of the non-refractory aerosol mass with a time resolution of ∼ 3 min. The HR–ToF–AMS measured the total organic aerosol (OA), sulfate (SO), nitrate (NO), ammonium (NH), chloride (Cl−), and two most dominant oxygen-containing ions in the OA spectra, i.e., mass-to-charge ratios of (Org44, mostly CO) and (Org43, mainly C2H3O+ for the oxygenated OA and C3H for the hydrocarbon-like OA) (Ng et al., 2011). The fractions of Org44 and Org43 in OA are represented as f44 and f43, respectively. Ambient air was sampled through a critical orifice into an aerodynamic lens, which efficiently transmitted particles between 80 nm and up to at least 1 µm. Particles were flash-vaporized by impaction on a resistively heated surface (∼ 600 ∘C) and ionized by electron ionization (70 eV). The values of the resulting fragments were determined using a ToF mass spectrometer. Data were analyzed using the ToF–AMS software SQUIRREL and PIKA. Data were not corrected for lens transmission efficiency. Standard relative ionization efficiencies (RIEs) were used for organics (RIE = 1.4), nitrate (RIE = 1.1), chloride (RIE = 1.3), sulfate (RIE = 1.12), and ammonium (RIE = 4). Concentration data were obtained from background-subtracted stick-mass data (low-mass-resolution-base mass concentration data, which are calibrated using ammonium sulfate particles) and determined assuming a collection efficiency (CE) of 0.5.
2.2.6 Filter-based photometer
Real-time measurement of the equivalent black carbon (eBC) was performed using a five-wavelength dual-spot absorption photometer (MA300, AethLabs, San Francisco, CA, USA), which performed an online correction for possible artifacts resulting from filter loading and multiple scattering (Drinovec et al., 2015). In this study, eBC data obtained from light attenuation at a wavelength of 880 nm were used to avoid possible contributions from brown carbon; the time resolution was ∼ 1 min.
2.2.7 Trace elements
Fourteen trace elements (Al, V, Cr, Mn, Co, Ni, Cu, Zn, As, Se, Sr, Cd, Ba, and Pb) were measured using an offline method at 2 d intervals from 21 July to 5 August 2019. The suspended particulate matter (SPM) was collected onto 623.7 cm2-sized quartz fiber filters (Pallflex Tissuquartz 2500QAT-UP), which had an available collecting area of 405.84 cm2 using a high-volume sampler (1000 L min−1). Approximately 2 cm2 of each filter was cut into pieces and placed into a polytetrafluoroethylene (PTFE) pressure digestion tank with 1 mL 49 % hydrofluoric acid (HF) and 5 mL 69 % nitric acid (HNO3). A Thermo Fisher X2 Series ICP–MS was then used to determine metal concentrations. By assuming that the metal fractions were the same in SPM and PM1 (aerosol particles with aerodynamic diameters less than 1 µm), the concentrations in PM1 were estimated according to the tested metal concentrations in SPM and the ratio between SPM and PM1 measured in situ.
2.2.8 Water-soluble inorganic species
NR-PM1 water-soluble inorganic species (including Na+, SO, NH, NO, Cl−, Ca2+, K+, and Mg2+) used for the ISORROPIA-II model were also measured using the offline method, as described above. For extraction, we cut one-fourth of a 47 mm filter punched from the original collected filter and placed it in 10 mL of ultrapure water (18.2 MW cm−1) in a centrifuge tube. This was followed by 15 min of ultrasonication in a 30 ∘C water bath. The solution was then vortexed (Vortex Genie 2, Scientific Industries, USA) for 1 min to ensure homogeneity and filtered through a syringe filter with a pore size of 0.45 µm (Advantec Dismic-25, PTFE). An Ion Chromatograph (IC, ICS1600, DIONEX, USA) was employed to determine the concentrations of these inorganic ions in the extracted solution.
2.2.9 Gas-phase monitors
NO2 was measured by cavity-attenuated phase shift (CAPS, Aerodyne Research, USA, at 1 s intervals), NOy–NO by chemiluminescence (model 42i-TL, Thermo, at 10 s intervals), CO by a Thermo CO analyzer of nondispersive infrared spectroscopy (model 48i-TLE, Thermo Scientific, USA, at 10 s time intervals), and O3 by UV absorption (model 1150, Dylec, AMI Co., Ltd, at 10 s time intervals). HCHO was determined by high-performance liquid chromatography (HPLC; 1260 Infinity, Agilent Technologies Inc, USA) from 14:00 29 July to 12:00 3 August 2019. An average value of ∼ 2 ppb was used for the data analysis.
2.2.10 ISORROPIA-II model
NR-PM1 water-soluble inorganic species (including Na+, SO, NH, NO, Cl−, Ca2+, K+, and Mg2+) and meteorological parameters including temperature and RH were used to calculate the aerosol pH and liquid water content based on the ISORROPIA-II model (Fountoukis and Nenes, 2007). We ran ISORROPIA-II in “reverse” mode, and the particles were assumed to be deliquescent, i.e., in metastable mode (Hennigan et al., 2015). The thermodynamic equilibrium of the NH–SO–NO system case was used for modeling.
3.1 The HO2 uptake kinetics onto ambient aerosols
The measured total HO2 reactivities were compared against the modeled gas-phase HO2 reactivity under the experimental conditions both with and without the aerosol phase. Without the aerosol phase, the modeled kg values are calculated according to the description in Sect. 2.2 and are not statistically different with the measured kg values (Fig. 1a second panel, t test, p=0.49, with inspection level = 0.05), indicating that HO2 loss in the reaction cell was dominated by its reaction with NO2 in the LFP–LIF system. With the aerosol phase, the measured (Eka+kg) and modeled values (≈kg) were significantly different (see Fig. 2b, first panel, t test, p=0.04, with inspection level = 0.05). The differences were considered to be the HO2 reactivities of enriched ambient aerosols (Eka). Eka ranged between 0.015 s−1 (25th percentile) and 0.097 s−1 (75th percentile), with a median value of 0.059 s−1, the corresponding ka, calculated by dividing Eka by E, ranging between 0.001 s−1 (25th percentile) and 0.008 s−1 (75th percentile), with a median value of 0.005 s−1 and an average value of 0.005 ± 0.005 s−1. The error for Eka was estimated to be ∼ 0.05 s−1, calculated as the propagated error from kg+Eka (i.e., the systematic error of the instrument, ∼ 0.05 s−1) and the modeled kg in mode (b) (∼ 0.001 s−1). The error for ka was then estimated as ∼ 0.004 s−1 by dividing the error of Eka by the enrichment factor E. The corresponding γ, calculated from Eq. (2), ranged from 0.05 (25th percentile) to 0.33 (75th percentile), with a median value of 0.19 (with an average value of 0.23 ± 0.21). The mean diameters of ambient particles ranged from 0.1 to 0.46 µm (with a median value of 0.25 µm), and the gas-phase diffusion effects on γ were estimated to be ∼ 6.6 % (further details are given in the Supplement). The absolute increase in γ due to the gas-phase diffusion is 0.03 on average, which is negligible compared to γ uncertainty (∼ 0.21 on average). Therefore, we ignored the gas-phase diffusion effects on γ.
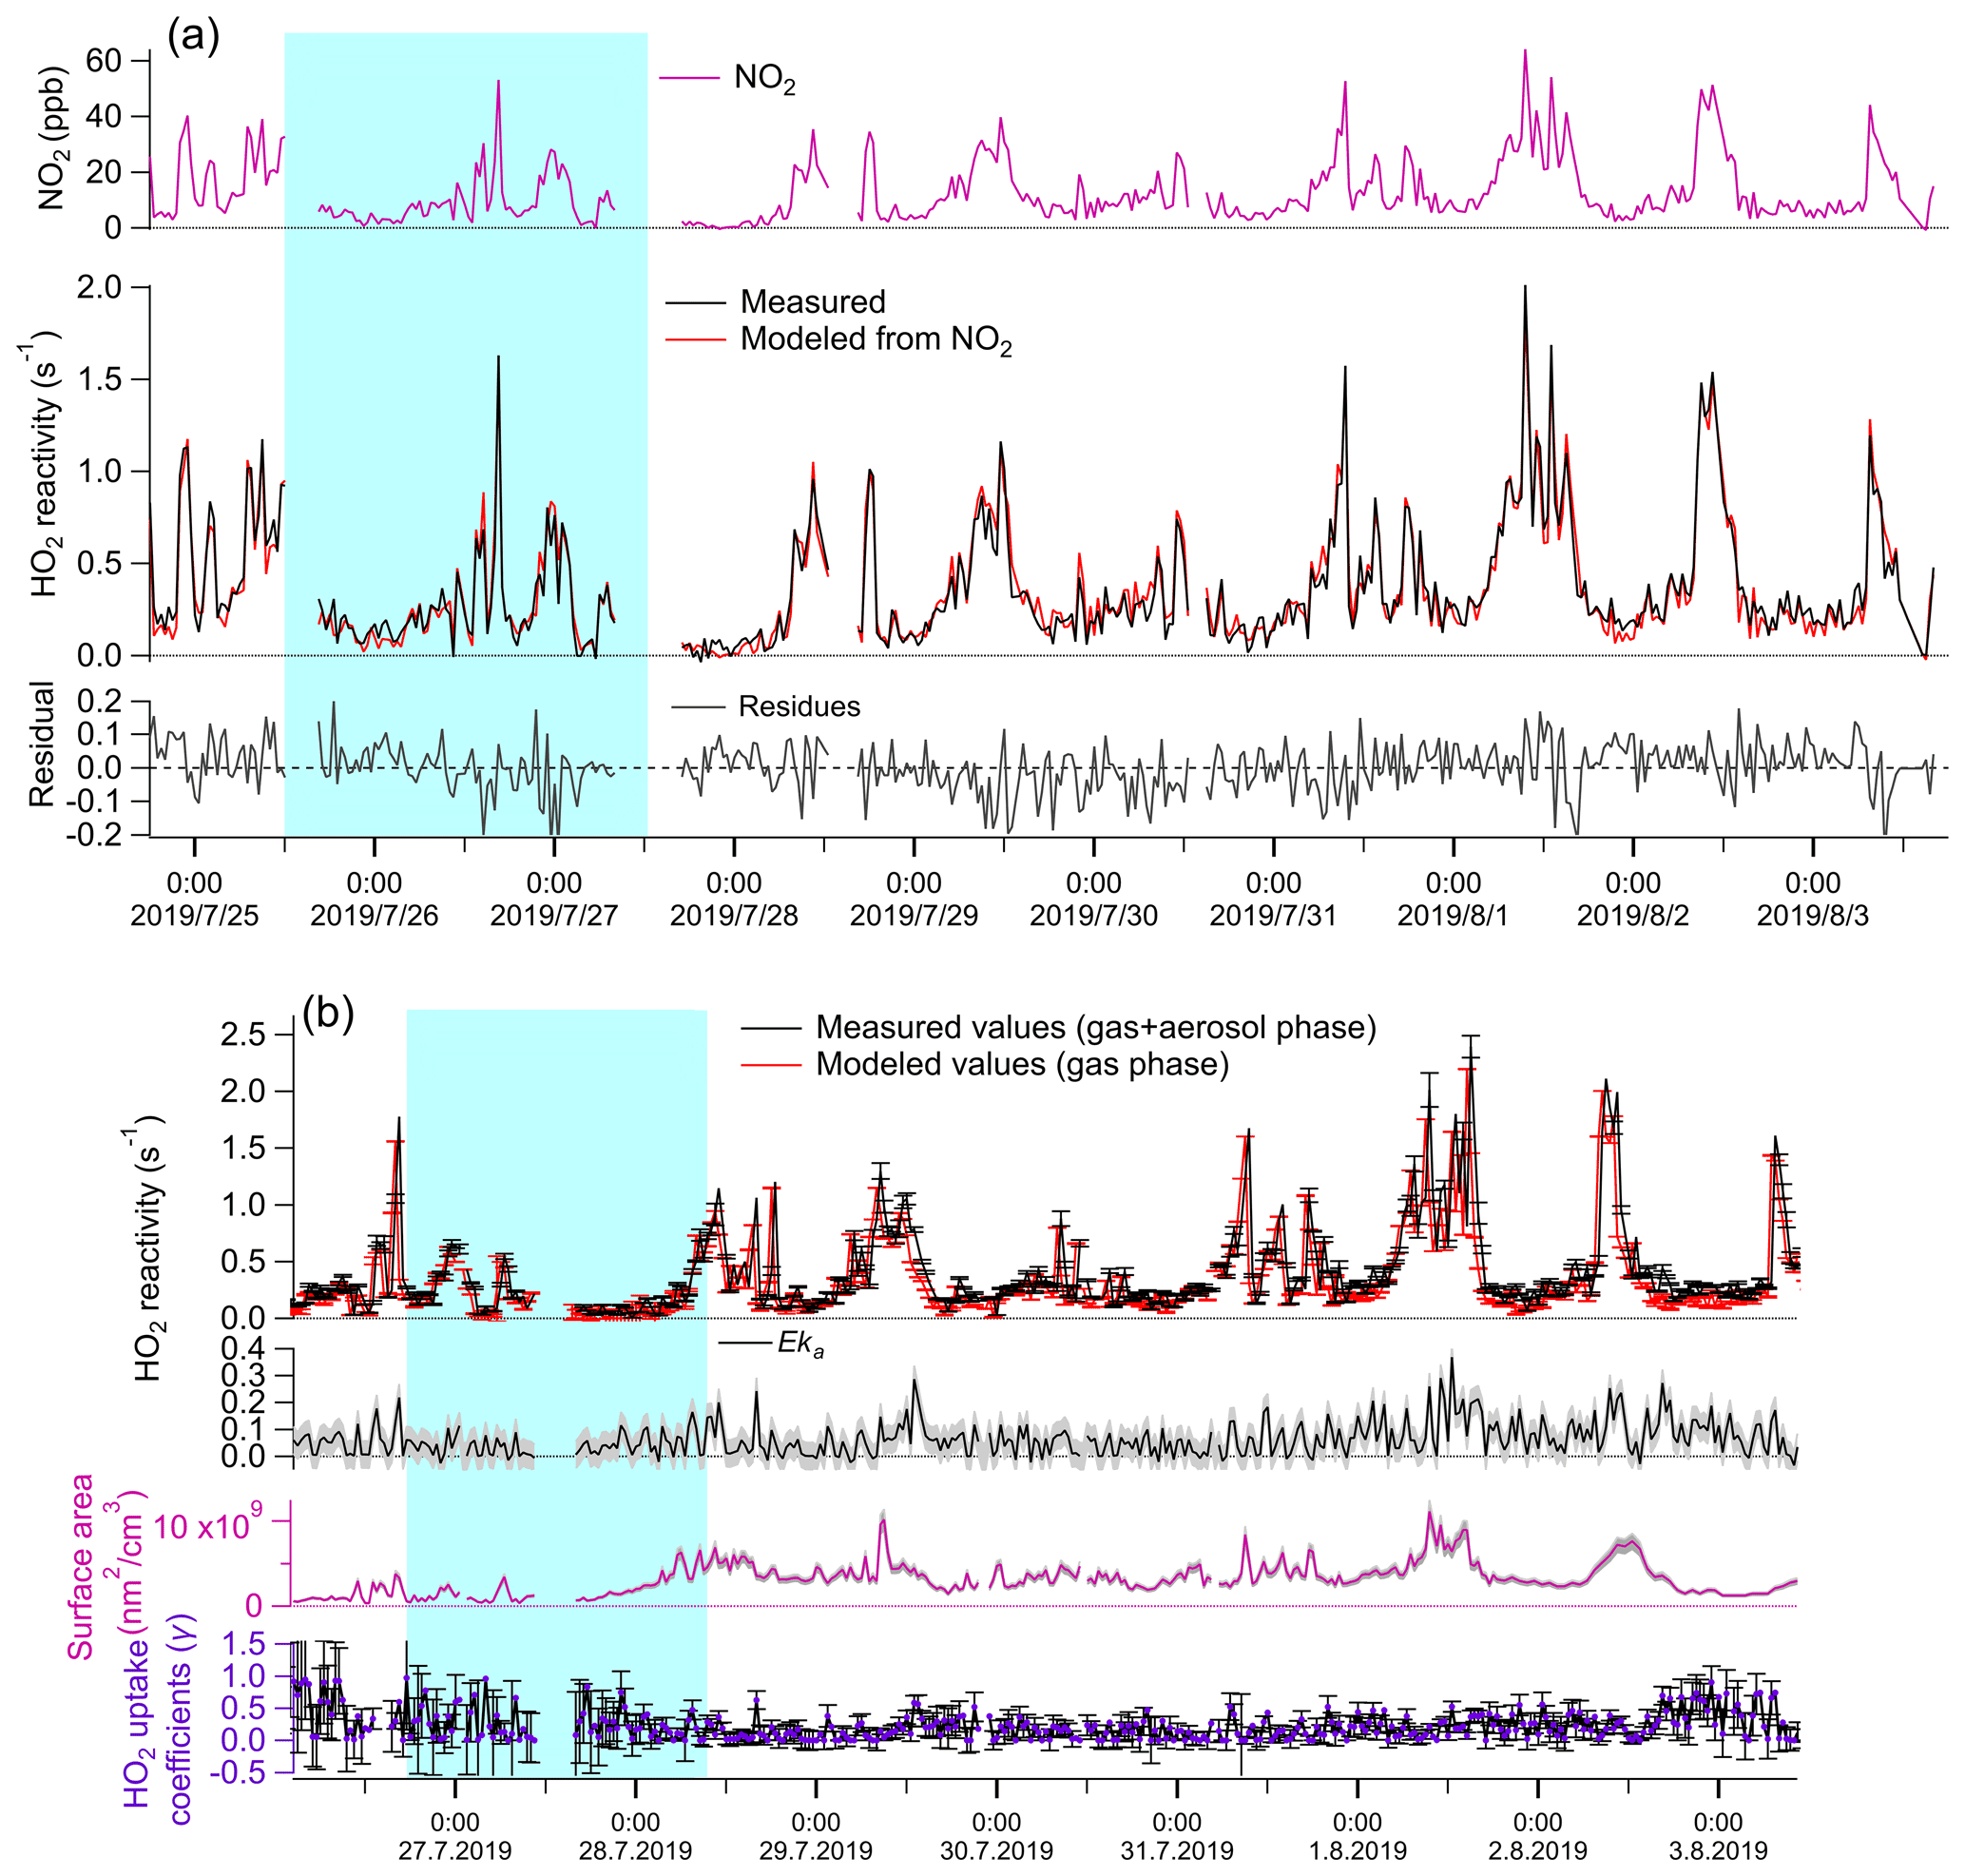
Figure 1Temporal variation of parameters under different experimental conditions. (a) Without aerosol phase: first panel: measured NO2 concentrations (ppb); second panel: measured (red line) and modeled (black line) kg; third panel: fitting residues of modeled kg values, ranging from −0.04 (25th percentile) to 0.05 (75th percentile). Therefore, we consider the systematic error of the LFP–LIF instrument to be ∼ 0.05 s−1. (b) Gas + aerosol phase: first panel: measured total HO2 reactivity (kg+Eka) and modeled kg; second panel: Eka, calculated from the difference between the measured and modeled values from the first panel; the gray shadow area represents the uncertainty of Eka (ΔEka), propagated from the error of (kg+Eka) and modeled kg; third panel: the upper-limit surface area of the enriched ambient aerosols (ES): the gray shadow area represents the uncertainty of ES (ΔES), propagated from the systematic errors of the SMPS instrument (∼ 8 %), and the uncertainty of the enrichment factor; fourth panel: γ calculated from Eka and ES according to Eq. (2). The errors for γ were propagated from ΔEka and ΔES, . The blue shaded area represents the air masses from group i (from the coast), and the remainder is from group ii (from the mainland).
Statistical significance analysis showed that the average γ value of group i (0.35 ± 0.28) is significantly higher than that of group ii (0.21 ± 0.16) (calculated p=4.9E-5; Mann–Whitney), indicating that the air masses from the ocean yield higher γ values than the air masses from mainland Japan. The difference in γ values between group i and group ii may be due to the different chemical components contained in the ambient aerosols arriving from the ocean or mainland, which we will discuss in the following sections. The average value of ka at Yokohama (0.005 ± 0.005 s−1) was much higher than that at Kyoto (0.0017 ± 0.0015 s−1) (with calculated p<0.05; Mann–Whitney); this may be due to the different aerosol properties in Kyoto and Yokohama. We list some of them as follows. (1) Mass composition: the aerosols at the coastal city (Yokohama) tend to contain more sea salts and thus increased ka. (2) Particle size distribution: smaller particles tend to yield higher γ values than larger particles owing to the depleting species (e.g., transition metal ions) being mostly distributed in the accumulation mode of aerosol. (3) The water content and the metal concentrations will highly influence the HO2 uptake capacity of the ambient aerosols. However, the average value of the HO2 uptake coefficient onto ambient aerosols (γ) at Yokohama is ∼ 0.23, which is comparable with previous measured (∼ 0.24–0.25) (Zhou et al., 2019b; Taketani et al., 2012) and modeled (∼ 0.20) values (Stadtler et al., 2018; Jacob, 2000). The large standard deviation (± 0.21, 1σ) of the values along with the measurement time may be due to the instantaneously changed chemical and physical properties of ambient aerosols, indicating that a large bias may exist if a constant γ value is used for modeling.

Figure 2(a) Concentrations of non-refractory chemical components plus eBC in Yokohama, Japan (24 July to 2 August 2019). The blue shaded area represents group i from the coast, and the remaining areas represent group ii from the mainland. (b) Average contribution fractions of different chemical components of groups i and ii.
3.2 Bulk chemical composition of ambient aerosols
Figure 2a shows the time series of the mass concentrations of OA, SO, NO, NH, Cl−, and eBC in PM1 in Yokohama from 24 July to 2 August 2019, which is ∼ 1.5 d less than for the LFP–LIF data. During this period, PM1 ranged from ∼ 1 to 35 µg m−3 (average ≈13 µg m−3) and was dominated by OA, SO, and NH, with contributions of 39 ± 11 %, 30 ± 12 %, and 12 ± 4 %, respectively; these were followed by eBC and metals, with contributions of 10 ± 7 % and 8 ± 8 %, respectively. Cl− contributed <1 % in both groups, which is similar to that reported for an urban area in winter in Bern (Switzerland) (Zhou et al., 2019a). However, NO contributed much less (∼ 2 ± 0.7 %) compared with that reported for Bern (∼ 19 ± 4 %), which may be due to the reverse reaction of NH4NO3 converting to HNO3. Since Yokohama is a coastal city and HNO3 is easily vaporized in summer, gaseous HNO3 may sink with sea salt particles by forming NaNO3 through heterogeneous reactions (Finlayson-Pitts and Pitts, 2000).
Figure 2b shows the average contribution fractions of different components of group i and group ii. The main differences in the components between these two groups are the fractions of OA, BC, SO, and metals. The OA fraction was ∼ 1.8 and ∼ 8.4 times higher than that for the metals in groups i and ii, respectively. As OA can cover the surface of the particles and thereby decrease γ (Lakey et al., 2016a; Takami et al., 2013), the difference between the OA and metal fractions in these two groups may partially explain the much higher γ values of group i (vs. group ii). Previous studies have shown a quite low HO2 uptake coefficient on BC (∼ 0.01) (Saathoff et al., 2001; Macintyre and Evans, 2011), which is different from the result obtained here. This may be due to the much higher fraction of BC in group i (vs. group ii) providing active sites for HO2 self-reaction or its reaction with the H atom from the abstraction reaction from hydrogen-containing functional groups and produce H2O2 (Bedjanian et al., 2005), or BC can be coated with additional materials (e.g., sulfate and organic carbon), thus influencing HO2 uptake (Schwarz et al., 2008). We also observed a slightly higher Cl− and BC fraction in group i (from the ocean) than that in group ii (from the mainland), which may be due to the effects of sea salt and the ship emissions in the air mass from the ocean, respectively. From the average diurnal patterns (Figs. S5 and S6), the trends in ka follow the trends in chemical composition, whereas γ shows a contrasting trend with both variables in both groups. For group ii, SO and OA exhibited higher values, whereas γ exhibited lower values during the daytime than those during the nighttime, indicating that secondary aerosol formation resulting from photochemical reactions may decrease γ. To identify the influence of each individual chemical component of ambient aerosol on ka and γ, we further performed correlation matrix analysis.
3.2.1 Influence of individual chemical components of ambient aerosol on ka and γ
For multiple-component ambient aerosol, ka and γ are influenced by different chemical components, and these chemical components may also have mutual effects on each other. For example, the transition metals Cu and Fe contained in ambient aerosols can be chelated by organics (Lakey et al., 2016b). Therefore, we produced a Pearson correlation matrix of all the testing factors at Yokohama, including different chemical components, ka and γ. Here we note that the different chemical components were measured using HR–ToF–AMS for ambient aerosols with aerodynamic diameters <1 µm, while ka and γ were measured using the VACES–LFP–LIF system for ambient aerosols with aerodynamic diameters <2.5 µm, but due to most “fine-mode” aerosols having a mean diameter ranging from 0.09 to 0.47 µm (with a median value of 0.25 µm, measured by SMPS), we assume that the chemical components of ambient aerosols with the aerodynamic diameter ranging between 1 and 2.5 µm have a negligible impact on the Pearson correlation matrix result. However, the present results do not include the effects of coarse particles (with aerodynamic diameters >2.5 µm) on the HO2 uptake kinetics, and we may partially miss measuring sea spray (with diameters ranging from ∼ 0.05 to 10 µm) effects. When Cl− measured by AMS increased, coarse particles may exist and our results may not represent the real ambient conditions. Consequently, we consider our results to be the lower limit of the HO2 uptake kinetics onto real ambient aerosols.
To exclude the effects of the different fractions of chemical components in groups i and ii, the bootstrap method, which is based on the creation of replicating the inputs by perturbing the original data through resampling, was employed. The resampling was performed by randomly reorganizing the rows of the original time series such that some rows of the original data were present several times while other rows were removed. The final results were obtained by running the data for 1000 bootstrap replicates. The average values of these 1000 bootstrap replicates are listed in Fig. 3.
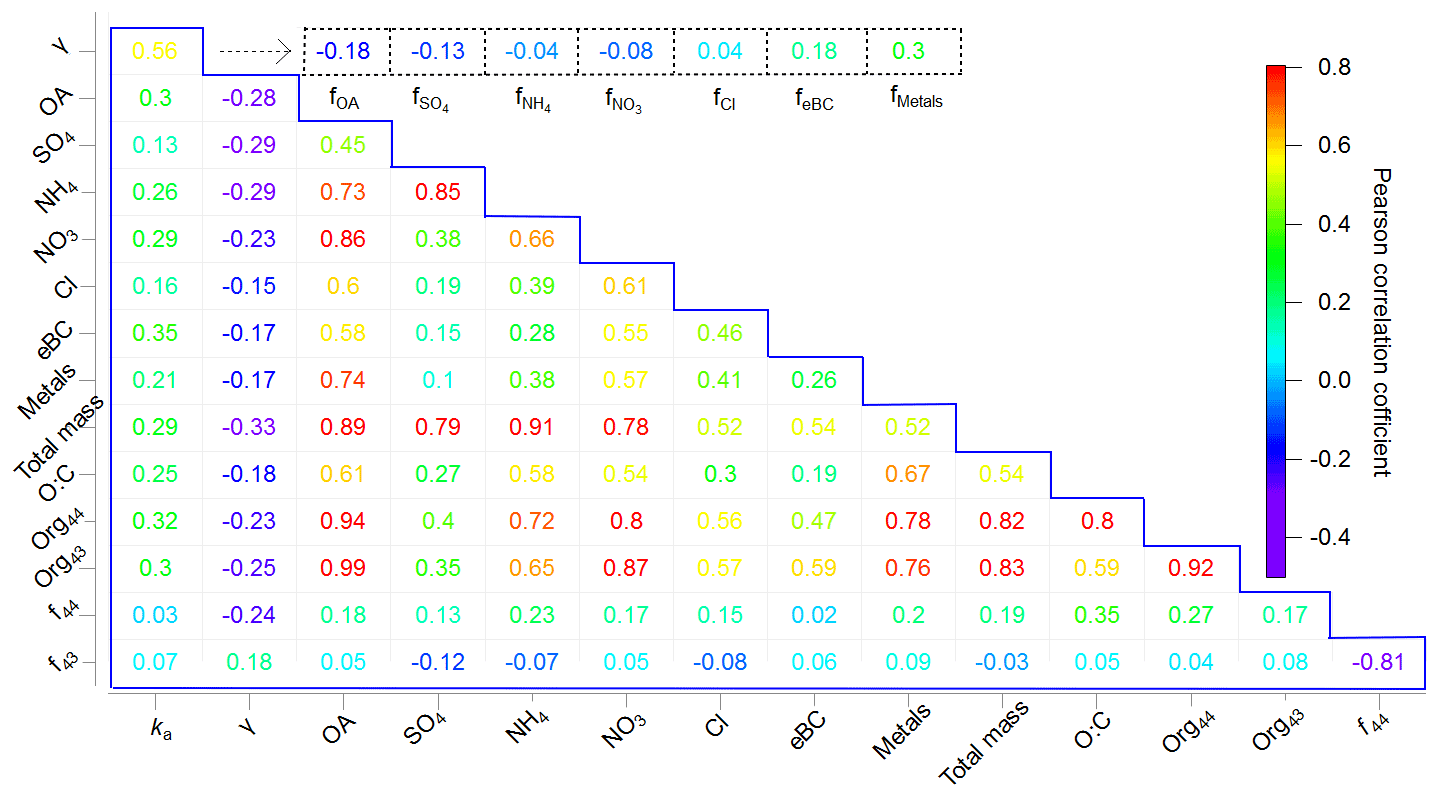
Figure 3Correlation matrix showing Pearson's r values for the chemical compositions, ka, and γ during the corresponding measurement periods (in the blue box) as well as Pearson's r values for the chemical composition fraction i (represented as fi, i= OA, SO, NH, NO, Cl−, eBC, and metals) and γ (in the dashed line box).
Most of the chemical components had strong or moderate Pearson correlations with each other (Fig. 3), although ka and γ showed only moderate correlations with each other (0.56). As γ can be correlated with the qualitative, rather than quantitative, properties of the aerosols, we further investigated Pearson's r values between the chemical composition fractions and γ. The results show that ka was positively correlated with total mass and the individual chemical components, whereas γ showed only a weak positive correlation with f metals (0.30) and feBC (0.18). According to previous studies, metals may act as a catalyst, thus accelerating the depletion of HO2 (Mao et al., 2013a), and BC can provide active sites or can be coated by other chemical components, thus facilitating the HO2 uptake (Bedjanian et al., 2005; Schwarz et al. (2008), as described in Sect. 3.2. The very weak correlation of γ with (0.04) may be related to Cl− chemistry: for example, HO2(g) can react with NaCl(g), produce NaOH and Cl2(g), and thus cause a decrease in the HO2 concentration and indirectly affect γ (Remorov et al., 2002). Interestingly, when considering the Org44 and Org43 fractions in total OA separately, γ is positively correlated with f43 (0.18) but negatively correlated with f44 (−0.24). This is consistent with the previous conclusion that more oxidized organic aerosols tend to be highly viscous and thus decrease HO2 uptake coefficients (Lakey et al., 2016b). In summary, γ was dominated by the free forms of transition metals that can act as catalysts of HO2 uptake onto ambient aerosols and was indirectly affected by chemical components that might alter the properties of ambient aerosols; e.g., oxygenated OA can cover the aerosol surface and alter the viscosity of ambient aerosols, thereby decreasing γ (Lakey et al., 2016a, b; Takami et al., 2013), whereas BC may provide active sites or be coated by other chemical components, thereby increasing γ. This is further confirmed by the classification of the air masses; i.e., the air mass from the ocean (group i), which contained less OA and more metals than that from mainland Japan (group ii), had a higher HO2 uptake capacity. We further compared the measured γ values with the modeled γ values using previously proposed mechanisms, as shown below.
3.3 Possible mechanism of HO2 uptake onto ambient aerosols
Two mechanisms of HO2 uptake onto aqueous ambient aerosols have been proposed, for which equations have been derived from a previous study (Thornton et al., 2008), (i) HO2-only chemistry and (ii) chemistry with transition metals playing a role. In this study, the liquid content of the total ambient aerosol mass ranged from 70 % to 88 %, as obtained from the ISORROPIA-II model. As the solubility of Fe is rather small in ambient aerosol, the reaction rates of for liquid-phase HO2 in aerosol are ∼ 100 times slower than they are for Cu, and thus the influence of Fe and Mn on HO2 uptake can be neglected compared to Cu or scaled as equivalent [Cu2+] (Fang et al., 2017; Hsu et al., 2010; Baker and Jickells, 2006; Oakes et al., 2012; Song et al., 2020); therefore, we use the soluble Cu as a surrogate for transition metals in ambient aerosols to assess their influence on γ. The Cu solute mass fraction in the liquid content of the ambient aerosols was estimated as (3.5–30) × 10−4 mol L−1 according to our offline filter test (Sect. 2.2), and to get the effective concentrations of Cu ions which can participate in the reaction of the destruction of peroxy radicals, the activity coefficient for total Cu was assumed to be 0.1 (upper limit) based on a study of (NH4)2SO4 particles at 68 % RH (Ross and Noone, 1991; Robinson and Stokes, 1970). Using copper ions as a surrogate metal for transition metal ions (TMIs), the potential HO2 loss onto aqueous ambient aerosols via mechanisms involving TMIs was estimated as (Hanson et al., 1994)
where is the mass accommodation coefficient of HO2, ω is the mean HO2 molecular speed (cm s−1), Heff is the effective Henry's law coefficient, R is the gas constant (J K−1 mol−1), and T is the temperature (K). kI is the pseudo-first-order rate constant equal to [TMI], where is the second-order rate constant for aqueous-phase reaction with HO2 O and TMI. Q′ accounts for aqueous-phase diffusion limitations and is expressed as
Table S1 shows more details of the parameters used for modeling. Previous laboratory studies suggest the mass accommodation coefficient for various single-component aerosols doped with Cu(II) is commonly >0.2 (Taketani et al., 2008, 2009; Mozurkewich et al., 1987; Thornton and Abbatt, 2005; George et al., 2013; Lakey et al., 2016a, b), and organics substantially reduce HO2 uptake onto aerosols containing TMI (Lakey et al., 2016b). Here we calculated γTMI with using Eq. (3), which are plotted in Fig. 4a along with the measured γ values; the much lower variation of the modeled values may be due to the low time resolution (∼ 2 d) of [Cu]. The measured γ values (∼ 0.23 on average) are significantly higher than the modeled γTMI with (∼ 0.16 on average), with calculated p<0.05 (t test), which may be due to the TMI contained in the ambient aerosol. However, when using the upper limit of the mass accommodation value for modeling (with ), the measured γ values are significantly lower than the modeled γTMI (averaged value: ∼ 0.50), these results indicating that the chemical components may be internally mixed, as proposed by Takami et al. (2013), which influences the aerosol surface tension and the activity of the free form of the copper ion (i.e., OA and BC) to constrain γTMI. We suggest that the additional collective effects of different chemical components on and the bulk reactions should be involved in the γTMI modeling to get accurate estimation. No linear correlation was found between γTMI and γ. Further classification of measured γ≥0.4 and γ<0.4 shows that γTMI has a weak correlation with measured γ values when γ≥0.4 (Fig. S7), which may be due to the higher fraction of metals in the total mass at measured γ≥0.4 (∼ 12 %) than at <0.4 (∼ 7 %); therefore, the impact of the other chemical components is much lower. The γ values obtained here are comparable with those in previous ambient aerosol studies (Taketani et al., 2008; Zhou et al., 2019b) (Fig. 5b). When compared with single-compound aerosols obtained from laboratory studies, γ values were generally higher than the HO2 uptake coefficients onto organic species (Lakey et al., 2015), soot particles (Bedjanian et al., 2005), and the dry state of inorganic aerosols (i.e., (NH4)2SO4, NaCl, and H2SO4) but comparable to or lower than aqueous and copper-doped aqueous phases of inorganic species (Fig. 4b) (George et al., 2013; Lakey et al., 2016b; Taketani et al., 2008; Thornton and Abbatt, 2005). This may indicate the collective effects of the individual chemical components of ambient aerosols on γ and the significant influence of RH on aerosol states of single-component particles and thus their HO2 uptake coefficients.
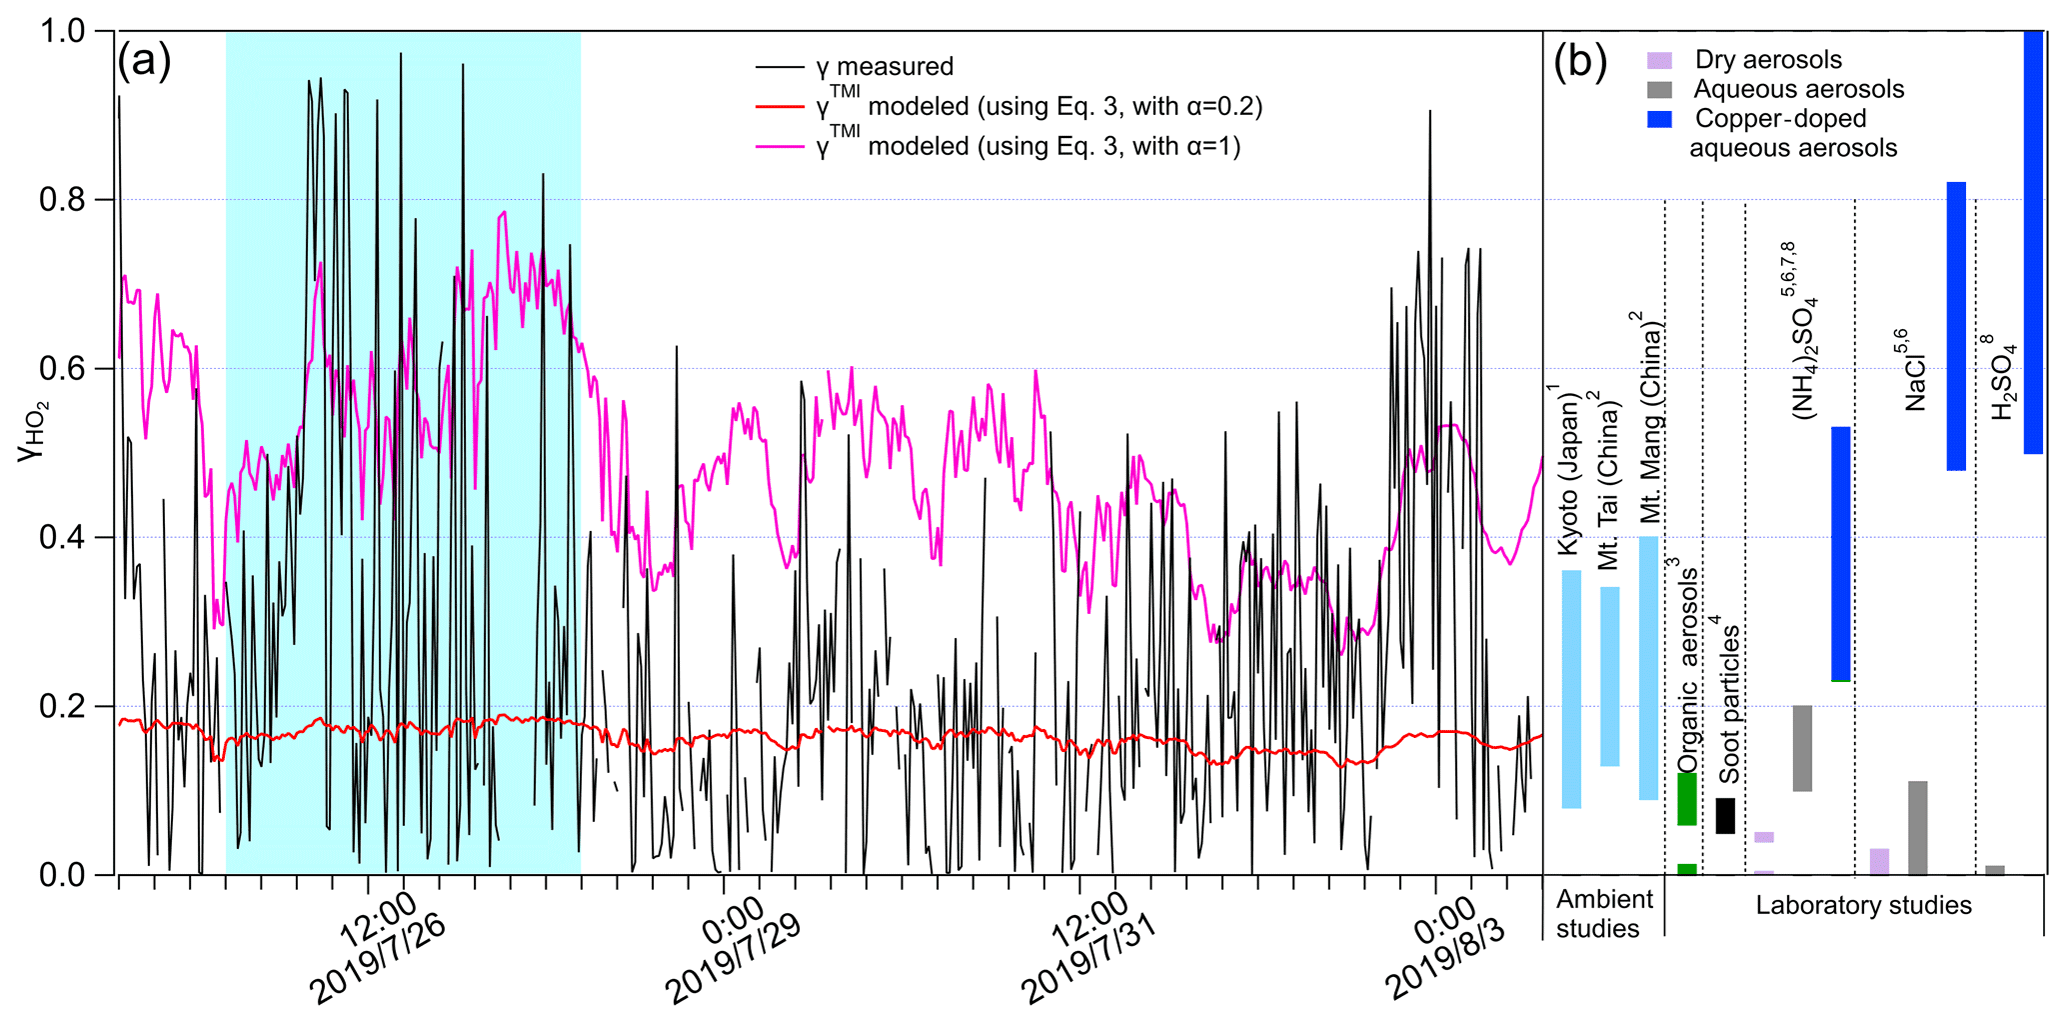
Figure 4(a) Measured and modeled γ values along with measurement time. The blue shaded area represents group i; the remaining areas represent group ii. (a) HO2 uptake coefficients onto different types of aerosol obtained from ambient and laboratory studies: the numbers indicate the related references from which the data were obtained: 1. Zhou et al. (2019b); 2. Taketani et al. (2012); 3. Lakey et al. (2015); 4. Bedjanian et al. (2005); 5. Taketani et al. (2008); 6. George et al. (2013); 7. Lakey et al. (2016b); 8. Thornton and Abbatt (2005).
Other studies have shown that γ is strongly negatively temperature dependent (Remorov et al., 2002; Mao et al., 2010; Cooper and Abbatt, 1996; Hanson et al., 1992; Thornton and Abbatt, 2005; Gershenzon et al., 1995). Here, RH and T were stabilized by the VACES–LFP–LIF system (in the reaction cell) as compared with those in ambient air (Fig. S8), and statistical analysis indicates the RH and T in the reaction cell were on average decreased by 3.3 % (t test, p<0.05, with inspection level = 0.05) and 2.3 ∘C (t test, p<0.05, with inspection level = 0.05) compared to that in ambient air, respectively, which is much smaller than the standard deviation of T and RH (which are ∼ 3.7 ∘C and 16.4 %, respectively) along with the measurement time. We noticed that ka and γ showed no dependence on RH and T in the reaction cell (see Fig. S9), indicating that the instantaneous change in RH and T may not be the dominating factor in terms of the variation of ka and γ with measurement time, and the stabilizations of RH and T by the VACES–LFP–LIF system have negligible effects on ka and γ. This suggests that the individual chemical components and physical properties of ambient aerosols may dominate γ variation during the field campaign; both the metal-catalyzed reactions and the chemical components and their states should be considered to yield more accurate γ values. Results obtained here are in accordance with previous results on correlations between particulate H2O2 (which can be formed by the uptake of HO2) and coarse particulate transition metals (Wang et al., 2010). Using an offline methodology to investigate the influence of RH and T by maintaining constant experimental conditions or chemical compositions will be the subject of future work.

Figure 5Temporal variations in (a) HO2 radical loss rates and (b) (red line) and the regime transition threshold (, black line) used to assess the ozone sensitivity regime. The gray shaded areas represent nighttime (from the National Astronomical Observatory of Japan) and are not discussed herein.
3.4 Influence of the physical properties of ambient aerosols on ka and γ
HO2 heterogeneous loss rates are driven by the different particle sizes of different aerosol types (i.e., urban ambient aerosols and marine aerosols) (Morita et al., 2004; Guo et al., 2019; Jacob, 2000). In this study, ka and γ showed no linear dependence on the mean ambient particle diameters (see Fig. S10). Identifying the fractional contributions of aerosols in different particle size ranges to ka and γ is highly desirable in terms of understanding their influence. However, it seems that high γ values (>0.8) occur when the surface area is cm2 cm−3 and the mean particle diameter is <110 nm. This is in accordance with a previous study showing that aerosols yield the highest fractional contribution to the total heterogeneous loss rate of HO2 radicals of size <0.1 µm (Morita et al., 2004) and that the mass accommodation process plays the determining role for small- and medium-sized aerosols in controlling HO2 uptake. Guo et al. (2019) state that the HO2 radicals experience less loss upon their diffusion into larger droplets than their diffusion into small droplets due to dilution effects making the larger aerosols have lower depleting species concentrations (Cu2+). However, this was based on the assumption that the total mass of Cu2+ is constant during the hygroscopic growth of particles, which is not always true in the ambient conditions. Further studies about Cu2+ content in particles with different sizes are needed to fully understand the result here.
3.5 Significance of ka to O3 formation potential
In the urban atmosphere, XO2 (=HO2 + RO2) fate is important to the photochemical production of ozone (P(O3)). Here, the loss rates of XO2 due to three factors were compared. (i) Uptake onto the ambient aerosols ( in Eq. 5); since no experiment or reference is available for RO2 uptake onto ambient particles, we assume that the RO2 reactivities caused by its interaction with ambient aerosols were the same as ka. (ii) XO2 self-reactions ( in Eq. 6). (iii) Reaction with NO ( in Eq. 7), which can produce NO2, a precursor of O3; therefore, Eq. (7) can also be regarded as P(O3).
where and are the second-order rate constants of HO2 self-reaction and its reaction with RO2, respectively. is the second-order rate constant of the reaction of HO2 with NO. The HO2 concentration was estimated from O3 concentration using the method described by Kanaya et al. (2007a). The RO2 concentration is then estimated by assuming a steady state of HO2 in the HOx cycle; the reaction rates of HO2 radicals are approximated as 0:
where kCO−OH and are the second-order rate constants of the reactions of CO and H2CO with OH, respectively. The different XO2 loss rates described in Eqs. (5)–(7), along with the measurement times, are shown in Fig. 5a. Generally, is much greater than , indicating that the XO2 taken up by ambient aerosols will compete with the XO2 self-reaction, thus influencing XO2 concentration. However, such an influence may have a negligible impact on P(O3) because is tens of thousands of times lower than owing to the relatively high NOx concentration at Yokohama. We further tested the impact of on the ozone formation sensitivity regime, according to the method proposed by Sakamoto et al. (2019), in which is used as a new indicator:
where kOH−VOCs and are the second-order rate constants of the reactions of OH with VOCs and NO2, respectively. is the second-order rate constant of the reaction of NO with HO2. α′ is the proportion of RO2 in XO2. LN is the OH radical loss rate through its reaction with NO2 (= ), and Q is the total loss of the HOx radicals in the HOx cycle reaction (). The regime transition point can be expressed as
where ). The results indicate that both and (calculated with and without including in Eq. 9, respectively) were higher than , indicating that ozone formation was VOC sensitive throughout the campaign and that the aerosol uptake of XO2 (ka') showed no impact on the O3 formation regime (see Fig. 5; here we only consider the daytime, when photochemical reactions occur). The plots of and as a function of NO concentration show the values were closer to (∼ 0.4) at lower NO concentrations (Fig. S11); therefore, aerosol uptake may play a more important role in the O3 formation regime at NO levels lower than those observed in this study. The temporal variations in key factors used in this section are shown in Fig. S12.
This study used a reliable online methodology to investigate HO2 uptake kinetics onto in situ ambient aerosols (i.e., HO2 reactivity of ambient aerosols ka and HO2 uptake coefficients γ) and discussed the impacting factors on such processes, i.e., chemical compositions and physical properties of ambient aerosols and experimental conditions. ka ranged between 0.001 s−1 (25th percentile) and 0.005 s−1 (75th percentile), with an average value of 0.005 ± 0.005 s−1. The corresponding γ ranging from 0.05 (25th percentile) to 0.33 (75th percentile), with a median value of 0.19 and an average value of 0.23 ± 0.21, is comparable with previous measured (∼ 0.24–0.25) (Zhou et al., 2019b; Taketani et al., 2012) and modeled (∼ 0.20) values (Stadtler et al., 2018; Jacob, 2000). However, the ka and γ values obtained here are considered to be the lower-limit values for real ambient aerosols, as the coarse particles were not measured in this study. We noticed that ka and γ showed no dependence on RH and T in the reaction cell in this study, indicating that the instantaneous changes in RH and T may not be dominating factors in terms of the variation of ka and γ with measurement time, and the large standard deviation of the γ values along with the measurement time (± 0.21, 1σ) may be due to the instantaneously changed chemical and physical properties of ambient aerosols; a large bias may exist if a constant γ value is used for modeling.
We found that the individual chemical components of ambient aerosols may have collective effects on γ through the analyses of (1) separating the air masses into two groups, group i from the ocean and group ii from mainland Japan; (2) the average diurnal patterns; (3) the correlation matrix analysis of each individual chemical component of ambient aerosol with ka and γ; and (4) the modeling studies using previously proposed mechanisms. All these efforts clearly indicate that the transition metals contained in ambient aerosols may act as a catalyst, thus accelerating the depletion of HO2; however, they can be chelated by OA. OA can also cover the aerosol surface and alter the viscosity of ambient aerosols, thereby decreasing γ, and more oxidized organic aerosols tend to be highly viscous, thus decreasing HO2 uptake coefficients. Results obtained here are in accordance with previous laboratory and modeling studies (Mao et al., 2013a; Lakey et al., 2016, b; Takami et al., 2013; Thornton et al., 2008; Hanson et al., 1994). The chemical components of ambient aerosols may be internally mixed, as proposed by Takami et al. (2013), which influences the aerosol surface tension and the activity of the free form of the copper ion (i.e., OA and BC) to constrain γ. In contrast to previous studies saying that BC may shrink HO2 losses onto ambient aerosols (Saathoff et al., 2001; Macintyre and Evans, 2011; Bedjanian et al., 2005), we found BC positively correlated with HO2 uptake coefficients (0.18); this may be due to BC being able to provide active sites or being coated by other chemical components, thus facilitating the physical uptake of HO2. Here, we observed higher γ values (>0.8) when the mean particle diameter is <110 nm, identifying the fractional contributions of aerosols in different particle size ranges to ka and γ as highly desirable in terms of understanding their influence.
In summary, the chemical components and physical properties of ambient aerosols may dominate γ variation during the field campaign; to yield a more accurate γ value, total suspended particles in ambient air should be measured, and the metal-catalyzed reactions, chemical components, and aerosol states should be considered. Also, improvements to the time resolution of metal measurements are needed for more precise analysis. For more detailed investigation of HO2 uptake mechanisms, an offline methodology that can maintain constant chemical compositions and experimental conditions (such as RH and T) will be useful. The HO2 loss onto ambient aerosols was identified as having a negligible impact on the O3 production rate and formation regime owing to the high NOx concentrations at Yokohama. This process may play a more important role in O3 formation under low NOx concentrations and high aerosol loading conditions. The results help us to understand the impacts of HO2 uptake kinetics on chemical transformations in the troposphere.
Supporting information for this paper is listed as the Supplement showing air mass arriving directions (Fig. S1), measurement strategy (Fig. S2), a technique combining laser-flash photolysis with laser-induced fluorescence (LFP–LIF), the enrichment of the ambient aerosols, HO2 reactivity of ambient air, correction of gas-phase diffusion for the HO2 uptake coefficient, HO2 reactivity of ambient gas phase (kg), examples of HO2 decay profiles (Fig. S3), HO2 reactivity calibration with different NO2 concentrations (Fig. S4), diurnal trends in individual chemical components of ambient aerosols (Fig. S5), diurnal trends in ka and γ (Fig. S6), correlations between measured and modeled γ (Fig. S7), time series of the averaged RH and T in ambient air and the reaction cell (Fig. S8), dependence of ka and γ on RH and T in the reaction cell (Fig. S9), dependence of ka and γ on mean particle diameter (Fig. S10), dependence of daytime and on [NO] (Fig. S11), profiles of key factors determining XO2 loss rates and P(O3) sensitivity (Fig. S12), summary of equations and values used for γ modeling (Table S1), summary of equations and values used for XO2 (= HO2 + RO2) loss and O3 formation sensitivity regime analysis (Table S1).
Data supporting this publication are available upon request to the corresponding author (junzhou@jnu.edu.cn).
The supplement related to this article is available online at: https://doi.org/10.5194/acp-21-12243-2021-supplement.
JZ, KM, YS, and YoK designed the experiments and JZ and YB carried them out. JZ did the data analysis and prepared the manuscript with contributions from all the co-authors.
The authors declare that they have no conflict of interest.
Publisher's note: Copernicus Publications remains neutral with regard to jurisdictional claims in published maps and institutional affiliations.
This work was supported by the Key-Area Research and Development Program of Guangdong Province (2020B1111360003) and the Japan Society for the Promotion of Science (JSPS) KAKENHI grant nos. JP16H06305 and JP19H04255. Many thanks to the Yokohama Environmental Science Research Institute during the campaign.
This research has been supported by the Key-Area Research and Development Program of Guangdong Province (grant no. 2020B1111360003) and the Japan Society for the Promotion of Science (grant nos. JP16H0630 and JP19H04255).
This paper was edited by James Roberts and reviewed by two anonymous referees.
Baker, A. R. and Jickells, T. D.: Mineral particle size as a control on aerosol iron solubility, Geophys. Res. Lett., 33, L17608, https://doi.org/10.1029/2006GL026557, 2006.
Bertram, A. K., Martin, S. T., Hanna, S. J., Smith, M. L., Bodsworth, A., Chen, Q., Kuwata, M., Liu, A., You, Y., and Zorn, S. R.: Predicting the relative humidities of liquid-liquid phase separation, efflorescence, and deliquescence of mixed particles of ammonium sulfate, organic material, and water using the organic-to-sulfate mass ratio of the particle and the oxygen-to-carbon elemental ratio of the organic component, Atmos. Chem. Phys., 11, 10995–11006, https://doi.org/10.5194/acp-11-10995-2011, 2011.
Bedjanian, Y., Lelièvre, S., and Le Bras, G.: Experimental study of the interaction of HO2 radicals with soot surface, Phys. Chem. Chem. Phys., 7, 334–341, https://doi.org/10.1039/B414217A, 2005.
Chen, G., Davis, D., Crawford, J., Heikes, B., O'Sullivan, D., Lee, M., Eisele, F., Mauldin, L., Tanner, D., Collins, J., Barrick, J., Anderson, B., Blake, D., Bradshaw, J., Sandholm, S., Carroll, M., Albercook, G., and Clarke, A.: An assessment of HOx chemistry in the tropical pacific boundary layer: comparison of model simulations with observations recorded during PEM Tropics A, J. Atmos. Chem., 38, 317–344, https://doi.org/10.1023/A:1006402626288, 2001.
Cooper, P. L. and Abbatt, J. P. D.: Heterogeneous Interactions of OH and HO2 Radicals with surfaces characteristic of atmospheric particulate matter, J. Phys. Chem., 100, 2249–2254, https://doi.org/10.1021/jp952142z, 1996.
Creasey, D. J., Halford-Maw, P. A., Heard, D. E., Pilling, M. J., and Whitaker, B. J.: Implementation and initial deployment of a field instrument for measurement of OH and HO2 in the troposphere by laser-induced fluorescence, J. Chem. Soc. Faraday Trans. 93, 2907–2913, https://doi.org/10.1039/A701469D, 1997.
DeCarlo, P. F., Kimmel, J. R., Trimborn, A., Northway, M. J., Jayne, J. T., Aiken, A. C., Gonin, M., Fuhrer, K., Horvath, T., Docherty, K. S., Worsnop, D. R., and Jimenez, J. L.: Field-Deployable, High-Resolution, Time-of-Flight Aerosol Mass Spectrometer, Anal. Chem. 78, 8281–8289, https://doi.org/10.1021/ac061249n, 2006.
Drinovec, L., Močnik, G., Zotter, P., Prévôt, A. S. H., Ruckstuhl, C., Coz, E., Rupakheti, M., Sciare, J., Müller, T., Wiedensohler, A., and Hansen, A. D. A.: The “dual-spot” Aethalometer: an improved measurement of aerosol black carbon with real-time loading compensation, Atmos. Meas. Tech., 8, 1965–1979, https://doi.org/10.5194/amt-8-1965-2015, 2015.
Fang, T., Guo, H., Zeng, L., Verma, V., Nenes, A., and Weber, R. J.: Highly acidic ambient particles, soluble metals, and oxidative potential: a link between sulfate and aerosol toxicity, Environ. Sci. Technol., 51, 2611–2620, https://doi.org/10.1021/acs.est.6b06151, 2017.
Finlayson-Pitts, B. J. and Pitts, J. N.: CHAPTER 7 – Chemistry of inorganic nitrogen compounds, in: chemistry of the upper and lower atmosphere, edited by: Finlayson-Pitts, B. J. and Pitts, J. N., Academic Press, San Diego, 264–293, 2000.
Fountoukis, C. and Nenes, A.: ISORROPIA II: a computationally efficient thermodynamic equilibrium model for K+-Ca2+-Mg2+-NH-Na+-SO-NO-Cl−-H2O aerosols, Atmos. Chem. Phys., 7, 4639–4659, https://doi.org/10.5194/acp-7-4639-2007, 2007.
George, I. J. and Abbatt, J. P.: Heterogeneous oxidation of atmospheric aerosol particles by gas-phase radicals, Nat. Chem., 2, 713–722, https://doi.org/10.1038/nchem.806, 2010.
George, I. J., Matthews, P. S. J., Whalley, L. K., Brooks, B., Goddard, A., Baeza-Romero, M. T., and Heard, D. E.: Measurements of uptake coefficients for heterogeneous loss of HO2 onto submicron inorganic salt aerosols, Phys. Chem. Chem. Phys., 15, 12829–12845, https://doi.org/10.1039/C3CP51831K, 2013.
Gershenzon, Y. M., Grigorieva, V. M., Ivanov, A. V., and Remorov, R. G.: O3 and OH Sensitivity to heterogeneous sinks of HO and CH3O2 on aerosol particles, Faraday Discuss., 100, 83–100, https://doi.org/10.1039/FD9950000083, 1995.
Gonzalez, J., Torrent-Sucarrat, M., and Anglada, J. M.: The reactions of SO3 with HO2 radical and H2OHO2 radical complex. Theoretical study on the atmospheric formation of HSO5 and H2SO4, Phys. Chem. Chem. Phys., 12, 2116–2125, https://doi.org/10.1039/B916659A, 2010.
González Palacios, L., Corral Arroyo, P., Aregahegn, K. Z., Steimer, S. S., Bartels-Rausch, T., Nozière, B., Guieu, C., Chester, R., Nimmo, M., Martin, J. M., Guerzoni, S., Nicolas, E., Mateu, J., and Keyse, S.: Atmospheric input of dissolved and particulate metals to the northwestern Mediterranean, Deep Sea Res., 44, 655–674, https://doi.org/10.1016/S0967-0645(97)88508-6, 1997.
González Palacios, L., Corral Arroyo, P., Aregahegn, K. Z., Steimer, S. S., Bartels-Rausch, T., Nozière, B., George, C., Ammann, M., and Volkamer, R.: Heterogeneous photochemistry of imidazole-2-carboxaldehyde: HO2 radical formation and aerosol growth, Atmos. Chem. Phys., 16, 11823–11836, https://doi.org/10.5194/acp-16-11823-2016, 2016.
Guo, J., Tilgner, A., Yeung, C., Wang, Z., Louie, P. K. K., Luk, C. W. Y., Xu, Z., Yuan, C., Gao, Y., Poon, S., Herrmann, H., Lee, S., Lam, K. S., and Wang, T.: Atmospheric peroxides in a polluted subtropical environment: seasonal variation, sources and sinks, and importance of heterogeneous processes, Environ. Sci. Technol., 48, 1443–1450, https://doi.org/10.1021/es403229x, 2014.
Guo, J., Wang, Z., Tao, W., and Zhang, X.: Theoretical evaluation of different factors affecting the HO2 uptake coefficient driven by aqueous-phase first-order loss reaction, Sci. Total Environ., 683, 146–153, https://doi.org/10.1016/j.scitotenv.2019.05.237, 2019.
Halstead, M. J. R., Cunninghame, R. G., and Hunter, K. A.: Wet deposition of trace metals to a remote site in Fiordland, New Zealand, Atmos. Environ., 34, 665–676, https://doi.org/10.1016/S1352-2310(99)00185-5, 2000.
Hanson, D. R., Burkholder, J. B., Howard, C. J., and Ravishankara, A. R.: Measurement of hydroxyl and hydroperoxy radical uptake coefficients on water and sulfuric acid surfaces, J. Phys. Chem., 96, 4979–4985, https://doi.org/10.1021/j100191a046, 1992.
Hanson, D. R., Ravishankara, A. R., and Solomon, S.: Heterogeneous reactions in sulfuric acid aerosols: A framework for model calculations, J. Geophys. Res.-Atmos., 99, 3615–3629, https://doi.org/10.1029/93jd02932, 1994.
Heard, D. E. and Pilling, M. J.: Measurement of OH and HO2 in the Troposphere, Chem. Rev., 103, 5163–5198, https://doi.org/10.1021/cr020522s, 2003.
Hennigan, C. J., Izumi, J., Sullivan, A. P., Weber, R. J., and Nenes, A.: A critical evaluation of proxy methods used to estimate the acidity of atmospheric particles, Atmos. Chem. Phys., 15, 2775–2790, https://doi.org/10.5194/acp-15-2775-2015, 2015.
Hofmann, H., Hoffmann, P., and Lieser, K. H.: Transition metals in atmospheric aqueous samples, analytical determination and speciation, Fresen. J. Anal. Chem., 340, 591–597, https://doi.org/10.1007/BF00322435, 1991.
Hsu, S.-C., Wong, G. T. F., Gong, G.-C., Shiah, F.-K., Huang, Y.-T., Kao, S.-J., Tsai, F., Candice Lung, S.-C., Lin, F.-J., Lin, I. I., Hung, C.-C., and Tseng, C.-M.: Sources, solubility, and dry deposition of aerosol trace elements over the East China Sea, Mar. Chem. 120, 116–127, https://doi.org/10.1016/j.marchem.200810.003, 2010.
George, I. J., Slowik, J., and Abbatt, J.: Chemical aging of ambient organic aerosol from heterogeneous reaction with hydroxyl radicals, Geophys. Res. Lett., 35, L13811, https://doi.org/10.1029/2008GL033884, 2008.
Jacob, D. J.: Heterogeneous chemistry and tropospheric ozone, Atmos. Environ., 34, 2131–2159, https://doi.org/10.1016/S1352-2310(99)00462-8, 2000.
Jaeglé, L., Jacob, D. J., Brune, W. H., Faloona, I., Tan, D., Heikes, B. G., Kondo, Y., Sachse, G. W., Anderson, B., Gregory, G. L., Singh, H. B., Pueschel, R., Ferry, G., Blake, D. R., and Shetter, R. E.: Photochemistry of HOx in the upper troposphere at northern midlatitudes, J. Geophys. Res.-Atmos., 105, 3877–3892, https://doi.org/10.1029/1999JD901016, 2000.
Kanaya, Y., Cao, R., Akimoto, H., Fukuda, M., Komazaki, Y., Yokouchi, Y., Koike, M., Tanimoto, H., Takegawa, N., and Kondo, Y.: Urban photochemistry in central Tokyo: 1. Observed and modeled OH and HO2 radical concentrations during the winter and summer of 2004, J. Geophys. Res.-Atmos., 112, D21312, https://doi.org/10.1029/2007jd008670, 2007a.
Kanaya, Y., Cao, R., Kato, S., Miyakawa, Y., Kajii, Y., Tanimoto, H., Yokouchi, Y., Mochida, M., Kawamura, K., and Akimoto, H.: Chemistry of OH and HO2 radicals observed at Rishiri Island, Japan, in September 2003: Missing daytime sink of HO2 and positive nighttime correlations with monoterpenes, J. Geophys. Res.-Atmos., 112, D11308, https://doi.org/10.1029/2006jd007987, 2007b.
Lakey, P. S. J., George, I. J., Whalley, L. K., Baeza-Romero, M. T., and Heard, D. E.: Measurements of the HO2 uptake coefficients onto single component organic aerosols, Environ. Sci. Technol., 49, 4878–4885, https://doi.org/10.1021/acs.est.5b00948, 2015.
Lakey, P. S. J., Berkemeier, T., Krapf, M., Dommen, J., Steimer, S. S., Whalley, L. K., Ingham, T., Baeza-Romero, M. T., Pöschl, U., Shiraiwa, M., Ammann, M., and Heard, D. E.: The effect of viscosity and diffusion on the HO2 uptake by sucrose and secondary organic aerosol particles, Atmos. Chem. Phys., 16, 13035–13047, https://doi.org/10.5194/acp-16-13035-2016, 2016a.
Lakey, P. S. J., George, I. J., Baeza-Romero, M. T., Whalley, L. K., and Heard, D. E.: Organics substantially reduce HO2 uptake onto aerosols containing transition metal ions, J. Phys. Chem. A, 120, 1421–1430, https://doi.org/10.1021/acs.jpca.5b06316, 2016b.
Logan, J. A., Prather, M. J., Wofsy, S. C., and McElroy, M. B.: Tropospheric chemistry: A global perspective, 86, 7210–7254, https://doi.org/10.1029/JC086iC08p07210, 1981.
Loukhovitskaya, E., Bedjanian, Y., Morozov, I., and Le Bras, G.: Laboratory study of the interaction of HO2 radicals with the NaCl, NaBr, MgCl2⋅6H2O and sea salt surfaces, Phys. Chem. Chem. Phys., 11, 7896–7905, https://doi.org/10.1039/B906300E, 2009.
Macintyre, H. L. and Evans, M. J.: Parameterisation and impact of aerosol uptake of HO2 on a global tropospheric model, Atmos. Chem. Phys., 11, 10965–10974, https://doi.org/10.5194/acp-11-10965-2011, 2011.
Manoj, S. V., Mishra, C. D., Sharma, M., Rani, A., Jain, R., Bansal, S. P., and Gupta, K. S.: Iron, manganese and copper concentrations in wet precipitations and kinetics of the oxidation of SO2 in rain water at two urban sites, Jaipur and Kota, in Western India, Atmos. Environ., 34, 4479–4486, https://doi.org/10.1016/S1352-2310(00)00117-5, 2000.
Mao, J., Jacob, D. J., Evans, M. J., Olson, J. R., Ren, X., Brune, W. H., Clair, J. M. St., Crounse, J. D., Spencer, K. M., Beaver, M. R., Wennberg, P. O., Cubison, M. J., Jimenez, J. L., Fried, A., Weibring, P., Walega, J. G., Hall, S. R., Weinheimer, A. J., Cohen, R. C., Chen, G., Crawford, J. H., McNaughton, C., Clarke, A. D., Jaeglé, L., Fisher, J. A., Yantosca, R. M., Le Sager, P., and Carouge, C.: Chemistry of hydrogen oxide radicals (HOx) in the Arctic troposphere in spring, Atmos. Chem. Phys., 10, 5823–5838, https://doi.org/10.5194/acp-10-5823-2010, 2010.
Mao, J., Fan, S., Jacob, D. J., and Travis, K. R.: Radical loss in the atmosphere from Cu-Fe redox coupling in aerosols, Atmos. Chem. Phys., 13, 509–519, https://doi.org/10.5194/acp-13-509-2013, 2013a.
Mao, J., Paulot, F., Jacob, D. J., Cohen, R. C., Crounse, J. D., Wennberg, P. O., Keller, C. A., Hudman, R. C., Barkley, M. P., and Horowitz, L. W.: Ozone and organic nitrates over the eastern United States: Sensitivity to isoprene chemistry, J. Geophys. Res.-Atmos., 118, 11256–211268, https://doi.org/10.1002/jgrd.50817, 2013b.
Martínez, M., Harder, H., Kovacs, T. A., Simpas, J. B., Bassis, J., Lesher, R. L., Brune, W., Frost, G., Williams, E., Stroud, C., Jobson, B., Roberts, J. M., Hall, S., Shetter, R., Wert, B. P., Fried, A., Alicke, B., Stutz, J., Young, V., White, A., and Zamora, R. J.: OH and HO2 concentrations, sources, and loss rates during the Southern Oxidants Study in Nashville, Tennessee, summer 1999, J. Geophys. Res.-Atmos., 108, 4617, https://doi.org/10.1029/2003JD003551, 2003.
Matthews, P. S. J., Baeza-Romero, M. T., Whalley, L. K., and Heard, D. E.: Uptake of HO2 radicals onto Arizona test dust particles using an aerosol flow tube, Atmos. Chem. Phys., 14, 7397–7408, https://doi.org/10.5194/acp-14-7397-2014, 2014.
Millán, L., Wang, S., Livesey, N., Kinnison, D., Sagawa, H., and Kasai, Y.: Stratospheric and mesospheric HO2 observations from the Aura Microwave Limb Sounder, Atmos. Chem. Phys., 15, 2889–2902, https://doi.org/10.5194/acp-15-2889-2015, 2015.
Miyazaki, K., Nakashima, Y., Schoemaecker, C., Fittschen, C., and Kajii, Y.: Note: A laser-flash photolysis and laser-induced fluorescence detection technique for measuring total HO2 reactivity in ambient air, Rev. Sci. Instrum., 84, 076106, https://doi.org/10.1063/1.4812634, 2013.
Morita, A., Kanaya, Y., and Francisco, J. S.: Uptake of the HO2 radical by water: Molecular dynamics calculations and their implications for atmospheric modeling, J. Geophys. Res.-Atmos., 109, D09201, https://doi.org/10.1029/2003jd004240, 2004.
Mozurkewich, M., McMurry, P. H., Gupta, A., and Calvert, J. G.: Mass accommodation coefficient for HO2 radicals on aqueous particles, J. Geophys. Res.-Atmos., 92, 4163–4170, https://doi.org/10.1029/JD092iD04p04163, 1987.
Nakayama, T., Matsumi, Y., Kawahito, K., Watabe, Y.: Development and evaluation of a palm-sized optical PM2.5 sensor. Aerosol Sci. Technol., 52, 2–12, https://doi.org/10.1080/02786826.2017.1375078,2018.
Ng, N. L., Canagaratna, M. R., Jimenez, J. L., Chhabra, P. S., Seinfeld, J. H., and Worsnop, D. R.: Changes in organic aerosol composition with aging inferred from aerosol mass spectra, Atmos. Chem. Phys., 11, 6465–6474, https://doi.org/10.5194/acp-11-6465-2011, 2011.
Oakes, M., Weber, R. J., Lai, B., Russell, A., and Ingall, E. D.: Characterization of iron speciation in urban and rural single particles using XANES spectroscopy and micro X-ray fluorescence measurements: investigating the relationship between speciation and fractional iron solubility, Atmos. Chem. Phys., 12, 745–756, https://doi.org/10.5194/acp-12-745-2012, 2012.
Remorov, R. G., Gershenzon, Y. M., Molina, L. T., and Molina, M. J.: Kinetics and mechanism of HO2 uptake on solid NaCl, J. Phys. Chem. A, 106, 4558–4565, https://doi.org/10.1021/jp013179o, 2002.
Robinson, R. A., Stokes, R. H., and Marsh, K. N.: Activity coefficients in the ternary system: water + sucrose + sodium chloride, J. Chem. Thermodyn., 2, 745–750, https://doi.org/10.1016/0021-9614(70)90050-9, 1970.
Ross, H. B. and Noone, K. J.: A numerical investigation of the destruction of peroxy radical by Cu ion catalysed reactions on atmospheric particles, J. Atmos. Chem., 12, 121–136, https://doi.org/10.1007/BF00115775, 1991.
Saathoff, H., Naumann, K.-H., Riemer, N., Kamm, S., Möhler, O., Schurath, U., Vogel, H., and Vogel, B.: The loss of NO2, HNO3, NO3/N2O5, and HO2/HOONO2 on soot aerosol: A chamber and modeling study, Geophys. Res. Lett., 28, 1957–1960, https://doi.org/10.1029/2000gl012619, 2001.
Sadanaga, Y., Yoshino, A., Watanabe, K., Yoshioka, A., Wakazono, Y., Kanaya, Y., and Kajii, Y.: Development of a measurement system of OH reactivity in the atmosphere by using a laser-induced pump and probe technique, Rev. Sci. Instrum., 75, 2648–2655, https://doi.org/10.1063/1.1775311, 2004.
Sakamoto, Y., Zhou, J., Kohno, N., Nakagawa, M., Hirokawa, J., and Kajii, Y.: Kinetics study of OH uptake onto deliquesced NaCl particles by combining Laser Photolysis and Laser-Induced Fluorescence, J. Phys. Chem. Lett., 9, 4115–4119, https://doi.org/10.1021/acs.jpclett.8b01725, 2018.
Sakamoto, Y., Sadanaga, Y., Li, J., Matsuoka, K., Takemura, M., Fujii, T., Nakagawa, M., Kohno, N., Nakashima, Y., Sato, K., Nakayama, T., Kato, S., Takami, A., Yoshino, A., Murano, K., and Kajii, Y.: Relative and absolute sensitivity analysis on ozone production in Tsukuba, a city in Japan, Environ. Sci. Technol., 53, 13629–13635, https://doi.org/10.1021/acs.est.9b03542, 2019.
Schwarz, J. P., Spackman, J. R., Fahey, D. W., Gao, R. S., Lohmann, U., Stier, P., Watts, L. A., Thomson, D. S., Lack, D. A., Pfister, L., Mahoney, M. J., Baumgardner, D., Wilson, J. C., and Reeves, J. M.: Coatings and their enhancement of black carbon light absorption in the tropical atmosphere, J. Geophys. Res.-Atmos., 113, https://doi.org/10.1029/2007JD009042, 2008.
Sedlak, D. L., and Hoigné, J.: The role of copper and oxalate in the redox cycling of iron in atmospheric waters, Atmos. Environ., 27, 2173–2185, https://doi.org/10.1016/0960-1686(93)90047-3, 1993.
Siefert, R. L., Johansen, A. M., Hoffmann, M. R., and Pehkonen, S. O.: Measurements of trace metal (Fe, Cu, Mn, Cr) oxidation states in fog and stratus clouds, J. Air Waste Manage., 48, 128–143, https://doi.org/10.1080/10473289.1998.10463659, 1998.
Sioutas, C., Kim, S., Chang, M.: Development and evaluation of a prototype ultrafine particle concentrator, J. Aerosol Sci., 30, 1001–1017, https://doi.org/10.1016/S0021-8502(98)00769-1, 1999.
Sommariva, R., Haggerstone, A.-L., Carpenter, L. J., Carslaw, N., Creasey, D. J., Heard, D. E., Lee, J. D., Lewis, A. C., Pilling, M. J., and Zádor, J.: OH and HO2 chemistry in clean marine air during SOAPEX-2, Atmos. Chem. Phys., 4, 839–856, https://doi.org/10.5194/acp-4-839-2004, 2004.
Song, H., Chen, X., Lu, K., Zou, Q., Tan, Z., Fuchs, H., Wiedensohler, A., Moon, D. R., Heard, D. E., Baeza-Romero, M.-T., Zheng, M., Wahner, A., Kiendler-Scharr, A., and Zhang, Y.: Influence of aerosol copper on HO2 uptake: a novel parameterized equation, Atmos. Chem. Phys., 20, 15835–15850, https://doi.org/10.5194/acp-20-15835-2020, 2020.
Stadtler, S., Simpson, D., Schröder, S., Taraborrelli, D., Bott, A., and Schultz, M.: Ozone impacts of gas–aerosol uptake in global chemistry transport models, Atmos. Chem. Phys., 18, 3147–3171, https://doi.org/10.5194/acp-18-3147-2018, 2018.
Stone, D., Whalley, L. K., and Heard, D. E.: Tropospheric OH and HO2 radicals: field measurements and model comparisons, Chem. Soc. Rev., 41, 6348–6404, https://doi.org/10.1039/C2CS35140D, 2012.
Takami, A., Mayama, N., Sakamoto, T., Ohishi, K., Irei, S., Yoshino, A., Hatakeyama, S., Murano, K., Sadanaga, Y., Bandow, H., Misawa, K., and Fujii, M.: Structural analysis of aerosol particles by microscopic observation using a time-of-flight secondary ion mass spectrometer, J. Geophys. Res.-Atmos., 118, 6726–6737, https://doi.org/10.1002/jgrd.50477, 2013.
Taketani, F., Kanaya, Y., and Akimoto, H.: Kinetics of heterogeneous reactions of HO2 radical at ambient concentration levels with (NH4)2SO4 and NaCl aerosol particles, J. Phys. Chem. A, 112, 2370–2377, https://doi.org/10.1021/jp0769936, 2008.
Taketani, F., Kanaya, Y., and Akimoto, H.: Heterogeneous loss of HO2 by KCl, synthetic sea salt, and natural seawater aerosol particles. Atmos. Environ., 43, 1660–1665, 2009.
Taketani, F., Kanaya, Y., Pochanart, P., Liu, Y., Li, J., Okuzawa, K., Kawamura, K., Wang, Z., and Akimoto, H.: Measurement of overall uptake coefficients for HO2 radicals by aerosol particles sampled from ambient air at Mts. Tai and Mang (China), Atmos. Chem. Phys., 12, 11907–11916, https://doi.org/10.5194/acp-12-11907-2012, 2012.
Thornton, J. and Abbatt, J. P. D.: Measurements of HO2 uptake to aqueous aerosol: Mass accommodation coefficients and net reactive loss, J. Geophys. Res.-Atmos., 110, D08309, https://doi.org/10.1029/2004jd005402, 2005.
Thornton, J. A., Jaeglé, L., and McNeill, V. F.: Assessing known pathways for HO2 loss in aqueous atmospheric aerosols: Regional and global impacts on tropospheric oxidants, J. Geophys. Res.-Atmos., 113, D05303, https://doi.org/10.1029/2007jd009236, 2008.
Tie, X., Brasseur, G., Emmons, L., Horowitz, L., and Kinnison, D.: Effects of aerosols on tropospheric oxidants: A global model study, J. Geophys. Res.-Atmos., 106, 22931–22964, https://doi.org/10.1029/2001JD900206, 2001.
Wang, Y., Arellanes, C., Curtis, D. B., and Paulson, S. E.: Probing the source of hydrogen peroxide associated with coarse mode aerosol particles in southern california, Environ. Sci. Technol., 44, 4070–4075, https://doi.org/10.1021/es100593k, 2010.
Wang, D., Pakbin, P., Saffari, A., Shafer, M. M., Schauer, J. J., and Sioutas, C.: Development and evaluation of a high-volume aerosol-into-liquid collector for fine and ultrafine particulate matter, Aerosol Sci. Technol., 47, 1226–1238, https://doi.org/10.1080/02786826.2013.830693, 2013.
Wang, D., Shafer, M. M., Schauer, J. J., and Sioutas, C.: Development of a technology for online measurement of total and water-soluble copper (Cu) in PM2.5, Aerosol Sci. Technol., 48, 864–874, https://doi.org/10.1080/02786826.2014.937478, 2014.
Whalley, L. K., Furneaux, K. L., Goddard, A., Lee, J. D., Mahajan, A., Oetjen, H., Read, K. A., Kaaden, N., Carpenter, L. J., Lewis, A. C., Plane, J. M. C., Saltzman, E. S., Wiedensohler, A., and Heard, D. E.: The chemistry of OH and HO2 radicals in the boundary layer over the tropical Atlantic Ocean, Atmos. Chem. Phys., 10, 1555–1576, https://doi.org/10.5194/acp-10-1555-2010, 2010.
Wilkinson, J., Reynolds, B., Neal, C., Hill, S., Neal, M., and Harrow, M.: Major, minor and trace element composition of cloudwater and rainwater at Plynlimon, Hydrol. Earth Syst. Sci., 1, 557–569, https://doi.org/10.5194/hess-1-557-1997, 1997.
You, Y., Smith, M. L., Song, M., Martin, S. T., and Bertram, A. K.: Liquid–liquid phase separation in atmospherically relevant particles consisting of organic species and inorganic salts, Int. Rev. Phys. Chem., 33, 43–77, https://doi.org/10.1080/0144235X.2014.890786, 2014.
Zhou, J., Elser, M., Huang, R.-J., Krapf, M., Fröhlich, R., Bhattu, D., Stefenelli, G., Zotter, P., Bruns, E. A., Pieber, S. M., Ni, H., Wang, Q., Wang, Y., Zhou, Y., Chen, C., Xiao, M., Slowik, J. G., Brown, S., Cassagnes, L.-E., Daellenbach, K. R., Nussbaumer, T., Geiser, M., Prévôt, A. S. H., El-Haddad, I., Cao, J., Baltensperger, U., and Dommen, J.: Predominance of secondary organic aerosol to particle-bound reactive oxygen species activity in fine ambient aerosol, Atmos. Chem. Phys., 19, 14703–14720, https://doi.org/10.5194/acp-19-14703-2019, 2019a.
Zhou, J., Murano, K., Kohno, N., Sakamoto, Y., and Kajii, Y.: Real-time quantification of the total HO2 reactivity of ambient air and HO2 uptake kinetics onto ambient aerosols in Kyoto (Japan), Atmos. Environ., 223, 117189, https://doi.org/10.1016/j.atmosenv.2019.117189, 2019b.