the Creative Commons Attribution 4.0 License.
the Creative Commons Attribution 4.0 License.
 | 27 Jan 2021
Toward closure between predicted and observed particle viscosity over a wide range of temperatures and relative humidity
Sabin Kasparoglu
Manabu Shiraiwa
Atmospheric aerosols can exist in amorphous semi-solid or glassy phase states whose viscosity varies with atmospheric temperature and relative humidity. The temperature and humidity dependence of viscosity has been hypothesized to be predictable from the combination of a water–organic binary mixing rule of the glass transition temperature, a glass-transition-temperature-scaled viscosity fragility parameterization, and a water uptake parameterization. This work presents a closure study between predicted and observed viscosity for sucrose and citric acid. Viscosity and glass transition temperature as a function of water content are compiled from literature data and used to constrain the fragility parameterization. New measurements characterizing viscosity of sub-100 nm particles using the dimer relaxation method are presented. These measurements extend the available data of temperature- and humidity-dependent viscosity to −28 ∘C. Predicted relationships agree well with observations at room temperature and with measured isopleths of constant viscosity at ∼107 Pa s at temperatures warmer than −28 ∘C. Discrepancies at colder temperatures are observed for sucrose particles. Simulations with the kinetic multi-layer model of gas–particle interactions suggest that the observed deviations at colder temperature for sucrose can be attributed to kinetic limitations associated with water uptake at the timescales of the dimer relaxation experiments. Using the available information, updated equilibrium phase-state diagrams (, temperature, and , relative humidity) for sucrose and citric acid are constructed and associated equilibration timescales are identified.
- Article
(2792 KB) - Full-text XML
-
Supplement
(3056 KB) - BibTeX
- EndNote


Atmospheric aerosols affect Earth's energy budget by absorbing or scattering solar radiation (direct effect) or by acting as cloud condensation nuclei or as ice nuclei (indirect effect) (McCormick and Ludwig, 1967; Zobrist et al., 2008). Atmospheric particles also affect human health by causing cardiovascular, respiratory, and allergic diseases (Mar et al., 2000; Pope et al., 2004; Kelly and Fussell, 2011). Atmospheric aerosols can be composed of a mixture of organic or inorganic components. The organic mass fractions can represent up to 90 % of the total submicron non-refractory atmospheric particle mass (Zhang et al., 2007; Jimenez et al., 2009).
Viscosity affects the equilibration timescale of a particle with respect to gas–particle exchange (Zobrist et al., 2011; Zaveri et al., 2018; Li and Shiraiwa, 2019; Ullmann et al., 2019; Vander Wall et al., 2020). For highly viscous particles, gas–particle exchange rates are slow. This, in turn, may prevent chemical degradation of reactive compounds bound within the interior of viscous particles (Shrivastava et al., 2017) and may increase the time for solid surfaces to facilitate heterogeneous ice nucleation (Berkemeier et al., 2014; Ignatius et al., 2016).
Viscosity varies over 17 orders of magnitude from 10−5 Pa s, corresponding to a gas, to 1012 Pa s, corresponding to a glass. Viscosity exponentially increases with decreasing temperature (Fulcher, 1925). The temperature where viscosity reaches 1012 Pa s is sometimes equated with the glass transition temperature (Tg) measured through differential calorimetry (Debenedetti and Stillinger, 2001). Equilibrium water uptake causes the condensed-phase water fraction to increase with increasing water activity or ambient relative humidity (RH). The water mass fraction depends on the particle hygroscopicity. With an increasing water fraction, viscosity decreases as water can act as a plasticizer. A substantial number of studies investigated the influence of relative humidity on viscosity for organic particles at room temperature (Power et al., 2013; Renbaum-Wolff et al., 2013; Song et al., 2015; DeRieux et al., 2018). These studies generally show high viscosity or glassy conditions at low RH, a strong decrease in viscosity with increasing RH, and viscosity approaching that of a liquid at RH>90 %.
The glass transition temperature of mixtures can be obtained through semi-empirical mixing rules (Gordon and Taylor, 1952). Zobrist et al. (2008) combined mixing rules and water activity vs. composition relationships to identify the glass transition temperature as a function of temperature and RH. The Tg–RH relationship defines phase-state-diagram-delineating glassy states at a cold temperature and low RH and a semi-solid or liquid at a warm temperature and high relative humidity. The dry particle Tg is influenced by compound molecular weight (Koop et al., 2011; Shiraiwa et al., 2017), an atomic oxygen-to-carbon ratio (Koop et al., 2011; Saukko et al., 2012; Dette et al., 2014; Shiraiwa et al., 2017; DeRieux et al., 2018), and functional group composition (Sastri and Rao, 1992; Rothfuss and Petters, 2017b). Dry Tg also correlates with vapor pressure or volatility of the compound (Rothfuss and Petters, 2017b; Champion et al., 2019; Zhang et al., 2019; Li et al., 2020). The Tg–RH relationship is controlled by the temperature and RH dependence of the hygroscopicity parameter (Thomas et al., 1979; Koop et al., 2011; Berkemeier et al., 2014; Rothfuss and Petters, 2017a; Petters et al., 2019) and empirical constants constraining the mixing rule.
Rothfuss and Petters (2017a) extended the Tg–RH phase-state diagram to include isopleths of constant viscosity (η). The isopleth is equivalent to the Tg–RH line. Viscosity isopleths with lower viscosity are offset from the Tg–RH line. The extended phase-state diagram maps out the semi-solid regime, defined as 102 to 1012 Pa s of the state space. Experimental measurements of viscosity isopleths in the 106–107 Pa s range have been made for sucrose (Rothfuss and Petters, 2017a), sucrose–citric-acid and sucrose–NaNO3 mixtures (Marsh et al., 2018), and secondary organic aerosols (Järvinen et al., 2016; Petters et al., 2019).
Rothfuss and Petters (2017a) and Marsh et al. (2018) modeled the viscosity isopleths based on the Tg–RH relationship and the measured temperature dependence of viscosity as parameterized through the Vogel–Fulcher–Tammann (VFT) model (Fulcher, 1925) and conjecture that the slope of the VFT model is independent of particle composition. Shiraiwa et al. (2017) and DeRieux et al. (2018) used a similar model to compute viscosity based on fragility relationships. Fragility relationships scale viscosity by Tg and are related to the VFT relationship (Angell, 1995). For example, fragility plots for amino acids (Renzetti et al., 2020) and zwitterions (van der Sman et al., 2020) have been reported. An implicit assumption in these works is that the fragility relationship is independent of the water content, which is identical to the conjecture that the slope of the VFT model is independent of water content.
In summary, there are four types of empirical relationships that are commonly used to characterize the amorphous state: glass transition temperature vs. water weight fraction, viscosity vs. temperature, viscosity vs. RH at a constant temperature, and viscosity isopleths as a function of temperature and RH. These relationships are related through a phase diagram model that involves a water–organic binary mixing rule of the glass transition temperature, a glass-transition-temperature-scaled viscosity fragility parameterization, and a water uptake parameterization.
In this work we perform a closure study that tests for consistency between these four state spaces and the phase diagram model for sucrose and citric acid. Sucrose and citric acid are selected because extensive data are available for a wide range of water contents and temperatures. These data are compiled from the literature and are used to constrain the inputs of the in-mixing rule and fragility relationships. The resulting model is compared with the data in all of the state spaces. Limited data are available to constrain viscosity isopleths below ambient temperatures. New measurements are performed to measure viscosity isopleths at ∘C (temperature). To this end the dimer coagulation, isolation, and coalescence (DCIC) method (Rothfuss and Petters, 2016) was modified to extend the temperature range where this method can be applied. The method identifies the temperature and RH when dimer particles relax into spheres. Equilibrium water uptake is assumed when retrieving viscosity from this method. Model simulations using the kinetic multi-layer model of gas–particle interactions in aerosols and clouds (KM-GAP) model (Shiraiwa et al., 2012) are used to identify conditions where the equilibration timescale is similar to or exceeds the time available for dimer relaxation. The combined work yields updated equilibrium phase-state diagrams ( and ) and equilibration timescales for sucrose and citric acid.
2.1 Viscosity measurement
The DCIC technique has been described extensively in prior publications (Champion et al., 2019; Marsh et al., 2018; Rothfuss and Petters, 2016, 2017a; Rothfuss et al., 2019; Petters, 2018; Tandon et al., 2019; Petters et al., 2019). The basic concept is briefly introduced, and then modifications made to enable low-temperature measurements will be described. Dimer particles were generated using the dual-tandem differential mobility analyzer (DMA) technique. Two DMAs were used to create mobility-selected size-selected particles of opposite charge. The streams from the two DMAs were merged and passed into a coalescence chamber where some of the particles coagulated. Dimer particles formed from +1 and −1 or +2 and −2 coagulation events are charge neutral. The aerosol was passed through an electrostatic precipitator. Neutral dimer particles were transmitted, thus isolating dimer particles. Coagulated and coalesced particles are spherical, while coagulated and non-coalesced particles are rod shaped. The dimer particles were passed through temperature-controlled volume (thermal conditioner) to alter the thermodynamic state for a short amount of time. Subsequently the size distribution was measured using a scanning mobility particle sizer (SMPS). Rod-shaped particles have a large apparent mobility diameter due to increased drag force. The altered thermodynamic state, defined by an increase in either temperature or relative humidity, may induce partial or complete coalescence, which was observed as a change in the mode diameter of the dimer mobility size distribution. The observed mode of the mobility size distribution was converted to a particle shape parameter; the shape parameter was graphed against temperature; and the observed relationship was fit to a logistic curve as
where ξ is the shape parameter, erfc is the complementary error function, σ is the spread parameter, T is the temperature, and T0 is the midpoint of coalescence relaxation. The shape parameter was converted to viscosity using the Frenkel sintering theory (Pokluda et al., 1997; Rothfuss and Petters, 2016). Example logistic curves including data for aerosol of sucrose and citric acid are given in prior work (Rothfuss and Petters, 2016, 2017a; Marsh et al., 2018; Rothfuss et al., 2019; Tandon et al., 2019; Petters et al., 2019) and the Supplement.
The relationship between shape factor and viscosity scales with particle diameter, surface tension, and residence time in the thermal conditioner. Surface tension values used in the conversion are identical to those used in Marsh et al. (2018). The dependence of surface tension on water content was not considered. The mass fractions of sucrose and citric acid at the 107 Pa s viscosity transition are 0.88±0.11 and 0.95±0.06, respectively. The variability of the solute mass fractions at the transition points is small, and the solution molarity approaches the upper end of available surface tension measurements (Petters and Petters, 2016). Furthermore, the influence of surface tension on the retrieved relaxation T∕RH is much smaller than other measurement errors (Marsh et al., 2018). Thus, ignoring the dependence of surface tension on water content does not influence our conclusions. In this study we increased the volume of the thermal conditioner to increase the residence time from t=5 s used in previous studies to t=60 s. The rationale for this increase was to decrease the potential sensitivity of dimer coalescence to kinetic limitations of water uptake. The monomer particle mobility diameters are 90 nm, slightly larger than those used in previous studies. Increasing the residence time and monomer particle diameter also increases the measured viscosity from Pa s in previous work to Pa s in this work.
Figure 1 depicts the schematic of the experimental setup. To facilitate cold-temperature measurements, several modifications were made to the instrument. The particle-drying technique was improved. All DMA flows were switched to N2 boiled off from dewar. To accommodate the larger thermal load required to control the increased thermal conditioner volume, the cooling system of SMPS was revised. Settings specific to this study are now discussed.
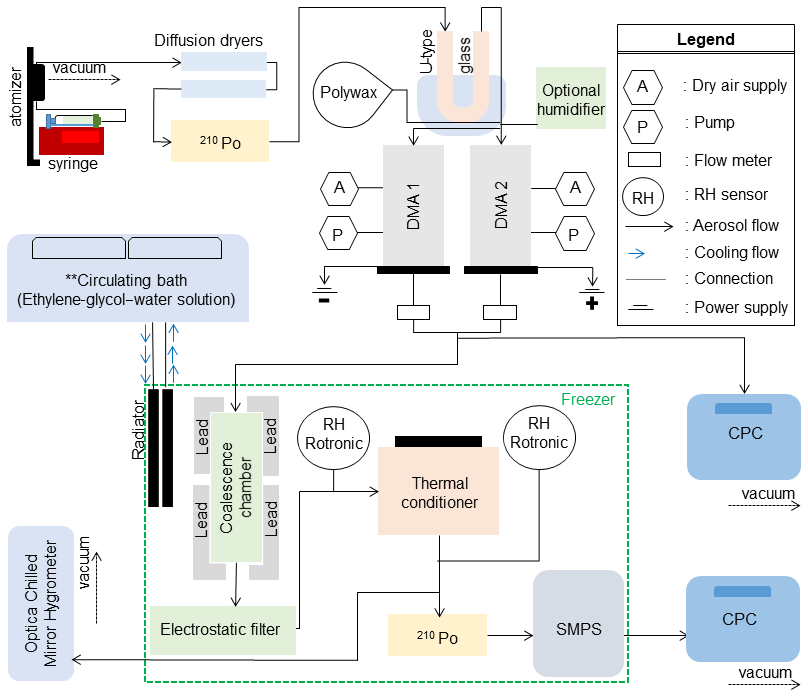
Dimer particles are composed of a polyethylene monomer and a monomer particle of either sucrose or citric acid. Rothfuss and Petters (2017a) showed that dimer particles composed of sucrose and sodium dodecyl sulfate relax into a sphere at T and RH like those observed in sucrose–sucrose dimer particles. Thus, it is assumed that the relaxation measured from sucrose–polyethylene and citric-acid–polyethylene dimer particles approximates that of sucrose–sucrose and citric-acid–citric-acid dimer particles. Measurements reported later in this work compare well with literature data, thus lending further support to this approach. Polyethylene particles were generated using an evaporation–condensation system that is described in Tandon et al. (2019) and Rothfuss et al. (2019). Citric acid (≥99.5 %, Sigma Aldrich, St. Louis, MO, USA) and sucrose (≥99.5 %, Sigma Aldrich, St. Louis, MO, USA) were dissolved in HPLC (high-performance liquid chromatography) grade water (5 g of solute in 100 mL of HPLC grade submicron filtered water, Fisher Scientific, USA) and atomized using a constant-output atomizer (TSI 3076). Particles generated by atomization were dried using silica gel diffusion dryers and passed through a 210Po neutralizer to establish charge equilibrium. Additional drying was achieved by passing particles through a U-type glass embedded in a chilled bath held at ∘C. The output flow from the U-type glass was split and passed to the dual-tandem DMA. DMA 1 was connected to a negative-polarity power supply to select positively charged particles, and DMA 2 was connected to a positive power supply to select negatively charged particles. The DMAs were operated at a sheath-to-sample flow ratio. The flows from the two DMAs were merged and then split between a CPC (condensation particle counter) with a flow rate of 0.5 L min−1 and the coalescence chamber with a flow rate of 1 L min−1. The coalescence chamber was shielded with lead to prevent spontaneous particle discharging from naturally occurring ionizing radiation (Rothfuss et al., 2019) and was placed inside the freezer to maintain dimers at a temperature cold enough to prevent coalescence before reaching the thermal conditioner. The freezer temperature could be varied between −8 and 18 ∘C. Temperature control was achieved by using a circulating bath chiller (NESLAB ULT 95 Bath Recirculator) that transported heat exchange fluid through an aspirated car radiator placed inside the freezer. Also placed inside the freezer were the electrostatic precipitator (operated at 1500 V potential) and the scanning mobility particle sizer, operated at a sheath-to-sample flow ratio of (DMA 3). Operation of the SMPS at subzero temperature was previously described in Wright et al. (2016) and Petters et al. (2019). Placing the coalescence chamber and SMPS in the freezer enables measurement of non-coalesced dimer particles for systems that otherwise would coalesce well below ambient temperature.
The RH in the instrument was measured using three resistance-based RH (Rotronic HC2) sensors placed at various points inside the flow path in the freezer. From the flow exiting the thermal conditioner, 0.5 L min−1 was transmitted through an RH sensor and subsequently to a chilled-mirror hygrometer outside the freezer which was measuring dew or frost point temperature (GE Optica four-stage with ±0.2 ∘C accuracy and a lower limit of detection of −65 ∘C). Readings <0 ∘C were interpreted as frost point temperature. The critical value for the experiment is the vapor pressure and temperature inside the thermal conditioner. Temperature of the thermal conditioner was monitored using thermistors mounted outside of the metal chamber. Vapor pressure was derived from a combination of the chilled-mirror measurement and the Rotronic measurements. For low vapor pressures, the chilled-mirror measurements are slow and accurate, while the resistance RH measurements are fast and sometimes biased. Derivation of RH from these measurements is described in detail in the Supplement.
Table 1Model parameters.
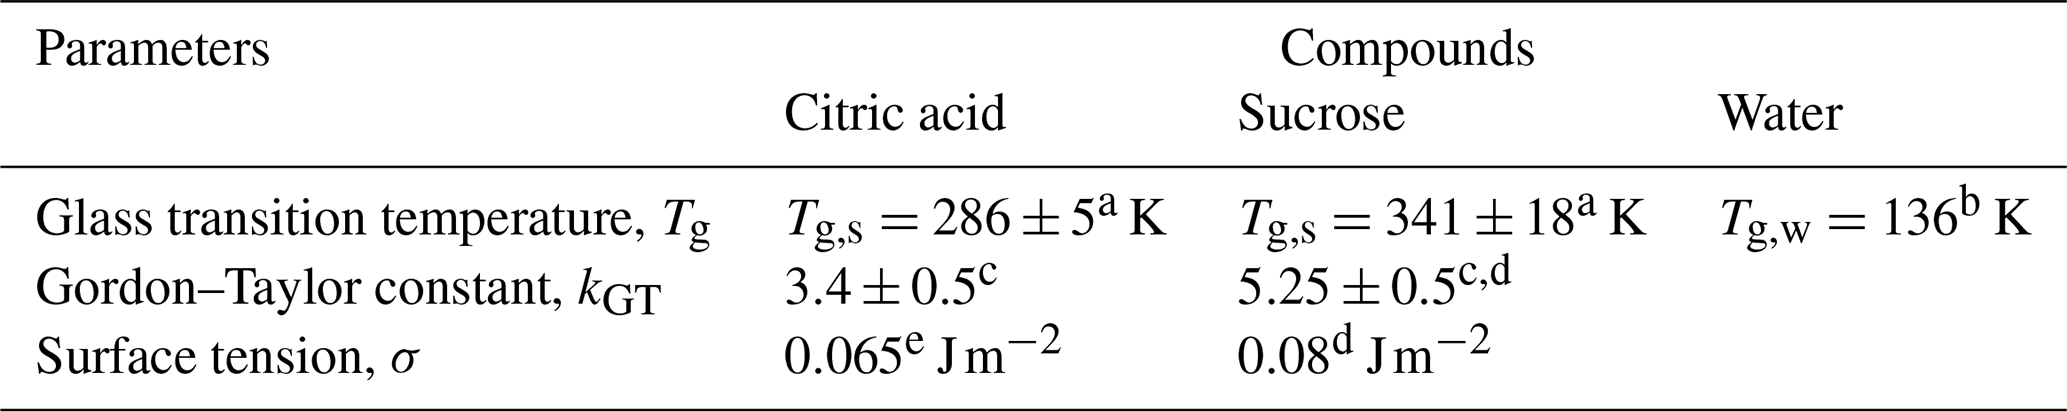
Source: a Rothfuss and Petters (2017b). b Koop et al. (2011). c Supplement. d Rothfuss and Petters (2017a). e Marsh et al. (2018).
2.2 Phase diagram model
The phase diagram model is described in detail in previous publications (Rothfuss and Petters, 2017a; DeRieux et al., 2018) and only briefly summarized here. The relationship between solute weight fraction and relative humidity is computed using a hygroscopicity parameterization (Mikhailov et al., 2013) as
where ws is the solute weight fraction, 1−ws is the water weight fraction, aw is the water activity and is taken to be , and κm is the mass-based hygroscopicity parameter. The effect of particle curvature on water content is not considered. This leads to a slight overestimate in the calculated water content. The maximum difference between RH and aw for 100 nm particles is ∼ 2 % in absolute RH units (RH = 40 % instead of 42 %). The difference depends on the hygroscopicity of the compound and solution and air interfacial tension of drop. The effect is not considered for simplicity. A treatment of the phase diagram model including the effect of curvature and particle size are provided in Petters and Kasparoglu (2020). The hygroscopicity parameter depends on water activity and temperature. This dependency is computed from the water activity parameterizations reported in Zobrist et al. (2008) and Lienhard et al. (2012) as described and visualized in the Supplement.
The glass transition temperature of the mixture is computed using the Gordon–Taylor mixing rule (Gordon and Taylor, 1952) as
where Tg,w is the glass transition temperature of water, Tg,s is the glass transition temperature of a solute, kGT is the Gordon–Taylor constant, and ws(RH) is computed using Eq. (2).
where η(T,RH) is the viscosity, DA is the fragility parameter, T is the temperature, and Tg is computed using Eq. (3). If Tg∕T exceeds 1, the compound is a glass and Tg∕T is set to 1 to ensure numerical stability for all input conditions. Table 1 summarizes the input parameters for sucrose and citric acid used in this study.
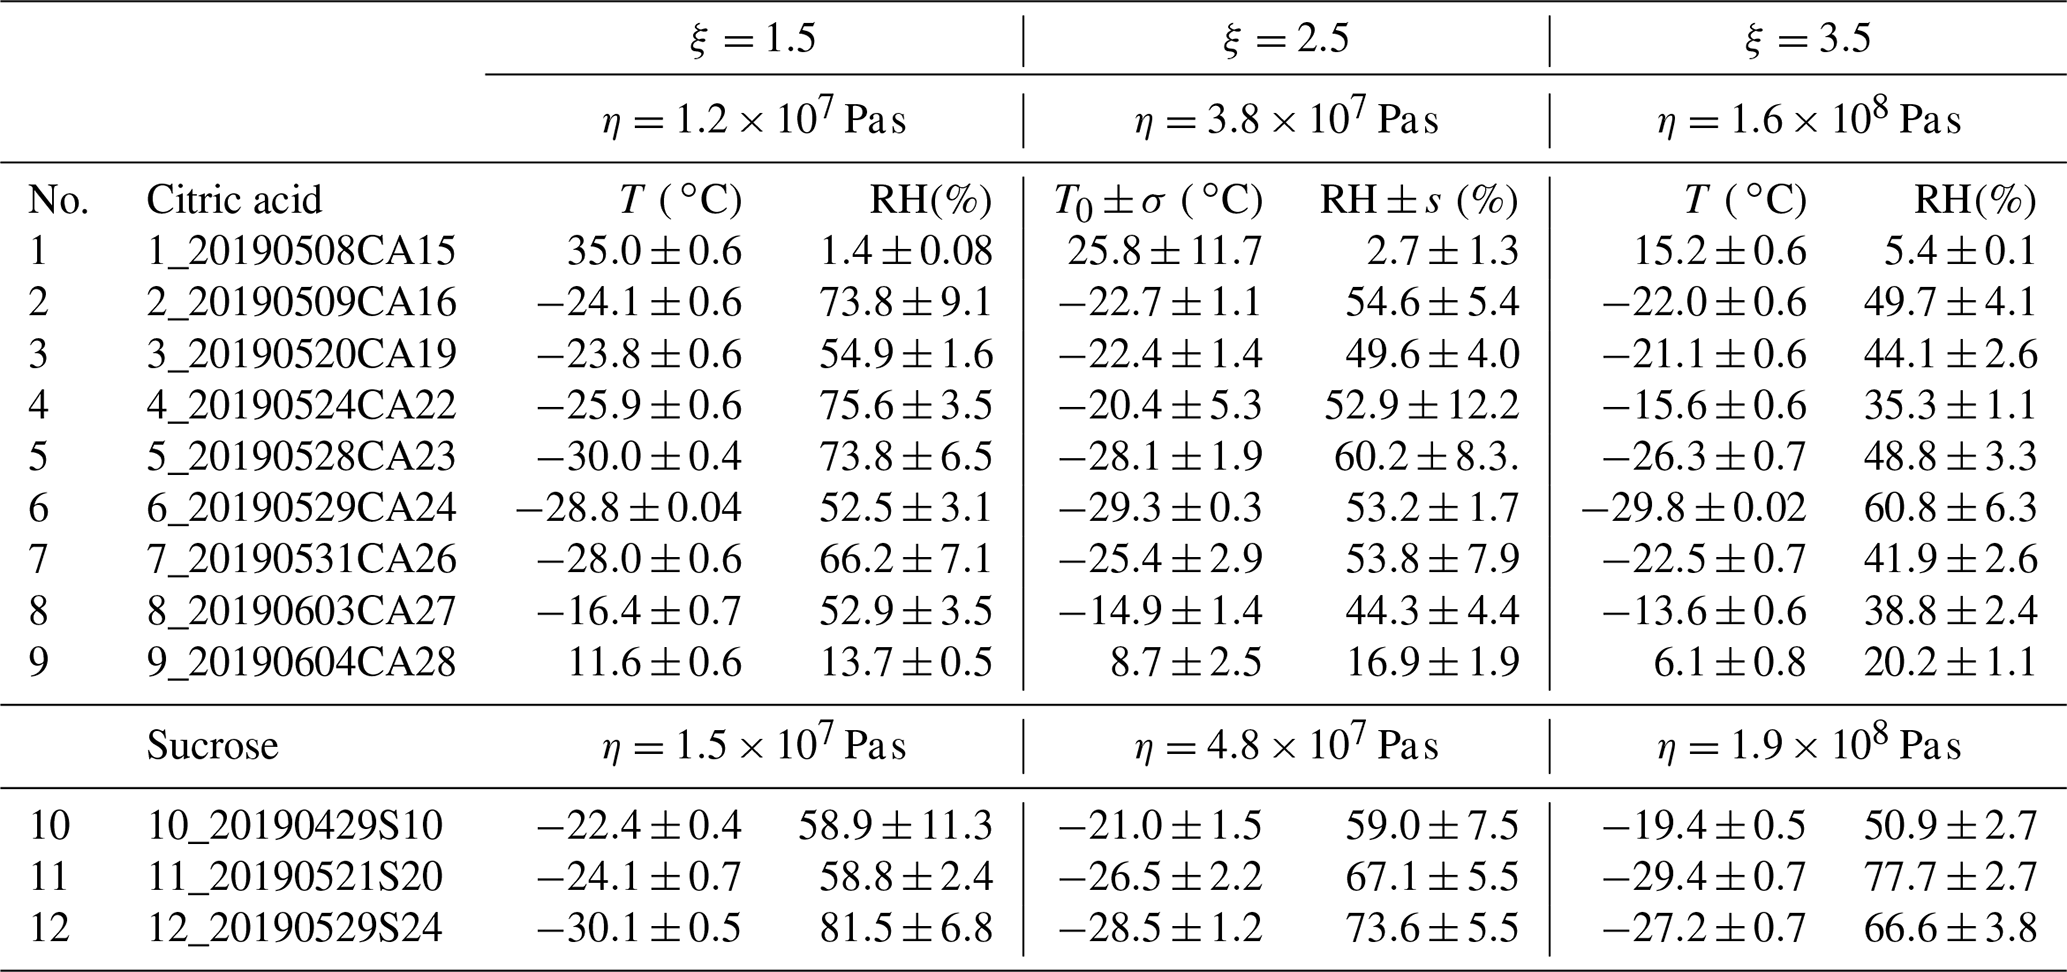
Table 2Data summary for each experiment. The viscosity is evaluated at , and 3.5. The corresponding viscosity is calculated based on the surface tension (Table 1), size (90 nm), and coagulating time (60 s). The second column includes an experiment identifier to link the figures in the Supplement and the data repository. T0±σ corresponds to the midpoint of the relaxation as determined from the fit of the data to Eq. (1). RH± SD corresponds to the standard deviation in RH in the interval . The temperatures and standard deviation in columns ξ=1.5 and ξ=3.5 correspond to the mean and standard deviation in the interval and , respectively, and their corresponding RH values.
2.3 Data summary
Experimental data were fitted with Eq. (1) to determine T0 and σ. Temperature and RH corresponding to shape factors ξ=1.5, ξ=2.5, and ξ=3.5 and the associated viscosities are summarized in Table 2. Uncertainty in the reported viscosity stems from assumed surface tension and a long list of potential experimental errors (sizing errors, flow rates, temperature and dew point measurement, and concentration variability) and how they propagate through the data reduction process. In Table 2 we report uncertainty in terms of T and RH at the midpoint viscosity ξ=2.5. The uncertainty is typically dominated by RH. Typical error bars correspond to at least ±1 order of magnitude in viscosity, with larger uncertainties at colder temperatures. To compute fragility, the temperature was normalized by the average Tg calculated from Eq. (3). Detailed data for each experiment listed in Table 2 are provided in the Supplement and data repository. Discussion of these data is provided in the Results section.
2.4 KM-GAP simulations
The time to achieve gas–particle equilibrium is computed using the simulations of the kinetic multi-layer model of gas–particle interactions in aerosols and clouds (KM-GAP) (Li and Shiraiwa, 2019; Shiraiwa et al., 2012). KM-GAP consists of multiple model layers: the gas phase, near-surface gas phase, sorption layer, quasi-static surface layer, and a number of bulk layers. The model includes gas phase diffusion, adsorption and desorption at the particle surface–bulk exchange and diffusion through bulk layers. The diffusion coefficient of water () is treated as composition dependent. Parameterizations of for the sucrose–water system apply the method in Zobrist et al. (2011). The estimation of in particles of citric acid uses a semi-empirical method in Berkemeier et al. (2014) that utilizes the VFT equation and assumes the aqueous solutions of citric acid are chemically similar to the sucrose–water system. A total of 2500 simulations were performed for a single compound. The model was initialized with T, RH on an equidistant grid with and , and 50 points in each dimension for 100 nm diameter particles. The time to reach equilibrium, τ, is defined when the variability in composition throughout the drop is . This corresponds to 4.6 traditional e-folding times. For τ equaling a single e-folding time, the particle interior is still solid, which will interfere with the dimer relaxation. The non-traditional choice for τ is thus motivated by the need to define a timescale where the particle composition has become nearly uniform throughout the semi-solid domain. This equilibrium timescale depends on the volatility, bulk phase diffusivity, surface accommodation coefficient, and particle size (Shiraiwa and Seinfeld, 2012). Contour curves denoting constant time to equilibrium are derived from the 2-D scalar field.
2.5 Literature data
Literature data were either digitized from graphs or taken from tables in the cited publications and tabulated. The sources are listed sequentially for each of the figures in this paper.
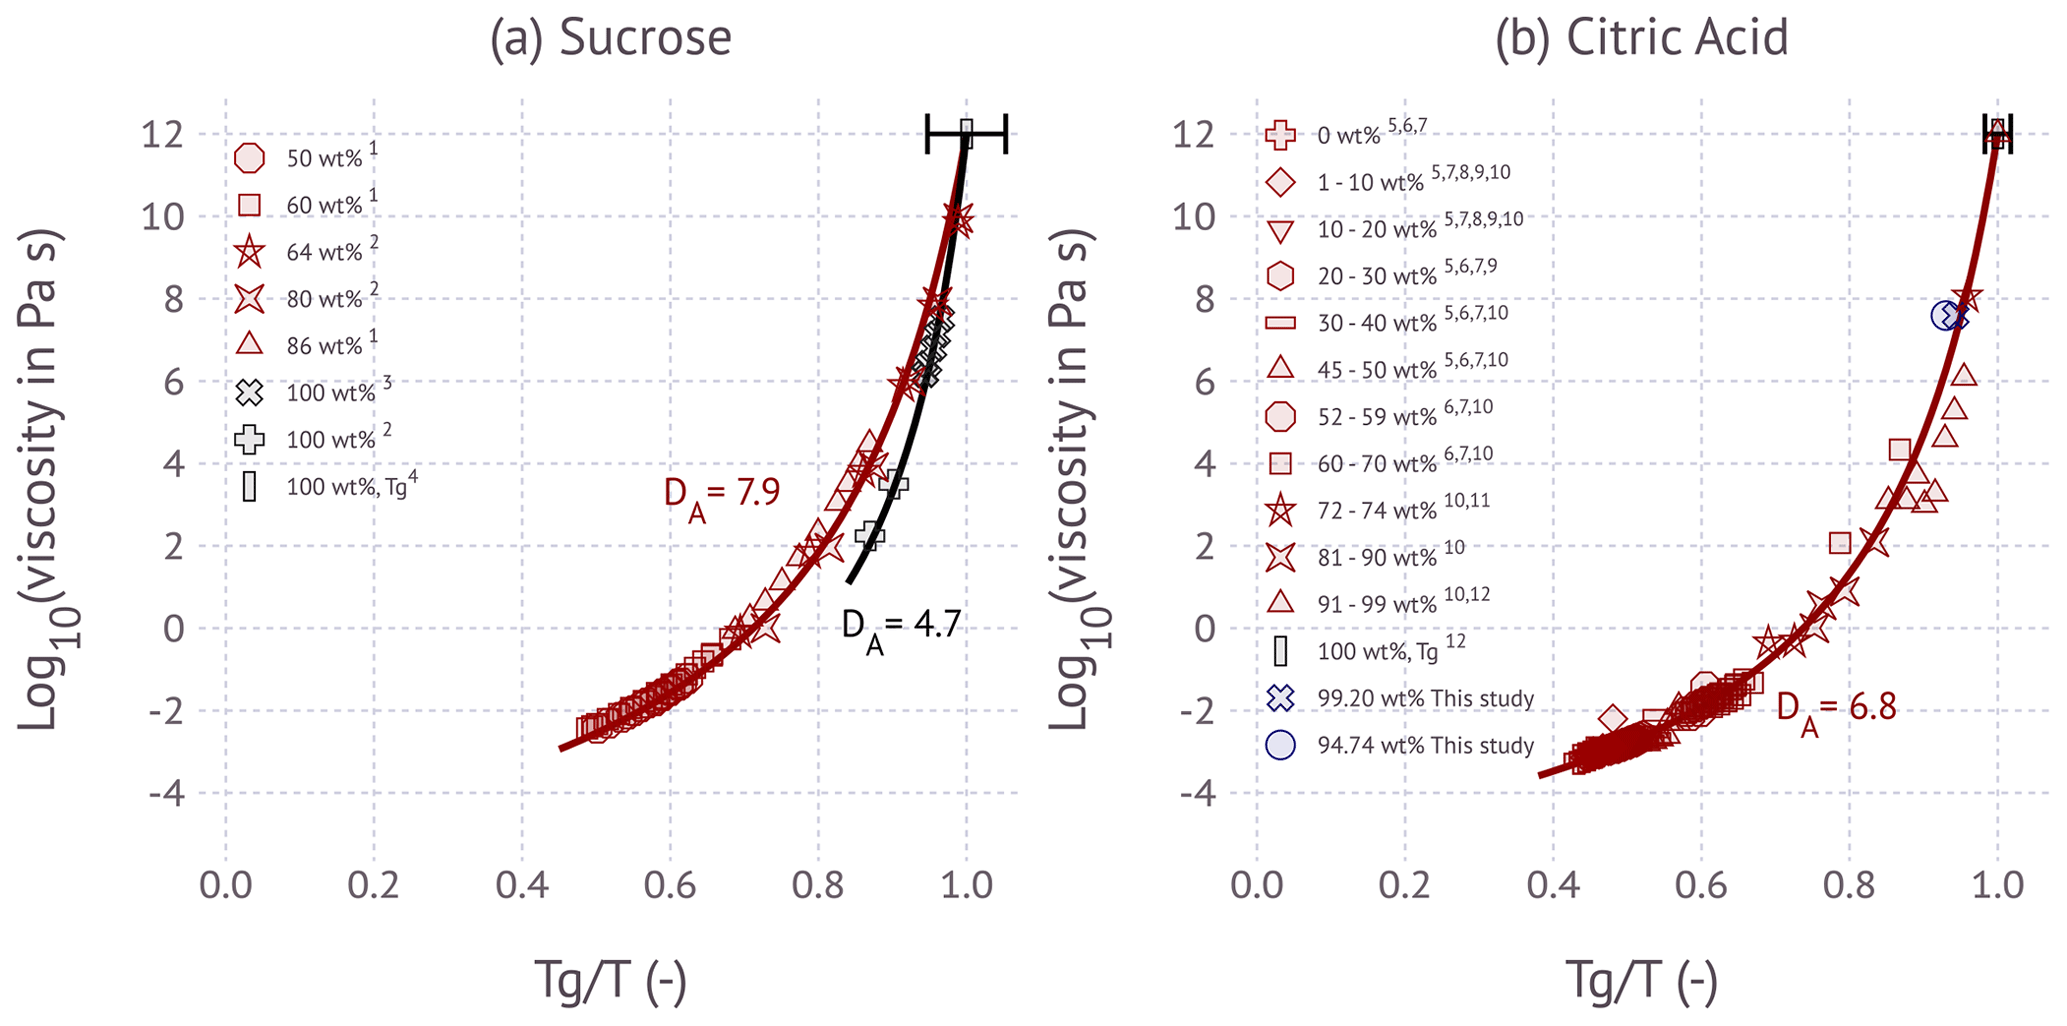
Figure 2Angell representation of viscosity scaled by Tg for the (a) sucrose–water system and (b) citric-acid–water system. Solid lines are fitted relations using the fragility parameterization. Black and red data points are from the literature: 1 Longinotti and Corti (2008), 2 Angell (2002), 3 Rothfuss and Petters (2017a), 4 Rothfuss and Petters (2017b), 5 Simion et al. (2014), 6 Laguerie et al. (1976), 7 Apelblat (2014), 8 Omran et al. (2019), 9 Haynes and Lide (2011), 10 Song et al. (2016), 11 Maltini and Anese (1995), and 12 Marsh et al. (2018). Red colors correspond to aqueous solutions with 0 wt %–90 wt % (weight percent) of solute, and black colors correspond to 90 wt %–100 wt % of solute. Blue colors represent results from this study. The error bar on Tg corresponds to ±18 and ±5 K uncertainty for sucrose and citric acid, respectively.
2.5.1 Figure 2
For Fig. 2a, Tg∕T data for 64 wt %, 80 wt %, and 100 wt % denoted as ref. 1 in the figure are taken from Fig. 12 in Angell (2002); 86 wt %, 60 wt %, and 50 wt % denoted as ref. 2 in the figure are digitized from Fig. 4 in Longinotti and Corti (2008), where the data are presented as viscosity and temperature values with respect to the weight percent. The data were normalized by Tg calculated from the Gordon–Taylor mixing rule of Eq. (3) and the parameters in Table 1. Then, the viscosity and Tg∕T points are plotted where the temperature range is from −5 to 60 ∘C for 50 wt % of solutions, −10 to 94 ∘C for 60 wt % of solutions, and 5 to 80 ∘C for 86 wt % of solutions. The data points denoted as ref. 3 are calculated as follows: the viscosity and T values are read from Table S1 in Rothfuss and Petters (2017a) for 100 % dry data points (where RH is assumed as 0.8 %), and then by using the hygroscopicity parameter, κm, which is calculated through the polynomial coefficients from Table S1.1 in Marsh et al. (2018), the weight percent of the solution is calculated. Then, it is converted into Tg by Eq. (3) by using the corresponding constants for sucrose taken from Table 1. Thus, the viscosity and Tg∕T points are plotted against viscosity where the temperature range is between 78.5 to 86.8 ∘C. For Fig. 2b, the raw data denoted as ref. 5–11 are collected and taken as temperature, viscosity, and weight percent, and their Tg values are calculated via Eq. (3) by using the corresponding constants for citric acid taken from Table 1. These data points (ref. 5–11) are as follows: the data denoted as ref. 5 are taken from Table 2 in Simion et al. (2014) at around room temperature including 298.15, 303.15, 308.15, and 313.15 K; and the data points denoted as ref. 6 are taken from Table 3 in Laguerie et al. (1976) at 25 ∘C; the data points denoted as ref. 7 are taken from Table 2.17 in Apelblat (2014) at 298.15, 300.65, 308.15, and 313.15 K; the data points denoted as ref. 8 are taken from Table 1 in Omran et al. (2019) at 20 ∘C; the data points denoted as ref. 9 and ref. 10 are taken from pp. 5–126 in Haynes and Lide (2011) and read from Table SI.29 in Song et al. (2016), respectively, at 293.15 K; the data points denoted as ref. 11 are digitized from Fig. 4 in Maltini and Anese (1995) at 240 and 227 K. Then for each point, their Tg∕T is calculated and plotted against their viscosity. The literature summary for Tg of sucrose and citric acid denoted as ref. 4 and ref. 12 is taken from Table S1 in Rothfuss and Petters (2017b) and Marsh et al. (2018), respectively; note that their error range corresponds to the values given in Table S1 in Rothfuss and Petters (2017b).

Figure 3Influence of RH on viscosity for the (a) sucrose and (b) citric acid at room temperature. Symbols correspond to experimental data from different investigators. The colored lines correspond to the model prediction from Eq. (4) using the fragility curves shown in Fig. 2.
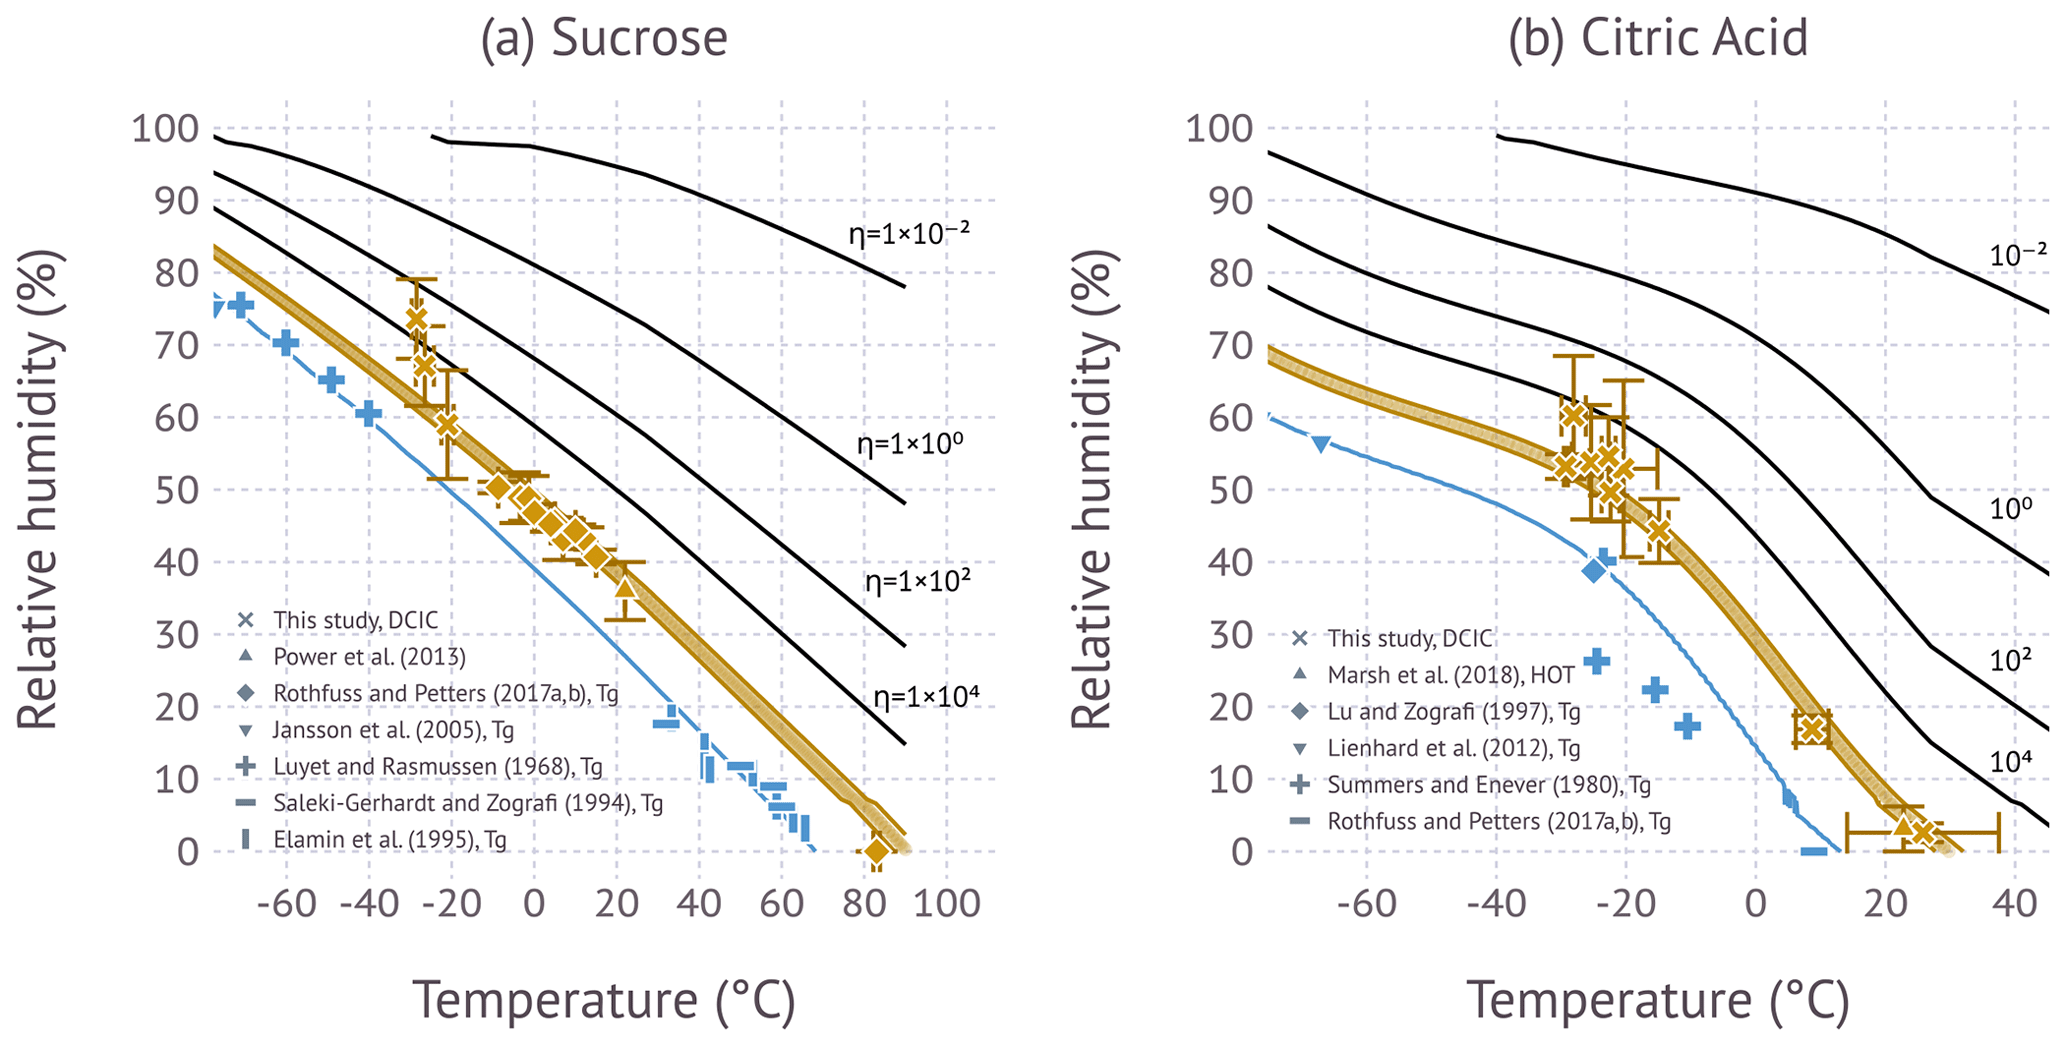
Figure 4The symbols show glass transition (blue) and viscosity data (gold) as a function of temperature and RH. Viscosity data from Power et al. (Power et al., 2013; sucrose) and Marsh et al. (Marsh et al., 2018; citric acid) are from holographic optical tweezer (HOT) measurement. Viscosity data from Rothfuss and Petters (2017a) and this study are from the DCIC method. Data lines correspond to contours computed from the computed η(T,RH) field evaluated for 1012 Pa s (blue), 5×10⁶ to 4.8×10⁷ Pa s for sucrose (gold-shaded area) and 5×10⁶ to 3.8×10⁷ Pa s for citric acid (gold-shaded area), and 104 to 10−2 Pa s (black).
2.5.2 Figure 3
Figure 3a and b are adapted from Fig. 5c in Gervasi et al. (2020). The RH values (aw) of the solutions of sucrose and citric acid are calculated using the Eq. (2), where the hygroscopicity parameter, κm, is calculated by Table 1. The relation between weight percent of the solute and RH is derived by using the parameterization of κm by using the water activity parameterizations of Zobrist et al. (2008) and Lienhard et al. (2012) from the original literature data (Apelblat, 2014; Först et al., 2002; Haynes and Lide, 2011; Laguerie et al., 1976; Omran et al., 2019; Quintas et al., 2006; Simion et al., 2014; Swindells et al., 1958; Telis et al., 2007). For Fig. 3a, the calculated RH values for sucrose solutions from Eq. (2) are as follows: the sucrose weight percent and viscosity points (by viscometer) at 20 ∘C are taken from Table 1 in Telis et al. (2007); the weight percent and viscosity points (by viscometer) at 20 ∘C are digitized from Fig. 1 in Först et al. (2002); the weight percent and viscosity points are taken from the CRC Handbook of Chemistry and Physics (Haynes and Lide, 2011); the weight percent and viscosity points (by viscometer) are digitized from Fig. 2 in Quintas et al. (2006); and the weight percent and viscosity points (by viscometer) are taken from Table 131 in Swindells et al. (1958). RH(aw) data points are read directly from Table 1 in Mazurkiewicz et al. (2001), where the viscosity is measured by viscometer, and from Table SI.4 in Song et al. (2016), where the viscosity is measured by aerosol optical tweezers. RH and viscosity points (aerosol optical tweezers) are digitized from Fig. 4a in Power et al. (2013).
For Fig. 3b, the calculated RH values for solutions of citric acid from Eq. (2) are as follows: the weight percent and viscosity points are taken from Table 2 in Simion et al. (2014) at 298.15, 303.15, and 3018.25 K; weight percent and viscosity points (by viscometer) are from Table 1 in Omran et al. (2019); weight percent and viscosity points are taken from pp. 5–126 in the CRC Handbook of Chemistry and Physics (Haynes and Lide, 2011); weight percent and viscosity points (by viscometer) are taken from Table 3 in Laguerie et al. (1976); and weight percent and viscosity points are taken from Table 2.17 in Apelblat (2014). The RH and viscosity points (measured by aerosol optical tweezer) are read from Table SI.29 in Song et al. (2016).
2.5.3 Figure 4
Figure 4a is digitized from Fig. 3a in Power et al. (2013), Fig. 5 in Rothfuss and Petters (2017a), Fig. 1 in Jansson et al. (2005), Table 2 in Luyet and Rasmussen (1968), Table 2 in Saleki-Gerhardt and Zografi (1994) and read from Table 2 in Elamin et al. (1995). The data for citric acid for Fig. 4b are tabulated in Marsh et al. (2018) and read from Table 1 in Lu and Zografi (1997), Table 2 in Lienhard et al. (2012), and Table 1 in Summers and Enever (1980); the literature range for Tg of citric acid is taken from Rothfuss and Petters (2017b).
2.5.4 Figure S1 in the Supplement
For Fig. S1a, the data are read from Table 2 in Elamin et al. (1995), Table 2 in Saleki-Gerhardt and Zografi (1994), and Fig. 2 in Maltini and Anese (1995) and digitized from Fig. 1 in Jansson et al. (2005). For Fig. S1b, the data for citric acid are from Table 1 in Summers and Enever (1980) and Fig. 5 in Murray (2008); read from Table 2 and digitized from Fig. 1 in Lienhard et al. (2012); and read from Table 1 in Lu and Zografi (1997).
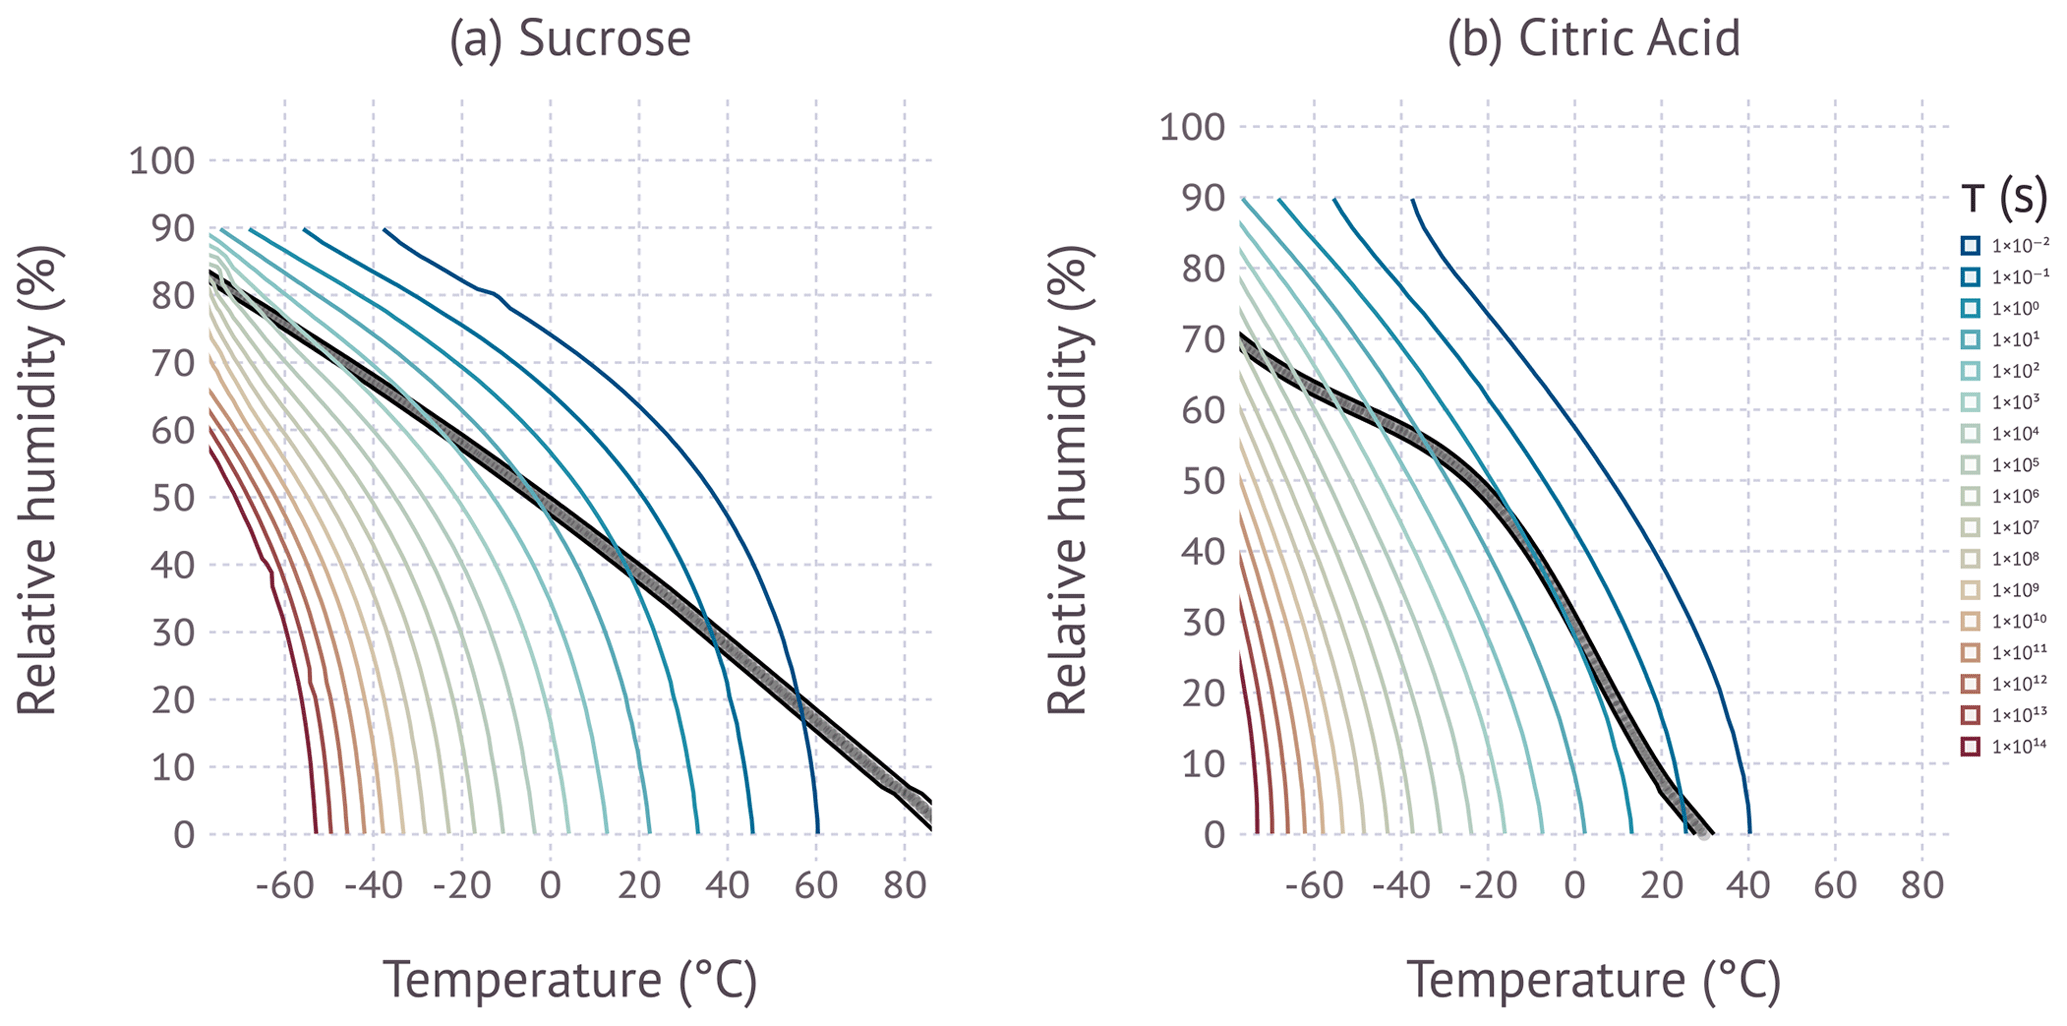
Figure 5Colored lines correspond to the equilibration timescale as predicted by the KM-GAP model simulations. The black-shaded area shows the region between 5×10⁶ to 4.8×10⁷ Pa s for sucrose, and 5×10⁶ to 4.8×10⁷ Pa s is for citric acid. The contours are limited to and due to numerical instability outside this domain.
Figure 2 shows the Angell representation of viscosity scaled by Tg for sucrose and citric acid. The sucrose data show two apparent regimes, one for aqueous solutions and one for dry sucrose. Dry sucrose thermally decomposes at 456 K (Šimkovic et al., 2003) or , thus explaining the limited range of available measurements. The stratification along a single fragility parameter model for aqueous sucrose solutions over a wide range of solute wt % is remarkable. Angell (2002) noted the systematic difference in fragility between dry sucrose and aqueous solutions based on the two data points at ∼102 to ∼103 Pa s. Since these measurements approach the decomposition temperature, Angell (2002) considered the possibility that these measurements are not representative of sucrose. The more recent measurements by Rothfuss and Petters (2017a) using the DCIC method suggest that dry sucrose has indeed a lower fragility than solutions of aqueous sucrose. The data for aqueous solutions of citric acid are more scattered. The observed data from this study using sub-100 nm particles are within the range of the published bulk data. Data for dry citric acid are not available in the literature or from our DCIC measurements. The dimer relaxation occurs at T≈10 ∘C in the DCIC system. Drying to RH=0 % at that temperature is currently not possible, and low fractions of hygroscopically bound water are expected to be present. Despite the scatter, no systematic variation of fragility with solute wt % is observed.
Figure 3 summarizes the data, showing the influence of RH on viscosity at room temperature. Similar summaries have been presented elsewhere (Song et al., 2016; Gervasi et al., 2020). In general, the data investigating the same viscosity range agree within 0.5 orders of magnitude. Few measurements at η>102 Pa s are available. Song et al. (2016) and Power et al. (2013) report viscosity for sucrose in this range. Song et al. (2016), Marsh et al. (2018), and this study show measurements of citric acid at η>106 Pa s and approaching dry conditions. These measurements agree within ±24 % when viscosity is expressed as log10 of its value. Predicted viscosity computed via Eq. (4) evaluated at T=20 ∘C and fragility parameters in Fig. 2 are in excellent agreement with the data at RH>40 %. At RH<40 % the model slightly overestimates the data. The reasons for the small discrepancy are not entirely clear. Possible explanations are a bias in the holographic optical tweezer data, variations in fragility that are not captured with a single-parameter representation of fragility, and uncertainty in the aerosol water content associated with the particle. For the latter, the variability in κm with RH may be insufficiently described by the water activity parameterization. Accurate estimates of water content at low RH, especially below 10 %, remain highly uncertain due to experimental challenges (Kreidenweis et al., 2008). Whichever the case, the difference between measurements and the model does not appear to be substantially larger than the scatter in the data.
Figure 4 shows the variation of viscosity with temperature and RH. The glass transition data coincide with the 1012 Pa s line by the definitions of the Tg vs. wt % fits and the wt % vs. water activity relationships used to relate RH and mass fraction. Deviations from the 1012 Pa s line of three out of four data points for citric acid reported by Summers and Enever (1980) mirror the deviations in the Gordon–Taylor mixing plot (see Fig. S1 in the Supplement). The viscosity isopleth corresponding to the measurements is shown as a shaded band due to the mismatch in viscosity from prior studies (Rothfuss and Petters, 2017a; Marsh et al., 2018) using a shorter coalescence time than in this study. The uncertainty due to this mismatch is less than the scatter in the data. The measured viscosity data are in reasonable agreement with the modeled isopleth, except for the coldest data point ( ∘C). Sucrose measurements at an even colder temperature were attempted, but they were unsuccessful, as no dimer coalescence was observed. The isopleths of citric acid show significant curvature when compared to sucrose, with an upward inflection near −20 ∘C. This curvature is caused by a decrease in hygroscopicity, i.e., κm in that temperature range. (The temperature dependence of κm is shown in Fig. S2 in the Supplement). Excellent agreement between measurements and the modeled isopleth is observed between 8.7 and 28.5 ∘C. Measurements between −14.9 and 8.7 ∘C were attempted but unsuccessful due to lacking the ability to precisely control the dew point temperature of the flows exiting the coalescence chamber. At ∘C, the inferred viscosity from the DCIC method is in good agreement with the viscosity isopleths predicted by the model (Eq. 4), but the data are more scattered.
Figure 5 summarizes the KM-GAP model simulations. At warm temperatures and high relative humidity the equilibration timescale is near instantaneous. The equilibration timescale increases with decreasing temperature and decreasing RH, with temperature dominating the effect. The interplay of the measured temperature and RH from the DCIC measurements and equilibration timescale is complex. If water uptake is kinetically limited, sintering is slowed, and a higher than expected viscosity would be inferred from DCIC data. We expect that the measurements start showing a bias when the equilibration timescale approaches the coalescence timescale (60 s). Figure 6 shows the modeled equilibration timescale evaluation along the viscosity isopleths characterized by the DCIC experiments. The figure suggests that sucrose equilibration timescales approach and exceed the available coalescence time at T≲−30 ∘C. Thus the systematic divergence of the data and viscosity model for sucrose at the coldest measured temperatures shown in Fig. 4 is explained by kinetic limitations of water uptake. Figure 6 also shows that no kinetic limitations are expected for citric acid at the temperatures probed in this work, which is consistent with the data.
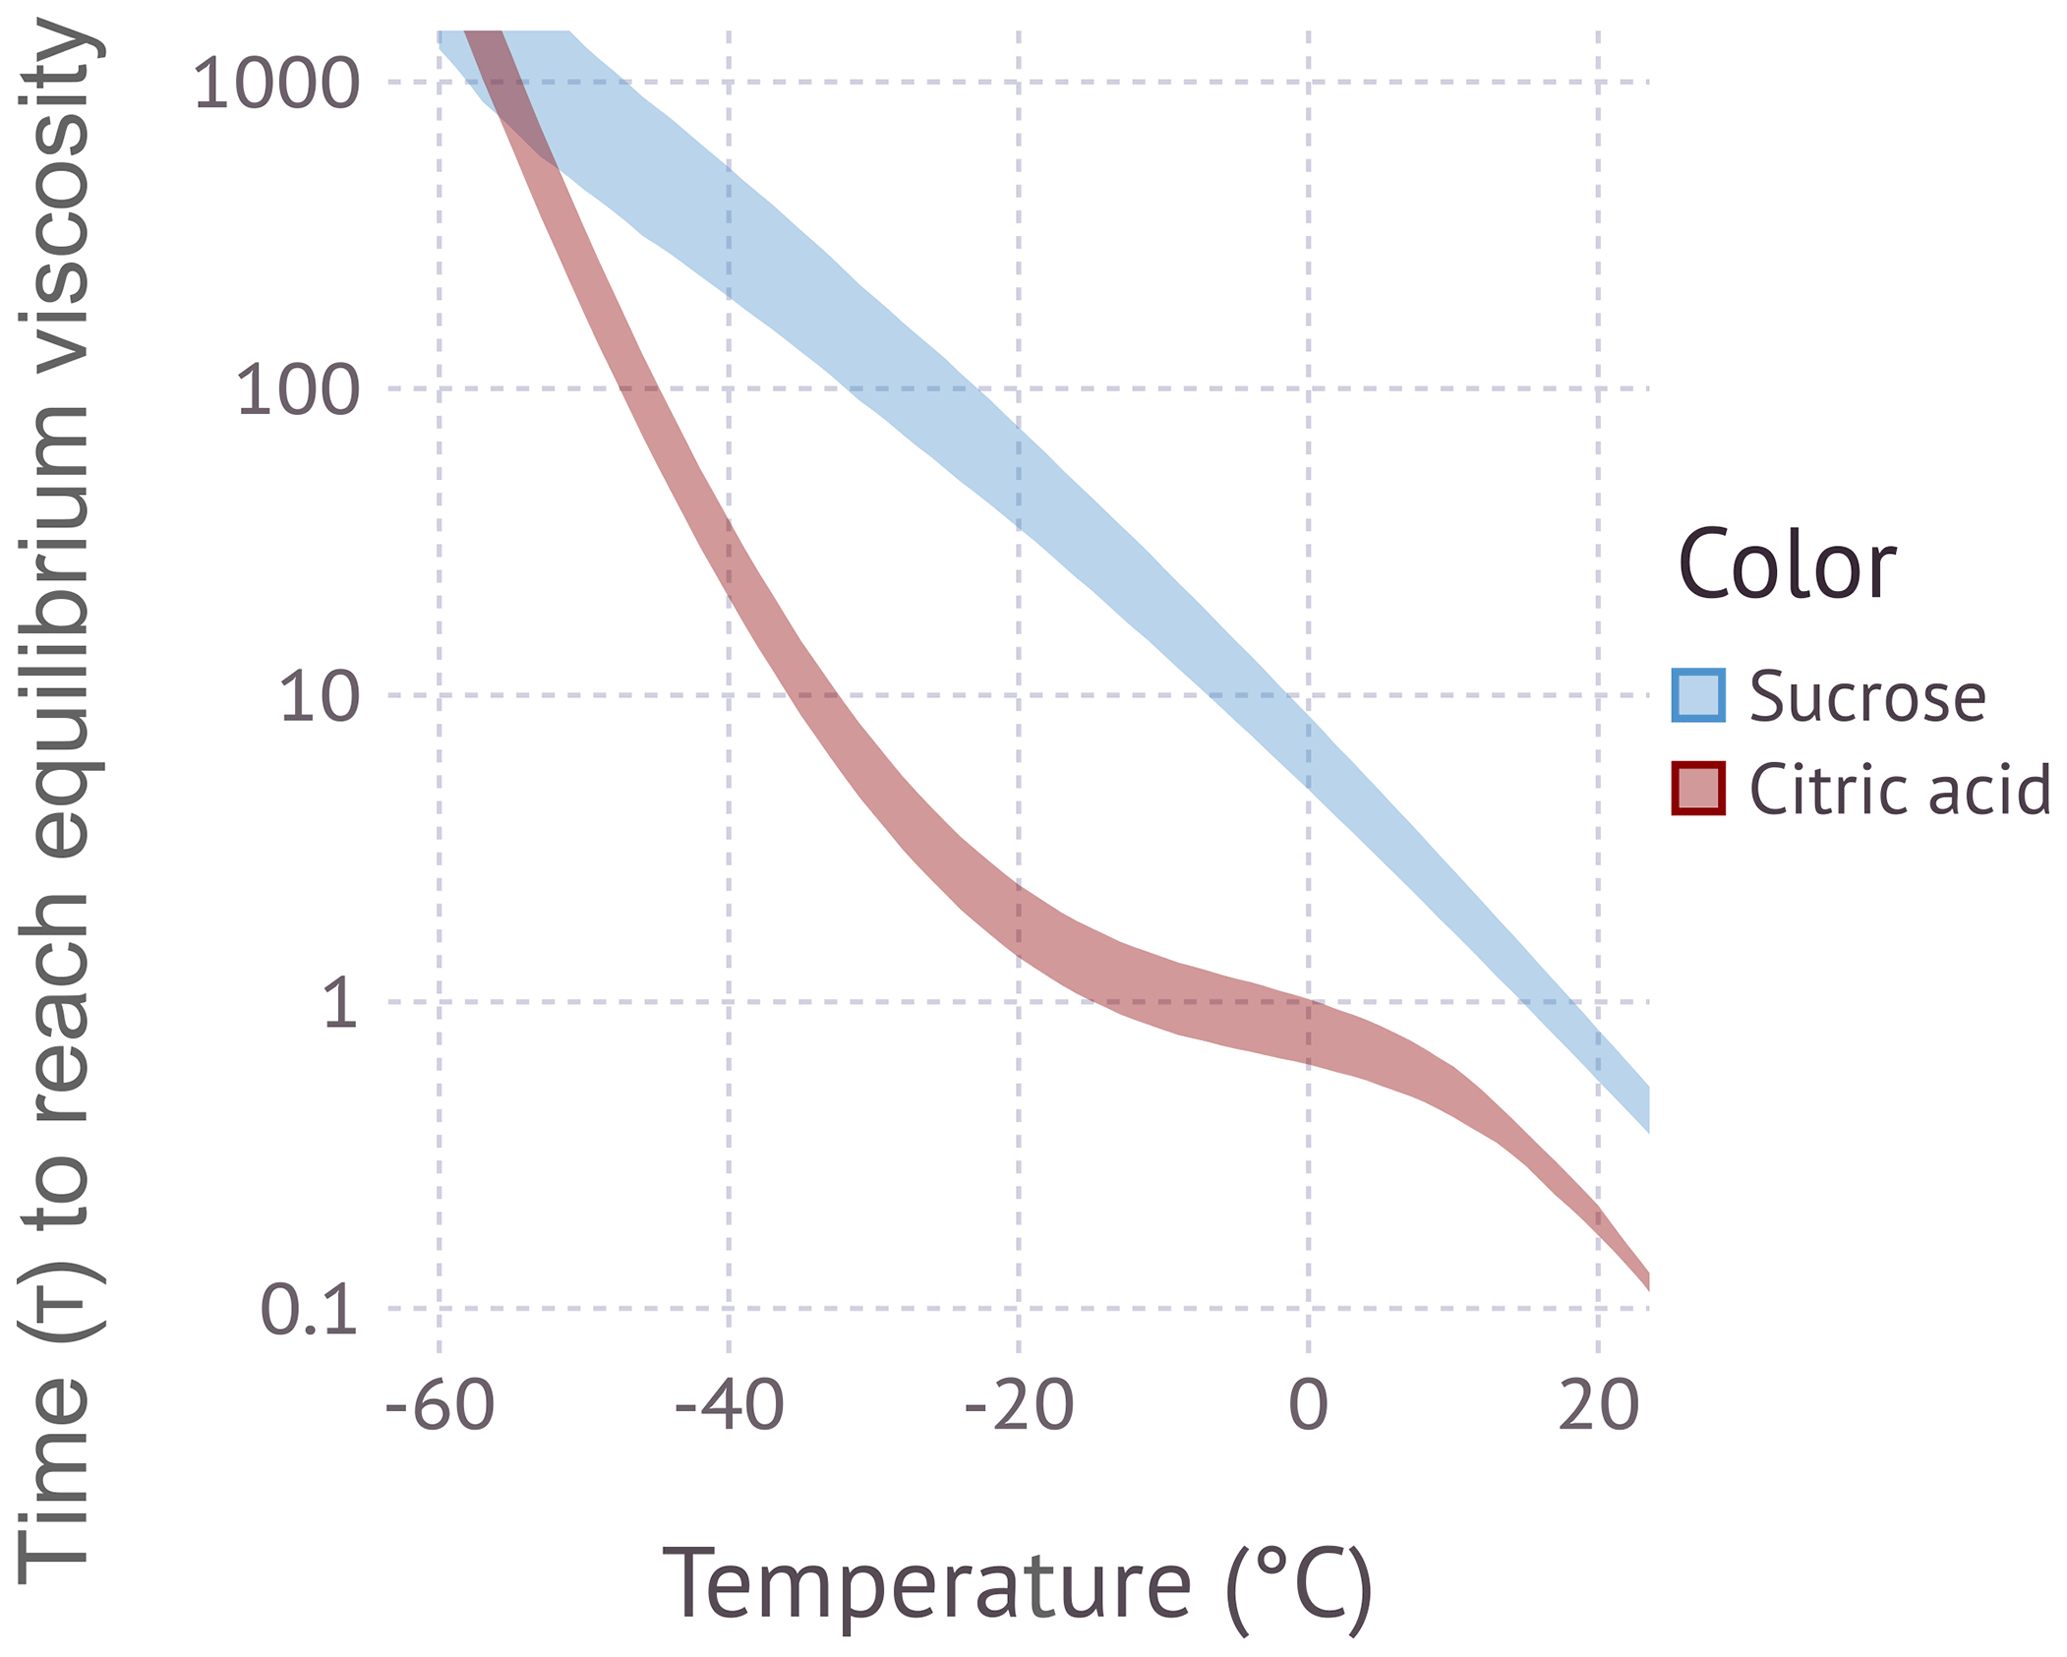
Figure 6Time to reach equilibrium viscosity along the viscosity isopleth shown in Fig. 5. The shading corresponds to the range of 5×10⁶ to 4.8×10⁷ Pa s (sucrose, blue-shaded area) and 5×10⁶ to 3.8×10⁷ Pa s (citric acid, red-shaded area).
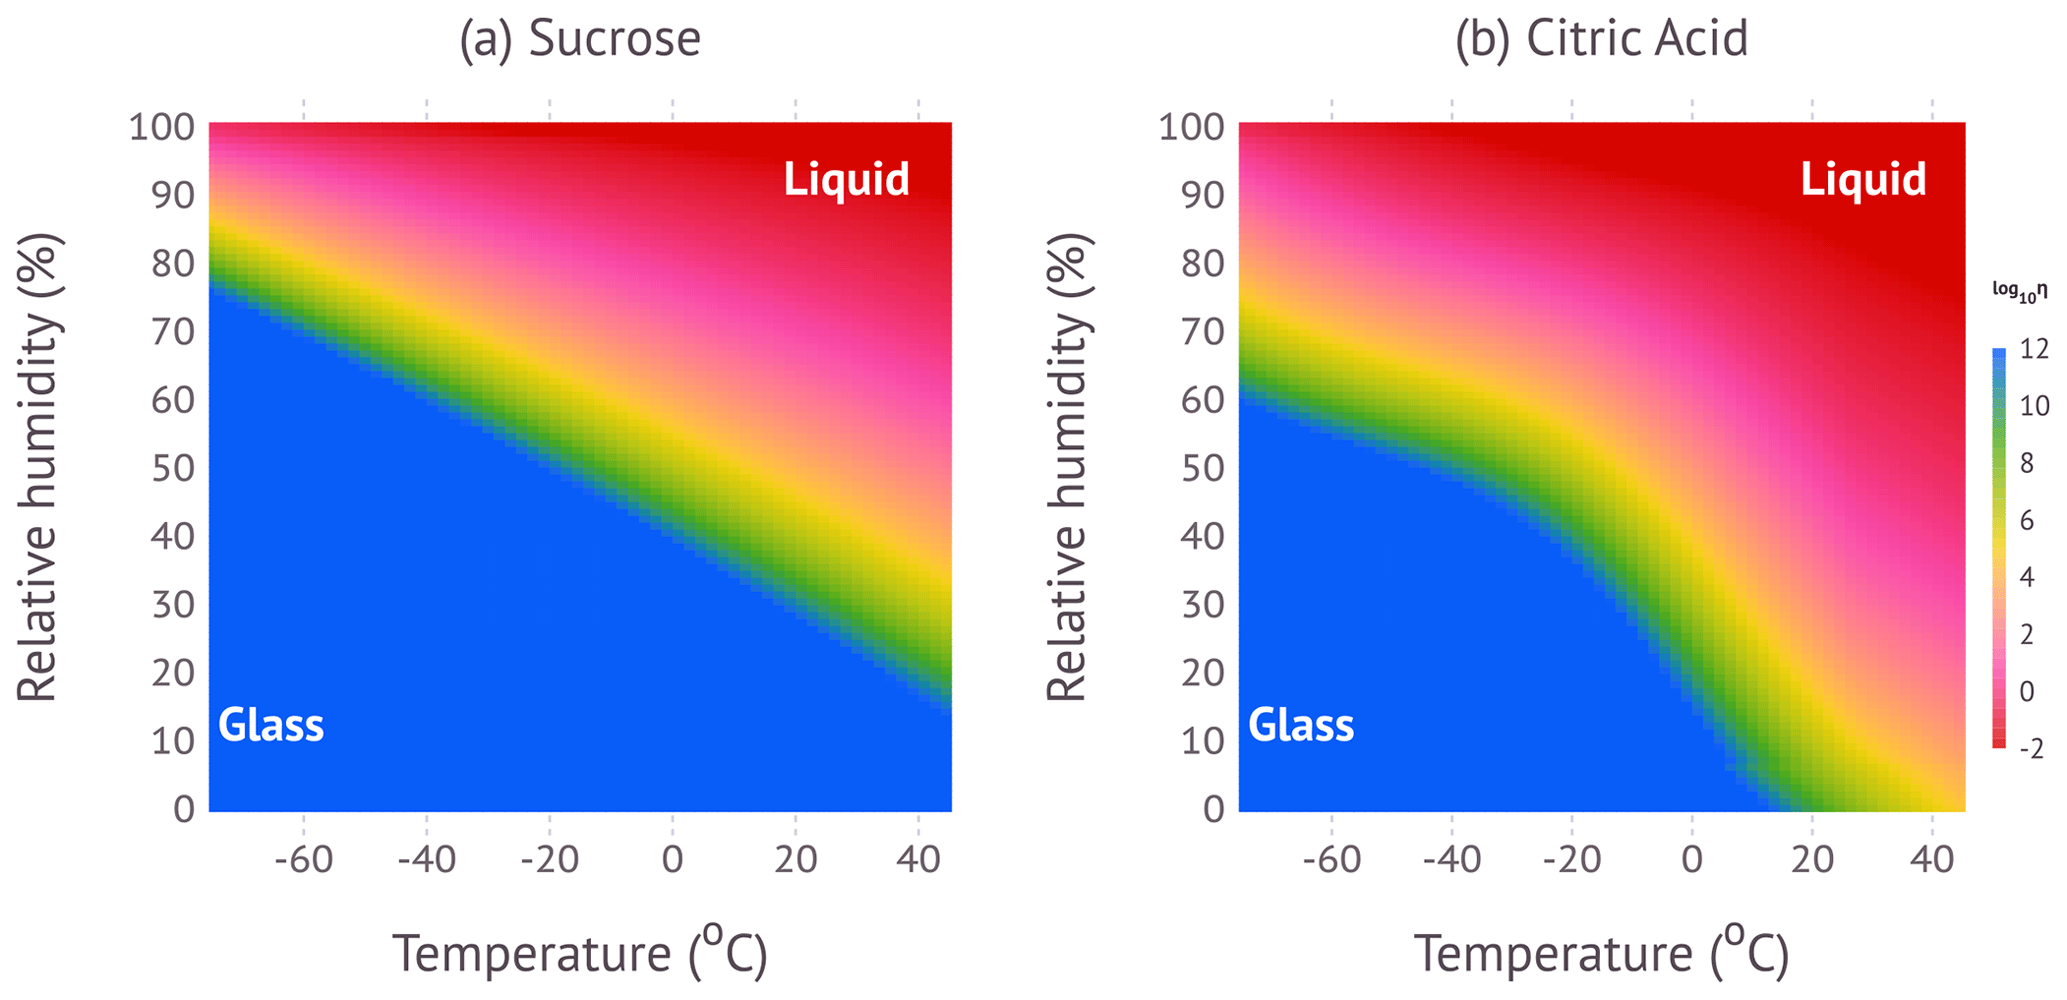
Figure 7 shows a false-color representation of the phase diagrams for sucrose and citric acid using a perceptually uniform color map (Kovesi, 2015). The information is identical to the contours graphed in Fig. 4. Blue colors indicate glassy states; red colors indicate liquid states; and in-between colors indicate semi-solid states. The utility of this diagram is to easily visualize and quantify the phase state and viscosity for a wide range of conditions.
The strong curvature of the viscosity isopleth in the temperature and RH state space for citric acid is caused by the temperature and water content dependence of κm. As noted in previous work (Rothfuss and Petters, 2017a), there is a need to accurately predict the mass fraction of water at low temperature and at low RH to fully characterize the phase diagram. Although this is not an issue here, there are only few studies that quantify equilibrium water content in that regime. For example, measurements of water uptake by secondary organic aerosol (Varutbangkul et al., 2006; Jurányi et al., 2009; Petters et al., 2009; Good et al., 2010; Massoli et al., 2010; Chu et al., 2014; Pajunoja et al., 2015) have focused on RH>50 % and room temperature. The lack of appropriate water activity data remains an impediment to fully characterize the phase diagram for other organic aerosols, including limiting full confidence in predictions of the phase state in large-scale atmospheric models.
The central tenet of this study is the hypothesis that a phase diagram model that involves a water–organic binary mixing rule of the glass transition temperature, a glass-transition-temperature-scaled viscosity fragility parameterization, and a water uptake parameterization connects the four common state spaces used to characterize the amorphous state: glass transition temperature vs. water weight fraction, viscosity vs. temperature, viscosity vs. RH at a constant temperature, and viscosity isopleths as a function of temperature and RH. The model prediction and the synthesis of data from a wide range of sources are in good agreement, as shown in Figs. S1 and 2–4. This suggests that the hypothesized simple phase diagram model can provide a self-consistent description of the four state spaces. This hypothesis is supported for sucrose and citric acid, based on the synthesis of data from a wide range of sources. A key ingredient of the phase diagram model is that the fragility of sucrose and citric acid only weakly depend on water content. This is an empirical and perhaps surprising observation noted previously (Angell, 2002; Longinotti and Corti, 2008) that greatly simplifies the prediction of viscosity. Differences in fragility for dry and aqueous sucrose are apparent in Fig. 3. However, the potential dependence of the fragility of organic compounds on water content and the potential dependence of fragility in systems with multiple dry components at different mass ratios will require rigorous testing before it can be confidently applied for other compound classes.
This work also reports new measurements of viscosity at sub-zero temperatures using the dimer coagulation isolation and coalescence (DCIC) method. Several modifications were made to the system to enable measurements to ∘C. These include a longer coalescence timescale and a more involved drying and temperature control system. Although the data shown here demonstrate that it is feasible, precise temperature and humidity control through the entire system remain challenging. A consequence of this limitation is that the data collected with the DCIC method are not uniformly spaced along the entire ∼107 Pa s viscosity isopleth shown in Fig. 4. In addition to technical constraints related to cooling and drying the DMA and coalescence system, water equilibration timescales present a limit to the lowest temperature that can be studied. Increasing the time in the coalescence chamber to ≫60 s is challenging due to the nature of the flow-through system. The exact lower temperature limit depends on the system studied. Lienhard et al. (2015) summarize the temperature dependence of the water diffusion coefficient in pure component model mixtures. In their compilation of model systems sucrose has the most resistance to diffusion. Based on this we expect that the DCIC method can probably safely be used for T≳−30 ∘C.
Literature data of four common empirical state spaces used to characterize the amorphous phase diagram were compiled including (1) glass transition temperature vs. water weight fraction, (2) viscosity vs. temperature, (3) viscosity vs. RH at a constant temperature, and (4) viscosity isopleths as a function of temperature and RH. The dimer coagulation, isolation, and coalescence method (DCIC) was modified to enable measurement of viscosity isopleths at sub-zero temperatures down to −30 ∘C. Colder temperatures might be accessible using this method for substances that do not show kinetic limitations to water uptake. New measurements of the temperature and RH dependence for sucrose and citric acid were obtained using the DCIC method. The new measurements experimentally constrain the ∼107 Pa s viscosity isopleths. Closure between the four state spaces using a semi-empirical phase diagram model is achieved. A critical component of the phase diagram model is the application of the Angell fragility representation of viscosity, i.e., viscosity scaled by the ratio of temperature and glass transition temperature. The data suggest that fragility is independent of water content for sucrose and citric acid, with the exception of anhydrous sucrose. Kinetic limitations for sucrose were observed at temperatures ∘C. No kinetic limitations were observed for citric acid. The observation related to kinetic limitations is consistent with equilibration timescales predicted by the KM-GAP model.
All data and scripts used to create the figures in this paper are available on Zenodo (https://doi.org/10.5281/zenodo.4287484, Kasparoglu et al., 2020).
The supplement related to this article is available online at: https://doi.org/10.5194/acp-21-1127-2021-supplement.
MDP conceptualized the study. SK performed the experiments and analyzed the data. MS and YL performed the KM-GAP simulations. SK and MDP wrote the paper. All authors commented on the paper.
The authors declare that they have no conflict of interest.
This work was supported by the Office of Biological and Environmental Research, Office of Science, US Department of Energy (grant nos. DE-SC0018265 and DE-SC0018349). The authors thank Paul DeMott for loaning the NESLAB ULT 95 chiller to conduct these studies.
This research has been supported by the Office of Science, US Department of Energy (grant nos. DE-SC0018265 and DE-SC0018349).
This paper was edited by Annele Virtanen and reviewed by two anonymous referees.
Angell, C. A.: Formation of Glasses from Liquids and Biopolymers, Science, 267, 1924, https://doi.org/10.1126/science.267.5206.1924, 1995. a
Angell, C. A.: Liquid Fragility and the Glass Transition in Water and Aqueous Solutions, Chem. Rev., 102, 2627–2650, https://doi.org/10.1021/cr000689q, 2002. a, b, c, d, e
Apelblat, A.: Citric Acid, Springer, Cham, 2014. a, b, c, d
Berkemeier, T., Shiraiwa, M., Pöschl, U., and Koop, T.: Competition between water uptake and ice nucleation by glassy organic aerosol particles, Atmos. Chem. Phys., 14, 12513–12531, https://doi.org/10.5194/acp-14-12513-2014, 2014. a, b, c
Champion, W. M., Rothfuss, N. E., Petters, M. D., and Grieshop, A. P.: Volatility and Viscosity Are Correlated in Terpene Secondary Organic Aerosol Formed in a Flow Reactor, Environ. Sci. Tech. Lett., 6, 513–519, https://doi.org/10.1021/acs.estlett.9b00412, 2019. a, b
Chu, B., Wang, K., Takekawa, H., Li, J., Zhou, W., Jiang, J., Ma, Q., He, H., and Hao, J.: Hygroscopicity of Particles Generated from Photooxidation of α-Pinene under Different Oxidation Conditions in the Presence of Sulfate Seed Aerosols, J. Environ. Sci.-China, 26, 129–139, https://doi.org/10.1016/S1001-0742(13)60402-7, 2014. a
Debenedetti, P. G. and Stillinger, F. H.: Supercooled Liquids and the Glass Transition, Nature, 410, 259–267, https://doi.org/10.1038/35065704, 2001. a
DeRieux, W.-S. W., Li, Y., Lin, P., Laskin, J., Laskin, A., Bertram, A. K., Nizkorodov, S. A., and Shiraiwa, M.: Predicting the glass transition temperature and viscosity of secondary organic material using molecular composition, Atmos. Chem. Phys., 18, 63316351, https://doi.org/10.5194/acp-18-6331-2018, 2018. a, b, c, d
Dette, H. P., Qi, M., Schröder, D. C., Godt, A., and Koop, T.: Glass-Forming Properties of 3-Methylbutane-1,2,3-Tricarboxylic Acid and Its Mixtures with Water and Pinonic Acid, J. Phys. Chem. A, 118, 7024–7033, https://doi.org/10.1021/jp505910w, 2014. a
Elamin, A. A., Sebhatu, T., and Ahlneck, C.: The Use of Amorphous Model Substances to Study Mechanically Activated Materials in the Solid State, Int. J. Pharmaceut., 119, 25–36, https://doi.org/10.1016/0378-5173(94)00364-B, 1995. a, b
Först, P., Werner, F., and Delgado, A.: On the Pressure Dependence of the Viscosity of Aqueous Sugar Solutions, Rheol. Acta, 41, 369–374, https://doi.org/10.1007/s00397-002-0238-y, 2002. a, b
Fulcher, G. S.: Analysis of Recent Measurements of the Viscosity of Glasses, J. Am. Ceram. Soc., 8, 339–355, https://doi.org/10.1111/j.1151-2916.1925.tb16731.x, 1925. a, b
Gervasi, N. R., Topping, D. O., and Zuend, A.: A predictive group-contribution model for the viscosity of aqueous organic aerosol, Atmos. Chem. Phys., 20, 2987–3008, https://doi.org/10.5194/acp-20-2987-2020, 2020. a, b
Good, N., Topping, D. O., Duplissy, J., Gysel, M., Meyer, N. K., Metzger, A., Turner, S. F., Baltensperger, U., Ristovski, Z., Weingartner, E., Coe, H., and McFiggans, G.: Widening the gap between measurement and modelling of secondary organic aerosol properties?, Atmos. Chem. Phys., 10, 2577–2593, https://doi.org/10.5194/acp-10-2577-2010, 2010. a
Gordon, M. and Taylor, J. S.: Ideal Copolymers and the Second-Order Transitions of Synthetic Rubbers. i. Non-Crystalline Copolymers, J. Appl. Chem., 2, 493–500, https://doi.org/10.1002/jctb.5010020901, 1952. a, b
Haynes, W. M. and Lide, D. R. (Eds.): CRC Handbook of Chemistry and Physics: A Ready-Reference Book of Chemical and Physical Data, CRC Press, Boca Raton, Fl., 92nd edn., 2011–2012 edn., 2011. a, b, c, d, e
Ignatius, K., Kristensen, T. B., Järvinen, E., Nichman, L., Fuchs, C., Gordon, H., Herenz, P., Hoyle, C. R., Duplissy, J., Garimella, S., Dias, A., Frege, C., Höppel, N., Tröstl, J., Wagner, R., Yan, C., Amorim, A., Baltensperger, U., Curtius, J., Donahue, N. M., Gallagher, M. W., Kirkby, J., Kulmala, M., Möhler, O., Saathoff, H., Schnaiter, M., Tomé, A., Virtanen, A., Worsnop, D., and Stratmann, F.: Heterogeneous ice nucleation of viscous secondary organic aerosol produced from ozonolysis of α-pinene, Atmos. Chem. Phys., 16, 6495–6509, https://doi.org/10.5194/acp-16-6495-2016, 2016. a
Jansson, H., Bergman, R., and Swenson, J.: Dynamics of Sugar Solutions as Studied by Dielectric Spectroscopy, J. Non-Cryst. Solids, 351, 2858–2863, https://doi.org/10.1016/j.jnoncrysol.2005.04.086, 2005. a, b
Järvinen, E., Ignatius, K., Nichman, L., Kristensen, T. B., Fuchs, C., Hoyle, C. R., Höppel, N., Corbin, J. C., Craven, J., Duplissy, J., Ehrhart, S., El Haddad, I., Frege, C., Gordon, H., Jokinen, T., Kallinger, P., Kirkby, J., Kiselev, A., Naumann, K.-H., Petäjä, T., Pinterich, T., Prevot, A. S. H., Saathoff, H., Schiebel, T., Sengupta, K., Simon, M., Slowik, J. G., Tröstl, J., Virtanen, A., Vochezer, P., Vogt, S., Wagner, A. C., Wagner, R., Williamson, C., Winkler, P. M., Yan, C., Baltensperger, U., Donahue, N. M., Flagan, R. C., Gallagher, M., Hansel, A., Kulmala, M., Stratmann, F., Worsnop, D. R., Möhler, O., Leisner, T., and Schnaiter, M.: Observation of viscosity transition in α-pinene secondary organic aerosol, Atmos. Chem. Phys., 16, 4423–4438, https://doi.org/10.5194/acp-16-4423-2016, 2016. a
Jimenez, J. L., Canagaratna, M. R., Donahue, N. M., Prevot, A. S. H., Zhang, Q., Kroll, J. H., DeCarlo, P. F., Allan, J. D., Coe, H., Ng, N. L., Aiken, A. C., Docherty, K. S., Ulbrich, I. M., Grieshop, A. P., Robinson, A. L., Duplissy, J., Smith, J. D., Wilson, K. R., Lanz, V. A., Hueglin, C., Sun, Y. L., Tian, J., Laaksonen, A., Raatikainen, T., Rautiainen, J., Vaattovaara, P., Ehn, M., Kulmala, M., Tomlinson, J. M., Collins, D. R., Cubison, M. J., E., Dunlea, J., Huffman, J. A., Onasch, T. B., Alfarra, M. R., Williams, P. I., Bower, K., Kondo, Y., Schneider, J., Drewnick, F., Borrmann, S., Weimer, S., Demerjian, K., Salcedo, D., Cottrell, L., Griffin, R., Takami, A., Miyoshi, T., Hatakeyama, S., Shimono, A., Sun, J. Y., Zhang, Y. M., Dzepina, K., Kimmel, J. R., Sueper, D., Jayne, J. T., Herndon, S. C., Trimborn, A. M., Williams, L. R., Wood, E. C., Middlebrook, A. M., Kolb, C. E., Baltensperger, U., and Worsnop, D. R.: Evolution of Organic Aerosols in the Atmosphere, Science, 326, 1525–1529, https://doi.org/10.1126/science.1180353, 2009. a
Jurányi, Z., Gysel, M., Duplissy, J., Weingartner, E., Tritscher, T., Dommen, J., Henning, S., Ziese, M., Kiselev, A., Stratmann, F., George, I., and Baltensperger, U.: Influence of Gas-to-Particle Partitioning on the Hygroscopic and Droplet Activation Behaviour of Alpha-Pinene Secondary Organic Aerosol, Phys. Chem. Chem. Phys., 11, 8091–8097, https://doi.org/10.1039/b904162a, 2009. a
Kasparoglu, S., Li, Y., Shiraiwa, M., and Petters, M.: Dataset for “Toward closure between predicted and observed particle viscosity over a wide range temperature and relative humidity”, Zenodo, https://doi.org/10.5281/zenodo.4287484, 2020. a
Kelly, F. J. and Fussell, J. C.: Air Pollution and Airway Disease: Air Pollution and Airway Disease, Clin. Exp. Allergy, 41, 1059–1071, https://doi.org/10.1111/j.1365-2222.2011.03776.x, 2011. a
Koop, T., Bookhold, J., Shiraiwa, M., and Pöschl, U.: Glass Transition and Phase State of Organic Compounds: Dependency on Molecular Properties and Implications for Secondary Organic Aerosols in the Atmosphere, Phys. Chem. Chem. Phys., 13, 19238–19255, https://doi.org/10.1039/C1CP22617G, 2011. a, b, c, d
Kovesi, P.: Good Colour Maps: How to Design Them, arXiv [preprint], , arXiv:1509.03700, 2015. a
Kreidenweis, S. M., Petters, M. D., and DeMott, P. J.: Single-Parameter Estimates of Aerosol Water Content, Environ. Res. Lett., 3, 035002, https://doi.org/10.1088/1748-9326/3/3/035002, 2008. a
Laguerie, C., Aubry, M., and Couderc, J. P.: Some Physicochemical Data on Monohydrate Citric Acid Solutions in Water: Solubility, Density, Viscosity, Diffusivity, pH of Standard Solution, and Refractive Index, J. Chem. Eng. Data, 21, 85–87, https://doi.org/10.1021/je60068a031, 1976. a, b, c, d
Li, Y. and Shiraiwa, M.: Timescales of secondary organic aerosols to reach equilibrium at various temperatures and relative humidities, Atmos. Chem. Phys., 19, 5959–5971, https://doi.org/10.5194/acp-19-5959-2019, 2019. a, b
Li, Y., Day, D. A., Stark, H., Jimenez, J. L., and Shiraiwa, M.: Predictions of the glass transition temperature and viscosity of organic aerosols from volatility distributions, Atmos. Chem. Phys., 20, 8103–8122, https://doi.org/10.5194/acp-20-8103-2020, 2020. a
Lienhard, D. M., Bones, D. L., Zuend, A., Krieger, U. K., Reid, J. P., and Peter, T.: Measurements of Thermodynamic and Optical Properties of Selected Aqueous Organic and Organic–Inorganic Mixtures of Atmospheric Relevance, J. Phys. Chem. A, 116, 9954–9968, https://doi.org/10.1021/jp3055872, 2012. a, b, c, d
Lienhard, D. M., Huisman, A. J., Krieger, U. K., Rudich, Y., Marcolli, C., Luo, B. P., Bones, D. L., Reid, J. P., Lambe, A. T., Canagaratna, M. R., Davidovits, P., Onasch, T. B., Worsnop, D. R., Steimer, S. S., Koop, T., and Peter, T.: Viscous organic aerosol particles in the upper troposphere: diffusivity-controlled water uptake and ice nucleation?, Atmos. Chem. Phys., 15, 13599–13613, https://doi.org/10.5194/acp-15-13599-2015, 2015. a
Longinotti, M. P. and Corti, H. R.: Viscosity of Concentrated Sucrose and Trehalose Aqueous Solutions Including the Supercooled Regime, J. Phys. Chem. Ref. Data, 37, 1503–1515, https://doi.org/10.1063/1.2932114, 2008. a, b, c
Lu, Q. and Zografi, G.: Properties of Citric Acid at the Glass Transition, J. Pharm. Sci., 86, 1374–1378, https://doi.org/10.1021/js970157y, 1997. a, b
Luyet, B. and Rasmussen, D.: Study by Differential Thermal Analysis of the Temperatures of Instability of Rapidly Cooled Solutions of Glycerol, Ethylene Glycol, Sucrose and Glucose, Biodynamica, 10, 167–191, 1968. a
Maltini, E. and Anese, M.: Evaluation of Viscosities of Amorphous Phases in Partially Frozen Systems by WLF Kinetics and Glass Transition Temperatures, Food Res. Int., 28, 367–372, https://doi.org/10.1016/0963-9969(95)00006-8, 1995. a, b, c
Mar, T. F., Norris, G. A., Koenig, J. Q., and Larson, T. V.: Associations between Air Pollution and Mortality in Phoenix, 1995–1997, Environ. Health Persp., 108, 347–353, https://doi.org/10.1289/ehp.00108347, 2000. a
Marsh, A., Petters, S. S., Rothfuss, N. E., Rovelli, G., Song, Y. C., Reid, J. P., and Petters, M. D.: Amorphous Phase State Diagrams and Viscosity of Ternary Aqueous Organic/Organic and Inorganic/Organic Mixtures, Phys. Chem. Chem. Phys., 20, 15086–15097, https://doi.org/10.1039/C8CP00760H, 2018. a, b, c, d, e, f, g, h, i, j, k, l, m, n
Massoli, P., Lambe, A. T., Ahern, A. T., Williams, L. R., Ehn, M., Mikkilä, J., Canagaratna, M. R., Brune, W. H., Onasch, T. B., Jayne, J. T., Petäjä, T., Kulmala, M., Laaksonen, A., Kolb, C. E., Davidovits, P., and Worsnop, D. R.: Relationship between Aerosol Oxidation Level and Hygroscopic Properties of Laboratory Generated Secondary Organic Aerosol (SOA) Particles, Geophys. Res. Lett., 37, L24801, https://doi.org/10.1029/2010GL045258, 2010. a
Mazurkiewicz, J., Tomasik, P., and Zapłotny, J.: Relationships between Water Activity and Viscosity of Solutions, Food Hydrocolloid., 15, 43–46, https://doi.org/10.1016/S0268-005X(00)00048-5, 2001. a
McCormick, R. A. and Ludwig, J. H.: Climate Modification by Atmospheric Aerosols, Science, 156, 1358–1359, 1967. a
Mikhailov, E., Vlasenko, S., Rose, D., and Pöschl, U.: Mass-based hygroscopicity parameter interaction model and measurement of atmospheric aerosol water uptake, Atmos. Chem. Phys., 13, 717–740, https://doi.org/10.5194/acp-13-717-2013, 2013. a
Murray, B. J.: Inhibition of ice crystallisation in highly viscous aqueous organic acid droplets, Atmos. Chem. Phys., 8, 5423–5433, https://doi.org/10.5194/acp-8-5423-2008, 2008. a
Omran, M. M., Kiani, F., Saraei, A. G.-H., Koohyar, F., and Rostami, A. M.: Determination and Study on Refractive Indices and Viscosities of Aqueous Solutions of Citric Acid, (Citric Acid + Glycerol), and (Citric Acid + d-Sorbitol) at T=293.15 K–323.15 K and Atmospheric Pressure, Food Chem., 289, 436–442, https://doi.org/10.1016/j.foodchem.2019.03.075, 2019. a, b, c, d
Pajunoja, A., Lambe, A. T., Hakala, J., Rastak, N., Cummings, M. J., Brogan, J. F., Hao, L., Paramonov, M., Hong, J., Prisle, N. L., Malila, J., Romakkaniemi, S., Lehtinen, K. E. J., Laaksonen, A., Kulmala, M., Massoli, P., Onasch, T. B., Donahue, N. M., Riipinen, I., Davidovits, P., Worsnop, D. R., Petäjä, T., and Virtanen, A.: Adsorptive Uptake of Water by Semisolid Secondary Organic Aerosols, Geophys. Res. Lett., 42, 3063–3068, https://doi.org/10.1002/2015GL063142, 2015. a
Petters, M. and Kasparoglu, S.: Predicting the Influence of Particle Size on the Glass Transition Temperature and Viscosity of Secondary Organic Material, Sci. Rep.-UK, 10, 15170, https://doi.org/10.1038/s41598-020-71490-0, 2020. a
Petters, M. D.: A Language to Simplify Computation of Differential Mobility Analyzer Response Functions, Aerosol Sci. Tech., 52, 1437–1451, https://doi.org/10.1080/02786826.2018.1530724, 2018. a
Petters, M. D., Wex, H., Carrico, C. M., Hallbauer, E., Massling, A., McMeeking, G. R., Poulain, L., Wu, Z., Kreidenweis, S. M., and Stratmann, F.: Towards closing the gap between hygroscopic growth and activation for secondary organic aerosol Part 2: Theoretical approaches, Atmos. Chem. Phys., 9, 3999–4009, https://doi.org/10.5194/acp-9-3999-2009, 2009. a
Petters, S. S. and Petters, M. D.: Surfactant Effect on Cloud Condensation Nuclei for Two-Component Internally Mixed Aerosols, J. Geophys. Res.-Atmos., 121, 1878–1895, https://doi.org/10.1002/2015JD024090, 2016. a
Petters, S. S., Kreidenweis, S. M., Grieshop, A. P., Ziemann, P. J., and Petters, M. D.: Temperature- and Humidity-Dependent Phase States of Secondary Organic Aerosols, Geophys. Res. Lett., 46, 1005–1013, https://doi.org/10.1029/2018GL080563, 2019. a, b, c, d, e
Pokluda, O., Bellehumeur, C. T., and Vlachopoulos, J.: Modification of Frenkel's Model for Sintering, AIChE J., 43, 3253–3256, https://doi.org/10.1002/aic.690431213, 1997. a
Pope, C. A., Burnett, R. T., Thurston, G. D., Thun, M. J., Calle, E. E., Krewski, D., and Godleski, J. J.: Cardiovascular Mortality and Long-Term Exposure to Particulate Air Pollution: Epidemiological Evidence of General Pathophysiological Pathways of Disease, Circulation, 109, 71–77, https://doi.org/10.1161/01.CIR.0000108927.80044.7F, 2004. a
Power, R. M., Simpson, S. H., Reid, J. P., and Hudson, A. J.: The Transition from Liquid to Solid-like Behaviour in Ultrahigh Viscosity Aerosol Particles, Chem. Sci., 4, 2597–2604, https://doi.org/10.1039/C3SC50682G, 2013. a, b, c, d, e
Quintas, M., Brandão, T., Silva, C., and Cunha, R.: Rheology of Supersaturated Sucrose Solutions, J. Food Eng., 77, 844–852, https://doi.org/10.1016/j.jfoodeng.2005.08.011, 2006. a, b
Renbaum-Wolff, L., Grayson, J. W., Bateman, A. P., Kuwata, M., Sellier, M., Murray, B. J., Shilling, J. E., Martin, S. T., and Bertram, A. K.: Viscosity of α-Pinene Secondary Organic Material and Implications for Particle Growth and Reactivity, P. Natl. Acad. Sci. USA, 110, 8014–8019, https://doi.org/10.1073/pnas.1219548110, 2013. a
Renzetti, S., van den Hoek, I. A., and van der Sman, R. G.: Amino Acids, Polyols and Soluble Fibres as Sugar Replacers in Bakery Applications: Egg White Proteins Denaturation Controlled by Hydrogen Bond Density of Solutions, Food Hydrocolloid., 108, 106034, https://doi.org/10.1016/j.foodhyd.2020.106034, 2020. a
Rothfuss, N. E. and Petters, M. D.: Coalescence-Based Assessment of Aerosol Phase State Using Dimers Prepared through a Dual-Differential Mobility Analyzer Technique, Aerosol Sci. Tech., 50, 1294–1305, https://doi.org/10.1080/02786826.2016.1221050, 2016. a, b, c, d
Rothfuss, N. E. and Petters, M. D.: Characterization of the Temperature and Humidity-Dependent Phase Diagram of Amorphous Nanoscale Organic Aerosols, Phys. Chem. Chem. Phys., 19, 6532–6545, https://doi.org/10.1039/C6CP08593H, 2017a. a, b, c, d, e, f, g, h, i, j, k, l, m, n, o, p
Rothfuss, N. E. and Petters, M. D.: Influence of Functional Groups on the Viscosity of Organic Aerosol, Environ. Sci. Technol., 51, 271–279, https://doi.org/10.1021/acs.est.6b04478, 2017b. a, b, c, d, e, f, g
Rothfuss, N. E., Petters, S. S., Champion, W. M., Grieshop, A. P., and Petters, M. D.: Characterization of a Dimer Preparation Method for Nanoscale Organic Aerosol, Aerosol Sci. Tech., 39, 998–1011, https://doi.org/10.1080/02786826.2019.1623379, 2019. a, b, c, d
Saleki-Gerhardt, A. and Zografi, G.: Non-Isothermal and Isothermal Crystallization of Sucrose from the Amorphous State, Pharmaceut. Res., 11, 1166–1173, https://doi.org/10.1023/A:1018945117471, 1994. a, b
Sastri, S. and Rao, K.: A New Group Contribution Method for Predicting Viscosity of Organic Liquids, Chem Eng. J., 50, 9–25, https://doi.org/10.1016/0300-9467(92)80002-R, 1992. a
Saukko, E., Lambe, A. T., Massoli, P., Koop, T., Wright, J. P., Croasdale, D. R., Pedernera, D. A., Onasch, T. B., Laaksonen, A., Davidovits, P., Worsnop, D. R., and Virtanen, A.: Humidity-dependent phase state of SOA particles from biogenic and anthropogenic precursors, Atmos. Chem. Phys., 12, 7517–7529, https://doi.org/10.5194/acp-12-7517-2012, 2012. a
Shiraiwa, M. and Seinfeld, J. H.: Equilibration Timescale of Atmospheric Secondary Organic Aerosol Partitioning, Geophys. Res. Lett., 39, 2012GL054008, https://doi.org/10.1029/2012GL054008, 2012. a
Shiraiwa, M., Pfrang, C., Koop, T., and Pöschl, U.: Kinetic multi-layer model of gas-particle interactions in aerosols and clouds (KM-GAP): linking condensation, evaporation and chemical reactions of organics, oxidants and water, Atmos. Chem. Phys., 12, 2777–2794, https://doi.org/10.5194/acp-12-2777-2012, 2012. a, b
Shiraiwa, M., Li, Y., Tsimpidi, A. P., Karydis, V. A., Berkemeier, T., Pandis, S. N., Lelieveld, J., Koop, T., and Pöschl, U.: Global Distribution of Particle Phase State in Atmospheric Secondary Organic Aerosols, Nat. Commun., 8, 15002, https://doi.org/10.1038/ncomms15002, 2017. a, b, c
Shrivastava, M., Lou, S., Zelenyuk, A., Easter, R. C., Corley, R. A., Thrall, B. D., Rasch, P. J., Fast, J. D., Massey Simonich, S. L., Shen, H., and Tao, S.: Global Long-Range Transport and Lung Cancer Risk from Polycyclic Aromatic Hydrocarbons Shielded by Coatings of Organic Aerosol, P. Natl. Acad. Sci. USA, 114, 1246–1251, https://doi.org/10.1073/pnas.1618475114, 2017. a
Simion, Ionuţ, A., Grigoras, C.-G., and Gavrilă, L. G.: Modelling of the thermophysical properties of citric acid aqueous solutions. Density and viscosity, Annu. Rev. Food Sci. T., 15, 10, 2014. a, b, c, d
Šimkovic, I., Šurina, I., and Vričan, M.: Primary Reactions of Sucrose Thermal Degradation, J. Anal. Appl. Pyrol., 70, 493–504, https://doi.org/10.1016/S0165-2370(03)00007-X, 2003. a
Song, M., Liu, P. F., Hanna, S. J., Li, Y. J., Martin, S. T., and Bertram, A. K.: Relative humidity-dependent viscosities of isoprene-derived secondary organic material and atmospheric implications for isoprene-dominant forests, Atmos. Chem. Phys., 15, 5145–5159, https://doi.org/10.5194/acp-15-5145-2015, 2015. a
Song, Y. C., Haddrell, A. E., Bzdek, B. R., Reid, J. P., Bannan, T., Topping, D. O., Percival, C., and Cai, C.: Measurements and Predictions of Binary Component Aerosol Particle Viscosity, J. Phys. Chem. A, 120, 8123–8137, https://doi.org/10.1021/acs.jpca.6b07835, 2016. a, b, c, d, e, f, g
Summers, M. and Enever, R.: Glass Transition Temperature of Citric Acid, J. Pharm. Sci., 69, 612–613, https://doi.org/10.1002/jps.2600690542, 1980. a, b, c
Swindells, J., Snyder, C., Hardy, R., Golden, P., and of Standards, U. S. N. B.: Viscosities of Sucrose Solutions at Various Temperatures: Tables of Recalculated Values, National Bureau of Standards Circular, US Department of Commerce, National Bureau of Standards, U.S. Government Printing Office, Washington DC, available at: https://nvlpubs.nist.gov/nistpubs/Legacy/circ/nbscircular440sup.pdf (last access: 22 January 2021), 1958. a, b
Tandon, A., Rothfuss, N. E., and Petters, M. D.: The effect of hydrophobic glassy organic material on the cloud condensation nuclei activity of particles with different morphologies, Atmos. Chem. Phys., 19, 3325–3339, https://doi.org/10.5194/acp-19-3325-2019, 2019. a, b, c
Telis, V., Telis-Romero, J., Mazzotti, H., and Gabas, A.: Viscosity of Aqueous Carbohydrate Solutions at Different Temperatures and Concentrations, Int. J. Food Prop., 10, 185–195, https://doi.org/10.1080/10942910600673636, 2007. a, b
Thomas, L. H., Meatyard, R., Smith, H., and Davies, G. H.: Viscosity Behavior of Associated Liquids at Lower Temperatures and Vapor Pressures, J. Chem. Eng. Data, 24, 161–164, https://doi.org/10.1021/je60082a011, 1979. a
Ullmann, D. A., Hinks, M. L., Maclean, A. M., Butenhoff, C. L., Grayson, J. W., Barsanti, K., Jimenez, J. L., Nizkorodov, S. A., Kamal, S., and Bertram, A. K.: Viscosities, diffusion coefficients, and mixing times of intrinsic fluorescent organic molecules in brown limonene secondary organic aerosol and tests of the StokesEinstein equation, Atmos. Chem. Phys., 19, 1491–1503, https://doi.org/10.5194/acp-19-1491-2019, 2019. a
van der Sman, R., van den Hoek, I., and Renzetti, S.: Sugar Replacement with Zwitterionic Plasticizers like Amino Acids, Food Hydrocolloid., 109, 106113, https://doi.org/10.1016/j.foodhyd.2020.106113, 2020. a
Vander Wall, A. C., Perraud, V., Wingen, L. M., and Finlayson-Pitts, B. J.: Evidence for a Kinetically Controlled Burying Mechanism for Growth of High Viscosity Secondary Organic Aerosol, Environ. Sci.-Proc. Imp., 22, 66–83, https://doi.org/10.1039/C9EM00379G, 2020. a
Varutbangkul, V., Brechtel, F. J., Bahreini, R., Ng, N. L., Keywood, M. D., Kroll, J. H., Flagan, R. C., Seinfeld, J. H., Lee, A., and Goldstein, A. H.: Hygroscopicity of secondary organic aerosols formed by oxidation of cycloalkenes, monoterpenes, sesquiterpenes, and related compounds, Atmos. Chem. Phys., 6, 2367–2388, https://doi.org/10.5194/acp-6-2367-2006, 2006. a
Wright, T. P., Song, C., Sears, S., and Petters, M. D.: Thermodynamic and Kinetic Behavior of Glycerol Aerosol, Aerosol Sci. Tech., 50, 1385–1396, https://doi.org/10.1080/02786826.2016.1245405, 2016. a
Zaveri, R. A., Shilling, J. E., Zelenyuk, A., Liu, J., Bell, D. M., D'Ambro, E. L., Gaston, C. J., Thornton, J. A., Laskin, A., Lin, P., Wilson, J., Easter, R. C., Wang, J., Bertram, A. K., Martin, S. T., Seinfeld, J. H., and Worsnop, D. R.: Growth Kinetics and Size Distribution Dynamics of Viscous Secondary Organic Aerosol, Environ. Sci. Technol., 52, 1191–1199, https://doi.org/10.1021/acs.est.7b04623, 2018. a
Zhang, Q., Jimenez, J. L., Canagaratna, M. R., Allan, J. D., Coe, H., Ulbrich, I., Alfarra, M. R., Takami, A., Middlebrook, A. M., Sun, Y. L., Dzepina, K., Dunlea, E., Docherty, K., DeCarlo, P. F., Salcedo, D., Onasch, T., Jayne, J. T., Miyoshi, T., Shimono, A., Hatakeyama, S., Takegawa, N., Kondo, Y., Schneider, J., Drewnick, F., Borrmann, S., Weimer, S., Demerjian, K., Williams, P., Bower, K., Bahreini, R., Cottrell, L., Griffin, R. J., Rautiainen, J., Sun, J. Y., Zhang, Y. M., and Worsnop, D. R.: Ubiquity and Dominance of Oxygenated Species in Organic Aerosols in Anthropogenically-Influenced Northern Hemisphere Midlatitudes, Geophys. Res. Lett., 34, L13801, https://doi.org/10.1029/2007GL029979, 2007. a
Zhang, Y., Nichman, L., Spencer, P., Jung, J. I., Lee, A., Heffernan, B. K., Gold, A., Zhang, Z., Chen, Y., Canagaratna, M. R., Jayne, J. T., Worsnop, D. R., Onasch, T. B., Surratt, J. D., Chandler, D., Davidovits, P., and Kolb, C. E.: The Cooling Rate- and Volatility-Dependent Glass-Forming Properties of Organic Aerosols Measured by Broadband Dielectric Spectroscopy, Environ. Sci. Technol., https://doi.org/10.1021/acs.est.9b03317, 2019. a
Zobrist, B., Marcolli, C., Pedernera, D. A., and Koop, T.: Do atmospheric aerosols form glasses?, Atmos. Chem. Phys., 8, 5221–5244, https://doi.org/10.5194/acp-8-5221-2008, 2008. a, b, c, d
Zobrist, B., Soonsin, V., Luo, B. P., Krieger, U. K., Marcolli, C., Peter, T., and Koop, T.: Ultra-Slow Water Diffusion in Aqueous Sucrose Glasses, Phys. Chem. Chem. Phys., 13, 3514–3526, https://doi.org/10.1039/C0CP01273D, 2011. a, b