the Creative Commons Attribution 4.0 License.
the Creative Commons Attribution 4.0 License.
 | 19 Aug 2020
Rate coefficients for reactions of OH with aromatic and aliphatic volatile organic compounds determined by the multivariate relative rate technique
Jacob T. Shaw
Andrew R. Rickard
Mike J. Newland
The multivariate relative rate method was applied to a range of volatile organic compound (VOC) reactions with OH. This previously published method (Shaw et al., 2018) was improved to increase the sensitivity towards more slowly reacting VOCs, broadening the range of compounds which can be examined. A total of 35 room temperature relative rate coefficients were determined, eight of which have not previously been reported. Five of the new reaction rate coefficients were for large alkyl substituted mono-aromatic species recently identified in urban air masses, likely with large ozone production potentials. The new results (with kOH (296 K) values in units of 10−12 cm3 molec.−1 s−1) were n-butylbenzene, 11 (±4); n-pentylbenzene, 7 (±2); 1,2-diethylbenzene, 14 (±4); 1,3-diethylbenzene, 22 (±4); and 1,4-diethylbenzene, 16 (±4). Interestingly, whilst results for smaller VOCs agreed well with available structure–activity relationship (SAR) calculations, the larger alkyl benzenes were found to be less reactive than the SAR prediction, indicating that our understanding of the oxidation chemistry of these compounds is still limited. kOH (296 K) rate coefficients (in units of 10−12 cm3 molec.−1 s−1) for reactions of three large alkanes with OH were also determined for the first time: 2-methylheptane, 9.1 (±0.3); 2-methylnonane, 11.0 (±0.3); and ethylcyclohexane, 14.4 (±0.3), all in reasonable agreement with SAR predictions. Rate coefficients for the 27 previously studied OH + VOC reactions agreed well with available literature values, lending confidence to the application of this method for the rapid and efficient simultaneous study of gas-phase reaction kinetics.
- Article
(1909 KB) - Full-text XML
-
Supplement
(623 KB) - BibTeX
- EndNote


The troposphere contains many thousands of organic compounds (Lewis et al., 2000; Goldstein and Galbally, 2007). These compounds differ substantially in their chemical and physical properties. Volatile organic compounds (VOCs) are organic chemicals which take part in photochemical degradation cycles leading to the formation of ground-level ozone and photochemical smog and the production of secondary organic aerosols – significantly impacting upon air quality and climate.
Aromatic VOCs can account for a large proportion of the non-methane hydrocarbon mass in the atmosphere. At least 90 different aromatic compounds have been identified in diesel fuel (Hamilton and Lewis, 2003). Aromatics are therefore particularly prevalent in heavily urbanized environments associated with large amounts of fuel combustion and solvent use. For example, aromatic VOCs were reported to account for up to 33 % of the VOC emission mass from vehicle exhaust in China (Guo et al., 2011; Cao et al., 2016). Summed concentrations of 11 aromatic compounds were measured to be 30 ppbv in Yokohama City (Tiwari et al., 2010). In Mumbai, the total concentration of five aromatic compounds was measured to be 27 (±8) ppbv in Mumbai (Pandit et al., 2011). Peak concentrations of aromatic VOCs can be much greater, however; Dunmore et al. (2015) measured daily wintertime peaks for mono-aromatics containing four carbon atoms as part of alkyl substituents (henceforth C4 aromatics) of 500 ppbv, associated with extensive traffic pollution in London.
Whilst many aromatic species are known to exist in the atmosphere, measurements of OH + aromatic VOC rate coefficients are sparse. The IUPAC Task Group on Atmospheric Chemical Kinetic Data Evaluation provides evaluated rate coefficients for 26 OH + aromatic reactions, including cresols, phenols, nitrophenols, quinones, and furans (Atkinson et al., 2006). Calvert et al. (2002) provide an evaluation of a further 18 reactions between OH and aromatic VOCs with alkyl substituents. More recently, Jenkin et al. (2018a) have developed an updated aromatic + OH structure–activity relationship (SAR) based on a compiled database of 67 monocyclic aromatic hydrocarbons and oxygenated organic compounds, including eight higher alkyl-substituted benzenes and four alkenylbenzenes. Despite their ubiquity in the urban atmosphere, repeat measurements of OH + aromatic VOC rate coefficients by different laboratories are rare; only toluene, o- and m-xylene, and the three isomers of trimethylbenzene have five or more example measurements in the literature. The number of available rate coefficient measurements drastically decreases with increasing substituent size of aromatic VOCs.
The propensity for VOCs to generate tropospheric ozone through their photochemical oxidation is indicated by their photochemical ozone creation potentials (POCPs). This model-calculated reactivity index describes the relative capability for an organic compound to produce ozone over north-west Europe (Derwent et al., 1998, 2007). Mono-aromatics with two, or three, alkyl substituents, containing one, two, or three carbon atoms (henceforth C1, C2, and C3 aromatics) have relatively large POCP values, meaning that they are amongst the emitted species with the greatest potential for producing ozone (Derwent et al., 2007).
Many measurement techniques fail to detect aromatic compounds with larger alkyl substituents (greater than three carbons) and are therefore limited to quantifying the smaller substituted aromatics, such as toluene, xylenes, and trimethylbenzenes. In the absence of measured values, toluene-equivalency ratios can provide a prediction of the additional aromatic content of the atmosphere based on measured concentrations of the smaller aromatic compounds (Lidster et al., 2014). However, using toluene concentration as a proxy for concentrations of larger aromatics requires knowledge of their rate coefficient for reaction with OH; this is often unavailable for C4 and larger aromatics.
Reactions between aromatic VOCs and the hydroxyl radical (OH) primarily involve OH addition to the aromatic ring. For benzene and the methyl- and ethyl-substituted aromatics this pathway dominates at room temperature, accounting for greater than 90 % of the OH reaction. The reaction produces a hydroxyalkylcyclohexadienyl radical, or OH-aromatic adduct, which can decompose back to VOC + OH, or be captured by reaction with O2 or NO2. Pseudo first-order rate coefficients for the OH-adduct + O2 capture reaction and for the OH-adduct back decomposition are 1000 and 1 s−1 respectively at [O2] = 0.2 atm (Vereecken, 2019). Thus, while in the troposphere, effectively all of the OH adduct is captured by reaction with O2. In laboratory studies performed at low O2 concentrations, the competition of these pathways can lead to non-atmospherically relevant product distribution and must be considered (Ji et al., 2017; Newland et al., 2017). The OH adduct can also react with NO2, but the ratio of the O2 and NO2 rate coefficients is such that, under typical atmospheric conditions, monocyclic aromatics react almost exclusively with O2 (Knispel et al., 1990; Koch et al., 1994; Bohn and Zetzsch, 1999; Bohn, 2001). Meta-substituted aromatics, such as m-xylene, react faster than their ortho- and para- counterparts owing to enhanced electrophilic addition of OH leading to the formation of a resonance stabilized tertiary radical addition product (Ravishankara et al., 1978; Nicovich et al., 1981; Mehta et al., 2009). Arrhenius plots for the reactions of VOCs with OH tend to exhibit complex behaviour; two distinct regions are visible over a large temperature range. It is thought that the OH-aromatic adduct undergoes thermal decomposition at temperatures greater than 325 K, so that the H-atom abstraction pathway becomes the dominant reaction mechanism as temperature increases. The atmospheric lifetime of the OH-aromatic adduct is predicted to be approximately 0.3 s at 298 K (Atkinson and Arey, 2003). This decreases rapidly with temperature to an approximate lifetime of 20 µs at 450 K. To gain a thorough understanding of the oxidation of aromatic VOCs, these reactions need to be studied across the typical range of atmospheric conditions.
Alkanes are also ubiquitous in the urban atmosphere and are generally associated with vehicle emissions. Approximately 40 % of the chemicals found in exhaust emissions are alkanes (Guo et al., 2011; Cao et al., 2016), but this can increase to up to 90 % when the engine loading is above 30 % (Pereira et al., 2018). Long-chain diesel-related aliphatic hydrocarbon species (C10–C13) have been observed to dominate the gas-phase reactive carbon in cities with high diesel fleet fractions (Dunmore et al., 2015) and have also been detected in engine exhaust (Erickson et al., 2014).
The relative rate method is an established technique for the measurement of rate coefficients for the reactions of VOCs with OH. Recent developments in the analytical capabilities of instrumentation have allowed for the development of an extension to the technique, in which multiple reactions can be monitored simultaneously (Shaw, 2018; Shaw et al., 2018). Rather than measuring a target reaction relative to a single reference reaction, target reactions are placed on an absolute basis relative to a suite of similar reference reactions, reducing the reliance on using any single value as a reference. This multivariate technique has been used to measure the rates of reaction for 19 VOCs with OH at room temperature and for 25 VOCs (12 of which were aromatic VOCs) with OH at an elevated temperature of 323 (±10) K (Shaw et al., 2018).
In this work, laboratory-based experiments were conducted to study the gas-phase kinetics of a suite of atmospherically important reactions of aromatic and aliphatic VOCs with OH. Use of the multivariate relative rate technique allowed the rapid determination of 35 rate coefficients (kOH (296 K)) including for C3 and C4 mono-substituted benzenes, a range of diethylbenzene isomers, and a number of methyl- and ethyl-branched alkanes that were, to the best of our knowledge, previously unknown.
A detailed description of the multivariate relative rate technique was provided in Shaw et al. (2018). Briefly, three synthetic gas mixtures were prepared by injecting 1–7 mm3 of undiluted VOC into a 500 cm3 evacuated sample cylinder (Swagelok) and flushing through into a pacified gas cylinder (10 L, Experis, Air Products) with N2 (Fig. S1 in the Supplement). A two-stage dilution process was required to achieve approximate mixing ratios of each VOC in the cylinder of 40 parts per billion by volume (ppbv). Gas-phase reactants were mixed in a flow reactor under conditions of 1 bar (N2) and 296 (±2) K. Photochemical oxidation reactions were initiated through the use of a low-pressure Hg∕Ar lamp (L.O.T., Pen-Ray®); OH radicals were generated by the photolysis of H2O via Reaction (R1). It was expected that the atomic H by-product was rapidly converted to HO2 by reaction with molecular oxygen, which could not be fully excluded from the reactor (Reaction R2; cm3 molec.−1 s−1 at 1 bar N2 and 300 K; Atkinson et al., 2006).
To limit photolysis of the aromatic VOC, by either the 185 nm emission or by the principal Hg emission band at 254 nm, the gas mixture was introduced into the reactor downstream of the photolysis zone via a moveable injector (Cryer, 2016; Shaw, 2018). Depletion of VOC due to photolysis was not observed for mixtures containing m- and o-xylene (Shaw, 2018). Flow rates of the VOC gas mixture and the diluting N2 bath gas containing H2O were controlled by various mass flow controllers (MKS and Tylan). Assuming a constant total flow rate of 3000 cm3 min−1 into the reactor, the VOCs were estimated to have a residence time of 4 s, of which OH was estimated to persist for no longer than 0.5 s.
Samples were collected with the lamp alternately switched off and on, thereby generating two datasets: one in which the VOC concentrations were representative of their cylinder concentration and one in which the VOC concentrations were depleted by reaction with OH. The depletion factor for a VOC due to reaction with OH was related to its rate coefficient for reaction with OH by Eq. (1) (Shaw, 2018). The integral of OH concentration as a factor of time is referred to as the OH exposure (OHexp); all VOCs in the gas mixture should experience identical exposure to OH radicals. By simultaneously measuring depletion factors for a range of VOCs with different reactivities towards OH, the system was calibrated with respect to rate coefficient. A rate coefficient value for the reaction between each VOC and OH could then be calculated relative to all other reactions, by placing the depletion factor vs. k relationship on an absolute basis.
Producing OH via the photolysis of H2O also resulted in the production of HO2 (Reaction R2). Although HO2 is much less reactive towards VOCs than OH, it may represent a significant OH sink within the reactor via Reaction (R3). The recommended rate coefficient for this reaction is cm3 molec.−1 s−1 (Atkinson et al., 2006); thus this reaction may proceed at a rate fast enough to compete with the VOC for OH.
Whilst this was not an issue with the synthetic gas mixtures measured in Shaw et al. (2018), some of the mixtures in this work contained more slowly reacting VOCs. Hence, the HO2 may outcompete the VOCs for OH, resulting in only negligible depletions in the VOC concentrations.
The impact of HO2 was minimized by adding NO into the reactive mix. This served two purposes. Firstly, NO reacts with HO2 (Reaction R4) with a recommended rate coefficient of cm3 molec.−1 s−1 (Atkinson et al., 2006). Although this value is much smaller than that for the HO2+OH reaction, the addition of significant quantities of NO reduced the amount of OH lost to reaction with HO2. Secondly, one of the products of the HO2+NO reaction is OH. This reaction therefore served as a secondary source for OH radicals, effectively converting the photolysis by-product (HO2) into useful OH.
The gas chromatography–mass spectrometry (GC–MS) system used for chromatographic separation and detection was an Agilent 6890 (Agilent Technologies) fitted with a DB5-MS ultra-inert capillary column (60 m × 0.32 mm ID × 1 µm film, Agilent Technologies), coupled to a Markes International BenchTOF© mass spectrometer. The temperature ramping in the GC oven varied between mixtures to optimally resolve all mixture components; the sample turnarounds, across both GC method and thermal desorption unit (TDU) setup, were approximately 20 min. For a full description of the gas sampling and analysis, please refer to Shaw et al. (2018).
Experimental results from four synthetic gas mixtures containing aromatic VOCs are presented in Sect. 3.1. Results and conclusions drawn from numerical simulations are presented in Sect. 3.2. All errors presented in this work represent 1σ (66 %) and account for the statistical uncertainties calculated by combining the instrument error and the scatter in the relative rate plots. It is worth noting that the uncertainties quoted on the evaluated literature reference values are often large (up to 35 % of the measured value); using these values to place the measured data on an absolute basis therefore limits the final precision of the results in this work. These limitations may not be captured by the quoted uncertainties.
3.1 Results from relative rate experiments at 296 K
The measured depletion factor for each VOC in Mixture 1 was plotted against their evaluated rate coefficients using Eq. (1) (Fig. 1). This demonstrates the typical linear relationship between depletion factor and rate coefficient. Mixture 1 contained several aromatic VOCs with multiple methyl substituents, such as the three trimethylbenzene isomers and two isomers of tetramethylbenzene. Multiple, well-evaluated reference reactions (OH + isoprene, OH + pinenes, OH + xylenes) were included as part of this mixture to place the relative rate values on a reliable absolute scale. The rate coefficient results for this mixture are provided in Table 1. All of the measured values were in excellent agreement with the evaluated literature rate coefficients. In particular, the results for the tetramethylbenzene + OH reactions were in good agreement with their literature counterparts, despite their only being measured once or twice previously (Aschmann et al., 2013; Alarcón et al., 2015).
Table 1Results of relative rate experiments, with evaluated literature data, for each VOC in Mixture 1, ordered by evaluated literature k value. The measured values presented here are the weighted averages of five individual experiments conducted with different mixture OH reactivities (see Fig. S4).
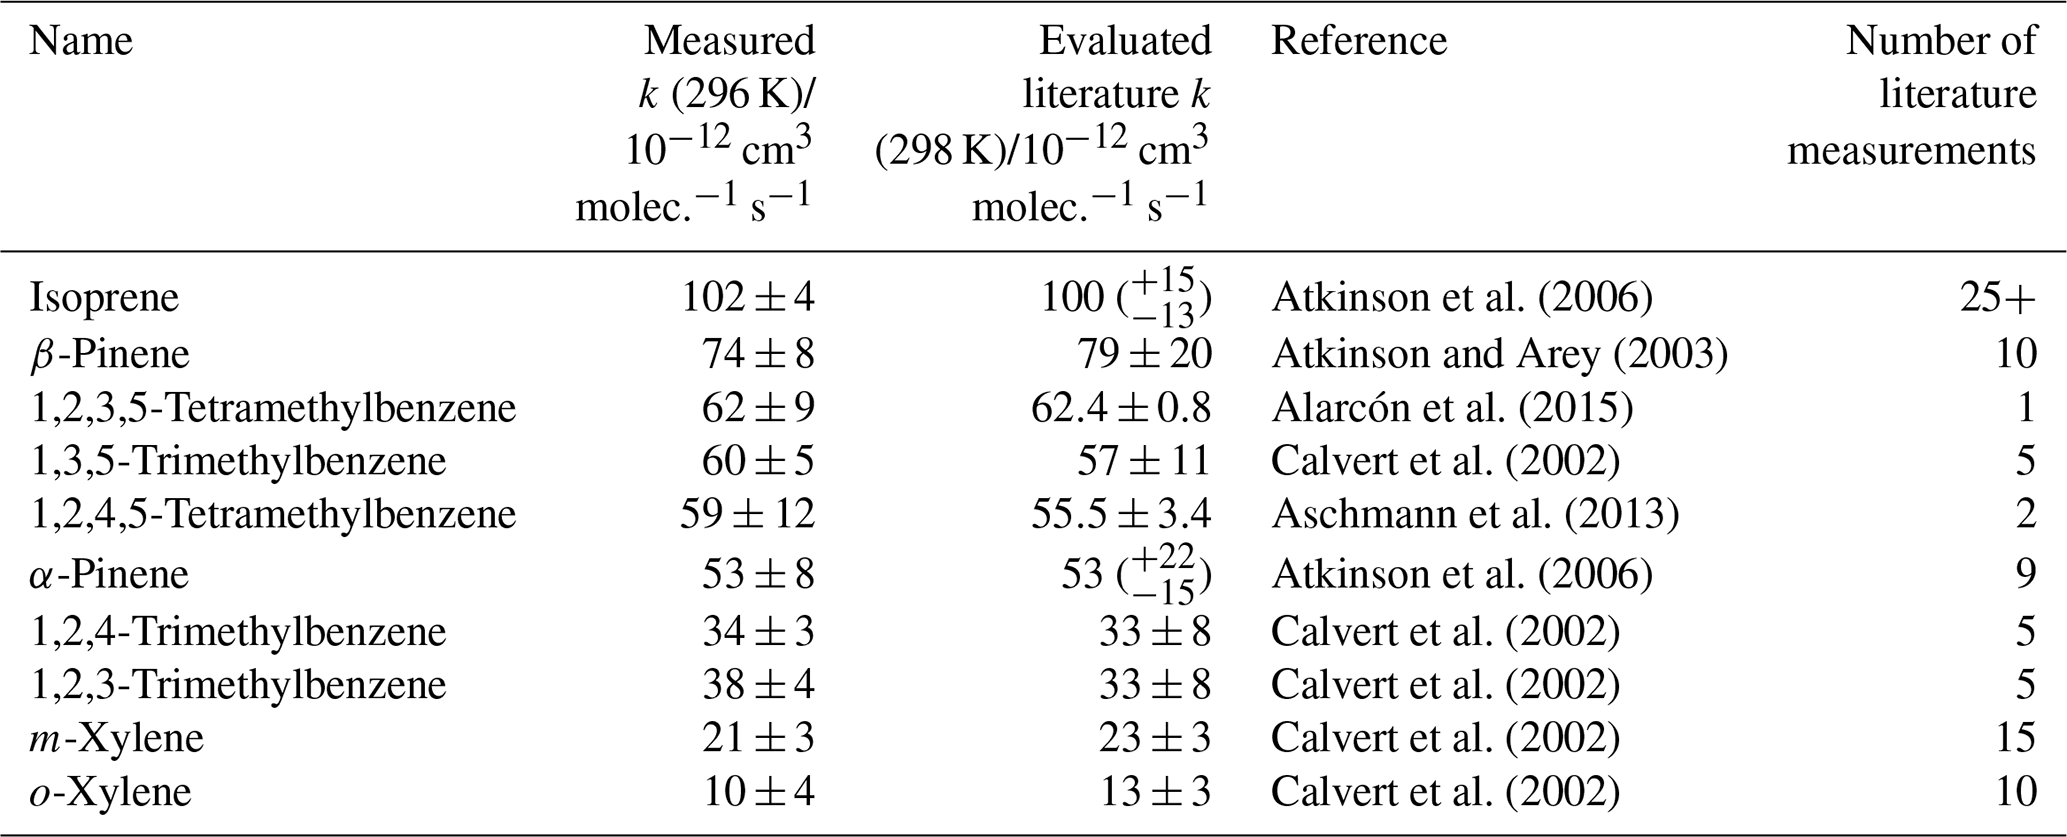

Figure 1Relative rate plot for Mixture 1 (OH reactivity of 48 s−1) in the absence of NO at 296 (±2) K. Compounds with a reference rate coefficient for reaction with OH using evaluated literature values. Error bars on the y axis, equal to 1 standard error, were calculated by combining the standard error in peak areas for eight lamp-off and eight lamp-on samples. Error bars on the x axis were typically large (approximately ±20 %–30 %) and accounted for deviations from the predicted trend for all VOCs. A weighted (to the uncertainty in the y values) linear fit was used to generate the slope with OH molec. cm−3 s and R2=0.980. The VOCs can be identified as follows: 1, o-xylene; 2, m-xylene; 3, 1,2,4-trimethylbenzene; 4, 1,2,3-trimethylbenzene; 5, α-pinene; 6, 1,2,4,5-tetramethylbenzene; 7, 1,3,5-trimethylbenzene; 8, 1,2,3,5-tetramethylbenzene; 9, β-pinene; 10, isoprene.
Figure S2 in the Supplement shows sections of typical ion chromatograms (TICs) obtained for Mixture 2: one chromatogram with the reactor lamp turned off (blue) and one for a sample with the reactor lamp turned on (black). There was a clear, but small, reduction in the peak areas observed with the lamp on relative to the lamp off, corresponding to the depletion in the VOCs due to reaction with OH. Figure S2 also shows that the observed reduction for the peak assigned to n-pentylbenzene was negligible.
Figure 2 shows the relative rate plot for Mixture 2 (see Table 2) with an OH reactivity (in the reactor) of approximately 18 s−1. A linear relationship between depletion factor and k was observed, but the scale of the depletion factor was exceptionally low when compared with similar plots for more reactive mixtures (such as Mixture 1, Fig. 1, or those in Shaw et al., 2018). Typically, when using synthetic mixtures containing relatively fast-reacting isoprenoid species such as monoterpenes, the measured depletion factors were greater than 0.1 for all VOCs. The depletion factors measured here were equivalent to depletions of less than a few percent; for example, t-butyl- and n-pentylbenzene recorded depletions of just 0.3 % and 0.2 % respectively. These small depletions were attributed to the presence of HO2 within the reactor, which represented a greater sink for OH than the VOCs themselves, given their relatively slow reactions with OH.
Table 2Results of relative rate experiments, with evaluated literature data, for each VOC in Mixture 2, ordered by evaluated literature k value. The results of experiments using different concentrations of NO are presented, along with a mean measured k value for each VOC, weighted to the errors in the individual NO experiments. Each iteration with a different [NO] comprised three individual experiments with different OH reactivities of mixture injected into the reactor. Figure S3 shows the relative rate plots for Mixture 2 with an OH reactivity (in the reactor) of 18 s−1 and NO concentrations of 0, 30, and 70 ppb.


Figure 2Relative rate plot for Mixture 2 (OH reactivity of 18 s−1) in the absence of NO at 296 (±2) K. Compounds with a reference rate coefficient for reaction with OH were plotted using evaluated literature values. Error bars on the y axis, equal to 1 standard error, were calculated by combining the standard error in peak areas for six lamp-off and six lamp-on samples. Error bars on the x axis were typically large (approximately ±20 %–30 %) and accounted for deviations from the predicted trend for most VOCs. A weighted (to the uncertainty in the y values) linear fit was used to generate the slope with OH molec. cm−3 s and R2=0.899. Data for n-pentylbenzene (A) were not used in the calculation of OHexp but were included on the plot to illustrate its measured depletion factor. The dashed arrow indicates that the k value for the target compound is determined by where it would fall on the measured OHexp curve. The VOCs can be identified as follows: 1, t-butylbenzene; 2, toluene; 3, n-propylbenzene; 4, isopropylbenzene; 5, ethylbenzene; 6, 2-ethyltoluene; 7, 4-ethyltoluene; 8, o-xylene; 9, 3-ethyltoluene; 10, m-xylene.
In an attempt to increase the depletion factor, NO was added to the reactor to convert HO2 to OH (see Reaction R4). There was an observed increase in the measured depletion factors for each of the VOCs corresponding with the increased [NO] in the reactor. The percentage depletions in t-butyl- and n-pentylbenzene increased to 2.3 % and 3.0 % respectively when using [NO] = 70 ppb (see Table S1 in the Supplement). The addition of NO to the system therefore resulted in increased VOC depletions; this was especially useful for the slowest-reacting VOCs, for which the observed depletions were often below the limit of detection in the absence of NO.
Table 2 provides the estimated rate coefficient values for the reaction of each VOC in Mixture 2 with OH, as calculated using Eq. (1). Measured k values are provided for each of the three experiments using different NO concentrations together with an overall weighted mean for each of the VOC + OH reactions. Results for all 10 reactions, except that for n-propylbenzene, were in agreement with evaluated literature rate coefficients, within errors. The rate coefficient for n-pentylbenzene + OH, kOH (296 K) = 5.3 (±0.7) × 10−12 cm3 molec.−1 s−1, is one of two determinations reported in this study.
Figure 3 shows the results from a third mixture comprising 10 aromatic VOCs and three simple linear and branched alkanes (Table 3). The alkanes were used as well-characterized reference reactions to assist with the diagnosis of the depletion factor vs. rate coefficient trend. The final results for this mixture are provided in Table 3. All measured rate coefficients were in agreement with their corresponding evaluated literature values. The measured rate coefficient for the n-propylbenzene + OH reaction was larger than the evaluated literature counterpart by approximately 20 % but was consistent within errors. This mixture contained a homologous series of mono-substituted aromatic VOCs with an increasing alkyl-substituent chain length, from toluene (C6H5CH3) to n-pentylbenzene (C6H5(CH2)4CH3). The results for this series of reactions show that the rate coefficient increased with increasing number of carbon atoms in the aryl group up to four carbon atoms, although the measurement for kOH + n-butylbenzene had a large derived uncertainty. The rate coefficient for reaction with OH then decreased with the addition of the extra carbon atom from n-butylbenzene to n-pentylbenzene. The rate coefficient for the n-butylbenzene + OH has not been measured previously. The rate coefficient for the n-pentylbenzene + OH, kOH (296 K) = 7 (±2) × 10−12 cm3 molec.−1 s−1, is in agreement with the same measurement in Mixture 2, within 1σ uncertainties.
Table 3Results of relative rate experiments, with evaluated literature data, for each VOC in Mixture 3, ordered by evaluated literature k value. The measured values presented here are the weighted averages of five individual experiments conducted with different mixture OH reactivities and 40 ppbv NO. Five VOCs had no reported data for their reactions with OH.
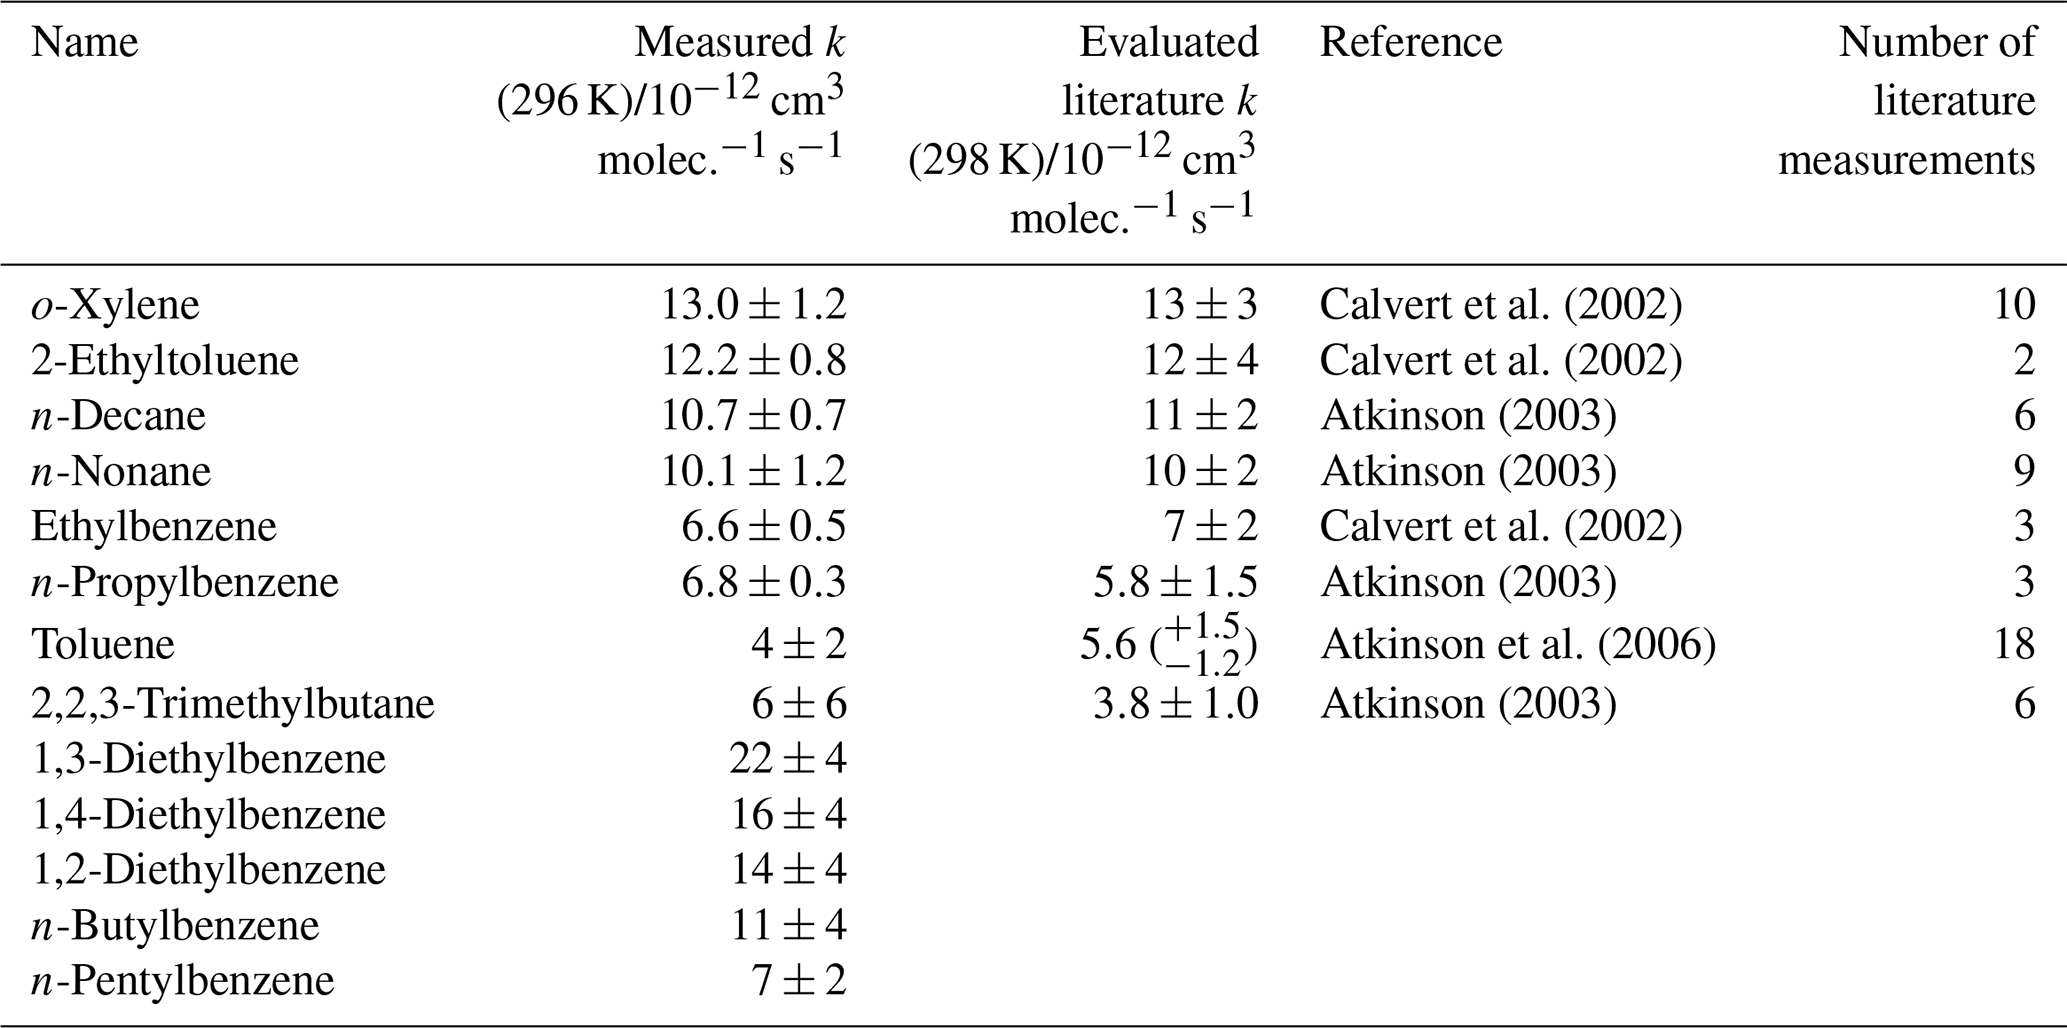
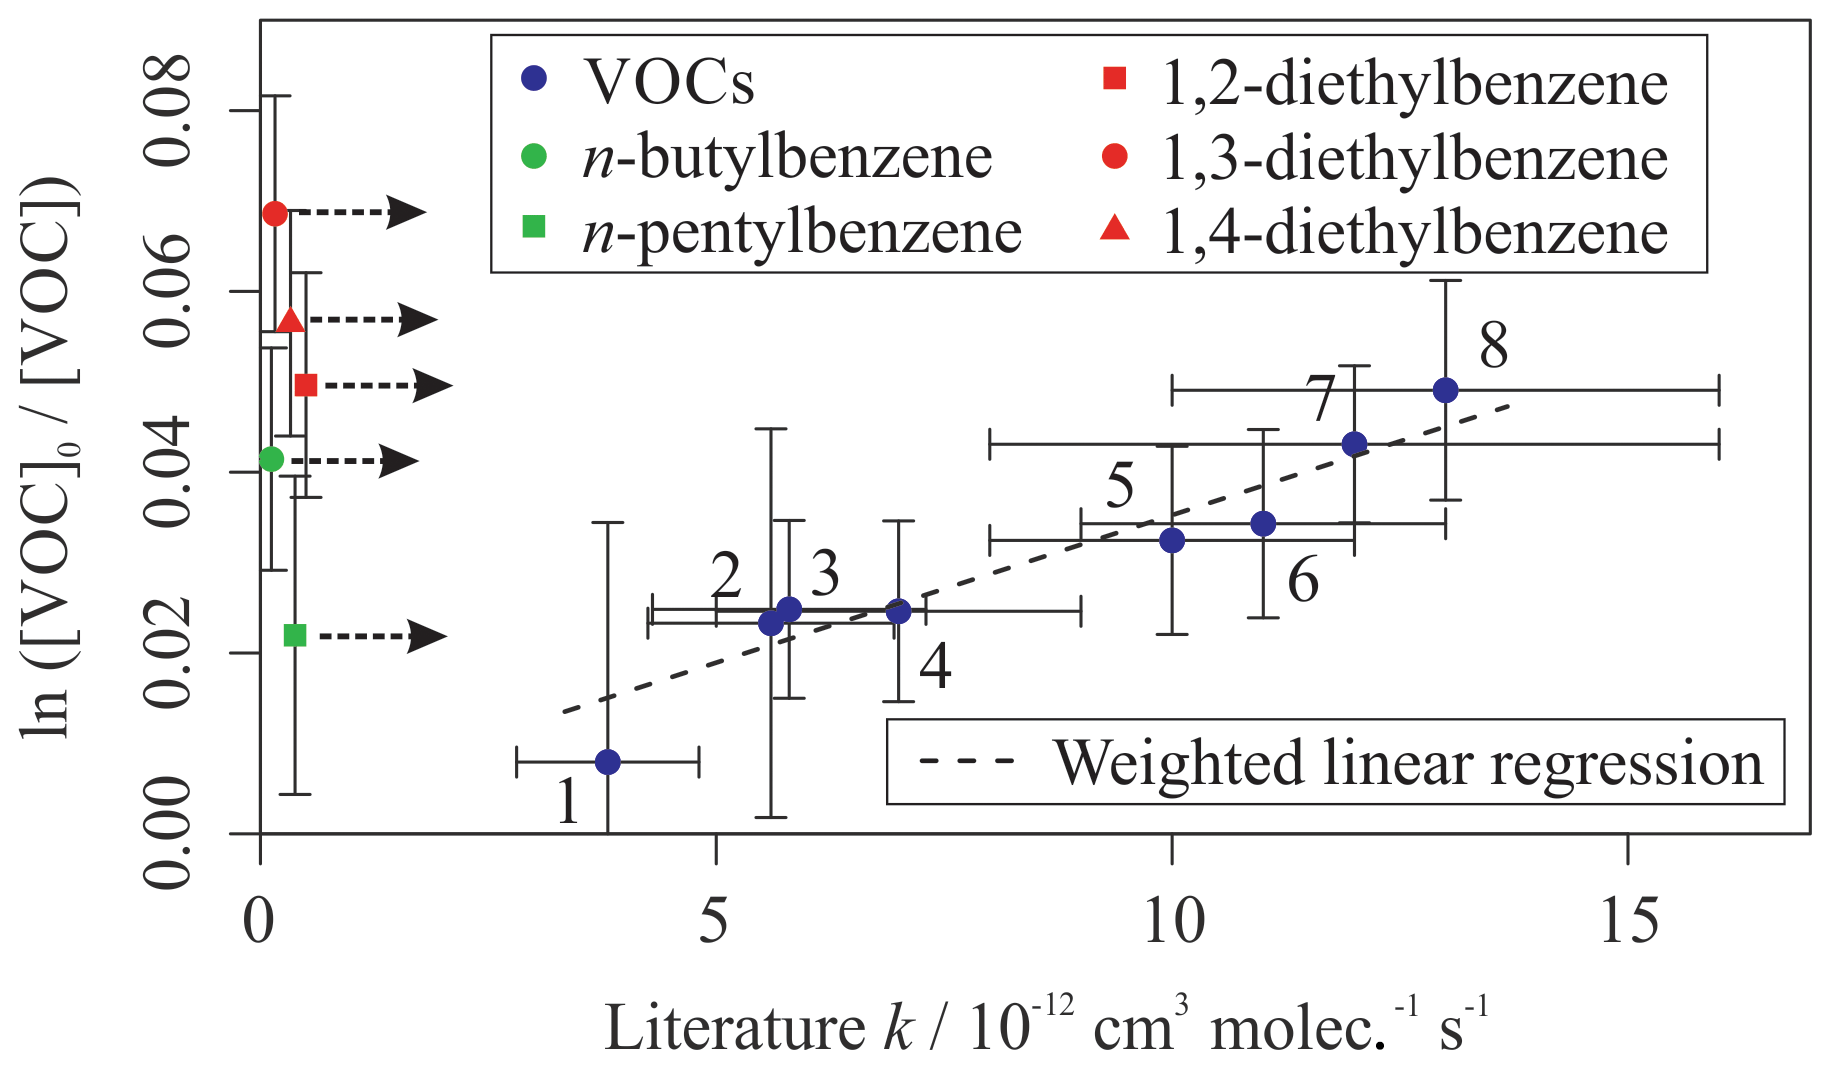
Figure 3Relative rate plot for Mixture 3 (OH reactivity of 6 s−1) and 40 ppb NO at 296 (±2) K. Compounds with a reference rate coefficient for reaction with OH were plotted using evaluated literature values. Error bars on the y axis, equal to 1 standard error, were calculated by combining the standard error in peak areas for eight lamp-off and eight lamp-on samples. Error bars on the x axis were typically large (approximately ±20 %–30 %) and accounted for deviations from the predicted trend for most VOCs. A weighted (to the uncertainty in the y values) linear fit was used to generate the slope with OH molec. cm−3 s and R2=0.890. Data for 1,2-, 1,3-, and 1,4-diethylbenzene and n-butyl and n-pentylbenzene were not used in the calculation of OHexp but were included on the plot to illustrate their measured depletion factors. The dashed arrows indicate that the k values for the target compounds are determined by where they would fall on the measured OHexp curve. The VOCs can be identified as follows: 1, 2,2,2-trimethylbutane; 2, toluene; 3, n-propylbenzene; 4, ethylbenzene; 5, n-nonane; 6, n-decane; 7, 2-ethyltoluene; 8, o-xylene.
Mixture 3 included the three isomers of diethylbenzene (C6H5(CH2CH3)2), for which no literature rate coefficients for reactions with OH could be found at the time of writing. The averaged measured values, from the five different OH reactivities tested, were (kOH (295 K) in units of 10−12 cm3 molec.−1 s−1) 1,2-diethylbenzene, ; 1,3-diethylbenzene, ; and 1,4-diethylbenzene, . Values reported here for the diethylbenzene + OH reactions were extrapolated from the depletion factor vs. k relationship; their measured depletions were all greater than the depletion in the fastest-reacting reference compound. There may therefore be a larger extent of uncertainty in their values than that calculated, as the OHexp trend beyond o-xylene was unmeasured.
A fourth synthetic gas mixture, containing aliphatic VOCs with a range of sizes, branching and OH reaction rate coefficients, was also measured using the multivariate relative rate method. Figure 4 shows the relative rate plot for this VOC mixture. A clear linear relationship was observed between depletion factor and literature rate coefficient. Table 4 provides a list of compounds in this mixture, along with their measured rate coefficient and evaluated literature reference rate coefficient, where available. Results for all seven of the reference reactions were in excellent agreement with evaluated literature rate coefficients, within errors. Rate coefficients for the reactions of OH with three VOCs (2-methylheptane, 2-methylnonane, and ethylcyclohexane), were measured for the first time.
Table 4Results of relative rate experiments, with evaluated literature data, for each VOC in Mixture 4, ordered by evaluated literature k value.
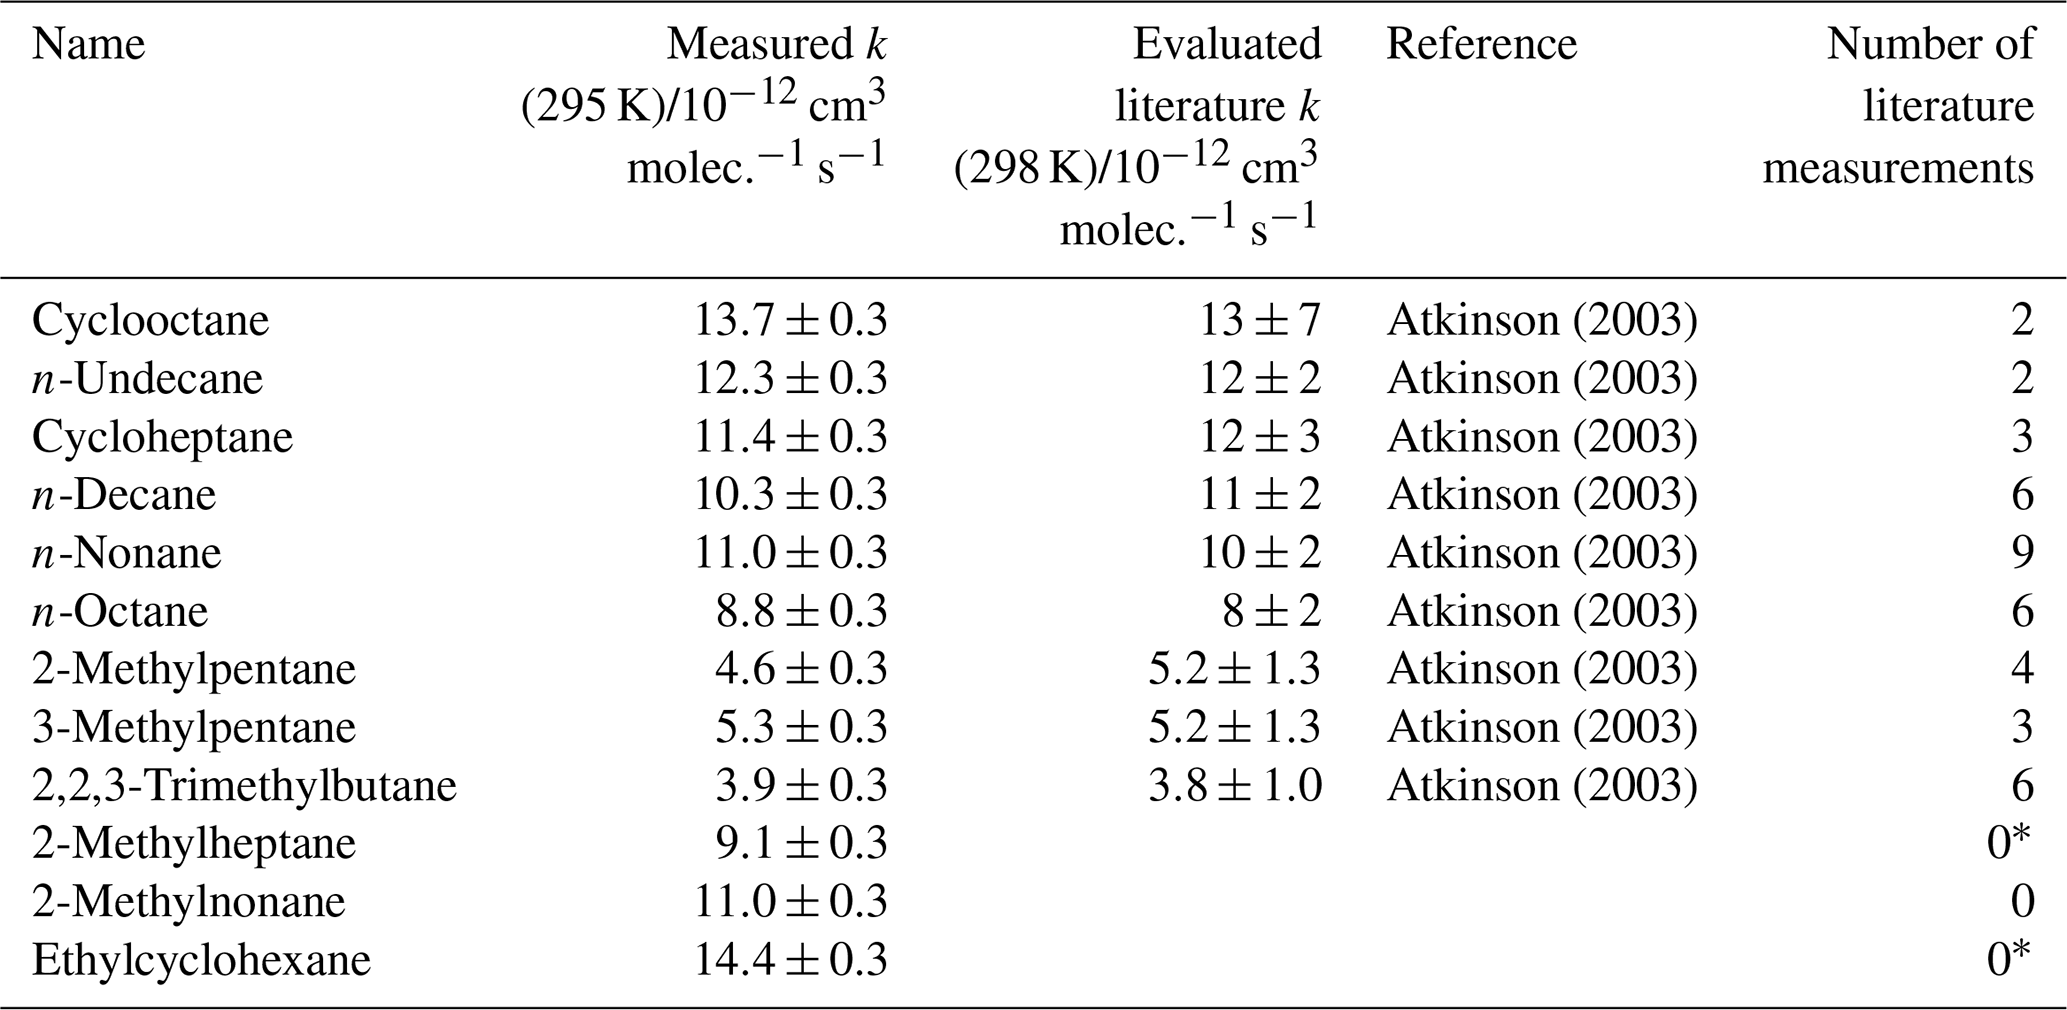
* Shaw et al. (2018) reported kOH (323 K) for these compounds, but no literature kOH value was found at 298 K.
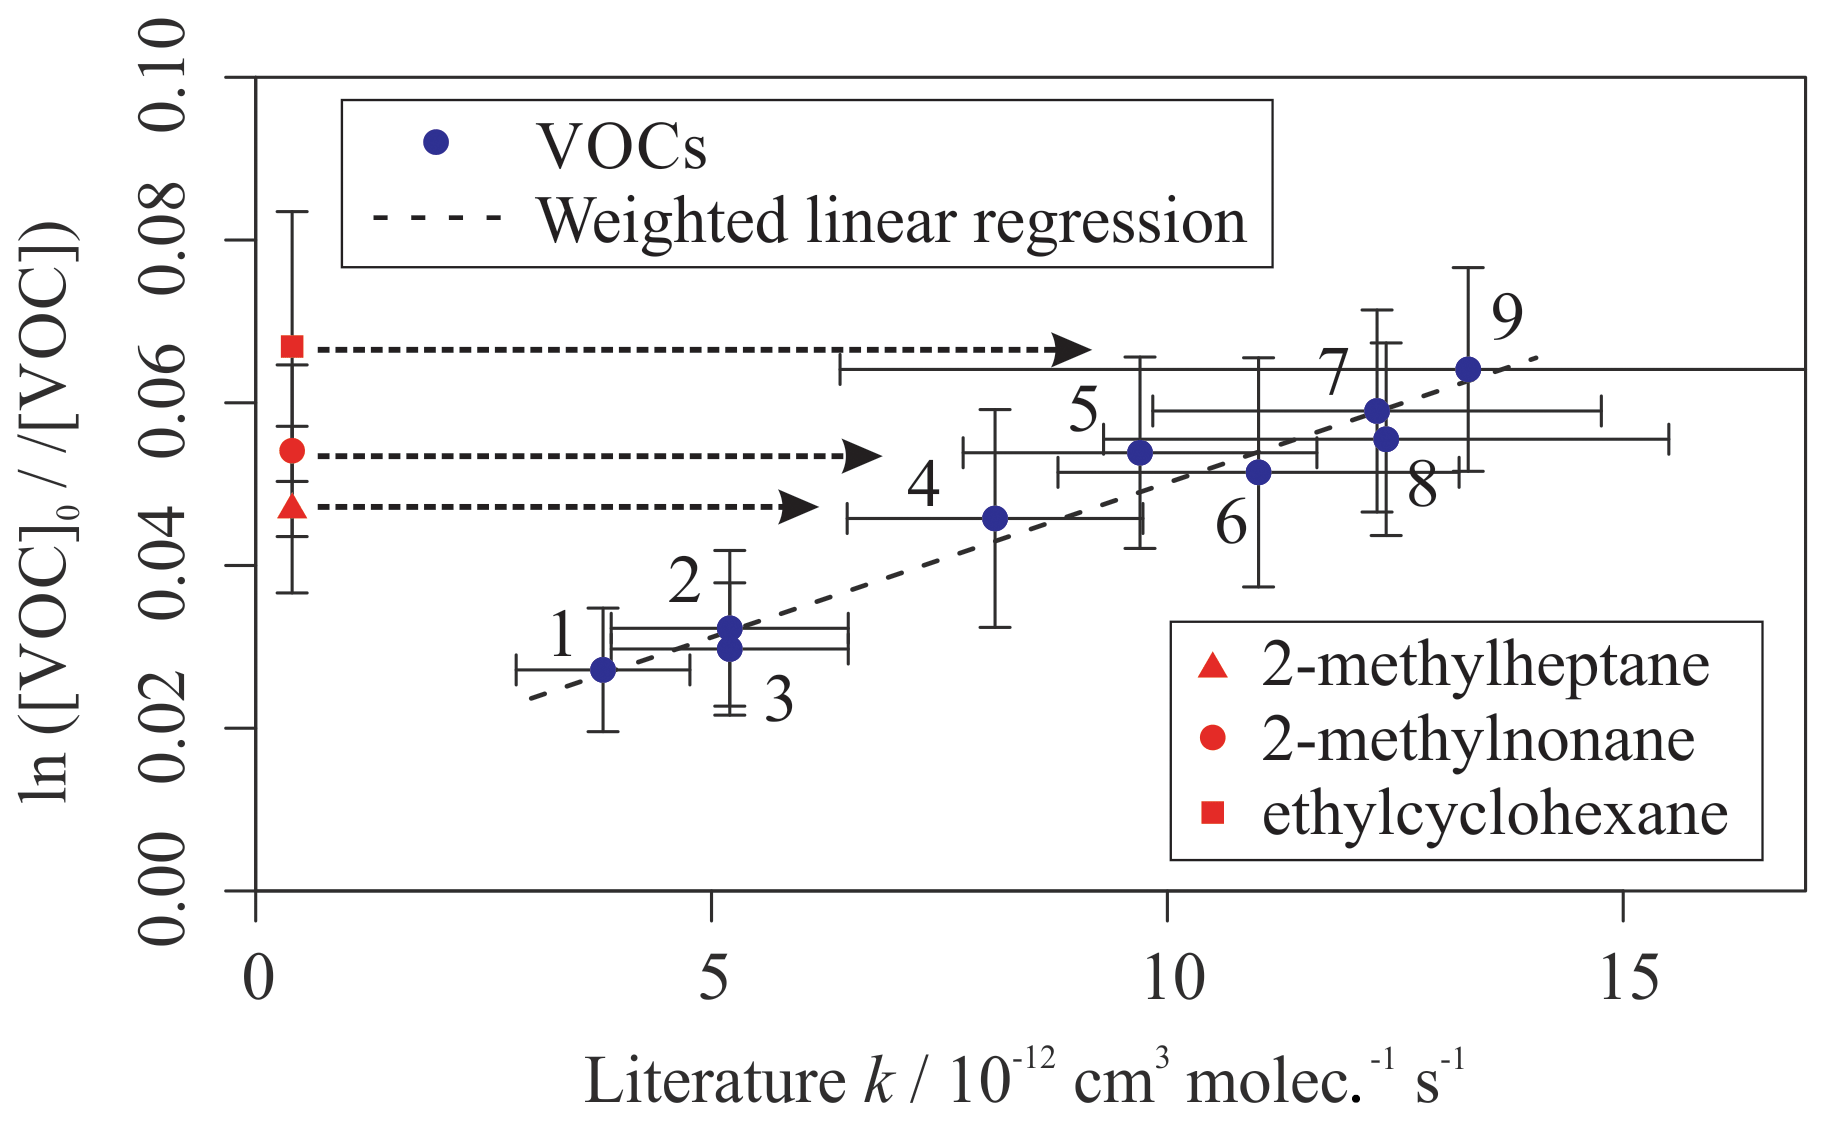
Figure 4Relative rate plot for Mixture 4 (OH reactivity of 43 s−1) and 50 ppb NO, at 296 K. Compounds with a reference rate coefficient for reaction with OH were plotted using their evaluated literature values. Errors on the y axis, equal to 1 standard error, were calculated by combining the standard error in peak areas for six lamp-off and six lamp-on samples. Error bars on the x axis were typically large and accounted for deviations from the line for all VOCs. A weighted (to the uncertainty in the y values) linear fit was used to generate the slope, with a value of OH molec. cm−3 s and R2=0.971. Data for 2-methylheptane, 2-methylnonane, and ethylcyclohexane, which had no literature k (298 K) values, were not used in the calculation of the fit but were included on the plot to illustrate their measured depletion factors. The dashed arrows indicate that the k values for the target compounds are determined by where they would fall on the measured OHexp curve. The VOCs can be identified as follows: (1) 2,2,3-trimethylbutane; (2) 2-methylpentane; (3) 3-methylpentane; (4) n-octane; (5) n-nonane; (6) n-decane; (7) n-undecane; (8) cycloheptane; (9) cyclooctane.
3.2 Comparisons to structure–activity relationships
Structure–activity relationships (SARs) provide a method for estimating rate coefficients and branching ratios for the reactions of compounds based on their structural properties. SAR-derived parameters, when based on large subsets of the kinetic catalogue, may be used as comparisons for the measured values in this work in the absence of, or in parallel with, literature experimental results (Vereecken et al., 2018). Recently, Jenkin et al. (2018a) developed an updated SAR for estimating rate coefficients for reactions of aromatic organic compounds with OH. The SAR was based on a preferred dataset of kinetic measurements for 25 monocyclic and 42 oxygenated aromatic hydrocarbons and returned results with no significant bias and an average uncertainty of 15 % relative to the observational dataset, hence providing a reasonably accurate representation of aromatic reactivity with OH. A similarly constructed SAR, for the estimation of rate coefficients for reactions involving aliphatic compounds, can be found in Jenkin et al. (2018b).
Figure 5 provides a comparison between the measured rate coefficients from this work and the calculated rate coefficients from Jenkin et al. (2018a) (for the reactions of aromatic VOCs with OH) and Jenkin et al. (2018b) (for the reactions of aliphatic VOCs with OH). All of the values measured using the multivariate relative rate technique were in good agreement with those estimated by the SARs. This provides additional validation of the SARs proposed in Jenkin et al. (2018a, b). The five reactions involving aromatic compounds for which no literature measured values existed at the time of writing were also in good agreement with those estimated using the SAR. Table S2 provides additional SAR-derived parameters for these five aromatic reactions, and the three newly measured aliphatic reactions, using alternative SARs described by Kwok and Atkinson (1995) and Ziemann and Atkinson (2012). These SARs performed relatively poorly when simulating the aromatic + OH reaction rate coefficients but performed well for the aliphatic + OH reaction rate coefficients.
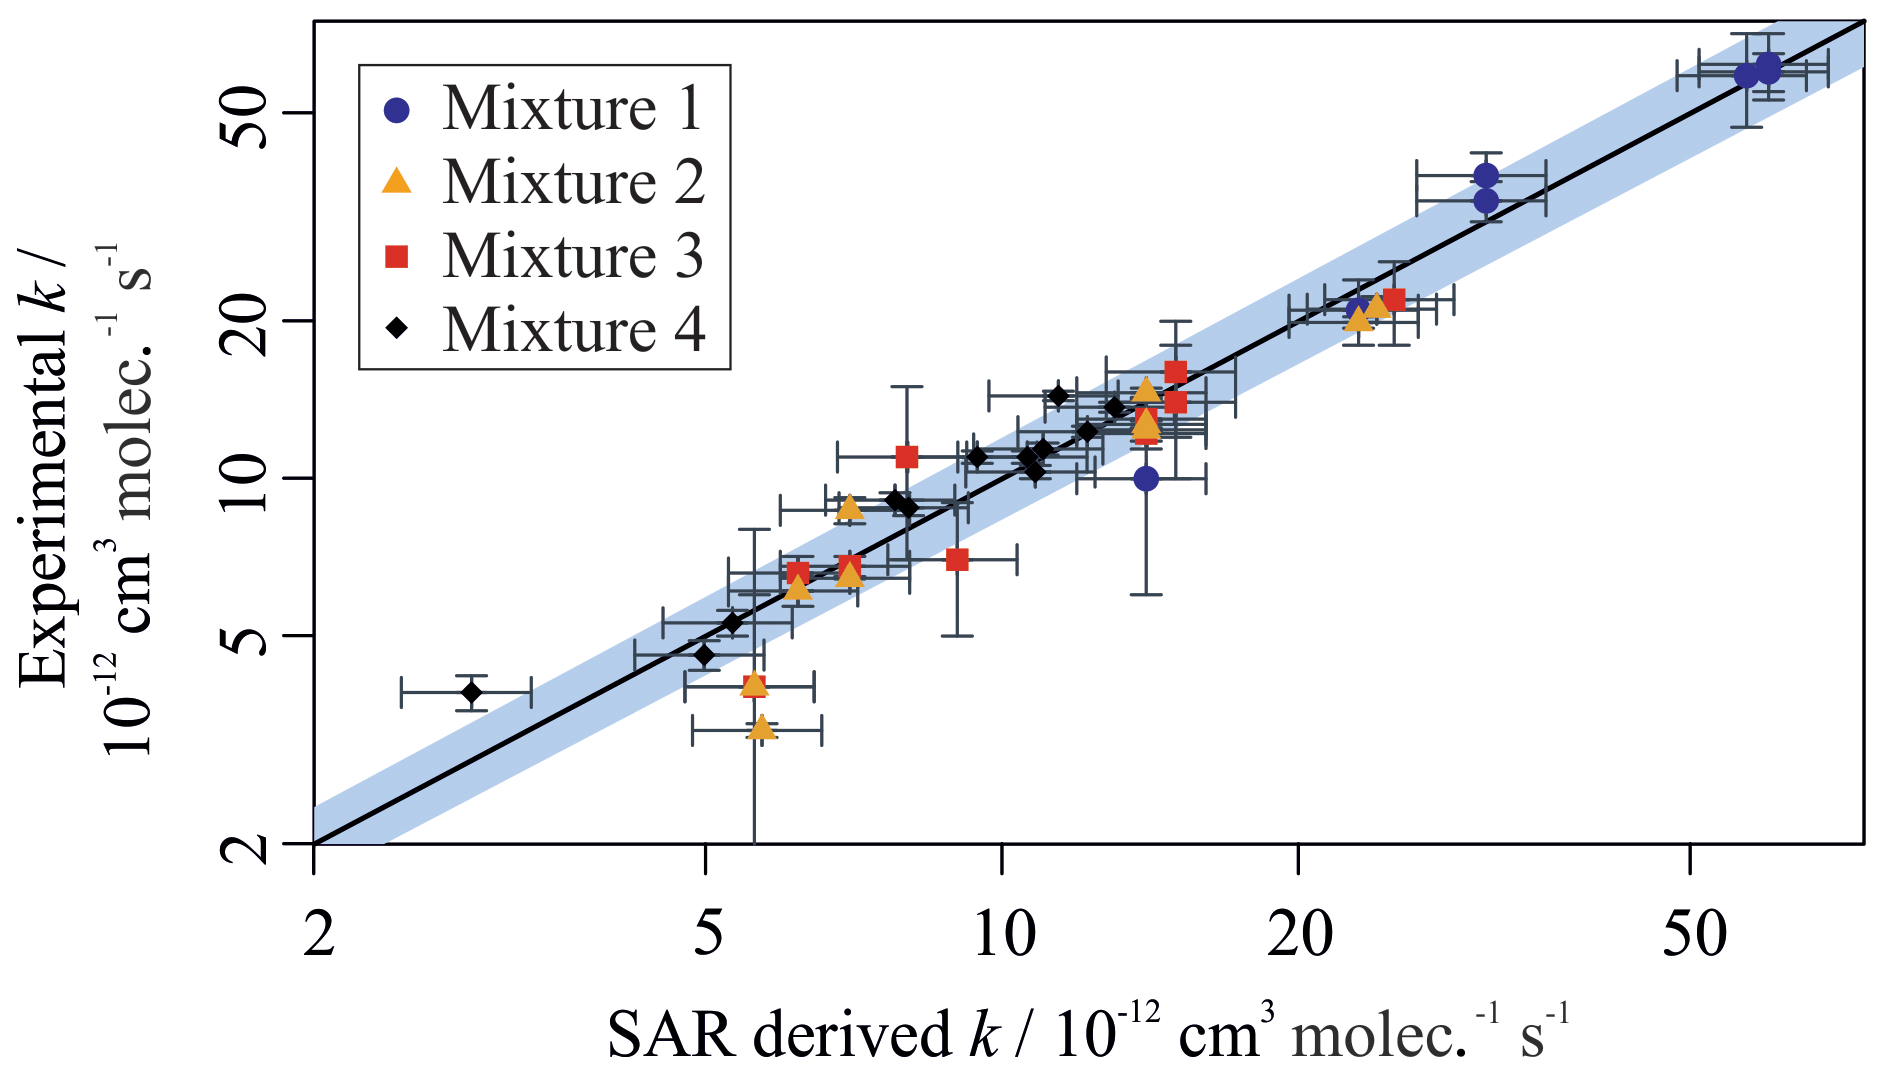
Figure 5Measured VOC + OH rate coefficients plotted against SAR-derived rate coefficients for all compounds in Mixtures 1, 2, 3, and 4. The grey shaded area demonstrates a 25 % uncertainty in the 1 : 1 black gradient line. Most data fall well within this bound. The structure–activity relationships used can be found in Jenkin et al. (2018a, b). Outliers are 2,2,3-trimethylbenzene, toluene, t-butylbenzene, n-butylbenzene, n-pentylbenzene, and o-xylene. Most outliers have large derived uncertainties in their measured value.
Figure 6 shows a more detailed analysis of the measured kOH (295 K) values for the reactions between OH and a homologous series of n-alkylbenzenes. Measurements from this work, and a previous study utilizing the multivariate relative rate technique, are shown alongside the trend predicted by the Jenkin et al. (2018a) SAR. The SAR generally predicts a small increase in rate coefficient with increasing chain length. Many of the experimental results were in agreement with the SAR when accounting for uncertainties.
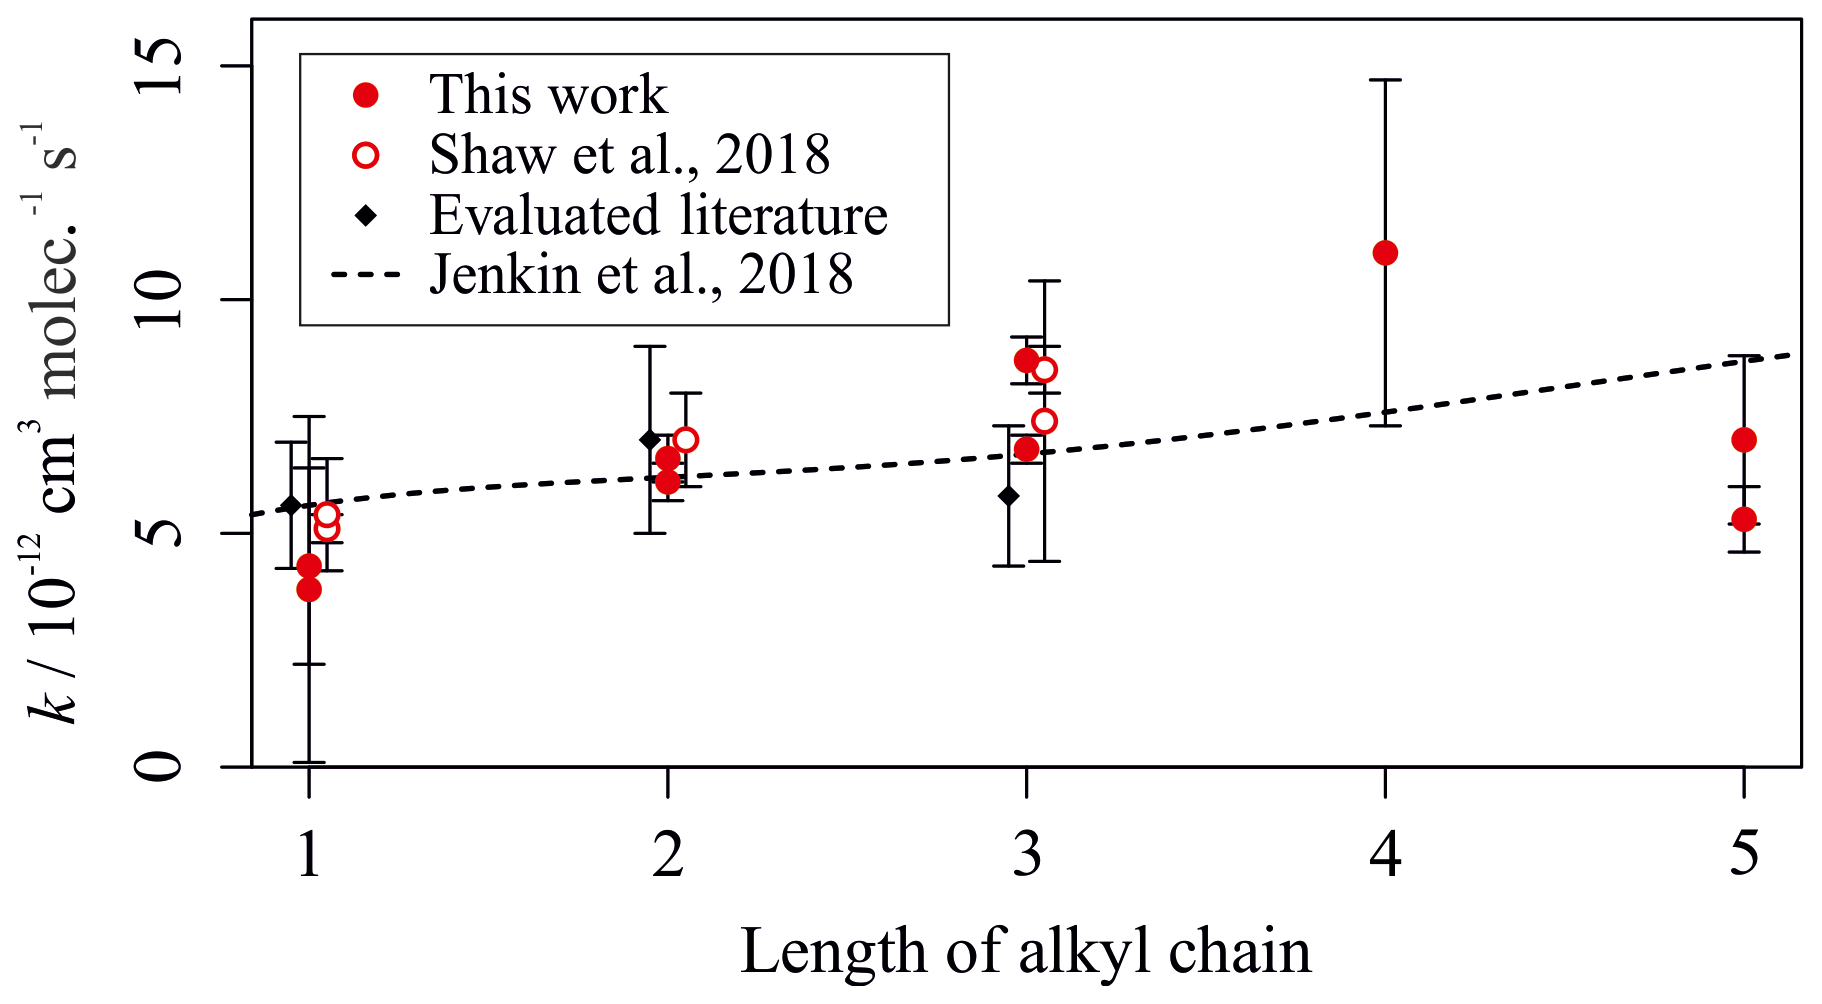
Figure 6Experimentally derived (data points; see Tables 2 and 3) and estimated SAR-derived (line; see Jenkin et al., 2018a) k values for the reactions between OH and a homologous series of n-alkylbenzenes with different numbers of carbon atoms in the alkyl chain. Data from this, and other multivariate relative rate studies, are shown in red.
Figure 7 shows a similar plot for comparison of the measured rate coefficients for the diethylbenzene isomers with those predicted by the Jenkin et al. (2018a) SAR. This plot further illustrates the good agreement between experimental results from this work and the rate coefficients estimated using the SAR. The experimental results were marginally greater than the predicted values but were in agreement when accounting for uncertainties, despite the lack of previous literature measurements for the diethylbenzene compounds. The proposed aromatic OH SAR presented in Jenkin et al. (2018a) therefore agrees well with the measurements for all aromatic compounds measured as part of this work.
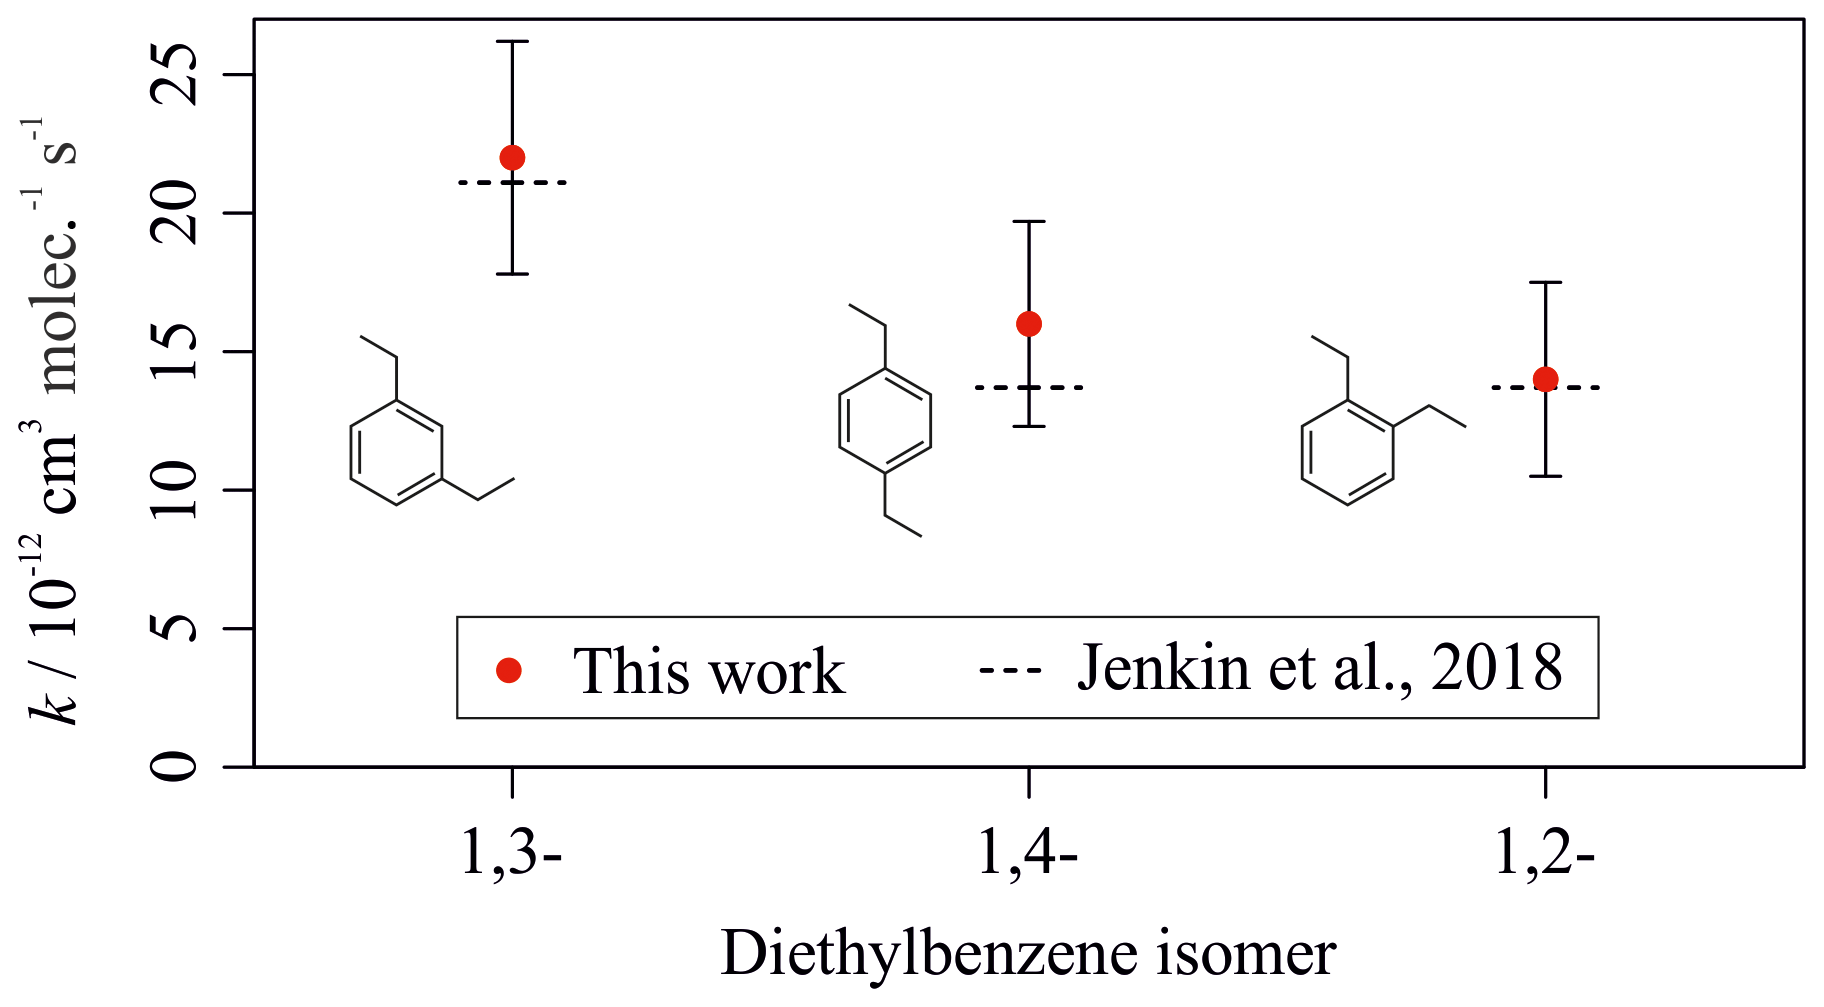
Figure 7Experimentally derived (data points) and estimated SAR-derived (lines) k values for the reactions between OH and the three diethylbenzene isomers. Data from this work are shown in red.
3.3 Interpretations from numerical simulations
Numerical simulations were conducted to aid in the evaluation of the experimental results obtained as part of this work for the aromatic systems. Simulations were performed using the Kintecus software package (Ianni, 2017).
The first set of simulations aimed to assess the significance of the thermal decomposition of the OH-aromatic adducts (as depicted in Fig. S5) at different temperatures (Calvert et al., 2002). The chemical model for these simulations used Arrhenius expressions for the initial reactions of OH with benzene, toluene, and m- and p-xylene (Atkinson and Arey, 2003; Atkinson et al., 2006). The chemical scheme included two subsequent pathways: one in which the OH-aromatic adducts decayed back into the initial aromatics (and OH) and one in which they reacted with O2. Arrhenius expressions for each of these reactions were included in the model (Perry et al., 1977; Knispel et al., 1990; Koch et al., 2007). Minor H-atom abstraction pathways were neglected. The initial OH concentration was kept constant at 2×10¹¹ molec. cm−3. The concentration of O2 within the experimental reactor was not measured experimentally, so an estimate of 1×10¹⁷ molec. cm−3 of O2 (equivalent to an N2 purity of approximately 99 %) was used during the simulations.
Allowing for the decay of the OH-aromatic adduct (at T=300 K) resulted in the correctly simulated relationship between depletion factor and literature kOH value for all four aromatic species, with an R2 value of 0.9995. Figure 8 shows that this relationship was sensitive to the concentration of O2 in the simulation, with the R2 value decreasing to 0.856 at [O2] = 1×10¹⁵ molec. cm−3. Therefore, at the experimental temperature (T=296 K), significant back-decomposition of the OH-aromatic adduct should have been avoided, given the assumed 1 % O2 content (1017 molec. cm−3) within the reactor.

Figure 8Simulated relative rate plot for four aromatic VOCs when simulating different concentrations of O2 in the reactor at 300 K. From left to right, the data points can be identified as benzene, toluene, p-xylene, and m-xylene. The R2 values were 0.856, 0.981, and 1.00 for [O2] = 1015, 1016, and 1017 molec. cm−3 respectively. The relationship between depletion factor and k value improved with increasing [O2], suggesting that greater concentrations would be more likely to provide more accurate results.
At elevated temperatures (e.g. T=350 K), the decay of the aromatic adducts proceeds at a quicker rate. The relationship between depletion factor and literature k value was poorly simulated, even when using the assumed concentration of O2. The simulated depletion factors for some of the aromatic species were also well below the limit of detection for experimental observations, owing to the rapid reformation of the original aromatic species. This suggests that there is a threshold temperature above which significant thermal decomposition of the OH-aromatic adducts would occur, limiting the potential for experimental results.
The thermal instability of the primary product of the aromatic + OH reactions therefore complicated the relative rate nature of these experiments. The potential reformation of the original aromatic species meant that their measured concentrations after reaction with OH may not have been dependent on just their rate coefficient for reaction with OH. However, the numerical simulations performed as part of this work yielded an important conclusion: at the reactor temperatures used during experimentation, the extent of OH-aromatic decay was largely insignificant as long as approximately 1017 molec. cm−3 of O2 was present in the reactor, which is assumed to be the case.
A second set of simulations was performed to model the impact that NO had on the chemical mechanisms occurring within the reactor. The chemical scheme for these simulations incorporated the oxidation of the aromatic compounds toluene, ethylbenzene, n-propylbenzene, isopropylbenzene, m- and o-xylene, and 2-, 3-, and 4-ethyltoluene, as adapted from the Master Chemical Mechanism (MCM, http://mcm.leeds.ac.uk/MCM/, last access: 14 February 2018, Jenkin et al., 2003; Bloss et al., 2005). All reactions involving O3 and NO3 were removed from the chemical model as these oxidants were assumed to be absent from the experimental reactor. Reactions involving RO2 were also removed from the chemical model for simplification reasons. Basic HOx and NOx chemistry was included to yield a simplified chemical scheme comprising a total of 160 reactions and 88 different species.
Reactions involving primary OH (henceforth referred to as pOH) were separated from reactions involving secondary OH (sOH) within the model. pOH corresponds to the OH generated as a direct result of H2O photolysis. sOH refers to the OH generated as a result of the reaction between NO and HO2 (Reaction R4).
Figure S6 shows that adding NO to the reactor increased the simulated extent of aromatic VOC depleted through reactions with OH. A total of 6.1 % of the total aromatic VOC reacted with OH in the case without NO compared to 8.2 % in simulations with 30 ppb of NO. This correlated well with evidence from experiments in which the depletion factors for individual VOCs increased after the addition of NO to the reactor. However, the simulated proportion of reacted VOC decreased after addition of 70 ppb of NO. This was not observed experimentally. This may suggest that there is an optimum amount of NO to include in the reactor, above which the sinks of OH to reactions with NO and NO2 begin to dominate. This critical point was not surpassed experimentally, hence leading to the observed trend where increased [NO] led to an increase in depletion factor.
The multivariate relative rate technique was successfully adapted to measure the relative reaction rates of 20 different mono-aromatic VOCs with OH (at 296 K). A total of 15 of these reactions have had rate coefficients reported at least once previously, with the measurements reported here in good agreement with this existing limited experimental dataset. Five of the measured rate coefficients are reported for the first time. These are (in units of 10−12 cm3 molec.−1 s−1) n-butylbenzene, 11 (±4); n-pentylbenzene, 7 (±2); 1,2-diethylbenzene, 14 (±4); 1,3-diethylbenzene, 22 (±4); and 1,4-diethylbenzene, 16 (±4). The OH rate coefficients for 12 straight and branched chain aliphatic species were also measured using the multivariate relative rate technique, three of which are not available in the literature. The measured OH reaction rate coefficients for these were (in units of 10−12 cm3 molec.−1 s−1) 2-methylheptane, 9.1 (±0.3); 2-methylnonane, 11.0 (±0.3); and ethylcyclohexane, 14.4 (±0.3). The 296 K measurements were in agreement with the available, but often limited, experimental dataset.
Measurements of slower reactions (relative to many of those measured in Shaw et al., 2018) proved difficult owing to the limited depletions observed for some of the VOCs. A simple chemical modification to the basic setup successfully increased the extent of the measured depletions, allowing for the evaluation of the rates of reaction for slower-reacting compounds. The addition of NO to flow reactors is therefore advised for any future work performing this type of self-consistent, multivariate relative rate measurement, particularly when the rates of reaction for the targeted reactive species are below cm3 molec.−1 s−1. Model sensitivity simulations on the thermal stability of the OH-aromatic adduct intermediate species suggested that there should be limited decomposition to reform the original aromatic precursors under the applied experimental conditions.
Atmospheric lifetimes for the eight VOCs for which rate coefficients for reaction with OH were measured for the first time were calculated using a global 24 h average tropospheric concentration of [OH] = 1×10⁶ molec. cm−3 (Li et al., 2018). Estimated lifetimes due to reaction with OH (τOH) for the five aromatic compounds were n-butylbenzene, 25 h; n-pentylbenzene, 40 h; 1,2-diethylbenzene, 20 h; 1,3-diethylbenzene, 13 h; and 1,4-diethylbenzene, 17 h. Given that these aromatic compounds are relatively large and react rapidly with OH (when compared with toluene), they would be expected to have reasonably high photochemical ozone creation potentials (POCPs). Estimated lifetimes due to reaction with OH for 2-methylheptane, 2-methylnonane, and ethylcyclohexane were 31, 25, and 19 h respectively. It should be noted that the lifetimes indicated here have limited applicability in atmospheric environments with substantially different OH concentrations and that they may be as short as a few hours in environments with particularly high concentrations of OH. Comprehensive chemical modelling would need to be undertaken to fully understand the behaviour of these compounds in different environments, but this is beyond the scope of this work.
The majority of the rate coefficients measured as part of this work were in good agreement with the recently developed SARs by Jenkin et al. for estimating aromatic and aliphatic OH kinetics (Jenkin et al., 2018a, b), validating the use of theoretical calculation of OH rate coefficients for reactions involving these compounds. This work highlights that more experimental and theoretical work is required to understand the OH oxidation kinetics and mechanisms of large-alkyl substituted aromatic hydrocarbons in order to extend the kinetic database for more accurate SAR parameter estimations and to assess their impact on atmospheric composition.
Raw data are available upon request.
The supplement related to this article is available online at: https://doi.org/10.5194/acp-20-9725-2020-supplement.
ARR and TJD planned the overall project; JTS and TJD designed experiments; JTS conducted all experiments and performed the analysis; JTS and TJD prepared the manuscript with contributions from ARR and MJN.
The authors declare that they have no conflict of interest.
The authors would like to thank Martyn Ward, Chris Mortimer, and Chris Rhodes for their assistance and technical support throughout the project. We would also like to thank NERC for the provision and funding of a PhD for Jacob T. Shaw as part of the SPHERES DTP scheme.
This research has been supported by the NERC Environmental Bioinformatics Centre (grant nos. NE/M013448/1, NE/J008990/1, and NE/J008532/1).
This paper was edited by James B. Burkholder and reviewed by four anonymous referees.
Alarcón, P., Bohn, B., and Zetzsch, C.: Kinetic and mechanistic study of the reaction of OH radicals with methylated benzene: 1,4-dimethyl-, 1,3,5-trimethyl-, 1,2,4,5-, 1,2,3,5- and 1,2,3,4-tetramethyl-, pentamethyl-, and hexamethylbenzene, Phys. Chem. Chem. Phys., 17, 13053–13065, https://doi.org/10.1039/c5cp00253b, 2015.
Aschmann, S. M., Arey, J., and Atkinson, R.: Rate constants for the reactions of OH radicals with 1,2,4,5-tetramethylbenzene, pentamethylbenzene, 2,45-trimethylbenzaldehyde, 2,4,5-trimethylphenol, and 3-methyl-3-hexene-2,5-dione and products of OH + 1,2,4,5-tetramethylbenzene, J. Phys. Chem. A, 117, 2556–2568, https://doi.org/10.1021/jp400323n, 2013.
Atkinson, R.: Kinetics of the gas-phase reactions of OH radicals with alkanes and cycloalkanes, Atmos. Chem. Phys., 3, 2233–2307, https://doi.org/10.5194/acp-3-2233-2003, 2003.
Atkinson, R. and Arey, J.: Gas-phase tropospheric chemistry of biogenic volatile organic compounds: A review, Atmos. Environ., 37, S197–S219, https://doi.org/10.1016/S1352-2310(03)00391-1, 2003.
Atkinson, R., Baulch, D. L., Cox, R. A., Crowley, J. N., Hampson, R. F., Hynes, R. G., Jenkin, M. E., Rossi, M. J., Troe, J., and IUPAC Subcommittee: Evaluated kinetic and photochemical data for atmospheric chemistry: Volume II – gas phase reactions of organic species, Atmos. Chem. Phys., 6, 3625–4055, https://doi.org/10.5194/acp-6-3625-2006, 2006.
Bohn, B.: Formation of peroxy radicals from OH-toluene adducts and O2, J. Phys. Chem. A, 105, 6092–6101, https://doi.org/10.1021/jp0033972, 2001.
Bohn, B. and Zetzsch, C.: Gas-phase reaction of the OH-benzene adduct with O2: Reversibility and secondary formation of HO2, Phys. Chem. Chem. Phys., 1, 5097–5107, https://doi.org/10.1039/A904887A, 1999.
Bloss, C., Wagner, V., Jenkin, M. E., Volkamer, R., Bloss, W. J., Lee, J. D., Heard, D. E., Wirtz, K., Martin-Reviejo, M., Rea, G., Wenger, J. C., and Pilling, M. J.: Development of a detailed chemical mechanism (MCMv3.1) for the atmospheric oxidation of aromatic hydrocarbons, Atmos. Chem. Phys., 5, 641–664, https://doi.org/10.5194/acp-5-641-2005, 2005.
Calvert J. G., Atkinson, R., Becker, K. H., Kamens, R. M., Seinfeld, J. H., Wallington, T. J., and Yarwood, G.: The mechanisms of atmospheric oxidation of aromatic hydrocarbons, Oxford University Press, New York, 2002.
Cao, X., Yao, Z., Shen, X., Ye, Y., and Jiang, X.: On-road emission characteristics of VOCs from light-duty gasoline vehicles in Beijing, China, Atmos. Environ., 124, 146–155, https://doi.org/10.1016/j.atmosenv.2015.06.019, 2016.
Cryer, D. R.: Measurements of hydroxyl radical reactivity and formaldehyde in the atmosphere, PhD thesis, University of Leeds, available at: http://etheses.whiterose.ac.uk/id/eprint/16834 (last access: July 2019), 2016.
Derwent, R. G., Jenkin, M. E., Saunders, S. M., and Pilling, M. J.: Photochemical ozone creation potentials for organic compounds in northwest Europe calculated with a master chemical mechanism, Atmos. Environ., 32, 14–15, 2429–2441, https://doi.org/10.1016/S1352-2310(98)00053-3, 1998.
Derwent, R. G., Jenkin, M. E., Passant, N. R., and Pilling, M. J.: Photochemical ozone creation potentials (POCPs) for different emission sources of organic compounds under European conditions estimated with a Master Chemical Mechanism, Atmos. Environ., 41, 2570–2579, https://doi.org/10.1016/j.atmosenv.2006.11.019, 2007.
Dunmore, R. E., Hopkins, J. R., Lidster, R. T., Lee, J. D., Evans, M. J., Rickard, A. R., Lewis, A. C., and Hamilton, J. F.: Diesel-related hydrocarbons can dominate gas phase reactive carbon in megacities, Atmos. Chem. Phys., 15, 9983–9996, https://doi.org/10.5194/acp-15-9983-2015, 2015.
Erickson, M. H., Gueneron, M., and Jobson, B. T.: Measuring long chain alkanes in diesel engine exhaust by thermal desorption PTR-MS, Atmos. Meas. Tech., 7, 225–239, https://doi.org/10.5194/amt-7-225-2014, 2014.
Goldstein, A. H. and Galbally, I. E.: Known and unexplored organic constituents in the Earth's atmosphere, Environ. Sci. Technol., 41, 1514–1521, https://doi.org/10.1021/es072476p, 2007.
Guo, H., Zou, S., Tasia, W., Chan, L., and Blake, D. R.: Emission characteristics of non-methane hydrocarbons from private cars and taxis at different driving speeds in Hong Kong, Atmos. Environ., 45, 2711–2721, https://doi.org/10.1016/j.atmosenv.2011.02.053, 2011.
Hamilton, J. F. and Lewis, A. C.: Monoaromatic complexity in urban air and gasoline assessed using comprehensive GC and fast GC-ToF/MS, Atmos. Environ., 37, 589–602, https://doi.org/10.1016/S1352-2310(02)00930-5, 2003.
Ianni, J. C.: Kintecus, Windows Version 5.20, available at: http://www.kintecus.com (last access: August 2018), 2017.
Jenkin, M. E., Saunders, S. M., Wagner, V., and Pilling, M. J.: Protocol for the development of the Master Chemical Mechanism, MCM v3 (Part B): tropospheric degradation of aromatic volatile organic compounds, Atmos. Chem. Phys., 3, 181–193, https://doi.org/10.5194/acp-3-181-2003, 2003.
Jenkin, M. E., Valorso, R., Aumont, B., Rickard, A. R., and Wallington, T. J.: Estimation of rate coefficients and branching ratios for gas-phase reactions of OH with aromatic organic compounds for use in automated mechanism construction, Atmos. Chem. Phys., 18, 9329–9349, https://doi.org/10.5194/acp-18-9329-2018, 2018a.
Jenkin, M. E., Valorso, R., Aumont, B., Rickard, A. R., and Wallington, T. J.: Estimation of rate coefficients and branching ratios for gas-phase reactions of OH with aliphatic organic compounds for use in automated mechanism construction, Atmos. Chem. Phys., 18, 9297–9328, https://doi.org/10.5194/acp-18-9297-2018, 2018b.
Ji, Y., Zhao, J., Terazono, H., Misawa, K., Levitt, N. P., Li, Y., Lin, Y., Peng, J., Wang, Y., Duan, L., Pan, B., Zhang, F., Feng, X., An, T., Marrero-Ortiz, W., Secrest, J., Zhang, A. L., Shibuya, K., Molina, M. J., and Zhang, R.: Reassessing the atmospheric oxidation mechanism of toluene, P. Natl. Acad. Sci. USA, 114, 8169–8174, https://doi.org/10.1073/pnas.1705463114, 2017.
Knispel, R., Koch, R., Siese, M., and Zetzsch, C.: Adduct formation of OH radicals with benzene, toluene, and phenol and consecutive reactions of the adducts with NOx and O2, Berich Bunsen-Gesell., 94, 1375–1379, https://doi.org/10.1002/bbpc.199000036, 1990.
Koch, R., Knispel, R., Siese, M., and Zetzsch, C.: Absolute rate constants and products of secondary steps in the atmospheric degradation of aromatics, in: Proceedings of the 6th European Symposium on the Physico-Chemical Behaviour of Atmospheric Pollutants, edited by: Angeletti, G. and Restilli, G., European Commission, Brussels, Belgium, 143–149, 1994.
Koch, R., Knispel, R., Elend, M., Siese, M., and Zetzsch, C.: Consecutive reactions of aromatic-OH adducts with NO, NO2 and O2: benzene, naphthalene, toluene, m- and p-xylene, hexamethylbenzene, phenol, m-cresol and aniline, Atmos. Chem. Phys., 7, 2057–2071, https://doi.org/10.5194/acp-7-2057-2007, 2007.
Kwok, E. S. C. and Atkinson, R.: Estimation of hydroxyl radical reaction rate constants for gas-phase organic compounds using a structure-reactivity relationship: an update, Atmos. Environ., 29, 1685–1695, https://doi.org/10.1016/1352-2310(95)00069-B, 1995.
Lewis, A. C., Carslaw, N., Marriott, P. J., Kinghorn, R. M., Morrison, R., Lee, A. L., Bartle, K. D., and Pilling, M. J.: A larger pool of ozone-forming carbon compounds in urban atmospheres, Nature, 405, 778–781, https://doi.org/10.1038/35015540, 2000.
Li, M., Karu, E., Brenninkmeijer, C., Fischer, H., Lelieveld, J., and Williams, J.: Tropospheric OH and stratospheric OH and Cl concentrations determined from CH4, CH3Cl, and SF6 measurements, Clim. Atmos. Sci., 1, 29, https://doi.org/10.1038/s41612-018-0041-9, 2018.
Lidster, R. T., Hamilton, J. F., Lee, J. D., Lewis, A. C., Hopkins, J. R., Punjabi, S., Rickard, A. R., and Young, J. C.: The impact of monoaromatic hydrocarbons on OH reactivity in the coastal UK boundary layer and free troposphere, Atmos. Chem. Phys., 14, 6677–6693, https://doi.org/10.5194/acp-14-6677-2014, 2014.
Mehta, D., Nguyen, A., Montenegro, A., and Li, Z.: A kinetic study of the reaction of OH with xylenes using the relative rate/discharge flow/mass spectrometry technique, J. Phys. Chem. A, 113, 46, 12942–12951, https://doi.org/10.1021/jp905074j, 2009.
Newland, M. J., Jenkin, M. E., and Rickard, A. R.: Elucidating the fate of the OH-adduct in toluene oxidation under tropospheric boundary layer conditions, P. Natl. Acad. Sci. USA, 114, E7856–E7857, https://doi.org/10.1073/pnas.1713678114, 2017.
Nicovich, J. M., Thompson, R. L., and Ravishankara, A. R.: Kinetics of the reactions of the hydroxyl radical with xylenes, J. Phys. Chem., 84, 2913–2916, https://doi.org/10.1021/j150620a012, 1981.
Pandit, G. G., Sahu, S. K., and Puranik, V. D.: Distribution and source apportionment of atmospheric non-methane hydrocarbons in Mumbai, India, Atmos. Pollut. Res., 2, 231–236, https://doi.org/10.5094/APR.2011.029, 2011.
Pereira, K. L., Dunmore, R., Whitehead, J., Alfarra, M. R., Allan, J. D., Alam, M. S., Harrison, R. M., McFiggans, G., and Hamilton, J. F.: Technical note: Use of an atmospheric simulation chamber to investigate the effect of different engine conditions on unregulated VOC-IVOC diesel exhaust emissions, Atmos. Chem. Phys., 18, 11073–11096, https://doi.org/10.5194/acp-18-11073-2018, 2018.
Perry, R. A., Atkinson, R. A., and Pitts Jr., J. N.: Kinetics and mechanism of the gas phase reaction of hydroxyl radicals with aromatic hydrocarbons over the temperature range 296–473 K, J. Phys. Chem., 81, 296–304, https://doi.org/10.1021/j100519a004, 1977.
Ravishankara, A. R., Wagner, S., Fischer, S., Smith, G., Schiff, R., Watson, R. T., Tesi, G., and Davis, D. D.: A kinetics study of the reactions of OH with several aromatic and olefinic compounds, Int. J. Chem. Kinet., 10, 783–804, https://doi.org/10.1002/kin.550100802, 1978.
Shaw, J. T.: Multivariate relative rate measurements of reactions between volatile organic compounds (VOCs) and atmospheric radicals, PhD thesis, University of York, available at: http://etheses.whiterose.ac.uk/id/eprint/21989 (last access: November 2019), 2018.
Shaw, J. T., Lidster, R. T., Cryer, D. R., Ramirez, N., Whiting, F. C., Boustead, G. A., Whalley, L. K., Ingham, T., Rickard, A. R., Dunmore, R. E., Heard, D. E., Lewis, A. C., Carpenter, L. J., Hamilton, J. F., and Dillon, T. J.: A self-consistent, multivariate method for the determination of gas-phase rate coefficients, applied to reactions of atmospheric VOCs and the hydroxyl radical, Atmos. Chem. Phys., 18, 4039–4054, https://doi.org/10.5194/acp-18-4039-2018, 2018.
Tiwari, V., Hanai, Y., and Masunaga, S.: Ambient levels of volatile organic compounds in the vicinity of petrochemical industrial area of Yokohama, Japan, Air Qual. Atmos. Hlth., 3, 65–75, https://doi.org/10.1007/s11869-009-0052-0, 2010.
Vereecken, L.: Reaction Mechanisms for the Atmospheric Oxidation of Monocyclic Aromatic Compounds, in: Advances in Atmospheric Chemistry, Vol. 2: Organic Oxidation and Multiphase Chemistry, edited by: Barker, J. R., Steiner, A. L., and Wallington, T. J., World Scientific Publishing Co. Pte. Ltd, Singapore, 2019.
Vereecken, L., Aumont, B., Barnes, I., Bozzelli, J. W., Goldman, M. J., Green, M. H., Madronich, S., Mcgillen, M. R., Mellouki, A., Orlando, J. J., Picquet-Varrault, B., Rickard, A. R., Stockwell, W. R., Wallington, T. J., and Carter, W. P. L.: Perspective on mechanism development and structure-activity relationships for gas-phase atmospheric chemistry, Int. J. Chem. Kinet., 50, 435–469, https://doi.org/10.1002/kin.21172, 2018.
Ziemann, P. J. and Atkinson, R.: Kinetics, products, and mechanisms of secondary organic aerosol formation, Chem. Soc. Rev., 41, 6582–6605, https://doi.org/10.1039/C2CS35122F, 2012.