the Creative Commons Attribution 4.0 License.
the Creative Commons Attribution 4.0 License.
 | 31 Jul 2020
Contrasting sources and processes of particulate species in haze days with low and high relative humidity in wintertime Beijing
Ru-Jin Huang
Yao He
Jing Duan
Yongjie Li
Yan Zheng
Yang Chen
Weiwei Hu
Chunshui Lin
Haiyan Ni
Wenting Dai
Junji Cao
Yunfei Wu
Renjian Zhang
Jurgita Ovadnevaite
Darius Ceburnis
Thorsten Hoffmann
Colin D. O'Dowd
Although there are many studies of particulate matter (PM) pollution in Beijing, the sources and processes of secondary PM species during haze periods remain unclear. Limited studies have investigated the PM formation in highly polluted environments under low- and high-relative-humidity (RH) conditions. Herein, we present a systematic comparison of species in submicron particles (PM1) in wintertime Beijing (29 December 2014 to 28 February 2015) for clean periods and pollution periods under low- and high-RH conditions. PM1 species were measured with an aerosol chemical species monitor (ACSM) and an Aethalometer. Sources and processes for organic aerosol (OA) were resolved by positive matrix factorization (PMF) with a multilinear engine 2 (ME-2). The comparisons for clean, low-RH pollution and high-RH pollution periods are made from three different aspects, namely (a) mass concentration, (b) mass fraction and (c) growth rate in diurnal profiles. OA is the dominant component of PM1, with an average mass concentration of 56.7 µg m−3 (46 %) during high-RH pollution and 67.7 µg m−3 (54 %) during low-RH pollution periods. Sulfate had higher concentration and mass fraction during high-RH pollution periods, while nitrate had higher concentration and mass fraction during low-RH pollution periods. The diurnal variations of nitrate and oxygenated organic aerosol (OOA) showed a daytime increase in their concentrations during all three types of periods. Nitrate had similar growth rates during low-RH (0.40 µg m−3 h−1) and high-RH (0.55 µg m−3 h−1) pollution periods. OOA had a higher growth rate during low-RH pollution periods (1.0 µg m−3 h−1) than during high-RH pollution periods (0.40 µg m−3 h−1). In contrast, sulfate had a decreasing trend during low-RH pollution periods, while it increased significantly with a growth rate of 0.81 µg m−3 h−1 during high-RH pollution periods. These distinctions in mass concentrations, mass fractions and daytime growth rates may be explained by the difference in the formation processes affected by meteorological conditions. In particular, photochemical oxidation and aqueous-phase processes may both produce sulfate and nitrate. The relative importance of the two pathways, however, differs under different meteorological conditions. Additional OOA formation under high-RH (> 70 %) conditions suggests aqueous-related formation pathways. This study provides a general picture of the haze formation in Beijing under different meteorological conditions.
- Article
(1794 KB) - Full-text XML
-
Supplement
(440 KB) - BibTeX
- EndNote


Air pollution is a serious environmental problem in China, particularly in the North China Plain (NCP) in winter, affecting air quality and human health. Beijing is one of the most polluted megacities in the NCP, with an annual mean concentration of PM2.5 being 86 and 51 µg m−3 in 2014 and 2018, respectively (http://sthjj.beijing.gov.cn/, last access: 1 February 2020), which significantly exceeded the Chinese National Ambient Air Quality Standard (annual average of 35 µg m−3). Fine-PM pollution in polluted urban environments is complex and is typically associated with enhanced primary emissions from multiple sources, strong secondary aerosol formation and stagnant weather conditions (Sun et al., 2011, 2013a, b, 2016; Huang et al., 2014; Hu et al., 2016; An et al., 2019). Regional transport of air pollutants from urbanized and industrialized areas has an important contribution to fine-PM pollution in the NCP region. For example, severe fine-PM pollution in Beijing during winter often happened when prevailing air masses were from the south (Sun et al., 2016).
Organic aerosol (OA) is the major constituent of fine PM and is much less understood compared to inorganic aerosol in terms of their chemical nature and sources (Hallquist et al., 2009; Shrivastava et al., 2017). OA is composed of a wide variety of organic species from different sources, and its emission sources and atmospheric processes are not well understood so far, especially in those regions with high fine-PM pollution. OA is either directly emitted to the atmosphere (primary organic aerosol, POA) or formed in the atmosphere (secondary organic aerosol, SOA). Therefore, it is essential to identify and quantify the major emission sources and understand the formation processes of OA.
The Aerodyne aerosol chemical speciation monitor (ACSM) with quadrupole (Q) or time-of-flight (TOF) mass analyzer is capable of real-time determination of nonrefractory components in submicron aerosol (NR-PM1), overcoming the limitation of filter measurements such as limited time resolution or measurement artifacts (Ng et al., 2011a; Fröhlich et al., 2013). ACSM has been widely used for fine-PM studies in many sites in China, including Beijing, Nanjing, Shijiazhuang, and Baoji (Sun et al., 2014; Wang et al., 2017; Zhang et al., 2017; Huang et al., 2019). By applying positive matrix factorization (PMF, Paatero et al., 1994) or a multilinear engine (ME-2, Canonaco et al., 2013) solver to the ACSM data, main OA sources can be identified. Those sources include hydrocarbon-like OA (HOA), biomass burning OA (BBOA), cooking OA (COA), coal combustion OA (CCOA) and oxygenated OA (OOA). OOA can further be resolved into semivolatile OOA (SV-OOA) and low-volatility OOA (LV-OOA) by volatility or into more-oxidized OOA (MO-OOA) and less-oxidized OOA (LO-OOA) by oxidation state. MO-OOA and LO-OOA together were found to contribute 61 % of OA in Beijing during summer in 2011 (Sun et al., 2012), while POA was found to be more important during winter of the same year (Sun et al., 2013a). However, many recent studies show large contributions of SOA in wintertime Beijing (Huang et al., 2014; Hu et al., 2016; Xu et al., 2018), and CCOA is often found to be a large fraction of POA during wintertime pollution days in Beijing (Sun et al., 2016; Wang et al., 2015; Elser et al., 2016). The discrepancies in SOA contribution in different measurement periods reflect the difference in atmospheric and meteorological conditions, e.g., atmospheric oxidative capacity and relative humidity (RH) (Sun et al., 2013b; Xu et al., 2017; Wu et al., 2018; Song et al., 2019).
Despite the observations of the large production of secondary aerosol during haze events, the formation mechanisms are not yet well understood. Specifically, more studies are needed to elucidate the relative importance of photochemical oxidation versus aqueous-phase processes on the formation of secondary aerosol during wintertime haze episodes of different meteorological conditions. In this study, we present measurement results at an urban site in Beijing during the winter of 2014–2015. The chemical nature of NR-PM1, sources of OA, formation processing of secondary aerosol in different episodes, and particularly the effects of RH on secondary aerosol formation are discussed.
2.1 Site description and instrumentation
The online measurements were conducted on the rooftop of a building (about 20 m above the ground level) at the campus of the National Center for Nanoscience and Technology (40.00∘ N, 116.38∘ E) from 29 December 2014 to 28 February 2015. The observation site is between the 4th Ring Road and 5th Ring Road in the northwest of Beijing and is surrounded by a residential area.
A Q-ACSM was deployed for the mass concentration measurements of NR-PM1 species, and the detailed operation principles can be found in Ng et al. (2011a). Briefly, ambient air was pumped through a 3∕8 in. (9.5 mm) stainless steel tube at a flow rate of 3 L min−1, of which 85 mL min−1 was sampled into the Q-ACSM. In order to remove coarse particles, an URG cyclone (URG-2000-30ED, size cutoff 2.5 µm) was installed in front of the inlet. Because particle bounce can affect collection efficiency (CE), to reduce this uncertainty and to dry the particles, a Nafion dryer (MD-110-48S; Perma Pure, Inc., Lakewood, NJ, USA) was installed after the URG cyclone. An aerodynamic lens was used to focus the submicron particles into a narrow beam, and the particle beam then impinged on a heated tungsten surface (about 600∘) to evaporate, impacted by 70 eV electron to ionize, and then detected by a quadrupole mass spectrometer. During this study, the scan rate of Q-ACSM was at 200 ms amu−1 from m∕z 10 to 150, and the time resolution was 30 min. To determine the response factor (RF), a differential mobility analyzer (DMA, TSI model 3080) and a condensation particle counter (CPC, TSI model 3772) were used to select and count the monodisperse 350 nm ammonium nitrate (NH4NO3) particles, respectively. The mass of NH4NO3 particles was calculated with known particle size and number concentrations. This calculated mass concentration was compared to the RF of the Q-ACSM, resulting in the ionization efficiency (IE) value (Ng et al., 2011a).
The gaseous species including O3, NOx, and SO2 were measured by a Thermo Scientific Model 49i ozone analyzer, a Thermo Scientific Model 42i analyzer, and an Ecotech EC 9850 sulfur dioxide analyzer, respectively. The NH3 concentrations were measured by an NH3 analyzer (Picarro G2103). The concentration of black carbon (BC) was determined by an Aethalometer (Model AE-33, Magee Scientific) with a time resolution of 1 min. In brief, light attenuation at seven different wavelengths was recorded for particle-laden filter spots, and BC concentration was retrieved based on the light attenuation at 880 nm. An automatic weather station (MAWS201, Vaisala, Vantaa, Finland) was used to measure the meteorological parameters including temperature, pressure, relatively humidity and visibility, and a wind sensor (Vaisala Model QMW101-M2) was used to measure the wind speed (WS) and wind direction (WD).
2.2 Data analysis
2.2.1 ACSM data analysis
The standard Q-ACSM data analysis software (v.1.5.3.5) written in Igor Pro (WaveMetrics, Inc., OR, USA) was used to calculate the mass concentrations for different species in NR-PM1. Default relative ionization efficiencies (RIEs) were used for organics (1.4), nitrate (1.1) and chloride (1.4), respectively (Ng et al., 2011a). RIEs of 5.8 for ammonium and 1.2 for sulfate were determined by the IE calibrations of ammonium nitrate and ammonium sulfate. Meanwhile, data were corrected for the particle collection efficiency (CE), due to particle bounce on the vaporizer. CE can be affected by relative humidity, mass fraction of ammonium nitrate and particle acidity. In our measurement, the particles were generally neutral and dried before sampling into the ACSM. CE was calculated as CEdry= max (0.45, ANMF), where ANMF refers to the ammonium nitrate fraction in NR-PM1 (Middlebrook et al., 2012).
2.2.2 OA source apportionment
The receptor model PMF using a multilinear engine (ME-2) was used to identify and quantify the OA sources. PMF is a bilinear receptor model used to describe the variability of a multivariate dataset, X, as the linear combination of a set of constant factor profiles, F, and their corresponding time series, G, as expressed in Eq. (1).
where X is the measured OA mass spectra consisting of i rows and j columns, and E is the model residuals. The PMF uses a least-squares method to minimize the object function (Q), defined as the sum of the squared residuals (eij) weighted by their respective uncertainties (σij).
Unconstrained PMF analyses of OA data suffer from rotational ambiguity when sources show similar profiles and temporal covariation (Canonaco et al., 2013; Huang et al., 2019). However, by introducing a priori information as additional model input and constraining one or more output factor profiles to a predetermined range, ME-2 can overcome such difficulties and provide more environmentally meaningful solutions. When an element of a factor profile (fj, where j refers to the m∕z) is constrained with a certain a value (a), the following conditions need to be fulfilled:
The a value can vary between 0 and 1, which is the extent to which the output profiles can vary from the model inputs. The data analyses were conducted using the source finder (SoFi, Canonaco et al., 2013) tool version 4.9 for Igor Pro. Due to rotational ambiguity, there was no mathematically unique solution. Therefore, criteria including chemical fingerprint of the factor profiles, correlations with external tracers, and diurnal cycles were used for the factor identification and interpretation (Ulbrich et al., 2009; Huang et al., 2014, Elser et al., 2016).
2.2.3 Aerosol liquid water content
NR-PM1 inorganic species, NH3 concentrations and meteorological parameters including temperature and RH were used to calculate the aerosol liquid water content from inorganic species (ALWCi) based on the ISORROPIA II model (Fountoukis and Nenes, 2007). Here we ran the ISORROPIA II in forward mode, and the particles were assumed to be deliquescent, i.e., in metastable mode (Hennigan et al., 2015). The thermodynamic equilibrium of the system was then modeled and ALWCi was calculated.
Meanwhile, the contribution of organics to ALWC (ALWCO) was also calculated using the following equation (Guo et al., 2015; Cheng et al., 2016):
where OM is the mass concentration of organics, ρw is the density of water and ρorg is the density of organics ( kg m−3, Cerully et al., 2015). κorg is the hygroscopicity parameter of organic aerosol composition. We adopted a κorg value of 0.06 based on previous cloud condensation nuclei measurements in Beijing (Gunthe et al., 2011).
Table 1Summary of the PM1 composition, OA sources and meteorological conditions during different pollution periods.
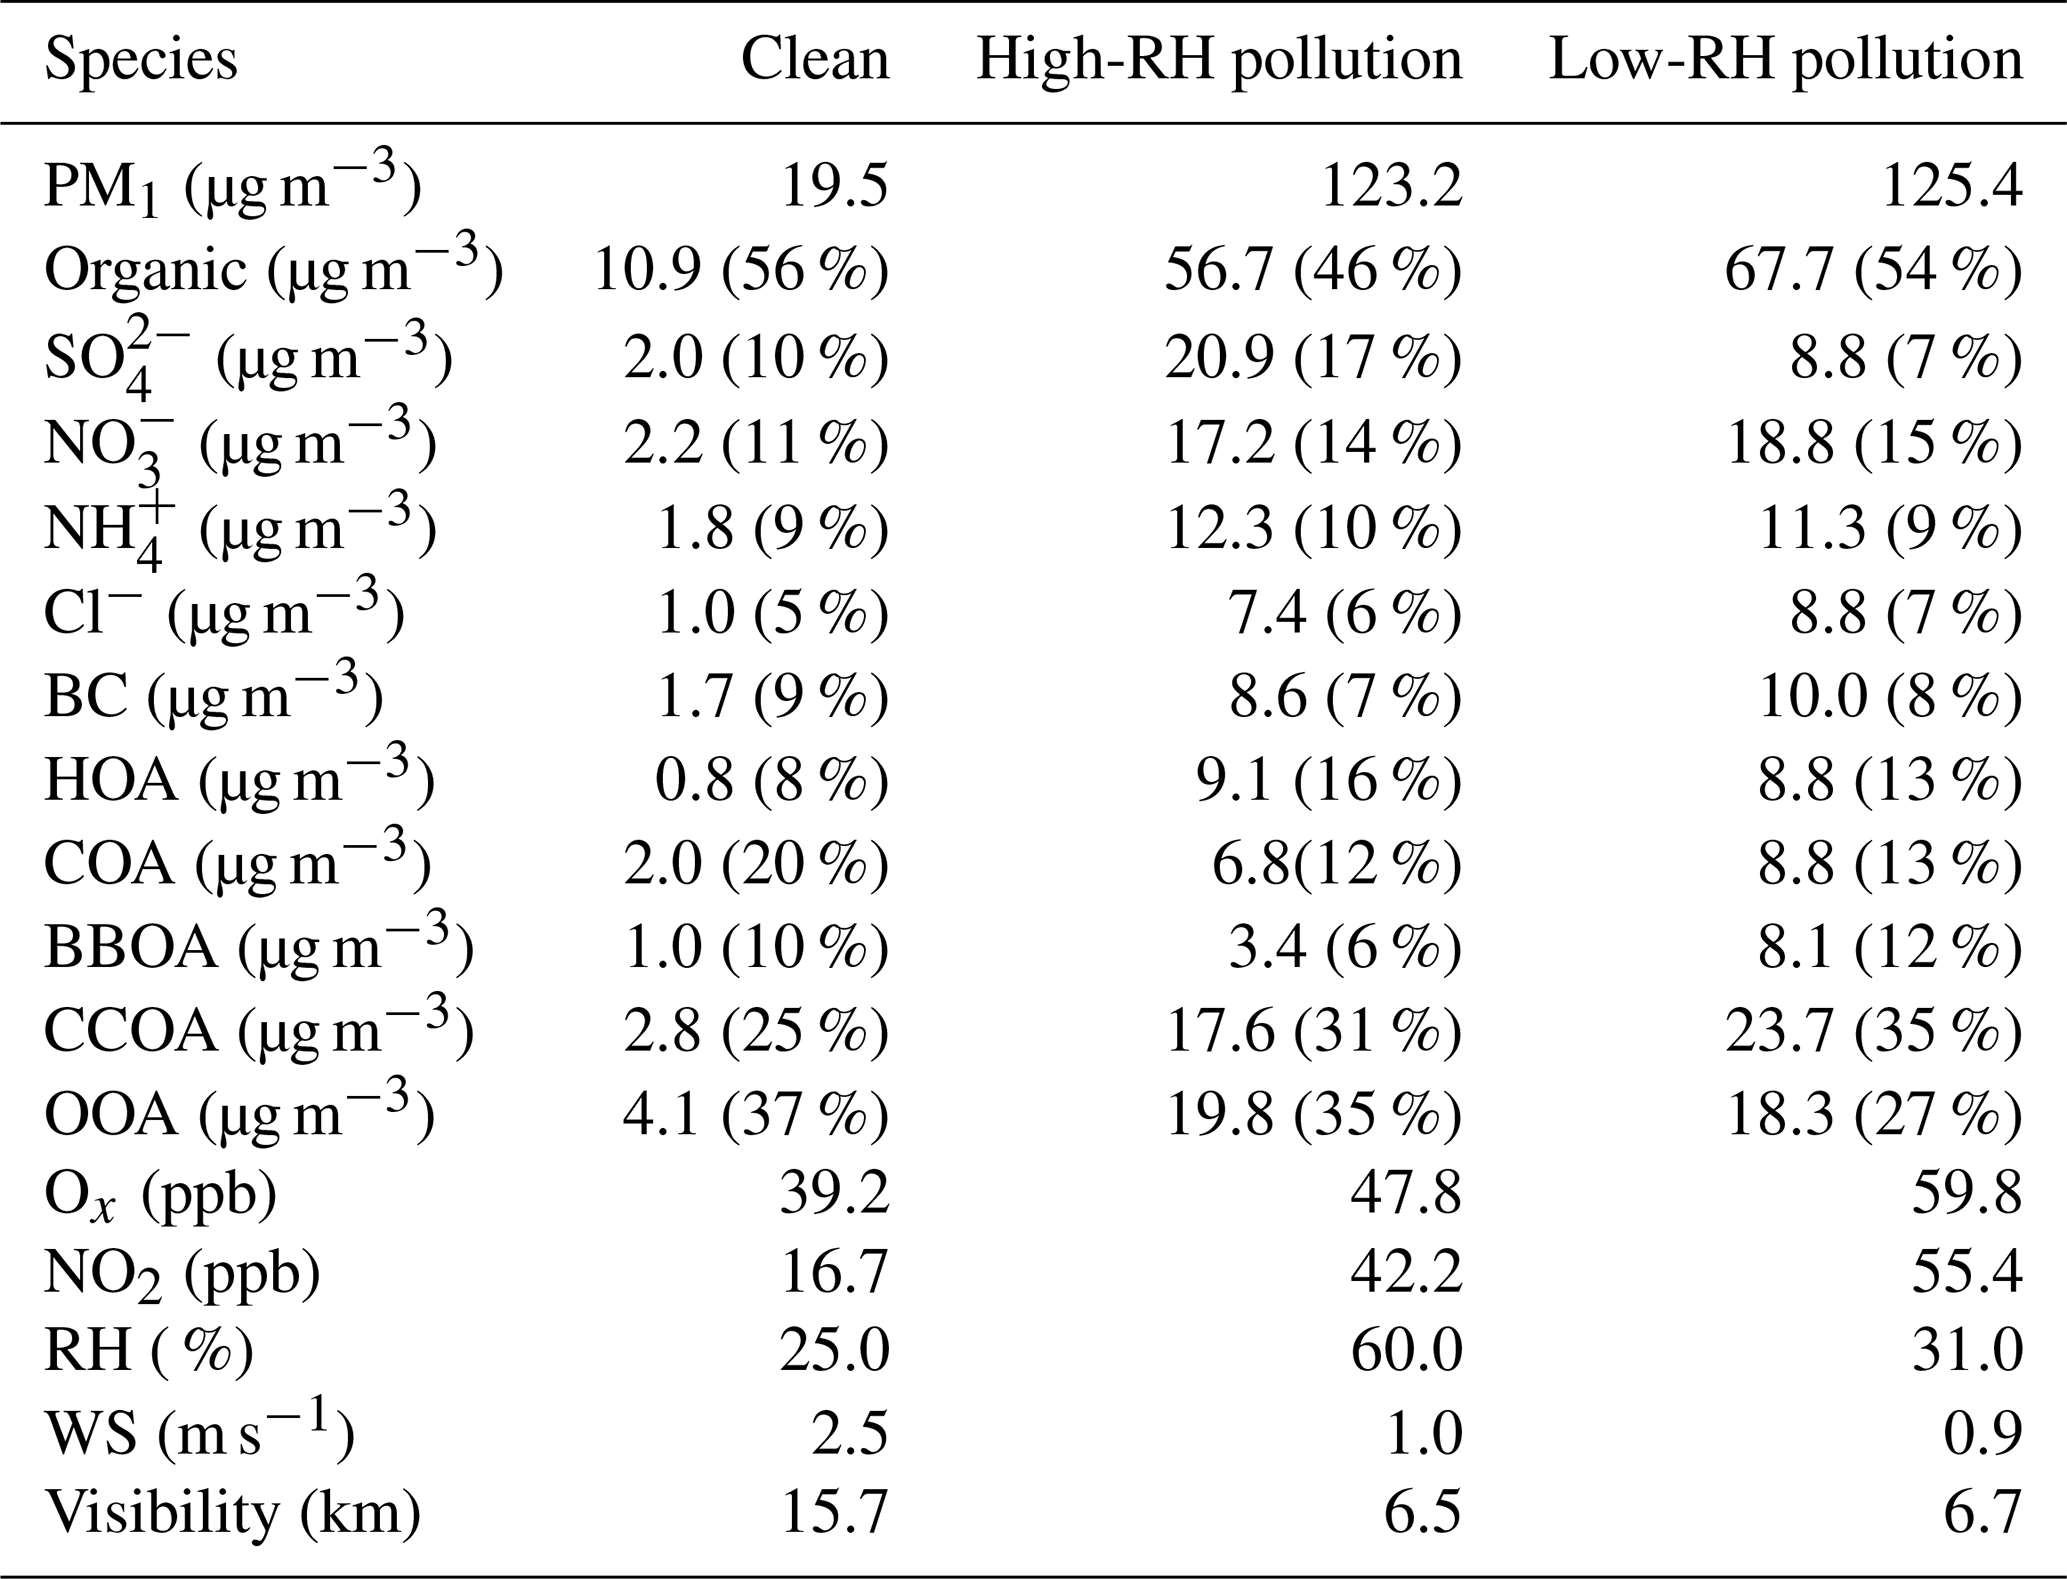

Figure 1Time series of (a) wind speed (WS) and wind direction (WD), (b) temperature (Temp) and relative humidity (RH), (c) visibility and PM1, (d) NR-PM1 species (i.e., OA, , , , Cl− and BC; note that OA concentration in the figure is half of that actually measured), (e) OA factors (i.e., HOA, COA, BBOA, CCOA and OOA), and (f) relative contribution of PM1 species.
3.1 Temporal variations and mass fractions of PM1 species
Figure 1 shows the time series of mass concentrations of OA, , , , Cl− and BC, as well as the meteorological parameters. The average mass concentration of PM1 during the entire measurement period was 73.8 µg m−3, similar to those observed in Beijing in winter 2011 (66.8 µg m−3, Sun et al., 2013a) and winter 2013 (64.0 µg m−3, Sun et al., 2016). The lowest daily average concentration was 5.2 µg m−3 on 31 December, while the highest was 210.1 µg m−3 on 15 January, with a difference of a factor of ∼40. OA (52 %) was the most abundant component of PM1, irrespective of the meteorological conditions, followed by nitrate (14 %) and sulfate (11 %). The weather conditions during the measurement period were characterized by drastic changes in wind speed, wind direction, RH and temperature, providing a unique setting to investigate the influence of meteorological conditions on PM species. The clean and pollution episodes occurred alternately during the measurement period, and the PM1 concentration was usually lower than 20 µg m−3 during clean episodes and higher than 100 µg m−3 during pollution episodes. As such, the measurements can be divided into the clean period (PM1 < 20 µg m−3) and the pollution period (PM1 > 100 µg m−3). The southern or southeasterly wind directions with low speed (average, 0.9–1.0 m s−1) were typical for the pollution period, while the northern or northwesterly directions with high speed (average, 2.5 m s−1) were typical for the clean period (Fig. 1).
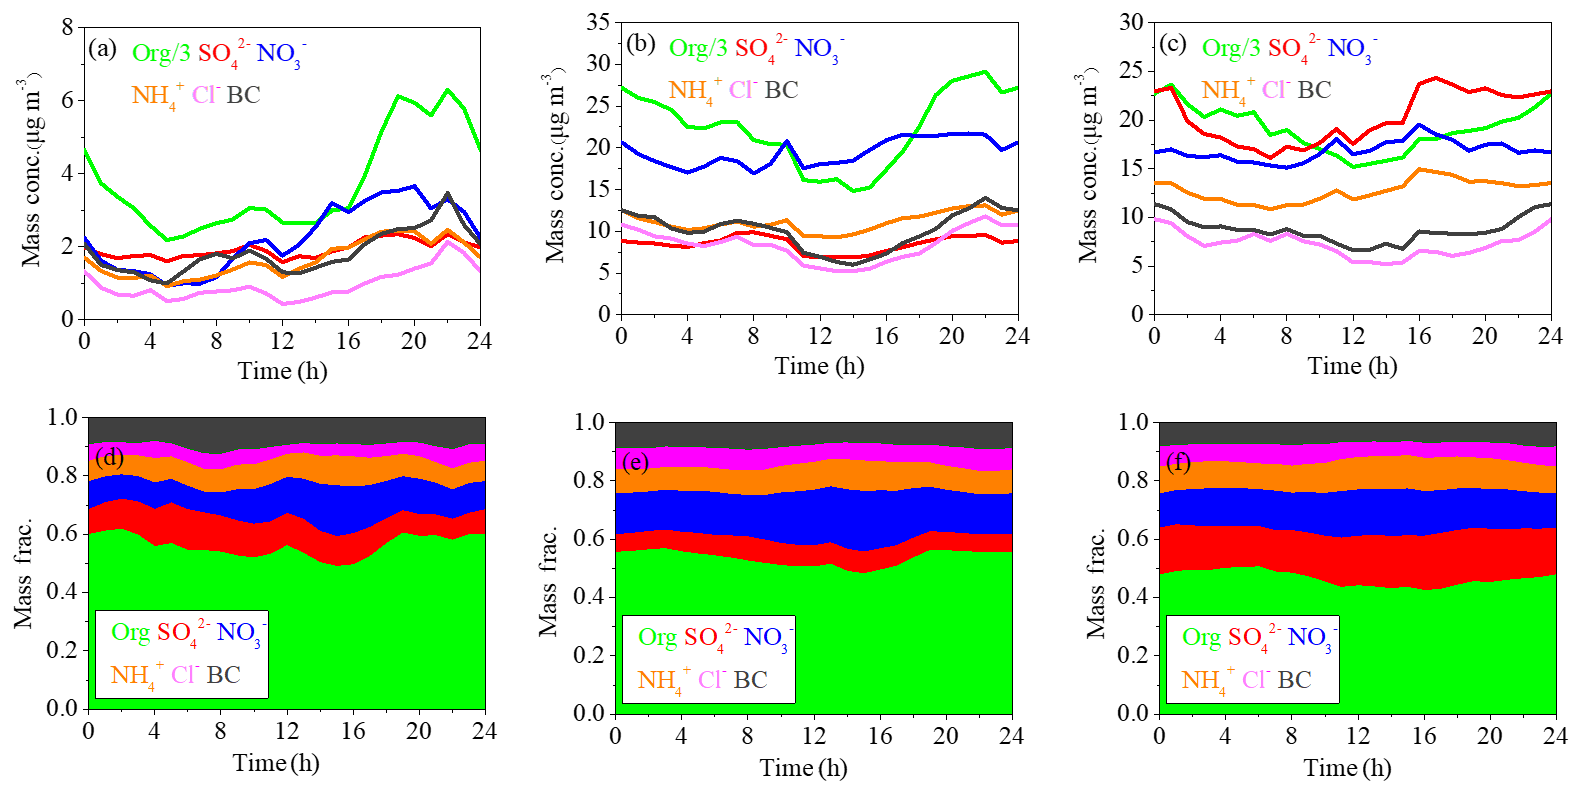
Figure 2The diurnal variations of mass concentrations and relative contributions of PM1 components during clean days (a, d), low-RH pollution days (b, e) and high-RH pollution days (c, f).
During the polluted period, RH varied from 15 % to 95 %, with an average value of 46 % and a median value of 43 %. To investigate the effects of RH on PM pollution formation, we further divided the pollution period into two categories, the low-RH pollution days (RH < 50 %) and the high-RH pollution days (RH > 50 %). The diurnal variations of mass concentrations and fractions of different chemical species during clean days, low-RH pollution days and high-RH pollution days are shown in Fig. 2. The mass fractional variations were flatter during low-RH and high-RH pollution days than during clean days, likely due to the accumulation of pollutants during stagnant weather conditions in pollution days. During clean days, secondary inorganic aerosol showed generally increasing trends from 06:00 to 20:00 local time (LT), despite the development of the boundary layer height during the day. The growth rate of nitrate mass (0.21 µg m−3 h−1) was higher than that of sulfate (0.04 µg m−3 h−1) and ammonium (0.10 µg m−3 h−1), indicating that formation of nitrate was perhaps faster than that of sulfate and ammonium during clean days. During low-RH pollution days, nitrate increased from 06:00 to 20:00 LT, with a growth rate of 0.40 µg m−3 h−1, which was 2 times higher than that during clean days. On the contrary, sulfate concentrations increased from 06:00 to 10:00 LT, then started decreasing and reached the minimum at 14:00 LT, possibly due to the increase in the boundary layer height during the day, which outweighed the production of sulfate. Associated with both sulfate and nitrate, ammonium showed a minor increase from 06:00 to 20:00 LT with a mass growth rate of 0.18 µg m−3 h−1. This phenomenon suggested that the low-RH condition was favorable for nitrate formation but not for sulfate formation under polluted conditions. In contrast, obvious increases in secondary inorganic species from 08:00 to 16:00 LT were observed during high-RH pollution days, with growth rates of 0.81 µg m−3 h−1, 0.55 and 0.46 µg m−3 h−1 for sulfate, nitrate and ammonium, respectively. These mass growth rates increased correspondingly by about 20, 2.6 and 4.6 times compared to those during clean days. Note that the nitrate growth rate in high-RH pollution days (0.55 µg m−3 h−1) was still slightly higher than that in low-RH pollution days (0.40 µg m−3 h−1), indicating that nitrate production is still efficient when RH is high, although not much higher compared to sulfate. Measurements of sulfate oxygen isotopes suggest that the largely enhanced formation of sulfate is associated with efficient aqueous-phase reactions during high-RH pollution days (Shao et al., 2019). Note that the comparison of growth rates was done under the assumption that chemical processes were the main reason for mass growth, which might not be the case if other factors such as planetary boundary layer height variations dominate. Yet comparison of growth rates of different species in the same time period would not be affected by these factors because those species should share the same effects.
3.2 Sources and diurnal variations of OA
Source apportionment was performed on the OA data. Three to seven factors were examined using an unconstrained PMF model, and the factors were qualitatively identified based on their mass spectral profiles and correlation with external data. We found that a solution of five factors (i.e., HOA, COA, CCOA, BBOA and OOA) best explains our data. For the solutions with less than five factors, HOA appeared to be mixed with COA while CCOA mixed with BBOA (Fig. S1 in the Supplement). However, when the number of factors was increased to six, the OOA factor split into two OOA factors of similar time series (Fig. S2), suggesting that further separation of the factors does not improve the interpretation of the data.
Although five factors with different profiles and temporal variations were identified by the unconstrained PMF model, the factor profiles and time series were suboptimal, specifically for HOA, COA and BBOA. The diurnal pattern of HOA showed pronounced peaks at cooking time, indicating its mixing with COA. The fractional contribution of m∕z 60 (f60, typically related to the fragmentation of anhydrous sugars) in HOA (0.008) was higher than the average value reported from multiple ambient datasets (0.002, Ng et al., 2011b). To reduce the mixing between factors, the reference HOA mass spectral profile, characterized by a small f60 (Wang et al., 2017), and the BBOA mass spectral profile, derived from Beijing wintertime measurements (Elser et al., 2016), were constrained using ME-2. For the COA mass spectral profile that was derived from our unconstrained PMF analysis, an a value of 0 was used. Meanwhile, for HOA and BBOA, the a values were varied systematically between 0 and 1 with an interval of 0.1 to explore the solution space. To assess the obtained solutions, we have set thresholds for the highest acceptable f60 value (0.006) for HOA and f57 value (0.042) for BBOA, based on mass spectra obtained at multiple sites (mean ±2σ, Ng et al., 2011b). Only solutions that conform to both criteria were selected, and the final solution was the average of those selected reasonable solutions (Fig. S3).
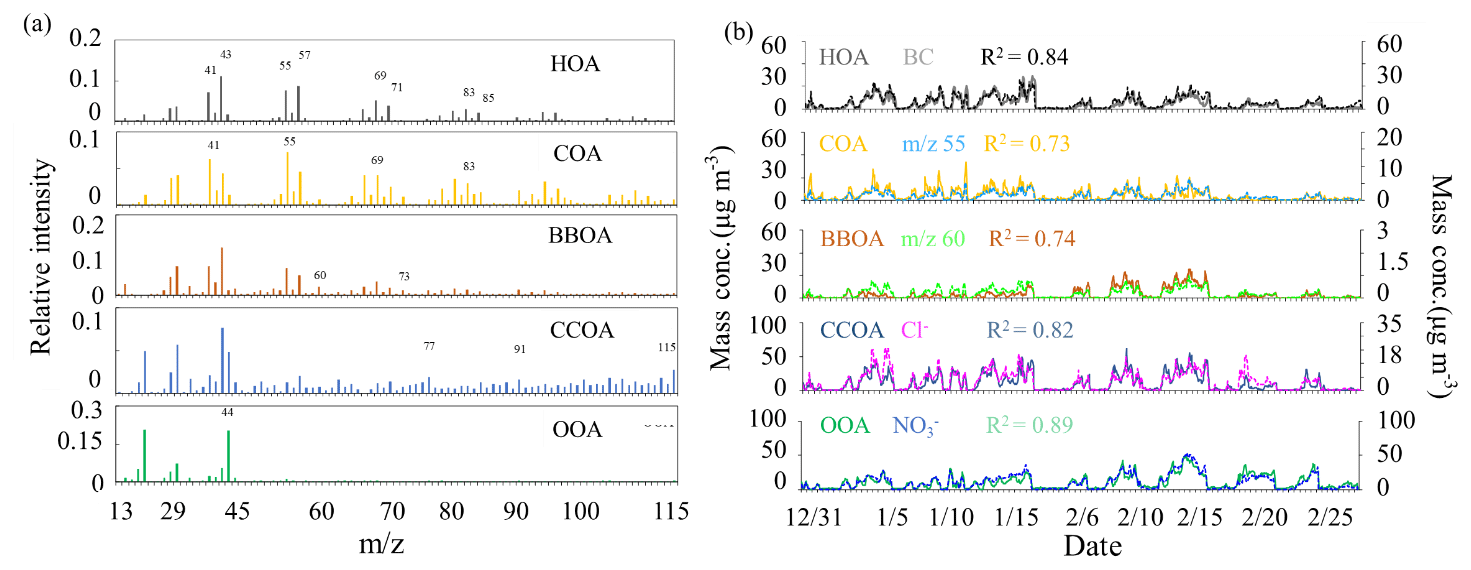
Figure 3The mass spectra (a) and time series (b) of OA factors (HOA, COA, BBOA, CCOA and OOA).
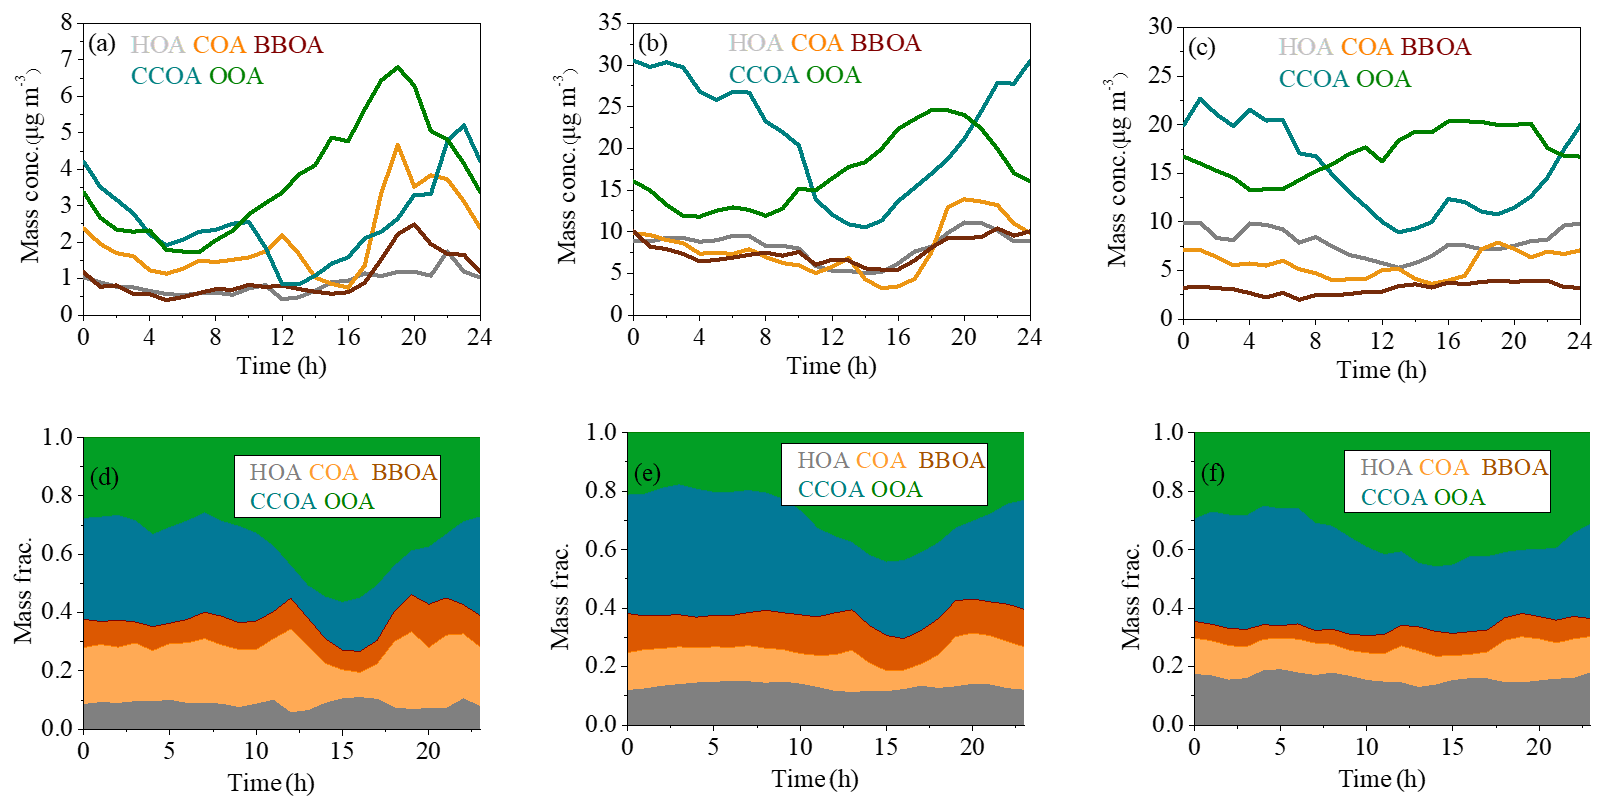
Figure 4The diurnal variations of mass concentrations and relative contributions of OA factors during clean days (a, d), low-RH pollution days (b, e) and high-RH pollution days (c, f).
The final OA factors resolved by ME-2 include four POA factors (i.e., HOA, COA, BBOA and CCOA) and one SOA factor (i.e., OOA), on average accounting for 14 %, 14 %, 10 %, 32 % and 31 % of OA mass concentration, respectively. The mass spectral profiles and time series of the resolved factors are shown in Fig. 3a and b, respectively. The diurnal patterns of these factors are presented in Fig. 4. The HOA spectrum is similar to those derived from other studies in Beijing (Hu et al., 2016; Sun et al., 2014, 2016) and Pittsburgh (Ulbrich et al., 2009) and also resembles the source profile from diesel exhausts (Canagaratna et al., 2004). A strong correlation between the time series of HOA and BC was observed (R2=0.84). The diurnal cycle of HOA was similar to those observed in other studies in Beijing (Sun et al., 2011, 2013a, 2014), showing higher mass concentrations during the night than during the day, due to enhanced traffic emissions from heavy-duty vehicles and diesel trucks that are allowed to enter the inner city during the night.
Similar to HOA, the mass spectrum of COA also displayed high signals in odd fragments, while the m∕z 55∕57 ratio (1.45) and m∕z 41∕43 ratio (1.6) were significantly higher compared to those of the HOA factor profile (m∕z , m∕z ). The COA profile is similar to those resolved in previous studies in Beijing (Elser et al., 2016; Sun et al., 2016), Paris (Crippa et al., 2013) and Zurich (Lanz et al., 2007). The R2 between COA and m∕z 55 time series was 0.73. The diurnal cycle of COA showed two prominent peaks during lunch (12:00–13:00 LT) and dinner (18:00–19:00 LT) times, and the peak in the evening was more pronounced than that at noon, consistent with a previous study in Beijing (Sun et al., 2016). Furthermore, the diurnal variation of COA was more obvious with much clearer noon and evening peaks during clean days than during low-RH and high-RH pollution days, likely because the stagnant meteorological conditions during pollution days facilitated the accumulation of pollutants and thus weakened the diurnal fluctuation.
The BBOA mass spectrum showed a similar pattern to that extracted from Crippa et al. (2014), with pronounced peaks at m∕z 60 and 73, two distinct markers of biomass burning emissions (Lanz et al., 2007). BBOA also showed similar time series with a high signal at m∕z 60 (R2=0.74). The diurnal cycle of BBOA showed a slight increase during the night (18:00–24:00 LT), corresponding to nighttime burning for residential heating in clean days, while this diurnal cycle became much flatter during low-RH and high-RH pollution days, likely due to the stagnant meteorological conditions during pollution days. On average, BBOA contributed 10 % of the total OA, which is much less than that of CCOA (32 %) and consistent with previous results in Beijing (Elser et al., 2016).
The profile of CCOA showed a moderate correlation with that resolved in Beijing in winter 2014 (Elser et al., 2016). Similar to previous studies, signals related to unsaturated hydrocarbons, especially those at m∕z 77, 91 and 115, contributed significantly to the total CCOA signal. In addition, there was a strong correlation between CCOA and Cl− (R2=0.82), which was considered a marker mainly from coal combustion emissions. The mass concentration and mass fraction of CCOA were both significantly higher at night than those during the day, which was observed both in clean days and pollution days. The diurnal pattern suggests much stronger emissions from coal combustion at night, a situation further deteriorated by a shallower boundary layer at night.
One secondary OA factor, namely OOA, was also resolved, characterized by an important contribution at m∕z 44. The profile of OOA is also similar to those resolved in Ng et al. (2011a) and Sun et al. (2013a). OOA is correlated well with nitrate (R2=0.89), and the diurnal cycle of OOA shows an increase from about 06:00 to 20:00 LT, indicating the contribution from photochemical production and accumulation of OOA. Note that the growth rate of OOA during low-RH pollution days (1.0 µg m−3 h−1) was higher than that during high-RH pollution days (0.40 µg m−3 h−1) and clean days (0.35 µg m−3 h−1) (Fig. 4).
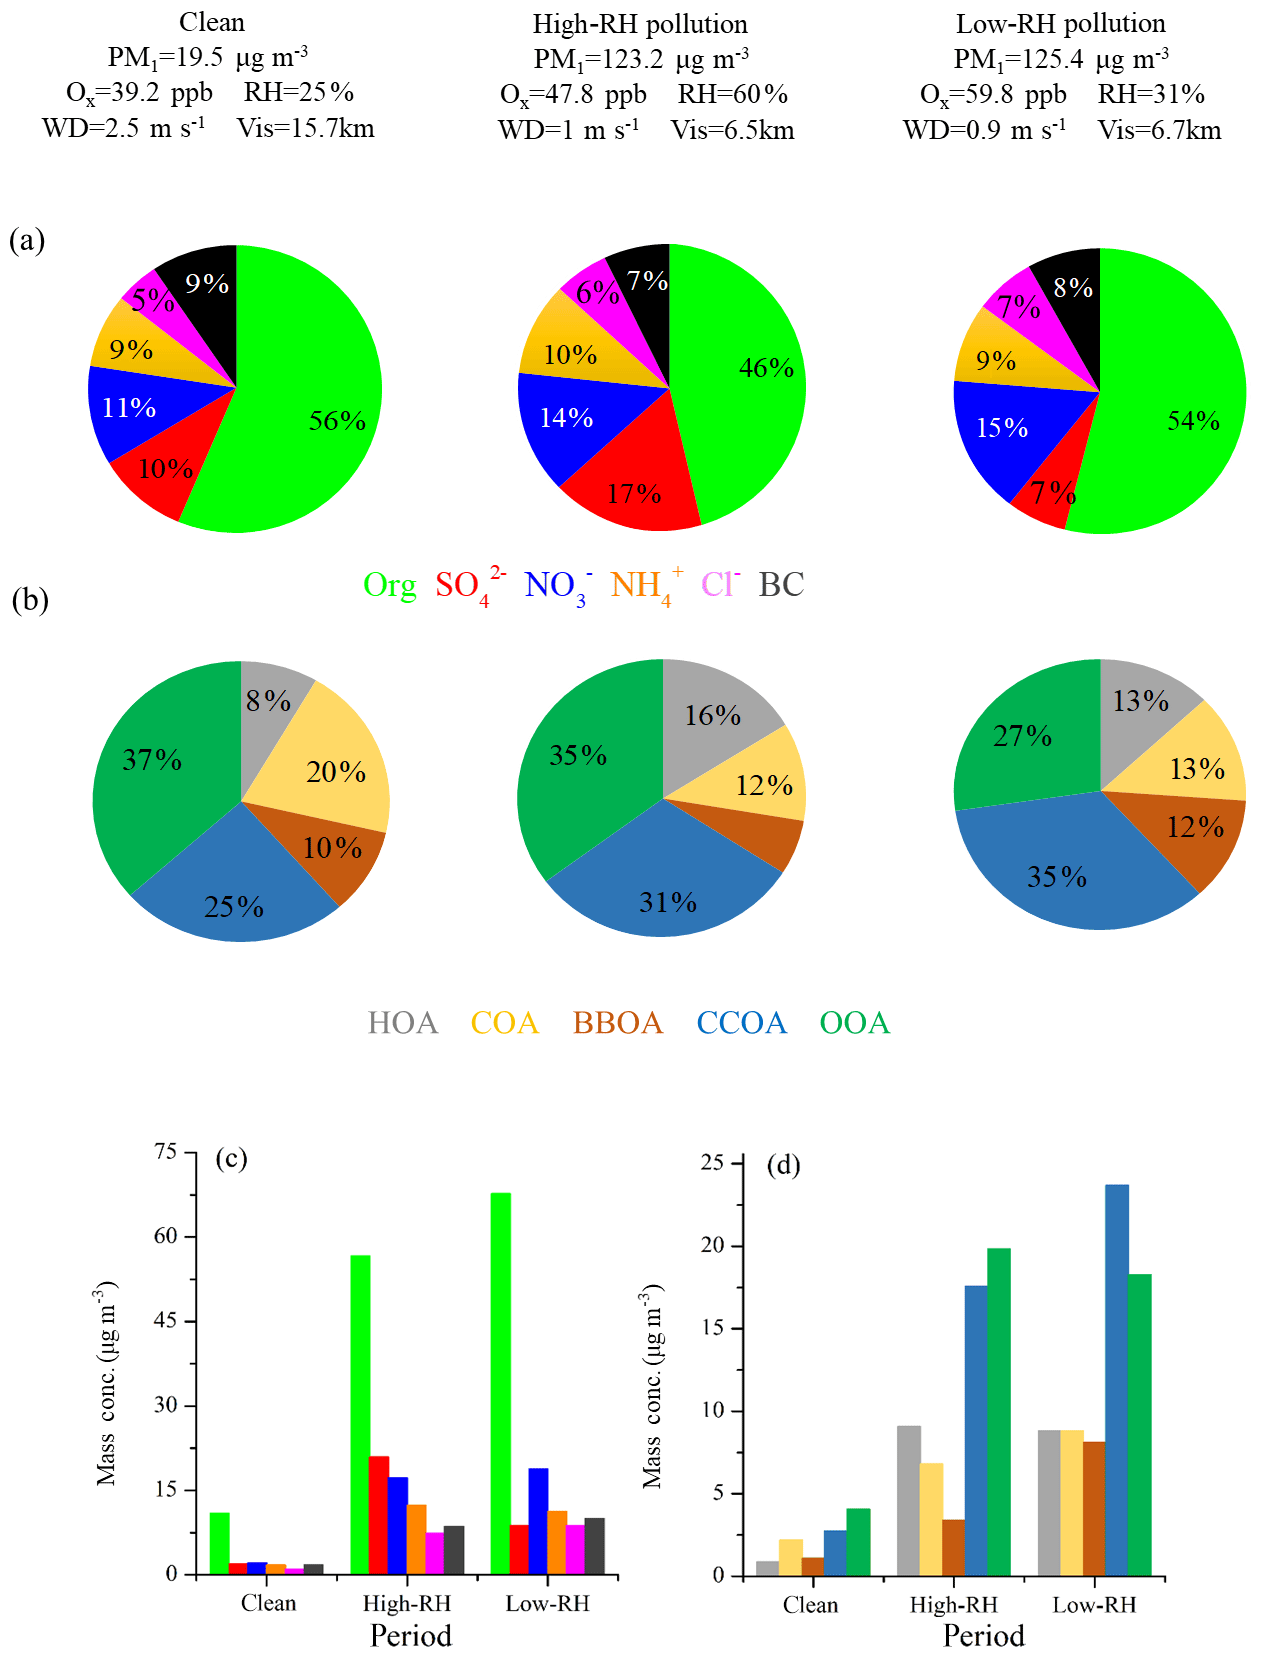
Figure 5PM1 chemical composition (a) and OA source composition (b) pie chart as well as the mass concentrations of PM1 species (c) and OA sources (d) during clean, high-RH pollution and low-RH pollution periods.
3.3 Chemically resolved PM pollution
Figure 5 shows the mass fraction of PM1 and OA during clean, low-RH and high-RH pollution periods. OA was the dominant component in PM1, with an average concentration increasing from 10.9 µg m−3 during clean periods to 56.7 µg m−3 during high-RH pollution periods and further to 67.7 µg m−3 during low-RH pollution periods. The corresponding mass fraction of OA was 56 %, 46 % and 54 %, respectively. The decrease in OA mass fraction during pollution periods can be attributed to the increased formation of sulfate and nitrate, as demonstrated in the above section. Specifically, nitrate increased from 11 % (2.2 µg m−3) during clean periods to 14 % (17.2 µg m−3) during high-RH pollution periods and to 15 % (18.8 µg m−3) during low-RH pollution periods, while sulfate increased from 10 % (2.0 µg m−3) during clean periods to 17 % (20.9 µg m−3) during high-RH pollution periods but decreased back to as low as 7 % (8.8 µg m−3) during low-RH pollution periods. The increased formation of nitrate from clean to pollution periods, especially during low-RH pollution periods, is likely due to enhanced photochemical production, as discussed by Lu et al. (2019), who show fast photochemistry during wintertime haze events in Beijing. Specifically, the atmospheric oxidation proxy () increased from 39.2 ppb during clean periods to 47.8 ppb during high-RH pollution periods and up to as high as 59.8 ppb during low-RH pollution periods. Meanwhile, the precursor gas for nitrate, NO2, increased accordingly from 16.7 ppb during clean periods to 42.2 ppb during high-RH pollution periods and to 55.4 ppb during low-RH pollution periods. The averaged PM1 concentrations during high-RH (123.2 µg m−3) and low-RH (125.4 µg m−3) pollution periods were very similar, but a distinct difference lies in the sulfate and nitrate fractions in these two types of pollution periods. We observed similar contributions from nitrate during low-RH pollution periods and high-RH pollution periods, while we observed a much larger contribution from sulfate during high-RH pollution periods than during low-RH pollution periods because of enhanced formation from aqueous-phase processes.
In terms of OA sources, CCOA and OOA were the major sources irrespective of the PM1 level. The mass fraction of CCOA in OA increased from 25 % (2.8 µg m−3) during clean periods to 31 % (17.6 µg m−3) during high-RH pollution periods and to 35 % (23.7 µg m−3) during low-RH pollution periods, indicating the importance of residential coal combustion emissions during haze pollution in wintertime Beijing (Elser et al., 2016; Li et al., 2017). OOA also increased significantly during pollution periods, from 4.1 to ∼20 µg m−3. It should be noted that the average OOA mass concentrations were rather similar during high-RH (19.8 µg m−3) and low-RH (18.3 µg m−3) pollution periods. However, the OOA mass fraction in OA during the high-RH pollution period (35 %) is higher than that during the low-RH pollution period (27 %), indicating an additional contribution of OOA from, e.g., aqueous-phase oxidations during high-RH conditions, as discussed below. The mass fraction of HOA in OA increased from 8 % (0.8 µg m−3) during clean days to 13 % (8.8 µg m−3) during low-RH pollution days and further to 16 % (9.1 µg m−3) during high-RH pollution days, suggesting an increased contribution of HOA in pollution days. The mass fraction of HOA is similar to those measured in wintertime Beijing in 2011(14 %, Hu et al., 2016) and in 2013 (11 %, Sun et al., 2016). In contrast, the mass concentrations of COA during low-RH pollution days (8.8 µg m−3) and high-RH pollution days (6.8 µg m−3) were higher than that during clean days (2.0 µg m−3), but the mass fractions of COA in OA during high-RH pollution days (12 %) and low-RH pollution days (13 %) were lower than that during clean days (20 %). A similar decrease in HOA contribution and an increase in COA contribution during clean days were also observed by Sun et al. (2016) in wintertime Beijing in 2011. The highest contribution of BBOA was observed during low-RH pollution days with a mass fraction of 12 % (8.1 µg m−3). The BBOA concentration during high-RH pollution days (3.4 µg m−3) was higher than that during clean days (1.0 µg m−3), but the mass fraction of BBOA in OA during high-RH pollution days (6 %) was lower than that during clean days (10 %).
The chemical composition and sources of PM1 under different meteorological conditions (e.g., wind direction, wind speed and RH) in the seven pollution episodes (PM1 > 100 µg m−3) and seven clean episodes (PM1 < 20 µg m−3) are shown in Fig. S4. Note that these episodes in total accounted for 91 % of the entire measurement period. The pollution episodes were found to be associated with the air masses from the south or southwest, while clean episodes were associated with the air masses from the north or northwest. Meanwhile, the pollution episodes were generally associated with higher RH and lower wind speeds when compared to the clean episodes. The wind speeds were approximately 3 times higher in clean episodes than those in pollution episodes. For example, the lowest concentration of PM1 was 6.7 µg m−3 in the C6 period, corresponding to the highest wind speed (4.0 m s−1) and the lowest concentrations (< 20 ppb) of inorganic gaseous precursors (SO2, NH3 and NOx), while the highest PM1 concentration of 169.0 µg m−3 was found at P5, corresponding to a much lower wind speed (< 1.0 m s−1). The mass concentrations of OA increased from ∼4.1–9.4 µg m−3 during clean episodes to ∼44.7–85.7 µg m−3 during pollution episodes. However, the contributions of OA to PM1 showed a decreasing trend from 48 %–59 % during clean episodes to 44 %–57 % during pollution episodes, and the corresponding contributions of secondary inorganic species increased from 29 %–34 % (∼2.2–5.5 µg m−3) to 27 %–47 % (∼25.5–62.1 µg m−3), indicating a notable production and accumulation of secondary inorganic aerosol during haze pollution episodes. In contrast, the mass concentration of OOA increased from ∼1.4–3.9 µg m−3 during clean episodes to ∼10.0–27.6 µg m−3 during pollution episodes, while the contribution of OOA to OA decreased from 33 %–64 % during clean episodes to 20 %–52 % during pollution episodes. The corresponding contribution of POA sources increased from 35 %–67 % (∼1.2–4.7 µg m−3) to 38 %–80 % (∼13.9–58.7 µg m−3), suggesting that in general the emission and accumulation of POA sources played an important role during haze pollution in this measurement campaign.
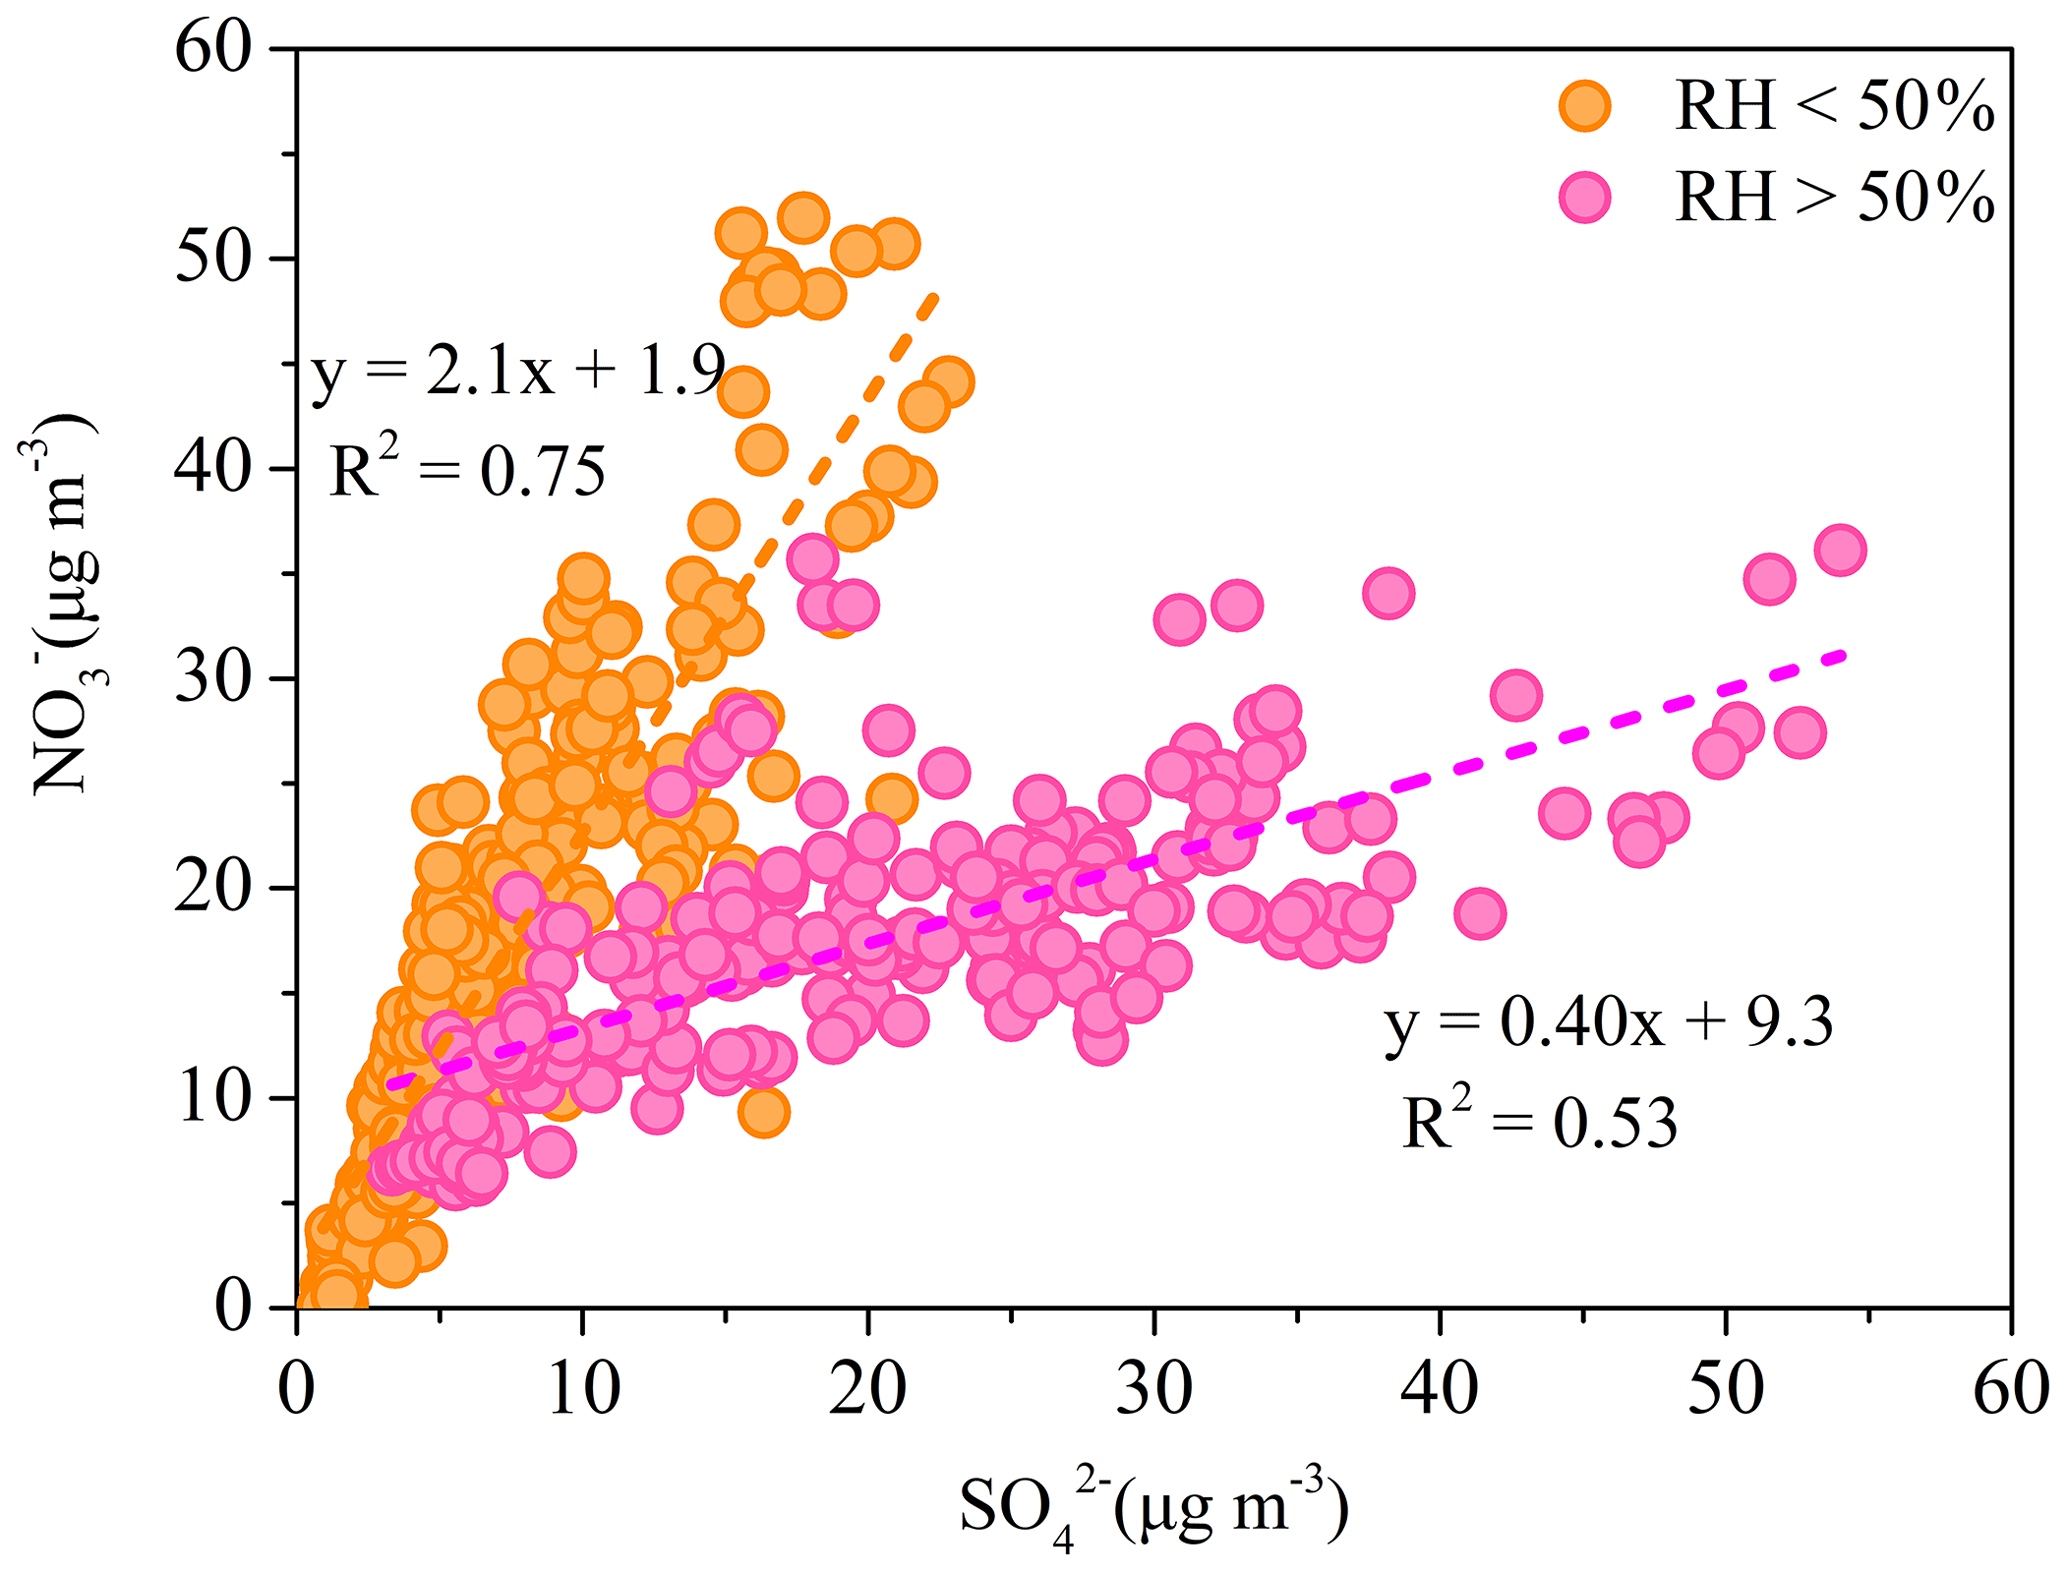
Figure 6The relationship between and during low-RH (RH < 50 %) and high-RH (RH > 50 %) pollution episodes.

Figure 7The relationship between the sulfate oxidation ratio (SOR = []/([] + [SO2]) and ALWC at high-RH pollution conditions (RH > 50 %).
Comparing the pollution episodes with different RH conditions (see Fig. S4), the mass fraction of sulfate was much higher during high-RH pollution episodes (P3, P6 and P7, 15 %–21 %) than during low-RH pollution episodes (P1, P2, P4 and P5, 6 %–8 %). OOA also showed a much higher contribution to OA during high-RH pollution events (62 % for P6 and 50 % for P7) than during low-RH pollution events (P1, P2, P4 and P5, 20 %–31 %). These variations suggest the potential importance of aqueous-phase reactions for the formation of sulfate and OOA, as discussed above. Further comparison of high-RH and low-RH pollution episodes with similar PM levels (e.g., P2 and P6 with PM1 concentration of 98.8 and 99.6 µg m−3 respectively) shows that secondary inorganic aerosol dominated PM1 in the high-RH pollution episode. Similarly, as for the high-RH and low-RH pollution episodes with similar OA levels, for example, P6 (44.7 µg m−3) and P7 (46.3 µg m−3), OOA dominated the particulate pollution (62 % of OA) at high-RH pollution events due to efficient formation of SOA. On the contrary, POA had increased contributions to PM pollution at low-RH and stagnant weather conditions (from 38 % of OA at high-RH pollution to 50 % of OA at low-RH pollution), consistent with previous studies in other Chinese cities (e.g., Wang et al., 2017; Huang et al., 2019). These results indicate that meteorological conditions have important effects on the particulate pollution.
3.4 Formation of secondary aerosol
The relationship between and is investigated to elucidate the formation processes of these two typical secondary inorganic aerosol species. The correlation between and was weak for the entire pollution period, because of the varied relative contribution of different formation processes during different periods. However, better correlations between and were found with different slopes when the data were divided into low-RH (RH <50 %) and high-RH (RH > 50 %) pollution periods (Fig. 6). During low-RH pollution periods, and showed a good correlation (R2=0.75) with a ratio of 2.1, indicating a similar photochemical production process. Meanwhile, the high ratio between and suggests the nitrate production is more efficient than that of sulfate during low-RH pollution period. However, during high-RH pollution periods, the ratio of to decreased significantly to 0.40, with a lower correlation coefficient (R2=0.53). The degraded temporal correlation between nitrate and sulfate suggests a different formation pathway of nitrate and sulfate during high-RH pollution periods. Aqueous-phase production of become important during those periods. Consistently, Fig. 7 shows that the sulfate oxidation ratio (SOR = []/([] + [SO2]) increased exponentially with the increase in ALWC at RH > 50 %.
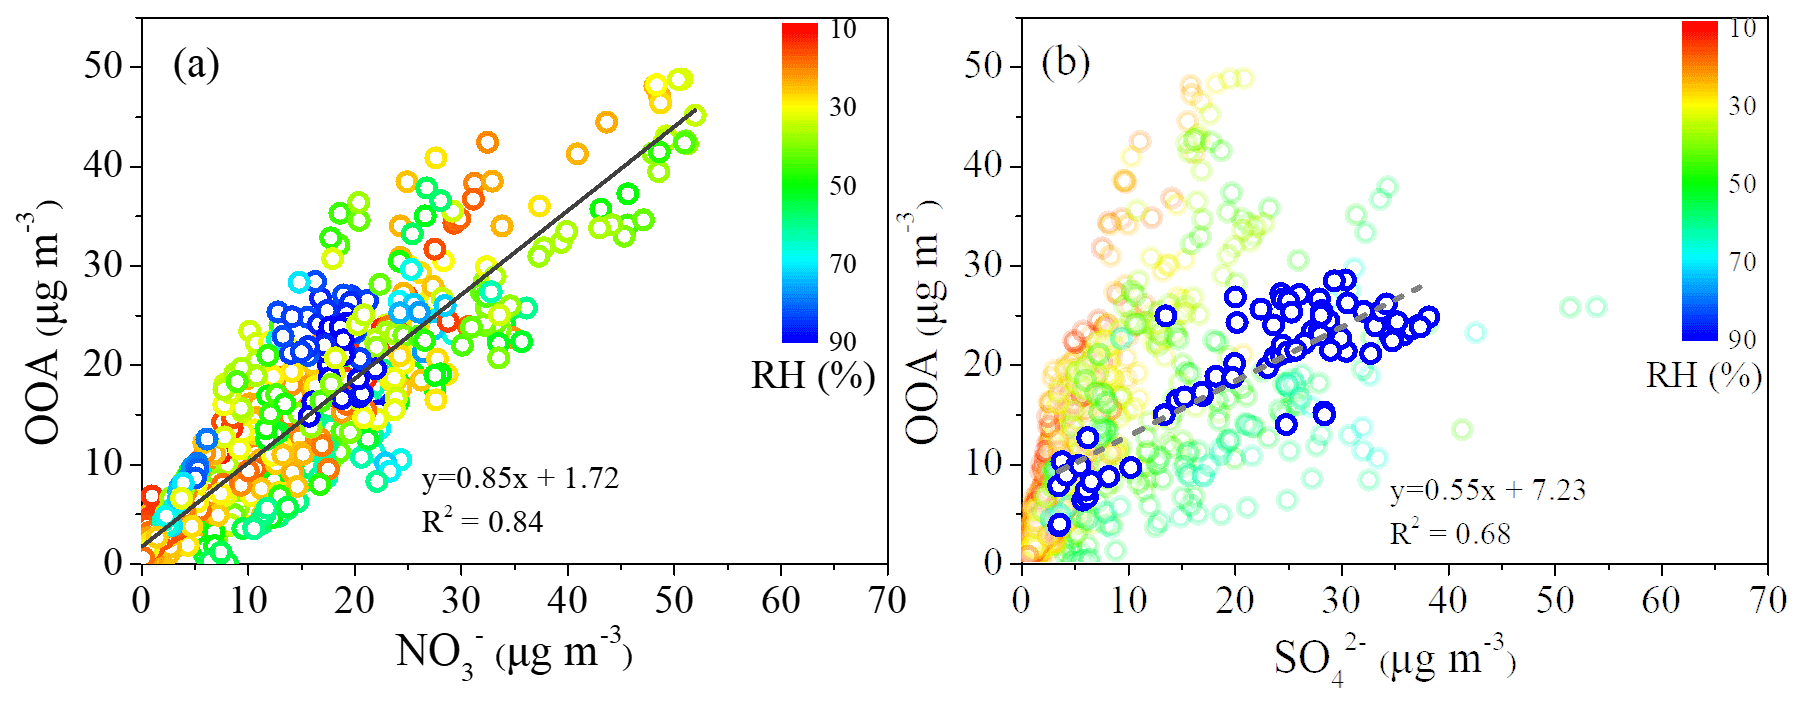
Figure 8Scatter plot between the mass concentration of OOA and (colored by RH) (a), and scatter plot between the mass concentration of OOA and (colored by RH) (b).
A strong correlation of the mass concentrations between OOA and was observed with R2 of 0.84 (Fig. 8a), possibly explained by the dominant contribution of photochemical production for both OOA and . Meanwhile, the Ox concentration during low-RH pollution days (59.8 ppb) was higher than that during high-RH pollution days (47.8 ppb) and clean days (39.2 ppb). With the higher Ox concentration (as a surrogate of oxidant level) under low-RH conditions, the daytime formation of OOA was more efficient and the growth rate was higher during low-RH pollution days than those during high-RH pollution days and clean days. When considering the RH effect (color coded in Fig. 8a), it is found that the data are scattered around the regression line with uniform slope when RH > 70 % but are concentrated in a small area above the regression line when RH < 70 %, suggesting that the OOA formation at RH < 70 % is probably promoted by aerosol water. This is further supported by the linear increase in OOA with increasing when RH > 70 %, while the relationship between OOA and was very scattered when RH < 70 % (Fig. 8b).
We conducted online measurements of PM1 in urban Beijing from 29 December 2014 to 27 February 2015. The average mass concentration of PM1 was 73.8 µg m−3, and OA was the most important component of PM1 (52 %), followed by nitrate (14 %) and sulfate (10 %). Source apportionment of OA resolved five factors including HOA, COA, BBOA, CCOA and OOA, in which CCOA (32 %) and OOA (32 %) were the most important sources to OA. The mass proportion of CCOA in OA showed a significant increase from clean period (25 %) to pollution periods (31 %–35 %), highlighting the important role of coal burning in haze formation in wintertime Beijing. The meteorological conditions (WD, WS and RH) have a significant impact on the chemical composition and evolution of PM1 species. Nitrate had a higher contribution during low-RH pollution days, implying the photochemical oxidation process of nitrate formation. In contrast, the mass fraction of sulfate to PM1 was much higher during high-RH pollution episodes compared to that during low-RH pollution episodes. The data also showed the exponential increase in sulfate oxidation ratio (SOR) with ALWC at high-RH conditions. Both are consistent with the impacts of aqueous-phase reactions on the formation of sulfate. As for the OOA formation, the strong correlation between OOA and may be explained by the dominant role of photochemical production on both species; aqueous-phase processes may add an additional contribution to OOA formation under high-RH condition, as indicated by the linear increase in OOA with increasing when RH >70 %. These results provide insights into the relative importance of photochemical oxidation and aqueous-phase processes for secondary aerosol formation during haze pollution, demonstrating the significance of meteorological conditions in the formation of secondary aerosol.
Raw data used in this study are archived at the Institute of Earth Environment, Chinese Academy of Sciences, and are available at the East Asian Paleoenvironmental Science Database, National Earth System Science Data Center, National Science & Technology Infrastructure of China (http://paleodata.ieecas.cn/index.aspx, last access: 21 July 2020).
The supplement related to this article is available online at: https://doi.org/10.5194/acp-20-9101-2020-supplement.
R-JH designed the study. Data analysis and interpretation were performed by YH, JD and R-JH. R-JH, JD and YH prepared the manuscript with contributions from all authors.
The authors declare that they have no conflict of interest.
This article is part of the special issue “Multiphase chemistry of secondary aerosol formation under severe haze”. It is not associated with a conference.
This work was supported by the National Natural Science Foundation of China (NSFC), the National Key Research and Development Program of China, the Chinese Academy of Sciences, the Cross Innovative Team fund from the State Key Laboratory of Loess and Quaternary Geology, and the Irish Environmental Protection Agency and Science Foundation Ireland project OM-MaREI.
This research has been supported by the National Natural Science Foundation of China (grant nos. 41925015, 91644219, 41877408 and 41675120), the National Key Research and Development Program of China (grant no. 2017YFC0212701), the Chinese Academy of Sciences (grant no. ZDBS-LY-DQC001), the Cross Innovative Team fund from the State Key Laboratory of Loess and Quaternary Geology (grant no. SKLLQGTD1801), and the Irish Environmental Protection Agency and Science Foundation Ireland (OM-MaREI).
This paper was edited by Hang Su and reviewed by three anonymous referees.
An, Z., Huang, R.-J., Zhang, R., Tie, X., Li, G., Cao, J., Zhou, W., Shi, Z., Han, Y., Gu, Z., and Ji, Y.: Severe haze in northern China: A synergy of anthropogenic emissions and atmospheric processes, P. Natl. Acad. Sci. USA, 116, 8657–8666, 2019.
Canagaratna, M. R., Jayne, J. T., Ghertner, D. A., Herndon, S., Shi, Q., Jimenez, J. L., Silva, P. J., Williams, P., Lanni, T., Drewnick, F., Demerjian, K. L., Kolb, C. E., and Worsnop, D. R.: Chase studies of particulate emissions from in-use New York City vehicles, Aerosol Sci. Tech., 38, 555–573, 2004.
Canagaratna, M. R., Jayne, J. T., Jimenez, J. L., Allan, J. D., Alfarra, M. R., Zhang, Q., Onasch, T. B., Drewnick, F., Coe, H., Middlebrook, A., Delia, A., Williams, L. R., Trimborn, A. M., Northway, M. J., DeCarlo, P. F., Kolb, C. E., Davidovits, P., and Worsnop, D. R.: Chemical and microphysical characterization of ambient aerosols with the Aerodyne aerosol mass spectrometer, Mass Spectrom. Rev., 26, 185–222, https://doi.org/10.1002/mas.20115, 2007.
Canonaco, F., Crippa, M., Slowik, J. G., Baltensperger, U., and Prévôt, A. S. H.: SoFi, an IGOR-based interface for the efficient use of the generalized multilinear engine (ME-2) for the source apportionment: ME-2 application to aerosol mass spectrometer data, Atmos. Meas. Tech., 6, 3649–3661, https://doi.org/10.5194/amt-6-3649-2013, 2013.
Cerully, K. M., Bougiatioti, A., Hite Jr., J. R., Guo, H., Xu, L., Ng, N. L., Weber, R., and Nenes, A.: On the link between hygroscopicity, volatility, and oxidation state of ambient and water-soluble aerosols in the southeastern United States, Atmos. Chem. Phys., 15, 8679–8694, https://doi.org/10.5194/acp-15-8679-2015, 2015.
Cheng, Y. F., Zheng, G. J., Wei, C., Mu, Q., Zheng, B., Wang, Z. B., Gao, M., Zhang, Q., He, K. B., Carmichael, G., Pöschl, U., and Su, H.: Reactive nitrogen chemistry in aerosol water as a source of sulfate during haze events in China, Sci. Adv., 2, e1601530, https://doi.org/10.1126/sciadv.1601530, 2016.
Crippa, M., DeCarlo, P. F., Slowik, J. G., Mohr, C., Heringa, M. F., Chirico, R., Poulain, L., Freutel, F., Sciare, J., Cozic, J., Di Marco, C. F., Elsasser, M., Nicolas, J. B., Marchand, N., Abidi, E., Wiedensohler, A., Drewnick, F., Schneider, J., Borrmann, S., Nemitz, E., Zimmermann, R., Jaffrezo, J.-L., Prévôt, A. S. H., and Baltensperger, U.: Wintertime aerosol chemical composition and source apportionment of the organic fraction in the metropolitan area of Paris, Atmos. Chem. Phys., 13, 961–981, https://doi.org/10.5194/acp-13-961-2013, 2013.
Crippa, M., Canonaco, F., Lanz, V. A., Äijälä, M., Allan, J. D., Carbone, S., Capes, G., Ceburnis, D., Dall'Osto, M., Day, D. A., DeCarlo, P. F., Ehn, M., Eriksson, A., Freney, E., Hildebrandt Ruiz, L., Hillamo, R., Jimenez, J. L., Junninen, H., Kiendler-Scharr, A., Kortelainen, A.-M., Kulmala, M., Laaksonen, A., Mensah, A. A., Mohr, C., Nemitz, E., O'Dowd, C., Ovadnevaite, J., Pandis, S. N., Petäjä, T., Poulain, L., Saarikoski, S., Sellegri, K., Swietlicki, E., Tiitta, P., Worsnop, D. R., Baltensperger, U., and Prévôt, A. S. H.: Organic aerosol components derived from 25 AMS data sets across Europe using a consistent ME-2 based source apportionment approach, Atmos. Chem. Phys., 14, 6159–6176, https://doi.org/10.5194/acp-14-6159-2014, 2014.
East Asian Paleoenvironmental Science Database, National Earth System Science Data Center, National Science & Technology Infrastructure of China, http://paleodata.ieecas.cn/index.aspx, last access: 21 July 2020.
Elser, M., Huang, R.-J., Wolf, R., Slowik, J. G., Wang, Q., Canonaco, F., Li, G., Bozzetti, C., Daellenbach, K. R., Huang, Y., Zhang, R., Li, Z., Cao, J., Baltensperger, U., El-Haddad, I., and Prévôt, A. S. H.: New insights into PM2.5 chemical composition and sources in two major cities in China during extreme haze events using aerosol mass spectrometry, Atmos. Chem. Phys., 16, 3207–3225, https://doi.org/10.5194/acp-16-3207-2016, 2016.
Fountoukis, C. and Nenes, A.: ISORROPIA II: a computationally efficient thermodynamic equilibrium model for K+–Ca2+–Mg2+–NH–Na+–SO–NO–Cl−–H2O aerosols, Atmos. Chem. Phys., 7, 4639–4659, https://doi.org/10.5194/acp-7-4639-2007, 2007.
Fröhlich, R., Crenn, V., Setyan, A., Belis, C. A., Canonaco, F., Favez, O., Riffault, V., Slowik, J. G., Aas, W., Aijälä, M., Alastuey, A., Artiñano, B., Bonnaire, N., Bozzetti, C., Bressi, M., Carbone, C., Coz, E., Croteau, P. L., Cubison, M. J., Esser-Gietl, J. K., Green, D. C., Gros, V., Heikkinen, L., Herrmann, H., Jayne, J. T., Lunder, C. R., Minguillón, M. C., Močnik, G., O'Dowd, C. D., Ovadnevaite, J., Petralia, E., Poulain, L., Priestman, M., Ripoll, A., Sarda-Estève, R., Wiedensohler, A., Baltensperger, U., Sciare, J., and Prévôt, A. S. H.: ACTRIS ACSM intercomparison – Part 2: Intercomparison of ME-2 organic source apportionment results from 15 individual, co-located aerosol mass spectrometers, Atmos. Meas. Tech., 8, 2555–2576, https://doi.org/10.5194/amt-8-2555-2015, 2015.
Gunthe, S. S., Rose, D., Su, H., Garland, R. M., Achtert, P., Nowak, A., Wiedensohler, A., Kuwata, M., Takegawa, N., Kondo, Y., Hu, M., Shao, M., Zhu, T., Andreae, M. O., and Pöschl, U.: Cloud condensation nuclei (CCN) from fresh and aged air pollution in the megacity region of Beijing, Atmos. Chem. Phys., 11, 11023–11039, https://doi.org/10.5194/acp-11-11023-2011, 2011.
Guo, H., Xu, L., Bougiatioti, A., Cerully, K. M., Capps, S. L., Hite Jr., J. R., Carlton, A. G., Lee, S.-H., Bergin, M. H., Ng, N. L., Nenes, A., and Weber, R. J.: Fine-particle water and pH in the southeastern United States, Atmos. Chem. Phys., 15, 5211–5228, https://doi.org/10.5194/acp-15-5211-2015, 2015.
Hennigan, C. J., Izumi, J., Sullivan, A. P., Weber, R. J., and Nenes, A.: A critical evaluation of proxy methods used to estimate the acidity of atmospheric particles, Atmos. Chem. Phys., 15, 2775–2790, https://doi.org/10.5194/acp-15-2775-2015, 2015.
Hallquist, M., Wenger, J. C., Baltensperger, U., Rudich, Y., Simpson, D., Claeys, M., Dommen, J., Donahue, N. M., George, C., Goldstein, A. H., Hamilton, J. F., Herrmann, H., Hoffmann, T., Iinuma, Y., Jang, M., Jenkin, M. E., Jimenez, J. L., Kiendler-Scharr, A., Maenhaut, W., McFiggans, G., Mentel, Th. F., Monod, A., Prévôt, A. S. H., Seinfeld, J. H., Surratt, J. D., Szmigielski, R., and Wildt, J.: The formation, properties and impact of secondary organic aerosol: current and emerging issues, Atmos. Chem. Phys., 9, 5155–5236, https://doi.org/10.5194/acp-9-5155-2009, 2009.
Hu, W., Hu, M., Hu, W., Jimenez, J. L., Yuan, B., Chen, W., Wang, M., Wu, Y., Chen, C., Wang, Z., Peng, J., Zeng, L., and Shao, M.: Chemical composition, sources, and aging process of submicron aerosols in Beijing: Contrast between summer and winter, J. Geophys. Res.-Atmos., 121, 1955–1977, https://doi.org/10.1002/2015JD024020, 2016.
Huang, R. J., Zhang, Y. L., Bozzetti, C., Ho, K. F., Cao, J. J., Han, Y. M., Daellenbach, K. R., Slowik, J. G., Platt, S. M., Canonaco, F., Zotter, P., Wolf, R., Pieber, S. M., Bruns, E. A., Crippa, M., Ciarelli, G., Piazzalunga, A., Schwikowski, M., Abbaszade, G., Schnelle-Kreis, J., Zimmermann, R., An, Z., Szidat, S., Baltensperger, U., Haddad, I. E., and Prevot, A. S. H.: High secondary aerosol contribution to particulate pollution during haze events in China, Nature, 514, 218–222, 2014.
Huang, R.-J., Wang, Y., Cao, J., Lin, C., Duan, J., Chen, Q., Li, Y., Gu, Y., Yan, J., Xu, W., Fröhlich, R., Canonaco, F., Bozzetti, C., Ovadnevaite, J., Ceburnis, D., Canagaratna, M. R., Jayne, J., Worsnop, D. R., El-Haddad, I., Prévôt, A. S. H., and O'Dowd, C. D.: Primary emissions versus secondary formation of fine particulate matter in the most polluted city (Shijiazhuang) in North China, Atmos. Chem. Phys., 19, 2283–2298, https://doi.org/10.5194/acp-19-2283-2019, 2019.
Lanz, V. A., Alfarra, M. R., Baltensperger, U., Buchmann, B., Hueglin, C., and Prévôt, A. S. H.: Source apportionment of submicron organic aerosols at an urban site by factor analytical modelling of aerosol mass spectra, Atmos. Chem. Phys., 7, 1503–1522, https://doi.org/10.5194/acp-7-1503-2007, 2007.
Li, H., Zhang, Q., Zhang, Q., Chen, C., Wang, L., Wei, Z., Zhou, S., Parworth, C., Zheng, B., Canonaco, F., Prévôt, A. S. H., Chen, P., Zhang, H., Wallington, T. J., and He, K.: Wintertime aerosol chemistry and haze evolution in an extremely polluted city of the North China Plain: significant contribution from coal and biomass combustion, Atmos. Chem. Phys., 17, 4751–4768, https://doi.org/10.5194/acp-17-4751-2017, 2017.
Lu, K., Fuchs, H., Hofzumahaus, A., Tan, Z., Wang, H., Zhang, L., Schmitt, S. H., Rohrer, F., Bohn, B., Broch, S., Dong, H., Gkatzelis, G. I., Hohaus, T., Holland, F., Li, X., Liu, Y., Ma, X., Novelli, A., Schlag, P., Shao, M., Wu, Y., Wu, Z., Zeng, L., Hu, M., Kiendler-Scharr, A., Wahner, A., and Zhang, Y.: Fast Photochemistry in Wintertime Haze: Consequences for Pollution Mitigation Strategies, Environ. Sci. Technol, 53, 10676–10684, 2019.
Middlebrook, A. M., Bahreini, R., Jimenez, J. L., and Canagaratna, M. R.: Evaluation of composition-dependent collection efficiencies for the Aerodyne aerosol mass spectrometer using field data, Aerosol Sci. Tech., 46, 258–271, https://doi.org/10.1080/02786826.2011.620041, 2012.
Ng, N. L., Herndon, S. C., Trimborn, A., Canagaratna, M. R., Croteau, P. L., Onasch, T. B., Sueoer, D., Worsnop, D. R., Zhang, Q., Sun, Y. L., and Jayne, J. T.: An Aerosol Chemical Speciation Monitor (ACSM) for routine monitoring of the composition and mass concentrations of ambient aerosol, Aerosol Sci. Technol., 45, 770–784, https://doi.org/10.1080/02786826.2011.560211, 2011a.
Ng, N. L., Canagaratna, M. R., Jimenez, J. L., Zhang, Q., Ulbrich, M., and Worsnop, D. R.: Real-time methods for estimating organic component mass concentrations from aerosol mass spectrometer data, Environ. Sci. Technol., 45, 910–916, https://doi.org/10.1021/es102951k, 2011b.
Paatero, P. and Tapper, U.: Positive matrix factorization: A non-negative factor model with optimal utilization of error estimates of data values, Environmetrics, 5, 111–126, 1994.
Shao, J., Chen, Q., Wang, Y., Lu, X., He, P., Sun, Y., Shah, V., Martin, R. V., Philip, S., Song, S., Zhao, Y., Xie, Z., Zhang, L., and Alexander, B.: Heterogeneous sulfate aerosol formation mechanisms during wintertime Chinese haze events: air quality model assessment using observations of sulfate oxygen isotopes in Beijing, Atmos. Chem. Phys., 19, 6107–6123, https://doi.org/10.5194/acp-19-6107-2019, 2019.
Shrivastava, M., Cappa, C. D., Fan, J., Goldstein, A. H., Guenther, A., Jimenez, J., Kuang, C., Laskin, A., Martin, S. T., Ng, N. L., Petaja, T., Pierce, J. R., Rasch, P. J., Roldin, P., Seinfeld, J. H., Shilling, J. E., Smith, J. N., Thornton, J. A., Volkamer, R., Wang, J., Worsnop, D. R., Zaveri, R. A., Zelenyuk, A., and Zhang, Q.: Recent advances in understanding secondary organic aerosol: Implications for global climate forcing, Rev. Geophys., 55, 509–559, 2017.
Song, S., Nenes, A., Gao, M., Zhang, Y., Liu, P., Shao, J., Ye, D., Xu, W., Lei, L., Sun, Y., Liu, B., Wang, S., and McElroy, M.: Thermodynamic modeling suggests declines in water uptake and acidity of inorganic aerosols in Beijing winter haze events during 2014/2015–2018/2019, Environ. Sci. Tech. Let., 6, 752–760, 2019.
Sun, C., Lee, B. P., Huang, D., Jie Li, Y., Schurman, M. I., Louie, P. K. K., Luk, C., and Chan, C. K.: Continuous measurements at the urban roadside in an Asian megacity by Aerosol Chemical Speciation Monitor (ACSM): particulate matter characteristics during fall and winter seasons in Hong Kong, Atmos. Chem. Phys., 16, 1713–1728, https://doi.org/10.5194/acp-16-1713-2016, 2016.
Sun, Y., Jiang, Q., Wang, Z., Fu, P., Li, J., Yang, T., and Yin, Y.: Investigation of the sources and evolution processes of severe haze pollution in Beijing in January 2013, J. Geophys. Res.-Atmos., 119, 4380–4398, https://doi.org/10.1002/2014JD021641, 2014.
Sun, Y., Du, W., Fu, P., Wang, Q., Li, J., Ge, X., Zhang, Q., Zhu, C., Ren, L., Xu, W., Zhao, J., Han, T., Worsnop, D. R., and Wang, Z.: Primary and secondary aerosols in Beijing in winter: sources, variations and processes, Atmos. Chem. Phys., 16, 8309–8329, https://doi.org/10.5194/acp-16-8309-2016, 2016.
Sun, Y.-L., Zhang, Q., Schwab, J. J., Demerjian, K. L., Chen, W.-N., Bae, M.-S., Hung, H.-M., Hogrefe, O., Frank, B., Rattigan, O. V., and Lin, Y.-C.: Characterization of the sources and processes of organic and inorganic aerosols in New York city with a high-resolution time-of-flight aerosol mass apectrometer, Atmos. Chem. Phys., 11, 1581–1602, https://doi.org/10.5194/acp-11-1581-2011, 2011.
Sun, Y. L., Wang, Z., Dong, H., Yang, T., Li, J., Pan, X., Chen, P., and Jayne, J. T.: Characterization of summer organic and inorganic aerosols in Beijing, China with an Aerosol Chemical Speciation Monitor, Atmos. Environ., 51, 250–259, https://doi.org/10.1016/j.atmosenv.2012.01.013, 2012.
Sun, Y. L., Wang, Z. F., Fu, P. Q., Yang, T., Jiang, Q., Dong, H. B., Li, J., and Jia, J. J.: Aerosol composition, sources and processes during wintertime in Beijing, China, Atmos. Chem. Phys., 13, 4577–4592, https://doi.org/10.5194/acp-13-4577-2013, 2013a.
Sun, Y. L., Wang, Z. F., Fu, P. Q., Jiang, Q., Yang, T., Li, J., and Ge, X. L.: The impact of relative humidity on aerosol composition and evolution processes during wintertime in Beijing, China, Atmos. Environ., 77, 927–934, 2013b.
Ulbrich, I. M., Canagaratna, M. R., Zhang, Q., Worsnop, D. R., and Jimenez, J. L.: Interpretation of organic components from Positive Matrix Factorization of aerosol mass spectrometric data, Atmos. Chem. Phys., 9, 2891–2918, https://doi.org/10.5194/acp-9-2891-2009, 2009.
Wang, Q., Sun, Y., Jiang, Q., Du, W., Sun, C., Fu, P., and Wang, Z.: Chemical composition of aerosol particles and light extinction apportionment before and during the heating season in Beijing, China, J. Geophys. Res.-Atmos., 120, 12708–12722, 2015.
Wang, Y. C., Huang, R. J., Ni, H. Y., Chen, Y., Wang, Q. Y., Li, G. H., Tie, X. X., Shen, Z. X., Huang, Y., Liu, S. X., Dong, W. M., Xue, P., Fröhlich, R., Canonaco, F., Elser, M., Daellenbach, K.R., Bozzetti, C., Haddad, EI., and Cao, J. J.: Chemical composition, sources and secondary processes of aerosols in Baoji city of northwest China, Atmos. Environ., 158, 128–137, https://doi.org/10.1016/j.atmosenv.2017.03.026, 2017.
Wu, Y. Z., Ge, X. L., Wang, J. F., Shen, Y. F., Ye, Z. L., Ge, S., Wu, Y., Yu, H., and Chen, M. D.: Responses of secondary aerosols to relative humidity and photochemical activities in an industrialized environment during late winter, Atmos. Environ., 193, 66–78, 2018.
Xu, W. Q., Han, T. T., Du, W., Wang, Q. Q., Chen, C., Zhao, J., Zhang, Y. J., Li, J., Fu, P. Q., Wang, Z. F., Worsnop, D. R., and Sun, Y. L.: Effects of Aqueous-Phase and Photochemical Processing on Secondary Organic Aerosol Formation and Evolution in Beijing, China, Environ. Sci. Technol., 51, 762–770, https://doi.org/10.1021/acs.est.6b04498, 2017.
Xu, W. Q., Sun, Y. L., Wang, Q. Q., Zhao, J., Wang, J. F., Ge, X. L., Xie, C. H., Zhou, W., Du, W., Li, J., Fu, P. Q., Wang, Z. F., Worsnop, D. R., and Coe, H.: Changes in aerosol chemistry from 2014 to 2016 in winter in Beijing: insights from high resolution aerosol mass spectrometry, J. Geophys. Res.-Atmos., 124, 1132–1147, 2018.
Zhang, Y. J., Tang, L. L., Sun, Y. L., Favez, O., Canonaco, F., Albinet, A., Couvidat, F., Liu, D. T., Jayne, J. T., Wang, Z., Croteau, P. L., Canagaratna, M. R., Zhou, H. C., Prevot, A. S. H., and Worsnop, D. R.: Limited formation of isoprene epoxydiols-derived secondary organic aerosol under NOx-rich environments in Eastern China, Geophys. Res. Lett., 44, 2035–2043, https://doi.org/10.1002/2016GL072368, 2017.