the Creative Commons Attribution 4.0 License.
the Creative Commons Attribution 4.0 License.
 | 29 Jul 2020
Large difference in aerosol radiative effects from BVOC-SOA treatment in three Earth system models
Sara M. Blichner
Roland Schrödner
Inger H. H. Karset
Terje K. Berntsen
Twan van Noije
Tommi Bergman
Declan O'Donnell
Risto Makkonen
Biogenic volatile organic compounds (BVOCs) emitted from vegetation are oxidised in the atmosphere and can form aerosol particles either by contributing to new particle formation or by condensing onto existing aerosol particles. As the understanding of the importance of BVOCs for aerosol formation has increased over the years, these processes have made their way into Earth system models (ESMs). In this study, sensitivity experiments are run with three different ESMs (the Norwegian Earth System Model (NorESM), EC-Earth and ECHAM) to investigate how the direct and indirect aerosol radiative effects are affected by changes in the formation of secondary organic aerosol (SOA) from BVOCs. In the first two sensitivity model experiments, the yields of SOA precursors from oxidation of BVOCs are changed by ±50 %. For the third sensitivity test, the formed oxidation products do not participate in the formation of new particles but are only allowed to condense onto existing aerosols. In the last two sensitivity experiments, the emissions of BVOC compounds (isoprene and monoterpenes) are turned off, one at a time. The goal of the study is to investigate whether it is of importance to treat SOA formation processes correctly in the models rather than to evaluate the correctness of the current treatment in the models.
The results show that the impact on the direct radiative effect (DRE) is linked to the changes in the SOA production in the models, where more SOA leads to a stronger DRE and vice versa. However, the magnitude by which the DRE changes (maximally 0.15 W m−2 globally averaged) in response to the SOA changes varies between the models, with EC-Earth displaying the largest changes. The results for the cloud radiative effects (CREs) are more complicated than for the DRE. The changes in CRE differ more among the ESMs, and for some sensitivity experiments they even have different signs. The most sensitive models are NorESM and EC-Earth, which have CRE changes of up to 0.82 W m−2. The varying responses in the different models are connected to where in the aerosol size distributions the changes in mass and number due to SOA formation occur, in combination with the aerosol number concentration levels in the models. We also find that interactive gas-phase chemistry as well as the new particle formation parameterisation has important implications for the DRE and CRE in some of the sensitivity experiments. The results from this study indicate that BVOC-SOA treatment in ESMs can have a substantial impact on the modelled climate but that the sensitivity varies greatly between the models. Since BVOC emissions have changed historically and will continue to change in the future, the spread in model results found in this study implies uncertainty into ESM estimates of aerosol forcing from land-use change and BVOC feedback strengths.
- Article
(7003 KB) - Full-text XML
-
Supplement
(31209 KB) - BibTeX
- EndNote


The climatic relevance of biogenic volatile organic compounds (BVOCs) emitted from vegetation has received increasing attention over the past years. Emitted BVOCs are oxidised in the atmosphere producing a number of different products with lower volatility. These can then form secondary organic aerosols (SOAs), increasing both aerosol number concentration (through new particle formation (NPF) and participation in early growth) and aerosol sizes (through condensation onto pre-existing particles) (Shrivastava et al., 2017). The formation of SOA from BVOCs can thus influence climate both through changes in cloud properties (indirect aerosol effects) (Twomey, 1974; Albrecht, 1989) and through changes in scattering and absorption of solar radiation by aerosols (direct aerosol effect) (Charlson et al., 1990).
BVOC emissions depend on various environmental factors, in particular temperature, radiation, CO2 concentrations and land use, and are thus expected to have changed in the past and to continue to change in the future (e.g. Bonan, 2016; Hantson et al., 2017). Studies have found that future BVOC emissions are likely to increase due to warming and higher CO2 concentrations and that BVOCs could dampen temperature increase and provide a negative climate feedback (Sporre et al., 2019; Paasonen et al., 2013; Kulmala et al., 2014; Scott et al., 2018; Carslaw et al., 2010). There are, however, a range of uncertainties associated with these feedbacks, including the strength of CO2 inhibition on BVOC emissions (Arneth et al., 2007). Nevertheless, it is important to include these processes in Earth system models (ESMs) to estimate aerosol effects in the future but also in the past. SOA formation has been added to many models over recent years in response to the increased understanding of the importance of BVOCs to aerosol formation. However, uncertainties regarding these processes in models are large; e.g. Tsigaridis et al. (2014) show an order of magnitude variation between the 31 models in the vertical profile of organic aerosol mass in their intercomparison.
Organics constitute a large fraction of the atmospheric aerosol mass (Shrivastava et al., 2017; Zhang et al., 2007), and as much as 50 %–85 % of this can be SOA (Zhang et al., 2007; Glasius and Goldstein, 2016). In model estimates, biogenic SOA usually dominates the SOA budget (Glasius and Goldstein, 2016; Hallquist et al., 2009; Kelly et al., 2018). As an exception, Shrivastava et al. (2015) find biomass burning to be the largest source and biogenics to be the second largest. However, there are large seasonal and regional differences in sources, with biogenic SOA dominating in summer, while sources like wood burning can be more dominant in winter, particularly in populated regions (Glasius et al., 2018). Moreover, some studies have found that the biogenic SOA formation is anthropogenically controlled (Spracklen et al., 2011; Kanakidou et al., 2000; Carlton et al., 2010).
The SOA formation and processing pathways in the atmosphere are remarkably complex. To represent these in ESMs, a trade-off must be made between detail and computational cost (Tsigaridis et al., 2014). In reality, BVOCs consist of a myriad of compounds with different properties. However, in ESMs these are often reduced to be represented by 2–3 tracers, usually isoprene, monoterpenes (MTs) and sesquiterpenes, which constitute the main contributors to aerosol formation and are estimated to constitute around 50 %, 15 % and 3 %, respectively, of the total BVOC emissions (Guenther et al., 2012). The oxidation products of BVOCs, while in reality there is a large variety of compounds produced through a series of reactions (Glasius and Goldstein, 2016; Shrivastava et al., 2017), are lumped into a few tracers which can condense onto existing aerosols or contribute to NPF and early growth (Tsigaridis et al., 2014). Not all oxidation products have low enough volatility to be relevant for aerosol formation. Therefore, the percentage of low volatility products formed during the oxidation is described by yields for each oxidation reaction (e.g. Tsigaridis et al., 2014; Jokinen et al., 2015; Makkonen et al., 2014). Some models also use volatility basis sets or similar approaches to account for changes in volatility during the oxidation (Donahue et al., 2006, 2011; Yu, 2011).
All three models included in this study use two tracers representing the oxidation products from the BVOCs. One tracer represents the highly oxidised BVOCs which can take part in NPF and the early growth of the newly formed particles. This tracer will be denoted ELVOCs (extremely low volatility organic compounds) here. The other tracer represents the oxidation products with somewhat higher volatility that can condense onto larger aerosols, and this will be denoted by L/SVOCs (low volatility and semi-volatile organic compounds). However, the VOCs are not actually volatile in these models since the parameterisations only allow irreversible condensation of the organics.
As already mentioned, evidence suggests that low-volatility organics contribute at the earliest stages of NPF (Tröstl et al., 2016; Riccobono et al., 2014; Ehn et al., 2014; Kirkby et al., 2016; Riipinen et al., 2011, 2012; R. Zhang et al., 2012), and this is increasingly considered in global models. The formation or nucleation rate of new particles is typically parameterised with one parameterisation of binary nucleation of sulfuric acid (H2SO4) and water (H2O) vapours for the entire atmosphere. However, since these nucleation parameterisations underestimate NPF in the boundary layer (BL) (Spracklen et al., 2006), an additional parameterisation involving sulfuric acid and organics that better captures the NPF in the BL is often added to the ESMs. These parameterisations are not always limited to the BL, but in this article we will refer to them as BL nucleation since they were introduced into the models to address the underestimation of NPF there.
There are large uncertainties in several of the processes representing SOA formation in ESMs. BVOC emissions are poorly constrained both locally and globally (Heald and Spracklen, 2015) and future changes in emissions are highly uncertain, both because of scenario uncertainty and because vegetation response is uncertain (Hantson et al., 2017). In addition, the formation of low-volatility oxidation products depends on a number of variables, including oxidation capacity, NOx concentrations (Shrivastava et al., 2017), specific BVOC species, etc., which results in large uncertainties in the yields (Jokinen et al., 2015). The representation of SOA in global models is currently under rapid development (Tsigaridis et al., 2014; Makkonen et al., 2014, 2012; Gordon et al., 2016, 2017; Dunne et al., 2016). It is important to understand the dynamics introduced by these parameterisations and how they interact with the other parts of the models – in particular those related to the direct and indirect aerosol effects, which have strong impacts on climate.
In this study we investigate the impact of choices in emissions of SOA precursors and yields of BVOC oxidation products on the climatic effects of SOA through a series of sensitivity experiments with three ESMs. The models have comparable treatments of SOA formation but have different aerosol schemes and different treatment of gas-phase chemistry. The comparison of the simulations for the different models and experiments thus gives us the possibility to investigate the sensitivities to common parameters. We investigate how the direct and indirect aerosol effects are impacted by the changes in yields and emissions, and from this we gain insight into how significant these parameters are for the radiative effects in the models. The goal is to better understand the processes controlling sensitivities in common setups of SOA parameterisations in ESMs currently. We do not conclude on whether these processes are treated correctly but rather if it is important that they are.
2.1 Experimental setup
A set of sensitivity experiments was designed to investigate how changes to BVOC and SOA representations in the models affect clouds and radiation balance. Care was taken to design experiments that could be run with all three models. The five sensitivity experiments are listed.
-
Yield higher. The EL/L/SVOC yields for the BVOC oxidation reactions (Table 2) are increased by 50 %.
-
Yield lower. The EL/L/SVOC yields for the BVOC oxidation reactions are decreased by 50 %.
-
No ELVOCs. The formation of ELVOCs is removed from the models. The total BVOC oxidation yields are kept constant, but all BVOC oxidation reactions produce L/SVOCs.
-
No isoprene. The isoprene emissions in the models are turned off.
-
No MTs. The MT emissions in the model are turned off.
For comparison purposes, a control simulation (CTRL) was run with the models. The Yield higher and Yield lower simulations directly increase or decrease the produced SOA mass, while the changes are more complex for the other three experiments. The No ELVOCs scenario strongly decreases the NPF in the BL and increases the mass of L/SVOCs, which can only condense onto existing particles. With the No isoprene and No MTs cases, the importance of the two classes of BVOCs for modelled SOA mass and particle size distributions is investigated. Whereas isoprene is, on a global scale, emitted in larger amounts compared to MTs, its oxidation reactions have smaller yields for SOA precursors than MTs. In addition, the modelled isoprene oxidation produces a very small quantity of ELVOCs (EC-Earth, ECHAM) or no (NorESM) ELVOCs. Therefore, with these two experiments both the amount of modelled SOA and the fraction of oxidation products participating in NPF are changed.
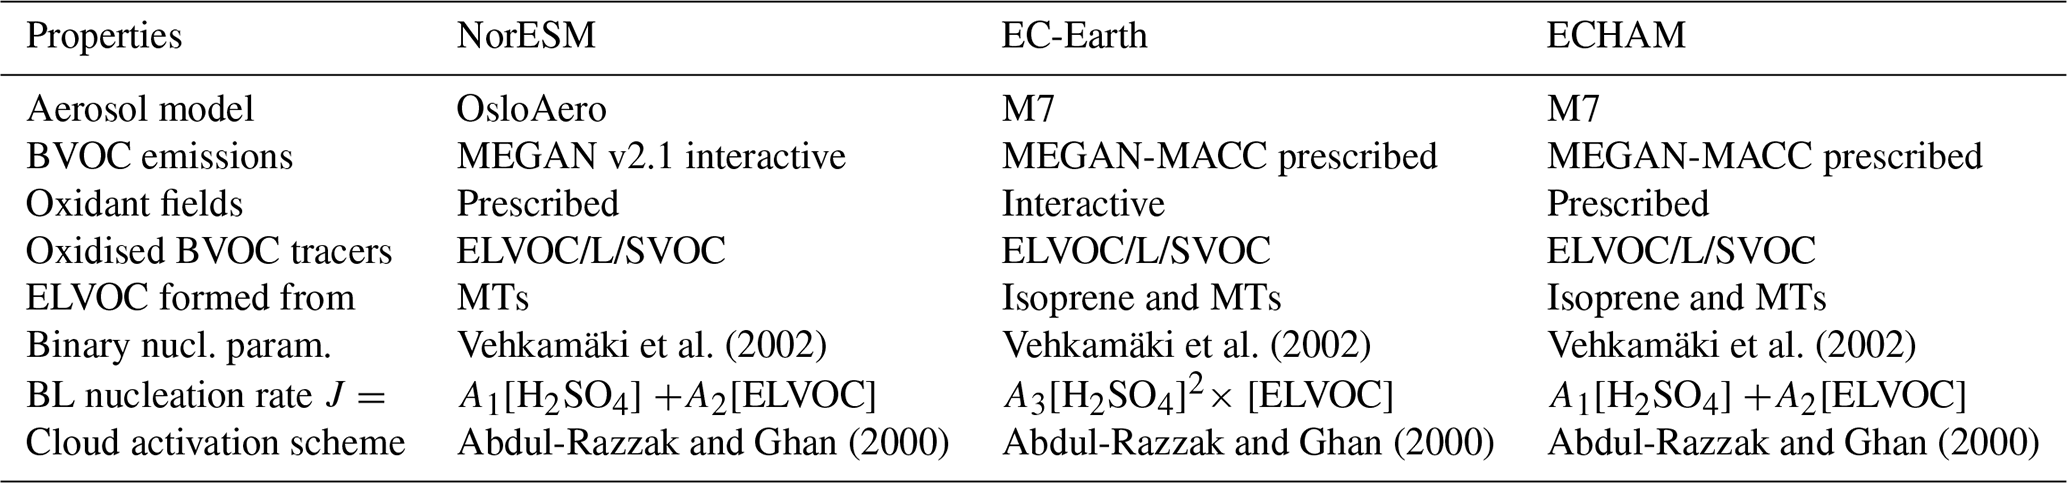
Vehkamäki et al. (2002)Vehkamäki et al. (2002)Vehkamäki et al. (2002)Abdul-Razzak and Ghan (2000)Abdul-Razzak and Ghan (2000)Abdul-Razzak and Ghan (2000)Table 1This table lists similarities and dissimilarities between the three ESMs of particular relevance for this study.
s−1, s−1, cm−6 s−1.
In order to have similar meteorological conditions in the three models, all simulations were nudged (Kooperman et al., 2012) to ERA-Interim (Dee et al., 2011) data for the years 2000–2005. Although this method may not capture all changes in the cloud radiative effect (CRE) since dynamical feedbacks are limited by the constrained meteorology (Lohmann and Hoose, 2009; Lin et al., 2016), previous studies with CAM5.3-Oslo found the effective radiative forcing from aerosol–cloud interactions (ERFaci) and ERFaci changes carried out with nudged configurations to be in the uncertainty range of that carried out with a free-running version of the model (Kirkevåg et al., 2018; Karset et al., 2018). The first year of the simulations has been discarded as spin-up and the last 5 years have been used for the analysis.
The radiative effects from aerosols and clouds in this study are calculated using the methods described by Ghan (2013). The direct radiative effect (DRE) is calculated by taking the difference between the top-of-atmosphere radiative flux and the radiative flux excluding scattering and absorption by aerosols (Fclean). The CRE is similarly calculated as the difference between Fclean and the radiation flux without the scattering and absorption by the clouds or aerosols (Fclean, clear).
2.2 Model similarities and dissimilarities
A more detailed description of each of the models will follow after this section. However, here we would like to highlight some of the key similarities and dissimilarities between the models (summarised in Table 1). The ESM model components are different between the three ESMs. The Norwegian Earth System Model (NorESM) and ECHAM have an atmospheric model which contains an aerosol module, while EC-Earth consists of a chemistry transport model coupled to an atmospheric general circulation model. Therefore, EC-Earth has a more advanced treatment of gas-phase chemistry, including interactive oxidant fields, while the other two models have prescribed oxidant fields. The aerosol modules also differ between the models. NorESM has OsloAero (Kirkevåg et al., 2018), while EC-Earth and ECHAM both use M7 (Vignati et al., 2004) but different versions. As described in the Introduction section, the treatment of the oxidation products is similar between the models where all three models have one ELVOCs and one L/SVOC tracer. However, the BVOC oxidation differs between the models in terms of yield, number of oxidation reactions from BVOC to ELVOCs/L/SVOCs and which reactions produce which oxidation products, as can be seen in Table 2. Moreover, all three ESMs use the Model of Emissions of Gases and Aerosols from Nature (MEGAN) version 2.1 (Guenther et al., 2012). However, in NorESM, MEGAN is run interactively, while the other two models use emissions produced in offline simulations with MEGAN.
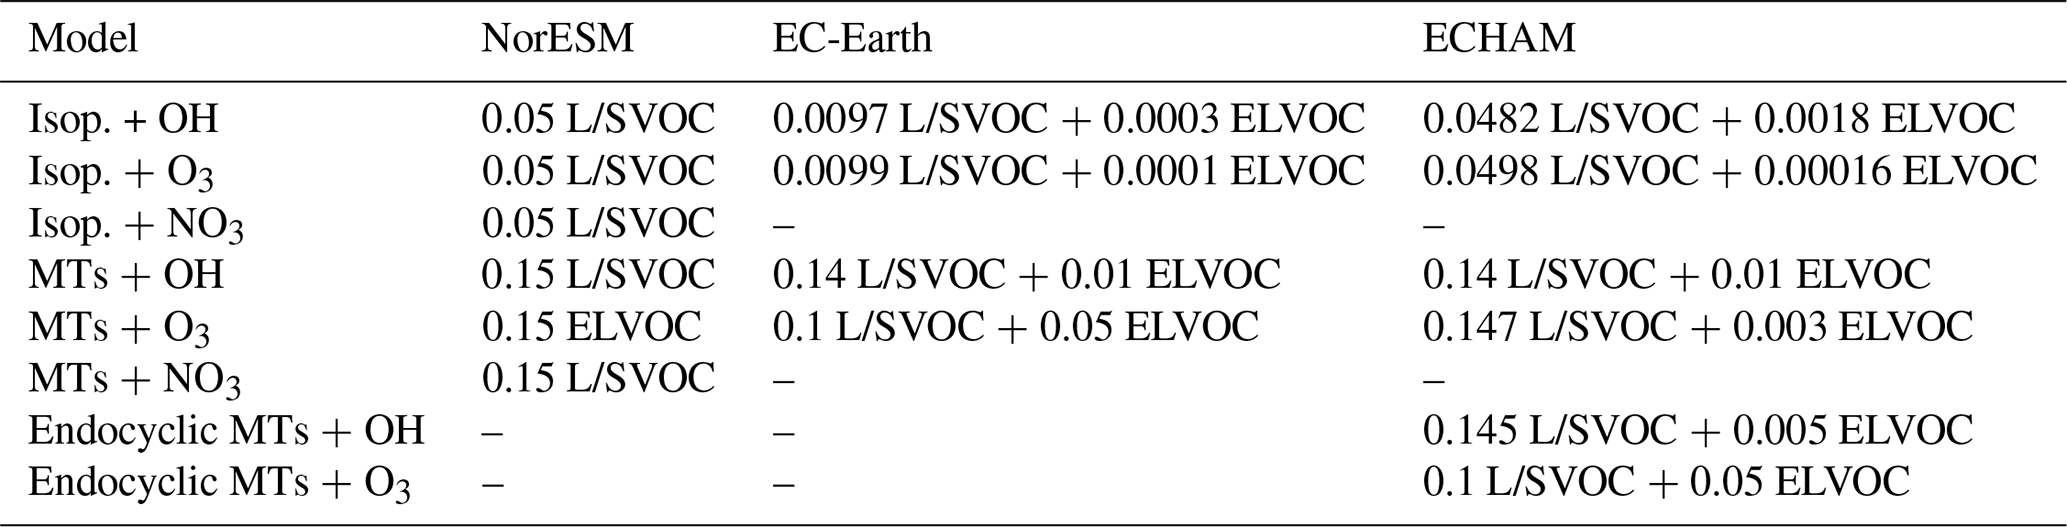
Table 2Yields and resulting products from the reactions of BVOCs with oxidants to form ELVOC and L/SVOC for the three ESMs. In ECHAM, there are different yields for endocyclic MTs and the other MTs. The equations for the endocyclic MTs are written separately, and the other MTs are shown on the same rows as the MTs in the other models.
2.3 NorESM
NorESM (Bentsen et al., 2013; Kirkevåg et al., 2013; Iversen et al., 2013) is an ESM based on the Community Earth System Model (CESM) (Neale et al., 2012). The aerosol scheme in the Atmospheric Community Model (CAM) version 5.3 has been replaced by the aerosol scheme OsloAero (Kirkevåg et al., 2018). In this investigation, CAM5.3-Oslo (CAM with OsloAero) is coupled to the Community Land Model (CLM) version 4.5 (Oleson et al., 2013) run with satellite phenology (SP) vegetation. NorESM is run with prescribed sea surface temperature (SST) and sea ice concentrations at ∘ resolution. The horizontal winds and surface pressure are nudged to ERA-Interim data with a relaxation time of 6 h.
OsloAero is described as a production-tagged aerosol model, which consists of 12 log-normal-shaped background modes. The shape and size of these modes can be modified by coagulation and condensation. The modes are made up of background tracers which determine the number concentration and process tracers which change the shape of aerosol size distributions. The mass of the tracers is tracked, and the size distributions and optical properties are calculated using a look-up table approach (Kirkevåg et al., 2018).
NPF was recently added to OsloAero (Makkonen et al., 2014) and is now included as two background tracers: one for sulfate (SO4) and one for SOA, forming one mode (Kirkevåg et al., 2018). Two types of NPF are included in OsloAero: (1) binary homogeneous sulfuric-acid–water nucleation according to Vehkamäki et al. (2002) and (2) an activation-type nucleation, in the BL, with a nucleation rate calculated from Eq. (18) in Paasonen et al. (2010). This nucleation rate is calculated from the concentrations of H2SO4 and ELVOCs available for nucleation. The nucleation rates are calculated for particles with a diameter of 2 nm, but the diameter of the nucleation tracers in OsloAero is 23.6 nm. The survival of these newly formed particles from nucleation to 23.6 nm diameter is parameterised dependent on coagulation sink and condensation growth rate in accordance with Lehtinen et al. (2007). In this study, contrary to Kirkevåg et al. (2018), we include all pre-existing particles in the calculation of coagulation sink. This modification was introduced into the model in order to have a more realistic survival rate of the particles between 2 and 23.5 nm.
The BVOC emissions used in the simulations are calculated interactively by MEGAN version 2.1 (Guenther et al., 2012), which is included in CLM. MEGAN thus uses the vegetation from CLM. The BVOC emissions depend on factors such as temperature, radiation, leaf area index and soil moisture. The model is run with a 30 min time step, and the coupling between CLM and CAM-Oslo is done at every time step, providing an interactive diurnal variation in the emissions. The BVOC emissions include isoprene and seven compounds which are lumped together as MTs in CAM-Oslo.
In CAM-Oslo, the emitted BVOCs are transformed into SOA through chemical reactions with ozone, hydroxyl (OH) and nitrate radical (NO3). When MTs reacts with O3, ELVOCs are formed, while the other five reactions yield only L/SVOCs. The reactions and their yields are given in Table 2. Fifty percent of the formed ELVOCs are available for nucleation, and the rest of the ELVOCs and the L/SVOCs condense onto pre-existing aerosol particles (Makkonen et al., 2014). The molar mass of both the ELVOCs and L/SVOCs is 168 g mol−1. The oxidants are prescribed monthly fields originating from a run with the full chemistry model CAM-chem (Lamarque et al., 2012).
CAM5.3-Oslo uses the cloud bulk microphysics scheme MG1.5 (Morrison and Gettelman, 2008; Gettelman and Morrison, 2015) with aerosol activation by Abdul-Razzak and Ghan (2000) for the stratiform clouds. Mass and number of cloud water and ice are treated prognostically, while the precipitation is diagnostic. The model also includes a shallow convection scheme (Park and Bretherton, 2009) and a deep convection scheme (Zhang and McFarlane, 1995).
2.4 EC-Earth
The Earth system model EC-Earth (Hazeleger et al., 2012; van Noije et al., 2014) includes an atmospheric general circulation model (GCM) based on cycle 36r4 of the Integrated Forecasting System (IFS) of the European Centre for Medium-Range Weather Forecasts (ECMWF). This is coupled to the atmospheric chemistry and transport model TM5 (Tracer Model 5; van Noije et al., 2014; Williams et al., 2017). For the present study, the EC-Earth release v3.2.3 in atmosphere-only mode (i.e. IFS + TM5) was used. TM5 treats the emission, transport, microphysical and chemical conversions, as well as deposition of atmospheric gases and aerosols. The latter are described with the size-resolved modal microphysics scheme M7 (Vignati et al., 2004). It uses seven log-normal size distributions (modes) of which four are soluble (nucleation, Aitken, accumulation, coarse) and three insoluble (Aitken, accumulation, coarse). The nucleation, Aitken, accumulation and coarse modes represent particles with dry diameters smaller than 10 nm, 10–100 nm and 100 nm–1 µm and larger than 1 µm, respectively. The considered aerosol species are sulfate, black carbon, organic matter (primary and secondary), mineral dust and sea salt. M7 tracks the number concentration in each mode and the mass of each species in each mode. The mode shape is constant, whereas median diameter, number of particles of each mode and their chemical composition can evolve freely. After growth by condensation and coagulation, the largest particles of each mode are shifted to the next larger mode. Particles in the insoluble modes that reach sufficient soluble coating are shifted to the respective soluble modes.
In addition, TM5 simulates the total particulate mass of nitrate, ammonium and methane sulfonic acid. When calculating optical properties, these components as well as the associated water uptake are assumed to be in the soluble accumulation mode. The gas-phase chemistry is described by a modified version of the Carbon Bond 05 (CB05) mechanism (Williams et al., 2017) using the photolysis scheme from Williams et al. (2012). SOA is produced from MTs and isoprene with the yields as presented in Table 2. Assumed molar masses for the two SOA species, ELVOCs and L/SVOCs, are 248 and 232 g mol−1, respectively. Produced ELVOCs condense to soluble nucleation, Aitken, accumulation and coarse modes as well as to insoluble Aitken mode according to the respective condensation sink (depending on surface area). L/SVOCs condense to soluble Aitken, accumulation and coarse modes as well as insoluble Aitken mode according to the actual mode mass.
NPF is treated following Vehkamäki et al. (2002). In addition, NPF from H2SO4 and ELVOCs is calculated using the semi-empirical method by Riccobono et al. (2014) (see Table 1). The size of freshly nucleated sulfuric-acid–ELVOC clusters is assumed to be 1.7 nm. The early growth to 5 nm diameter is calculated following Kerminen and Kulmala (2002). The resulting number of these 5 nm particles is finally added to the nucleation mode.
The emissions of the SOA precursors isoprene and MTs are calculated using MEGAN-MACC (Sindelarova et al., 2014) for the year 2000 and depend on the underlying vegetation information. The BVOC emissions are prescribed monthly fields and with an applied diurnal variation. There is also a small fraction of MTs and isoprene emitted from biomass burning, which will participate in production of SOA.
For the present study, IFS is applied at a spectral truncation of T255 (corresponding to 0.7∘) grid with 91 vertical levels. Emissions for TM5 are applied on a grid, whereas following processes and transport are calculated on . The horizontal winds (via divergence and vorticity) and surface pressure were nudged against ERA-Interim with a relaxation time of 8.25 h. The cloud droplet number concentration of stratiform clouds is calculated using Abdul-Razzak and Ghan (2000); it determines the effective radius of the cloud droplets and influences the lifetime of the clouds via its effect on the autoconversion of cloud liquid water to rain.
2.5 ECHAM
ECHAM5-HAM (Stier et al., 2005) is an aerosol–climate model originally developed at the Max Planck Institute for Meteorology, Hamburg. The Hamburg Aerosol Module (HAM) also employs the M7 aerosol microphysics module. The ECHAM-HAM simulations were performed in T63 spectral resolution with 31 hybrid-sigma vertical levels. The spectral atmospheric variables are nudged with standard ECHAM relaxation timescales: 6 h for vorticity, 24 h for pressure and temperature, and 48 h for divergence (Lohmann and Hoose, 2009).
We apply a modified version of ECHAM5.5-HAM2 (K. Zhang et al., 2012), which uses an improved numerical scheme (Kokkola et al., 2009) to compute the formation of sulfuric acid by oxidation of SO2 and its removal by nucleation and condensation on pre-existing particles. We consider SOA formation from the biogenic precursors isoprene and MTs. The SOA formation mechanism (Jokinen et al., 2015) includes both kinetic condensation to Fuchs-corrected surface area (condensation sink). Moreover, the relative partitioning to the Aitken, accumulation or coarse mode is done according to pre-existing organic mass in the respective modes. The model considers three BVOC tracers: isoprene, endocyclic and other MTs. The BVOC emissions in ECHAM simulations were pre-computed monthly averages (Jokinen et al., 2015). The MEGAN2.1 (Guenther et al., 2012) was driven with input drivers described in Sindelarova et al. (2014), combining MERRA meteorological fields and MACC land cover data. However, the BVOC emission inventories did not separate endocyclic and other MTs; hence, their respective emissions were considered equal fractions. The reaction rates of SOA precursors with O3, OH and NO3 are described in Jokinen et al. (2015).
The ELVOC yields are based on extensive laboratory experiments (Jokinen et al., 2015), while the total (ELVOC+L/SVOC) yield is set to 15 % for MTs and 5 % for isoprene. ELVOCs provide early growth for nucleation mode particles, as they are distributed to the particle phase according to condensation sink. The low volatility and semi-volatile products are distributed to particle phase according to particle-phase organic mass, as in Jokinen et al. (2015). Hence, after oxidation, no SOA products remain in the gas phase, but immediate condensation to aerosol phase is assumed. Simulations include organic vapours in the nucleation process according to Eq. (18) in Paasonen et al. (2010). The growth from nucleation to 3 nm is calculated according to Kerminen and Kulmala (2002), assuming growth by ELVOCs and sulfuric acid.
We will start the results section by investigating the inter-model differences in the CTRL simulation among the three models. It is necessary to be aware of the differences between models before investigating the changes that the sensitivity simulations induce.
3.1 CTRL
3.1.1 BVOC emissions and concentrations
The three ESMs all use the same emission model (MEGAN), but the emissions of MTs and isoprene still vary between the models because of choices in land cover data and meteorology. For isoprene, NorESM has the lowest emissions rates of about 435 Tg yr−1, while EC-Earth and ECHAM are somewhat higher with 572 and 526 Tg yr−1, respectively; see Fig. 1g. The spatial distribution in the emissions also varies between the models. In NorESM, the isoprene emissions are highest in the Amazon region with somewhat smaller sources in Africa and the tropical islands of Indonesia (Fig. 1a). EC-Earth has the highest emission rates out of all the models but with the Amazonian maximum located further south than in NorESM (Fig. 1c). ECHAM has similar emission patterns to EC-Earth but with somewhat weaker emissions; see Fig. 1e.
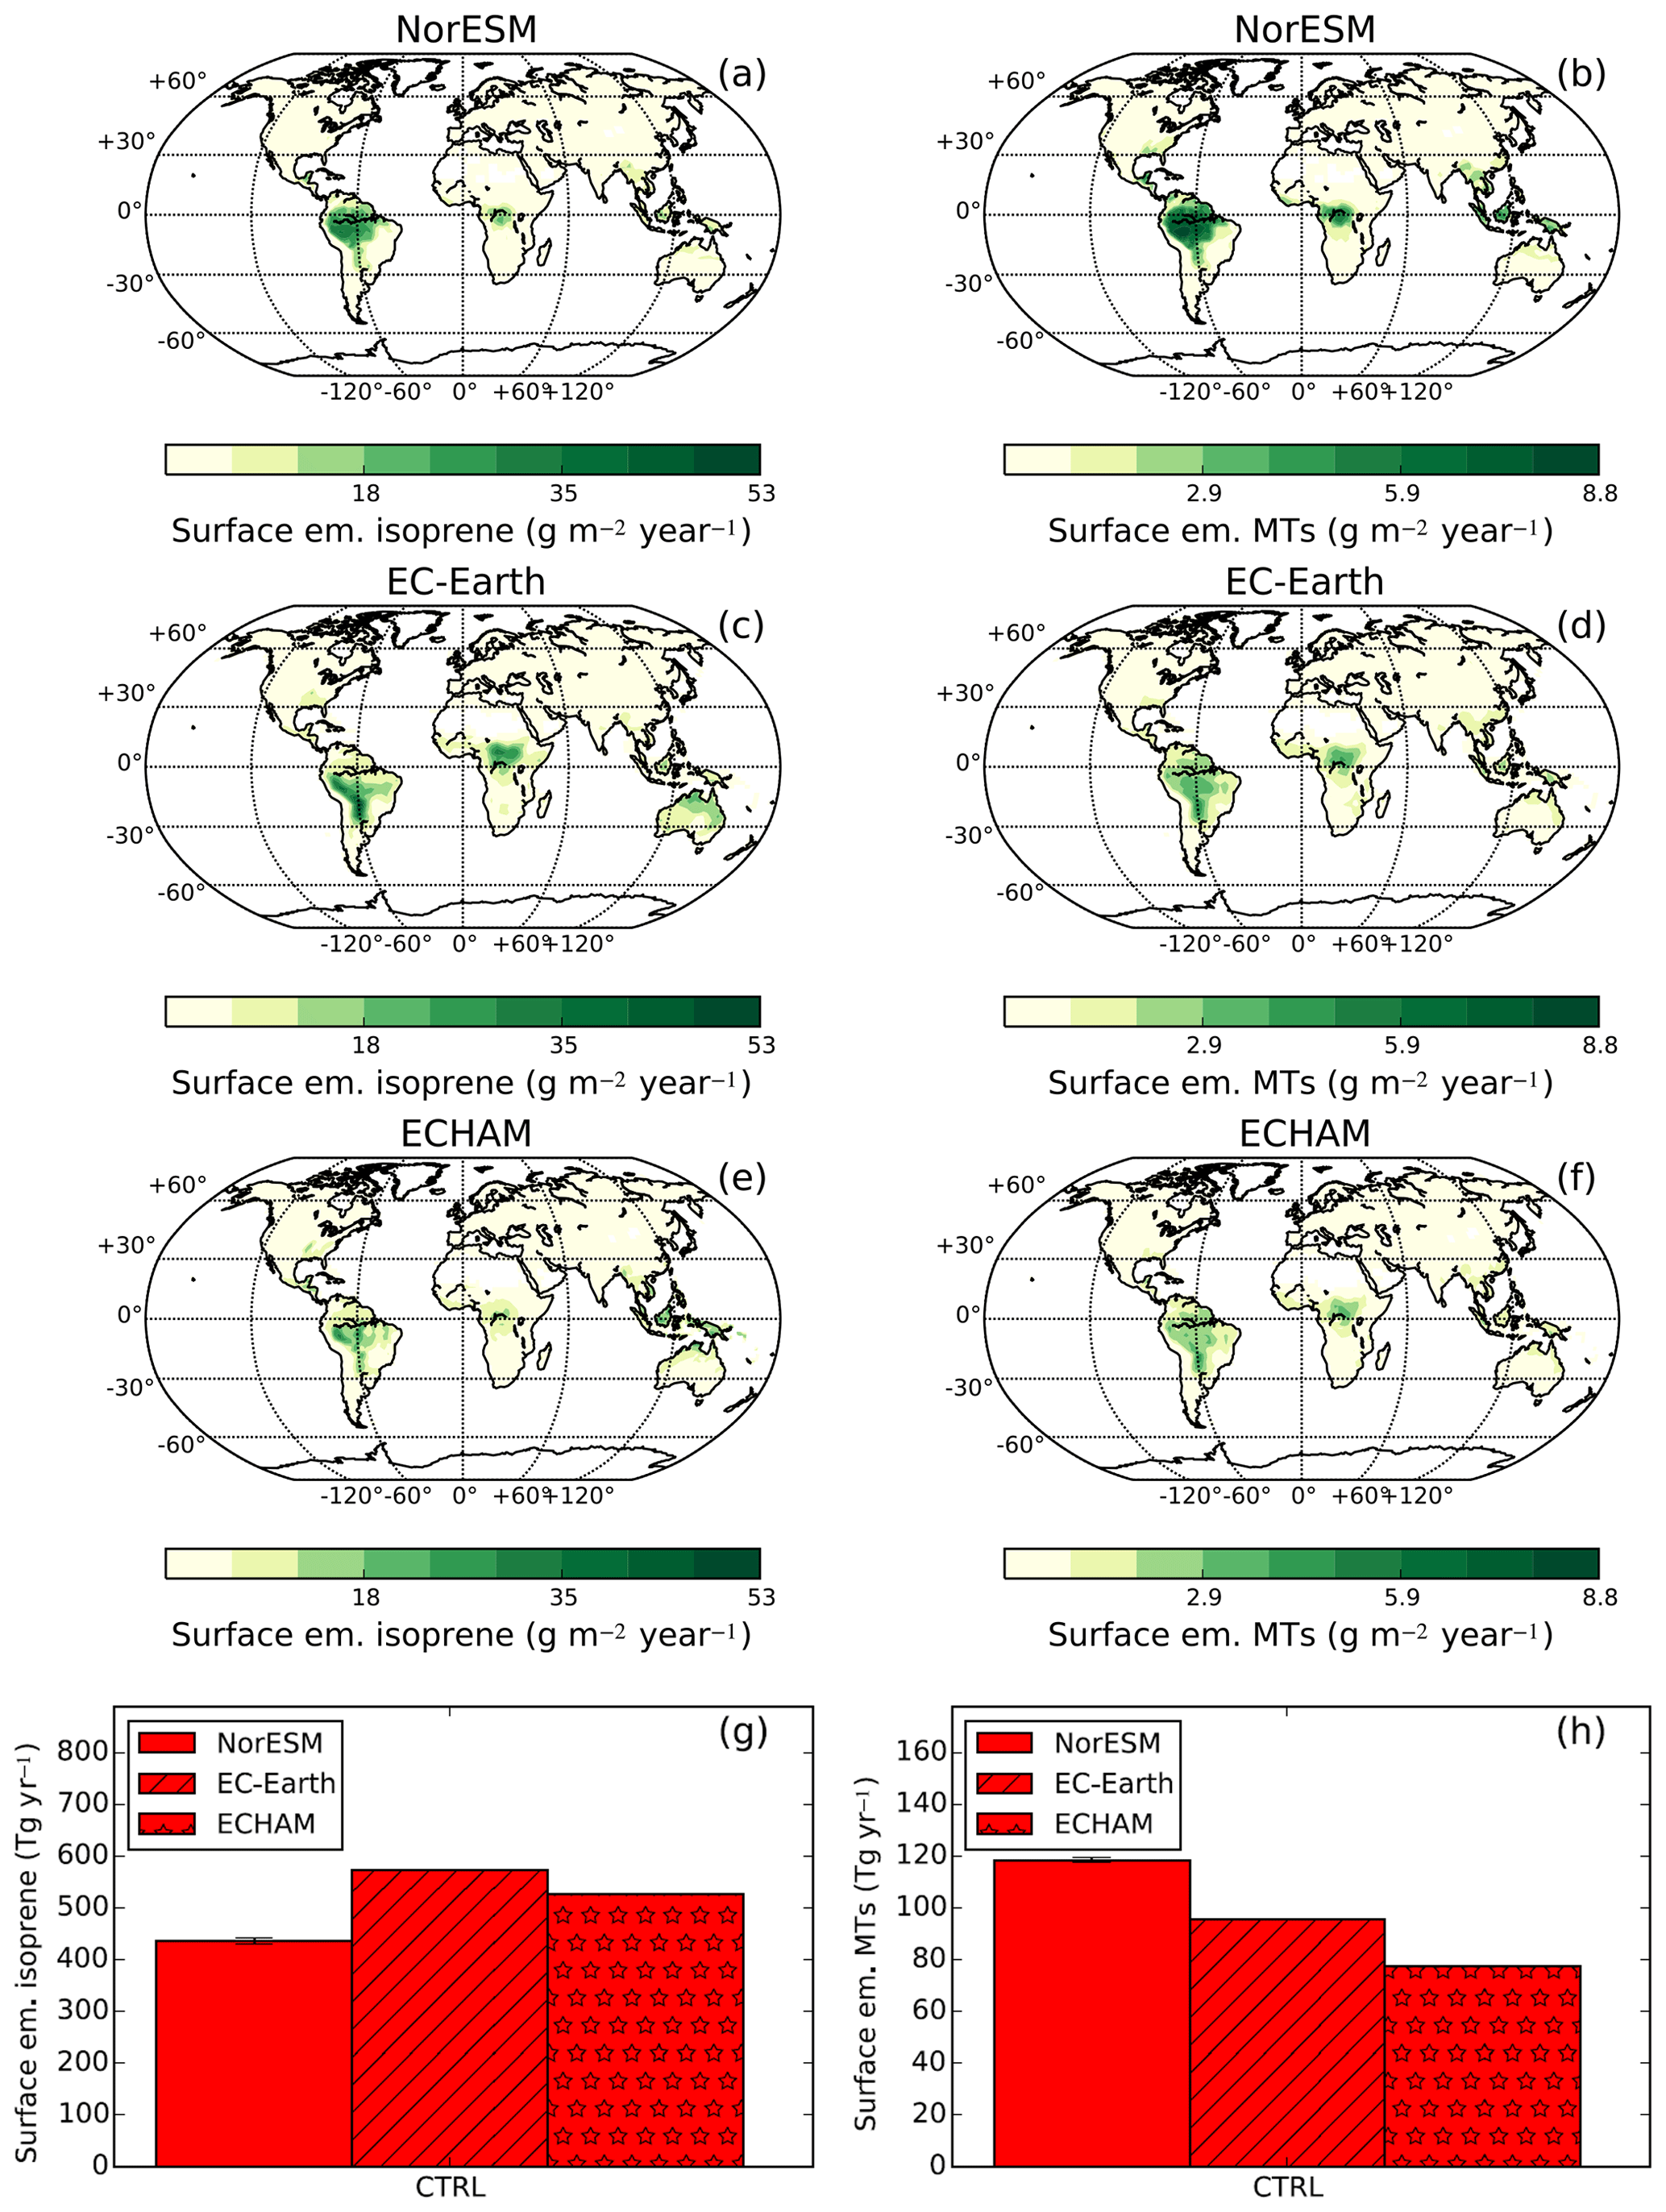
Figure 1Maps of annually averaged surface emissions of isoprene (a, c, e) and monoterpenes (MTs) (b, d, f) for NorESM, EC-Earth and ECHAM. ECHAM and EC-Earth use prescribed emissions and there are therefore no error bars presented for these models. Also shown are the global yearly surface emissions of isoprene (g) and MTs (h). The error bars denote the standard error of mean of the yearly averages.
For MTs, NorESM has the highest global emissions (118 Tg yr−1) followed by EC-Earth (96 Tg yr−1) and then ECHAM (77 Tg yr−1) as can be seen in Fig. 1h. The largest differences in the emissions are in the tropics, in particular in the Amazonian region, where NorESM has up to twice as high annual emissions. The cause of the difference in emissions is related to the implementation of MEGAN used in the models. In NorESM, MEGAN is interactive and uses the vegetation from CLM as well as atmospheric conditions and radiation in the calculation of the BVOC emissions. EC-Earth and ECHAM, on the other hand, use prescribed BVOC emissions from MEGAN-MACC with a yearly as well as diurnal variation included (Sindelarova et al., 2014). The emissions from these two models are not the same because different meteorology was used in the generation of the emissions fields.
The column burdens of the BVOCs also differ between the models (not shown). The global mean column burden of isoprene is approximately 3 times higher in EC-Earth (1.0 kg m−2) than in the other two models. This is in part because of significantly higher column burdens over the strong emission regions in South America and Africa, which are due to the interactive oxidant fields in EC-Earth. When interactive oxidant fields are used, the oxidants can be depleted and as a result the lifetime of BVOCs is increased. This does not occur in the other two models that have prescribed oxidation fields. The MT column burdens are more similar between the models.
3.1.2 SOA formation and aerosol size distributions
There is a large range in the amount of SOA formed in the different models. In spite of having the lowest BVOC emissions (due to lower isoprene emissions), NorESM has the largest average annual production (85 Tg yr−1), while ECHAM and EC-Earth have very similar and somewhat lower SOA production (52 Tg yr−1); see Fig. 2a. The higher emissions in NorESM are likely a result of the higher MT emissions (which have the highest yields), in combination with higher yields for isoprene than EC-Earth. Also the assumed molar mass of the BVOC oxidation products will affect how much SOA mass is formed. The produced SOA mass in the models is in the range of the values found in Tsigaridis et al. (2014) but are higher than the median of the models included in that study.
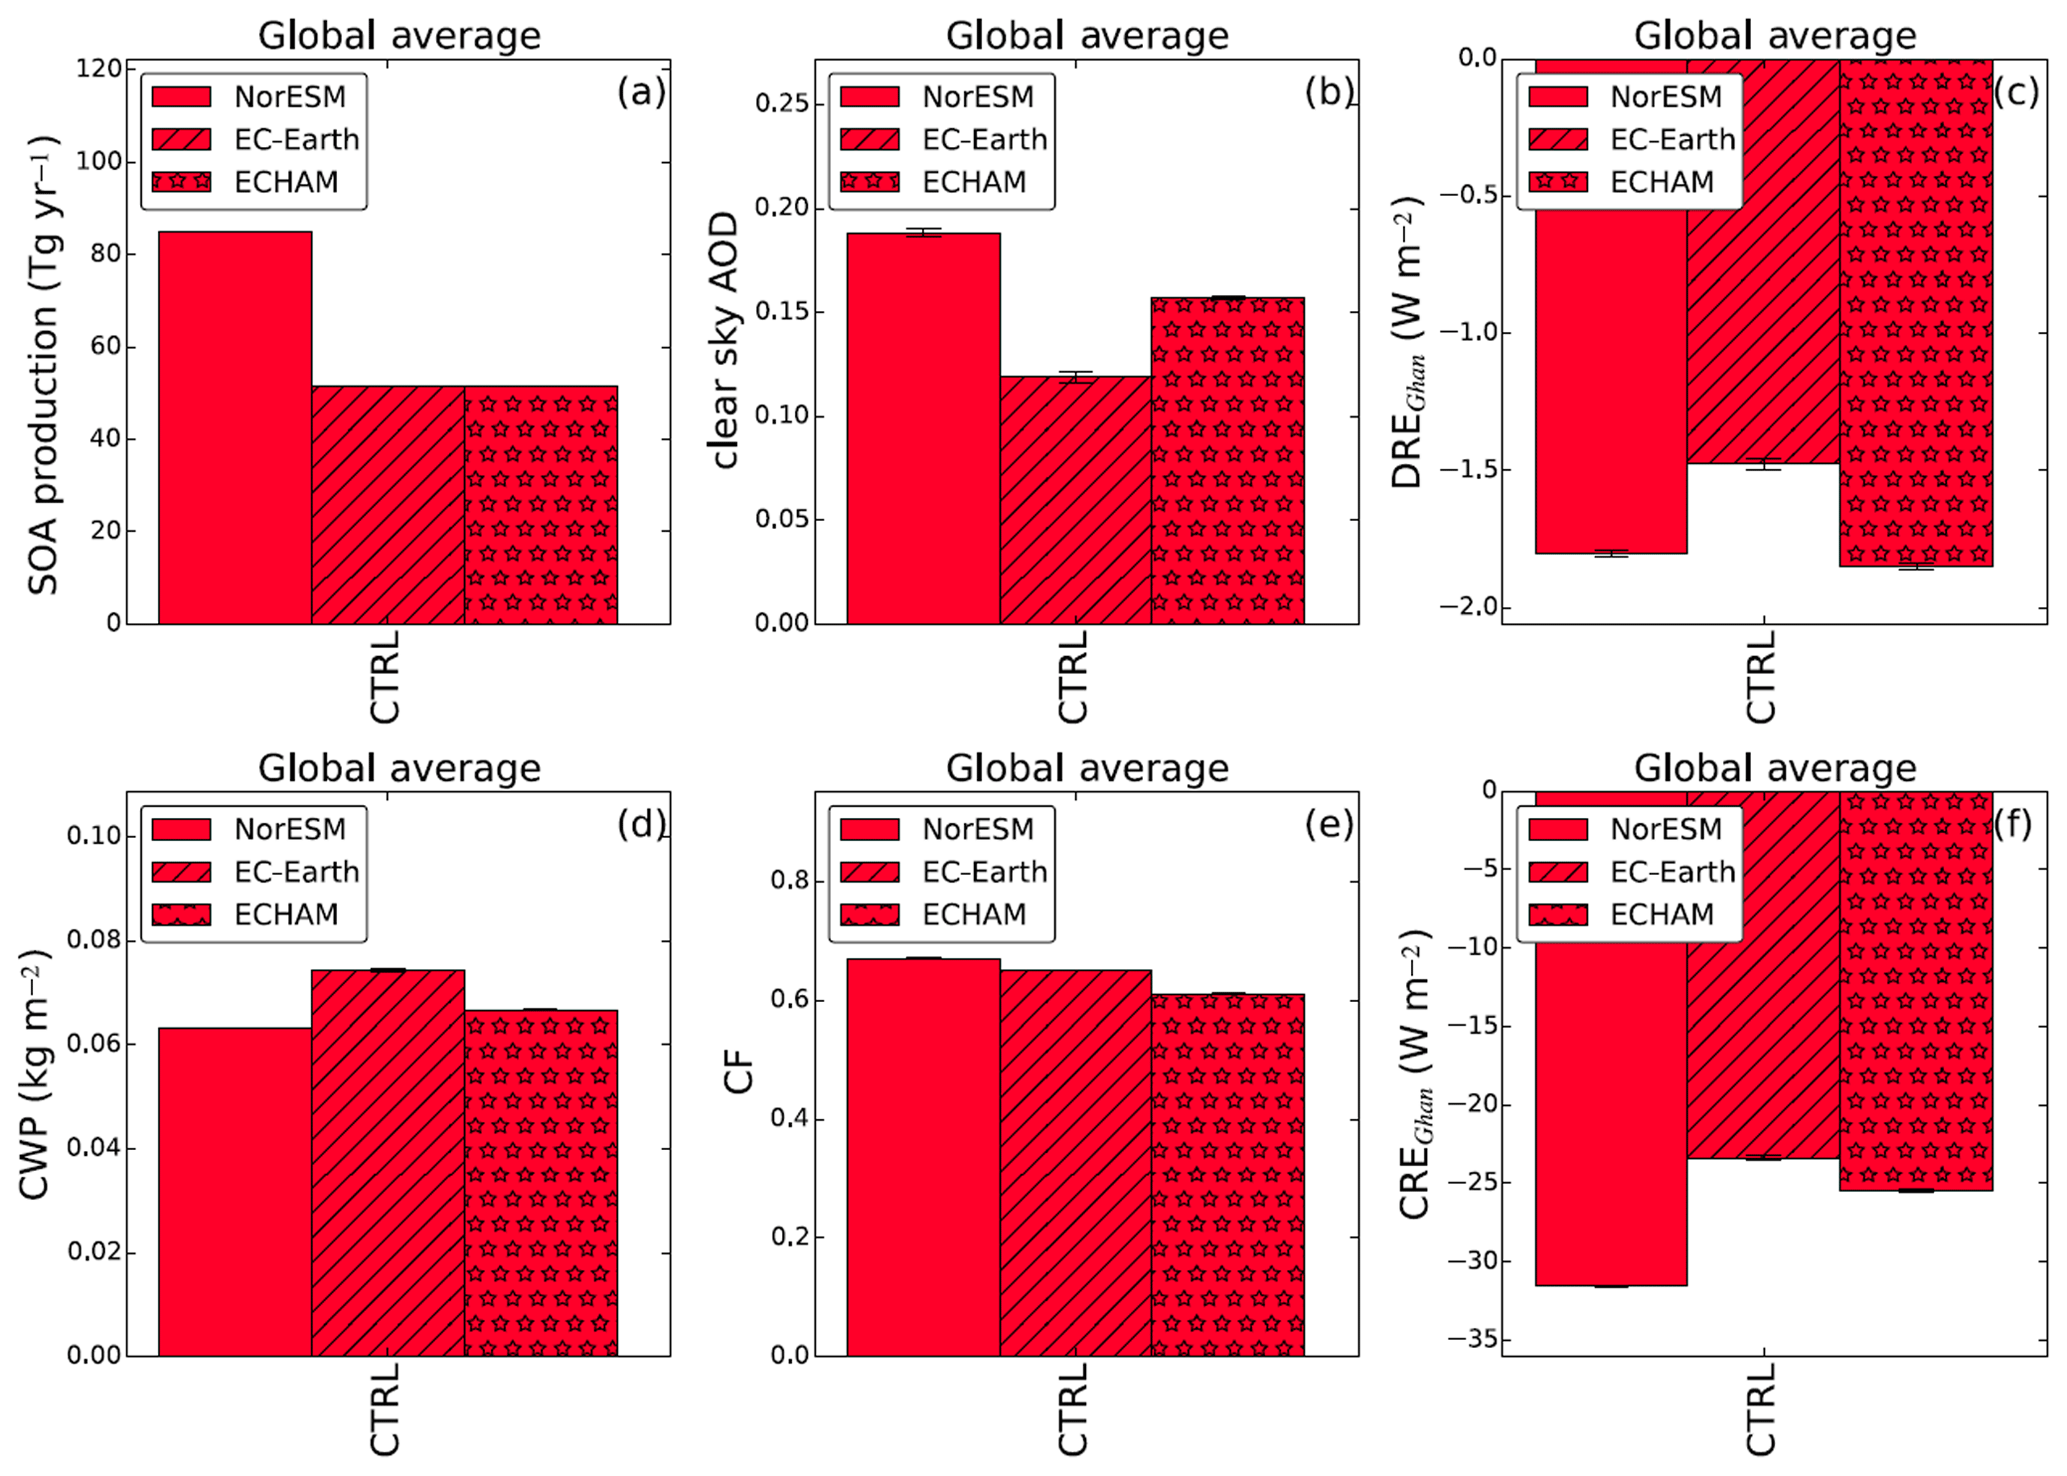
Figure 2Bar plots of the total yearly global SOA production and the yearly averaged aerosol optical depth (AOD), direct radiative effect (DREGhan), cloud water path (CWP), cloud fraction (CF) and cloud radiative effect (CREGhan) for all three models for the CTRL experiment. The error bars denote the standard error of mean of the yearly averages.
In this paper we have averaged the size distribution and number concentration data globally over the model levels with pressures higher than 850 hPa, i.e. the bottom part of the atmosphere. This choice was made since this part of the atmosphere contains most of the aerosol mass which is relevant for both the direct and indirect aerosol effects. Moreover, clouds in the ESMs use aerosol activation at the bottom of the clouds, and thus the aerosols at these levels are most important also for the indirect aerosol effects. The aerosol size distributions (for all particles) show large differences between the models even though ECHAM and EC-Earth both use the modal aerosol model M7; see Fig. 3. The most noticeable difference between the number size distribution of the models is that NorESM, which uses the aerosol model OsloAero, has no explicit nucleation mode. In NorESM, particles from NPF are added directly into SO4∕SOA nucleation mode which is in the Aitken-accumulation size range after growth through condensation. ECHAM's size distribution is dominated by a large nucleation mode which contains almost 2 orders of magnitude more particles than the nucleation mode in EC-Earth. Moreover, EC-Earth also has fewer particles than the other models in the largest particle sizes (diameters >250 nm). Of the three models, ECHAM has the most particles at large sizes (diameters >300 nm) as well as highest surface and volume of particles (Fig. 3b and c). Total aerosol number concentrations (Fig. 4) reveal that EC-Earth has the lowest aerosol number concentrations out of all models and ECHAM has the highest. This is still the case when comparing the number concentrations without the nucleation mode. Moreover, ECHAM has substantially higher aerosol number concentrations over the remote oceans (Fig. S1 in the Supplement) compared to the other two models. There are likely many different explanations as to why the size distributions and aerosol number concentrations are different in the models. Some plausible explanations include differences in wet deposition, nucleation rates and how the emissions in general are partitioned into the aerosol modes.
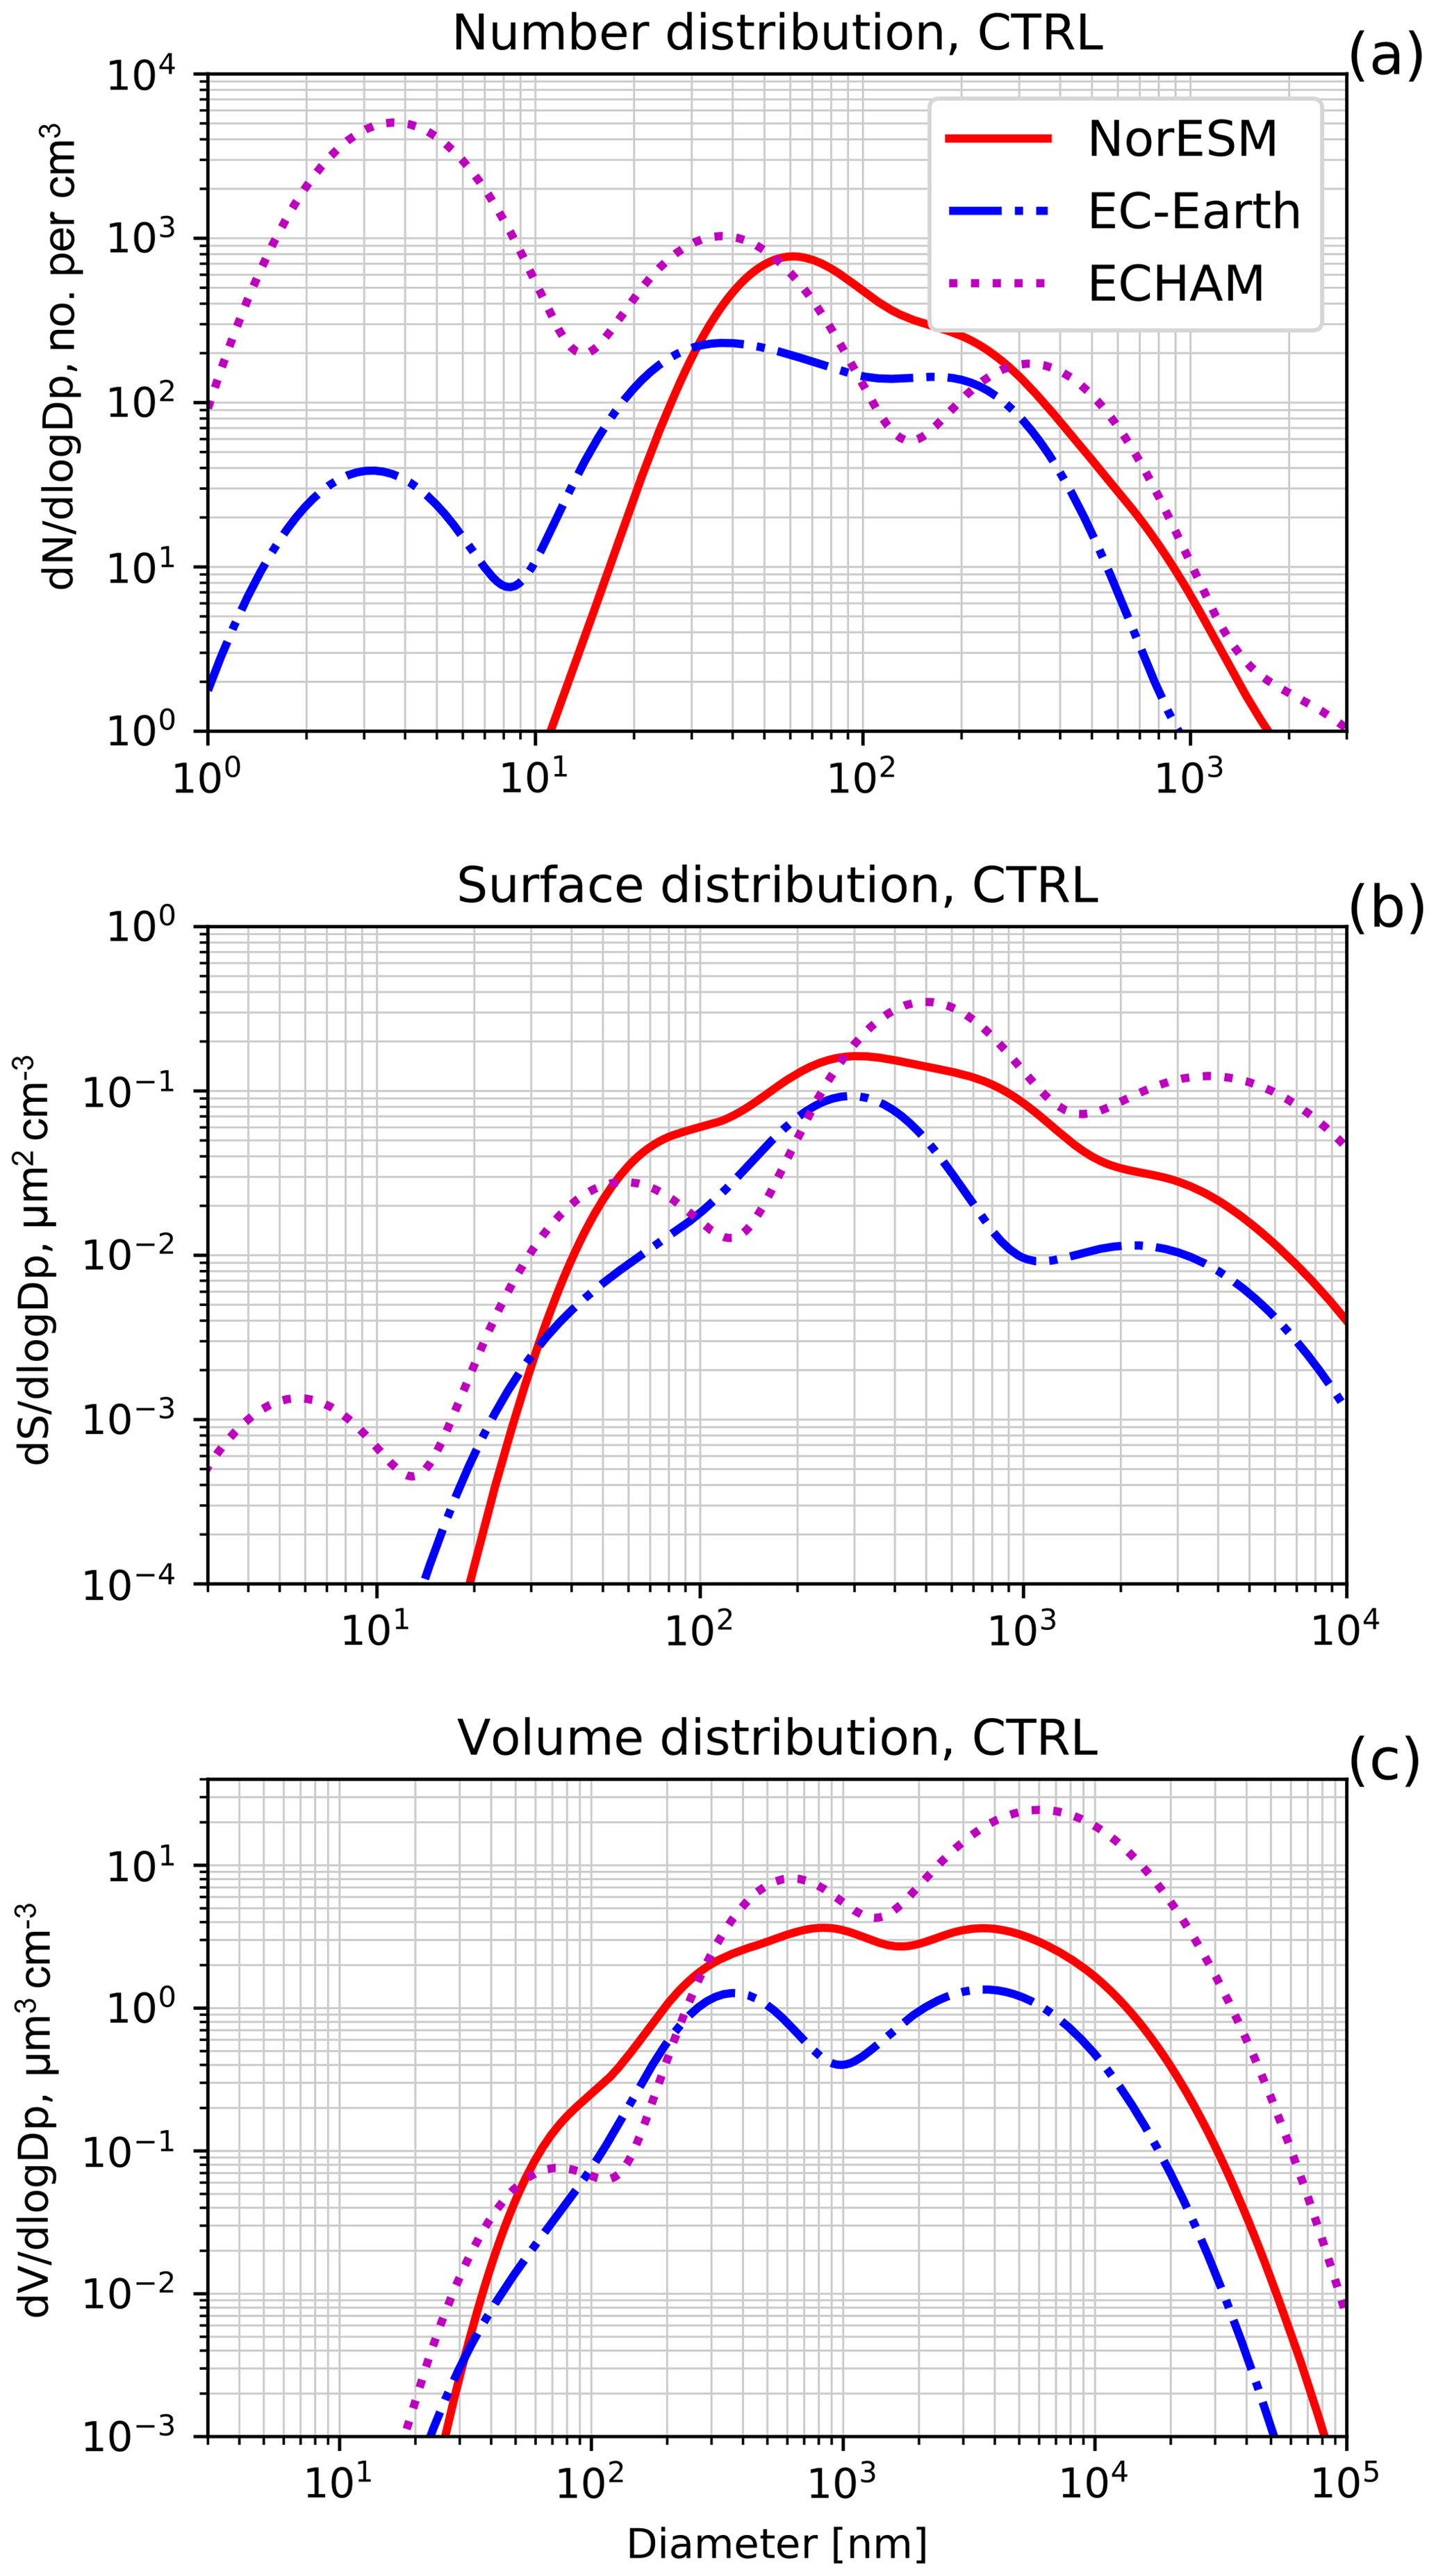
Figure 3Globally averaged aerosol number size distributions (a), surface size distributions (b) and volume size distributions from the three models from the CTRL simulation. The diameters are the dry diameters. Note the different scales on the x axis in the subplots.
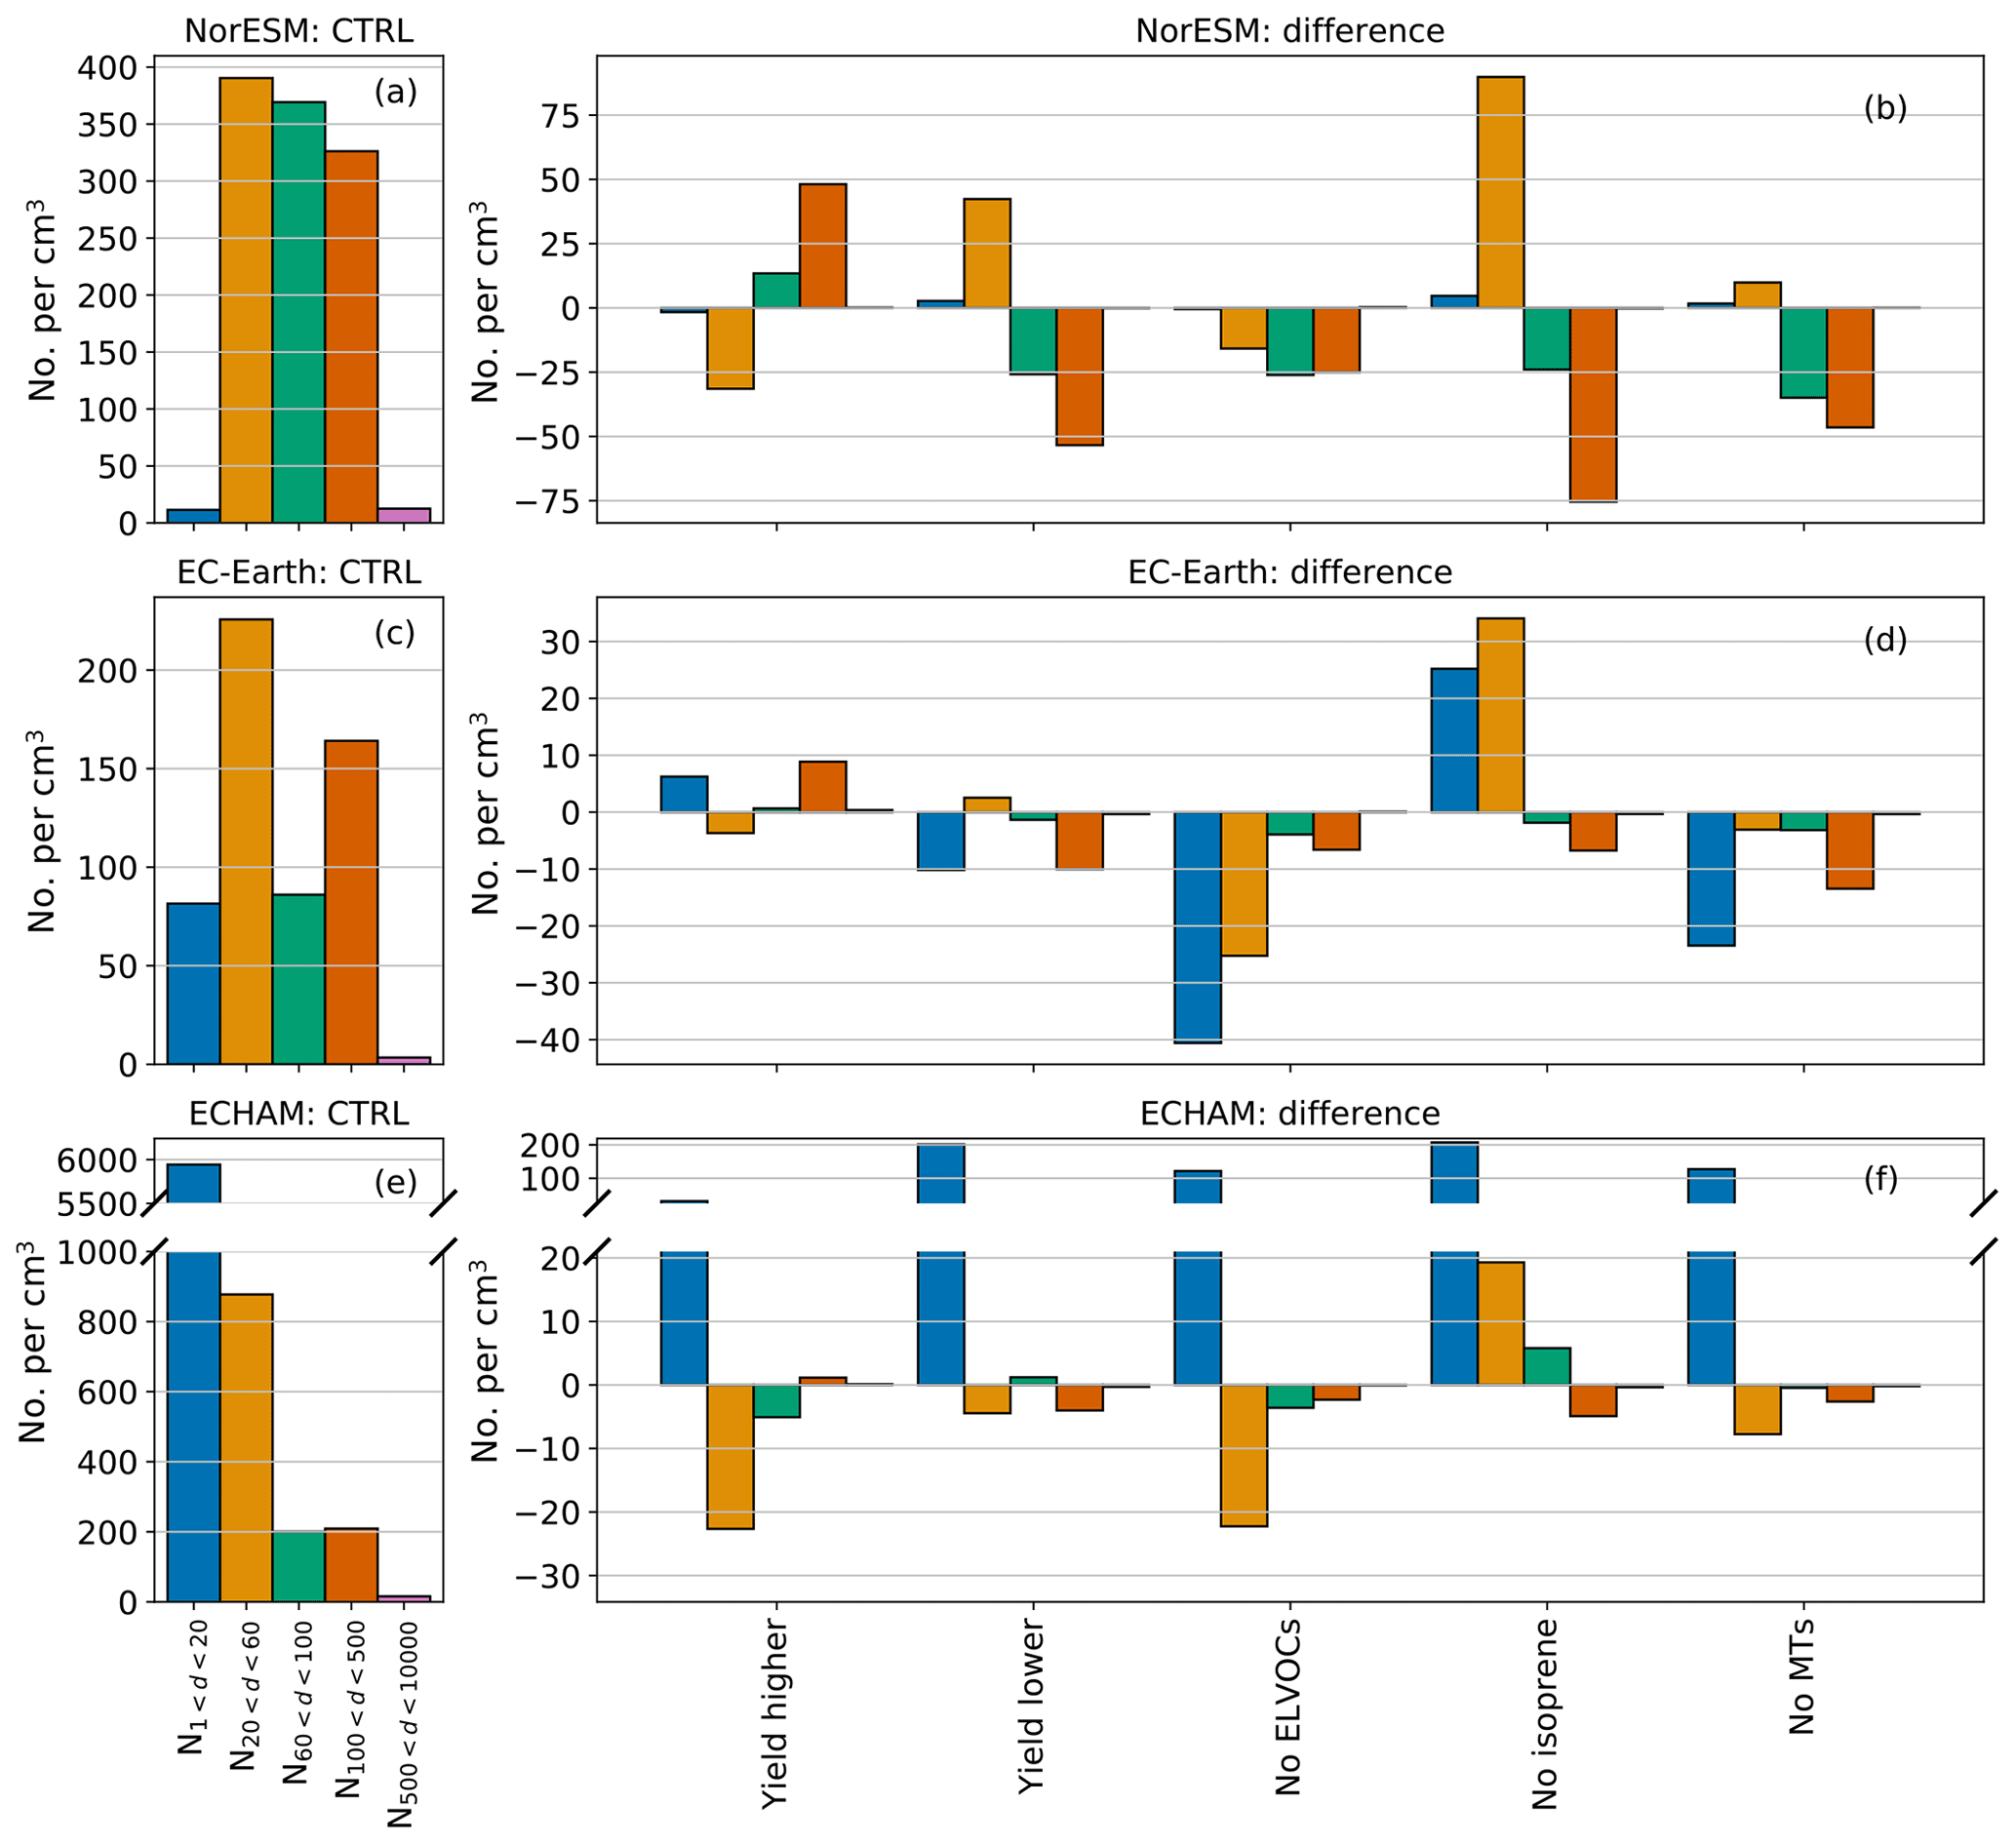
Figure 4Bar plots of the number concentration of particles of selected sizes. In (a), (c) and (e) the number concentrations from the CTRL simulations are shown. In (b), (d) and (f) the absolute differences between the sensitivity simulations and the control simulations are shown for each size bin. Note that there are different scales used for the different models.
3.1.3 AOD and direct aerosol effects
The global average aerosol optical depth (AOD) is highest in NorESM (0.19, Fig. 2b) due to significantly higher AOD values over desert regions, in particular the Sahara (Fig. S1). This is associated with high dust emissions from the desert. ECHAM has the second highest global AOD values (0.16) and has somewhat higher AOD values over the ocean than the other two models. The direct aerosol effects (Fig. 2c) in the models resemble the results from the AOD. EC-Earth has lower globally averaged direct radiative effect (DREGhan) than the other two models. This is a result of the low aerosol number concentrations, in particular at larger, radiation relevant sizes. This can also be seen in the AOD from EC-Earth. ECHAM has slightly stronger global average DREGhan than NorESM even though NorESM has a higher average AOD. The reason for this is that many of the regions with large AOD in NorESM have very bright surfaces (e.g. deserts) and therefore result in a lower DREGhan (Fig. S1).
3.1.4 Cloud properties and indirect aerosol effect
The cloud properties in the CTRL simulation are quite different in the models. EC-Earth has the lowest cloud droplet number concentrations (Fig. S2), which is related to the low number concentrations of aerosol particles in this model. ECHAM, on the other hand, has the highest number of cloud condensation nuclei (CCN) and also the highest cloud droplet number concentration (CDNC). NorESM has larger droplet sizes than the other two models and the droplet size patterns are very different in the different models. Nevertheless, the total grid box cloud water path (CWP) is fairly similar between the three models but slightly higher in EC-Earth (Fig. 2d). The total cloud fractions (CF) in the models are also fairly similar with global average values between 0.61 and 0.67; see Fig. 2e. The cloud radiative effect (CREGhan) is stronger in NorESM (−31 W m−2) compared to EC-Earth (−23 W m−2) and ECHAM (−26 W m−2); see Fig. 2f. Note that these are development versions of NorESM and EC-Earth which has not been tuned. The patterns of the CF and CREGhan can be seen in Fig. S3.
3.2 Yield higher and Yield lower
The results from the sensitivity simulations will now be presented and discussed in three different sections. The sensitivity experiments are grouped according to the similarity in the results. In the first section, the Yield higher and Yield lower experiments are discussed.
3.2.1 Direct aerosol effects
First, the results regarding the changes in aerosol scattering and how these affect climate forcing are presented. In the Yield higher simulation the DREGhan becomes stronger, i.e. more negative, and the opposite is true for the Yield lower simulation, for all three models (Fig. 5). These changes reflect the changes in SOA formation (Fig. 6) as more SOA leads to a stronger DREGhan. Since NorESM has the largest SOA production, it also experiences the largest SOA production change in these simulations, approximately ±38 Tg yr−1. The changes in the other two models are of the order of 25 Tg yr−1. Interestingly, an increase or decrease in the SOA precursor yields by 50 % results in an increase or decrease in SOA production by 50 % only in EC-Earth. In NorESM, the SOA production change is somewhat less than 50 % in both simulations. The explanation for this is that SOA is also produced from dimethyl sulfide (DMS) emissions from the ocean in NorESM (Kirkevåg et al., 2018), and these yields are not changed in the sensitivity simulations. For ECHAM, the effect is somewhat larger in the Yield higher simulation (+52 %) and smaller in the Yield lower simulation (−45 %).

Figure 5Bar plots of the average direct radiative effect (DREGhan) difference between each sensitivity simulation and the CTRL simulations. Coloured bars indicate a significant difference in the simulation averages with a 95 % confidence interval. The error bars denote the standard error of mean of the yearly differences.
The degree to which a SOA increase leads to a strengthening in the DREGhan varies between the models. NorESM has the largest absolute increase and decrease in SOA formation in these two simulations, but it is EC-Earth that experiences the largest change in the DREGhan with changes of ±0.15 W m−2. For reference, this number is roughly half of the radiative forcing due to aerosol–radiation interactions (RFari) best estimate in the Fifth Assessment Report by the IPCC (2013). ECHAM has the smallest changes in DREGhan with values of approximately ±0.03 W m−2 even though this model has similar changes in SOA production to EC-Earth. The cause of the different responses in the different models is, at least partly, related to where in the aerosol size distribution the additional or removed SOA is located. For all three models in the Yield higher simulation, the globally averaged particle number concentrations increase at sizes relevant for scattering of solar radiation (Nd>100, number concentration of particles above 100 nm) (see Fig. 4). However, in ECHAM this increase is quite small; see Fig. 4f. The changes in particle number concentration in NorESM are quite large but are mainly located close to the BVOC sources (not show). EC-Earth instead experiences these changes in the particle number concentration further downwind of the sources. This results in a more widespread change in DREGhan in EC-Earth compared to the other two models (see Fig. S4) and thus a significantly higher global average DREGhan. Similar but opposite changes are seen in the Yield lower simulation.
3.2.2 Indirect aerosol effects
The response of the indirect aerosol effects in the Yield higher and Yield lower sensitivity tests differs more than the direct effects. The CREGhan in NorESM is strengthened (i.e. more negative) with increasing SOA production and vice versa; see Fig. 7. The changes in CREGhan are −0.27 W m−2 (Yield higher) and 0.35 W m−2 (Yield lower), indicating that these sensitivity simulations induce changes in the forcing of relevant magnitude. The globally averaged changes in EC-Earth have the same sign as those for NorESM but are lower (−0.11 and +0.076 W m−2); for ECHAM the changes are very small and not statistically significant. Also for the indirect effects, changes in the size distributions can be used to explain the changes in CREGhan. While hygroscopicity might play a role, the effect is small in the activation scheme shared by the models (Abdul-Razzak and Ghan, 2000).
For NorESM, the higher (lower) SOA production in the Yield higher (Yield lower) simulation results in a shift in the size distribution to larger (smaller) sizes; see Fig. 4. For the Yield higher simulation, this results in higher CCN concentrations, higher CDNC, smaller cloud droplet effective radius (re) and larger CWP (Figs. S4–S7). The opposite change in these variables is seen in the Yield lower simulation. The main relative changes in cloud variables in NorESM are located over and downwind of the large BVOC emission sources in the tropics. Increased number of CCN generally means higher CDNC, lower re and higher CWP in all three models. For some regions, the CF decreases as CCN increases. The results regarding the changes in cloud parameters are shown in Figs. S5–S8 for the Yield higher and Yield lower simulations. Since the cloud response to the CCN changes are similar in all the models and simulations, we will mainly discuss CCN and CREGhan changes for the other simulations.
The essentially non-existing effects on the CREGhan in ECHAM can also be explained using the size distribution. ECHAM experiences the smallest changes in particle number concentrations for particles with diameters greater than 100 nm; see Fig. 4f. However, for the smallest size ranges (N1–60) ECHAM has the largest changes in the concentration of particles. Not surprisingly, the changes in number of these small particles do not affect the cloud formation in ECHAM, probably because they are too small to act as CCN when there is an abundance of particles at larger sizes (accumulation mode). Another interesting feature of ECHAM is that the changes in the size distribution are not mirrored in Yield higher and Yield lower simulations, which suggest non-linear dynamics caused by competition between NPF and condensation sink.
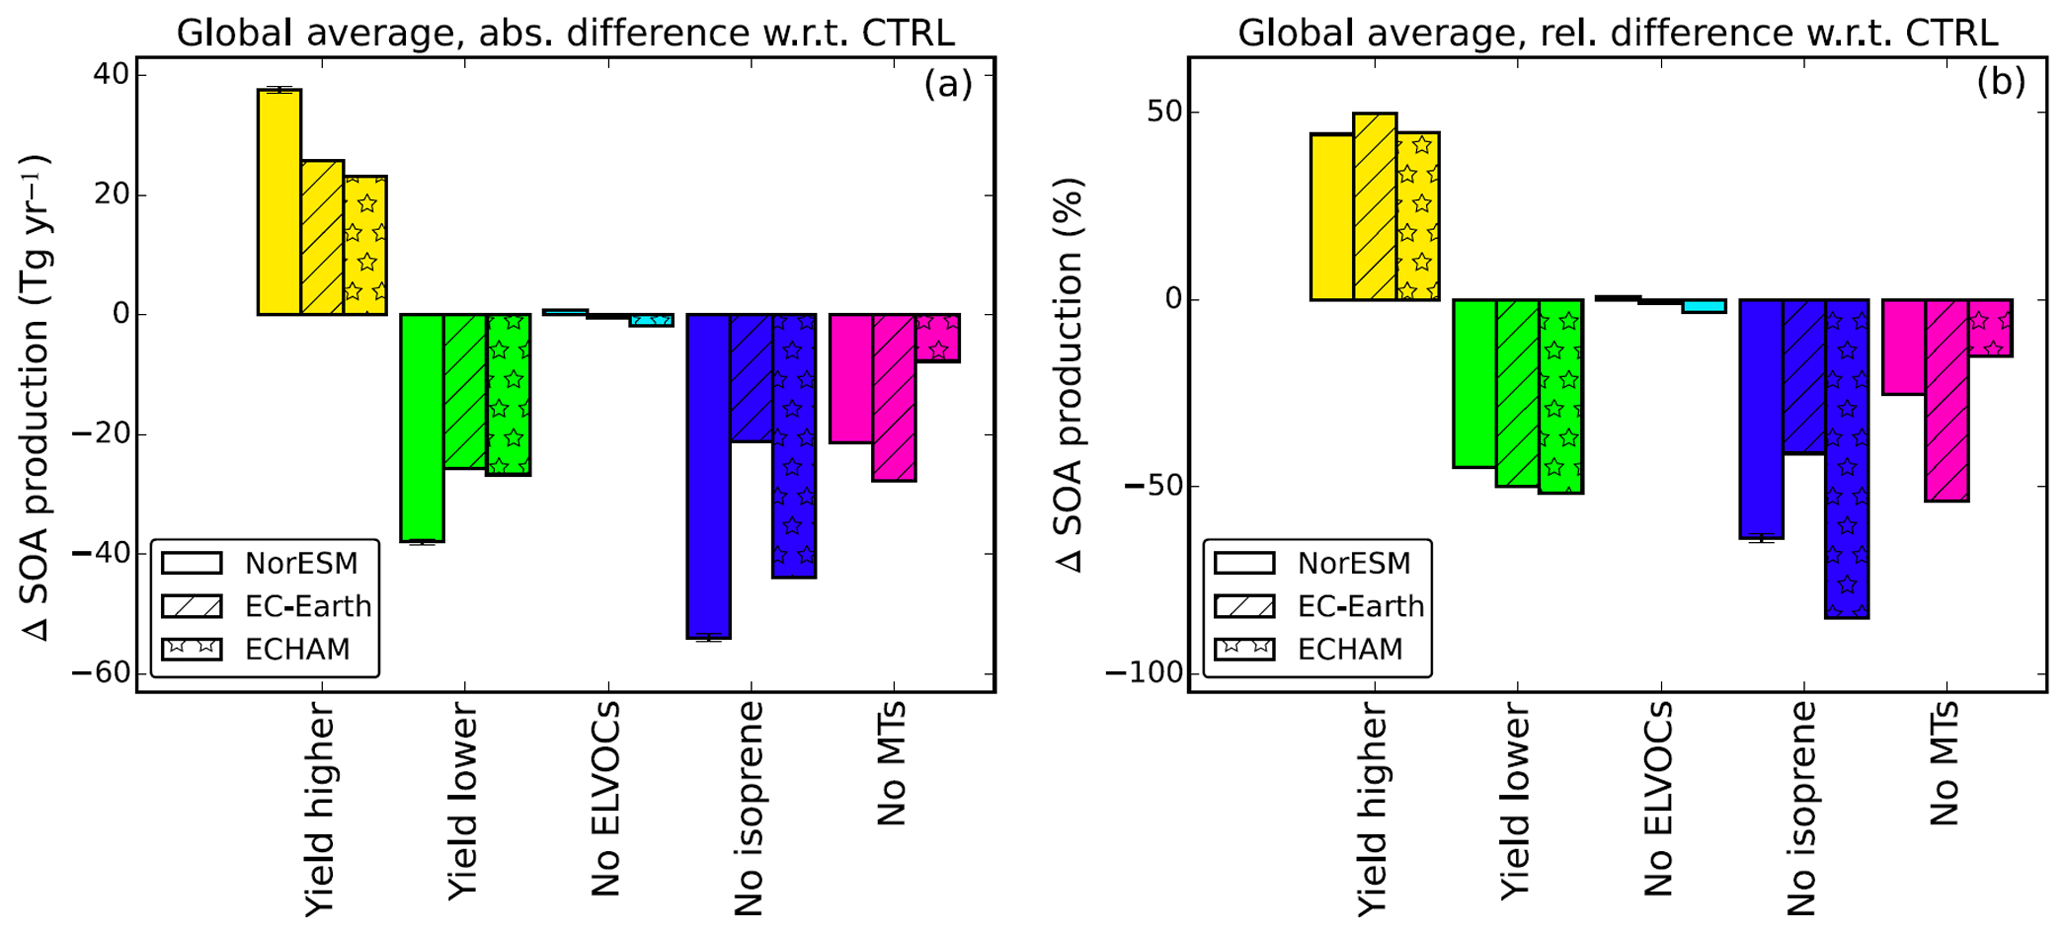
Figure 6Bar plots of the average yearly SOA production changes in the three models. In (a), the absolute difference between each sensitivity simulation and the CTRL simulations is shown and in (b) the relative differences between the sensitivity simulations and the control simulations are shown for all three models. Coloured bars indicate a significant difference in the simulation averages with a 95 % confidence interval. The error bars denote the standard error of mean of the yearly differences.
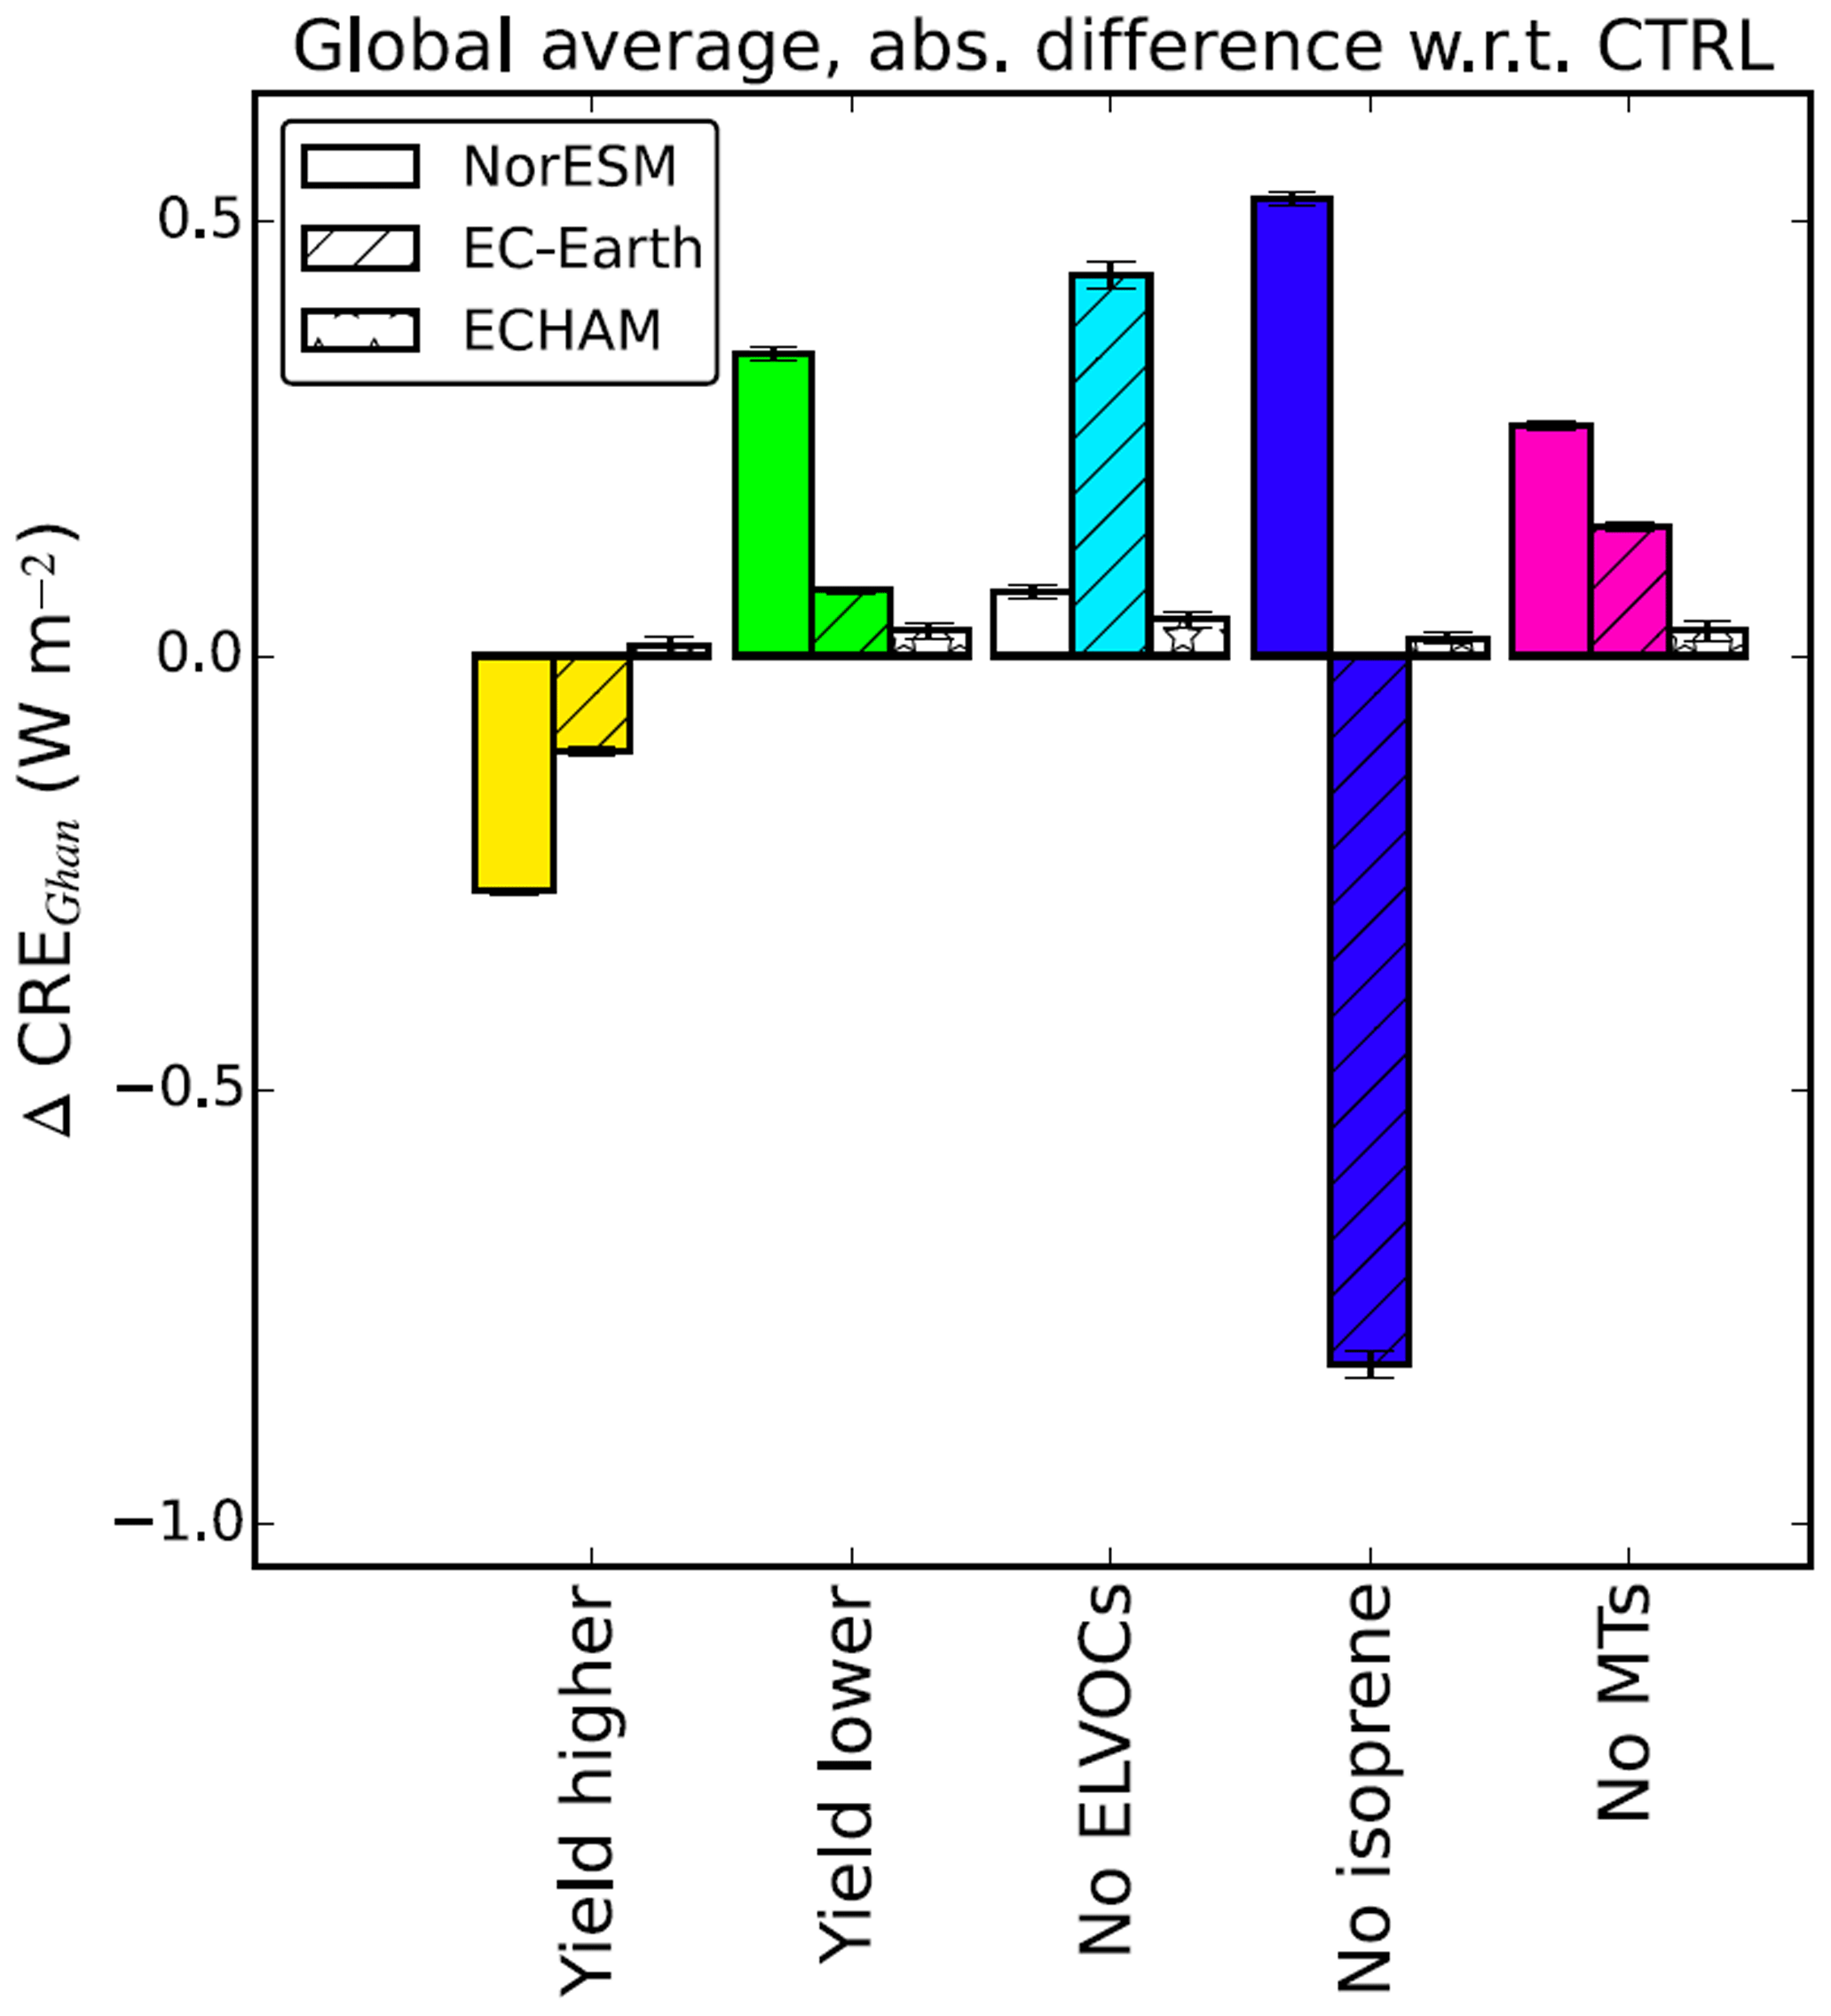
Figure 7Bar plots of the global average cloud radiative effect (CREGhan) between each sensitivity simulation and the CTRL simulations. Coloured bars indicate a significant difference in the simulation averages with a 95 % confidence interval. The error bars denote the standard error of mean of the yearly differences.
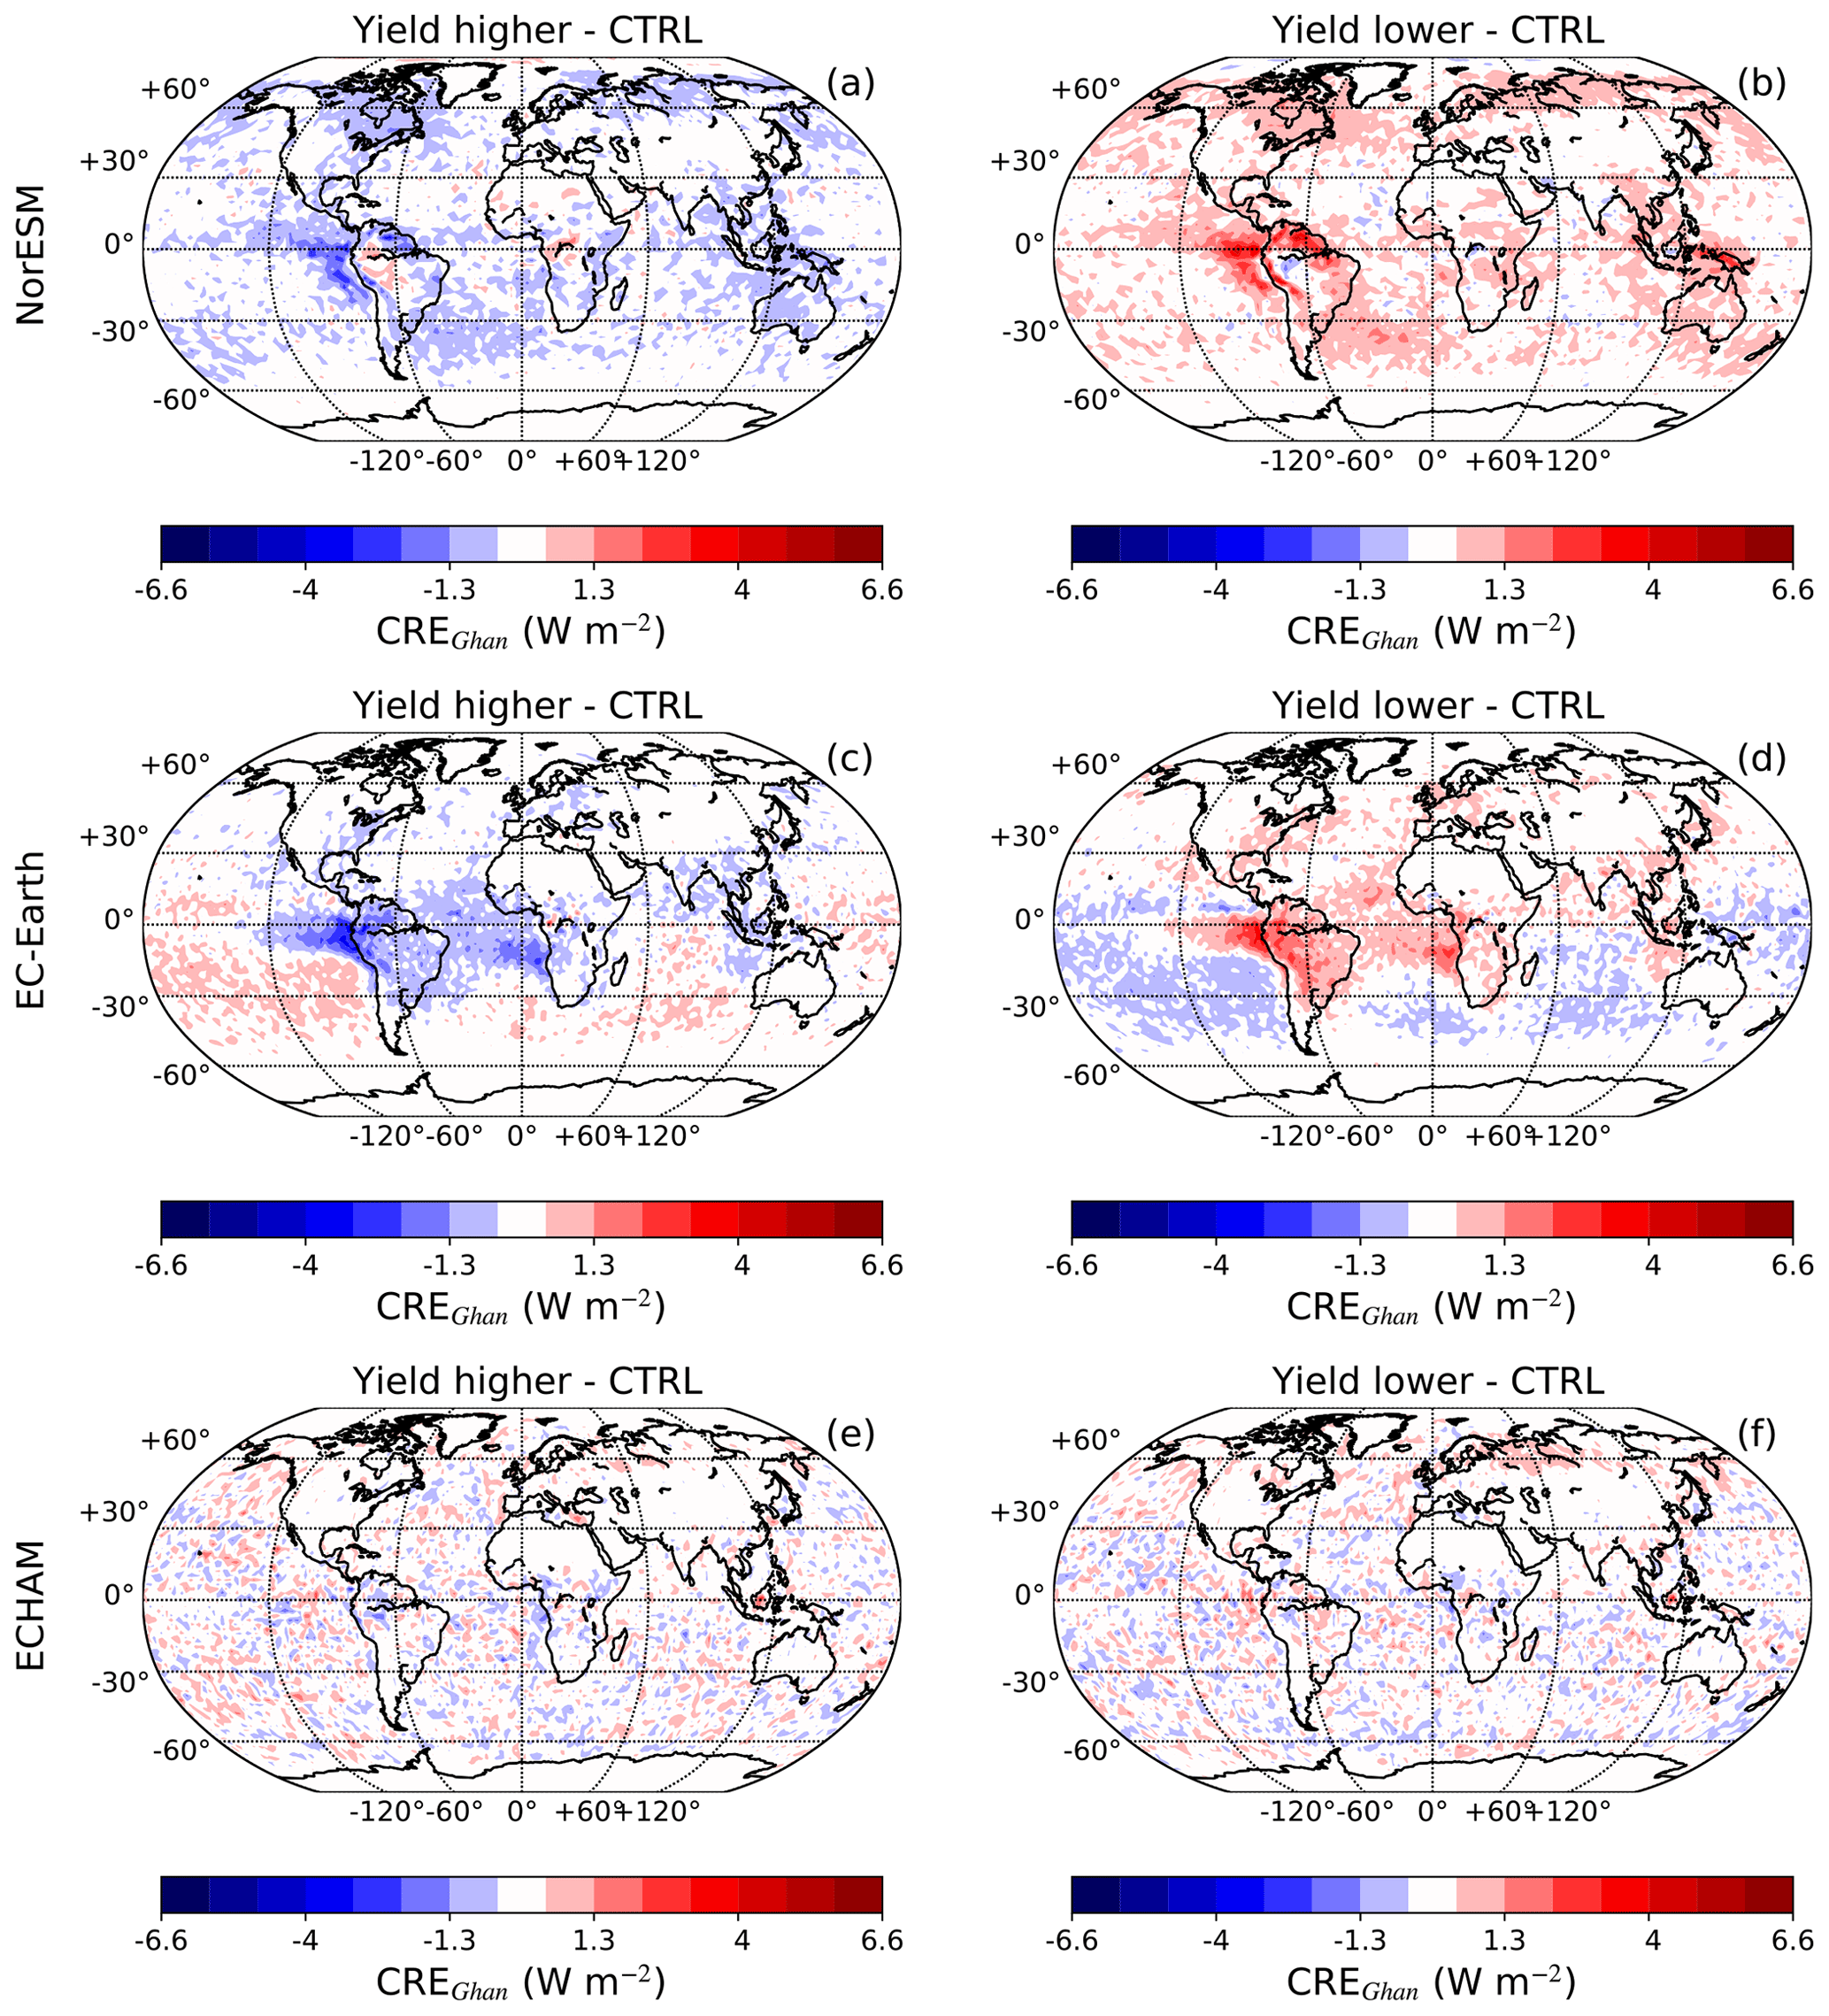
Figure 8Maps of the difference in the average cloud radiative effect (CREGhan) between the Yield higher (a, c, d) and Yield lower (b, d, h) with respect to the CTRL simulation. This is shown for NorESM (a, b), EC-Earth (c, d) and ECHAM (e, f).
The rather small global changes in CREGhan for EC-Earth are somewhat surprising since this model had the strongest response for the DREGhan. However, investigating the maps of the changes in the CREGhan for EC-Earth in Fig. 8c–d, one can see that the low global responses are caused by a pattern of opposite changes with magnitudes up to 4 W m−2. In the Yield higher simulation, there is a strengthening of the CREGhan close to large BVOC emission regions in the tropics, while over the remote oceans there is a weakening instead. The mirrored response is seen in the Yield lower simulation. Since the SOA production increases (decreases) globally in the Yield higher (Yield lower) simulation, the opposing patterns of CREGhan are not directly related to changes of SOA production. Instead, the changes are related to different effects on the size distribution close to and far away from the BVOC sources as can be seen in Fig. 9 (the areas are shown in Fig. S21). For the Yield higher simulation, close to the sources, the increase in SOA production results in more accumulation mode particles (N100–500), which leads to higher CCN concentrations and a stronger CREGhan. Over the remote regions there is also an increase in accumulation mode particles, but this is accompanied by a larger decrease in particle concentrations in the Aitken mode (N20–N60). Since the aerosol concentrations are low in EC-Earth, in particular in these remote regions, the particles in the Aitken mode can also be activated as CCN because reduced competition effects give higher maximum supersaturation during cloud droplet activation. As a result, the CCN concentrations in these remote regions decrease when the SOA formation increases. This leads to a weakening of the CREGhan (positive values). The changes in the Yield lower mirror those in the Yield higher simulation.
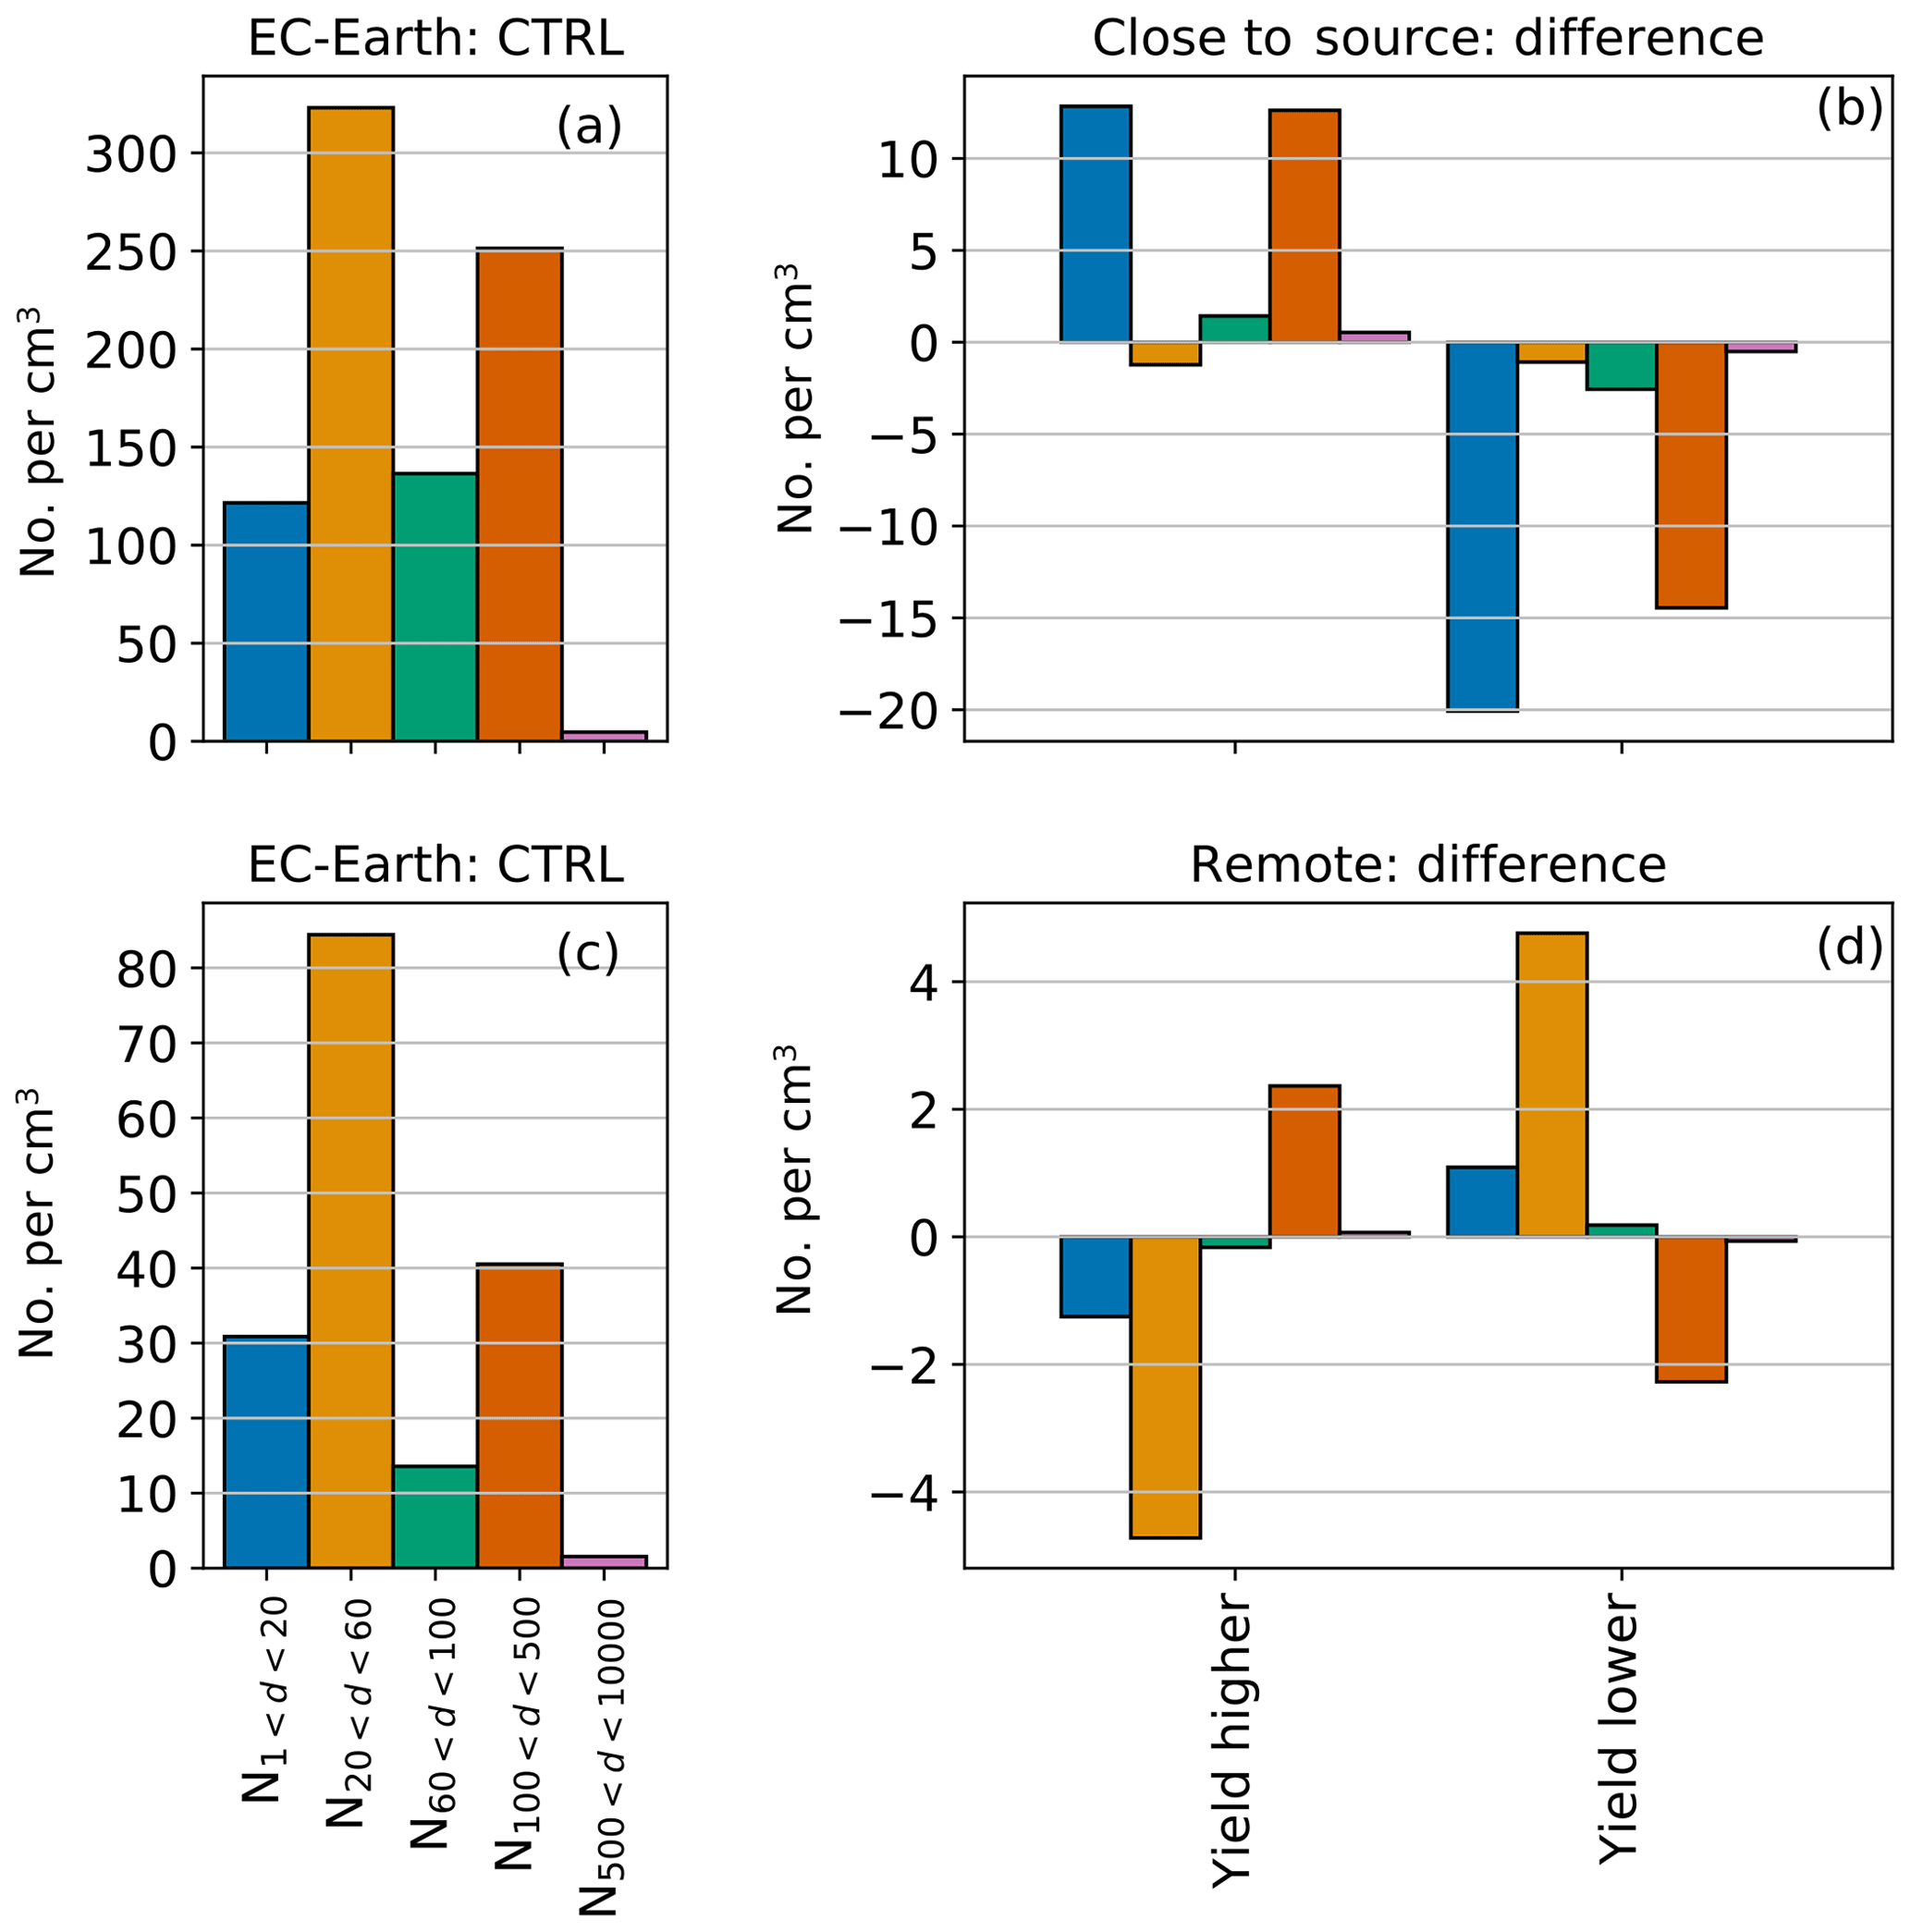
Figure 9Bar plots of the number concentration of particles of selected sizes ranges for EC-Earth, close to and far away from the sources. In panels (a) and (c) the number concentrations from the CTRL simulations are shown. In panels (b) and (d) the differences between the sensitivity simulations and the CTRL simulations are shown for each size bin. Note that there are different scales used for the different regions. The areas defined as close and remote are based on changes in CCN concentrations (positive or negative) at 1 % supersaturation. These areas can be seen in Fig. S21.
3.3 No ELVOCs
In this second section of results from the sensitivity simulations the results from the No ELVOCs simulation are presented. This simulation is different from the other simulations since only the type of SOA precursor is changed and not the quantity of precursors.
3.3.1 Direct aerosol effects
In terms of the direct effects, the global changes are small in all three models. For NorESM, there is a small but statistically significant strengthening of the DREGhan, but the other two models do not display significant changes (see Fig. 5). The change in NorESM can be explained by changes in aerosol number concentrations over and downwind of the Amazon. Since there are no ELVOCs contributing to nucleation in this simulation, the NPF is reduced and with this the number concentration of smaller particles. This decrease is particularly strong over the Amazon since the MT emissions are very high here (see Fig. 1b) and ELVOCs can only be produced from MTs in NorESM. The strong decrease in small particles and increased vapours available for condensation (L/SVOCs) in this region means that more particles can grow to sizes where they act as efficient scatterers of solar radiation. This effect over the Amazon in NorESM is big enough to affect the global DREGhan.
NorESM produces a large number of particles close to the BVOC emissions sources and, since the model does not contain a nucleation mode, these particles are introduced into the Aitken mode. The nucleated particles thus reach larger sizes closer to the sources than in the other two models, where the particles are introduced into a nucleation mode and shifted to the Aitken mode at a later time step while they are transported. This could be part of the explanation of why the BVOC effects in NorESM, in general, are located closer to the sources than in EC-Earth. Moreover, in comparison to NorESM, EC-Earth has lower oxidant concentrations close to the large BVOC sources (not shown), which limits the SOA production in these regions and increases the amount of BVOC transported away from the sources. Hence, the overall effect is more widespread than in NorESM.
3.3.2 Indirect aerosol effects
For the indirect aerosol effects, EC-Earth is the only model that has significant changes for this simulation. The CREGhan is weakened (less negative) by 0.44 W m−2 as can be seen in Fig. 7. This strong change in the CREGhan is caused by a more or less strong worldwide decrease in the aerosol number concentration at almost all sizes (except particles above 500 nm). This results in a reduction of CCN which leads to a weakened CREGhan. This strong decrease in CCN in EC-Earth occurs since the nucleation rates involving ELVOCs are calculated from a product of the H2SO4 and ELVOC concentrations (see Table 1). Thus, the removal of ELVOCs in this simulation removes all the BL NPF in EC-Earth. The other two models instead calculate the nucleation rates as the sum of H2SO4 and ELVOC concentrations and thus retain BL NPF from H2SO4. This results in quite different spatial patterns of the reduction in total aerosol number concentrations in the different models. For NorESM and ECHAM, the reductions occur close to the BVOC sources. For EC-Earth, on the other hand, the reductions are largest over regions that have large anthropogenic SO2 emissions such as Europe, North America and Australia (not shown). This widespread reduction in CCN in combination with EC-Earth having low aerosol concentrations (which makes the clouds more sensitive to aerosol perturbations, Spracklen and Rap, 2013) results in a significant weakening of the CREGhan in this simulation.
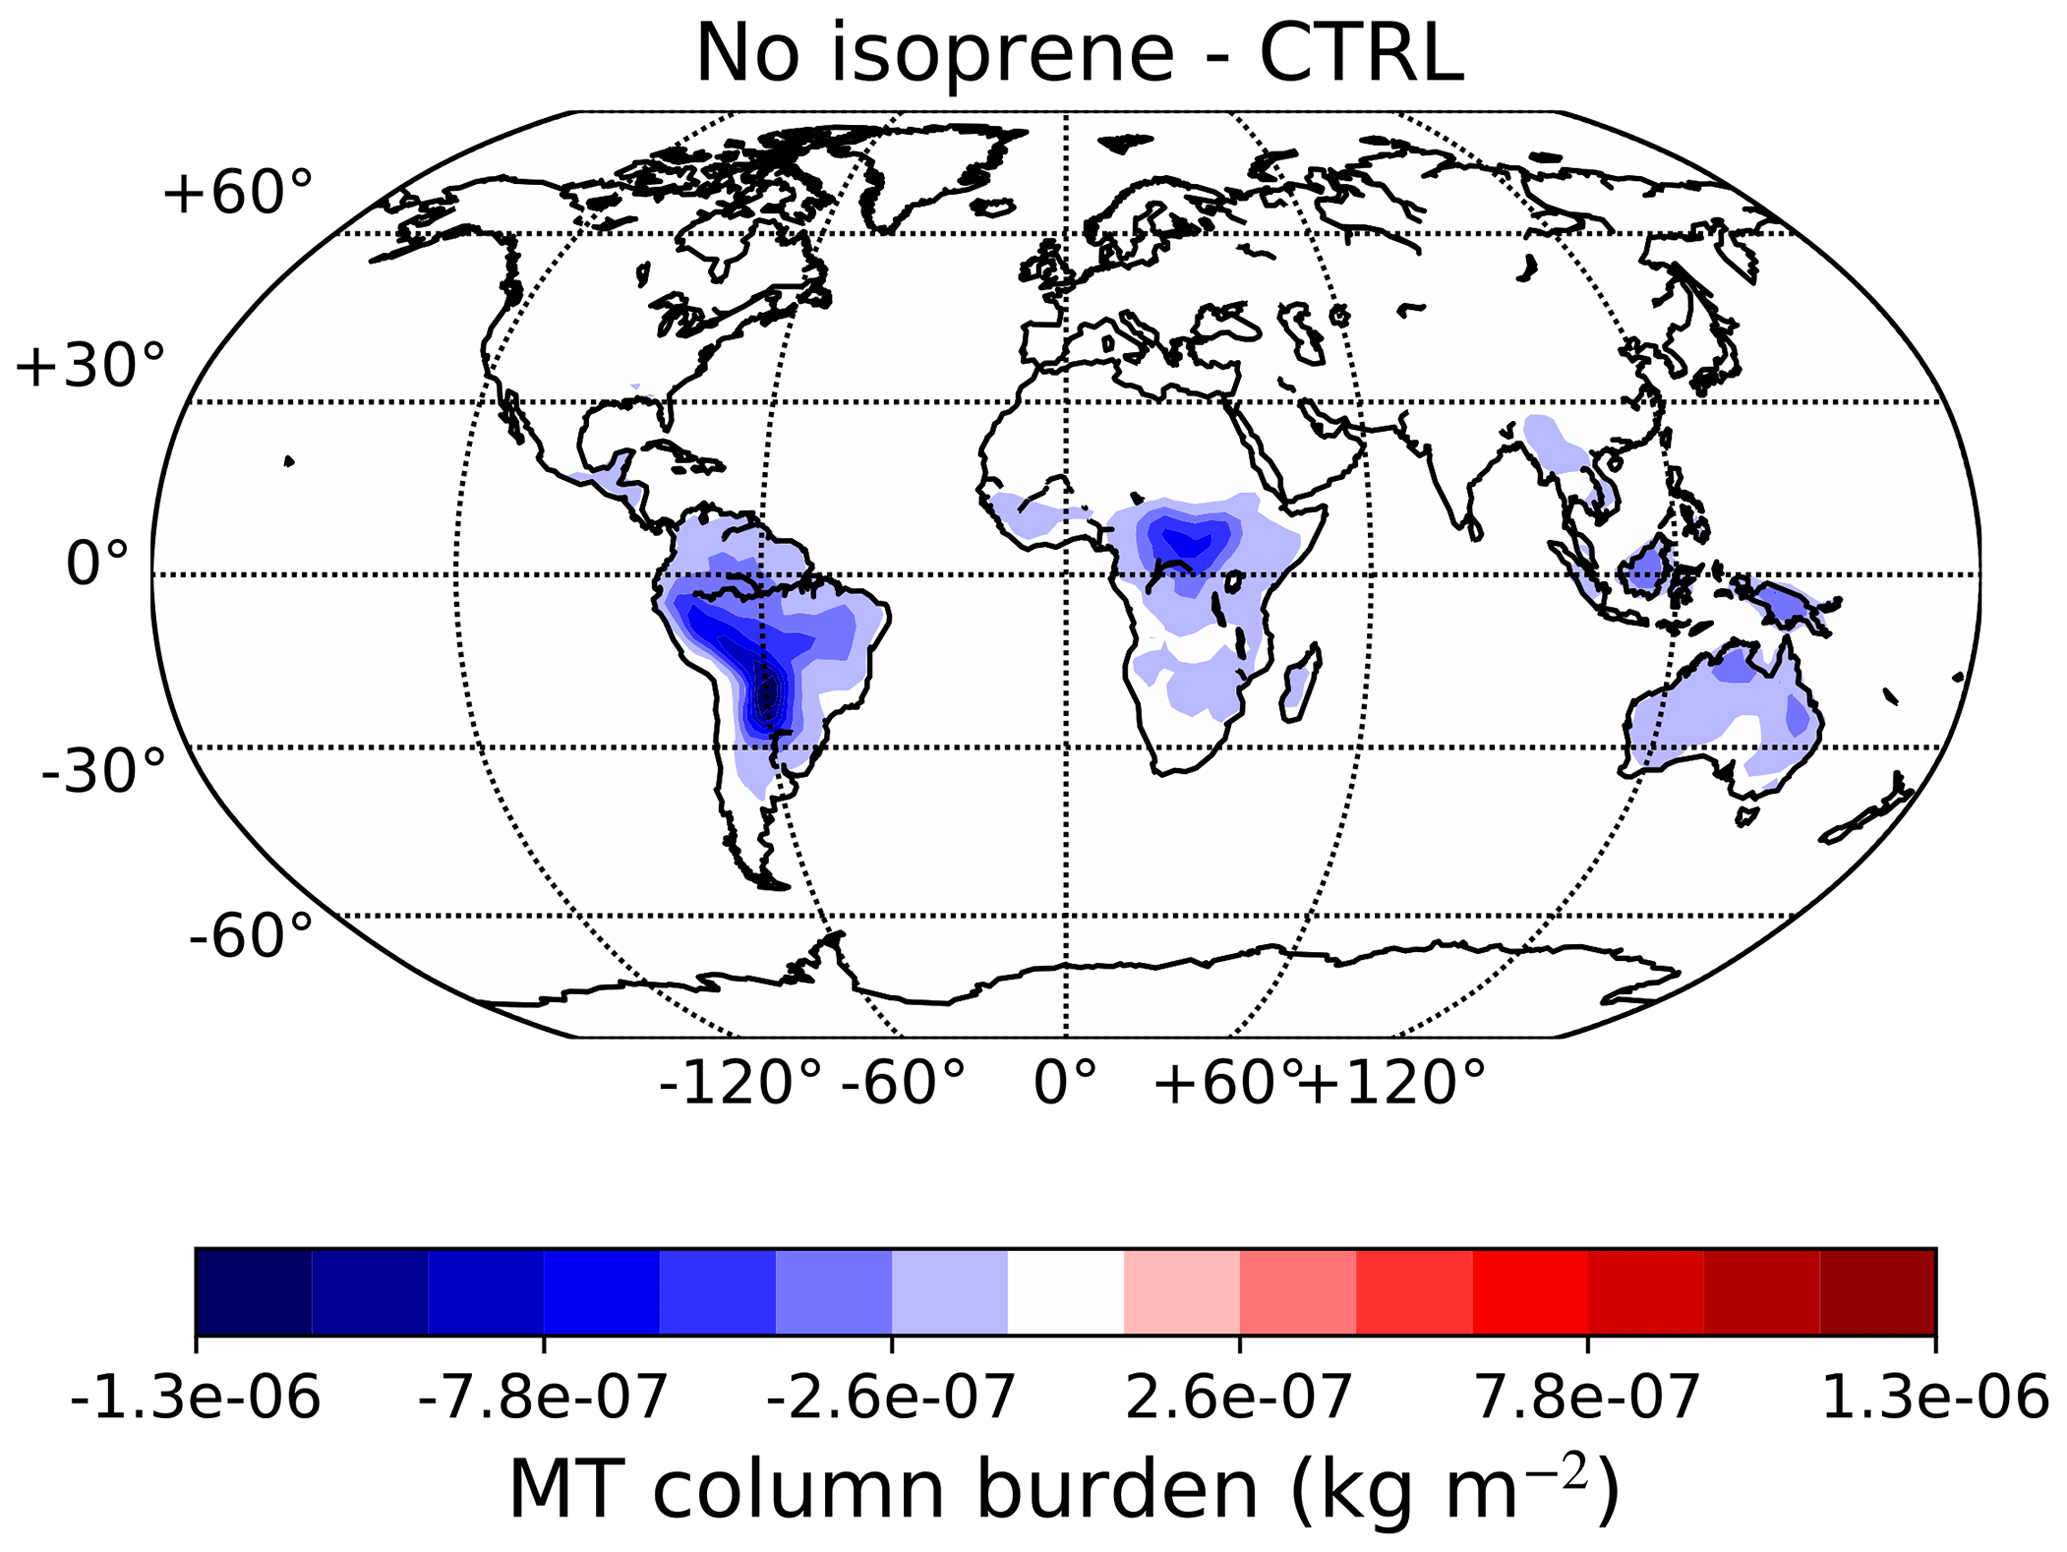
Figure 10Map of the difference in the average MT column burden between the No isoprene and CTRL simulations for EC-Earth.
ECHAM has no significant change in the CREGhan when the ELVOCs are removed. As for the first two experiments, the changes in the particle concentrations in the accumulation mode are small (Fig. 4). ECHAM, unlike the other models, experiences an increase in nucleation mode particles in this simulation. This is somewhat unexpected since removal of ELVOCs is expected to result in a decrease in NPF. However, this simulation shows that the nucleation rate parameterisation in ECHAM is not very sensitive to ELVOC concentrations. Nevertheless, the growth of the newly formed particles is highly dependent on the ELVOC concentrations and, since the particles do not grow to larger sizes, more particles remain in the nucleation mode. This results in increasing the concentration in the nucleation mode and decreasing number concentrations at larger sizes.
3.4 No isoprene and No MTs
In this last result section the No isoprene and No MTs simulations will be shown and discussed.
3.4.1 Direct aerosol effects
The DREGhan is reduced (less negative) in all models in both these simulations since the SOA formation goes down when the BVOC emissions are reduced. The strongest effects on the DREGhan are seen in EC-Earth with approximately 0.15 W m−2 changes for the No isoprene and No MTs simulations (Fig. 5). The reductions in DREGhan for NorESM are about twice as large as those for ECHAM for the No MTs simulation. Moreover, both NorESM and ECHAM have almost an order of magnitude smaller decreases than in EC-Earth. In NorESM and ECHAM the changes in DREGhan are located fairly close to the sources, while in EC-Earth they have a larger geographical spread (Fig. S15). This is the main cause for the large changes in the global DREGhan in EC-Earth. The decrease in DREGhan is explained by a reduction in the concentration of particles relevant for scattering (diameters above 100 nm).
The difference in SOA production between these cases reflects the proportion of SOA originating from isoprene and MTs, respectively. NorESM and ECHAM have the largest reductions in the No isoprene case, indicating that isoprene is the dominant SOA precursor, while EC-Earth has the largest reduction in the No MTs simulation, indicating MTs are the dominant precursors. The difference in dominating precursors in the different models is mainly a result of different yields. The EC-Earth isoprene yields are 1 % (ELVOCs + L/SVOCs), 15 times lower than for MTs, while in NorESM and ECHAM the isoprene yield is 5 %, 3 times smaller than for MTs.
In the No isoprene simulation we also see an interesting feature connected to the interactive gas-phase chemistry in EC-Earth. Over large emission regions in the tropics, the column burden of MTs decreases when we remove the isoprene emissions; see Fig. 10. The decrease in the MT column burden is caused by a greater availability of OH when there is no isoprene present. The concentration of O3 is reduced since the oxidation of isoprene results in the production of O3. However, the loss rate of MT to O3 oxidation is less important than OH, and thus the overall result is a reduction in column burden. This occurs only in EC-Earth due to the interactive chemistry in TM5. This does not increase the amount of SOA formed from MTs, but it affects where this SOA is formed, causing formation of SOA to occur closer to the sources. Additionally it favours the L/SVOCs over ELVOCs (see Table 2) because oxidation with OH will dominate more over reactions with O3, and MT oxidation with O3 has a higher ELVOC yield (5 %) than with OH (1 %).
3.4.2 Indirect aerosol effects
The No isoprene simulation displays the largest and also the most divergent results out of all simulations for the indirect aerosol effects. NorESM has a weakened CREGhan by 0.53 W m−2, while EC-Earth has a strengthened CREGhan by −0.82 W m−2. These numbers show that there is a substantial impact on the CREGhan from the isoprene emissions in NorESM and EC-Earth. The magnitude of these numbers is in the range of and larger than the best estimate of the IPCC (2013) ERFaci relative to 1750 of −0.55 W m−2. ECHAM, on the other hand, experiences a non-significant change in CREGhan; see Fig. 7. Interestingly, all three models show a somewhat similar change in the size distribution as can be seen in Fig. 4. Isoprene mainly produces L/SVOCs in the models, and the removal of isoprene therefore leads to a shift in the particle size distribution towards smaller particles. For ECHAM, the aerosol concentration changes at CCN relevant sizes are very small and the clouds are virtually unaffected by this change. NorESM, on the other hand, experiences a quite large decrease in accumulation mode particles, which results in a decrease in CCN and weakening of the CREGhan. EC-Earth also experiences a decrease in particles above 100 nm. Moreover, the Aitken mode in EC-Earth has a large absolute increase. This is due to more NPF when the condensation and coagulation sink decreases (more on this in the next section). Since the aerosol number concentrations in EC-Earth are so low, even aerosol particles in the Aitken mode can be activated as CCN and the increase in Aitken mode particles leads to increased CCN concentrations. This results in a strengthening of the CREGhan, in particular over the oceans (Fig. S20). Thus, similar changes in the size distribution lead to vastly different responses in the three models depending on aerosol number concentrations and different size distribution dynamics.
For the No MTs simulation, EC-Earth and NorESM have a weakened CREGhan, while ECHAM experiences no significant change in the CREGhan. The MT oxidation is the main source for ELVOCs in all three models (the only source in NorESM). It was therefore expected that turning off the emission of MTs would reduce the number of small particles in the models. However, this behaviour is only seen in EC-Earth where the global mean particle number concentration decreases at all sizes globally (see Fig. 4). For NorESM, the number of small particles instead increases while the number of larger particles decreases (due to less condensational growth of the particles), indicating that the loss of L/SVOCs (condensation) from MTs is more important than the loss of ELVOCs (NPF) for the size in this model. In ECHAM the number of nucleation mode particles increases and the number of larger particles decreases, which reduces the sink for small nuclei. Similarly to the No ELVOCs simulation, the reduction in ELVOCs leads to limited growth of the nucleation mode particles and therefore an increase in this mode. However, the changes in ECHAM are again very small and do not affect the clouds. Both NorESM and EC-Earth experience a decrease in CCN and therefore a weakened CREGhan. The global CREGhan response in EC-Earth in this simulation is, as for the simulations with changed yields, a result of compensating opposite patterns of CREGhan close to (weakening) and far away (strengthening) from the sources.
3.5 Further discussion and implications
The introduction of particles from NPF should in theory and in the models be dependent on the interplay between available vapours for nucleation, condensation losses of these vapours and loss of newly formed particles due to coagulation. Adequately parameterising these processes is a challenge, and the balance between them varies between the models and also sometimes between regions in the same model. Regional variation is seen in EC-Earth where the NPF response varies depending on the distance from the sources, even if both regions experience the same sign in SOA production change. If we take the Yields lower experiment as an example, close to the sources, the decrease in VOCs leads to a reduction in both larger particles and NPF (Fig. 9). In remote regions, on the other hand, the coagulation sink for newly formed particles is reduced because of a reduction in larger particles. This increases the probability of NPF particles surviving to larger sizes. Thus, even though the total aerosol mass is decreased, the mass is partitioned to smaller sizes and the total number concentration is increased. Finally, since EC-Earth generally has low particle number concentrations in these regions, even these smaller particles are activated to form cloud droplets and produce a negative CRE. A similar effect can be seen in the No isoprene case for EC-Earth where we also see a strong negative CREGhan associated with an increase in number concentrations (in spite of a decrease in total mass); see Figs. 7 and 6.
The above example for EC-Earth raises a more general point: the relationship between SOA production and CCN and aerosols relevant for radiation is highly non-linear. If ELVOCs are important for NPF and early growth, then an increase in ELVOCs could lead to more particles formed but also less condensate to grow the existing particles to climate relevant sizes (CCN, direct radiation effects). On the other hand, if H2SO4 is driving the NPF, SOA might be more important through changing the coagulation sink for NPF; more SOA could lead to less NPF and the effect on CCN will depend on the particles that are left. Thus, NPF does not necessarily lead to higher CCN concentrations.
Another factor of importance to NPF impact on the size distribution is the size at which new particles are added to the aerosol scheme. In EC-Earth and ECHAM, the particle growth and survival to 3 nm (ECHAM) and 5 nm (EC-Earth) are parameterised separately and then the particles are added to the nucleation mode. The size at which these particles are added makes a difference for the transferal of particles to the Aitken mode: in EC-Earth the added particles at 5 nm are already above the number median diameter of the mode, and thus some of these will always be transferred to the Aitken mode. In ECHAM, on the other hand, the addition of newly formed particles to the nucleation mode will decrease the number median diameter of the mode and can even decrease the number of particles that are transferred to Aitken mode. If NPF is continuously high, the particles can thus even be inhibited to grow to larger sizes. How much the radii of modes are allowed to change in combination with adding the particles at different sizes could be part of the explanation of why EC-Earth and ECHAM show such different changes in aerosol size distributions even though both models use the M7 aerosol module. NorESM also has a separate parameterisation for the growth and survival of the NPF particles up to a radius of 23 nm when the particles are added to the tracer for NPF. This growth occurs in one time step of the model (30 min). Hence, the particles grow very rapidly and reach Aitken mode sizes close to the sources.
This investigation shows that interactive oxidants can play an important role in determining, in particular, where the SOA formation occurs. The reduction in MT column burden over tropical forests when isoprene is removed illustrates that using interactive oxidants may limit the SOA formation in certain regions. This shifts the SOA formation further downstream from the sources, which results in more widespread climatic effects from BVOCs. Moreover, the results from the No isoprene experiment in the EC-Earth model show that there can be feedback mechanisms through interactive oxidants that affect SOA formation. In general, the removal of isoprene results in less formation of O3 since its production is linked to the oxidation of isoprene. The reduction in O3 means there is less O3 available for SOA formation, which can lead to a further reduction in SOA production. Nevertheless, in the No isoprene experiment the removal of isoprene also leads to a higher availability of OH for the oxidation of monoterpenes, which then is oxidised closer to the sources. This results in an increase in SVOC formation from monoterpenes. In summary, changes in emissions can feed back to SOA formation both through effects on the oxidation capacity of the atmosphere and through changing the balance between the oxidants and thus the total SOA production due to different yields for different oxidants.
There are clearly large differences in the aerosol size distributions and how the changes in these sensitivity experiments affect the size distributions in the models. This is in spite of quite similar simplified treatments of SOA formation in the three models. Our findings show that the location of the SOA mass in the size distribution is critical for CCN concentrations, which agree with the results in Riipinen et al. (2011). The present study implies that further model development and evaluation is needed in terms of how new particle and SOA formation affect the size distribution. However, there are still large uncertainties in how these models should behave with regards to these processes (Glasius and Goldstein, 2016; Riipinen et al., 2011).
However, there are also other uncertainties and limitations with regards to the SOA processes in these models. One such limitation in the models in this study is the assumption that L/SVOCs are condensing irreversibly on pre-existing aerosol particles. More realistic parameterisations of this process, such as volatility basis set parameterisations, are starting to make their way into global climate models (Tsigaridis and Kanakidou, 2018). However, the gain from introducing a number of additional tracers required in such parameterisations need to be balanced against the increased computational expense to become readily used in ESMs. Another limitation is the lack of anthropogenic SOA in the models, as currently all anthropogenic emissions are treated as primary emissions. Anthropogenic impact on SOA formation through gas-phase chemistry, e.g. NOx impact on yields, is also not included in these models at this point. Impacts from vegetation on the organic aerosol budget through primary biological organic aerosols are also missing in this study. The treatment of organic aerosol in ESMs is currently in rapid development. Model evaluation against observations is an important tool in this development work, though it is out of the scope of this article.
Over the past years, more and more studies have investigated the BVOC climate impact from pre-industrial to present day (Heald and Geddes, 2016; Scott et al., 2017; Unger, 2014) and also into the future, including possible BVOC climate feedbacks (Sporre et al., 2019; Makkonen et al., 2012; Scott et al., 2018; Paasonen et al., 2013). The results regarding the BVOC impact on climate have a large spread among the different studies. This study indicates that at least parts of these differences could be related to varying sensitivity to BVOC and SOA changes in the models used in the different studies. The decrease in isoprene emissions since 1850 has been estimated to be approximately 15 % (Scott et al., 2017; Unger, 2014), and in this study the removal of all isoprene emissions leads to a change in the total aerosol radiative effect by 0.62 W m−2 in NorESM and −0.67 W m−2 in EC-Earth, which is a 1.29 W m−2 difference. Hence, assuming the changes in radiative effects are not too far from linear, the decrease in isoprene emissions since pre-industrial would introduce an uncertainty in the aerosol forcing of an order of magnitude of 0.19 W m−2 using these models. This sensitivity study reveals that NorESM, EC-Earth and ECHAM would produce very different results if used to investigate the climatic impacts of BVOCs.
The impact of BVOC emission and SOA formation on particle size distribution, cloud properties and radiative effects has been compared among three ESMs: NorESM, EC-Earth and ECHAM. In five different sensitivity studies, the effect of changed yields of BVOC oxidation, volatility of the oxidised BVOCs and contribution of precursor gases has been investigated.
We found that both the direct and indirect aerosol effects in the models are substantially affected by changes in SOA precursor yields and BVOC emissions. The DREGhan is strengthened (by up to 0.15 W m−2) by more SOA and vice versa. Even though the changes in DREGhan have the expected sign of the response to changes in SOA production in all three models and simulations, the sensitivity of the DREGhan to SOA production changes varies between the models. This is connected to how much of the SOA production changes affect the parts of the modelled size distributions where the particles act most efficiently as scatterers of solar radiation. The results from this study show that EC-Earth is the model with most widespread changes of the accumulation- and coarse-mode particles, and hence largest sensitivity of DREGhan. ECHAM is least sensitive here since the SOA changes mostly affect the small particles and are relatively small.
The changes in the CREGhan are stronger (up to −0.82 W m−2) than for the DREGhan and more complex. The CREGhan changes do not necessarily follow the SOA changes and can be of different sign for different models and even different regions in the same model. Again, size distribution dynamics are crucial for understanding the sensitivity of the cloud properties and CREGhan in the models. Also for the CREGhan, ECHAM is the least sensitive model. Overall, the small effects on the size distributions at CCN-relevant sizes in this model means that the clouds in ECHAM are virtually unaffected by the sensitivity simulations. The clouds in NorESM are quite strongly affected by the sensitivity simulations, mainly because of shifts in the size distribution. These shifts are mainly a result of changes in condensational growth, and thus the condensation of L/SVOCs is very important for the climate impact of BVOCs in NorESM. EC-Earth is the most sensitive model out of the three models also for the cloud effects. This results from a combination of a size distribution quite sensitive to NPF in combination with low aerosol number concentrations in EC-Earth, which makes the clouds sensitive to aerosol perturbations. Moreover, the NPF in EC-Earth is more sensitive to the ELVOC concentrations than the other models since the BL nucleation rate is calculated from the product of the H2SO4 and ELVOC concentrations, while the other two models used the sum of the concentrations (see Table 1).
We can conclude that the BVOC treatment in the ESMs is of importance and can introduce substantial uncertainties in aerosol climate effects and forcing. There is need for more development and testing of these parameterisations in ESMs with respect to how the NPF parameterisations affect the size distributions.
The temporally averaged model output from the six simulations used in the paper from all three models is available here: https://doi.org/10.11582/2020.00032 (Sporre, 2020). The monthly data will be shared upon request. The reason for not supplying and storing all the data online is the large size of the entire dataset.
The supplement related to this article is available online at: https://doi.org/10.5194/acp-20-8953-2020-supplement.
MKS performed the model simulations with NorESM. MKS and SMB did the data analysis and wrote the article. RS performed the model simulations with EC-Earth and wrote parts of the paper. RM performed the model simulations with ECHAM and wrote parts of the paper. IHHK provided support during the setup NorESM. TvN, TB and DO co-developed the EC-Earth version used during the study and provided support for the EC-Earth simulations. MKS, SMB, RS, RM, IHKK and TKB contributed with discussions regarding the experimental design and data analysis. All contributors have contributed to the discussions regarding the article.
The authors declare that they have no conflict of interest.
The research leading to these results has received funding from the European Union's Seventh Framework Programme (FP7/2007-2013) project BACCHUS under grant agreement no. 603445. This work was supported by LATICE, a strategic research area funded by the Faculty of Mathematics and Natural Sciences at the University of Oslo. This work has been financed by the Research Council of Norway (RCN) through the NOTUR/Norstore project NN9485K (biogenic aerosols and climate feedbacks). Inger H. H. Karset has been financed by the Research Council of Norway through the project EVA and the NOTUR/Norstore projects (Sigma2 account: nn2345k, Norstore account: NS2345K). Twan van Noije and Tommi Bergman received funding from the European Union's Horizon 2020 research and innovation programme project CRESCENDO under grant agreement no. 641816.
This paper was edited by Kostas Tsigaridis and reviewed by three anonymous referees.
Abdul-Razzak, H. and Ghan, S. J.: A parameterization of aerosol activation: 2. Multiple aerosol types, J. Geophys. Res.-Atmos,, 105, 6837–6844, https://doi.org/10.1029/1999JD901161, 2000. a, b, c, d, e, f
Albrecht, B. A.: Aerosols, Cloud Microphysics, and Fractional Cloudiness, Science, 245, 1227–1230, https://doi.org/10.1126/science.245.4923.1227, 1989. a
Arneth, A., Niinemets, Ü., Pressley, S., Bäck, J., Hari, P., Karl, T., Noe, S., Prentice, I. C., Serça, D., Hickler, T., Wolf, A., and Smith, B.: Process-based estimates of terrestrial ecosystem isoprene emissions: incorporating the effects of a direct CO2-isoprene interaction, Atmos. Chem. Phys., 7, 31–53, https://doi.org/10.5194/acp-7-31-2007, 2007. a
Bentsen, M., Bethke, I., Debernard, J. B., Iversen, T., Kirkevåg, A., Seland, Ø., Drange, H., Roelandt, C., Seierstad, I. A., Hoose, C., and Kristjánsson, J. E.: The Norwegian Earth System Model, NorESM1-M – Part 1: Description and basic evaluation of the physical climate, Geosci. Model Dev., 6, 687–720, https://doi.org/10.5194/gmd-6-687-2013, 2013. a
Bonan, G.: Ecological Climatology, Cambridge University Press, 3rd Edn., 2016. a
Carlton, A. G., Pinder, R. W., Bhave, P. V., and Pouliot, G. A.: To What Extent Can Biogenic SOA be Controlled?, Environ. Sci. Technol., 44, 3376–3380, https://doi.org/10.1021/es903506b, 2010. a
Carslaw, K. S., Boucher, O., Spracklen, D. V., Mann, G. W., Rae, J. G. L., Woodward, S., and Kulmala, M.: A review of natural aerosol interactions and feedbacks within the Earth system, Atmos. Chem. Phys., 10, 1701–1737, https://doi.org/10.5194/acp-10-1701-2010, 2010. a
Charlson, R. J., Langner, J., and Rodhe, H.: Sulphate aerosol and climate, Nature, 348, p. 22, https://doi.org/10.1038/348022a0, 1990. a
Dee, D. P., Uppala, S. M., Simmons, A. J., Berrisford, P., Poli, P., Kobayashi, S., Andrae, U., Balmaseda, M. A., Balsamo, G., Bauer, P., Bechtold, P., Beljaars, A. C. M., van de Berg, L., Bidlot, J., Bormann, N., Delsol, C., Dragani, R., Fuentes, M., Geer, A. J., Haimberger, L., Healy, S. B., Hersbach, H., Hólm, E. V., Isaksen, L., Kållberg, P., Köhler, M., Matricardi, M., McNally, A. P., Monge‐Sanz, B. M., Morcrette, J., Park, B., Peubey, C., de Rosnay, P., Tavolato, C., Thépaut, J., and Vitart, F.: The ERA‐Interim reanalysis: configuration and performance of the data assimilation system, Q. J. Roy. Meteor. Soc., 137, 553–597, https://doi.org/10.1002/qj.828, 2011. a
Donahue, N. M., Robinson, A. L., Stanier, C. O., and Pandis, S. N.: Coupled Partitioning, Dilution, and Chemical Aging of Semivolatile Organics, Environ. Sci. Technol., 40, 2635–2643, https://doi.org/10.1021/es052297c, 2006. a
Donahue, N. M., Epstein, S. A., Pandis, S. N., and Robinson, A. L.: A two-dimensional volatility basis set: 1. organic-aerosol mixing thermodynamics, Atmos. Chem. Phys., 11, 3303–3318, https://doi.org/10.5194/acp-11-3303-2011, 2011. a
Dunne, E. M., Gordon, H., Kürten, A., Almeida, J., Duplissy, J., Williamson, C., Ortega, I. K., Pringle, K. J., Adamov, A., Baltensperger, U., Barmet, P., Benduhn, F., Bianchi, F., Breitenlechner, M., Clarke, A., Curtius, J., Dommen, J., Donahue, N. M., Ehrhart, S., Flagan, R. C., Franchin, A., Guida, R., Hakala, J., Hansel, A., Heinritzi, M., Jokinen, T., Kangasluoma, J., Kirkby, J., Kulmala, M., Kupc, A., Lawler, M. J., Lehtipalo, K., Makhmutov, V., Mann, G., Mathot, S., Merikanto, J., Miettinen, P., Nenes, A., Onnela, A., Rap, A., Reddington, C. L. S., Riccobono, F., Richards, N. A. D., Rissanen, M. P., Rondo, L., Sarnela, N., Schobesberger, S., Sengupta, K., Simon, M., Sipilä, M., Smith, J. N., Stozkhov, Y., Tomé, A., Tröstl, J., Wagner, P. E., Wimmer, D., Winkler, P. M., Worsnop, D. R., and Carslaw, K. S.: Global atmospheric particle formation from CERN CLOUD measurements, Science, 354, 1119–1124, https://doi.org/10.1126/science.aaf2649, 2016. a
Ehn, M., Thornton, J. A., Kleist, E., Sipilä, M., Junninen, H., Pullinen, I., Springer, M., Rubach, F., Tillmann, R., Lee, B., Lopez-Hilfiker, F., Andres, S., Acir, I.-H., Rissanen, M., Jokinen, T., Schobesberger, S., Kangasluoma, J., Kontkanen, J., Nieminen, T., Kurtén, T., Nielsen, L. B., Jørgensen, S., Kjaergaard, H. G., Canagaratna, M., Maso, M. D., Berndt, T., Petäjä, T., Wahner, A., Kerminen, V.-M., Kulmala, M., Worsnop, D. R., Wildt, J., and Mentel, T. F.: A large source of low-volatility secondary organic aerosol, Nature, 506, 476–479, https://doi.org/10.1038/nature13032, 2014. a
Gettelman, A. and Morrison, H.: Advanced Two-Moment Bulk Microphysics for Global Models. Part I: Off-Line Tests and Comparison with Other Schemes, J. Climate, 28, 1268–1287, https://doi.org/10.1175/JCLI-D-14-00102.1, 2015. a
Ghan, S. J.: Technical Note: Estimating aerosol effects on cloud radiative forcing, Atmos. Chem. Phys., 13, 9971–9974, https://doi.org/10.5194/acp-13-9971-2013, 2013. a
Glasius, M. and Goldstein, A. H.: Recent Discoveries and Future Challenges in Atmospheric Organic Chemistry, Environ. Sci. Technol., 50, 2754–2764, https://doi.org/10.1021/acs.est.5b05105, 2016. a, b, c, d
Glasius, M., Hansen, A. M. K., Claeys, M., Henzing, J. S., Jedynska, A. D., Kasper-Giebl, A., Kistler, M., Kristensen, K., Martinsson, J., Maenhaut, W., Nøjgaard, J. K., Spindler, G., Stenström, K. E., Swietlicki, E., Szidat, S., Simpson, D., and Yttri, K. E.: Composition and sources of carbonaceous aerosols in Northern Europe during winter, Atmos. Environ., 173, 127–141, https://doi.org/10.1016/j.atmosenv.2017.11.005, 2018. a
Gordon, H., Sengupta, K., Rap, A., Duplissy, J., Frege, C., Williamson, C., Heinritzi, M., Simon, M., Yan, C., Almeida, J., Tröstl, J., Nieminen, T., Ortega, I. K., Wagner, R., Dunne, E. M., Adamov, A., Amorim, A., Bernhammer, A.-K., Bianchi, F., Breitenlechner, M., Brilke, S., Chen, X., Craven, J. S., Dias, A., Ehrhart, S., Fischer, L., Flagan, R. C., Franchin, A., Fuchs, C., Guida, R., Hakala, J., Hoyle, C. R., Jokinen, T., Junninen, H., Kangasluoma, J., Kim, J., Kirkby, J., Krapf, M., Kürten, A., Laaksonen, A., Lehtipalo, K., Makhmutov, V., Mathot, S., Molteni, U., Monks, S. A., Onnela, A., Peräkylä, O., Piel, F., Petäjä, T., Praplan, A. P., Pringle, K. J., Richards, N. A. D., Rissanen, M. P., Rondo, L., Sarnela, N., Schobesberger, S., Scott, C. E., Seinfeld, J. H., Sharma, S., Sipilä, M., Steiner, G., Stozhkov, Y., Stratmann, F., Tomé, A., Virtanen, A., Vogel, A. L., Wagner, A. C., Wagner, P. E., Weingartner, E., Wimmer, D., Winkler, P. M., Ye, P., Zhang, X., Hansel, A., Dommen, J., Donahue, N. M., Worsnop, D. R., Baltensperger, U., Kulmala, M., Curtius, J., and Carslaw, K. S.: Reduced anthropogenic aerosol radiative forcing caused by biogenic new particle formation, P. Natl. Acad. Sci. USA, 113, 12053–12058, https://doi.org/10.1073/pnas.1602360113, 2016. a
Gordon, H., Kirkby, J., Baltensperger, U., Bianchi, F., Breitenlechner, M., Curtius, J., Dias, A., Dommen, J., Donahue, N. M., Dunne, E. M., Duplissy, J., Ehrhart, S., Flagan, R. C., Frege, C., Fuchs, C., Hansel, A., Hoyle, C. R., Kulmala, M., Kürten, A., Lehtipalo, K., Makhmutov, V., Molteni, U., Rissanen, M. P., Stozkhov, Y., Tröstl, J., Tsagkogeorgas, G., Wagner, R., Williamson, C., Wimmer, D., Winkler, P. M., Yan, C., and Carslaw, K. S.: Causes and importance of new particle formation in the present-day and pre-industrial atmospheres, J. Geophys. Res.-Atmos., 122, 8739–8760, https://doi.org/10.1002/2017JD026844, 2017. a
Guenther, A. B., Jiang, X., Heald, C. L., Sakulyanontvittaya, T., Duhl, T., Emmons, L. K., and Wang, X.: The Model of Emissions of Gases and Aerosols from Nature version 2.1 (MEGAN2.1): an extended and updated framework for modeling biogenic emissions, Geosci. Model Dev., 5, 1471–1492, https://doi.org/10.5194/gmd-5-1471-2012, 2012. a, b, c, d
Hallquist, M., Wenger, J. C., Baltensperger, U., Rudich, Y., Simpson, D., Claeys, M., Dommen, J., Donahue, N. M., George, C., Goldstein, A. H., Hamilton, J. F., Herrmann, H., Hoffmann, T., Iinuma, Y., Jang, M., Jenkin, M. E., Jimenez, J. L., Kiendler-Scharr, A., Maenhaut, W., McFiggans, G., Mentel, Th. F., Monod, A., Prévôt, A. S. H., Seinfeld, J. H., Surratt, J. D., Szmigielski, R., and Wildt, J.: The formation, properties and impact of secondary organic aerosol: current and emerging issues, Atmos. Chem. Phys., 9, 5155–5236, https://doi.org/10.5194/acp-9-5155-2009, 2009. a
Hantson, S., Knorr, W., Schurgers, G., Pugh, T. A., and Arneth, A.: Global isoprene and monoterpene emissions under changing climate, vegetation, CO2 and land use, Atmos. Environ., 155, 35–45, https://doi.org/10.1016/j.atmosenv.2017.02.010, 2017. a, b
Hazeleger, W., Wang, X., Severijns, C., Ştefănescu, S., Bintanja, R., Sterl, A., Wyser, K., Semmler, T., Yang, S., van den Hurk, B., van Noije, T., van der Linden, E., and van der Wiel, K.: EC-Earth V2.2: description and validation of a new seamless earth system prediction model, Clim. Dynam., 39, 2611–2629, https://doi.org/10.1007/s00382-011-1228-5, 2012. a
Heald, C. L. and Geddes, J. A.: The impact of historical land use change from 1850 to 2000 on secondary particulate matter and ozone, Atmos. Chem. Phys., 16, 14997–15010, https://doi.org/10.5194/acp-16-14997-2016, 2016. a
Heald, C. L. and Spracklen, D. V.: Land Use Change Impacts on Air Quality and Climate, Chem. Rev., 115, 4476–4496, https://doi.org/10.1021/cr500446g, 2015. a
IPCC: Summary for Policymakers, in: Climate Change 2013: The Physical Science Basis. Contribution of Working Group I to the Fifth Assessment Report of the Intergovernmental Panel on Climate Change, edited by: Stocker, T. F., Qin, D., Plattner, G.-K., Tignor, M., Allen, S. K., Boschung, J., Nauels, A., Xia, Y., Bex, V., and Midgley, P. M., Cambridge University Press, Cambridge, United Kingdom and New York, NY, USA, 2013. a, b
Iversen, T., Bentsen, M., Bethke, I., Debernard, J. B., Kirkevåg, A., Seland, Ø., Drange, H., Kristjansson, J. E., Medhaug, I., Sand, M., and Seierstad, I. A.: The Norwegian Earth System Model, NorESM1-M – Part 2: Climate response and scenario projections, Geosci. Model Dev., 6, 389–415, https://doi.org/10.5194/gmd-6-389-2013, 2013. a
Jokinen, T., Berndt, T., Makkonen, R., Kerminen, V.-M., Junninen, H., Paasonen, P., Stratmann, F., Herrmann, H., Guenther, A. B., Worsnop, D. R., Kulmala, M., Ehn, M., and Sipilä, M.: Production of extremely low volatile organic compounds from biogenic emissions: Measured yields and atmospheric implications, P. Natl. Acad. Sci. USA, 112, 7123–7128, https://doi.org/10.1073/pnas.1423977112, 2015. a, b, c, d, e, f, g
Kanakidou, M., Tsigaridis, K., Dentener, F. J., and Crutzen, P. J.: Human-activity-enhanced formation of organic aerosols by biogenic hydrocarbon oxidation, J. Geophys. Res.-Atmos., 105, 9243–9354, https://doi.org/10.1029/1999JD901148, 2000. a
Karset, I. H. H., Berntsen, T. K., Storelvmo, T., Alterskjær, K., Grini, A., Olivié, D., Kirkevåg, A., Seland, Ø., Iversen, T., and Schulz, M.: Strong impacts on aerosol indirect effects from historical oxidant changes, Atmos. Chem. Phys., 18, 7669–7690, https://doi.org/10.5194/acp-18-7669-2018, 2018. a
Kelly, J. M., Doherty, R. M., O'Connor, F. M., and Mann, G. W.: The impact of biogenic, anthropogenic, and biomass burning volatile organic compound emissions on regional and seasonal variations in secondary organic aerosol, Atmos. Chem. Phys., 18, 7393–7422, https://doi.org/10.5194/acp-18-7393-2018, 2018. a
Kerminen, V. M. and Kulmala, M.: Analytical formulae connecting the “real” and the “apparent” nucleation rate and the nuclei number concentration for atmospheric nucleation events, J. Aerosol Sci., 33, 609–622, https://doi.org/10.1016/S0021-8502(01)00194-X, 2002. a, b
Kirkby, J., Duplissy, J., Sengupta, K., Frege, C., Gordon, H. Williamson, C., Heinritzi, M., Simon, M., Yan, C., Almeida, J., Tröstl, J., Nieminen, Ortega, T., Wagner, R., Adamov, A., Amorim, A., Bernhammer, A., Bianchi, F., Breitenlechner, M., Brilke, S., Chen, X., Craven, J., Dias, A., Ehrhart, S., Flagan, R. C., Franchin, A., Fuchs, C., Guida, R., Hakala, J., Hoyle, C. R., Jokinen, T., Junninen, H. Kangasluoma, J., Kim, J., Krapf, M. Kürten, A., Laaksonen, A., Lehtipalo, K., Makhmutov, V., Mathot, S., Molteni, U., Onnela, A., Peräkylä, O., Piel, F., Petäjä, T., Praplan, A. P., Pringle, K., Rap, A., Richards, N., Riipinen, I., Rissanen, M. P., Rondo, L., Sarnela, N., Schobesberger, S., Scott, C., Seinfeld, J. H., Sipilä, M., Steiner, G., Stozhkov, Y., Stratmann, F., Tomé, A., Virtanen, A., Vogel, A., Wagner, A., Wagner, P., Weingartner, E., Wimmer, D., Winkler, P., Ye, P., Zhang, X., Hansel, A., Dommen, J., Donahue, N. M., Worsnop, D., Baltensperger, U., Kulmala, M., Carslaw, K. S., and Curtius, J.: Ion-induced nucleation of pure biogenic particles, Nature, 533, 521–526, https://doi.org/10.1038/nature17953, 2016. a
Kirkevåg, A., Iversen, T., Seland, Ø., Hoose, C., Kristjánsson, J. E., Struthers, H., Ekman, A. M. L., Ghan, S., Griesfeller, J., Nilsson, E. D., and Schulz, M.: Aerosol–climate interactions in the Norwegian Earth System Model – NorESM1-M, Geosci. Model Dev., 6, 207–244, https://doi.org/10.5194/gmd-6-207-2013, 2013. a
Kirkevåg, A., Grini, A., Olivié, D., Seland, Ø., Alterskjær, K., Hummel, M., Karset, I. H. H., Lewinschal, A., Liu, X., Makkonen, R., Bethke, I., Griesfeller, J., Schulz, M., and Iversen, T.: A production-tagged aerosol module for Earth system models, OsloAero5.3 – extensions and updates for CAM5.3-Oslo, Geosci. Model Dev., 11, 3945–3982, https://doi.org/10.5194/gmd-11-3945-2018, 2018. a, b, c, d, e, f, g
Kokkola, H., Hommel, R., Kazil, J., Niemeier, U., Partanen, A.-I., Feichter, J., and Timmreck, C.: Aerosol microphysics modules in the framework of the ECHAM5 climate model – intercomparison under stratospheric conditions, Geosci. Model Dev., 2, 97–112, https://doi.org/10.5194/gmd-2-97-2009, 2009. a
Kooperman, G. J., Pritchard, M. S., Ghan, S. J., Wang, M., Somerville, R. C. J., and Russell, L. M.: Constraining the influence of natural variability to improve estimates of global aerosol indirect effects in a nudged version of the Community Atmosphere Model 5, J. Geophys. Res.-Atmos., 117, 1–16, https://doi.org/10.1029/2012JD018588, 2012. a
Kulmala, M., Nieminen, T., Nikandrova, A., Lehtipalo, K., Manninen, H. E., Kajos, M. K., Kolari, P., Lauri, A., Petäjä, T., Krejci, R., Vesala, T., Kerminen, V. M., Nieminen, T., Kolari, P., Hari, P., Bäck, J., Krejci, R., Hansson, H. C., Swietlicki, E., Lindroth, A., Christensen, T. R., and Arneth, A.: CO2-induced terrestrial climate feedback mechanism: From carbon sink to aerosol source and back, Boreal Environ. Res., 19, 122–131, 2014. a
Lamarque, J.-F., Emmons, L. K., Hess, P. G., Kinnison, D. E., Tilmes, S., Vitt, F., Heald, C. L., Holland, E. A., Lauritzen, P. H., Neu, J., Orlando, J. J., Rasch, P. J., and Tyndall, G. K.: CAM-chem: description and evaluation of interactive atmospheric chemistry in the Community Earth System Model, Geosci. Model Dev., 5, 369–411, https://doi.org/10.5194/gmd-5-369-2012, 2012. a
Lehtinen, K. E., Dal Maso, M., Kulmala, M., and Kerminen, V. M.: Estimating nucleation rates from apparent particle formation rates and vice versa: Revised formulation of the Kerminen-Kulmala equation, J. Aerosol Sci., 38, 988–994, https://doi.org/10.1016/j.jaerosci.2007.06.009, 2007. a
Lin, G., Wan, H., Zhang, K., Qian, Y., and Ghan, S. J.: Can nudging be used to quantify model sensitivities in precipitation and cloud forcing?, J. Adv. Model. Earth Sy., 8, 1073–1091, https://doi.org/10.1002/2016MS000659, 2016. a
Lohmann, U. and Hoose, C.: Sensitivity studies of different aerosol indirect effects in mixed-phase clouds, Atmos. Chem. Phys., 9, 8917–8934, https://doi.org/10.5194/acp-9-8917-2009, 2009. a, b
Makkonen, R., Asmi, A., Kerminen, V.-M., Boy, M., Arneth, A., Guenther, A., and Kulmala, M.: BVOC-aerosol-climate interactions in the global aerosol-climate model ECHAM5.5-HAM2, Atmos. Chem. Phys., 12, 10077–10096, https://doi.org/10.5194/acp-12-10077-2012, 2012. a, b
Makkonen, R., Seland, Ø., Kirkevåg, A., Iversen, T., and Kristjánsson, J. E.: Evaluation of aerosol number concentrations in NorESM with improved nucleation parameterization, Atmos. Chem. Phys., 14, 5127–5152, https://doi.org/10.5194/acp-14-5127-2014, 2014. a, b, c, d
Morrison, H. and Gettelman, A.: A new two-moment bulk stratiform cloud microphysics scheme in the community atmosphere model, version 3 (CAM3). Part I: Description and numerical tests, J. Climate, 21, 3642–3659, https://doi.org/10.1175/2008JCLI2105.1, 2008. a
Neale, R. B., Gettelman, A., Park, S., Chen, C.-c., Lauritzen, P. H., Williamson, D. L., Conley, A. J., Kinnison, D., Marsh, D., Smith, A. K., Vitt, F., Garcia, R., Lamarque, J.-f., Mills, M., Tilmes, S., Morrison, H., Cameron-smith, P., Collins, W. D., Iacono, M. J., Easter, R. C., Liu, X., Ghan, S. J., Rasch, P. J., and Taylor, M. A.: Description of the NCAR Community Atmosphere Model (CAM 5.0), NCAR Technical Notes, Ncar/Tn-464+Str, p. 214, https://doi.org/10.5065/D6N877R0., 2012. a
Oleson, K. W., Lawrence, D. M., Bonan, G. B., Drewniak, B., Huang, M., Koven, C. D., Levis, S., Li, F., Riley, W. J., Subin, Z. M., Swenson, S. C., Thornton, P. E., Bozbiyik, A., Fisher, R., Heald, C. L., Kluzek, E., Lamarque, J.-f., Lawrence, P. J., Leung, L. R., Lipscomb, W., Muszala, S., Ricciuto, D. M., Sacks, W., Sun, Y., Tang, J., and Yang, Z.-L.: Technical description of version 4.0 of the Community Land Model (CLM), NCAR/TN-503+STR NCAR Technical Note, p. 266, available at: http://www.cesm.ucar.edu/models/cesm1.2/clm/CLM45_Tech_Note.pdf (last access: 15 July 2020), 2013. a
Paasonen, P., Nieminen, T., Asmi, E., Manninen, H. E., Petäjä, T., Plass-Dülmer, C., Flentje, H., Birmili, W., Wiedensohler, A., Hõrrak, U., Metzger, A., Hamed, A., Laaksonen, A., Facchini, M. C., Kerminen, V.-M., and Kulmala, M.: On the roles of sulphuric acid and low-volatility organic vapours in the initial steps of atmospheric new particle formation, Atmos. Chem. Phys., 10, 11223–11242, https://doi.org/10.5194/acp-10-11223-2010, 2010. a, b
Paasonen, P., Asmi, A., Petäjä, T., Kajos, M. K., Äijälä, M., Junninen, H., Holst, T., Abbatt, J. P. D., Arneth, A., Birmili, W., van der Gon, H. D., Hamed, A., Hoffer, A., Laakso, L., Laaksonen, A., Richard Leaitch, W., Plass-Dülmer, C., Pryor, S. C., Räisänen, P., Swietlicki, E., Wiedensohler, A., Worsnop, D. R., Kerminen, V.-M., and Kulmala, M.: Warming-induced increase in aerosol number concentration likely to moderate climate change, Nat. Geosci., 6, 438–442, https://doi.org/10.1038/ngeo1800, 2013. a, b
Park, S. and Bretherton, C. S.: The University of Washington Shallow Convection and Moist Turbulence Schemes and Their Impact on Climate Simulations with the Community Atmosphere Model, J. Climate, 22, 3449–3469, https://doi.org/10.1175/2008JCLI2557.1, 2009. a
Riccobono, F., Schobesberger, S., Scott, C. E., Dommen, J., Ortega, I. K., Rondo, L., Almeida, J., Amorim, A., Bianchi, F., Breitenlechner, M., David, A., Downard, A., Dunne, E. M., Duplissy, J., Ehrhart, S., Flagan, R. C., Franchin, A., Hansel, A., Junninen, H., Kajos, M., Keskinen, H., Kupc, A., Kürten, A., Kvashin, A. N., Laaksonen, A., Lehtipalo, K., Makhmutov, V., Mathot, S., Nieminen, T., Onnela, A., Petäjä, T., Praplan, A. P., Santos, F. D., Schallhart, S., Seinfeld, J. H., Sipilä, M., Spracklen, D. V., Stozhkov, Y., Stratmann, F., Tomé, A., Tsagkogeorgas, G., Vaattovaara, P., Viisanen, Y., Vrtala, A., Wagner, P. E., Weingartner, E., Wex, H., Wimmer, D., Carslaw, K. S., Curtius, J., Donahue, N. M., Kirkby, J., Kulmala, M., Worsnop, D. R., and Baltensperger, U.: Oxidation Products of Biogenic Emissions Contribute to Nucleation of Atmospheric Particles, Science, 344, 717–721, https://doi.org/10.1126/science.1243527, 2014. a, b
Riipinen, I., Pierce, J. R., Yli-Juuti, T., Nieminen, T., Häkkinen, S., Ehn, M., Junninen, H., Lehtipalo, K., Petäjä, T., Slowik, J., Chang, R., Shantz, N. C., Abbatt, J., Leaitch, W. R., Kerminen, V.-M., Worsnop, D. R., Pandis, S. N., Donahue, N. M., and Kulmala, M.: Organic condensation: a vital link connecting aerosol formation to cloud condensation nuclei (CCN) concentrations, Atmos. Chem. Phys., 11, 3865–3878, https://doi.org/10.5194/acp-11-3865-2011, 2011. a, b, c
Riipinen, I., Yli-Juuti, T., Pierce, J. R., Petaja, T., Worsnop, D. R., Kulmala, M., and Donahue, N. M.: The contribution of organics to atmospheric nanoparticle growth, Nat. Geosci., 5, 553–458, https://doi.org/10.1038/ngeo1499, 2012. a
Scott, C. E., Monks, S. A., Spracklen, D. V., Arnold, S. R., Forster, P. M., Rap, A., Carslaw, K. S., Chipperfield, M. P., Reddington, C. L. S., and Wilson, C.: Impact on short-lived climate forcers (SLCFs) from a realistic land-use change scenario via changes in biogenic emissions, Faraday Discuss., 200, 101–120, https://doi.org/10.1039/c7fd00028f, 2017. a, b
Scott, C. E., Monks, S. A., Spracklen, D. V., Arnold, S. R., Forster, P. M., Rap, A., Äijälä, M., Artaxo, P., Carslaw, K. S., Chipperfield, M. P., Ehn, M., Gilardoni, S., Heikkinen, L., Kulmala, M., Petäjä, T., Reddington, C. L. S., Rizzo, L. V., Swietlicki, E., Vignati, E., and Wilson, C.: Impact on short-lived climate forcers increases projected warming due to deforestation, Nat. Commun., 9, 157, https://doi.org/10.1038/s41467-017-02412-4, 2018. a, b
Shrivastava, M., Easter, R. C., Liu, X., Zelenyuk, A., Singh, B., Zhang, K., Ma, P. L., Chand, D., Ghan, S., Jimenez, J. L., Zhang, Q., Fast, J., Rasch, P. J., and Tiitta, P.: Global transformation and fate of SOA: Implications of low-volatility SOA and gas-phase fragmentation reactions, J. Geophys. Res.-Atmos., 120, 4169–4195, https://doi.org/10.1002/2014JD022563, 2015. a
Shrivastava, M., Cappa, C. D., Fan, J., Goldstein, A. H., Guenther, A. B., Jimenez, J. L., Kuang, C., Laskin, A., Martin, S. T., Ng, N. L., Petaja, T., Pierce, J. R., Rasch, P. J., Roldin, P., Seinfeld, J. H., Shilling, J., Smith, J. N., Thornton, J. A., Volkamer, R., Wang, J., Worsnop, D. R., Zaveri, R. A., Zelenyuk, A., and Zhang, Q.: Recent advances in understanding secondary organic aerosol: Implications for global climate forcing, Rev. Geophys., 55, 509–559, https://doi.org/10.1002/2016RG000540, 2017. a, b, c, d
Sindelarova, K., Granier, C., Bouarar, I., Guenther, A., Tilmes, S., Stavrakou, T., Müller, J.-F., Kuhn, U., Stefani, P., and Knorr, W.: Global data set of biogenic VOC emissions calculated by the MEGAN model over the last 30 years, Atmos. Chem. Phys., 14, 9317–9341, https://doi.org/10.5194/acp-14-9317-2014, 2014. a, b, c
Sporre, M. K.: Data for: Large difference in aerosol radiative effects from BVOC-SOA treatment in three ESMs, Data set, Norstore, https://doi.org/10.11582/2020.00032, last access: 22 July 2020. a
Sporre, M. K., Blichner, S. M., Karset, I. H. H., Makkonen, R., and Berntsen, T. K.: BVOC–aerosol–climate feedbacks investigated using NorESM, Atmos. Chem. Phys., 19, 4763–4782, https://doi.org/10.5194/acp-19-4763-2019, 2019. a, b
Spracklen, D. V. and Rap, A.: Natural aerosol–climate feedbacks suppressed by anthropogenic aerosol, Geophys. Res. Lett., 40, 5316–5319, https://doi.org/10.1002/2013GL057966, 2013. a
Spracklen, D. V., Carslaw, K. S., Kulmala, M., Kerminen, V.-M., Mann, G. W., and Sihto, S.-L.: The contribution of boundary layer nucleation events to total particle concentrations on regional and global scales, Atmos. Chem. Phys., 6, 5631–5648, https://doi.org/10.5194/acp-6-5631-2006, 2006. a
Spracklen, D. V., Jimenez, J. L., Carslaw, K. S., Worsnop, D. R., Evans, M. J., Mann, G. W., Zhang, Q., Canagaratna, M. R., Allan, J., Coe, H., McFiggans, G., Rap, A., and Forster, P.: Aerosol mass spectrometer constraint on the global secondary organic aerosol budget, Atmos. Chem. Phys., 11, 12109–12136, https://doi.org/10.5194/acp-11-12109-2011, 2011. a
Stier, P., Feichter, J., Kinne, S., Kloster, S., Vignati, E., Wilson, J., Ganzeveld, L., Tegen, I., Werner, M., Balkanski, Y., Schulz, M., Boucher, O., Minikin, A., and Petzold, A.: The aerosol-climate model ECHAM5-HAM, Atmos. Chem. Phys., 5, 1125–1156, https://doi.org/10.5194/acp-5-1125-2005, 2005. a
Tröstl, J., Chuang, W. K., Gordon, H., Heinritzi, M., Yan, C., Molteni, U., Ahlm, L., Frege, C., Bianchi, F., Wagner, R., Simon, M., Lehtipalo, K., Williamson, C., Craven, J. S., Duplissy, J., Adamov, A., Almeida, J., Bernhammer, A.-K., Breitenlechner, M., Brilke, S., Dias, A., Ehrhart, S., Flagan, R. C., Franchin, A., Fuchs, C., Guida, R., Gysel, M., Hansel, A., Hoyle, C. R., Jokinen, T., Junninen, H., Kangasluoma, J., Keskinen, H., Kim, J., Krapf, M., Kürten, A., Laaksonen, A., Lawler, M., Leiminger, M., Mathot, S., Möhler, O., Nieminen, T., Onnela, A., Petäjä, T., Piel, F. M., Miettinen, P., Rissanen, M. P., Rondo, L., Sarnela, N., Schobesberger, S., Sengupta, K., Sipilä, M., Smith, J. N., Steiner, G., Tomè, A., Virtanen, A., Wagner, A. C., Weingartner, E., Wimmer, D., Winkler, P. M., Ye, P., Carslaw, K. S., Curtius, J., Dommen, J., Kirkby, J., Kulmala, M., Riipinen, I., Worsnop, D. R., Donahue, N. M., and Baltensperger, U.: The role of low-volatility organic compounds in initial particle growth in the atmosphere, Nature, 533, 527–531, https://doi.org/10.1038/nature18271, 2016. a
Tsigaridis, K. and Kanakidou, M.: The Present and Future of Secondary Organic Aerosol Direct Forcing on Climate, Current Climate Change Reports, 4, 1–15, https://doi.org/10.1007/s40641-018-0092-3, 2018. a
Tsigaridis, K., Daskalakis, N., Kanakidou, M., Adams, P. J., Artaxo, P., Bahadur, R., Balkanski, Y., Bauer, S. E., Bellouin, N., Benedetti, A., Bergman, T., Berntsen, T. K., Beukes, J. P., Bian, H., Carslaw, K. S., Chin, M., Curci, G., Diehl, T., Easter, R. C., Ghan, S. J., Gong, S. L., Hodzic, A., Hoyle, C. R., Iversen, T., Jathar, S., Jimenez, J. L., Kaiser, J. W., Kirkevåg, A., Koch, D., Kokkola, H., Lee, Y. H., Lin, G., Liu, X., Luo, G., Ma, X., Mann, G. W., Mihalopoulos, N., Morcrette, J.-J., Müller, J.-F., Myhre, G., Myriokefalitakis, S., Ng, N. L., O'Donnell, D., Penner, J. E., Pozzoli, L., Pringle, K. J., Russell, L. M., Schulz, M., Sciare, J., Seland, Ø., Shindell, D. T., Sillman, S., Skeie, R. B., Spracklen, D., Stavrakou, T., Steenrod, S. D., Takemura, T., Tiitta, P., Tilmes, S., Tost, H., van Noije, T., van Zyl, P. G., von Salzen, K., Yu, F., Wang, Z., Wang, Z., Zaveri, R. A., Zhang, H., Zhang, K., Zhang, Q., and Zhang, X.: The AeroCom evaluation and intercomparison of organic aerosol in global models, Atmos. Chem. Phys., 14, 10845–10895, https://doi.org/10.5194/acp-14-10845-2014, 2014. a, b, c, d, e, f
Twomey, S.: Pollution and the Planetary Albedo, Atmos. Environ., 8, 1251–1256, 1974. a
Unger, N.: On the role of plant volatiles in anthropogenic global climate change, Geophys. Res. Lett., 41, 8563–8569, https://doi.org/10.1002/2014GL061616, 2014. a, b
van Noije, T. P. C., Le Sager, P., Segers, A. J., van Velthoven, P. F. J., Krol, M. C., Hazeleger, W., Williams, A. G., and Chambers, S. D.: Simulation of tropospheric chemistry and aerosols with the climate model EC-Earth, Geosci. Model Dev., 7, 2435–2475, https://doi.org/10.5194/gmd-7-2435-2014, 2014. a, b
Vehkamäki, H., Kulmala, M., Napari, I., Lehtinen, K. E. J., Timmreck, C., Noppel, M., and Laaksonen, A.: An improved parameterization for sulfuric acid–water nucleation rates for tropospheric and stratospheric conditions, J. Geophys. Res., 107, 4622, https://doi.org/10.1029/2002JD002184, 2002. a, b, c, d, e
Vignati, E., Wilson, J., and Stier, P.: M7: An efficient size-resolved aerosol microphysics module for large-scale aerosol transport models, J. Geophys. Res-Atmos., 109, D22202, https://doi.org/10.1029/2003JD004485, 2004. a, b
Williams, J. E., Strunk, A., Huijnen, V., and van Weele, M.: The application of the Modified Band Approach for the calculation of on-line photodissociation rate constants in TM5: implications for oxidative capacity, Geosci. Model Dev., 5, 15–35, https://doi.org/10.5194/gmd-5-15-2012, 2012. a
Williams, J. E., Boersma, K. F., Le Sager, P., and Verstraeten, W. W.: The high-resolution version of TM5-MP for optimized satellite retrievals: description and validation, Geosci. Model Dev., 10, 721–750, https://doi.org/10.5194/gmd-10-721-2017, 2017. a, b
Yu, F.: A secondary organic aerosol formation model considering successive oxidation aging and kinetic condensation of organic compounds: global scale implications, Atmos. Chem. Phys., 11, 1083–1099, https://doi.org/10.5194/acp-11-1083-2011, 2011. a
Zhang, G. J. and McFarlane, N. A.: Sensitivity of climate simulations to the parameterization of cumulus convection in the Canadian climate centre general circulation model, Atmos.-Ocean, 33, 407–446, https://doi.org/10.1080/07055900.1995.9649539, 1995. a
Zhang, K., O'Donnell, D., Kazil, J., Stier, P., Kinne, S., Lohmann, U., Ferrachat, S., Croft, B., Quaas, J., Wan, H., Rast, S., and Feichter, J.: The global aerosol-climate model ECHAM-HAM, version 2: sensitivity to improvements in process representations, Atmos. Chem. Phys., 12, 8911–8949, https://doi.org/10.5194/acp-12-8911-2012, 2012. a
Zhang, Q., Jimenez, J. L., Canagaratna, M. R., Allan, J. D., Coe, H., Ulbrich, I., Alfarra, M. R., Takami, A., Middlebrook, A. M., Sun, Y. L., Dzepina, K., Dunlea, E., Docherty, K., DeCarlo, P. F., Salcedo, D., Onasch, T., Jayne, J. T., Miyoshi, T., Shimono, A., Hatakeyama, S., Takegawa, N., Kondo, Y., Schneider, J., Drewnick, F., Borrmann, S., Weimer, S., Demerjian, K., Williams, P., Bower, K., Bahreini, R., Cottrell, L., Griffin, R. J., Rautiainen, J., Sun, J. Y., Zhang, Y. M., and Worsnop, D. R.: Ubiquity and dominance of oxygenated species in organic aerosols in anthropogenically-influenced Northern Hemisphere midlatitudes, Geophys. Res. Lett., 34, L13801, https://doi.org/10.1029/2007GL029979, 2007. a, b
Zhang, R., Khalizov, A., Wang, L., Hu, M., and Xu, W.: Nucleation and Growth of Nanoparticles in the Atmosphere, Chem. Rev., 112, 1957–2011, https://doi.org/10.1021/cr2001756, 2012. a