the Creative Commons Attribution 4.0 License.
the Creative Commons Attribution 4.0 License.
Modulation of radiative aerosols effects by atmospheric circulation over the Euro-Mediterranean region
Samuel Somot
Christophe Cassou
Marc Mallet
Martine Michou
Dominique Bouniol
Bertrand Decharme
Thomas Drugé
Romain Roehrig
David Saint-Martin
The present work aims at better understanding regional climate–aerosol interactions by studying the relationships between aerosols and synoptic atmospheric circulation over the Euro-Mediterranean region. Two 40-year simulations (1979–2018) have been carried out with version 6.3 of the Centre National de Recherches Météorologiques (National Centre for Meteorological Research) – Aire Limitée Adaptation dynamique Développement InterNational (CNRM-ALADIN) regional climate model, one using interactive aerosols and the other one without any aerosol. The simulation with aerosols has been evaluated in terms of different climate and aerosol parameters. This evaluation shows a good agreement between the model and observations, significant improvements compared to the previous model version and consequently the relevance of using this model for the study of climate–aerosol interactions over this region. A first attempt to explain the climate variability of aerosols is based on the use of the North Atlantic Oscillation (NAO) index. The latter explains a significant part of the interannual variability, notably in winter for the export of dust aerosols over the Atlantic Ocean and the eastern Mediterranean, and in summer for the positive anomalies of anthropogenic aerosols over western Europe. This index is however not sufficient to fully understand the variations of aerosols in this region, notably at daily scale. The use of “weather regimes”, namely persisting meteorological patterns, stable at synoptic scale for a few days, provides a relevant description of atmospheric circulation, which drives the emission, transport and deposition of aerosols. The four weather regimes usually defined in this area in winter and in summer bring significant information to answer this question. The blocking and NAO+ regimes are largely favourable to strong aerosol effects on shortwave surface radiation and near-surface temperature, either because of higher aerosol loads or because of weaker cloud fraction, which reinforces the direct aerosol effect. Inversely, the NAO− and Atlantic Ridge regimes are unfavourable to aerosol radiative effects, because of weaker aerosol concentrations and increased cloud cover. This study thus puts forward the strong dependence of aerosol loads on the synoptic circulation from interannual to daily scales and, as a consequence, the important modulation of the aerosol effects on shortwave surface radiation and near-surface temperature by atmospheric circulation. The role of cloud cover is essential in this modulation as shown by the use of weather regimes.
- Article
(32933 KB) - Full-text XML
-
Supplement
(2809 KB) - BibTeX
- EndNote
In the climate system, atmospheric aerosols exert a strong influence on the radiative budget and clouds (Kaufman et al., 2002). They absorb and scatter radiation (direct effect), but they also interact with cloud microphysics as cloud condensation nuclei (indirect effect). Their numerous and various sources as well as their relatively short lifetime give them a high spatiotemporal variability, notably over the Mediterranean. In this region, aerosols accumulate coming from the industrial and urban sources in Europe, north African towns, biomass burning in eastern Europe, desert sources in the Sahara and directly from the Mediterranean Sea itself (Lelieveld et al., 2002; Basart et al., 2009). Thus, aerosols have strong impacts on the European and Mediterranean regional climate insofar as they can, for example, modify the radiative budget (Spyrou et al., 2013; Nabat et al., 2012), surface temperature (Zanis et al., 2012; Nabat et al., 2015a), past climate trends (Zubler et al., 2011; Nabat et al., 2014; Boé et al., 2020) and air–sea fluxes (Nabat et al., 2015a). All these effects are generally more important in spring and summer, when maximal aerosol loads are observed. Indeed, the dry season favours a longer residence time for atmospheric aerosols. Besides, dust outbreaks characterized by large plumes of Saharan desert dust particles are more frequent in spring and summer. As a consequence, emissions, transport and deposition are different factors that can explain the high spatiotemporal variability of aerosols in the Mediterranean. For example, the daily variability of shortwave surface radiation and temperature is better represented in climate models when using a prognostic representation of dust aerosols (Nabat et al., 2015b).
Nevertheless, the latter is also partly due to variations in atmospheric conditions. For example, Moulin et al. (1998) have shown that the location of the main low- and high-pressure systems drives the dust outbreaks occurring over the Mediterranean basin. In spring, Sharav cyclones over Algeria and Libya (Alpert and Ziv, 1989) are responsible for strong dust storms and an induced southwesterly flow bringing dust loads over the eastern Mediterranean. Then from June, the settling of a high-pressure system over Libya keeps the lows over the western Sahara, moving the flow to southerly and the dust loads to the central Mediterranean (Israelevich et al., 2012; Marinou et al., 2017). During summer, these dust outbreaks are moving to the western basin, because of cyclogenesis phenomena over the Iberian Peninsula (Schepanski et al., 2016). In addition, the formation of Mediterranean cyclones could also affect dust transport over the eastern Mediterranean in autumn and winter (Flaounas et al., 2015; Georgoulias et al., 2016). Regarding sea-salt particles, high loads are notably triggered by strong local winds such as mistrals and tramontanes (Despiau et al., 1996), themselves favoured during northwesterly flows over western Europe. In this study, the objective is to establish more systematically the relationships between atmospheric conditions and aerosol loads over the Euro-Mediterranean area from yearly to daily timescales.
Previous studies have used climate indices such as the North Atlantic Oscillation (NAO) to characterize aerosol variability over the Mediterranean. Moulin et al. (1997) and Papadimas et al. (2008) have found a positive correlation between the NAO index and Mediterranean aerosol optical depth (AOD) retrieved by satellite instruments, respectively, MeteoSat and the MODerate resolution Imaging Spectroradiometer (MODIS). A positive phase of the NAO generally leads to drier conditions over the Mediterranean, thus favouring high AOD over this region. The negative phase has the opposite effects. Between 2000 and 2006, Papadimas et al. (2008) have therefore related the decrease in Mediterranean AOD to a decrease in the NAO index during the same period. However, using model output, Ginoux et al. (2004) have not confirmed this positive correlation between NAO and Mediterranean AOD but only the positive correlation between NAO and dust export over the Atlantic Ocean.
“Weather regimes” (Vautard, 1990) provide another approach to study the link between aerosols and synoptic atmospheric circulation. They consist in persistent meteorological structures of pressure, wind and temperature that embed synoptic-scale events for a few days. They are generally defined from a statistical method of automated classification, generally based on the sea-level pressure or the 500 hPa geopotential daily anomalies. The weather regime paradigm has the advantage of enhancing the level of predictability of the atmosphere (Cassou, 2008). Weather regimes have been used to explain atmospheric variability at synoptic scale in several processes such as European heat waves (Cassou et al., 2005), extreme precipitation (Sanchez-Gomez et al., 2008), cold extremes in Europe (Cattiaux et al., 2010) and deep water formation in the northwestern Mediterranean Sea (Somot et al., 2018). As aerosols are influenced by atmospheric conditions for emissions (dust and sea salt), transport and deposition, we could expect a strong modulation of aerosol radiative effects by weather regimes. The previous study of Ménégoz et al. (2010) has focused on the interactions between weather regimes and aerosols over the North Atlantic European region, showing that dynamical processes impact the different aerosol burdens. However, this study has used a model in which only three aerosol species were represented (sulfate, black carbon and desert dust) with climatological emissions for dust aerosols. Dust emission is indeed favoured by strong winds over Sahara, and dust transport over the Mediterranean Sea is more frequent in southerly to southwesterly flows over this region, as shown in case studies (Nabat et al., 2015b; Schepanski et al., 2016). Thus, the regime of intense dust episodes in the Mediterranean area has been studied by Gkikas et al. (2013), who have highlighted this strong relationship between synoptic circulation at a daily scale and these dust episodes.
As a matter of fact, the interactions between aerosol loads and atmospheric circulation at synoptic scale are very complex insofar as aerosol loads are strongly affected by meteorological conditions, and meanwhile these meteorological conditions are modified by the radiative and climate impacts of aerosols. Most of climate studies based on regional climate simulations already published only consider these interactions at yearly or seasonal timescales, while the daily timescale would be needed to better understand these interactions. That is the reason why the present work aims at analysing these interactions between atmospheric circulation and aerosols more completely, not only at yearly and monthly timescales using the North Atlantic Oscillation but also at daily timescales using weather regimes. The approach used here relies on the use of a regional climate system model, which enables us to have an explicit representation of the main aerosol types (sulfate, organic matter, black carbon, dust, sea salt, nitrates and ammonium), their different processes (emission, transport, deposition) and their interactions with radiation and clouds in a climate regional model.
2.1 The regional climate model: CNRM-ALADIN63
The present study is realized using the recent version (6.3) of the regional climate model Aire Limitée Adaptation dynamique Développement InterNational (ALADIN), called CNRM-ALADIN63 hereafter. This model is based on a bi-spectral, semi-implicit, semi-Lagrangian advection scheme and is used here in version 6.3 with a horizontal resolution of 50 km and 91 vertical levels as in Drugé et al. (2019). This version is based on cycle 37T1 of ARPEGE-IFS and is very close to the version described in Daniel et al. (2018). All the parameterizations used in CNRM-ALADIN63 are summarized in Table 1, separated between the atmosphere, the surface and the aerosol scheme. Compared to the previous ALADIN generation used in several studies such as Nabat et al. (2014) and Nabat et al. (2015a), most of the atmospheric physics has been revisited (Voldoire et al., 2019). It now includes a convection scheme representing in a unified way dry, shallow and deep convection (PCMT; Piriou et al., 2007; Guérémy, 2011), a moist turbulence scheme based on a prognostic equation of the turbulent kinetic energy (Cuxart et al., 2000) and the large-scale microphysics scheme of Lopez (2002) which describes liquid and ice particles as well as rain and snow using prognostic variables. The shortwave radiation scheme has been updated to six bands (Fouquart and Bonnel, 1980; Morcrette et al., 2008), while the longwave radiation scheme is based on the Rapid Radiative Transfer Model (RRTM; Mlawer et al., 1997).
Nabat et al. (2013)(Slingo, 1989)(Fu, 1996)Sommeria and Deardorff (1977)Bougeault (1981)Ricard and Royer (1993)(Piriou et al., 2007; Guérémy, 2011)(Déqué et al., 1994; Catry et al., 2008)(Lott and Miller, 1997)(Menon et al., 2002; Michou et al., 2020)Lopez (2002)(RRTM; Mlawer et al., 1997)Fouquart and Bonnel, 1980; Morcrette et al., 2008Cuxart et al. (2000)(Le Moigne et al., 2016)(Decharme et al., 2019)(Decharme et al., 2019)(Belamari and Pirani, 2007)Huneeus (2007)Reddy et al. (2005)Morcrette et al. (2009)Marticorena and Bergametti (1995)Kok (2011b)Hauglustaine et al. (2014)Grythe et al. (2014)Tompkins et al. (2005)(Giorgi and Chameides, 1986)(Morcrette et al., 2009)Table 1Summary of the parameterizations used in CNRM-ALADIN63 for atmosphere (ALADIN), surface (Surface Externalisée; SURFEX) and aerosol schemes (TACTIC).
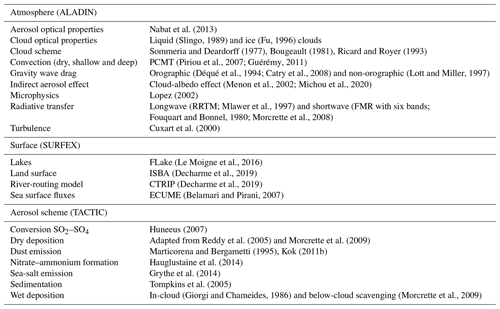
With regards to the surface, CNRM-ALADIN63 uses version 8 of the SURFEX modelling platform (https://www.umr-cnrm.fr/surfex/, last access: 16 July 2020), including notably a tile approach which separates natural land surface, lake and sea areas in the calculation of surface fluxes. The air–sea turbulent fluxes are derived from the ECUME (Exchange Coefficients from Unified Multi-campaigns Estimates) iterative approach (Belamari and Pirani, 2007). The lakes are represented using the bulk FLake model (http://www.flake.igb-berlin.de/, last access: 16 July 2020) which computes the temporal evolution of the vertical lake temperature profile from the surface mixing layer to the bottom. More details of its use in SURFEX can be found in Le Moigne et al. (2016). The land surface is simulated using the Interaction Soil Biosphere Atmosphere – CNRM version of Total Runoff Integrating Pathways (ISBA-CTRIP) coupled land surface modelling system (http://www.umr-cnrm.fr/spip.php?article1092&lang=en, last access: 16 July 2020) described in detail in Decharme et al. (2019). To summarize, the ISBA land surface model computes the energy and water budgets at the surface–atmosphere interface, while the CTRIP river-routing model simulates river discharge to the sea using the total runoff calculated by ISBA. An explicit two-way coupling between ISBA and CTRIP is used to represent (1) river flooding that interacts with the soil and the atmosphere through free-water evaporation, infiltration and precipitation interception and (2) water table into unconfined aquifers and upward capillarity fluxes into the superficial soil. Besides, CNRM-ALADIN63 is now using the XIOS input/output parallel server software (Meurdesoif, 2018), which facilitates the model workflow, especially online postprocessing and the production of output files in full NetCDF format with appropriate attributes, in line with the Climate Model Output Rewriter (CMOR) format (Taylor et al., 2004).
Finally, note that this version called CNRM-ALADIN63 is also used in the Coordinated Downscaling Experiment (CORDEX) framework, notably to contribute to the Euro-CORDEX and Med-CORDEX initiatives, as well as to the associated flagship pilot studies on aerosols and air–sea interactions.
2.2 The aerosol scheme: TACTIC
CNRM-ALADIN63 includes a prognostic aerosol scheme called TACTIC (Tropospheric Aerosols for Climate In CNRM), which originally comes from the GEMS project (Morcrette et al., 2009), and which has been first used in the CNRM climate models in the studies of Michou et al. (2015) and Nabat et al. (2015b), and more recently in Watson et al. (2018) and Michou et al. (2020). In addition to the five main aerosol species (dust, sea salt, sulfate, black carbon and organic matter) initially included, nitrate and ammonium particles have been recently added (Drugé et al., 2019). These aerosols are distributed in 16 prognostic variables, subject to atmospheric processes (emission, transport and deposition). Sea-salt and dust emissions are dynamically calculated online as a function of surface wind as well as soil characteristics for dust particles, while anthropogenic and biomass burning emissions are based on monthly inventories (see the following paragraph on simulations). Compared to the version used in Nabat et al. (2015b), the main changes, described below, are the implementation of a new sea-salt emission parameterization, a revision of the dust emission parameterization and a correction in the treatment of aerosols in the lateral boundary conditions. More details about the other parameters which have not been modified can be found in Michou et al. (2015) and Nabat et al. (2015b), as well as in Drugé et al. (2019) as far as nitrates and ammonium are concerned.
Sea-salt particles are represented with three size bins, whose original respective diameters defined by Morcrette et al. (2009) were 0.03, 0.5, 5 and 20 µm. However, these limits do not correspond to the different processes at stake in the formation of sea-salt particles. Indeed, the smallest particles whose diameter is generally lower than 1 µm are film droplets produced from bubble bursting at the surface. The jet following the void left at the sea surface by the bubble leads to the formation of larger particles, typically between 1 and 10 µm. Besides, even larger particles can be produced in the presence of strong winds when spume is torn off the wave crests. These different sizes of sea-salt particles have already been documented in several studies (O'Dowd et al., 1997; Sayer et al., 2012). Therefore, the size distribution of sea salt has been adapted to these processes, setting the bin limits to 0.01, 1.0, 10.0 and 100.0 µm. The respective optical properties (extinction coefficients, single scattering albedo and asymmetry parameter) have been recalculated following the Mie theory, taking into account the dependence on relative humidity. Following the recommendations of the review paper of Grythe et al. (2014), the so-called G13T parameterization given in this study has been included in TACTIC for the sea-salt emissions of the first two size bins. It has been shown to be the closest to observations compared to other sea-salt emission parameterizations. It also takes into account the observed dependence of sea-salt emissions to the sea surface temperature (Jaeglé et al., 2011). However, it cannot be applied to larger particles, for which the formulation of Andreas (1998) has been chosen.
With regards to dust emission, the parameterization used in TACTIC is based on the studies of Marticorena and Bergametti (1995) for the calculation of the saltation flux, Gillette (1979) for the sandblasting flux, Fécan et al. (1999) for the influence of soil moisture and Kok (2011a) for the particle size distribution of the emitted dust aerosol (vertical flux). These parameterizations are the same as the ones used in Nabat et al. (2015b), except from a few corrections in the calculation of soil textures from the silt, clay and sand contents, and the use of the soil characteristics (roughness length, fraction of bare soil, soil moisture) coming from the SURFEX module (Decharme et al., 2019), instead of the climatological values used in the previous version. Nevertheless, the model configuration does not include interactive vegetation which could impact dust emissions (Pierre et al., 2012).
Finally, note for information that the configuration of CNRM-ALADIN63 including the TACTIC scheme described above can be completed by the coupling of the Mediterranean regional sea, not used in the present study. In this case, this fully coupled regional climate model is called CNRM-RCSM6 (sixth generation of the CNRM Regional Climate System Model for the Mediterranean study), already used in Darmaraki et al. (2019). CNRM-RCSM6 represents at high resolution the main components of the regional water and energy cycles and their interactions.
2.3 Regional climate simulations
Two simulations using CNRM-ALADIN63 have been carried out over the 1979–2018 period, driven by the ERA-Interim reanalysis (Dee et al., 2011) providing atmospheric lateral boundary forcing at 6 h frequency, as well as sea surface temperature and sea ice cover at monthly frequency (linearly interpolated into daily values). The first one, called ALD-AER thereafter, includes interactive aerosols generated by the TACTIC scheme described above and their coupling with radiation and clouds (direct and first indirect aerosol effects). The second one, called ALD-NO thereafter, does not have any aerosols. The comparison between the two simulations is used to estimate the effects of aerosols on regional climate as a function of weather regimes. In both simulations, the historical evolution of greenhouse gases (GHGs) is included following the yearly global averages of Meinshausen et al. (2017) for CO2, N2O, CH4, CFC12 and a CFC11-equivalent species that includes the effects of all the other GHGs of the original data set (39 species). As in the previous version of the model, the total solar irradiance forcing is also taken into account with yearly averages following Matthes et al. (2017). Ozone radiative forcing is included using ozone concentrations coming from historical simulations carried out with the global Earth system model CNRM-ESM2-1 (Séférian et al., 2019). No land use land cover change is taken into account in CNRM-ALADIN63.
A spectral nudging method (Radu et al., 2008) has been included in both simulations in order to better constrain the synoptic chronology of the model's large scales. The nudging is maximal between the top of the model and 700 hPa and nil below 850 hPa (with a linear transition between 700 and 850 hPa). It is applied to wind (vorticity and divergence), humidity, temperature and surface pressure. The intensity of the nudging depends on the variable: 6 h for vorticity, 24 h for temperature, humidity and surface pressure, and 48 h for divergence. These parameters are the same as in the nudging applied in the simulation of Nabat et al. (2015b).
The domain of simulation, shown in Fig. 1, is close to the one used in Nabat et al. (2015b). It is an enlarged Med-CORDEX domain in order to include the main aerosol sources affecting the Mediterranean region. Anthropogenic and biomass burning emissions are based here on the CMIP6 historical inventories provided, respectively, by Hoesly et al. (2018) and van Marle et al. (2017). Since the ERA-Interim forcing used in this study does not have interactive aerosols and the domain is thus large enough to include all the main sources of aerosols affecting the Mediterranean region, no aerosol is included in the lateral boundary conditions used in this study. Besides, the radiative forcing of stratospheric aerosols including the contribution of the main historical volcanic eruptions such as Mt. Pinatubo (1991) is included through the Thomason et al. (2018) data set, providing stratospheric AOD for the 550 nm wavelength.
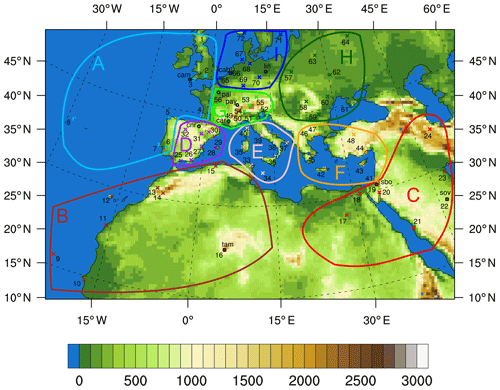
Figure 1Domain and orography (m) used in ALADIN simulations. Aerosol Robotic Network (AERONET) and Baseline Surface Radiation Network (BSRN) stations used in this study have been added with coloured crosses and circles, respectively (see Table 2 for the names of AERONET and BSRN stations), as well as the nine subregions in which they are gathered (A: 1–9, B: 10–18, C: 19–27, D: 28–36, E: 37–45, F: 46–54, G: 55–63, H: 64–72 and I: 73–81).
Before launching the final version of the ALD-AER simulation, the model calibration followed a rather empirical iterative approach using reference observations and 1-year long runs with varying uncertain parameters such as cloud radiative properties (inhomogeneity scaling factors for shortwave and longwave cloud optical thickness). The objective was to better reproduce Mediterranean Sea heat surface budget, which is essential for further coupled ocean–atmosphere simulations. It is worth mentioning that ALD-NO uses the same tuning parameters as ALD-AER. Both simulations start from the ERA-Interim atmosphere and land surface fields after a 10-year spinup.
2.4 Classification in weather regimes
Midlatitude atmospheric circulation can be characterized through the positions of low- and high-pressure quasi-stationary large-scale systems that drive higher-frequency synoptic perturbations and associated winds and rainfall over the North Atlantic region. These structures are relatively stable during several days and influence weather conditions in Europe and the Mediterranean region beyond meteorological timescale. Such persisting conditions in pressure, leading to specific continental-scale wind, temperature and precipitation anomalies are called “weather regimes”. They can be statistically defined using automated classification methods (Vautard, 1990; Cassou et al., 2004).
In the present work, this paradigm has been applied to the ALADIN simulations, based on the daily anomalies of sea-level pressure separately for winter (DJF) and for summer (JJA). These anomalies are classified using a k-means partition algorithm (Michelangeli et al., 1995) in order to get the decomposition of large-scale atmospheric conditions, respectively, for winter and summer. Four weather regimes are consistently retained in our study following earlier literature (e.g. Cassou et al., 2004).
2.5 Observations
In order to evaluate the model performance, different data sets of observations have been used in the present work and are briefly described in the following paragraphs.
2.5.1 Satellite data
Satellite data are essential to evaluate climate simulations given the spatial and temporal scales that they can cover. Regarding aerosols, two instruments are widely used to evaluate aerosol optical depth: the MODerate resolution Imaging Spectroradiometer (MODIS) and the Multiangle Imaging SpectroRadiometer (MISR). The first one is a multi-spectral radiometer providing retrievals of aerosol microphysical and optical properties. From the recently released collection (6.1) from the Terra and Aqua platforms (Sayer et al., 2014), the merged data sets between the standard and deep target algorithms are used in the present study over the 2000–2017 period. This product covers the whole domain of simulation at 1∘ resolution, including the Sahara. MISR, aboard the Terra platform, is also a passive radiometer providing data at four different wavelengths and nine directions, both over land and ocean. Level-3 monthly aerosol optical depths (MIL3MAE) at 0.5∘ resolution are used in this study over the 2000–2017 period.
As far as surface wind is concerned, QuikSCAT data provide satellite observations over the sea at 0.25∘ resolution. The ability of this instrument to retrieve the in situ variability of both wind direction and speed has been shown by Ruti et al. (2007). The high resolution makes it suitable for studies over the Mediterranean (Chronis et al., 2010; Herrmann et al., 2011). The version used here is the level-3 data set, similar to the one used in the previous evaluation of ALADIN carried out in Nabat et al. (2015a).
Observed cloud fraction is documented using observations from the Cloud Aerosol Lidar with Orthogonal Polarization (CALIOP; Winker et al., 2007) lidar aboard CALIPSO and Cloud Profiling Radar (CPR; Im et al., 2005) aboard CloudSat, both flying in tandem in the A-Train constellation combined in the radar–lidar geometrical profile product (Mace and Zhang, 2014). This combination is used in order to benefit from the ability of the CALIOP lidar to detect thin clouds and the CPR in penetrating deeper into opaque clouds as may be encountered in the Euro-Mediterranean area. Because of its increased horizontal resolution (0.33 km for CALIOP against 3.5 km for CPR), several lidar samples are present in a radar profile and the radar lidar product provides then a lidar cloud fraction in each radar bin. For model comparison purposes, a cloud fraction is computed from this observational data set in each ALADIN model grid point as the fraction of the grid covered by a cloud detected in radar geometrical profile where the cloud mask is higher than 20 (corresponding to less than 16 % of false detection) or when the lidar cloud fraction exceeds 10 % in a given bin. These thresholds differ from the values initially proposed and validated by Mace et al. (2009) because of the use of release 05 of the CloudSat GEOPROF products with specific tests performed on our domain. No attempt has been made to identify precipitation. The cloud cover is then computed on an instantaneous basis for three atmospheric layers located below 3.2 km height (low cloud cover), between 3.2 and 6.5 km height (middle cloud cover) and above 6.5 km (high cloud cover). Because of the low repetitivity of the A-Train, the data are accumulated at a monthly timescale. Due to the CPR failure in April 2011 and its partial sampling (daytime only) after 2012, the data sets used in this study are limited to the 2006–2011 period (4.5 years) and originate from CloudSat GEOPROF product release 05.
At the top of the atmosphere (TOA), shortwave (SW) and longwave (LW) radiation is evaluated against the Clouds and the Earth's Radiant Energy System (CERES) – Energy Balanced and Filled (EBAF) data (Loeb et al., 2009), in version 2.8 at 1∘ resolution over the 2000–2016 period. At the surface, the similar CERES-EBAF data set has been used for longwave radiation, but for the evaluation of shortwave radiation, the second edition of the Surface Solar Radiation Data Set – Heliosat (SARAH; Pfeifroth et al., 2017) has been preferred. Indeed, this satellite product is based on the visible channels of the Meteosat Visible and InfraRed Imager (MVIRI) and the Spinning Enhanced Visible and Infrared Imager (SEVIRI) instruments aboard the geostationary Meteosat satellites (Müller et al., 2015), which enables it to have a longer time period (1983–2015) and a finer resolution (0.05∘) than CERES.
2.5.2 Ground-based measurements
Ground-based observations are also used to evaluate the CNRM-ALADIN63 simulations. The Aerosol Robotic Network (AERONET) (Holben et al., 1998) provides measurements of aerosol optical depth from automatic Sun/sky radiometers, with an uncertainty of 0.01 (Eck et al., 1999). For this study, daily average quality-assured data (level 2.0, version 3) have been used from 72 stations (see Table 2) distributed over the whole domain of the simulation (shown in Fig. 1). These stations have been selected because of their temporal period (at least 4 years of data) and their location (in order to have a spatially equally distributed selection). For each of them, AERONET AOD at 550 nm is computed from wavelengths at 440 or 500 nm (depending on availability) and the Ångström exponent at daily frequency. Daily AOD at 550 nm can then be compared to daily AOD averages of ALADIN simulations at the same wavelength.
Table 2List of AERONET and BSRN stations used in this study. Latitudes (in ∘ N), longitudes (in ∘ E), elevations (in metres) and periods of time are given for each station. Stations are gathered in the nine regions (A to I) defined in Fig. 1.
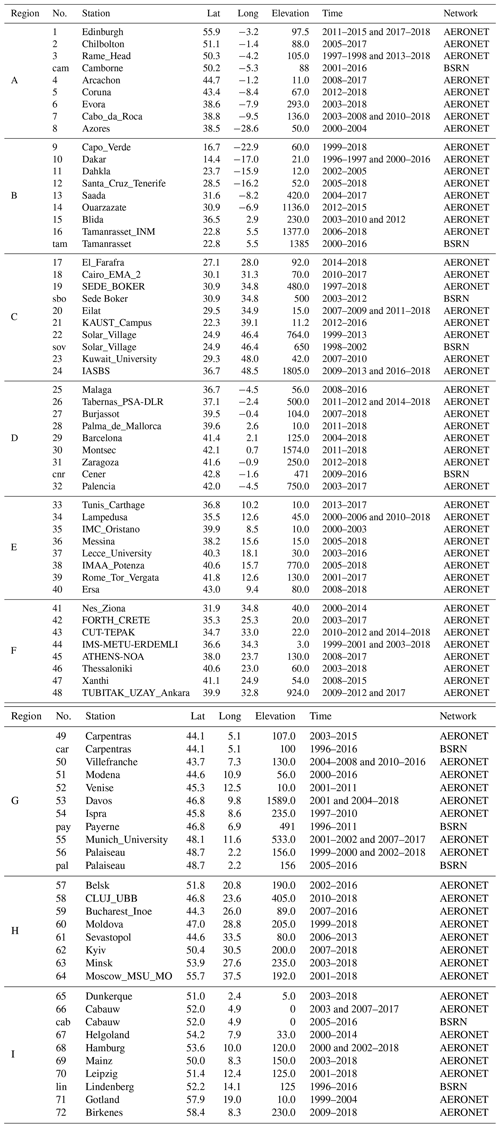
The Baseline Surface Radiation Network (BSRN) provides surface radiation measurements as well as other parameters such as temperature and humidity over different stations around the world. These measurements from 10 stations over Europe and Africa (see Table 2) have been used in this study (shown in Fig. 1). They are known for the quality of their data over long periods of time (Ohmura et al., 1998).
Land near-surface temperature and precipitation are compared to version 4.0 of the Climatic Research Unit (CRU) data set (Harris et al., 2014), provided by the University of East Anglia. This gridded product, whose horizontal resolution is 0.5∘, is based on land weather stations around the world.
Before studying the aerosols and their impact on climate variability, an evaluation of the main simulation ALD-AER is performed in this section in order to ensure the robustness of the subsequent results. Note that the ALD-NO simulation, which is similar to ALD-AER apart from the aerosols (AOD is set to zero in ALD-NO), is not evaluated here, since such a couple of simulations had already been the focus of two previous studies (Nabat et al., 2015a, b).
3.1 Mean climate
Mean climate is first evaluated for different essential parameters of regional climate (pressure, wind, temperature, precipitation, cloud cover and radiation). Figures 2 to 5 present the average biases of ALD-AER against different observation data sets. In parallel, the averages of these biases have been calculated on the six subregions of Europe and the Mediterranean (see Fig. 2a), defined in the frame of the PRUDENCE project (Christensen and Christensen, 2007) and already used in several studies (e.g. Kotlarski et al., 2014). These averages are presented in Tables 3 and 4, together with the equivalent range found in Kotlarski et al. (2014) for the Euro-CORDEX ensemble of regional simulations over Europe for temperature and precipitation. This evaluation of the new version (6.3) of the ALADIN model is also to be compared with a similar work carried out with the previous version (v5) of ALADIN (Sevault et al., 2014; Nabat et al., 2015a, b). In Tables 3 and 4, biases calculated with an ALADIN simulation (1979–2012) carried out with the version (5.3) used in Nabat et al. (2015b) have been added for ease of comparison with the new version 6.3. Note that a preliminary version (6) of ALADIN has been already evaluated over France in Daniel et al. (2018).
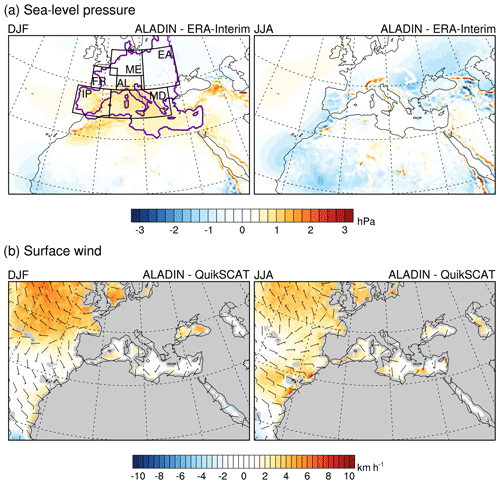
Figure 2Winter (DJF, left) and summer (JJA, right) average differences between ALADIN and ERA-Interim for sea-level pressure (hPa, 1979–2016, a), and between ALADIN and QuikSCAT for surface wind (km h−1, 2000–2009, b). Wind speed representation as in meteorological maps; one wind barb represents 2 km h−1. In the upper left figure, the PRUDENCE boxes (Christensen and Christensen, 2007) used for the evaluation of the model (see Table 3) are shown in black lines; the land domains of Europe and the Mediterranean Sea are shown in purple lines.
Table 3Averaged biases in the ALD-AER simulation (ALD6) in terms of near-surface temperature (in ∘C), precipitation (in %), cloud cover (Cld in %) and sea-level pressure (SLP in hPa) for winter (DJF) and summer (JJA). Corresponding biases for Euro-CORDEX (ECx, minimum/maximum) models (Kotlarski et al., 2014) have been added for temperature and precipitation. The same averages have been added for the previous ALADIN version (ALD5) used in Nabat et al. (2015b). All these biases are calculated over the PRUDENCE boxes, as well as on land domains of Europe and the Mediterranean Sea shown in Fig. 2. NA (not available) indicates domains where the biases could not be evaluated.
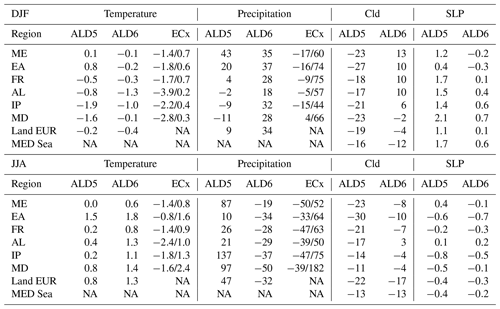
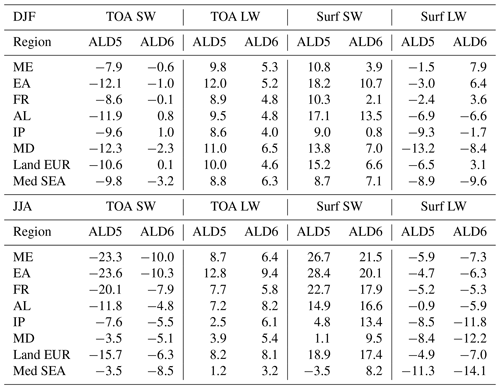
Table 4Averaged biases in radiation (W m−2) in ALD-AER simulation (ALD6). Values are given for shortwave (SW) and longwave (LW) upward radiation at the top of the atmosphere (TOA), as well as for SW and LW downward radiation at the surface. The same averages have been added for the previous ALADIN version (ALD5) used in Nabat et al. (2015b). All these biases are calculated over the PRUDENCE boxes, as well as on land domains of Europe and the Mediterranean Sea shown in Fig. 2.
First of all, an evaluation of atmospheric dynamics is presented in Fig. 2. The comparison with sea-level pressure (Fig. 2a) reveals that ALD-AER is close to ERA-Interim (bias less than 1 hPa in most of the domain both in winter and summer), showing its capacity to reproduce the general circulation pattern over this region. This is eased by the spectral nudging method, but the latter is not applied below 850 hPa. Nevertheless, surface wind (Fig. 2b) is slightly overestimated over the north of the Atlantic Ocean, especially in winter when the bias can reach 5 km h−1 on average.
Figure 3 presents the biases of the ALD-AER simulation in terms of land near-surface temperature, precipitation and cloud cover (total and low fractions) for winter (DJF) and summer (JJA). In winter (DJF), a residual cold bias is noticed in Europe (on average −0.4 ∘C) but significantly reduced compared to version 5 in eastern and southern Europe (see regions EA, MD and IP in Table 3), contrary to the higher grounds (AL). The Euro-CORDEX models analysed in Kotlarski et al. (2014) also have stronger biases than ALD-AER for most of them (see Table 3). This cold bias is a little more pronounced over northern Africa (−0.9 ∘C). Winter precipitation is overestimated in most parts of Europe: +0.6 mm d−1 on average, which represents a bias of 34 %. This overestimation is more important than in the previous ALADIN version. However, this bias is still in line with the bias of other regional climate models from Euro-CORDEX used in Kotlarski et al. (2014). As shown in Table 3, the bias in winter precipitation is included in the range of biases of the other models in all six subregions. Besides, cloud cover is significantly improved in Europe compared to the previous version of the model, as the bias is only −4 % on average (against −19 % in version 5). As in Nabat et al. (2015a), northeastern Europe is affected by an overestimation of cloud cover, which is mainly due to low-level clouds as the bias is similar in low-level cloud fraction (Fig. 3d). On the contrary, cloud cover is underestimated over the Mediterranean Sea (−12 %).
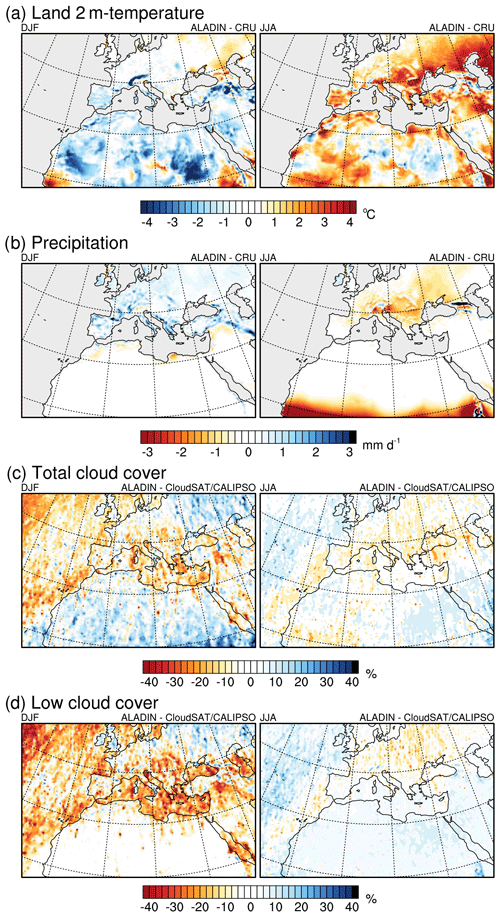
Figure 3Winter (DJF, left) and summer (JJA, right) average differences between ALADIN and observations (CRU and CloudSat/CALIPSO) for 2 m temperature (∘C, 1979–2015, a), precipitation (mm d−1, 1979–2015, b) and cloud cover (%, 2006–2011, total fraction in panel c, low fraction in panel d).
In summer (JJA), Europe is affected by a generalized warm bias (1.3 ∘C on average), which affected above all eastern Europe in the previous version. Compared to Euro-CORDEX models, this bias is in the upper range as several models had on the contrary a cold bias. Over northern Africa, a similar warm bias is noted (0.9 ∘C on average). This warm bias is consistent with an underestimation of cloud cover, especially in western Africa (along the monsoon domain) and in eastern Europe. It is combined with an underestimation of summer precipitation in Europe (−0.6 mm d−1, that is to say −32 %). These errors in summer cloud cover and precipitation are however reduced compared to the previous ALADIN version (see Table 3).
In terms of radiation, Fig. 4 shows the average biases at the TOA of upward SW (Fig. 4a) and LW (Fig. 4b) fluxes against the CERES data. Similar figures in percentage are available in the Supplement (Fig. S1). While in the previous version of ALADIN (Nabat et al., 2015a) SW TOA radiation was affected by a large negative bias (on average −10.6 W m−2 over land in Europe and −9.8 W m−2 over the Mediterranean Sea), it is better represented in winter in the present version (less than 1 W m−2 for the average DJF bias in Europe and −3.2 W m−2 for the Mediterranean Sea). In summer, the bias over Europe is also reduced (−6.3 instead of −15.7 W m−2 on average) but the Atlantic Ocean is affected by a large positive bias, likely due to the overestimation of cloud cover in this area. With regards to LW radiation, as in the previous version of ALADIN, the bias at the TOA is slightly positive and uniform with an improvement in winter (+4.6 instead of +10.0 W m−2 on average in Europe) and no significant change in summer (see Table 4). Both for SW and LW radiation at the TOA, the weak remaining bias over Europe and the Mediterranean represents less than 5 % of the total upward radiation (Fig. S1).
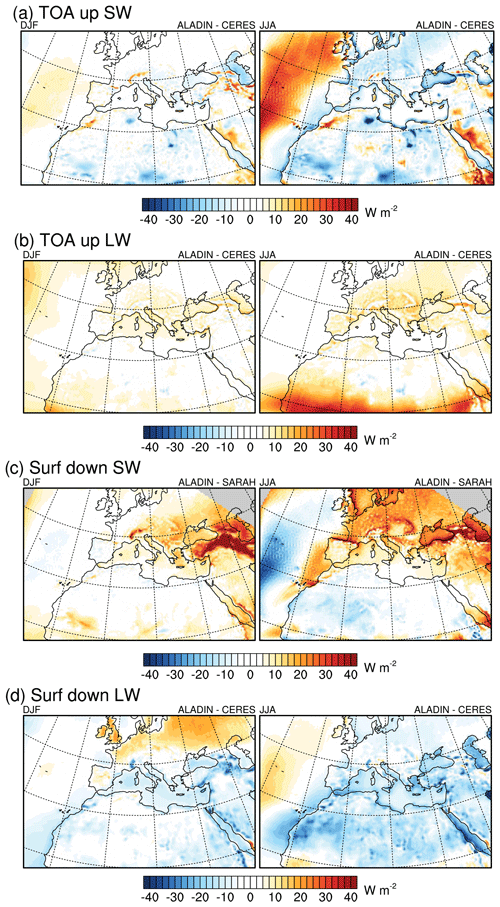
Figure 4Winter (DJF, left) and summer (JJA, right) average differences between ALADIN and satellite data for shortwave (SW) and longwave (LW) radiation (W m−2) at the top of the atmosphere (upward fluxes, panel a for SW, panel b for LW) and at the surface (downward fluxes, panel c for SW, panel d for LW). Satellite data used here are CERES (2000–2016) in panels (a), (b) and (d), as well as SARAH (1983–2015) in panel (c).
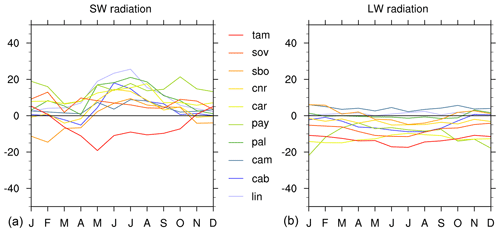
At the surface, a similar evaluation is shown for downwelling SW and LW radiation (Fig. 4c and d). It is worth mentioning that SARAH data have been used for SW radiation instead of CERES, to benefit from its finer resolution. This comparison with satellite data is completed by an evaluation against 10 BSRN stations throughout the domain of the simulation (Fig. 5). In winter, simulated radiation is close to SARAH over the whole domain, with a weak bias both in Europe (6.6 W m−2) and over the Mediterranean Sea (7.1 W m−2). This represents a significant improvement over Europe compared to the previous version of ALADIN which had a higher bias (+15.2 W m−2). In summer, SW radiation is overestimated (+17.4 W m−2 on average in Europe), probably due to the underestimation of cloud cover, which had already been noted in the previous version of the model evaluated over the Mediterranean in Sanchez-Gomez et al. (2011). This overestimation is confirmed by the comparison to BSRN stations, where the bias ranges from 5 to 20 W m−2. However, for the few stations located in the south of the domain (Tamanrasset in Algeria, Sede Boker in Israel), the average bias is weaker. Surface downwelling LW radiation is underestimated over the Mediterranean Sea in winter (−9.6 W m−2) and in summer (−14.1 W m−2), while it is slightly overestimated in northern Europe in winter (+3.1 W m−2).
In conclusion to this section, it has been proven that this new version of ALADIN is able to represent the main properties of mean regional climate over the Euro-Mediterranean area, in relatively good agreement with observations, and with significant improvements compared to its previous version especially for cloud cover and radiation. The residual biases are not stronger than those of other regional models over Europe (Kotlarski et al., 2014). Note that this evaluation is not the main scope of this paper, and that more detailed evaluation has already been published for the previous version of the model with regards to decadal variations (Dell'Aquila et al., 2018), daily precipitation (Fantini et al., 2018) and hydrometeorological extremes (Panthou et al., 2018). Evaluation and intercomparison of CNRM-ALADIN63 for historical simulations over Europe can also be found in Vautard et al. (2020).
3.2 Aerosols
3.2.1 General evaluation
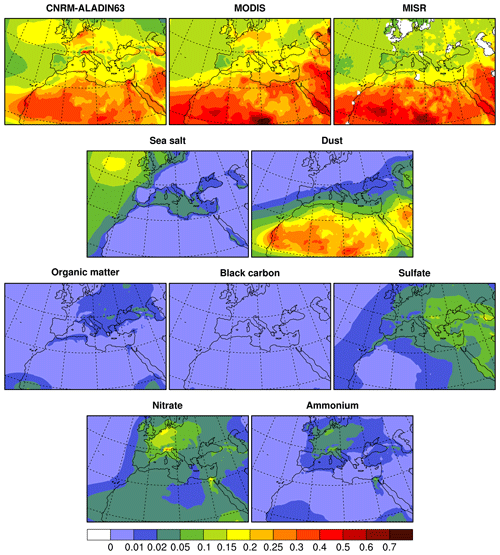
The aerosols simulated by the TACTIC scheme in CNRM-ALADIN63 are evaluated against satellite and ground-based measurements. Figure 6 shows the average total AOD simulated in ALD-AER, as well as the AOD for each aerosol type. The main spatial patterns of each aerosol type are consistent with their respective sources, namely a strong maximum in dust AOD over the Sahara, high-sea-salt AOD over the Atlantic Ocean and to a lesser extent over the Mediterranean and Black seas, and locally high values of sulfate, nitrate and organic matter AOD in Europe. Satellite data (MODIS and MISR), which provide only total AOD, have similar AOD spatial distribution. The spatial correlation between ALADIN and MODIS is 0.75, and 0.84 with MISR. However, discrepancies have been found locally, for example, in the Benelux region and in the Po Valley (see the biases in Fig. S2), where ALADIN AOD is overestimated compared to MODIS (up to 0.1 in the Po Valley) and especially MISR (up to 0.2). This bias is much smaller than the negative bias in the previous version of the model which did not include nitrate aerosols (Drugé et al., 2019). Annual AOD average over Europe in ALADIN is now similar to MODIS (0.17 for ALADIN and MODIS) but higher than MISR (0.13). Besides, sea-salt aerosols are also probably overestimated over the northern Atlantic Ocean compared to MODIS and MISR, as AOD reaches 0.17 on annual average in this area against only 0.14 for MODIS and 0.12 for MISR. This positive bias is consistent with the surface wind overestimation described in the previous paragraph. Over the Mediterranean, where dust particles are prevailing, total AOD simulated by ALADIN (0.18) is in the range of satellite estimates (0.20 for MODIS and 0.16 for MISR). Similar performance is noted over northern Africa (0.27 for ALD-AER, 0.33 for MODIS and 0.34 for MISR).
3.2.2 Confronting the model to station aerosol measurements
In order to further elaborate on the aerosols simulated by CNRM-ALADIN63, nine subregions have been defined on the domain (see Fig. 1) to separate the influence of different aerosol sources. Each of them contains eight AERONET stations. The AOD annual cycle simulated in ALD-AER is evaluated against one representative station of each subregion (Fig. 7), and the AOD daily distribution is shown in Fig. 8 for all stations. For each AERONET station, only the days where observations are available have been taken into account in the model both in Figs. 7 and 8.
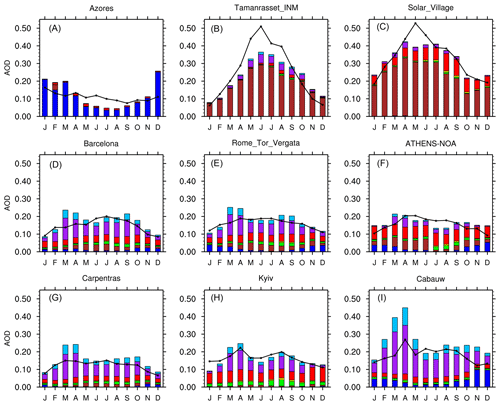
Figure 7Monthly means over the period of available observations (see Table 2) in AERONET stations (black lines; one for each subregion defined in Fig. 1) and ALADIN simulation (colour bars) for aerosol optical depth at 550 nm. The contribution of each aerosol type in ALADIN simulations is given by the following colour bars: dark blue for sea salt, brown for dust, red for sulfate, green for organic matter, yellow for black carbon, purple for nitrates and light blue for ammonium. Only the days where observations are available have been taken into account in the model.
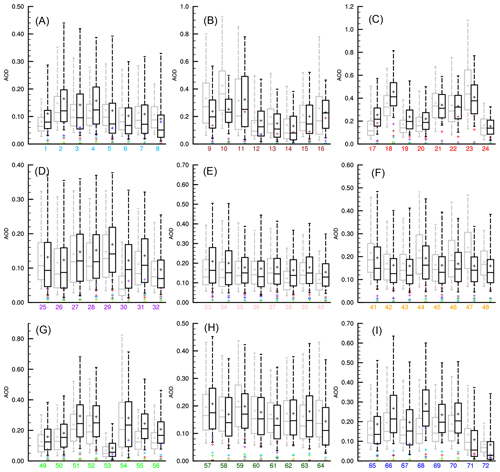
Figure 8Box plots comparing daily AOD simulated by CNRM-ALADIN63 (in black) to AERONET measurements (in grey) for each subregion defined in Fig. 1 (A–I). The numbers on the x axis correspond to the respective stations defined in Fig. 1 and Table 2. The limits of each boxplot are given by the first and third quartiles, the inner horizontal line is the median, while the whiskers limited by the 5th and 95th percentiles. Coloured crosses represent the average total AOD (AERONET in grey, ALADIN in black) and the contribution of each aerosol type in ALADIN (dust in brown, sea salt in dark blue, sulfate in red, organic matter in green, black carbon in yellow, nitrates in purple and ammonium in light blue). Only the days where observations are available have been taken into account in the model. Note that the AOD scale is adapted to each region.
Over the western part of the domain (region A), sea-salt aerosols generated over the Atlantic Ocean prevail with a maximum in winter, as shown by the AOD distribution at the Azores station (Fig. 7). This maximum is overestimated in winter, especially in December in the Azores, probably in relation to the overestimation of surface wind in the Atlantic Ocean. Both ALADIN and AERONET data show a decrease in AOD between winter and summer, but the decrease in AOD is too strong in the model, yielding an underestimation of AOD in summer. This could be due to an underestimated transport of dust aerosols from the Sahara in this season. With regards to the AOD daily distribution in this region, the 90 % interval (between the 5th and 95th percentiles) in ALD-AER is close that found in the observations for most stations (Fig. 8). In addition, ALD-AER also represents the average AOD values higher than the median as in the observations, due to the contribution of days with very high AOD, even if the model overestimates the most extreme AOD values in several stations.
Over northern Africa and the Middle East (regions B and C), dust aerosols have the most important contribution to AOD, as seen at Tamanrasset and Solar_Village (Fig. 7), generating AOD higher than 0.40 in spring and summer. ALD-AER correctly captures the annual mean and the seasonal cycle, despite a small underestimation at the end of the spring. At Solar_Village, sulfate aerosols also have a low contribution to AOD (around 0.05). The AOD daily distribution is also in general good agreement with observations in this area (Fig. 8), as well as the extreme AOD values. An exception is however noticed for stations 9 (Capo_Verde) and 10 (Dakar) under the influence of dust aerosol exports in the Saharan air layer in which AOD is underestimated, and for stations 17 (El_Farafra) and 18 (Cairo_EMA_2) in Egypt where AOD is slightly overestimated.
In southern Europe (regions D, E and F), AOD is mainly dominated by nitrate, sulfate and dust particles, with a small contribution of sea-salt aerosols in winter (Fig. 7). The annual cycle is less pronounced than in the previous regions, but a maximum in spring and summer is also noted both in the model and in the observations associated, respectively, with nitrate and dust aerosols. The AOD daily distribution is also well captured by ALD-AER, both for the median and the 90 % interval, especially in regions D and E. The only exception is Montsec (station 30), where ALADIN overestimates the aerosol concentrations. This might be due to a mismatch between the model orography and the true altitude of the station located at 1574 m. At some stations in region F in Greece and Turkey (44, 46, 47 and 48), ALADIN has a weak negative AOD bias, probably also due to a lack of transported dust in summer or underestimated local anthropogenic sources.
In regions G (southern France, northern Italy and the Alps) and H (continental and eastern Europe), anthropogenic aerosols are prevailing as seen, for example, in Carpentras and Kyiv (Fig. 7). The annual cycle is limited to an increase of nitrate and ammonium particles in spring and to organic matter in summer in eastern Europe due to biomass burning emissions. The model is also able to simulate various AOD daily distributions, such as the small range in Modena (station 50) or the larger range in Ispra (station 54). The cleaner air observed in the Alps in Davos (station 53) is also simulated in ALD-AER.
Finally, northern Europe (region I) is also dominated by anthropogenic particles, with a higher contribution of nitrate aerosols, probably overestimated in ALD-AER as already seen in central Europe. The annual cycle is characterized by a maximum in spring as seen in Cabauw (station 66, Fig. 7). The AOD daily distribution is in good agreement in AERONET and ALD-AER in several stations, for example, Dunkerque (station 65) and Gotland (station 71), but the overestimation of nitrates disrupts this distribution at other stations such as Cabauw (66), Hamburg (68) and Leipzig (70). This overestimated contribution of nitrates had already been documented in Drugé et al. (2019).
To summarize, ALD-AER reasonably captures the annual cycle and daily distribution of AOD. Some discrepancies have also been emphasized, notably in spring in northern Europe likely due to an overestimation of nitrates and in summer in the Atlantic and in southeastern Europe presumably because of an underestimation of the dust transport. However, these small biases do not prevent the model from being able to be used in this study to understand the variations of aerosols at the daily scale and their potential impact on regional climate.
In order to improve our understanding of the aerosol effects on the Mediterranean climate and their relationships with the atmospheric circulations, the present section analyses how the North Atlantic Oscillation can modulate aerosol concentrations, first in winter and subsequently in summer. For that purpose, monthly NAO index provided by the National Oceanic and Atmospheric Administration (NOAA; https://www.cpc.ncep.noaa.gov/products/precip/CWlink/pna/nao.shtml, last access: 16 July 2020) has been used (Barnston and Livezey, 1987). Since the ERA-Interim reanalysis has been shown to be consistent in time with observations and atmospheric circulation (Dee et al., 2011), this NAO index data must be consistent with the ERA-Interim reanalysis and therefore the ALADIN simulations.
4.1 In winter (DJF)
The respective correlation by season at yearly scale between the NAO index and the AOD (total, sea salt, dust and sulfate) in ALD-AER, is presented in Fig. 9 for winter and summer, while averages of these correlations over six regions of the domain are presented in Table 5. Note that the linear trend of AOD has been removed from all the data sets. The NAO index is based on the surface sea-level pressure difference between the subtropical (Azores) High and the Subpolar Low, and is thus assumed to be faithfully reproduced in ALD-AER, as it is laterally driven and spectrally nudged to the ERA-Interim reanalysis (Sanchez-Gomez et al., 2009). In winter, the correlation between total AOD and NAO has a zonal spatial distribution, characterized by positive values above 45∘ N (for example, 0.44 in EURNW) and below 30∘ N (0.77 in AFRW), and negative values between these two limits (−0.15 in EURSE). Note that, however, the area with significant values is larger for the positive correlations than for the negative ones. This pattern is consistent with the position of storm tracks and precipitation associated with winter NAO, namely an increase of storms and precipitation in northern Europe during the positive phase and a southward shift of the storm track in the negative phase (Pinto et al., 2009). Figure 10a shows both the AOD anomalies and the average circulation in the surface (wind and sea-level pressure), respectively, for the positive and negative phases of NAO. In the positive phase, both the low pressures over Iceland (beyond the northern limit of the domain) and the high pressures in the Azores are reinforced, the latter also reinforcing northeastern winds over northwestern Sahara following the geostrophic wind circulation. In the negative phase, both action centres move south, thus increasing wind speed over the Atlantic Ocean between 30 and 40∘ N but weakening winds over the Sahara.
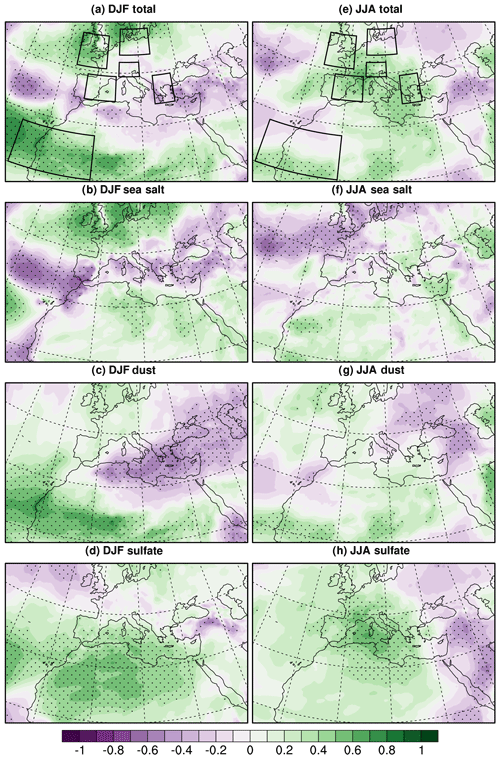
Figure 9Correlation between NAO index and AOD (total and by aerosol type) at 550 nm simulated by ALADIN over the period 1979–2018, separately for DJF (a–d) and JJA (e–h) seasonal means. Dotted areas are significant at the 0.05 level.
Table 5DJF (left) and JJA (right) correlations between AOD anomalies (for ALADIN, MODIS and MISR) and NAO index over six regions (AFRW, EURSE, EURNW, EURSW, ALPS and EURN) whose limits are given in this table (also shown in Fig. 9). Anomalies have been calculated, respectively, for winter (DJF, left) and summer (JJA,right) means of AOD and NAO index. Significant values at the 0.05 level are noted in bold font.

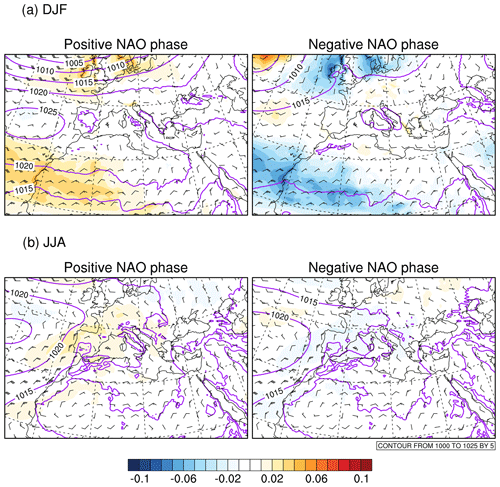
Figure 10Averaged (1979–2018) atmospheric circulation (sea-level pressure in hPa, purple lines, and surface wind with black wind barbs representing 2 km h−1) with AOD anomalies (colours) simulated by ALADIN in winter (DJF, a) and in summer (b), respectively, for the positive (left) and negative (right) phases of NAO.
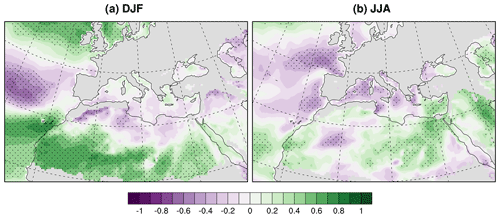
Figure 11Correlation between NAO index and natural emissions (dust emissions over land, sea-salt emissions over ocean) simulated by CNRM-ALADIN63 over the period 1979–2018, for DJF (a) and JJA (b) seasonal means. Grey colour shows areas without dust and sea-salt emissions. Dotted areas are significant at the 0.05 level.
Sea-salt aerosols logically follow this pattern, since emissions mostly depend on surface wind north of 30∘ N. The correlation between the NAO index and sea-salt emissions shown in Fig. 11 confirms this pattern. Below 30∘ N, the positive correlation is associated with dust particles, which explain a large part of the correlation between total AOD and the NAO index. It is the part of the domain where the correlation is the highest (between 0.7 and 0.9). This increase in dust AOD in the positive phase of NAO could be due to the reinforcement of easterly winds in northern Africa generating more dust emissions (see Fig. 11), due to the increase of surface pressure in the subtropics (Azores) and the associated geostrophic circulation (Fig. 10a).
With regards to sulfate aerosols (and more generally anthropogenic aerosols which are not shown here), a large positive correlation is noted over the south of the domain, probably due to a higher residence time favoured by high pressures and reduced precipitation in positive NAO conditions. However, this pattern is not noted in total AOD due to the weak sulfate concentrations in winter in this area.
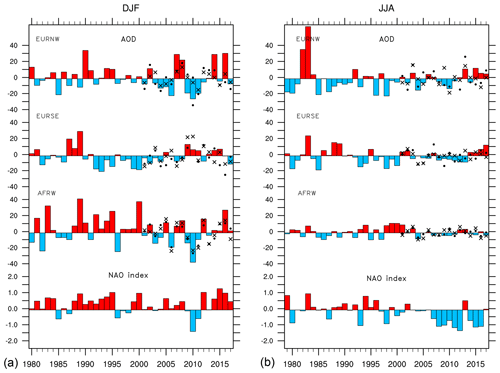
Figure 12Winter (DJF, a) and summer (JJA, b) means of NAO index (bottom) and AOD anomalies (in %, first three lines) in three regions (EURNW, EURSE and AFRW). AOD simulated data are in colour bars, while AOD satellite data are shown with black symbols (MODIS in black crosses, MISR in filled black circles). AOD anomalies are calculated against the common 2001–2017 period.
Figure 12, which presents the interannual time series of the NAO index (in winter and summer) compared to the averaged AOD anomalies over three of the six regions defined in Fig. 9 (EURNW, EURSE and AFRW), allows a better understanding of these correlations. Associated yearly temporal correlations between the NAO index and the AOD anomalies are given in Table 5 for winter and summer. In AFRW, off the western African coast, most of the years with large positive AOD anomalies (up to 40 % compared to the averaged AOD in DJF) are also years with positive anomalies in NAO, such as 1983, 1989, 1995, 2000 and 2016, and conversely for negative anomalies such as those in 1996 and 2010. As mentioned previously, previous studies (e.g. Moulin et al., 1997) had already highlighted such a correlation, since a positive phase of the NAO should favour the export of dust aerosols over the Atlantic Ocean, due to the circulation induced by the strengthening of the Azores High and associated trade winds. This result is confirmed for the shorter period (2001–2017) when satellite data are available, as the respective correlations of ALADIN, MODIS and MISR are 0.82, 0.75 and 0.76. On the contrary, a negative correlation is noted over the eastern Mediterranean area both in ALADIN and in satellite data, as shown in the EURSE domain. For example, the period 1999–2008, associated with the positive NAO index, is affected by negative AOD anomalies in EURSE, and vice versa for the period 2009–2011. However, this is not the case for the whole period (1980–2017), and even if the sign of the correlation is in agreement in the three data sets, it is not significant at the 0.05 level except for MISR (−0.65). Moreover, the anomalies shown in Fig. 12 are generally weaker than in AFRW. This absence of statistic significance is consistent with the results of Ginoux et al. (2004), who have not shown a relation between Mediterranean AOD and NAO, but not with those of Papadimas et al. (2008) which have probably used a too-short period of MODIS data. The same conclusion can be drawn for the ALPS region, where the correlation is negative but not significant in two out of the three data sets. In the two regions located above 45∘ N (EURNW and EURN), the correlation is largely positive in ALADIN (respectively, 0.44 and 0.31) but weaker in MODIS and MISR where the threshold of significance is not reached. However, in these regions where clouds prevail in winter, the lack of AOD data retrieved by MODIS and MISR could hamper the estimation of this correlation with NAO. Finally, in EURSW, no significant correlation in ALADIN nor in satellite products has been found.
4.2 In summer (JJA)
In summer, the interannual variability of AOD is less important than in winter, as noticed in Fig. 12. The correlations between AOD and the NAO index are also weaker (Fig. 9e), with fewer significant points at the 0.05 level than in winter. However, some regions such as a part of the Atlantic Ocean, southern Europe and the Mediterranean Sea still have a significant correlation between NAO and total AOD. In the Atlantic Ocean, the correlation is negative because of the contribution of sea-salt AOD, showing that the path of strong winds associated with the positive phase in summer is located at higher latitudes than in winter (Fig. 10b). This pattern is confirmed by the correlation between sea-salt emissions and NAO (Fig. 11). In southern Europe and the Mediterranean, the positive correlation is associated with the contribution of sulfate aerosols (and other anthropogenic particles to a lesser extent; not shown). In the positive phase of NAO in summer, the Mediterranean region is wetter than average (Bladé et al., 2012), with a slight positive anomaly in precipitation (Fig. S3). Thus, the increase in sulfate AOD could be due to an increase in relative humidity in the lower troposphere, which enhances aerosol extinction of hydrophilic aerosol species such as sulfate.
However, when averaged over the six different regions studied, most of the correlations are not significant. When considering the interannual time series (Fig. 12), it is indeed more difficult than in winter to conclude on the NAO impact on AOD. For example, the NAO index series is characterized by a long negative period between 2007 and 2016 (except 2013), which is not really the case in the time series of AOD in EURNW and EURSE (except the period 2008–2012 in EURSE). The averaged correlations in Table 5 also show that they strongly depend on the period chosen: in ALD-AER, the significant correlations of EURSE (0.33) and ALPS (0.34) over the 1979–2017 period are much lower than those over the 2001–2017 period. In satellite data, no correlation is significant except for MISR in EURNW.
As a summary, the NAO index explains a significant part of the interannual variability of aerosols, notably in winter for the export of dust aerosols over the Atlantic Ocean and the eastern Mediterranean, and in summer for the positive anomalies of anthropogenic aerosols over western Europe. Compared to existing literature, this study has further investigated these relationships between the NAO index and aerosol loads using a longer time period (1979–2018) and a detailed analysis by aerosol type. However, the significance of the correlations between AOD and NAO strongly depends on seasons and regions, and therefore this index is not sufficient to explain the whole variability in aerosol loads and their effects on regional climate over the Mediterranean. The following section will therefore move to the daily timescale using the methodology of weather regimes, in order to further analyse these aerosol effects on regional climate.
As mentioned previously, weather regimes are an appropriate methodology to explain climate variability in Europe at daily timescale. The objective of the present section is to understand if they can also explain the variability in aerosols and their impact on regional climate. The methodology described in Sect. 2 is applied to the ALADIN simulations in winter (DJF) and in summer (JJA), and results are presented below.
5.1 Definition of weather regimes
When applying the classification method to the daily sea-level pressure output of the ALD-AER simulations, the usual four main weather regimes are identified both for winter and summer: Atlantic Ridge (AR), negative NAO (NAO−), blocking (BL) and positive NAO (NAO+). The latter is close to the Atlantic Low (AL) regime identified for summer whose anomalies are less intense and northwestward shifted. The associated anomalies in sea-level pressure are shown at the top of Fig. 13 for winter and Fig. 14 for summer.
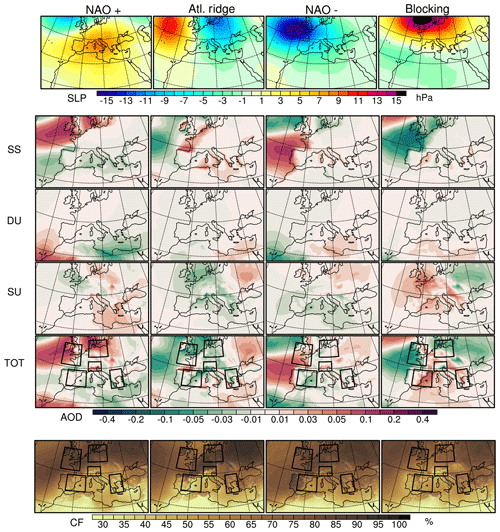
Figure 13Winter (DJF) anomalies in sea-level pressure (in hPa, first line), AOD at 550 nm (SS for sea salt, DU for dust, SU for sulfate and TOT for total) and cloud fraction (CF, in %, last line) for each weather regime (NAO+, Atlantic Ridge, NAO− and blocking).
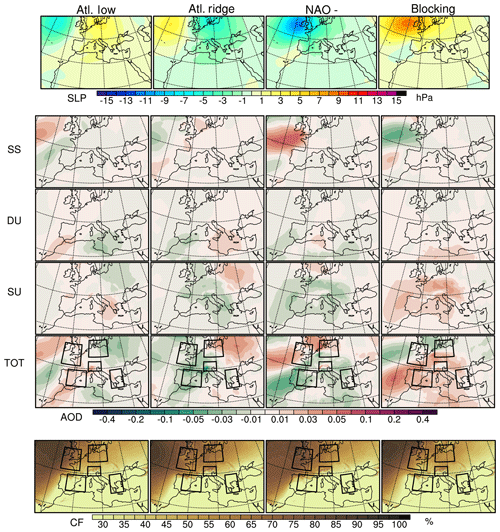
Figure 14Summer (JJA) anomalies in sea-level pressure (in hPa, first line), AOD at 550 nm (SS for sea salt, DU for dust, SU for sulfate and TOT for total) and cloud fraction (CF, in %, last line) for each weather regime (Atlantic Low, Atlantic Ridge, NAO− and blocking).
The AR regime is characterized by a high-pressure system over the Atlantic Ocean, rejecting low-pressure systems over northern Europe. This pattern induces a northwestern flow over western Europe and the northwestern Mediterranean, which favours local winds such as mistral and tramontane. In the NAO− regime, the Icelandic low-pressure system moves to the south, shifting the path of the Atlantic jet and surface strong winds to southern latitudes. Thus, the Mediterranean is affected by more cyclonic systems in this regime. On the contrary, in the winter NAO+ and summer AL regimes, the Mediterranean weather is drier and warmer, as the low-pressure systems are rejected to the northern latitudes, while southern latitudes experience positive anomalies of sea-level pressure and large-scale subsidence. Finally, the BL regime is characterized by the presence of high pressures over northwestern Europe.
Before analysing each regime, note that weather regime anomalies are stronger in winter than in summer (see Figs. 13 and 14), emphasizing that weather regimes are more significant in winter.
5.2 Aerosols and their effects as a function of the weather regimes
The anomalies of aerosol optical depth for each aerosol type and total are presented in Figs. 13 and 14, while the anomalies of the aerosol impact on surface downwelling SW radiation (SDSR, clear and all sky) and near-surface temperature are shown in Figs. 15 and 16. This impact of aerosols on SDSR and near-surface temperature is calculated as the difference between ALD-AER and ALD-NO in SDSR and near-surface temperature, respectively. The anomalies of this impact are then calculated for each regime compared to the mean impact.
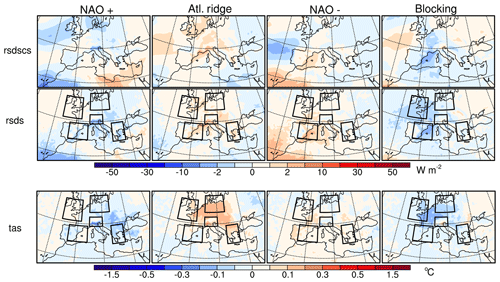
Figure 15Winter (DJF) anomalies in the impact of aerosols (ALD-AER – ALD-NO) on surface SW downward radiation (SDSR, clear-sky and all-sky, in W m−2) and on near-surface temperature (in ∘C) for each weather regime (NAO+, Atlantic Ridge, NAO− and blocking).
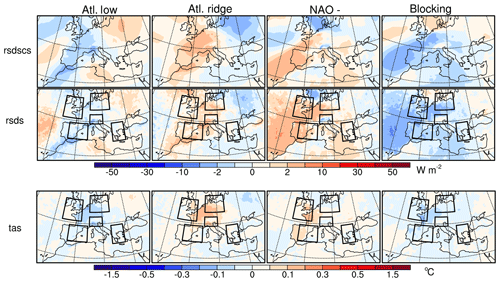
Figure 16Summer (JJA) anomalies in the impact of aerosols (ALD-AER – ALD-NO) on surface SW downward radiation (SDSR, clear-sky and all-sky, in W m−2) and on near-surface temperature (in ∘C) for each weather regime (Atlantic Low, Atlantic Ridge, NAO− and blocking).
5.2.1 The blocking (BL) regime
As implied by its name, the BL regime is characterized by a synoptic situation where high pressures prevent low-pressure systems from reaching Europe. This regime occurs both in winter and in summer, even if its intensity is weaker in summer. The first consequence of these high pressures over northern Europe is to reduce the activity of storms over the Atlantic Ocean, thus decreasing sea-salt emissions and thereby sea-salt AOD over western and northern Europe. On the contrary, over land, the atmosphere is more stable in this regime, thus allowing aerosols to live longer without being removed by wind, clouds or precipitation. The sulfate AOD anomaly in the ALD-AER simulation is thus positive over most of Europe, in winter and in summer. The only exception concerns the eastern part of the domain in winter. A likely explanation for this region is that the drier air brought by high pressure tends to decrease relative humidity in the lower troposphere, thus decreasing the aerosol extinction. With regards to dust aerosols, a small positive anomaly is observed over northern Africa, probably due to the reinforcement of easterly winds in this region, induced by the circulation. In total, the AOD anomaly is positive over continental Europe and the northern Mediterranean due to sulfate aerosols and negative over the western part of the domain due to sea-salt particles. The pattern is quite similar in winter and in summer, with a larger extent of the positive anomaly in summer.
These AOD anomalies have an impact on SDSR as seen in Figs. 15 and 16. The clear-sky SDSR pattern is very similar to that of AOD, with a decrease over continental Europe and an increase over the near Atlantic Ocean. In all-sky SDSR, only the negative anomaly over continental Europe remains and is even more widespread both in winter and in summer. Indeed, as shown in Fig. 13, cloud cover is reduced over Europe in the BL regime enabling more effects of aerosols on radiation, while over the Atlantic Ocean, the high values of cloud fraction limit their effects. As a consequence, a cooling effect of aerosols is noted over Europe in the BL regime, reaching −0.2 ∘C in winter over western Europe.
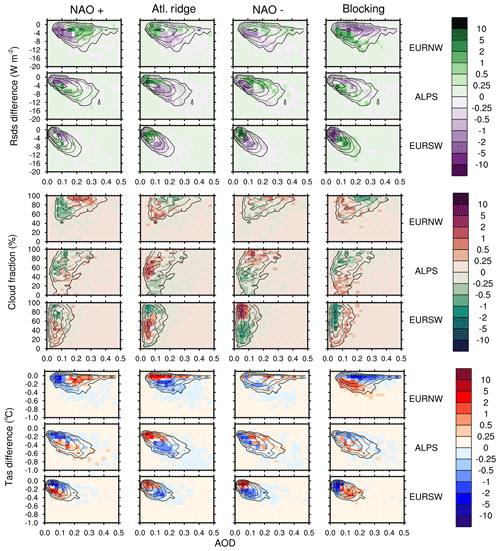
Figure 17Probability distribution functions in function of AOD at 550 nm in winter (DJF) of the aerosol impact on surface SW downward radiation (top panel, in W m−2, calculated as the difference between ALD-AER and ALD-NO), cloud cover (middle panel, in %) and the aerosol impact on near-surface temperature (bottom panel, in ∘C, calculated as the difference between ALD-AER and ALD-NO). The black lines represent the average (the values are 0.25, 0.5, 1.0, 2.0 and 10.0 in this order), while the colours present the anomalies of this distribution for each weather regime. These figures are calculated for the three regions (EURNW, ALPS and EURSW) (shown in Fig. 15).
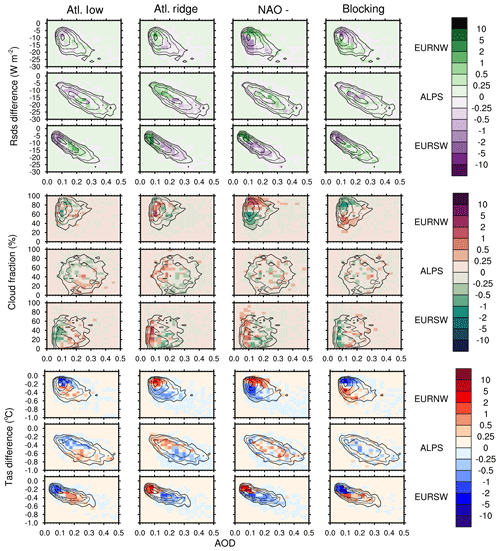
Figure 18Same as Fig. 17 but for summer (JJA).
In order to better understand this impact of aerosols on climate in the different weather regimes, the probability distribution functions of the aerosol impact on SDSR, the cloud cover and the aerosol impact on near-surface temperature have been calculated in function of AOD at the daily scale for the different regions (one region per line) presented in Table 5 and for each weather regime. The results concerning EURNW, ALPS and EURSW are presented in Fig. 17 for winter and Fig. 18 for summer. For the sake of brevity, the two other regions (EURN and EURSE) are shown in the Supplement (Figs. S4 and S5). The objective of these figures is to identify the change in the daily distribution of aerosol impacts in each regime compared to the average distribution. The latter, which is shown with black lines, is the same for each line (one line represents one region). For example, in winter in EURNW, the distribution of SDSR vs. AOD (Fig. 17) shows a maximum of occurrence of an impact of aerosols on SDSR by −3 W m−2 with an AOD of about 0.15. Concerning the anomalies of the BL regime in this region, more frequent days with relatively small AOD (between 0.10 and 0.25) are noted but with more impact on SDSR (between −4 and −12 W m−2) and thus induce a stronger cooling (between −0.2 and −0.4 ∘C) than average in this region. This is made possible by the higher frequency of days with lower cloud cover (less than 80 %). Similar behaviours can be identified in EURN (Fig. S4). However, this process is reinforced in summer in EURNW, when during days with cloud cover lower than 50 %, the decrease of SDSR by aerosols is stronger by 10 W m−2 and the induced cooling by 0.3 ∘C compared to the average aerosol effects. In the three other regions (EURSW, EURSE and ALPS), cloud cover is on average lower, so that the positive AOD anomalies in the BL regime lead to stronger aerosol effects on SDSR and near-surface temperature. For example, in winter EURSW, aerosols can generate a cooling of −0.4 ∘C in the BL regime against only −0.2 ∘C on average.
To summarize, in the BL regime, the aerosol effects are stronger over all of Europe, either because they are more efficient due to the decrease of cloud cover (in northern Europe), or because their concentrations are higher due to the more stable conditions (southern Europe).
5.2.2 The winter NAO+ and summer Atlantic Low (AL) regimes
The NAO+ regime in winter is characterized by a reinforcement of the Icelandic low-pressure system, together with a positive pressure anomaly in southern Europe. In summer, the equivalent regime (AL) has a similar negative pressure anomaly over the Atlantic, but further south, and a positive anomaly over Europe reaching higher latitudes than in winter. These conditions induce a contrast in the AOD anomaly between northwestern Europe and southern Europe. On the one hand, sea-salt emissions are reinforced in the northern Atlantic Ocean and North Sea in relation to the increase in surface wind, causing an increase in sea-salt and total AOD in this region (+0.05 on average in EURNW). Anthropogenic AOD over northwestern Europe is however reduced, because of the excess precipitation under these conditions. On the other hand, sea-salt emissions are reduced further south in the Atlantic Ocean, because of high pressure inducing a decrease in surface wind. Over the central and eastern Mediterranean, drier conditions allow a slight increase of sulfate AOD in winter. With regards to dust aerosols, in winter, they contribute to a negative anomaly in total AOD in the eastern Mediterranean and to a positive anomaly off northwestern Africa. All these patterns are consistent with the patterns described previously in the positive phase of NAO.
As in the BL regime, these AOD anomalies have impacts on SDSR, especially in clear-sky conditions, for example, in winter (Fig. 15) with a negative anomaly over northwestern Europe, northern Europe and off northwestern Africa (between −5 and −20 W m−2), and a smaller positive anomaly over the eastern Mediterranean (between 2 and 5 W m−2). However, in all-sky conditions, the negative winter anomalies in northern Europe are not preserved, probably because of the important cloud cover (see Fig. 13) that moderates the direct aerosol effect. As a consequence, the aerosol impact on near-surface temperature in this regime does not show any significant anomaly in winter. In summer (Fig. 16), when cloud cover is lower, the differences between all-sky and clear-sky conditions are reduced, but the anomalies in the impact of aerosols on near-surface temperature remain negligible and spatially uncorrelated to the AOD anomalies.
However, the study of density probability functions of the aerosol impacts in Fig. 17 shows more interesting patterns. First, they confirm the fact that the increase in AOD in northern Europe (EURNW and EURN) in winter does not have any impact on SDSR and temperature (Fig. 17), because this increase in AOD occurs in very cloudy sky conditions (higher than 90 %), thus limiting the direct aerosol effect. In the three other regions (EURSW, EURSE and ALPS), although the AOD anomalies are close to zero, the effect of aerosols is stronger in winter, both in SDSR (an extra dimming of about 5 W m−2) and in temperature (an extra cooling between 0.2 and 0.4 ∘C), because of lower cloud cover in the NAO+ regime in these regions. In EURSE (Fig. S4), the aerosol effects are even stronger despite a slight negative AOD anomaly. In summer, the relationship between AOD and the aerosol impact on SDSR seems to be more linear, notably in EURSW where the positive AOD anomaly (up to 0.1) leads to an extra dimming (about 5 W m−2; Fig. 18). To a lesser extent, the same conclusion applies to the aerosol impact on near-surface temperature, where the positive AOD anomalies cause an extra cooling of about 0.2 ∘C in EURSW and ALPS. In northern Europe (EURNW and EURN), this regime favours days with lower cloud cover and consequently stronger effects of aerosols for constant AOD.
To summarize, the NAO+ and AL regimes are characterized by stronger aerosol effects in southern Europe due to different reasons: drier conditions leading to a more efficient direct aerosol effect in winter, increase of AOD in summer. In northern Europe, the increase in AOD due to sea-salt emissions does not generate stronger aerosol effects in winter because of important cloud cover, while in summer the decrease in cloud cover in the AL regime allows an extra dimming and cooling of aerosols.
5.2.3 The NAO− regime
Contrary to the previous regime, the NAO− regime is associated with a strong negative pressure anomaly over the near Atlantic, also covering western Europe and the western and central Mediterranean. Therefore, storms are further south than average over the near Atlantic, and low systems are favoured over southern Europe compared to other regimes. With regards to aerosols, sea-salt emissions are reinforced between 30 and 55∘ N over the Atlantic Ocean in winter (only between 40 and 55∘ N in summer) and weakened further north. The dust AOD pattern in winter is the opposite of the one in the NAO+ regime, with a positive anomaly in the eastern Mediterranean and a negative anomaly off northwestern Africa. Anthropogenic AOD anomalies are small and associated with precipitation anomalies. Indeed southern Europe is affected by a negative sulfate AOD anomaly, probably due to higher precipitation in the NAO− regime, while northeastern Europe has a positive sulfate AOD anomaly in winter. In total, AOD anomalies consist essentially in an increase over the near Atlantic and a decrease over southern Europe and the Mediterranean.
In winter (Fig. 15), the AOD increase over the near Atlantic leads to a decrease in clear-sky SDSR by −5 to −10 W m−2, which is not preserved in all-sky SDSR due to important cloud cover at the same place in this regime. However, the negative AOD anomalies over southern Europe and off northwestern Africa lead to a slight increase in clear-sky and all-sky SDSR, up to 5 W m−2 locally. No impact on near-surface temperature associated with these effects on SDSR has been clearly identified. In summer, the negative AOD anomaly in southern Europe leads to higher increases both in clear-sky and all-sky SDSR, between 2 and 10 W m−2 (Fig. 16). However, the anomaly in the aerosol impact on near-surface temperature remains lower than 0.1 ∘C on average, except in western France where it reaches 0.2 ∘C.
More in detail, the positive AOD anomaly in winter occurs simultaneously with an increase in cloud cover. Therefore, Fig. 17 shows, for example, in EURNW less frequent days with strong aerosol effects and more frequent days with weak aerosol effect on SDSR (between 0 and −4 W m−2). The ALPS region is affected by the same process: more aerosols but also more clouds in this regime in winter, leading to a decrease of the aerosol impacts on SDSR and near-surface temperature. In EURSW, clouds are also favoured in this regime in winter, but compared to the areas further north, AOD is also reduced, leading to reduced aerosol effects. The same results are noted in summer, notably in EURNW and EURSW (Fig. 17).
In brief, the NAO− regime is dominated by reduced aerosol effects on SDSR and temperature, either due to a decrease in aerosol loads (notably in southern Europe) or due to the reinforcement in cloud cover (for example, in western Europe) making the aerosols less efficient in their direct effect.
5.2.4 The Atlantic Ridge (AR) regime
As implied by its name, the AR regime is characterized by a large positive pressure anomaly over the Atlantic Ocean, which can be seen as a ridge extending from the Azores high-pressure system to northern latitudes. This ridge induces a northwesterly flow over western Europe and is associated with low-pressure anomalies over central Europe. The pattern is similar in winter and in summer, but with weaker anomalies in summer. In this regime, the aerosol loads are in most places weaker than average over Europe, for different reasons. First of all, the northwesterly flow induced by the synoptic circulation leads to more frequent precipitation in western Europe, often under the form of showers behind cold fronts, thus scavenging the atmosphere from aerosols. Therefore, the anthropogenic AOD anomaly is negative over Europe, except in the extreme east of the domain away from this northwesterly flow. Secondly, this circulation is not favourable to dust outbreaks over the Mediterranean or even Europe, so that the dust AOD anomaly is close to zero, or slightly negative in summer in the western Mediterranean. Finally, the northwestern winds generate a positive anomaly in sea-salt AOD in winter along the European coasts from the Netherlands to Spain, which is however counterbalanced by the decrease in anthropogenic AOD, except in northern Spain.
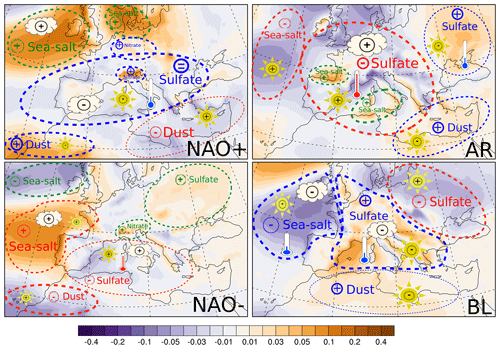
Figure 19Synthesis scheme of the aerosol effects as a function of weather regimes in winter (DJF). The main anomalies in aerosol optical depth and aerosol impact on surface radiation and temperature for each weather regime are summarized by areas delineated by dashed lines. Red colour refers to a reduced impact of aerosols, green to similar impact and blue to a reinforced impact of aerosols. The coloured plus/equal/minus symbols indicate the AOD anomalies, while the plus/minus symbols inside clouds indicate the cloud cover anomalies. The inclusion of Sun/thermometer symbols indicates the respective impact of aerosols on surface radiation/near-surface temperature in the area. Background colours show the total AOD anomaly (at 550 nm) for each weather regime.
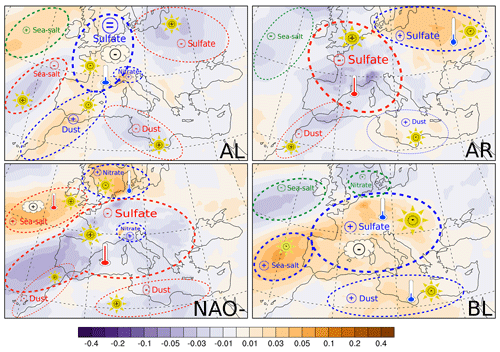
Figure 20Same as Fig. 19 but for summer (JJA).
The decrease in AOD in the AR regime leads to a positive anomaly in the aerosol impact on SDSR, both in clear-sky and all-sky conditions (Figs. 15 and 16). These anomalies are very weak in winter, between 0 and 2 W m−2 in Europe, and higher in summer, notably in clear-sky conditions (up to 10 W m−2). The calculation of subsequent anomalies in the impact of aerosols on near-surface temperature shows positive anomalies in Europe larger than expected (up to 0.3 ∘C on average) given the anomalies on SDSR, highlighting possible semi-direct aerosol effects.
With regards to the probability density function, Fig. 17 confirms that the decrease in AOD led to reduced aerosol impact on SDSR in the five studied regions, since anomalies are positive only for dimming lower than 4 W m−2 and cooling lower than 0.2 ∘C. Moreover, these AOD anomalies are associated in winter with more frequent days with important cloud cover (higher than 80 %) in western Europe (EURNW and EURSW), thus reinforcing the reduction in aerosol direct effect in this regime. In summer, cloud cover is on average weaker in most of Europe, so that the regions with negative AOD anomalies (notably EURSW, EURNW and ALPS) have more frequent days with lower aerosol effects due to lower aerosol loads (Fig. 18). Nevertheless, in northern Europe, the AR regime is associated with lower pressure inducing more cloud cover, thus limiting the direct aerosol effect for unchanged AOD.
To summarize, the AR regime is unfavourable to aerosol loads over most of Europe, and their effect on SDSR and temperature is thus reduced. The direct effect is even reduced in northern Europe in summer when aerosol loads are close to average in this regime, due to increased cloud cover.
5.3 Synthesis
This analysis by weather regime has highlighted that aerosol loads strongly depend on the synoptic circulation, and that as a consequence, the aerosol effects on SDSR and near-surface temperature are strongly modulated by atmospheric circulation. The role of cloud cover is essential in this modulation. As an effort to synthesize the results presented in this section, Figs. 19 and 20 present a schematic map of the modulation of aerosol effects for each weather regime, respectively, in winter and in summer. On the one hand, weather regimes strongly influence aerosol loads, in all the areas delineated by the dashed lines where the plus/equal/minus symbols indicate the sign of variation. On the other hand, the modification of these aerosol loads by weather regimes has consequences on their impact on SDSR and near-surface temperature, also depending on cloud cover. The colour of the lines indicates if the aerosol impact is rather reduced (red), stable (green) or reinforced (blue) by the weather regime. The Sun and thermometer symbols indicate if this impact concerns, respectively, SDSR and/or near-surface temperature. All this information has been established from the analysis provided in the previous paragraphs.
These two figures clearly show that the blocking and NAO+ regimes are mostly favourable to aerosols over the Euro-Mediterranean area and reinforce their efficiency in their impacts on SDSR and near-surface temperature. This is due either to a decrease of cloud cover (e.g. in southern Europe in the NAO+ regime) or to an increase in aerosol loads (in western Europe in the blocking regime). However, the strong cloud cover in winter in northern Europe in the NAO+ regime prevents an increase in aerosol radiative forcing despite higher AOD. Besides, the NAO− and Atlantic Ridge regimes result in weakening the aerosol impacts on SDSR and near-surface temperature in most of Europe. This is the result of reduced AOD (e.g. in southern Europe in winter) or of increased cloud fraction (e.g. in western Europe in the winter NAO-regime). Both figures also highlight some subregional features, such as the contribution of dust aerosol effects in the summer Atlantic Low and Atlantic Ridge regimes.
The present study aims at better understanding climate–aerosol interactions and high-frequency aerosol variability at the synoptic scale over the Euro-Mediterranean region. The CNRM-ALADIN63 regional climate model driven by the ERA-Interim reanalysis has thus been used to better understand the interactions between the North Atlantic Oscillation, weather regimes and the different aerosol types from the interannual to daily timescales. The 40-year simulation (1979–2018) has first been evaluated for various climate parameters (near-surface temperature, precipitation, surface wind, sea-level pressure, TOA and surface radiation), as well as for the aerosol content against satellite and ground-based observations. Mean climate and seasonal variations are in general in good agreement between the model and observations, and significant improvements have been noted compared to the previous version of the model. The same conclusions can be drawn for the aerosols, also relevant for the aerosol daily distribution, although some discrepancies, especially the overestimation of nitrates in spring in northern Europe, have been noted. This model is consequently considered to be relevant for the study of climate–aerosol interactions at high temporal frequency over this region.
Two approaches have been used to explain the climate variability of aerosols, namely the NAO index and weather regimes. The first one has been shown to explain a significant part of the interannual variability, notably in winter for the export of dust aerosols over the Atlantic Ocean and the eastern Mediterranean, and in summer for the positive anomalies of anthropogenic aerosols over western Europe. Nevertheless, this index is not sufficient to fully understand the variations of aerosols in this region and their effects on regional climate. The use of weather regimes allows a better consideration of the different patterns in atmospheric circulation which drive the emission, transport and deposition of aerosols. The issue of knowing the variations of aerosols relatively to the variations of clouds is essential to understand differences in aerosol effects on shortwave surface radiation and near-surface temperature.
The four weather regimes usually defined in this area in winter and in summer bring significant information to answer this question. Two synthesis figures, namely Figs. 19 and 20, have been established to summarize the modulation of aerosol effects on surface radiation and near-surface temperature as a function of weather regimes. In the blocking regime, aerosols have been shown to be more efficient in their interactions with radiation, either because cloud cover is less important (in northern Europe) or because of higher concentrations due to more stable conditions (in southern Europe). In southern Europe, aerosol impacts on climate are also stronger in the NAO+ and Atlantic Low regimes due to drier conditions in winter and higher loads in summer. On the contrary, the strong cloud cover in winter in northern Europe prevents an increase in aerosol radiative forcing despite higher AOD. In the NAO− regime, aerosols are less efficient in their direct effect, either due to reduced AOD (e.g. in southern Europe) or due to the reinforcement in cloud cover (e.g. in western Europe). Finally, the AR regime is also unfavourable to aerosol radiative effects, since aerosol loads are generally weaker in this regime, and cloud cover is also higher in northern Europe.
As a matter of fact, this study highlights the need of considering high-frequency aerosol variations to better represent climate–aerosol interactions and therefore regional climate itself. This kind of processes cannot been properly assessed in regional climate models using monthly aerosol optical depth climatologies. Nabat et al. (2015b) have shown that during summer 2012 the use of interactive aerosols instead of AOD climatologies could lead to differences in surface radiation of about 5 W m−2 and in near-surface temperature of about 0.4 ∘C over the Mediterranean region. We could presume that a regional climate model with only monthly AOD climatology, as many of them exist in the Euro-CORDEX and Med-CORDEX programmes, for instance, could underestimate or overestimate the effects of aerosols in several weather regimes. Since cloud and aerosol variations are not uncorrelated, the frequency of clear-sky days with averaged and relatively high AOD could be, for example, overestimated in the event of using a monthly AOD data set.
The code of the regional climate model CNRM-ALADIN63 is available as follows: the SURFEX code is accessible using a CECILL-C licence (http://cecill.info/licences/Licence_CeCILL-C_V1-en.txt, last access: 16 July 2020) at http://www.umr-cnrm.fr/surfex (CNRM, 2020); OASIS3-MCT is available at https://portal.enes.org/oasis/download (CERFACS, 2020); XIOS is available at https://forge.ipsl.jussieu.fr/ioserver (IPSL, 2020); and the rest of the CNRM-ALADIN63 code is available upon request to the authors. The two climate simulations used in this study are also available by contacting the authors. All the other data sets used in this study (satellite and ground-based observations) for the evaluation of the model are available at the following websites: the LAADS website for MODIS data (https://ladsweb.modaps.eosdis.nasa.gov/missions-and-measurements/science-domain/aerosol, NASA, 2020a), the NASA EarthData website for MISR data (https://eosweb.larc.nasa.gov/project/misr/mil3mae_table, NASA, 2020b), CERES data (https://ceres.larc.nasa.gov/data/, NASA, 2020c) and QuikSCAT data (https://podaac.jpl.nasa.gov/dataset/QSCAT_L3_SFC_EASTWARD_WIND_1DEG_1MO, NASA, 2020d), the CloudSAT data processing center for the CALIOP CPR and CloudSAT Geoprof data sets (http://www.cloudsat.cira.colostate.edu/order-data, CloudSat DPC, 2020), the EUMETSAT CM-SAF website for the SARAH data set (https://wui.cmsaf.eu/safira/action/viewDoiDetails?acronym=SARAH_V002, EUMETSAT, 2020), the CRU website for the CRU temperature and precipitation data set (http://www.cru.uea.ac.uk/data, Climate Research Unit, 2020), the AERONET website for AERONET AOD data (https://aeronet.gsfc.nasa.gov/, NASA, 2020e), the BSRN website for BSRN data (https://bsrn.awi.de/?id=393, WRMC-BSRN, 2020) and the NOAA website for the NOA indices (https://www.cpc.ncep.noaa.gov/products/precip/CWlink/pna/nao.shtml, NOAA, 2020).
The supplement related to this article is available online at: https://doi.org/10.5194/acp-20-8315-2020-supplement.
PN designed and carried out the simulations, and led the writing of the paper. PN, SS, CC, MMa, MMi and DB contributed to the evaluation and the analysis of the simulations, while PN, MMa, MMi, BD, TD, RR and DSM contributed to the development of the model.
The authors declare that they have no conflict of interest.
This article is part of the special issue “CHemistry and AeRosols Mediterranean EXperiments (ChArMEx) (ACP/AMT inter-journal SI)”. It is not associated with a conference.
We are grateful for the support of the whole team in charge of the CNRM climate models and especially that of Antoinette Alias and Stéphane Sénési for their technical assistance. Supercomputing time and financial support of this publication was provided by Météo-France. We thank Julien Cattiaux for his advice on the use of NAO data sets. We acknowledge all the PI investigators of the AERONET stations and their staff for establishing and maintaining the 72 sites used in the present work. We are also grateful to the BSRN network for providing radiation data in the 10 stations used here. We would like also to thank the NASA Langley Research Center Atmospheric Science Data Center, the National Center for Atmospheric Research and the Climate Research Unit for providing the data sets used to evaluate our climate simulations. This work is part of the Med-CORDEX initiative (http://www.medcordex.eu, last access: 16 July 2020) and a contribution to the CORDEX Flagship Pilot Study (FPS) on aerosols. It also provides a contribution to the ChArMEx programme, part of the French multidisciplinary programme MISTRALS (Mediterranean Integrated Studies aT Regional And Local Scales).
This research has been supported by Météo-France.
This paper was edited by Pedro Jimenez-Guerrero and reviewed by two anonymous referees.
Alpert, P. and Ziv, B.: The Sharav Cyclone: Observations and some theoretical considerations, J. Geophys. Res., 94, 18495–18514, https://doi.org/10.1029/JD094iD15p18495, 1989. a
Andreas, E. L.: A New Sea Spray Generation Function for Wind Speeds up to 32 m s−1, J. Phys. Oceanogr., 28, 2175–2184, https://doi.org/10.1175/1520-0485(1998)028<2175:ANSSGF>2.0.CO;2, 1998. a
Barnston, A. G. and Livezey, R. E.: Classification, seasonality and persistence of low-frequency atmospheric circulation patterns, Mon. Weather Rev., 115, 1083–1126, https://doi.org/10.1175/1520-0493(1987)115<1083:CSAPOL>2.0.CO;2, 1987. a
Basart, S., Pérez, C., Cuevas, E., Baldasano, J. M., and Gobbi, G. P.: Aerosol characterization in Northern Africa, Northeastern Atlantic, Mediterranean Basin and Middle East from direct-sun AERONET observations, Atmos. Chem. Phys., 9, 8265–8282, https://doi.org/10.5194/acp-9-8265-2009, 2009. a
Belamari, S. and Pirani, A.: Validation of the optimal heat and momentum fluxes using the ORCA2LIM global oceanice model, MERSEA IP Deliverable, D.4.1.3, 88 pp., 2007. a, b
Bladé, I., Liebmann, B., Fortuny, D., and van Oldenborgh, G. J.: Observed and simulated impacts of the summer NAO in Europe: implications for projected drying in the Mediterranean region, Clim. Dynam., 39, 709–727, https://doi.org/10.1007/s00382-011-1195-x, 2012. a
Boé, J., Somot, S., Corre, L., and Nabat, P.: Large discrepancies in summer climate change over Europe as projected by global and regional climate models: causes and consequences, Clim. Dynam., 54, 2981–3002, https://doi.org/10.1007/s00382-020-05153-1, 2020. a
Bougeault, P.: Modeling the Trade-Wind Cumulus Boundary Layer. Part I: Testing the Ensemble Cloud Relations Against Numerical Data, J. Atmos. Sci., 38, 2414–2428, https://doi.org/10.1175/1520-0469(1981)038<2414:MTTWCB>2.0.CO;2, 1981. a
Cassou, C.: Intraseasonal interaction between the Madden–Julian Oscillation and the North Atlantic Oscillation, Nature, 455, 523–527, https://doi.org/10.1038/nature07286, 2008. a
Cassou, C., Terray, L., Hurrell, J. W., and Deser, C.: North Atlantic Winter Climate Regimes: Spatial Asymmetry, Stationarity with Time, and Oceanic Forcing, J. Climate, 17, 1055–1068, https://doi.org/10.1175/1520-0442(2004)017<1055:NAWCRS>2.0.CO;2, 2004. a, b
Cassou, C., Terray, L., and Philips, A. S.: Tropical Atlantic Influence on European Heat Waves , J. Climate, 18, 2805–2811, https://doi.org/10.1175/JCLI3506.1, 2005. a
Catry, B., Geleyn, J.-F., Bouyssel, F., Cedilnik, J., Brožková, R., Derková, M., and Mladek, R.: A new sub-grid scale lift formulation in a mountain drag parameterisation scheme, Meteorol. Z., 17, 193–208, https://doi.org/10.1127/0941-2948/2008/0272, 2008. a
Cattiaux, J., Vautard, R., Cassou, C., Yiou, P., Masson-Delmotte, V., and Codron, F.: Winter 2010 in Europe: A cold extreme in a warming climate, Geophys. Res. Lett., 37, L20704, https://doi.org/10.1029/2010GL044613, 2010. a
CERFACS: OASIS, available at: https://portal.enes.org/oasis/download, late access: 16 July 2020. a
Christensen, J. H. and Christensen, O. B.: A summary of the PRUDENCE model projections of changes in European climate by the end of this century, Climatic Change, 81, 7–30, 2007. a, b
Chronis, T., Papadopoulos, V., and Nikolopoulos, E. I.: QuickSCAT observations of extreme wind events over the Mediterranean and Black Seas during 2000–2008, Int. J. Climatol., 31, 2068–2077, https://doi.org/10.1002/joc.2213, 2010. a
Climate Research Unit: Data, University of East Anglia, available at: http://www.cru.uea.ac.uk/data, last access: 16 July 2020. a
CloudSat DPC: Data Access, available at: http://www.cloudsat.cira.colostate.edu/order-data, last access: 16 July 2020. a
CNRM: SURFEX, available at: http://www.umr-cnrm.fr/surfex, late access: 16 July 2020. a
Cuxart, J., Bougeault, P., and Redelsperger, J.-L.: A turbulence scheme allowing for mesoscale and large-eddy simulations, Q. J. Roy. Meteor. Soc., 126, 1–30, https://doi.org/10.1002/qj.49712656202, 2000. a, b
Daniel, M., Lemonsu, A., Déqué, M., Somot, S., Alias, A., and Masson, V.: Benefits of explicit urban parameterization in regional climate modeling to study climate and city interactions, Clim. Dynam., 52, 2745–2764, https://doi.org/10.1007/s00382-018-4289-x, 2018. a, b
Darmaraki, S., Somot, S., Sevault, F., and Nabat, P.: Past Variability of Mediterranean Sea Marine Heatwaves, Geophys. Res. Lett., 46, 9813–9823, https://doi.org/10.1029/2019GL082933, 2019. a
Decharme, B., Delire, C., Minvielle, M., Colin, J., Vergnes, J.-P., Alias, A., Saint-Martin, D., Séférian, R., Sénési, S., and Voldoire, A.: Recent Changes in the ISBA-CTRIP Land Surface System for Use in the CNRM-CM6 Climate Model and in Global Off-Line Hydrological Applications, J. Adv. Model. Earth Syst., 11, 1207–1252, https://doi.org/10.1029/2018MS001545, 2019. a, b, c, d
Dee, D. P., Uppala, S. M., Simmons, A. J., Berrisford, P., Poli, P., Kobayashi, S., Andrae, U., Balmaseda, M. A., Balsamo, G., Bauer, P., Bechtold, P., Beljaars, A. C. M., van de Berg, L., Bidlot, J., Bormann, N., Delsol, C., Dragani, R., Fuentes, M., Geer, A. J., Haimbergere, L., Healy, S. B., Hersbach, H., Hólm, E. V., Isaksen, L., Kallberg, P., Köhler, M., Matricardi, M., McNally, A. P., Monge-Sanzf, B. M., Morcrette, J.-J., Park, B.-K., Peubey, C., de Rosnaya, P., Tavolato, C., Thépaut, J.-N., and Vitart, F.: The ERA-Interim reanalysis: configuration and performance of the data assimilation system, Q. J. Roy. Meteor. Soc., 137, 553–597, https://doi.org/10.1002/qj.828, 2011. a, b
Dell'Aquila, A., Mariotti, A., Bastin, S., Calmanti, S., Cavicchia, L., Deque, M., Djurdjevic, V., Dominguez, M., Gaertner, M., and Gualdi, S.: Evaluation of simulated decadal variations over the Euro-Mediterranean region from ENSEMBLES to Med-CORDEX, Clim. Dynam., 51, 857–876, https://doi.org/10.1007/s00382-016-3143-2, 2018. a
Déqué, M., Dreveton, C., Braun, A., and Cariolle, D.: The ARPEGE/IFS atmosphere model: a contribution to the French community climate modelling, Clim. Dynam., 10, 249–266, https://doi.org/10.1007/BF00208992, 1994. a
Despiau, S., Cougnenc, S., and Resch, F.: Concentrations and size distributions of aerosol particles in coastal zone, J. Aerosol Sci., 27, 403–415, https://doi.org/10.1016/0021-8502(95)00558-7, 1996. a
Drugé, T., Nabat, P., Mallet, M., and Somot, S.: Model simulation of ammonium and nitrate aerosols distribution in the Euro-Mediterranean region and their radiative and climatic effects over 1979–2016, Atmos. Chem. Phys., 19, 3707–3731, https://doi.org/10.5194/acp-19-3707-2019, 2019. a, b, c, d, e
Eck, T. F., Holben, B. N., Reid, J. S., Dubovik, O., Smirnov, A., O'Neill, N. T., Slutsker, I., and Kinne, S.: Wavelength dependence of the optical depth of biomass burning, urban, and desert dust aerosols, J. Geophys. Res., 104, 31,333–31,349, https://doi.org/10.1029/1999JD900923, 1999. a
EUMETSAT: CM SAF Web User Interface, available at: https://wui.cmsaf.eu/safira/action/viewDoiDetails?acronym=SARAH_V002, last access: 16 July 2020. a
Fantini, A., Raffaele, F., Torma, C., Bacer, S., Coppola, E., Giorgi, F., Ahrens, B., Dubois, C., Sanchez, E., and Verdecchia, M.: Assessment of multiple daily precipitation statistics in ERA-Interim driven Med-CORDEX and EURO-CORDEX experiments against high resolution observations, Clim. Dynam., 51, 877–900, https://doi.org/10.1007/s00382-016-3453-4, 2018. a
Fécan, F., Marticorena, B., and Bergametti, G.: Parametrization of the increase of the aeolian erosion threshold wind friction velocity due to soil moisture for arid and semi-arid areas, Ann. Geophys., 17, 149–157, https://doi.org/10.1007/s005850050744, 1999. a
Flaounas, E., Kotroni, V., Lagouvardos, K., Kazadzis, S., Gkikas, A., and Hatzianastassiou, N.: Cyclone contribution to dust transport over the Mediterranean region, Atmos. Sci. Lett., 16, 473–478, https://doi.org/10.1002/asl.584, 2015. a
Fouquart, Y. and Bonnel, B.: Computations of solar heating of the earth's atmosphere – A new parameterization, Beitraege zur Physik der Atmosphaere, 53, 35–62, 1980. a, b
Fu, Q.: An Accurate Parameterization of the Solar Radiative Properties of Cirrus Clouds for Climate Models, J. Climate, 9, 2058–2082, https://doi.org/10.1175/1520-0442(1996)009<2058:AAPOTS>2.0.CO;2, 1996. a
Georgoulias, A. K., Alexandri, G., Kourtidis, K. A., Lelieveld, J., Zanis, P., Pöschl, U., Levy, R., Amiridis, V., Marinou, E., and Tsikerdekis, A.: Spatiotemporal variability and contribution of different aerosol types to the aerosol optical depth over the Eastern Mediterranean, Atmos. Chem. Phys., 16, 13853–13884, https://doi.org/10.5194/acp-16-13853-2016, 2016. a
Gillette, D. A.: Environmental Factors Affecting Dust Emission by Wind Erosion, John Wiley, New York, USA, 1979. a
Ginoux, P., Prospero, J., Torres, O., and Chin, M.: Long-term simulation of global dust distribution with the GOCART model: correlation with North Atlantic Oscillation, Environ. Model. Softw., 19, 113–128, https://doi.org/10.1016/S1364-8152(03)00114-2, 2004. a, b
Giorgi, F. and Chameides, W. L.: Rainout lifetimes of highly soluble aerosols and gases as inferred from simulations with a general circulation model, J. Geophys. Res., 91, 14367–14376, 1986. a
Gkikas, A., Hatzianastassiou, N., Mihalopoulos, N., Katsoulis, V., Kazadzis, S., Pey, J., Querol, X., and Torres, O.: The regime of intense desert dust episodes in the Mediterranean based on contemporary satellite observations and ground measurements, Atmos. Chem. Phys., 13, 12135–12154, https://doi.org/10.5194/acp-13-12135-2013, 2013. a
Grythe, H., Ström, J., Krejci, R., Quinn, P., and Stohl, A.: A review of sea-spray aerosol source functions using a large global set of sea salt aerosol concentration measurements, Atmos. Chem. Phys., 14, 1277–1297, https://doi.org/10.5194/acp-14-1277-2014, 2014. a, b
Guérémy, J.: A continuous buoyancy based convection scheme: one-and three-dimensional validation, Tellus A, 63, 687–706, https://doi.org/10.1111/j.1600-0870.2011.00521.x, 2011. a, b
Harris, I., Jones, P., Osborn, T., and Lister, D.: Updated high-resolution grids of monthly climatic observations – the CRU TS3.10 dataset, Int. J. Climatol., 34, 623–642, https://doi.org/10.1002/joc.3711, 2014. a
Hauglustaine, D. A., Balkanski, Y., and Schulz, M.: A global model simulation of present and future nitrate aerosols and their direct radiative forcing of climate, Atmos. Chem. Phys., 14, 11031–11063, https://doi.org/10.5194/acp-14-11031-2014, 2014. a
Herrmann, M., Somot, S., Calmanti, S., Dubois, C., and Sevault, F.: Representation of spatial and temporal variability of daily wind speed and of intense wind events over the Mediterranean Sea using dynamical downscaling: impact of the regional climate model configuration, Nat. Hazards Earth Syst. Sci., 11, 1983–2001, https://doi.org/10.5194/nhess-11-1983-2011, 2011. a
Hoesly, R. M., Smith, S. J., Feng, L., Klimont, Z., Janssens-Maenhout, G., Pitkanen, T., Seibert, J. J., Vu, L., Andres, R. J., Bolt, R. M., Bond, T. C., Dawidowski, L., Kholod, N., Kurokawa, J.-I., Li, M., Liu, L., Lu, Z., Moura, M. C. P., O'Rourke, P. R., and Zhang, Q.: Historical (1750–2014) anthropogenic emissions of reactive gases and aerosols from the Community Emissions Data System (CEDS), Geosci. Model Dev., 11, 369–408, https://doi.org/10.5194/gmd-11-369-2018, 2018. a
Holben, B. N., Eck, T. F., Slutsker, I., Tanré, D., Buis, J. P., Setzer, A., Vermote, E., Reagan, J. A., Kaufman, Y., Nakajima, T., Lavenu, F., Jankowiak, I., and Smirnov, A.: AERONET-A Federated Instrument Network and Data Archive for Aerosol Characterization, Remote Sens. Environ., 66, 1–16, https://doi.org/10.1016/S0034-4257(98)00031-5, 1998. a
Huneeus, N.: Assimilation variationnelle d'observations satellitaires dans un modèle atmosphérique d'aérosols, PhD thesis, Université de Lille 1, available at: https://www.theses.fr/2007LIL10010 (last access: 16 July 2020), 2007. a
Im, E., Durden, S. L., and Wu, C.: Cloud profiling radar for the CloudSat mission, IEEE T. Aero. Elec. Sys., 20, 15–18, https://doi.org/10.1109/MAES.2005.1581095, 2005. a
IPSL: XIOS, available at: https://forge.ipsl.jussieu.fr/ioserver, late access: 16 July 2020. a
Israelevich, P., Ganor, E., Alpert, P., Kishcha, P., and Stupp, A.: Predominant transport paths of Saharan dust over the Mediterranean Sea to Europe, J. Geophys. Res., 117, D02205, https://doi.org/10.1029/2011JD016482, 2012. a
Jaeglé, L., Quinn, P. K., Bates, T. S., Alexander, B., and Lin, J.-T.: Global distribution of sea salt aerosols: new constraints from in situ and remote sensing observations, Atmos. Chem. Phys., 11, 3137–3157, https://doi.org/10.5194/acp-11-3137-2011, 2011. a
Kaufman, Y. J., Tanré, D., and Boucher, O.: A satellite view of aerosolsin the climate system, Nature, 419, 215–223, 2002. a
Kok, J. F.: A scaling theory for the size distribution of emitted dust aerosols suggests climate models underestimate the size of the global dust cycle, P. Natl. Acad. Sci. USA, 108, 1016–1021, https://doi.org/10.1073/pnas.1014798108, 2011a. a
Kok, J. F.: Does the size distribution of mineral dust aerosols depend on the wind speed at emission?, Atmos. Chem. Phys., 11, 10149–10156, https://doi.org/10.5194/acp-11-10149-2011, 2011b. a
Kotlarski, S., Keuler, K., Christensen, O. B., Colette, A., Déqué, M., Gobiet, A., Goergen, K., Jacob, D., Lüthi, D., van Meijgaard, E., Nikulin, G., Schär, C., Teichmann, C., Vautard, R., Warrach-Sagi, K., and Wulfmeyer, V.: Regional climate modeling on European scales: a joint standard evaluation of the EURO-CORDEX RCM ensemble, Geosci. Model Dev., 7, 1297–1333, https://doi.org/10.5194/gmd-7-1297-2014, 2014. a, b, c, d, e, f
Lelieveld, J., Berresheim, H., Borrmann, S., Crutzen, P. J., Dentener, F. J., Fischer, H., Feichter, J., Flatau, P. J., Heland, J., Holzinger, R., Korrmann, R., Lawrence, M. G., Levin, Z., Markowicz, K. M., Mihalopoulos, N., Minikin, A., Ramanathan, V., de Reus, M., Roelofs, G. J., Scheeren, H. A., Sciare, J., Schlager, H., Schultz, M., Siegmund, P., Steil, B., Stephanou, E. G., Stier, P., Traub, M., Warneke, C., Williams, J., and Ziereis, H.: Global Air Pollution Crossroads over the Mediterranean, Science, 298, 794–799, https://doi.org/10.1126/science.1075457, 2002. a
Le Moigne, P., Colin, J., and Decharme, B.: Impact of lake surface temperatures simulated by the Flake scheme in the CNRM-CM5 climate model, Tellus A, 68, 31274, https://doi.org/10.3402/tellusa.v68.31274, 2016. a, b
Loeb, N. G., Wielicki, B. A., Doelling, D. R., Smith, G. L., Keyes, D. F., Kato, S., Manalo-Smith, N., and Wong, T.: Toward Optimal Closure of the Earth's Top-of-Atmosphere Radiation Budget, J. Climate, 22, 748–766, https://doi.org/10.1175/2008JCLI2637.1, 2009. a
Lopez, P.: Implementation and validation of a new prognostic large-scale cloud and precipitation scheme for climate and data-assimilation purposes, Q. J. Roy. Meteor. Soc., 128, 229–257, https://doi.org/10.1256/00359000260498879, 2002. a, b
Lott, F. and Miller, F. J.: A new subgrid‐scale orographic drag parametrization: Its formulation and testing, Q. J. Roy. Meteor. Soc., 123, 101–127, https://doi.org/10.1002/qj.49712353704, 1997. a
Mace, G. G. and Zhang, Q.: The CloudSat radar-lidar geometrical profile product (RL-GeoProf): Updates, improvements and selected results, J. Geophys. Res., 119, 9441–9462, https://doi.org/10.1002/2013JD021374, 2014. a
Mace, G. G., Zhang, Q., Vaughan, M., Marchand, R., Stephens, G., Trepte, C., and Winker, D.: A description of hydrometeor layer occurrence statistics derived from the first year of merged CloudSat and CALIPSO data, J. Geophys. Res., 114, D00A26, https://doi.org/10.1029/2007JD009755, 2009. a
Marinou, E., Amiridis, V., Binietoglou, I., Tsikerdekis, A., Solomos, S., Proestakis, E., Konsta, D., Papagiannopoulos, N., Tsekeri, A., Vlastou, G., Zanis, P., Balis, D., Wandinger, U., and Ansmann, A.: Three-dimensional evolution of Saharan dust transport towards Europe based on a 9-year EARLINET-optimized CALIPSO dataset, Atmos. Chem. Phys., 17, 5893–5919, https://doi.org/10.5194/acp-17-5893-2017, 2017. a
Marticorena, B. and Bergametti, G.: Modeling the atmosphere dust cycle: 1. Design of a soil-derived dust emission scheme, J. Geophys. Res., 100, 16415–16430, 1995. a, b
Matthes, K., Funke, B., Andersson, M. E., Barnard, L., Beer, J., Charbonneau, P., Clilverd, M. A., Dudok de Wit, T., Haberreiter, M., Hendry, A., Jackman, C. H., Kretzschmar, M., Kruschke, T., Kunze, M., Langematz, U., Marsh, D. R., Maycock, A. C., Misios, S., Rodger, C. J., Scaife, A. A., Seppälä, A., Shangguan, M., Sinnhuber, M., Tourpali, K., Usoskin, I., van de Kamp, M., Verronen, P. T., and Versick, S.: Solar forcing for CMIP6 (v3.2), Geosci. Model Dev., 10, 2247–2302, https://doi.org/10.5194/gmd-10-2247-2017, 2017. a
Meinshausen, M., Vogel, E., Nauels, A., Lorbacher, K., Meinshausen, N., Etheridge, D. M., Fraser, P. J., Montzka, S. A., Rayner, P. J., Trudinger, C. M., Krummel, P. B., Beyerle, U., Canadell, J. G., Daniel, J. S., Enting, I. G., Law, R. M., Lunder, C. R., O'Doherty, S., Prinn, R. G., Reimann, S., Rubino, M., Velders, G. J. M., Vollmer, M. K., Wang, R. H. J., and Weiss, R.: Historical greenhouse gas concentrations for climate modelling (CMIP6), Geosci. Model Dev., 10, 2057–2116, https://doi.org/10.5194/gmd-10-2057-2017, 2017. a
Ménégoz, M., Guemas, V., y Melia, D. S., and Voldoire, A.: Winter interactions between aerosols and weather regimes in the North Atlantic European region, J. Geophys. Res., 115, D09201, https://doi.org/10.1029/2009JD012480, 2010. a
Menon, S., Genio, A. D. D., Koch, D., and Tselioudis, G.: GCM Simulations of the Aerosol Indirect Effect: Sensitivity to Cloud Parameterization and Aerosol Burden, J. Atmos. Sci., 59, 692–713, https://doi.org/10.1175/1520-0469(2002)059<0692:GSOTAI>2.0.CO;2, 2002. a
Meurdesoif, Y.: Xios fortran reference guide, iPSL, available at: http://forge.ipsl.jussieu.fr/ioserver/svn/XIOS/trunk/doc/XIOS_reference_guide.pdf (last access: 16 July 2020), 2018. a
Michelangeli, P. A., Vautard, R., and Legras, B.: Weather regimes: Recurrence and quasi stationarity, J. Atmos. Sci., 52, 1237–1256, https://doi.org/10.1175/1520-0469(1995)052<1237:WRRAQS>2.0.CO;2, 1995. a
Michou, M., Nabat, P., and Saint-Martin, D.: Development and basic evaluation of a prognostic aerosol scheme (v1) in the CNRM Climate Model CNRM-CM6, Geosci. Model Dev., 8, 501–531, https://doi.org/10.5194/gmd-8-501-2015, 2015. a, b
Michou, M., Nabat, P., Saint-Martin, D., Bock, J., Decharme, B., Mallet, M., Roehrig, R., Séférian, R., Sénési, S., and Voldoire, A.: Present-day and historical aerosol and ozone characteristics in CNRM CMIP6 simulations, J. Adv. Model. Earth Syst., 12, e2019MS001816, https://doi.org/10.1029/2019MS001816, 2020. a, b
Mlawer, E. J., Taubman, S. J., Brown, P. D., Iacono, M. J., and Clough, S. A.: Radiative transfer for inhomogeneous atmospheres: RRTM, a validated correlated-k model for the longwave, J. Geophys. Res., 102, 16663–16682, 1997. a, b
Morcrette, J.-J., Barker, H. W., Cole, J. N. S., Iacono, M. J., and Pincus, R.: Impact of a New Radiation Package, McRad, in the ECMWF Integrated Forecasting System, Mon. Weather Rev., 136, 4773–4798, https://doi.org/10.1175/2008MWR2363.1, 2008. a, b
Morcrette, J.-J., Boucher, O., Jones, L., Salmond, D., Bechtold, P., Beljaars, A., Benedetti, A., Bonet, A., Kaiser, J. W., Razinger, M., Schulz, M., Serrar, S., Simmons, J., Sofiev, M., Suttie, M., Tompkins, A. M., and Untch, A.: Aerosol analysis and forecast in the european centre for medium-range weather forecasts integrated forecast system: Forward modeling, J. Geophys. Res., 114, D06206, https://doi.org/10.1029/2008JD011235, 2009. a, b, c, d
Moulin, C., Lambert, C. E., Dulac, F., and Dayan, U.: Control of atmospheric export of dust from North Africa by the North Atlantic Oscillation, Nature, 387, 691–694, https://doi.org/10.1038/42679, 1997. a, b
Moulin, C., Lambert, C. E., Dayan, U., Masson, V., Ramonet, M., Bousquet, P., Legrand, M., Balkanski, Y. J., Guelle, W., Marticorena, B., Bergametti, G., and Dulac, F.: Satellite climatology of African dust transport in the Mediterranean atmosphere, J. Geophys. Res., 103, 13137–13144, https://doi.org/10.1029/98JD00171, 1998. a
Müller, R., Pfeifroth, U., Träger-Chatterjee, C., Trentmann, J., and Cremer, R.: Digging the METEOSAT Treasure—3 Decades of Solar Surface Radiation, Remote Sens., 7, 8067–8101, https://doi.org/10.3390/rs70608067, 2015. a
Nabat, P., Solmon, F., Mallet, M., Kok, J. F., and Somot, S.: Dust emission size distribution impact on aerosol budget and radiative forcing over the Mediterranean region: a regional climate model approach, Atmos. Chem. Phys., 12, 10545–10567, https://doi.org/10.5194/acp-12-10545-2012, 2012. a
Nabat, P., Somot, S., Mallet, M., Chiapello, I., Morcrette, J. J., Solmon, F., Szopa, S., Dulac, F., Collins, W., Ghan, S., Horowitz, L. W., Lamarque, J. F., Lee, Y. H., Naik, V., Nagashima, T., Shindell, D., and Skeie, R.: A 4-D climatology (1979–2009) of the monthly tropospheric aerosol optical depth distribution over the Mediterranean region from a comparative evaluation and blending of remote sensing and model products, Atmos. Meas. Tech., 6, 1287–1314, https://doi.org/10.5194/amt-6-1287-2013, 2013. a
Nabat, P., Somot, S., Mallet, M., Sanchez-Lorenzo, A., and Wild, M.: Contribution of anthropogenic sulfate aerosols to the changing Euro-Mediterranean climate since 1980, Geophys. Res. Lett., 41, 5605–5611, https://doi.org/10.1002/2014GL060798, 2014. a, b
Nabat, P., Somot, S., Mallet, M., Sevault, F., Chiacchio, M., and Wild, M.: Direct and semi-direct aerosol radiative effect on the Mediterranean climate variability using a Regional Climate System Model, Clim. Dynam., 44, 1127–1155, https://doi.org/10.1007/s00382-014-2205-6, 2015a. a, b, c, d, e, f, g, h
Nabat, P., Somot, S., Mallet, M., Michou, M., Sevault, F., Driouech, F., Meloni, D., di Sarra, A., Di Biagio, C., Formenti, P., Sicard, M., Léon, J.-F., and Bouin, M.-N.: Dust aerosol radiative effects during summer 2012 simulated with a coupled regional aerosol–atmosphere–ocean model over the Mediterranean, Atmos. Chem. Phys., 15, 3303–3326, https://doi.org/10.5194/acp-15-3303-2015, 2015b. a, b, c, d, e, f, g, h, i, j, k, l, m, n
NASA: Aerosol – LAADS DAAC, available at: https://ladsweb.modaps.eosdis.nasa.gov/missions-and-measurements/science-domain/aerosol, last access: 16 July 2020a. a
NASA: MIL3MAE, ASDC, available at: https://eosweb.larc.nasa.gov/project/misr/mil3mae_table, last access: 16 July 2020b. a
NASA: CERES Data Products – CERES, available at: https://ceres.larc.nasa.gov/data/, last access: 16 July 2020c. a
NASA: SeaWinds on QuikSCAT Level 3 Surface Eastward Wind for Climate Model Comparison, PO.DAAC/JPL/NASA, available at: https://podaac.jpl.nasa.gov/dataset/QSCAT_L3_SFC_EASTWARD_WIND_1DEG_1MO, last access: 16 July 2020d. a
NASA: Aerosol Robotic Network (AERONET), available at: https://aeronet.gsfc.nasa.gov/, last access: 16 July 2020e. a
NOAA: Climate Prediction Center – Teleconnections: North Atlantic Oscillation, available at: https://www.cpc.ncep.noaa.gov/products/precip/CWlink/pna/nao.shtml, last access: 16 July 2020. a
O'Dowd, C. D., Smith, M. H., Consterdine, I. E., and Lowe, J. A.: Marine aerosol, sea-salt, and the marine sulphur cycle: a short review, Atmos. Environ., 31, 73–80, https://doi.org/10.1016/S1352-2310(96)00106-9, 1997. a
Ohmura, A., Dutton, E. G., Forgan, B., Fröhlich, C., Gilgen, H., Hegner, H., Heimo, A., König-Langlo, G., McArthur, B., Müller, G., Philipona, R., Pinker, R., Whitlock, C. H., Dehne, K., and Wild, M.: Baseline Surface Radiation Network (BSRN/WCRP): New Precision Radiometry for Climate Research, B. Am. Meteorol. Soc., 79, 2115–2136, https://doi.org/10.1175/1520-0477(1998)079<2115:BSRNBW>2.0.CO;2, 1998. a
Panthou, G., Vrac, M., Drobinski, P., Bastin, S., and Li, L.: Impact of model resolution and Mediterranean sea coupling on hydrometeorological extremes in RCMs in the frame of HyMeX and MED-CORDEX, Clim. Dynam., 51, 915–932, https://doi.org/10.1007/s00382-016-3374-2, 2018. a
Papadimas, C. D., Hatzianastassiou, N., Mihalopoulos, N., Querol, X., and Vardavas, I.: Spatial and temporal variability in aerosol properties over the Mediterranean basin based on 6-year (2000–2006) MODIS data, J. Geophys. Res., 113, D11205, https://doi.org/10.1029/2007JD009189, 2008. a, b, c
Pfeifroth, U., Kothe, S., Müller, R., Trentmann, J., Hollmann, R., Fuchs, P., and Werscheck, M.: Surface Radiation Data Set – Heliosat (SARAH) – Edition 2, Satellite Application Facility on Climate Monitoring, Satellite Application Facility on Climate Monitoring (CM SAF), https://doi.org/10.5676/EUM_SAF_CM/SARAH/V002, 2017. a
Pierre, C., Bergametti, G., Marticorena, B., Mougin, E., Bouet, C., and Schmechtig, C.: Impact of vegetation and soil moisture seasonal dynamics on dust emissions over the Sahel, J. Geophys. Res., 117, D06114, https://doi.org/10.1029/2011JD016950, 2012. a
Pinto, J. G., Zacharias, S., Fink, A. H., Leckebusch, G. C., and Ulbrich, U.: Factors contributing to the development of extreme North Atlantic cyclones and their relationship with the NAO, Clim. Dynam., 32, 711–737, https://doi.org/10.1007/s00382-008-0396-4, 2009. a
Piriou, J.-M., Redelsperger, J.-L., Geleyn, J.-F., Lafore, J.-P., and Guichard, F.: An Approach for Convective Parameterization with Memory: Separating Microphysics and Transport in Grid-Scale Equations, J. Atmos. Sci., 64, 4127–4139, https://doi.org/10.1175/2007JAS2144.1, 2007. a, b
Radu, R., Déqué, M., and Somot, S.: Spectral nudging in a spectral regional climate model, Tellus, 60A, 898–910, https://doi.org/10.1111/j.1600-0870.2008.00341.x, 2008. a
Reddy, M. S., Boucher, O., Bellouin, N., Schulz, M., Balkanski, Y., Dufresne, J., and Pham, M.: Estimates of global multicomponent aerosol optical depth and direct radiative perturbation in the Laboratoire de Météorologie Dynamique general circulation model, J. Geophys. Res., 110, D10S16, https://doi.org/10.1029/2004JD004757, 2005. a
Ricard, J.-L. and Royer, J.-F.: A statistical cloud scheme for use in an AGCM, Ann. Geophys., 11, 1095–1115, 1993. a
Ruti, P. M., Marullo, S., D'Ortenzio, F., and Tremant, M.: Comparison of analyzed and measured wind speeds in the perspective of oceanic simulations over the Mediterranean basin: Analyses, QuikSCAT and buoy data, J. Marine Syst., 70, 33–48, https://doi.org/10.1016/j.jmarsys.2007.02.026, 2007. a
Sanchez-Gomez, E., Terray, L., and Joly, B.: Intra‐seasonal atmospheric variability and extreme precipitation events in the European‐Mediterranean region, Geophys. Res. Lett., 35, L15708, https://doi.org/10.1029/2008GL034515, 2008. a
Sanchez-Gomez, E., Somot, S., and Déqué, M.: Ability of an ensemble of regional climate models to reproduce weather regimes over Europe-Atlantic during the period 1961–2000, Clim. Dynam., 33, 723–736, https://doi.org/10.1007/s00382-008-0502-7, 2009. a
Sanchez-Gomez, E., Somot, S., Josey, S. A., Dubois, C., Elguindi, N., and Déqué, M.: Evaluation of Mediterranean Sea water and heat budgets simulated by an ensemble of high resolution regional climate models, Clim. Dynam., 37, 2067–2086, https://doi.org/10.1007/s00382-011-1012-6, 2011. a
Sayer, A. M., Smirnov, A., Hsu, N. C., and Holben, B. N.: A pure marine aerosol model, for use in remote sensing applications, J. Geophys. Res., 117, D05213, https://doi.org/10.1029/2011JD016689, 2012. a
Sayer, A. M., Munchak, L. A., Hsu, N. C., Levy, R. C., Bettenhausen, C., and Jeong, M.: MODIS Collection 6 aerosol products: Comparison between Aqua's e‐Deep Blue, Dark Target, and “merged” data sets, and usage recommendations, J. Geophys. Res.-Atmos., 119, 13965–13989, https://doi.org/10.1002/2014JD022453, 2014. a
Schepanski, K., Mallet, M., Heinold, B., and Ulrich, M.: North African dust transport toward the western Mediterranean basin: atmospheric controls on dust source activation and transport pathways during June–July 2013, Atmos. Chem. Phys., 16, 14147–14168, https://doi.org/10.5194/acp-16-14147-2016, 2016. a, b
Séférian, R., Nabat, P., Michou, M., Saint-Martin, D., Voldoire, A., Colin, J., Decharme, B., Delire, C., Berthet, S., Chevallier, M., Sénési, S., Franchisteguy, L., Vial, J., Mallet, M., Joetzjer, E., Geoffroy, O., Guérémy, J.-F., Moine, M.-P., Msadek, R., Ribes, A., Rocher, M., Roehrig, R., Salas-y Mélia, D., Sanchez, E., Terray, L., Valcke, S., Waldman, R., Aumont, O., Bopp, L., Deshayes, J., Éthé, C., and Madec, G.: Evaluation of CNRM Earth-System model, CNRM-ESM 2-1: role of Earth system processes in present-day and future climate, J. Adv. Model. Earth Syst., 11, 4182–4227, https://doi.org/10.1029/2019MS001791, 2019. a
Sevault, F., Somot, S., Alias, A., Dubois, C., Lebeaupin-Brossier, C., Nabat, P., Adloff, F., Déqué, M., and Decharme, B.: A fully coupled Mediterranean regional climate system model: design and evaluation of the ocean component for the 1980–2012 period, Tellus A, 66, 23967, https://doi.org/10.3402/tellusa.v66.23967, 2014. a
Slingo, A.: A GCM Parameterization for the Shortwave Radiative Properties of Water Clouds, J. Atmos. Sci., 46, 1419–1427, https://doi.org/10.1175/1520-0469(1989)046<1419:AGPFTS>2.0.CO;2, 1989. a
Sommeria, G. and Deardorff, J. W.: Subgrid-scale condensation in models of nonprecipitating clouds, J. Atmos. Sci., 34, 344–355, https://doi.org/10.1175/1520-0469(1977)034<0344:SSCIMO>2.0.CO;2, 1977. a
Somot, S., Houpert, L., Sevault, F., Testor, P., Bosse, A., Taupier-Letage, I., Bouin, M.-N., Waldman, R., Cassou, C., Sanchez-Gomez, E., de Madron, X. D., Adloff, F., Nabat, P., and Herrmann, M.: Characterizing, modelling and understanding the climate variability of the deep water formation in the North-Western Mediterranean Sea, Clim. Dynam., 51, 1179–1210, https://doi.org/10.1007/s00382-016-3295-0, 2018. a
Spyrou, C., Kallos, G., Mitsakou, C., Athanasiadis, P., Kalogeri, C., and Iacono, M. J.: Modeling the radiative effects of desert dust on weather and regional climate, Atmos. Chem. Phys., 13, 5489–5504, https://doi.org/10.5194/acp-13-5489-2013, 2013. a
Taylor, K. E., Doutriaux, C., and Peterschmitt, J.-Y.: Climate Model Output Rewriter (CMOR), Version 00, Department of Energy, USA, 2004. a
Thomason, L. W., Ernest, N., Millán, L., Rieger, L., Bourassa, A., Vernier, J.-P., Manney, G., Luo, B., Arfeuille, F., and Peter, T.: A global space-based stratospheric aerosol climatology: 1979–2016, Earth Syst. Sci. Data, 10, 469–492, https://doi.org/10.5194/essd-10-469-2018, 2018. a
Tompkins, A. M., Cardinali, C., Morcrette, J.-J., and Rodwell, M.: Influence of aerosol climatology on forecasts of the African Easterly Jet, Geophys. Res. Lett., 32, L10801, https://doi.org/10.1029/2004GL022189, 2005. a
van Marle, M. J. E., Kloster, S., Magi, B. I., Marlon, J. R., Daniau, A.-L., Field, R. D., Arneth, A., Forrest, M., Hantson, S., Kehrwald, N. M., Knorr, W., Lasslop, G., Li, F., Mangeon, S., Yue, C., Kaiser, J. W., and van der Werf, G. R.: Historic global biomass burning emissions for CMIP6 (BB4CMIP) based on merging satellite observations with proxies and fire models (1750–2015), Geosci. Model Dev., 10, 3329–3357, https://doi.org/10.5194/gmd-10-3329-2017, 2017. a
Vautard, R.: Multiple Weather Regimes over the North Atlantic: Analysis of Precursors and Successors, Mon. Weather Rev., 118, 2056–2081, https://doi.org/10.1175/1520-0493(1990)118<2056:MWROTN>2.0.CO;2, 1990. a, b
Vautard, R., Kadygrov, N., Iles, C., Boberg, F., Buonomo, E., Bülow, K., Coppola, E., Corre, L., van Meijgaard, E., Nogherotto, R., Sandstad, M., c. Schwingshackl, Somot, S., Aalbers, E., Christensen, O. B., Ciarlo, J. M., Demory, M.-E., Giorgi, F., Jacob, D., Jones, R. G., Keuler, K., Kjellström, E., Lenderink, G., Levavasseur, G., Nikulin, G., Sillmann, J., Solidoro, C. Lund Sørland,, S., Steger, C., Teichmann, C., Warrach-Sagi, K., and Wulfmeyer, V.: Evaluation of the large EURO-CORDEX regional climate model ensemble, J. Geophys. Res.-Atmos., in revision, 2020. a
Voldoire, A., Saint-Martin, D., Sénési, S., Decharme, B., Alias, A., Chevallier, M., Colin, J., Guérémy, J.-F., Michou, M., Moine, M.-P., Nabat, P., Roehrig, R., Salas y Mélia, D., Séférian, R., Valcke, S., Beau, I., Belamari, S., Berthet, S., Cassou, C., Cattiaux, J., Deshayes, J., Douville, H., Ethé, C., Franchisteguy, L., Geoffroy, O., Lévy, C., Madec, G., Meurdesoif, Y., Msadek, R., Ribes, A., Sanchez-Gomez, E., Terray, L., and Waldman, R.: Evaluation of CMIP6 DECK experiments with CNRM-CM6-1, J. Adv. Model. Earth Syst., 11, 2177–2213, https://doi.org/10.1029/2019MS001683, 2019. a
Watson, L., Michou, M., Nabat, P., and Saint-Martin, D.: Assessment of CNRM coupled ocean-atmosphere model sensitivity to the representation of aerosols, Clim. Dynam., 51, 2877–2895, https://doi.org/10.1007/s00382-017-4054-6, 2018. a
Winker, D. M., Hunt, B. H., and McGill, M. J.: Initial performance assessment of CALIOP, Geophys. Res. Lett., 34, L19803, https://doi.org/10.1029/2007GL030135, 2007. a
WRMC-BSRN: Baseline Surface Radiation Network: Conditions of data release, Alfred-Wegener-Institute, available at: https://bsrn.awi.de/?id=393, last access: 16 July 2020. a
Zanis, P., Ntogras, C., Zakey, A., Pytharoulis, I., and Karacostas, T.: Regional climate feedback of anthropogenic aerosols over Europe using RegCM3, Clim. Res., 52, 267–278, https://doi.org/10.3354/cr01070, 2012. a
Zubler, E. M., Folini, D., Lohmann, U., Lüthi, D., Muhlbauer, A., Pousse-Nottelmann, S., Schär, C., and Wild, M.: Implementation and evaluation of aerosol and cloud microphysics in a regional climate model, J. Geophys. Res., 116, D02211, https://doi.org/10.1029/2010JD014572, 2011. a
- Abstract
- Introduction
- Methodology
- Evaluation of the ALD-AER simulation
- Relations between aerosols and the North Atlantic Oscillation
- Aerosol effects and weather regimes
- Conclusions
- Code and data availability
- Author contributions
- Competing interests
- Special issue statement
- Acknowledgements
- Financial support
- Review statement
- References
- Supplement


