the Creative Commons Attribution 4.0 License.
the Creative Commons Attribution 4.0 License.
 | 06 May 2020
Physico-chemical characterization of urban aerosols from specific combustion sources in West Africa at Abidjan in Côte d'Ivoire and Cotonou in Benin in the frame of the DACCIWA program
Catherine Liousse
Elhadji Thierno Doumbia
Armelle Baeza-Squiban
Hélène Cachier
Jean-Francois Léon
Véronique Yoboué
Aristique Barthel Akpo
Corinne Galy-Lacaux
Benjamin Guinot
Cyril Zouiten
Hongmei Xu
Eric Gardrat
Sekou Keita
Urban air pollution in West Africa has yet to be well characterized. In the frame of DACCIWA (Dynamics-Aerosol-Chemistry-Cloud Interactions in West Africa) program, intensive measurement campaigns were performed in Abidjan (Côte d'Ivoire) and Cotonou (Benin), in dry (January 2016 and 2017) and wet (July 2015 and 2016) seasons, at different sites chosen to be representative of African urban combustion sources, i.e., domestic fires (ADF), traffic (AT) and waste burning (AWB) sources in Abidjan and traffic source in Cotonou (CT). Both the size distribution of particulate matter (PM) and their chemical composition including elemental carbon (EC), organic carbon (OC), water-soluble organic carbon (WSOC), water-soluble inorganic ions (WSI) and trace metals were examined. Results show very high PM concentrations at all sites and a well-marked seasonality as well as a strong spatial variation. The average PM2.5 mass concentrations during the wet season are 517.3, 104.1, 90.3, and 69.1 µg m−3 at the ADF, CT, AT, and AWB sites, respectively. In the dry season, PM2.5 concentrations decrease to 375.7 µg m−3 at the ADF site, while they increase to 269.7, 141.3, and 175.3 µg m−3 at the CT, AT, and AWB sites, respectively. The annual PM2.5 levels at almost all sites are significantly higher than the WHO guideline level of 10 µg m−3. As for PM mass, (EC) and (OC) concentrations are also maximal at the ADF site, accounting for up to 69 % of the total PM mass. Such a high content is mainly linked to wood burning for domestic cooking and commercial food smoking activities. Dust contributions are dominant at CT (57 %–80 %), AT (20 %–70 %), and AWB (30 %–69 %) sites and especially in the coarse and fine-particle modes at the CT site and in the coarse fraction at the AT site, which may be explained by the impact of long-range desert-dust transport and resuspended particles from the roads, in addition to anthropogenic sources. The contributions of WSI to the total PM mass, mainly driven by chloride, nitrate, and calcium in the fine and/or large particles, are highly variable according to the sites but remain less than 30 %. Values are generally 1–3 times higher in the wet season than in the dry season. This is due not only to anthropogenic emissions but also to nitrate formation by reaction processes and natural emissions. The concentrations of trace elements reflect well the trends in dust at the traffic and AWB sites, with a predominance of Al, Na, Ca, Fe, and K, keys markers of crustal dust. This study constitutes an original database that characterizes specific African combustion sources.
- Article
(16156 KB) - Full-text XML
- BibTeX
- EndNote


The impact of anthropogenic pollution on environment and health has been demonstrated by numerous studies in Europe and North America, which have contributed to the implementation of emission reduction policies. By contrast, air pollution in Africa is far from being well characterized, although it is suspected to be responsible for negative health outcomes (WHO, 2014). This is a major problem since Africa is an intense emitter of pollution from anthropogenic sources that include domestic fires, vehicular traffic, waste burning, and growing oil and mining industries. It has also one of the fastest growing urban populations in the world, especially in West and East Africa (United Nations, 2019). As a consequence, it has been shown that massive urbanization and rapid economic growth could be responsible for tripling anthropogenic emissions in Africa between 2000 and 2030 (Liousse et al., 2014). Moreover, it is important to recall the impact of biomass burning and dust sources in the African atmospheric composition, especially occurring during the dry season. All of this results in a major degradation of urban air quality and an impact on the health of exposed populations. Only a few studies on this subject have been conducted in West Africa (Val et al., 2013; Dieme et al., 2012; Kouassi et al., 2009) despite the high atmospheric pollutant concentrations already measured to be on the same order as in Asian megacities and well above WHO international standards (WHO, 2014).
West Africa is then a unique laboratory to study urban pollution. Previous studies conducted under the framework of the AMMA (Analyses Multidisciplinaires de la Mousson Africaine) and POLCA (POLlution des Capitales Africaines) programs have revealed very high average particulate mass concentrations in Cotonou (Benin), Bamako (Mali), Dakar (Senegal), and Yaoundé (Cameroon) during the dry season (Doumbia et al., 2012; Val et al., 2013), suggesting that the population may be affected by negative health outcomes. For example, during the dry season in Bamako (Mali) and Dakar (Senegal), Val et al. (2013) showed that the inflammatory impact of combustion aerosol depends on the type of emission sources and determined the predominant role of particulate organic matter. This is consistent with global findings showing that fine and ultrafine aerosol fractions, as well as their content in trace metals and organic compounds, induce biological effects due to their ability to reach the distal lung (Cassee et al., 2013). Such reasons highlight the need to better understand the size-speciation of the aerosol chemical composition of the main West African anthropogenic sources during the different seasons. Within this context, the DACCIWA (Dynamics-Aerosol-Chemistry-Cloud Interactions in West Africa) program dedicated a specific work package to “Air Pollution and Health” dealing with pollutant characterization related to health issues through toxicological studies and epidemiological studies.
Campaigns have been organized from December 2014 to March 2017 in Abidjan and Cotonou. The strategy was to measure aerosol chemical composition in different sites, representative of the main prevailing urban sources in West Africa following Liousse et al. (2014) and Keita et al. (2018). Two typical traffic-sampling sites were chosen, one in Abidjan (Côte d'Ivoire) and another one in Cotonou (Benin), to take into account differences in terms of fleets, type of fuel used, and quality of roads. Indeed, in Cotonou, the majority of population uses two-wheel vehicles using gasoline fuel or gasoline and oil fuel, whereas in Abidjan, the vehicle fleet is dominated by four-wheel engines using diesel fuel. Measurements were also performed at domestic fire and waste burning sites, both located in Abidjan.
For a period of 2 years, PM2.5 mass and carbonaceous aerosol were weekly measured, and results are discussed in Djossou et al. (2018). In this paper, we focus on the results from the intensive campaigns. We present measurements obtained at each site during the wet and dry seasons of the studied periods: (i) PM size distribution and mass concentrations; (ii) PM chemical composition including carbonaceous aerosol, water-soluble organic carbon, water-soluble inorganic ions, dust, and trace elements in different size fractions. Experimental method including description of sites, types of measurements and analyses, and meteorological conditions will be presented in the Sect. 2, whereas results and discussion are discussed in the Sects. 3 and 4 of the paper, respectively.
2.1 Description of sites
Measurement campaigns have been performed in wet seasons (20–26 July 2015 and 4–13 July 2016) and dry seasons (7–15 January 2016 and 5–14 January 2017) at three sites in Abidjan (Côte d'Ivoire), representative of different sources, i.e., ADF for Abidjan domestic fires, AWB for Abidjan waste burning, and AT for Abidjan traffic (Fig. 1), and one traffic site in Cotonou (Benin) (Fig. 2).
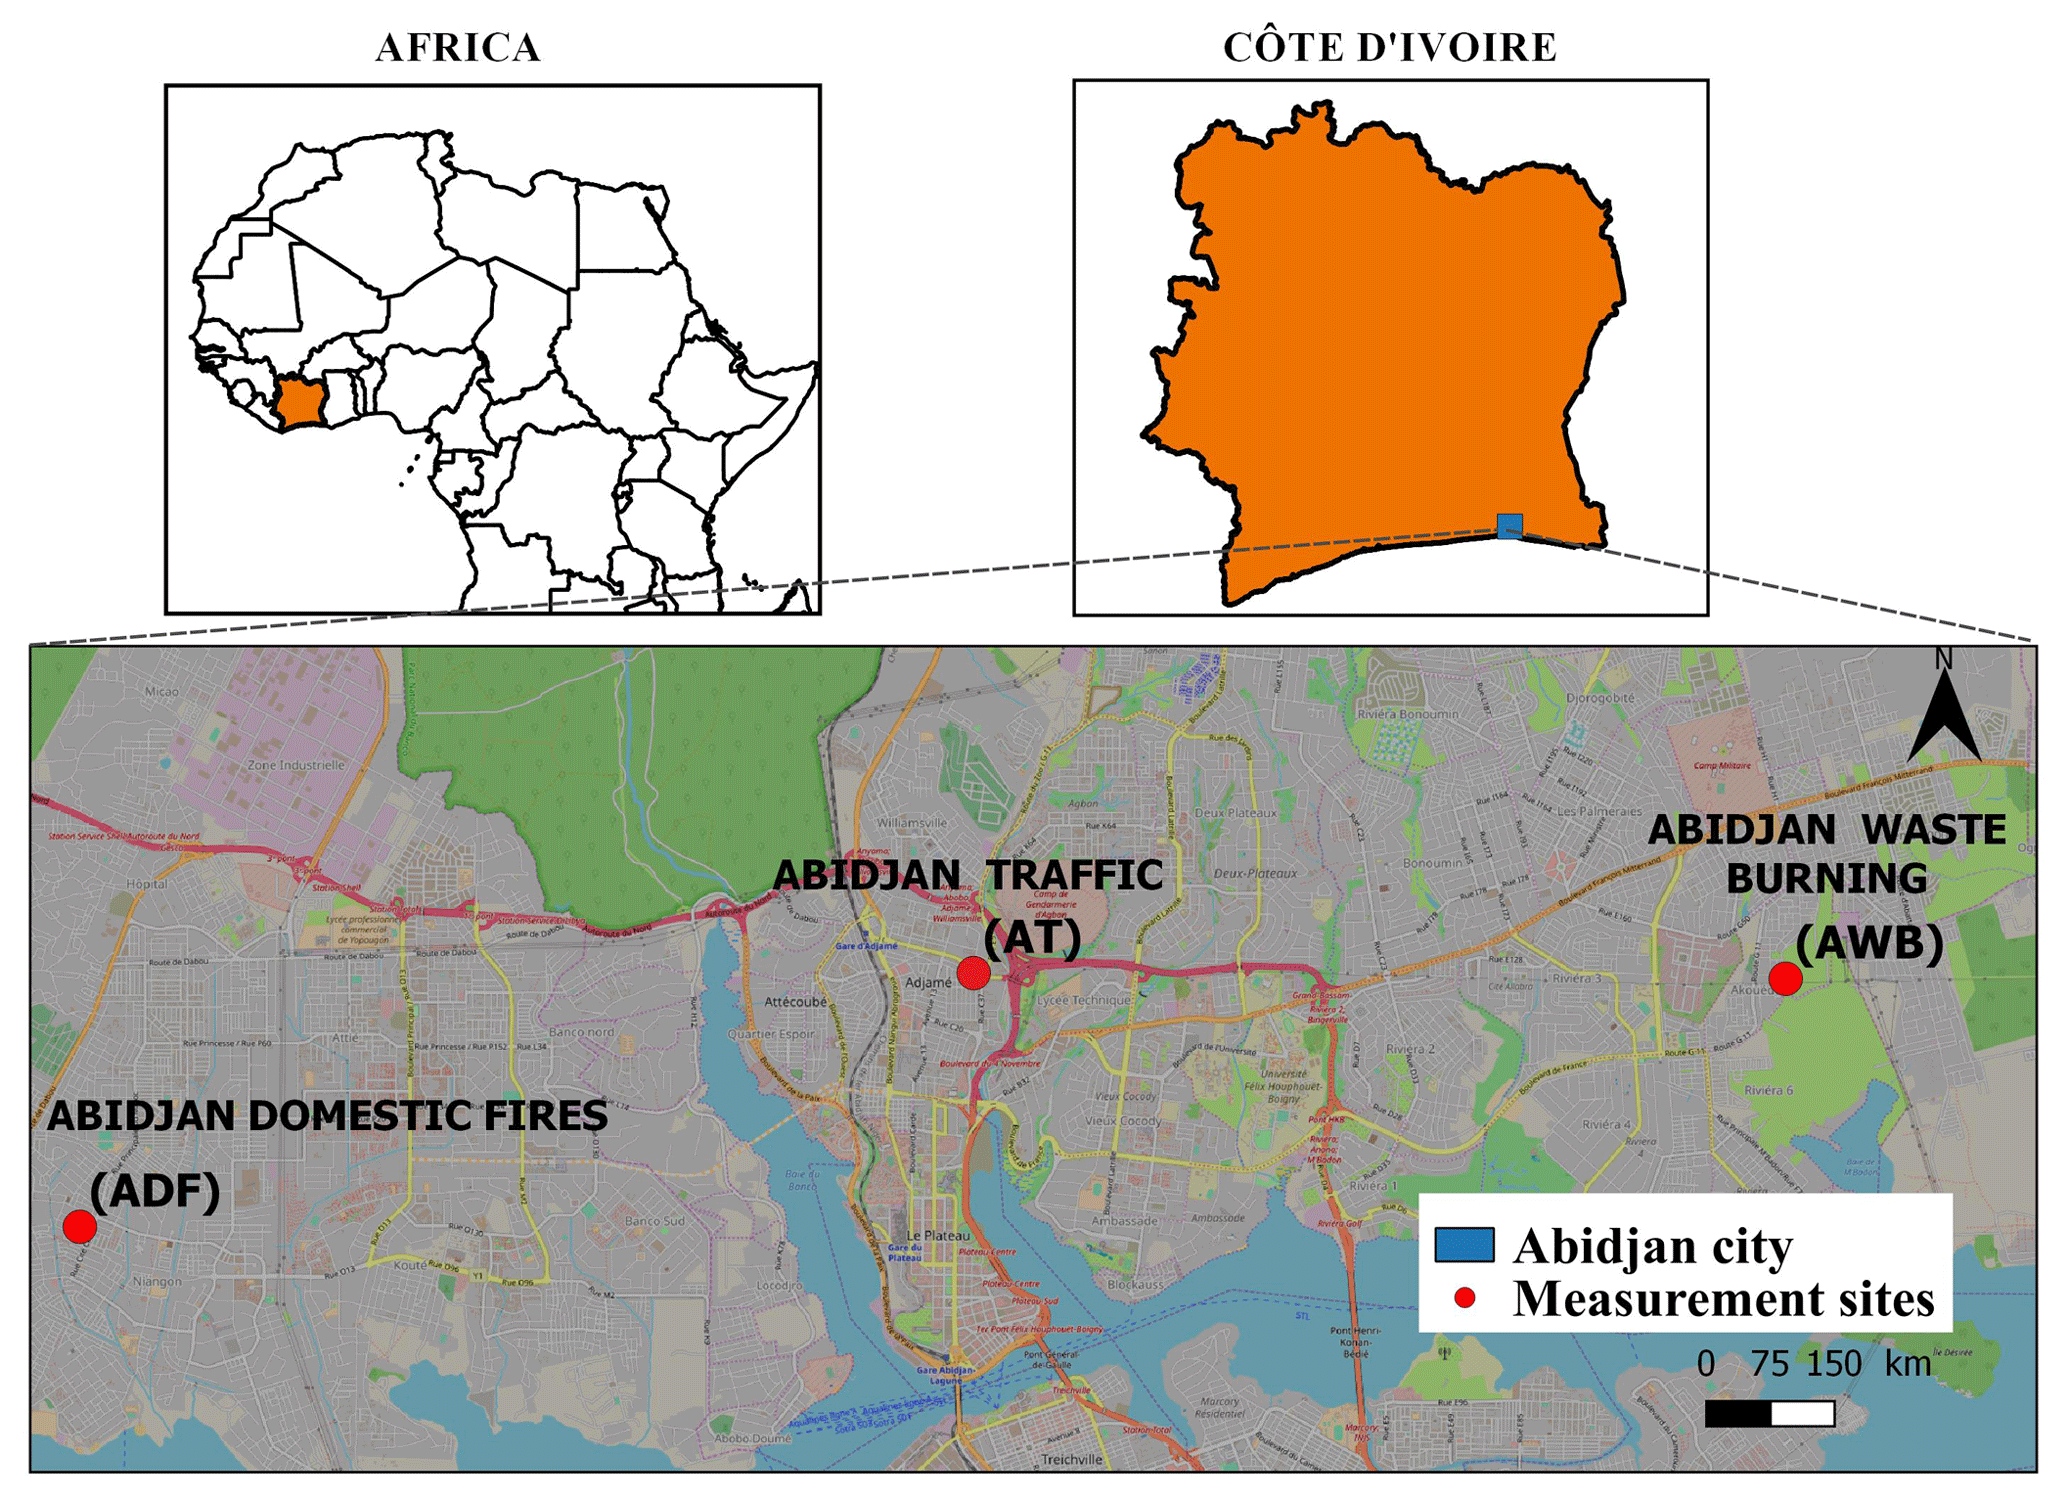
Figure 1Map of the city of Abidjan reporting the geographical location of DACCIWA urban sampling sites.
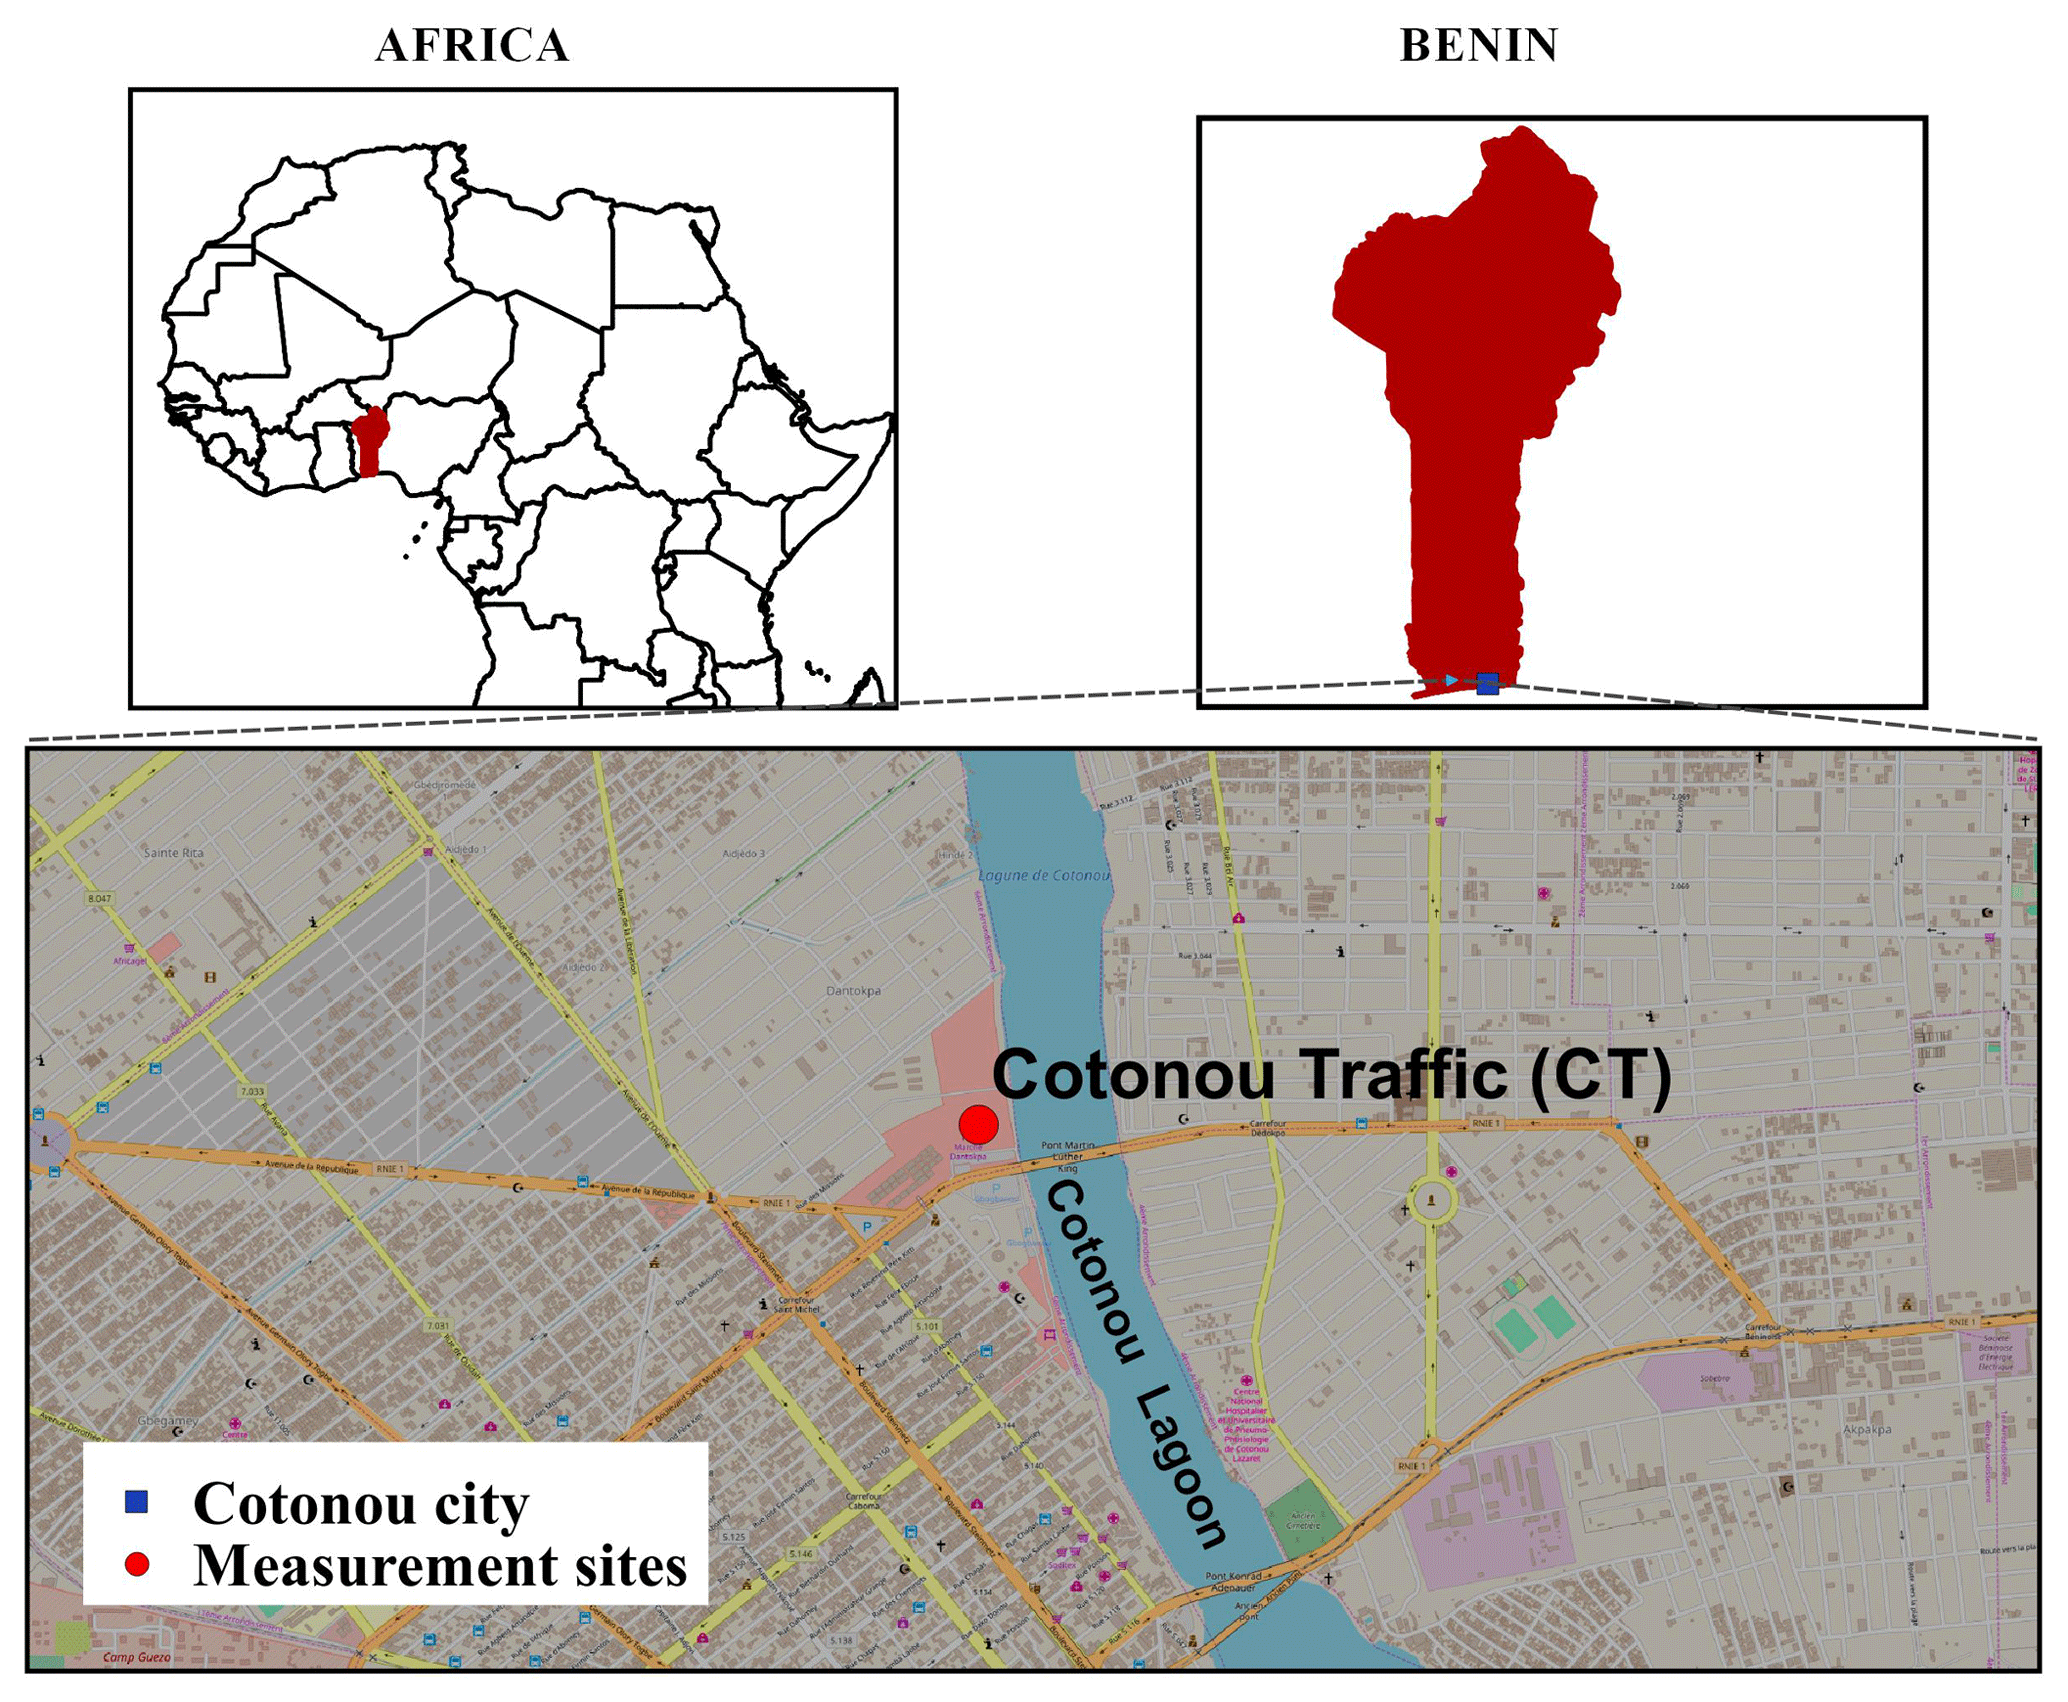
Figure 2Map of the city of Cotonou reporting the geographical location of DACCIWA urban sampling site.
As shown in Fig. 3, which presents pictures of the different sampling sites, the ADF site (5∘19′44′′ N, 4∘06′21′′ W) is situated on a platform, 5 m above ground level, in Yopougon Bracody district near a market (Fig. 1). This geographical area is highly populated with various small commercial activities such as fish and meat smoking by women. There are also many formal and informal settlements, which mainly use wood and charcoal as a source of fuel for private and professional combustion activities. Other sources of concern contributing to the mix of pollutant emissions in the area include transportation-related emissions, biomass burning, garbage bins or small landfills, and various other fugitive sources. The AT site (5∘21′14′′ N, 4∘01′04′′ W) is located in Adjamé, on the roof of the “220 pharmacie logement” building, about 7 m above ground level and roughly 10 m away from the main road. This site, close to the Adjamé market and to a bus station, is highly affected by traffic (Gbaka, bus, taxi, woro-woro, private cars, etc.). The AWB site (5∘21′12′′ N, 3∘56′16′′ W) is located in Akouédo in the district of Cocody, on the roof of “ Talafiguié”, a building 15 m above ground level. This site, close to the big municipal landfill of Abidjan operational since 1965 and now covering an area of 153 ha, is submitted to frequent waste burning pollution. The Cotonou traffic (CT) (6∘22′19′′ N, 2∘26′5′′ E) site is located in Cotonou, on the “Sogema” building roof, about 7 m above ground level. This site is close to the Dantokpa market and also to the biggest crossroad of Cotonou (intersection of four main roads). This site is highly influenced by intense traffic activities. As previously mentioned, such a site is interesting because the vehicle fleet and fuels are different in Cotonou compared to Abidjan in the following ways: (1) there are many two-wheel vehicles in Cotonou, while a few only in Abidjan; (2) in Cotonou, gasoline is of poor quality due to the illegal fuel transport from Nigeria, and (3) the roads are in worse conditions in Cotonou than in Abidjan.
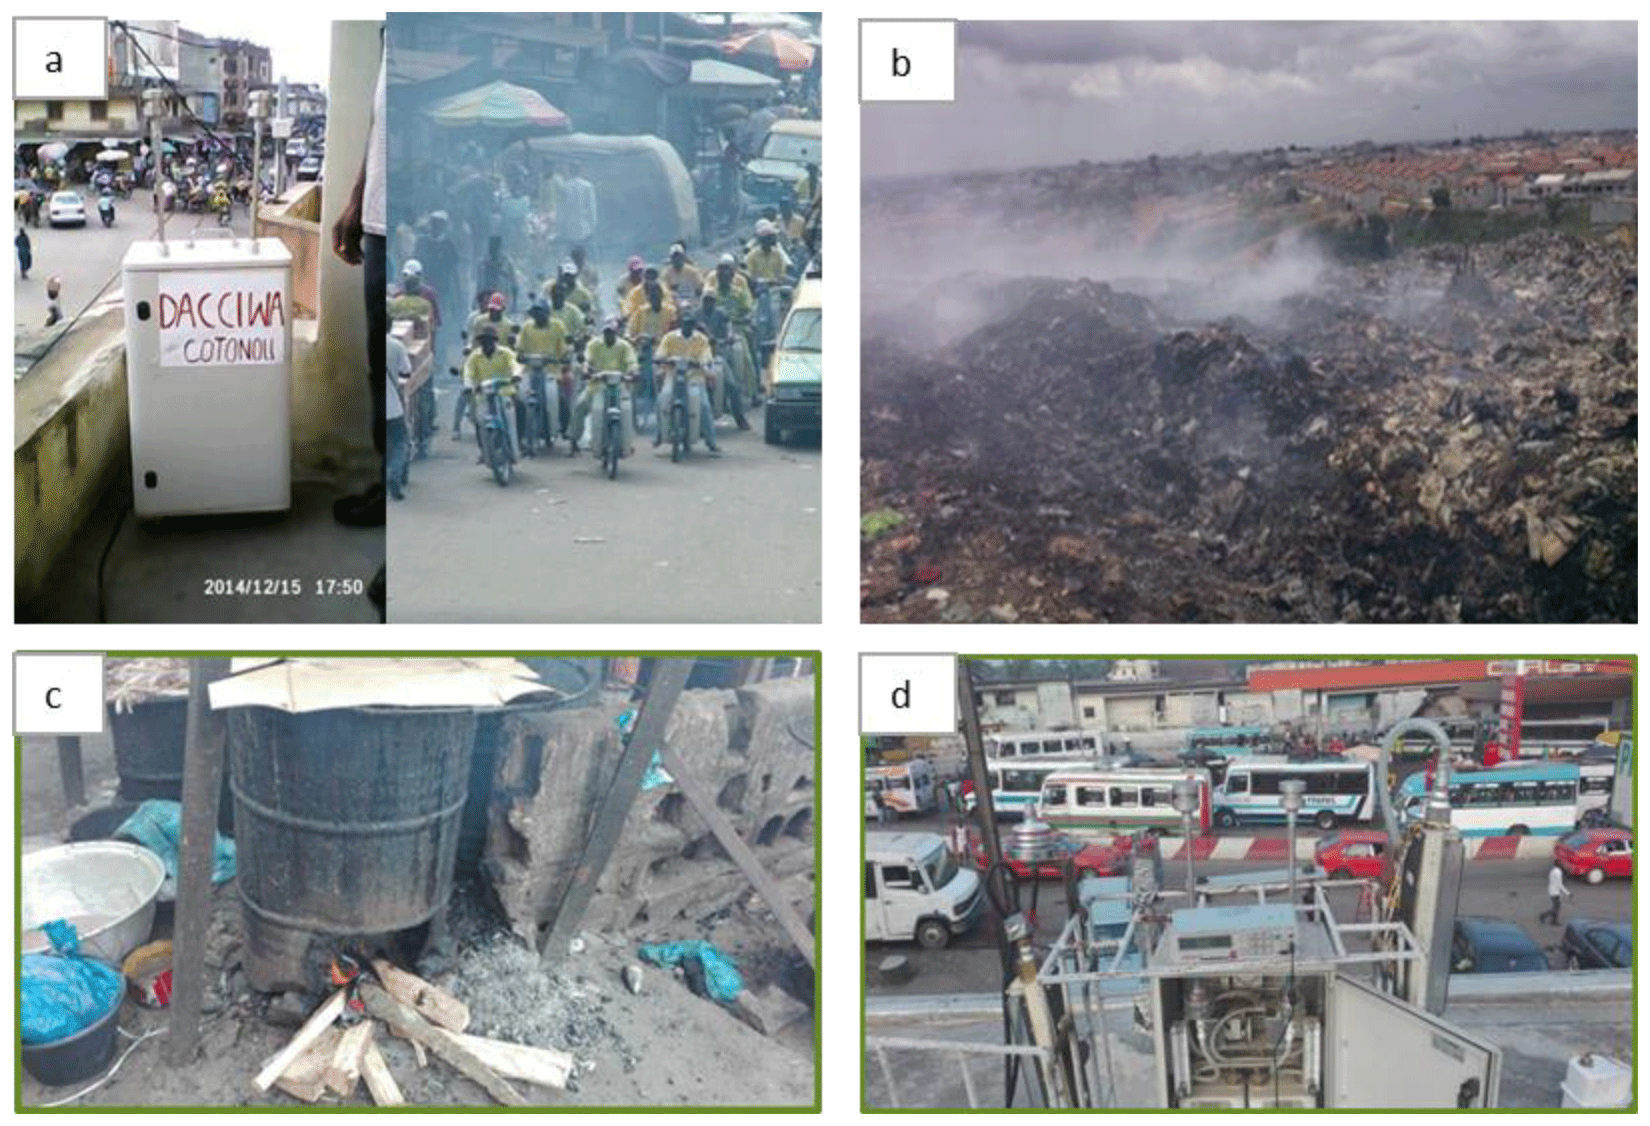
Figure 3Pictures of the different sampling sites: (a) traffic in Cotonou (Benin, CT station); (b) waste burning in Abidjan (Côte d'Ivoire, AWB station); (c) domestic fire, showing smoking activity in Yopougon, Abidjan (Côte d'Ivoire, ADF station); and (d) “woro-woro and Gbaka” traffic in Abidjan (Côte d'Ivoire, AT station).
2.2 Measurements
During each intensive campaign and on each site, two 3 h samples collected with cascade impactors operating in parallel are obtained for 3 consecutive days (i.e., six size-resolved samples per site during each campaign), to allow size-speciated characterization of the aerosol chemical composition. Note that the choice of the 3 h periods is linked to the period of maximum pollution for each site as shown by preliminary studies, e.g., morning at the ADF site (07:00–10:00 am), afternoon at the AT site (04:00–07:00 pm, and morning at the CT site (07:00–10:00 am). There is no specific period at AWB site since the activities are roughly the same during the day. The first impactor with four stages (PM>2.5, PM2.5−1, PM1−0.2, PM<0.2) includes four quartz fiber filters (QMA, Whatman) for mass and carbonaceous aerosol (EC, OC, and WSOC analysis). The second impactor with three stages (PM>2.5; PM2.5−1; PM1−0.1) is equipped with three Teflon filters (Zefluor, Pall Corporation®), dedicated to water-soluble ions species and trace elements. Due to operational problems in July 2016, this second three-stage cascade impactor is replaced by another three-stage cascade impactor with different size cuts (PM>10, PM10−2.5, PM2.5−1). For consistency, results will be presented as an ultrafine (UF), fine (F), and coarse (C) classification. The two first stages (PM>2.5 and PM2.5−1) being considered as the coarse particulate fraction, the PM1−0.1 or PM1−0.2 stage, the fine particulate fraction and the PM<0.2 stage, the ultrafine fraction.
All of the filters are prepared and analyzed at the Laboratoire d'Aerologie in Toulouse under different protocols described in the following paragraphs. Note that the quartz filters are pre-fired before sampling.
2.3 Analyses
2.3.1 Gravimetric analyses
Aerosol mass concentrations are obtained using a high-precision balance (Sartorius MC21S), placed under a controlled temperature and humidity atmosphere (Person and Tymen, 2005). Before weighing, the filters are kept 24 h in the weighing room at an ambient relative humidity of 30±15 %. The filters are weighed before and after sampling. The result of a gravimetric measurement consists of an average of two to four weighings whose differences do not exceed 5 µg. The standard error on a gravimetric measurement is therefore less than 10 µg, typically representing less than 5 % of the particles mass.
2.3.2 Carbonaceous aerosols
Carbonaceous aerosol is determined with thermal analysis with a two-step method adapted from Cachier et al. (1989). Two aliquots of the same filter are separately analyzed.
One portion is directly analyzed for its total carbon content (TC). The other portion is first submitted to a pre-combustion step (2 h at 340 ∘C under pure oxygen) in order to eliminate organic carbon (OC) and then analyzed for its elemental carbon (EC) content. Organic carbon (OC) concentrations are calculated as the differences between TC and EC. Note that the aerosol carbon content is quantified by a nondispersive infrared (NDIR) detector with G4 ICARUS instrument with a detection limit on the order of 2 µg C cm−2. Uncertainty is on the order of 5 % for TC, while being in the range of 5 %–20 %, for EC and OC.
2.3.3 Water-soluble organic carbon analysis
WSOC measurements are performed using a total organic carbon analyzer (Sievers M9). A detailed description of this technique is reported in Favez et al. (2008). Briefly, the full oxidation of total organic carbon into CO2 is obtained by coupling chemical oxidation (with ammonium persulphate) and UV light. CO2 is then quantified by conductivity. Analyses are conducted on 20 mL of solution extracts. For UF samples, solutions to be analyzed are obtained using a total filter surface of 3 cm2 (6 cm×0.5 cm punches symmetrically taken out of each QMA filter), whereas, for C and F sizes, due to the geometry of the spots at the surface of the filters, samples are divided into equivalent parts (1∕2 or 1∕4 of 47 mm filters, the rest of the filters being used for carbonaceous analysis). The extraction protocol consists of 16 h soaking under soft shaking in an Erlen–Meyer flask containing 20 mL of ultrapure water. Prior to WSOC analysis, water extracts are filtered through Teflon (PTFE) filters (0.2 µm pore size diameter) in order to remove any suspended particles. Measurement uncertainty, given by the manufacturer, is on the order of 7 %. The overall calculated blank value is on the order of 2.27±0.33 µg C cm−2, which represents 16.4±8.5 % of the mean WSOC content. For each sample, duplicate analyses show good reproducibility.
2.3.4 Water-soluble ionic species
Water-soluble ionic species (Na+, , K+, Mg2+, Ca2+, , , and Cl−) are analyzed using an ion chromatograph (IC), following the analytical protocol described in Adon et al. (2010). Briefly, the aerosol water-soluble fraction is first extracted from half-sampled Teflon filter (the other part being used for trace element analysis), with a 10 min sonication in plastic vials including 6 mL or 10 mL of purified water with a controlled resistivity of 18.2 MΩ. Then these vials are subjected to ionic chromatograph analysis or stored at +4 ∘C if not analyzed immediately. Cations are analyzed with Dionex DX-100 and anions with Dionex DX-500 with a detection limit of 1 to 6 ppb depending on ionic species. Uncertainties in the range of 1 %–50 % are found depending on ionic species.
2.3.5 Trace elements
The protocol to measure trace element concentrations is developed and performed at the Laboratory of Environmental Geosciences of Toulouse. Half-sampled Teflon filters (the other part being used for water-soluble ionic species; see below) are mineralized by acid digestion with a 10 mL concentrated HNO3 and 0.5 mL HF solution (Lamaison, 2006) using a closed vessel microwave accelerated reaction system (MARS 5, CEM Corporation) at high pressure (700 psi) (Celo et al., 2010). The digestion is realized in three steps: a rise in temperature at 130 ∘C in 3 min and holding for 1 min, then a second rise at 160 ∘C in 1 min and holding for 30 s, and finally a third rise to 180 ∘C in 1 min and holding for 3 min. After a 12 h cooling period, the solutions are evaporated at 80 ∘C and concentrated in 7 mL of 2 % concentrated HNO3 solution, before analysis by inductively coupled plasma mass spectrometry (ICP-MS), which is performed with a 7500 CE Agilent Technologies instrument equipped with a collision cell and using In and Re as internal standards. The detection limit is less than 10 ppt. For all of the samples, the final blank values and detection limit on filters are taken into account for final concentrations calculations. In this work, we consider 13 trace metals: Al, Ti, Cr, Mn, Fe, Ni, Cu, Zn, Ba, La, Th, Pb, and Cd.
2.3.6 Dust calculation
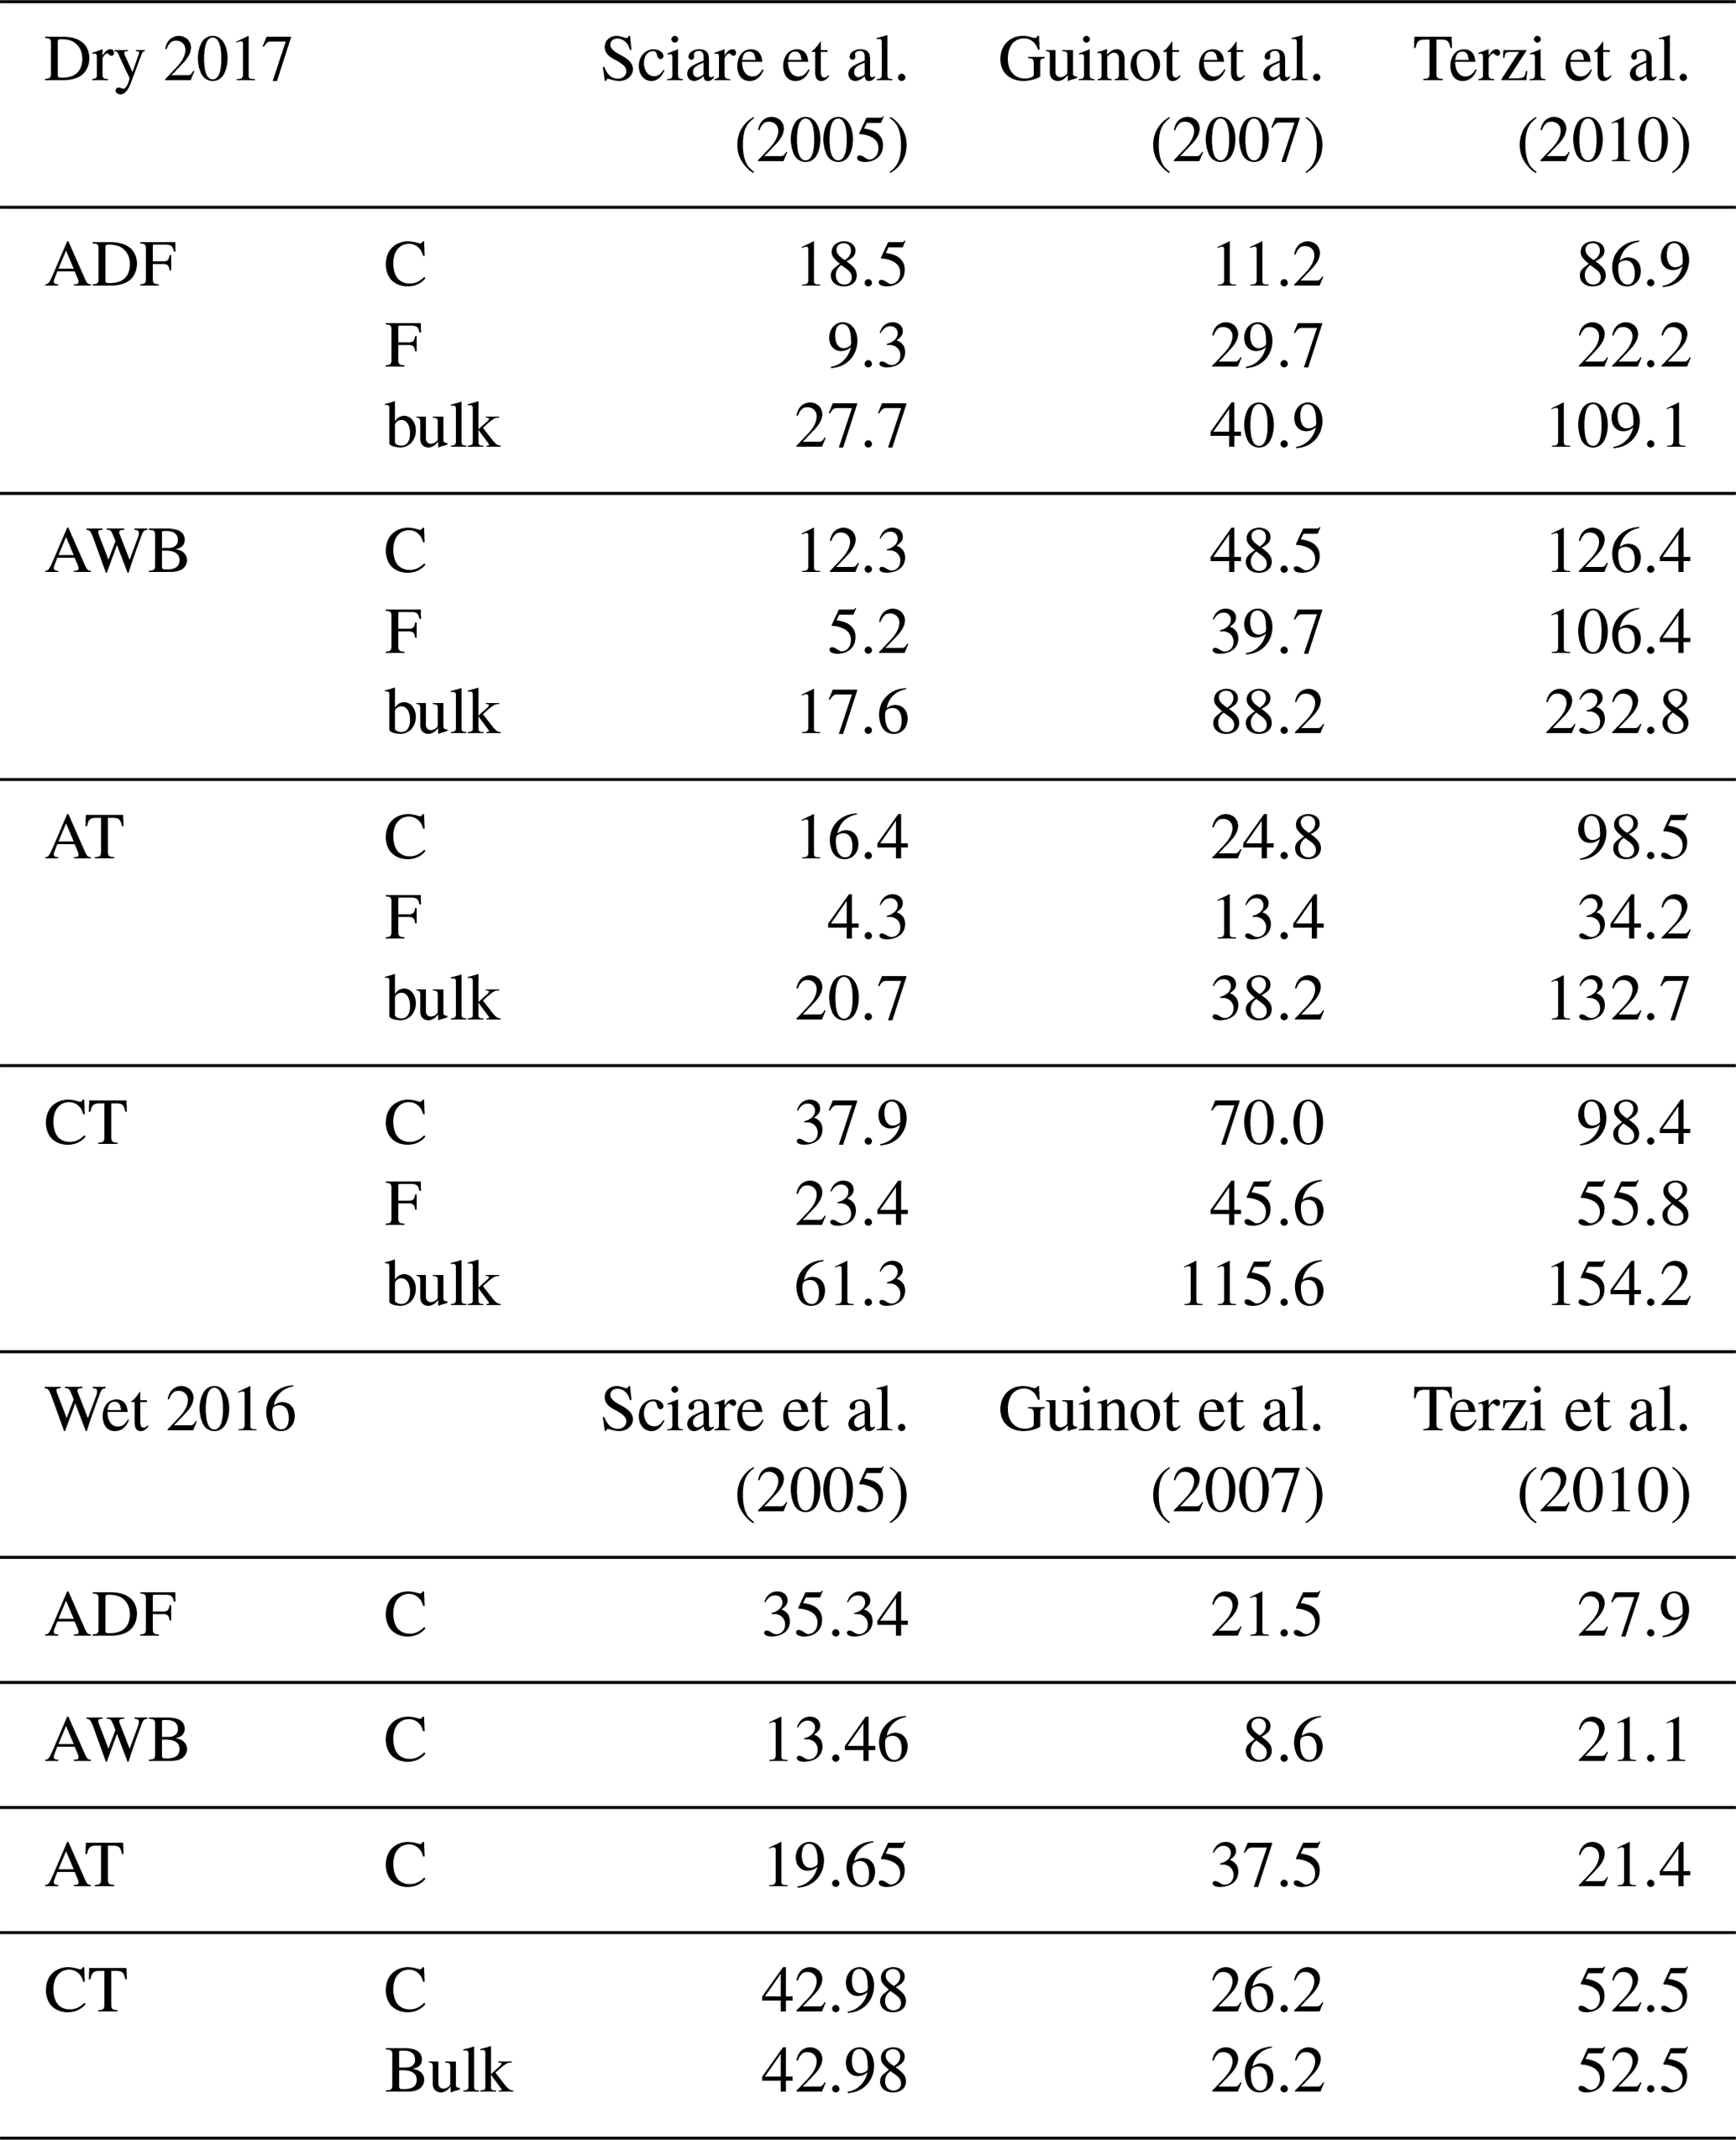
Many methods can be used to quantify dust concentrations. We have selected three methods (Sciare et al., 2005; Guinot et al., 2007; Terzi et al., 2010) to underline the uncertainties linked to dust estimates.
The Sciare et al. (2005) method consists of using soluble calcium data obtained with ionic chromatography (IC), to estimate the dust concentrations following the relationship: dust = 10.96 × nss-Ca2+, where nss-Ca2+ (= 1.02 × Ca2+–0.038 × Na+) refers to non-sea-salt calcium concentration.
The Guinot et al. (2007) method is based on a chemical closure where fine- and coarse-particle aerosols are separated into four components (EC, POM, WSI, and dust). EC, WSI, and total aerosol mass are directly experimentally determined (see paragraphs below). POM concentrations are obtained from OC concentrations that are experimentally determined and k, the OC ∕ POM conversion factor. Dust concentrations are obtained from measured Ca2+ concentrations and f, the abundance of calcium in dust. The k and f values are obtained from a linear regression (L) between the reconstructed and the weighed aerosol mass concentrations. Briefly, first step consists of focusing on the aerosol coarse fraction. k is fixed to 1.8, and as a result of L just mentioned, f is obtained to be in the range of 0.012 to 0.15, depending on our sites. The second step deals with the aerosol fine fraction. The f values just obtained for the aerosol coarse fraction are applied to the fine fraction, and k ratios are estimated using (L) to be in the range of 1.2 to 2.1. Note that at all of our sites, the correlation between Ca2+ and the missing mass between the weighed and the reconstructed aerosol mass is sufficiently good (r2=0.9) to support the consistency of this simple approach for the evaluation of dust. Also, f and k values are included in the range of values provided in the literature (He et al., 2001; Sun et al., 2004; Guinot et al., 2007). However, it is important to mention that the ranges of f and k coefficients are large, which is due to the source mixing observed in this study.
In the Terzi et al. (2010) method, dust is obtained with the following relationship: dust = 1.89[Al] + 1.21[K] + 1.95[Ca] + 1.66[Mg] + 1.7 [Ti] + 2.14[Si] + 1.42[Fe]. In our study, all of these elements are determined except for silicon (Si). Consequently, we used mean Si values obtained from different relationships available in the literature (SiO2 = 3 × Al2O3 for Alastuey et al. 2005, Si = 4.0 × Al for Zhang et al., 2003; and Si = 2.03 × Al for Chiapello et al., 1997).
The results of dust concentrations estimated from the three methodologies above described are summarized in the Table 1 for the wet season (WS) 2016 and dry season (DS) 2017. Indeed, Ca, Al, and Fe concentrations measured by ICP-MS are only available in WS2016 and DS2017 due to experimental problems, whereas Ca2+ concentrations measured by IC are available for all campaigns. As shown in Table 1, the dust obtained from Ca2+ measured by IC (Sciare et al., 2005) and by the Guinot et al. (2007) method is lower than that obtained from trace elements (Terzi et al., 2010) for DS2017, whereas it is of the same order of magnitude in WS2016. Such results are in agreement with methodological aspects. Indeed, Al, Fe, Ca, etc. obtained by ICP-MS include both soluble and insoluble particles, whereas Ca2+ measured by IC only includes soluble particles. During the dry season, comparison of Ca measured by ICP-MS (not shown here) is higher than that of the IC, by factors of 1.7, 1.8, 2.2, and 1.1, at the ADF, AWB, AT, and CT sites, respectively. By contrast, this factor is low and constant (1.3) in the wet season for all of the sites. In our study, due to the lack of trace element data for WS2015 and DS2016, dust estimations are performed from the Guinot et al. (2007) method. This choice globally implies an underestimate of dust concentrations by a factor of 1.5 to 3.5 in DS2017 as shown in Table 1.
Table 1Comparison of dust concentrations obtained from different methodologies, in micrograms per cubic meter.
2.3.7 Aerosol chemical closure methodology
As previously mentioned and detailed, aerosol chemical closure is performed following the Guinot et al. (2007) methodology.
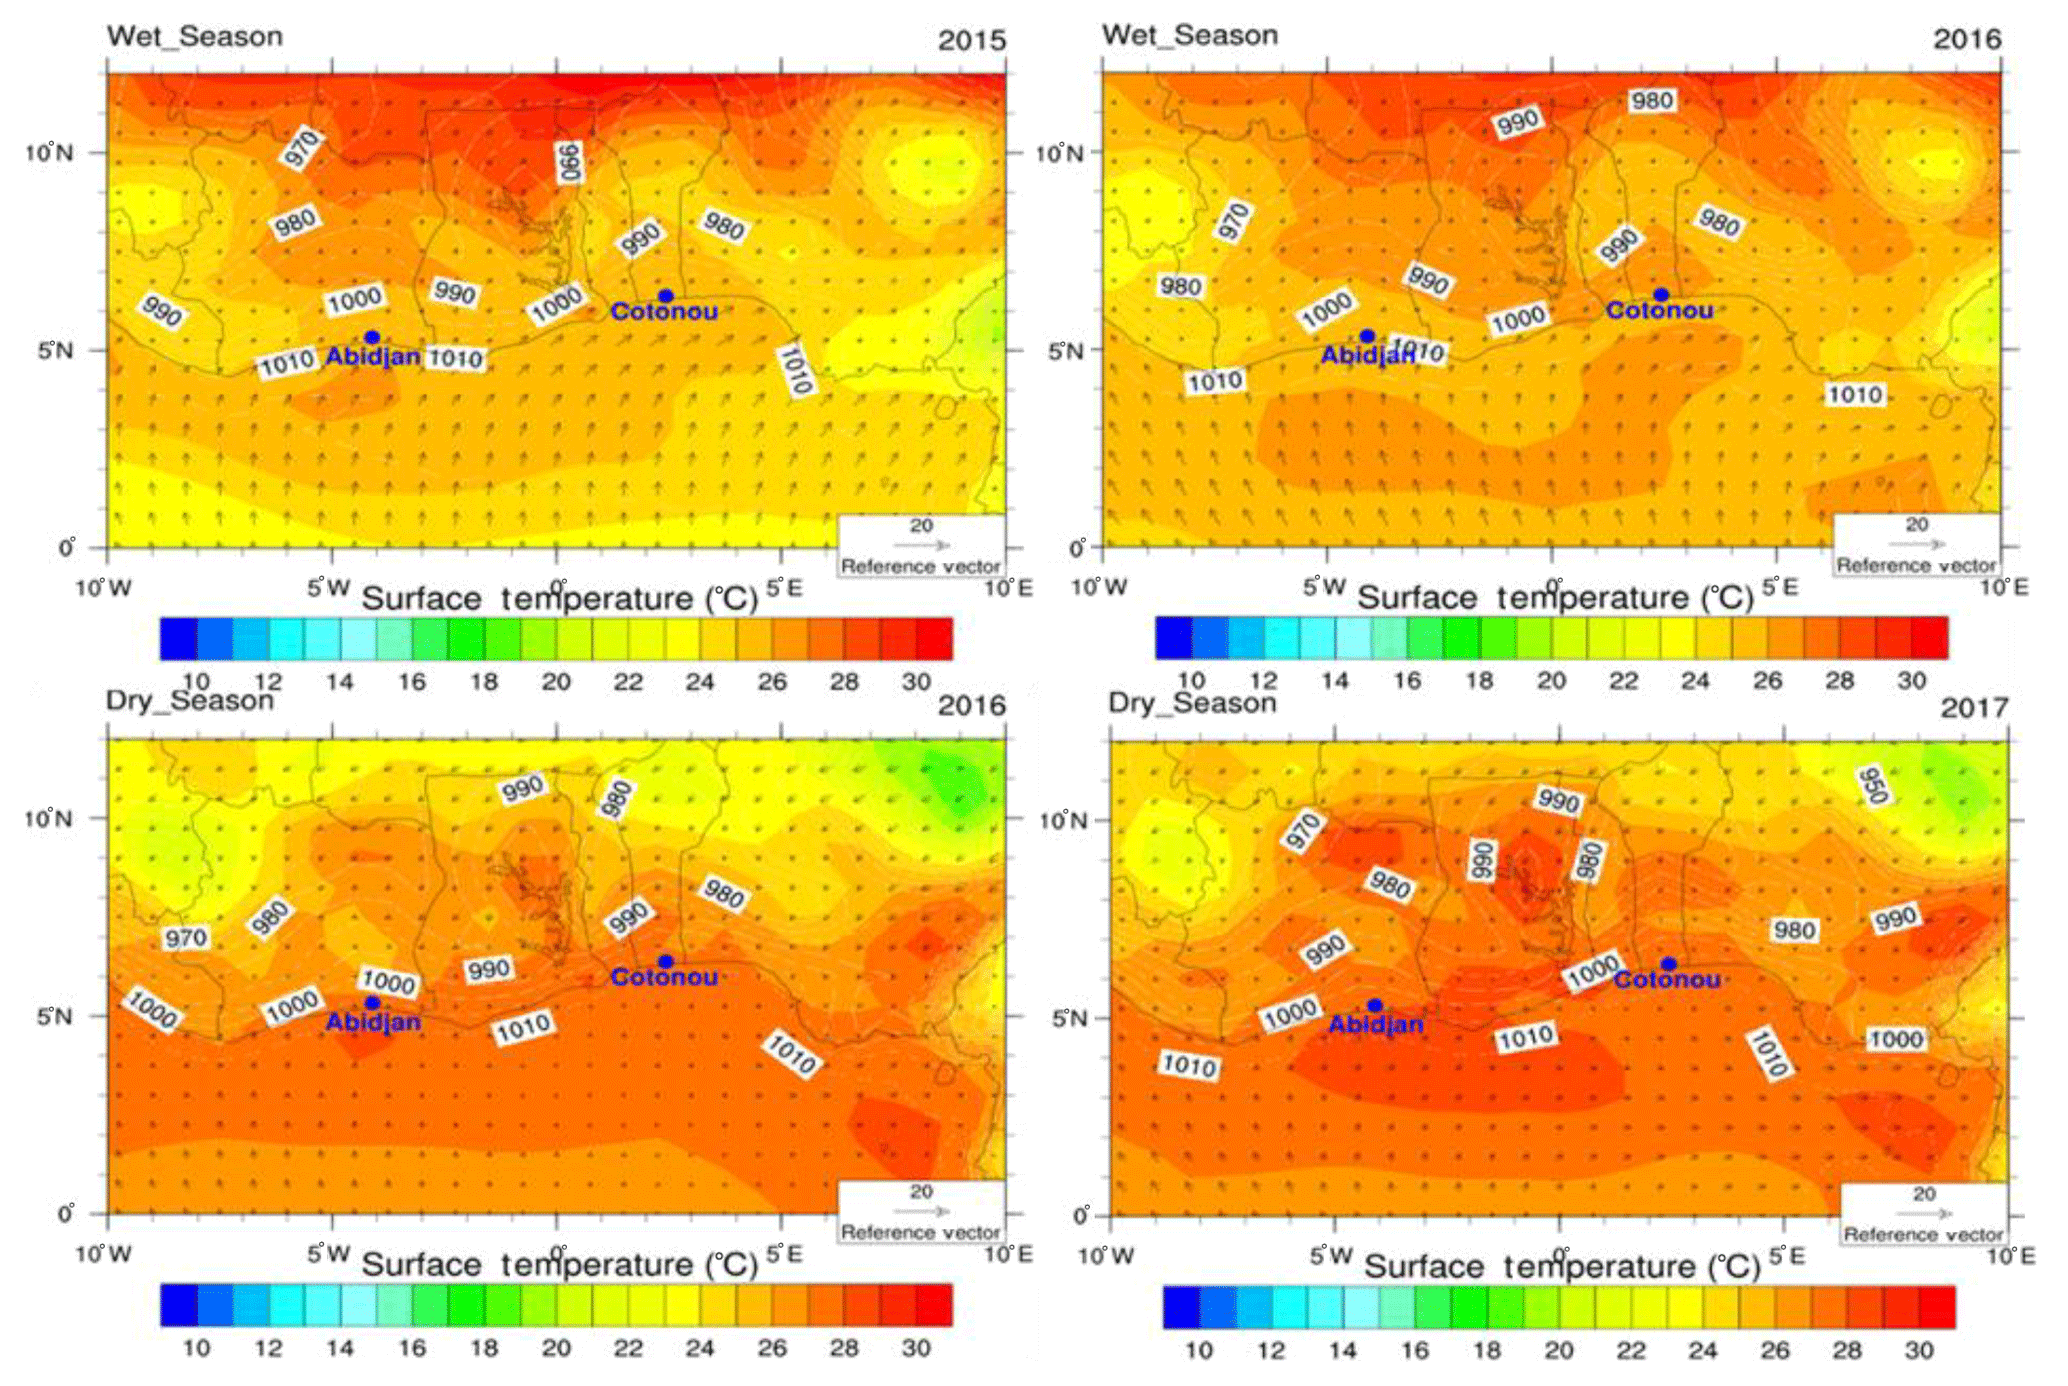
Figure 4Wind, pressure, and temperature diagram at Abidjan and Cotonou during the different campaigns.
2.4 Meteorological conditions
In Fig. 4, meteorological data (surface temperature and wind directions and speed) issued from the NOAA Integrated Surface database (ISD; see https://www.ncdc.noaa.gov/isd, last access: 20 November 2018) and the ASECNA (Agence pour la Sécurité de la Navigation Aérienne en Afrique et à Madagascar) are presented for the southwestern Africa region including Abidjan and Cotonou. As expected, this area is under the influence of the convergence zone of two air masses of a different nature, i.e., Harmattan (hot and dry continental trade winds) from the north and monsoon (humid maritime trade winds) from the south (Fig. 4). Ground contact between these two air masses constitutes the intertropical front (ITF) of which the fluctuations during the year determine the seasons in the Gulf of Guinea (Tapsoba, 1997). During the dry season (from November to March), temperatures are relatively high with a maximum around 30 ∘C on the coast. The humidity is low, since the prevailing Harmattan wind blows from the desert, usually bringing dust (Fig. 4, lower row). The period from June to September, especially in July is the wet season period when daytime temperatures are slightly lower, with a maximum around 26∕28 ∘C on the coast (Fig. 4, upper row). At this season, the humidity level is high across the region. On the coast, rains may occur from March to November.
During our campaigns (not shown here), temperatures are roughly the same at Abidjan and Cotonou, reaching 28 and 26 ∘C in the dry and wet seasons, respectively. Gentle to moderate wind speeds are observed during the measurement campaigns at the two cities, with average values of 15–20 and 15–22 km h−1 at Abidjan and Cotonou, respectively. There is no precipitation at the CT site during the studied periods. In Abidjan on the contrary, low rains occur both in wet and dry periods with cumulative precipitation higher in DS2017 (7 mm) than in WS2016 (4.7 mm) and WS2015 (2 mm). There is no rain in DS2016 (https://www.historique-meteo.net/afrique/, last access: 20 December 2019).
2.5 Backward trajectories
The Hybrid Single-Particle Lagrangian Integrated Trajectory (HYSPLIT) modeling system (Air resources laboratory, Draxler and Rolph, 2012) is used for the trajectory analysis. The HYSPLIT model is run to compute 120 h back trajectories ending at Abidjan and Cotonou at 50 m a.g.l. (Fig. 5). The Global Data Assimilation System reanalysis database is used as meteorological input, with a horizontal resolution. Results presented in Fig. 5 confirm that air masses mainly come from the north with a few from the southwest in the dry season (January), whereas they come from the southwest and the south in the wet season (July). Therefore, in January Abidjan and Cotonou are mainly impacted by polluted air masses from surrounding areas and northern countries with possible dust and West African biomass burning influences, whereas in July the impact of oceanic sources possibly polluted by long-range south African biomass burning aerosols may be observed.
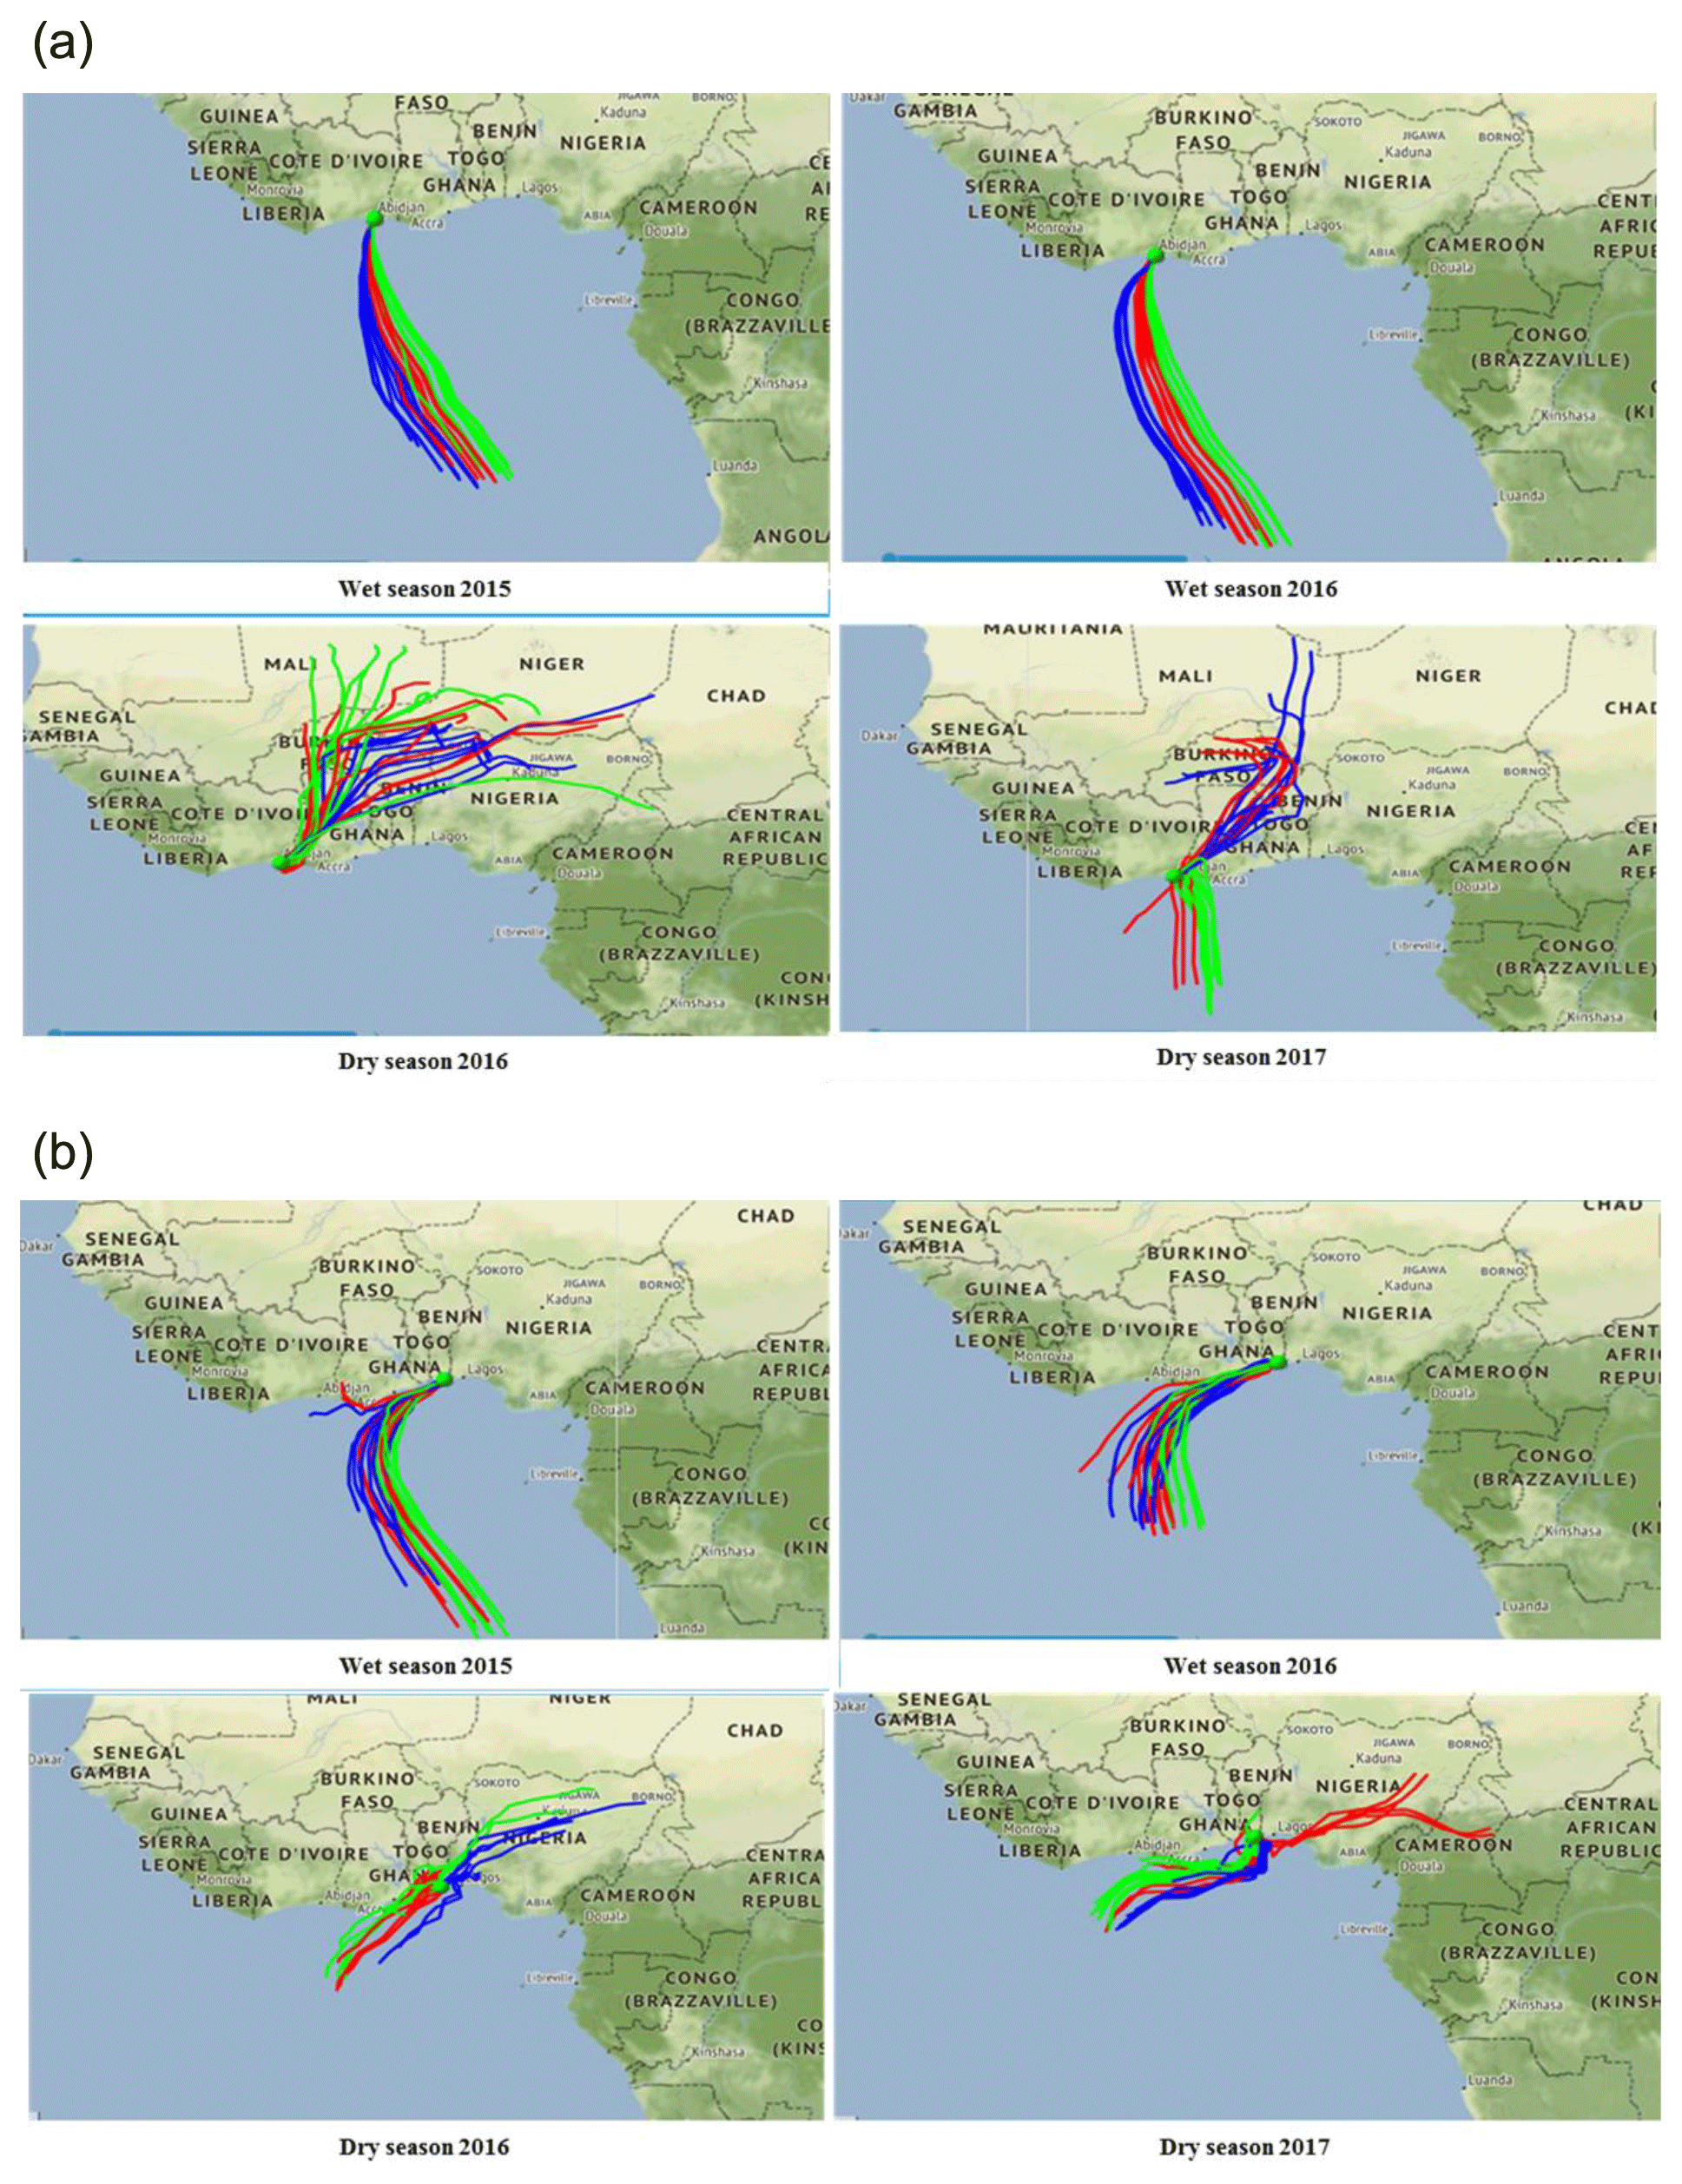
Figure 5Back trajectories arriving at Abidjan (a) and Cotonou (b) for each season (WS2015, WS2016, DS2016, and DS2017).
3.1 Aerosol size distribution and mass concentration
In Fig. 6, the relative mass distribution of PM for coarse (C), fine (F), and ultrafine (UF) particle sizes in percentages are presented with bulk mass concentration averages indicated in the black boxes for each site and for each campaign. As it may be seen, bulk concentrations vary widely from site to site and from campaign to campaign. During the wet season, the average total concentrations range from 82 to 676 µg m−3 in 2015 and from 56 to 358 µg m−3 in 2016, with the maximum at the Abidjan domestic fire (ADF) site. While during the dry season, values range from 168 to 269 µg m−3 in 2016 and from 114 to 559 µg m−3 in 2017, with maximum concentration obtained at the Cotonou traffic (CT) and ADF sites. In terms of size distribution, concentration peaks may be observed for all aerosol size-fractions which are found to exhibit different seasonal patterns. UF particles (< 0.2 µm) represent the highest contributor to the bulk mass at the ADF site, by up to 60 % (335.3 µg m−3) in DS2017. F particles (1–0.2 µm) are the second most important contributor, and both combined particle sizes account for more than 85 % of the total mass at the ADF site. In this site, ultrafine and fine fractions are also found to be maximal during WS2015 and WS2016 by up to 90 % and 83 %, respectively. Let us note that C particle contribution in bulk is relatively higher in the traffic and waste burning sites than at the ADF site (40 %), whereas F and UF particle contributions are on the order of 60 %.
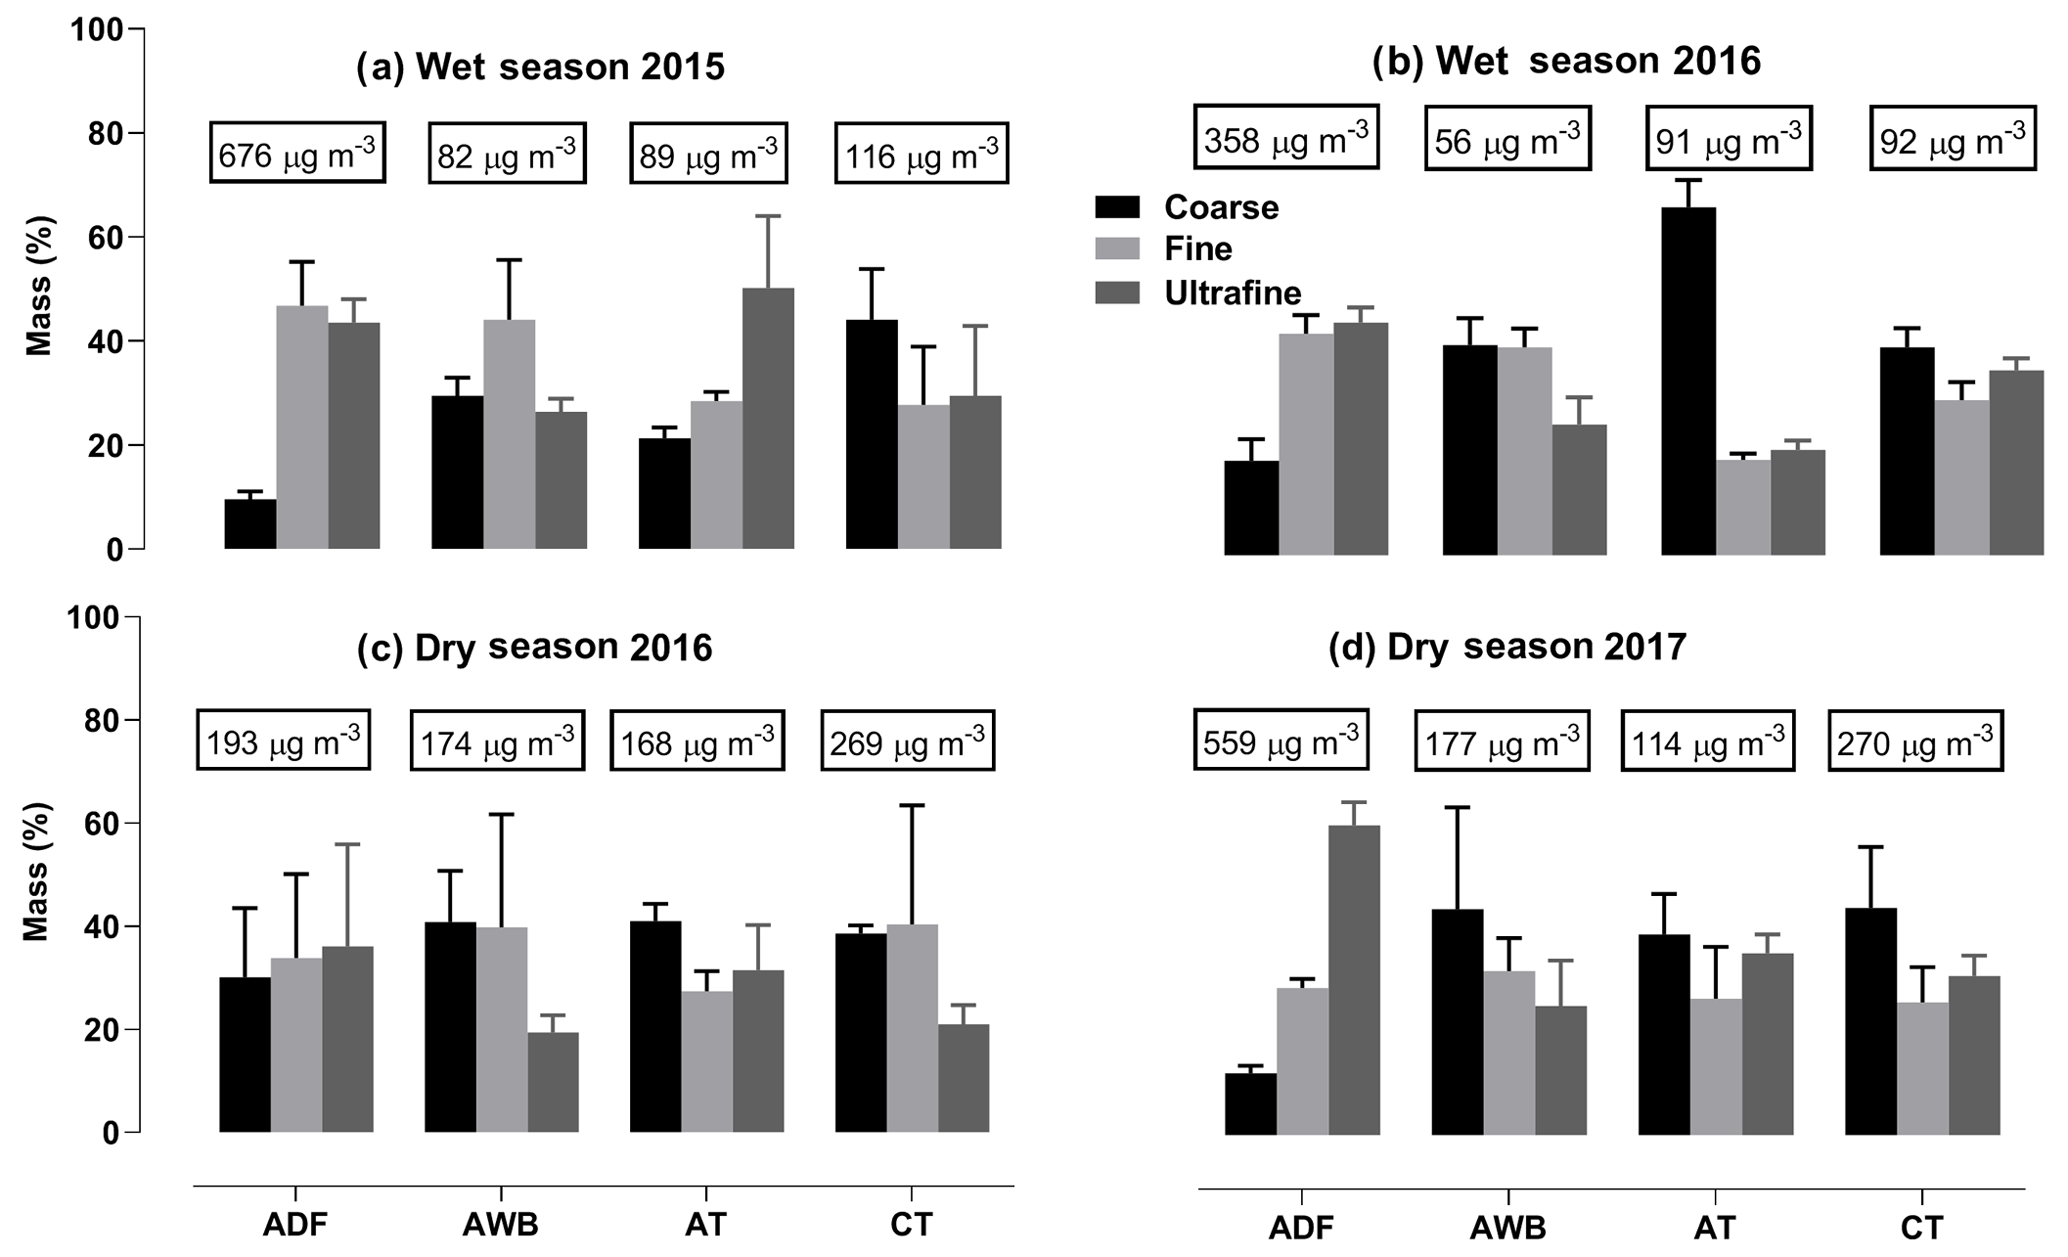
Figure 6Aerosol mass concentrations at the different study sites for each campaign and for the different sizes (C in black, fine in light grey, ultrafine in grey). Bulk aerosol mass is indicated in boxes.
In terms of PM2.5, the results of this work are presented in Fig. 7. The mass concentrations of PM2.5 averaged over DS2016 and DS2017 are 154±74, 144±42, 134±7, and 211±51 µg m−3 at the ADF, AWB, AT, and CT sites, respectively, and 338±24, 45±3, 52±4, and 70±1 µg m3 over the wet seasons (2015–2016). The increase in PM2.5 is on the order of 54 % at ADF from the dry to wet season, whereas a sharp reduction (more than 60 %) is obtained at AWB, AT, and CT sites.
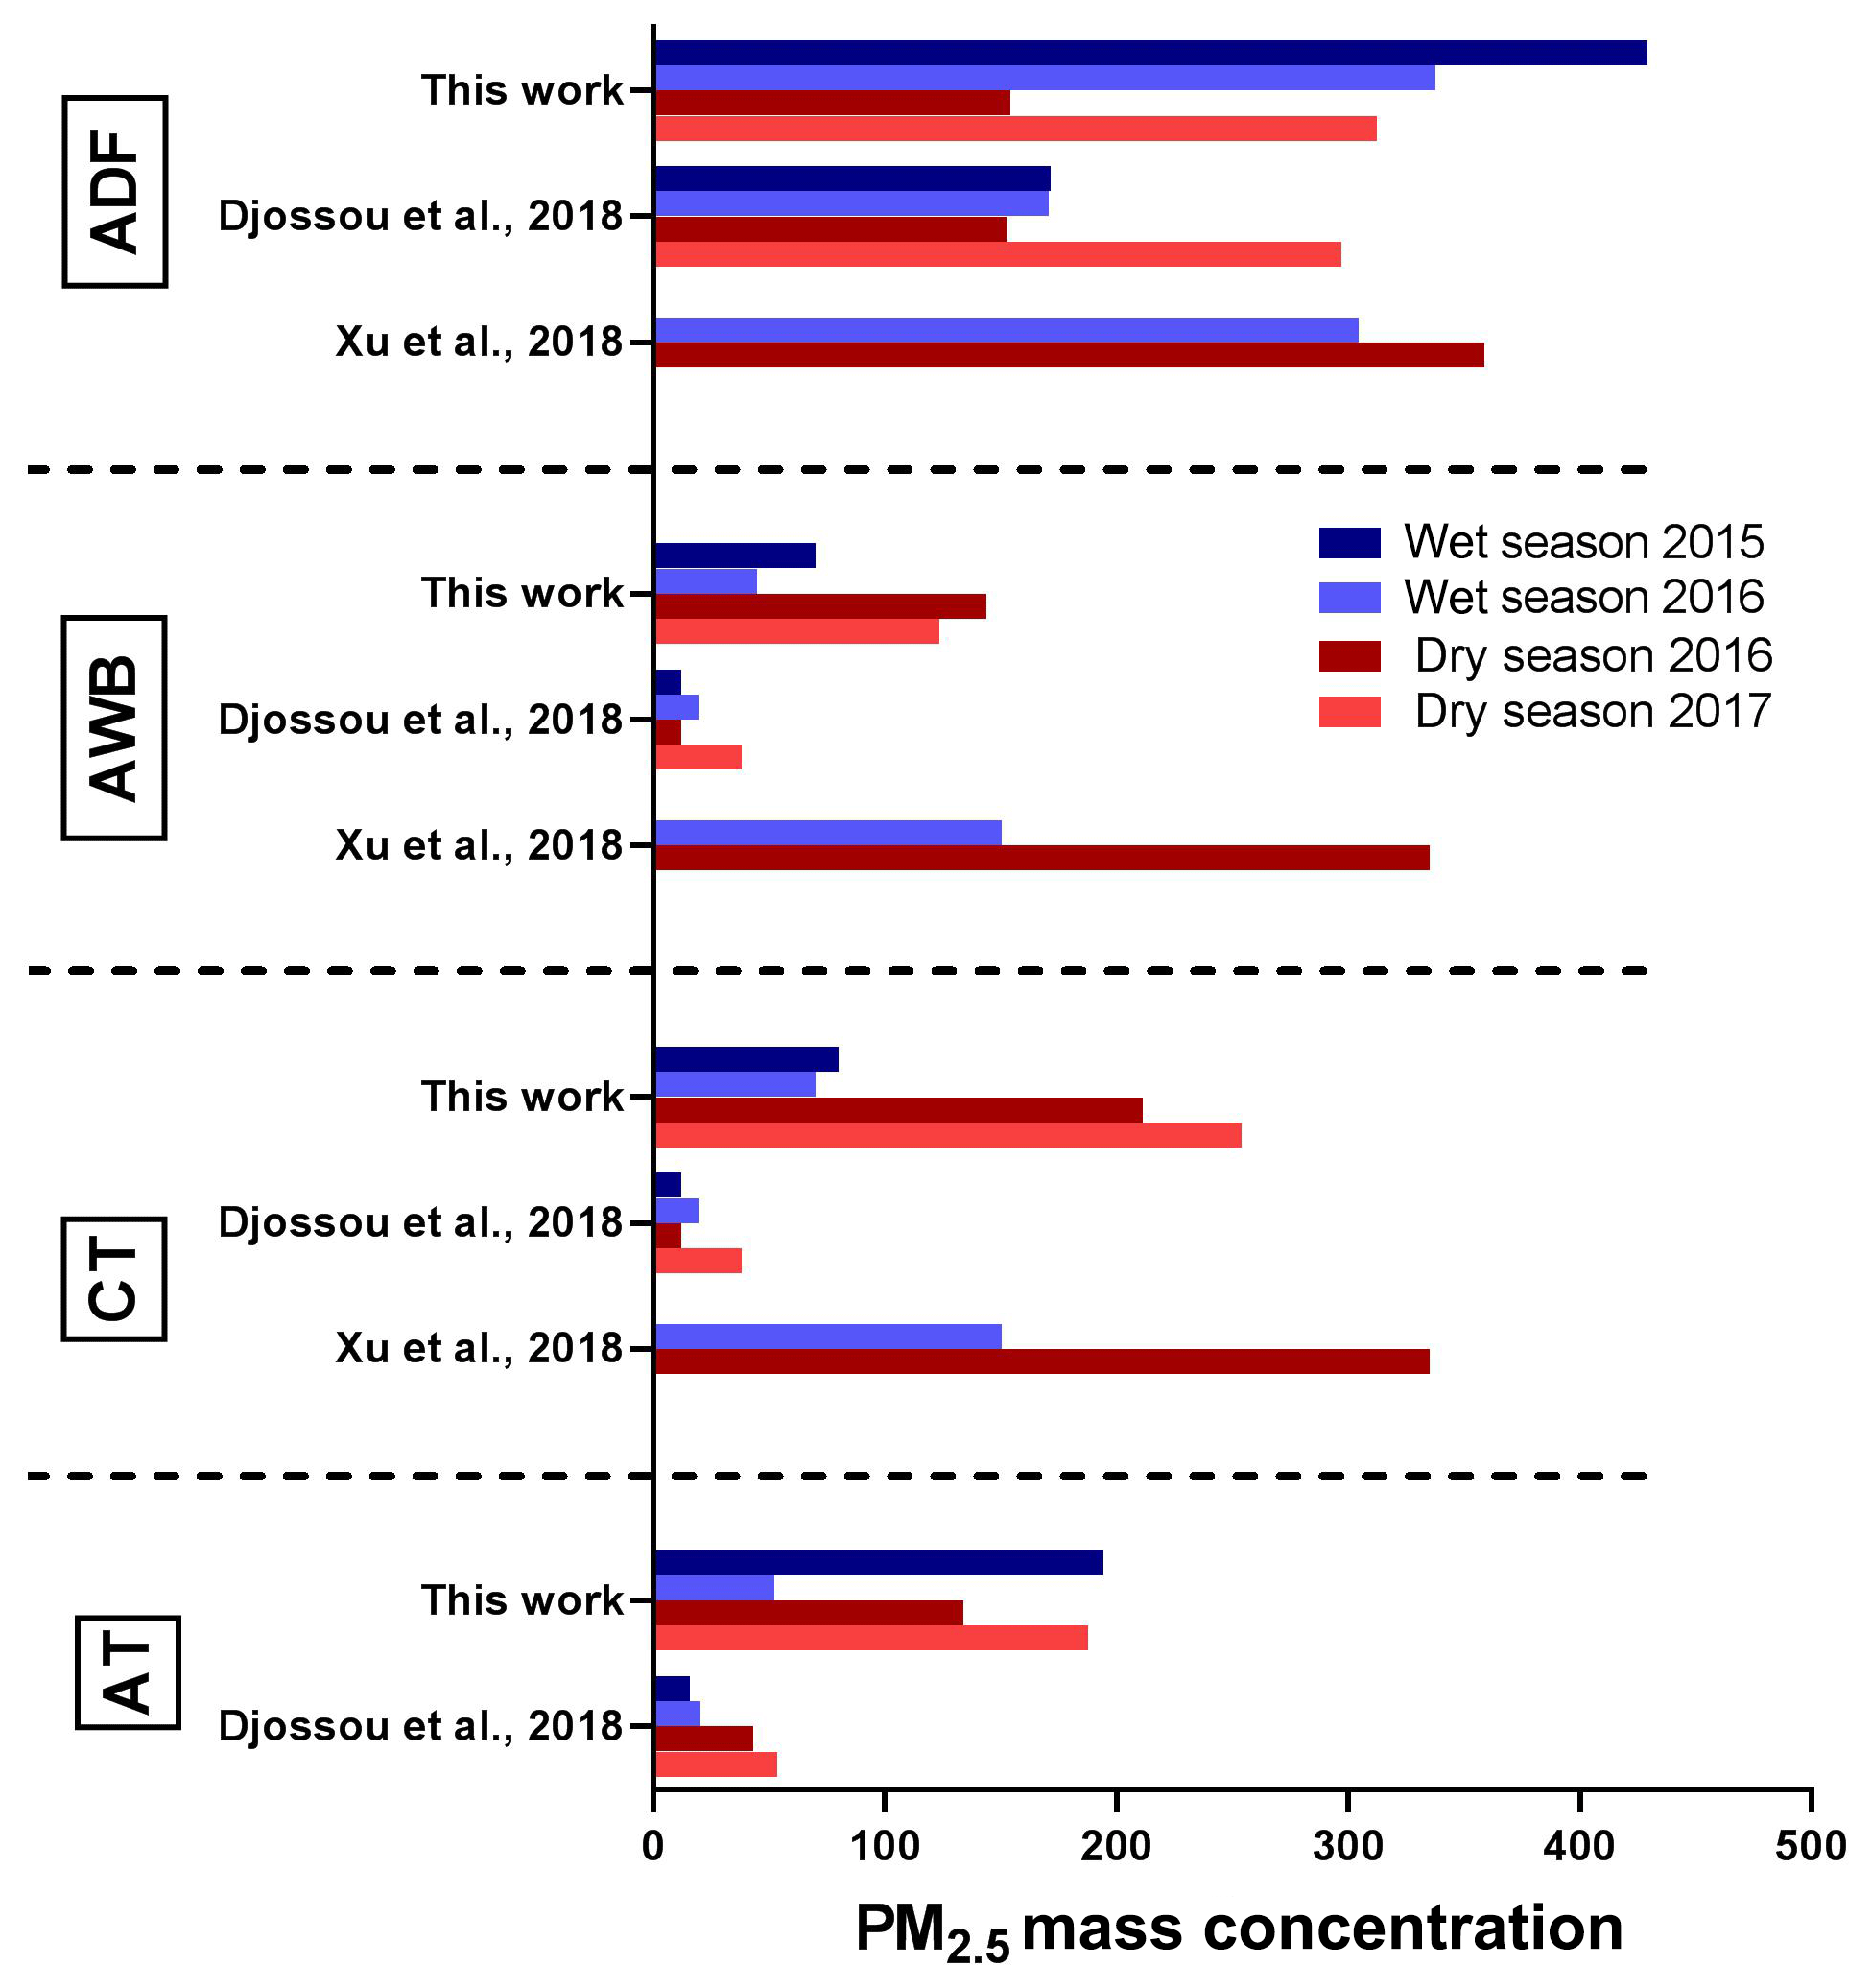
Figure 7Comparison of PM2.5 mass concentrations in micrograms per cubic meter (µg m−3) at the four sites with those obtained by Djossou et al. (2018) and Xu et al. (2019) for the same sites and periods. Data for the following weeks were then selected in Djossou et al. (2018): 20–27 July 2015 for WS15, 4–11 January 2016 for DS16, 4–11 July 2016 for WS16, and 9–16 January 2017 for DS17.
3.2 Carbonaceous aerosol
3.2.1 EC and OC concentrations
In Fig. 8, EC relative mass contributions are presented for each size, site, and campaign as follows: wet season 2015 (WS2015), wet season 2016 (WS2016), dry season 2016 (DS2016), and dry season 2017 (DS2017). Mean EC bulk mass concentrations are added in the black boxes for each size and for each campaign. The most striking feature is that the ADF site concentrations are higher than at the other sites in WS2016 and DS2017, while on the same order as CT site concentrations in the other seasons. Mean concentration at the CT site (16 µg m−3) is slightly higher than at the AT site (10 µg m−3), whereas the lowest concentrations are found at the AWB site. Results of the EC size distribution are very consistent among the different sites (Fig. 8). Whatever the site and the season, higher EC concentrations are found in C (42 %) and UF (43 %) particles compared to F particles.
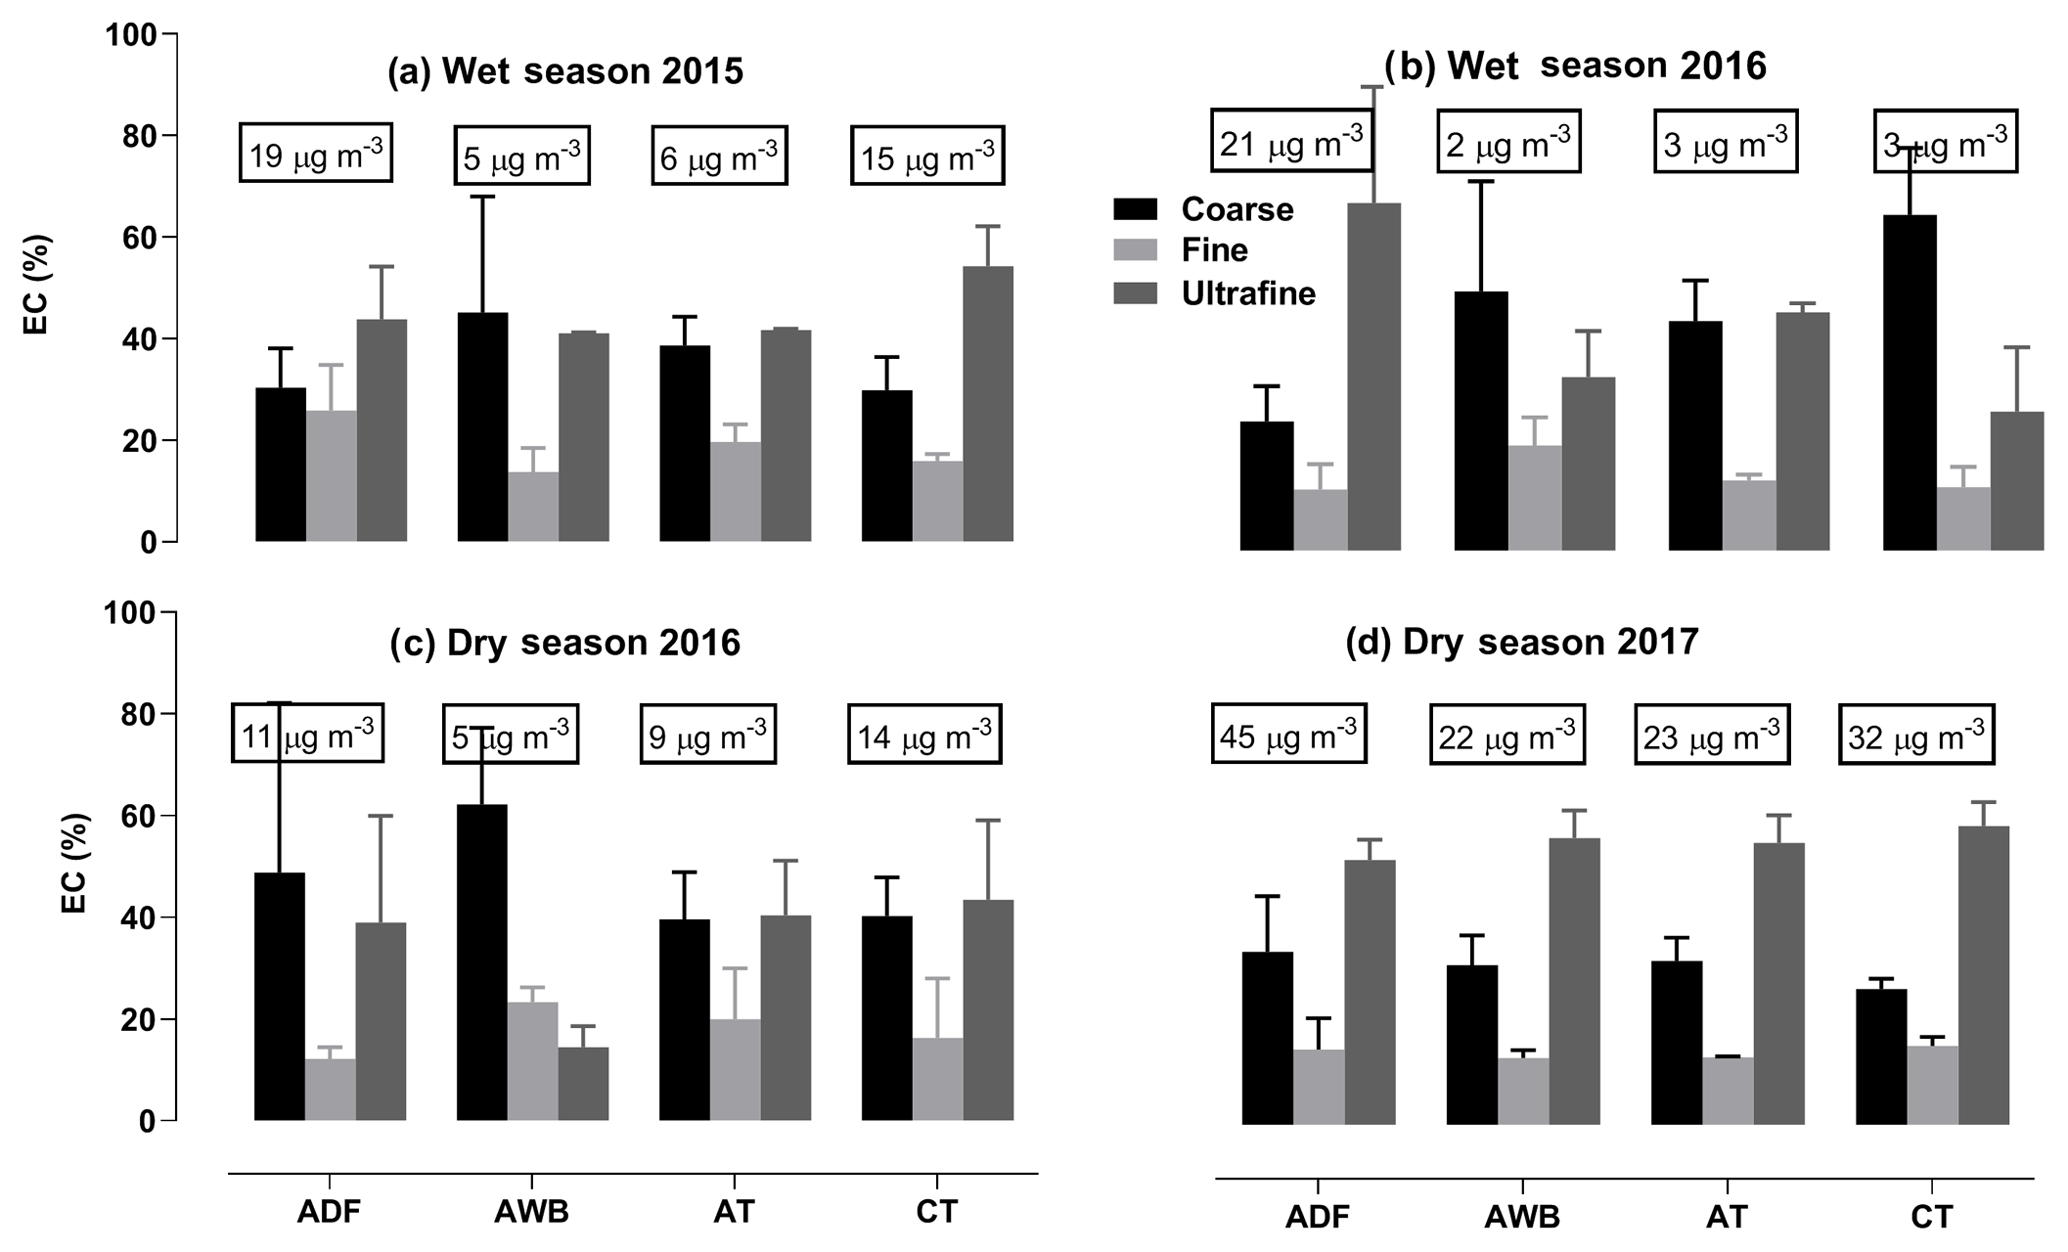
Figure 8EC relative concentrations in each size classes (C in black, fine in light grey, ultrafine in grey) at the different study sites for each campaign. Bulk EC concentration for each site is indicated in boxes.
The same data are presented for OC concentrations in Fig. 9. It may be underlined that ADF OC values are always higher than in the other sites by a factor ranging from 6 to 30, for all seasons and particle sizes, with highest and lowest values, respectively, in DS2017 and DS 2016. In terms of size distribution, maximum OC concentrations at the ADF site may be found in UF (53 %), then F (29 %), and finally C (18 %) particles. The same distribution is observed for the traffic sites in DS2016; however, for the other campaigns, OC size distribution looks like the EC ones with higher concentrations in UF and C particles than in F particles.
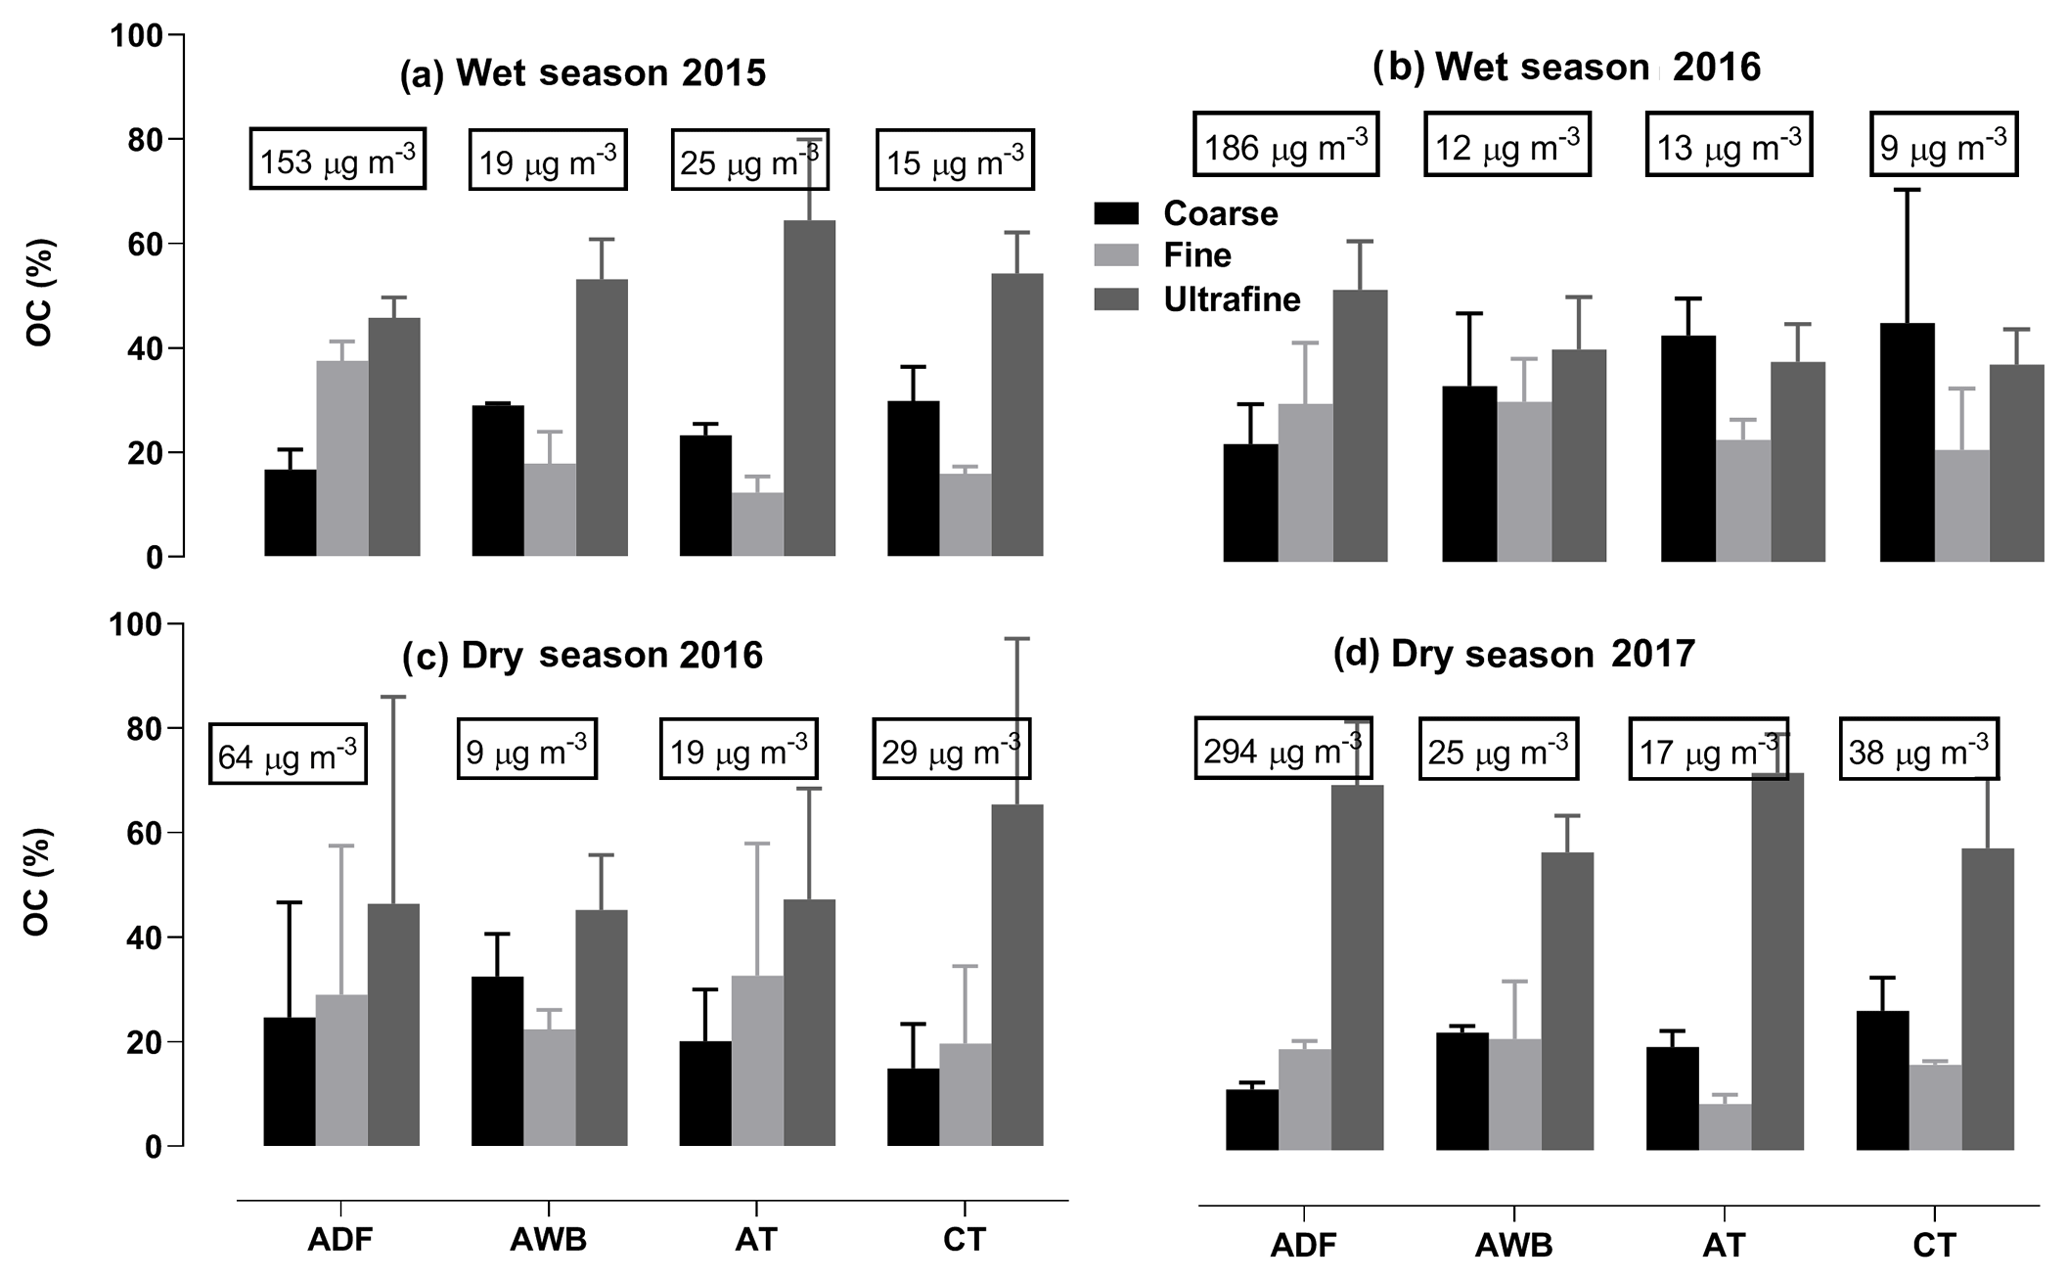
Figure 9OC relative concentrations in each size classes (C in black, fine in light grey, ultrafine in grey) at the different study sites for each campaign. Bulk OC concentration for each site is indicated in boxes.
As shown in Fig. 10, the highest OC ∕ EC ratios are always obtained at the ADF site with a value as high as 25 for F particles in WS2016, whereas the lowest values are found in DS2017. This is the same feature for the other sites with ratios lower than 2 in DS2017. OC ∕ EC ratios at the AWB site are higher than at the traffic sites. Note that values at the AT site are higher than CT values in the wet season, while lower in the dry season. Finally, it is interesting to underline that linear correlations between EC and OC are obtained in the ultrafine and fine modes in all campaigns, particularly in DS2017 (r2 = 0.8, 0.8, 0.9, and 0.9) at the ADF, AWB, AT, and CT sites, respectively. This suggests that different studied sources can be assessed as significant sources of both EC and OC.
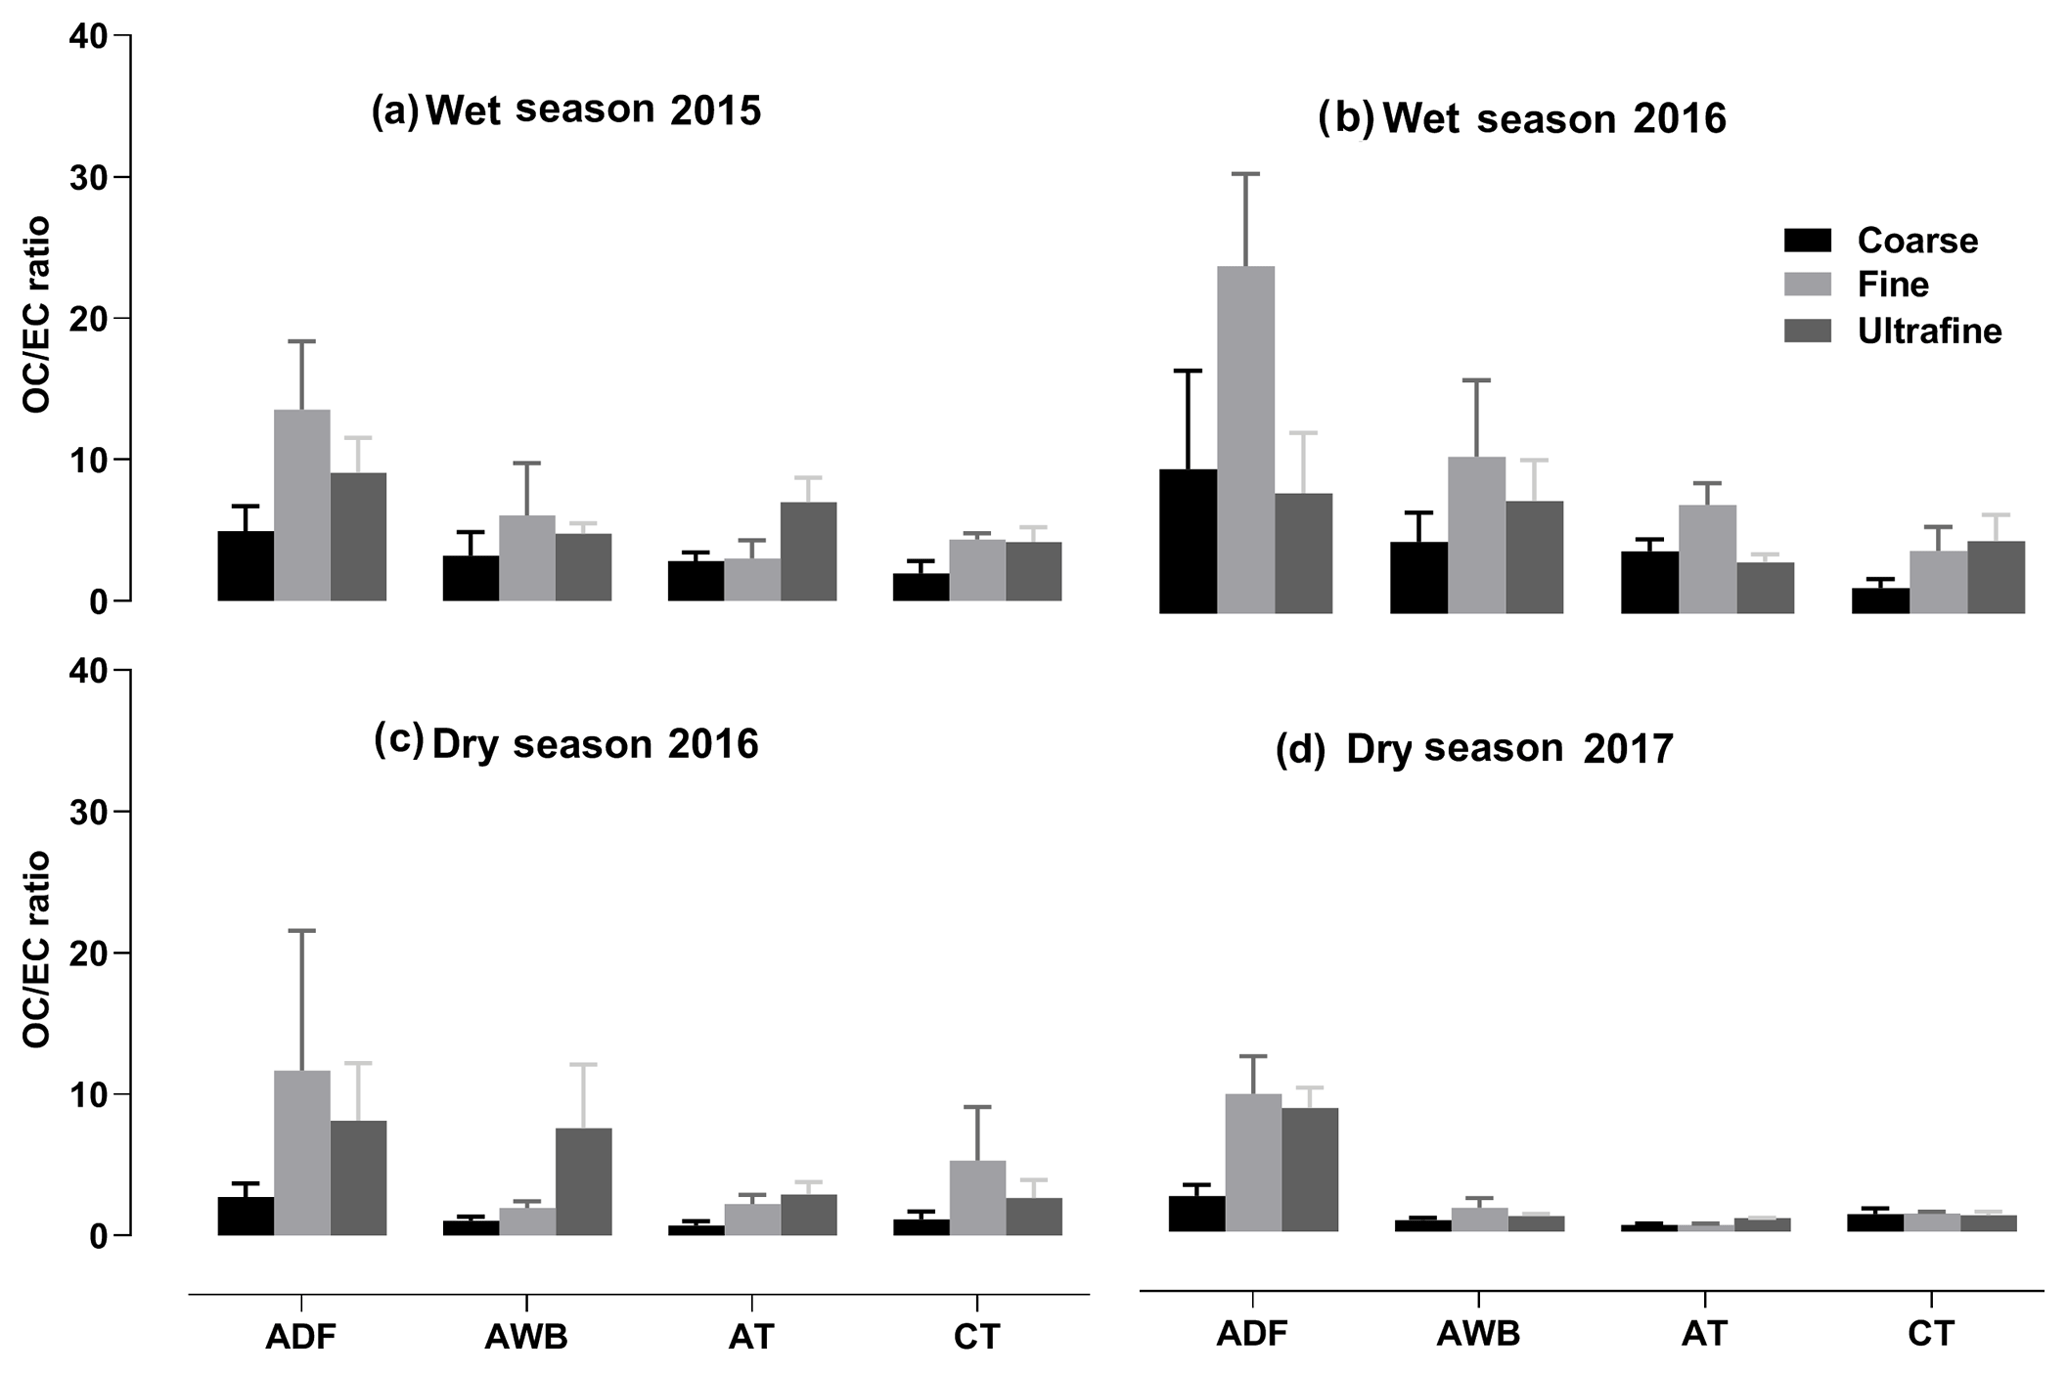
Figure 10OC∕EC ratio for the different campaigns and sites for each aerosol size (C in black, fine in light grey, ultrafine in grey). Each box shows the median and the first and the third quartiles.
3.2.2 Water-soluble organic carbon
Concentrations of WSOC and WSOC ∕ OC ratios are presented in Table 2 for each size (UF, F, C, and PM2.5) and campaign. As seen, WSOC values are always higher at the ADF site than in other sites, at least by a factor of 12. Maximum values are obtained in WS2016 with an average of 16.47, 17.08, and 79.68 µg C m−3 for coarse, fine, and ultrafine fractions, respectively, followed by WS2015 and DS2017. WSOC concentrations are the lowest in DS2016, with an average of 4.14, 6.95, and 21.89 µg m−3 for coarse, fine, and ultrafine fractions, respectively. In terms of seasonality, there is not a clear trend in WSOC values at the AWB and AT sites, whereas at the CT and ADF sites, WSOC values are found to be respectively higher and lower in dry seasons compared to wet seasons. It is also interesting to note that WSOC values are maximal in UF sizes at the AT, ADF, and AWB sites. At the CT site, the highest values are found in the coarse particulate fractions, except in DS2016.
Table 2WSOC concentrations (µg m−3) and WSOC ∕ OC ratios (%) for each site, each campaign and each aerosol size.

As expected, WSOC is strongly correlated with OC (r=0.7 at the ADF site, 0.8 at the AT site, and 0.5 at the AWB site, and 0.7 at the CT site), whereas correlations with EC are weaker, especially at the AWB and CT sites with values ranging from 0.1 to 0.4, respectively. Finally, when looking at WSOC ∕ OC ratios (Table 2), maximum values are obtained at the ADF site with PM2.5 ratios as high as 43 %, followed by the AT and AWB sites with 32 %. The lowest value (23 %) is found at the CT site. Also, Table 2 shows that there is no clear seasonality in WSOC ∕ OC values, excepted at ADF where maximum values occur during the wet season. Note, as for WSOC, that ratios are maximal in UF and F fractions for all sites except at the CT site where the ratio for the coarse fraction is the highest.
3.3 Water-soluble ionic species
Figure 11 shows the relative contribution of the major ions to the total concentration (also given) of the ions in the different particle modes (C and F) at the ADF, AWB, AT, and CT sites for the different measurement campaigns. Let us recall here that only C and F fractions may be documented due to the our experimental protocol. Total concentrations present maximum values at ADF and CT sites. Values at the AWB and AT sites are of the same order of magnitude and lower by a factor of 2 than at the ADF and CT sites. The contribution of different ions shows significant variations from site to site. The dominant ionic species at the ADF site over all campaigns is chloride (Cl−), with a 26 % contribution, followed by nitrate () (16 %), calcium (Ca2+) (13 %), and potassium (K2+) (12 %). Sulfate (), ammonium (), sodium (Na+), and to a lesser extent magnesium (Mg2+) contributions are lower, ranging from 4 % to 7 % of the total ion species. The lowest contribution is for organic acids with their total value lower than 5 %. is the major ionic component at the AWB and AT sites, representing 24 % and 29 % of the total water-soluble inorganic concentration, respectively. The second major contributor at the AWB and AT sites is , accounting for 21 % and 17 % of the ion mass, respectively followed by Ca2+ (12 % and 15 %) and Cl− (15 % and 13 %). At the CT site, Ca2+ is predominant with a relative abundance of 24 %, followed by (23 %), (19 %), and Cl− (13 %). Na+, , and K+ contributions are lower and of the same order of magnitude at AT, AWB, and CT sites, ranging from 4 % to 9 % of the total ion species. Note that organic ion contributions at AT, CT, and AWB sites are of the same order as at the ADF site, with lower values at the CT site. It is interesting to underline in Fig. 11 that contribution is always higher in the coarse than in the fine size. Conversely, K+ is always higher in the fine than in the coarse size. In CT, Ca2+ in the fine fraction is as high as in the coarse fraction, whereas at AT, AWB, and ADF sites Ca2+ coarse fraction is predominant. Fine-particle contribution may be noticed for Cl− at ADF, whereas at the other sites, Cl− is most likely dominated by coarse particles. Finally, is mainly found in the fine mode at the AT, AWB, and CT sites but in the coarse mode at the ADF site.
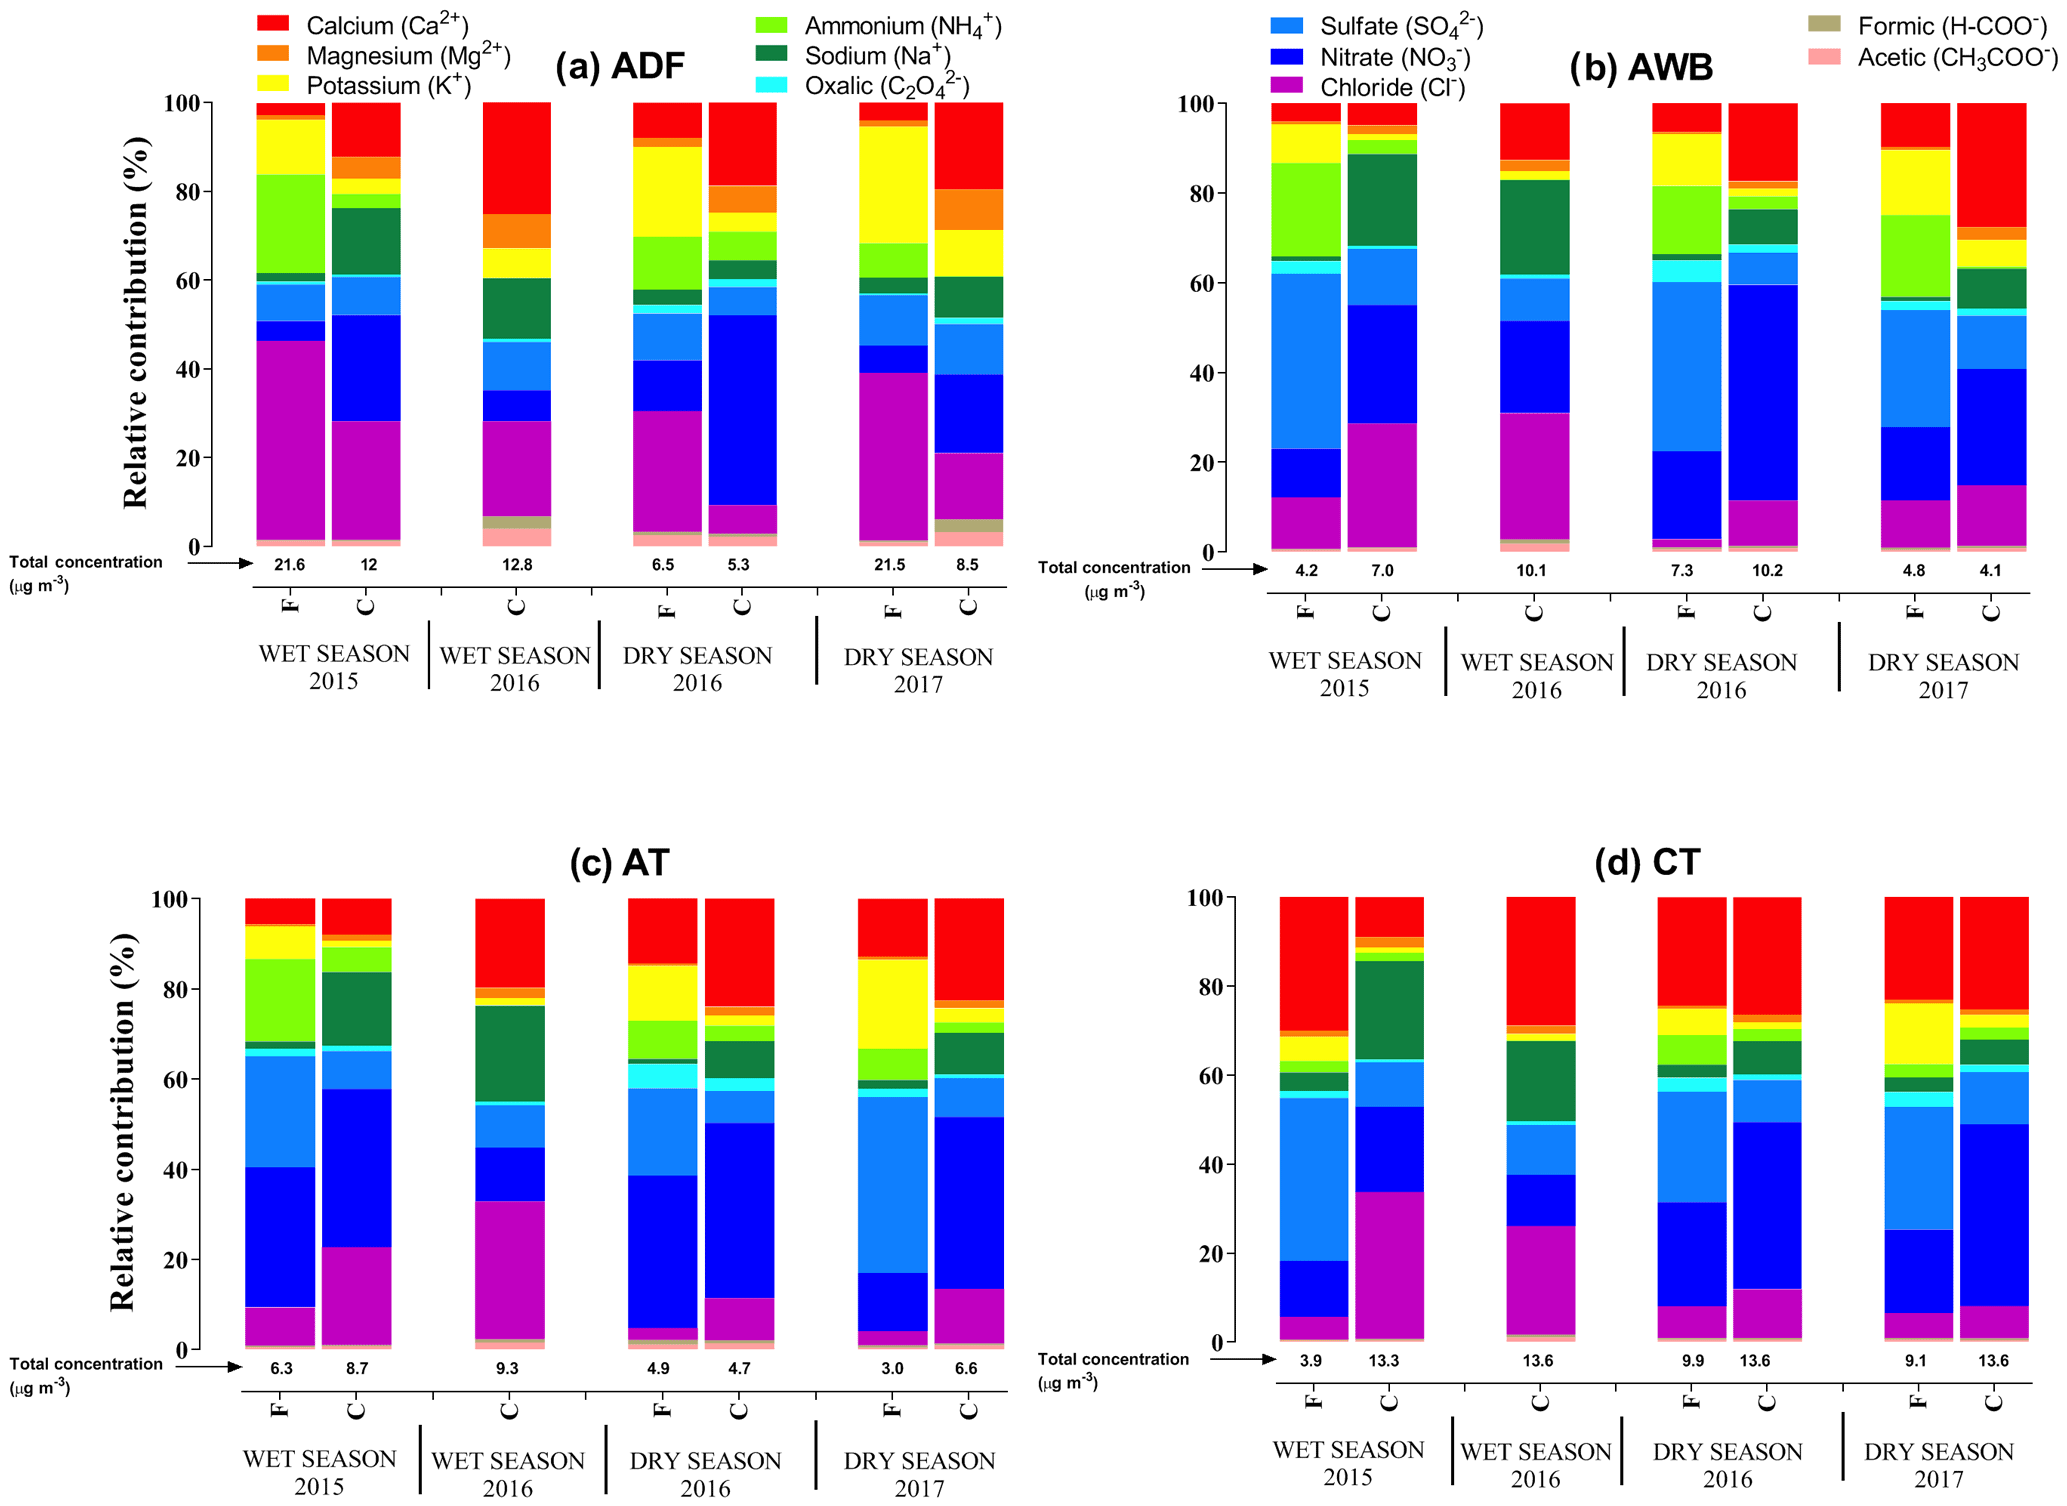
Figure 11Water-soluble ionic species speciation for each site, each campaign, and each aerosol size.
In terms of seasonal variations, it may be shown in Fig. 11 that higher Cl− values are found in wet seasons than in the dry seasons everywhere, except at the ADF site where there is no marked difference between seasons. For example, the mean relative total percentages of Cl− at the CT site are 38 % and 24 % in WS2015 and WS2016, respectively, while these percentages decrease significantly to 18 % and 13 % in DS2016 and DS2017, respectively. The ratios are about 1.5 everywhere in both seasons, in agreement with the typical seawater ratio (1–1.2) (Hara et al., 2004), except at the ADF site where these ratios increase to 4 and 5 in the wet and dry season, respectively and at the AWB site in the dry season (2). K+ and Ca2+ are always higher in the dry season than in the wet season except for Ca2+ in the ADF site where values are of the same order. Finally, the same trend is observed for and with higher values in dry than in wet seasons at AWB and CT sites, whereas values at ADF and AT sites are of the same order of magnitude for the two seasons.
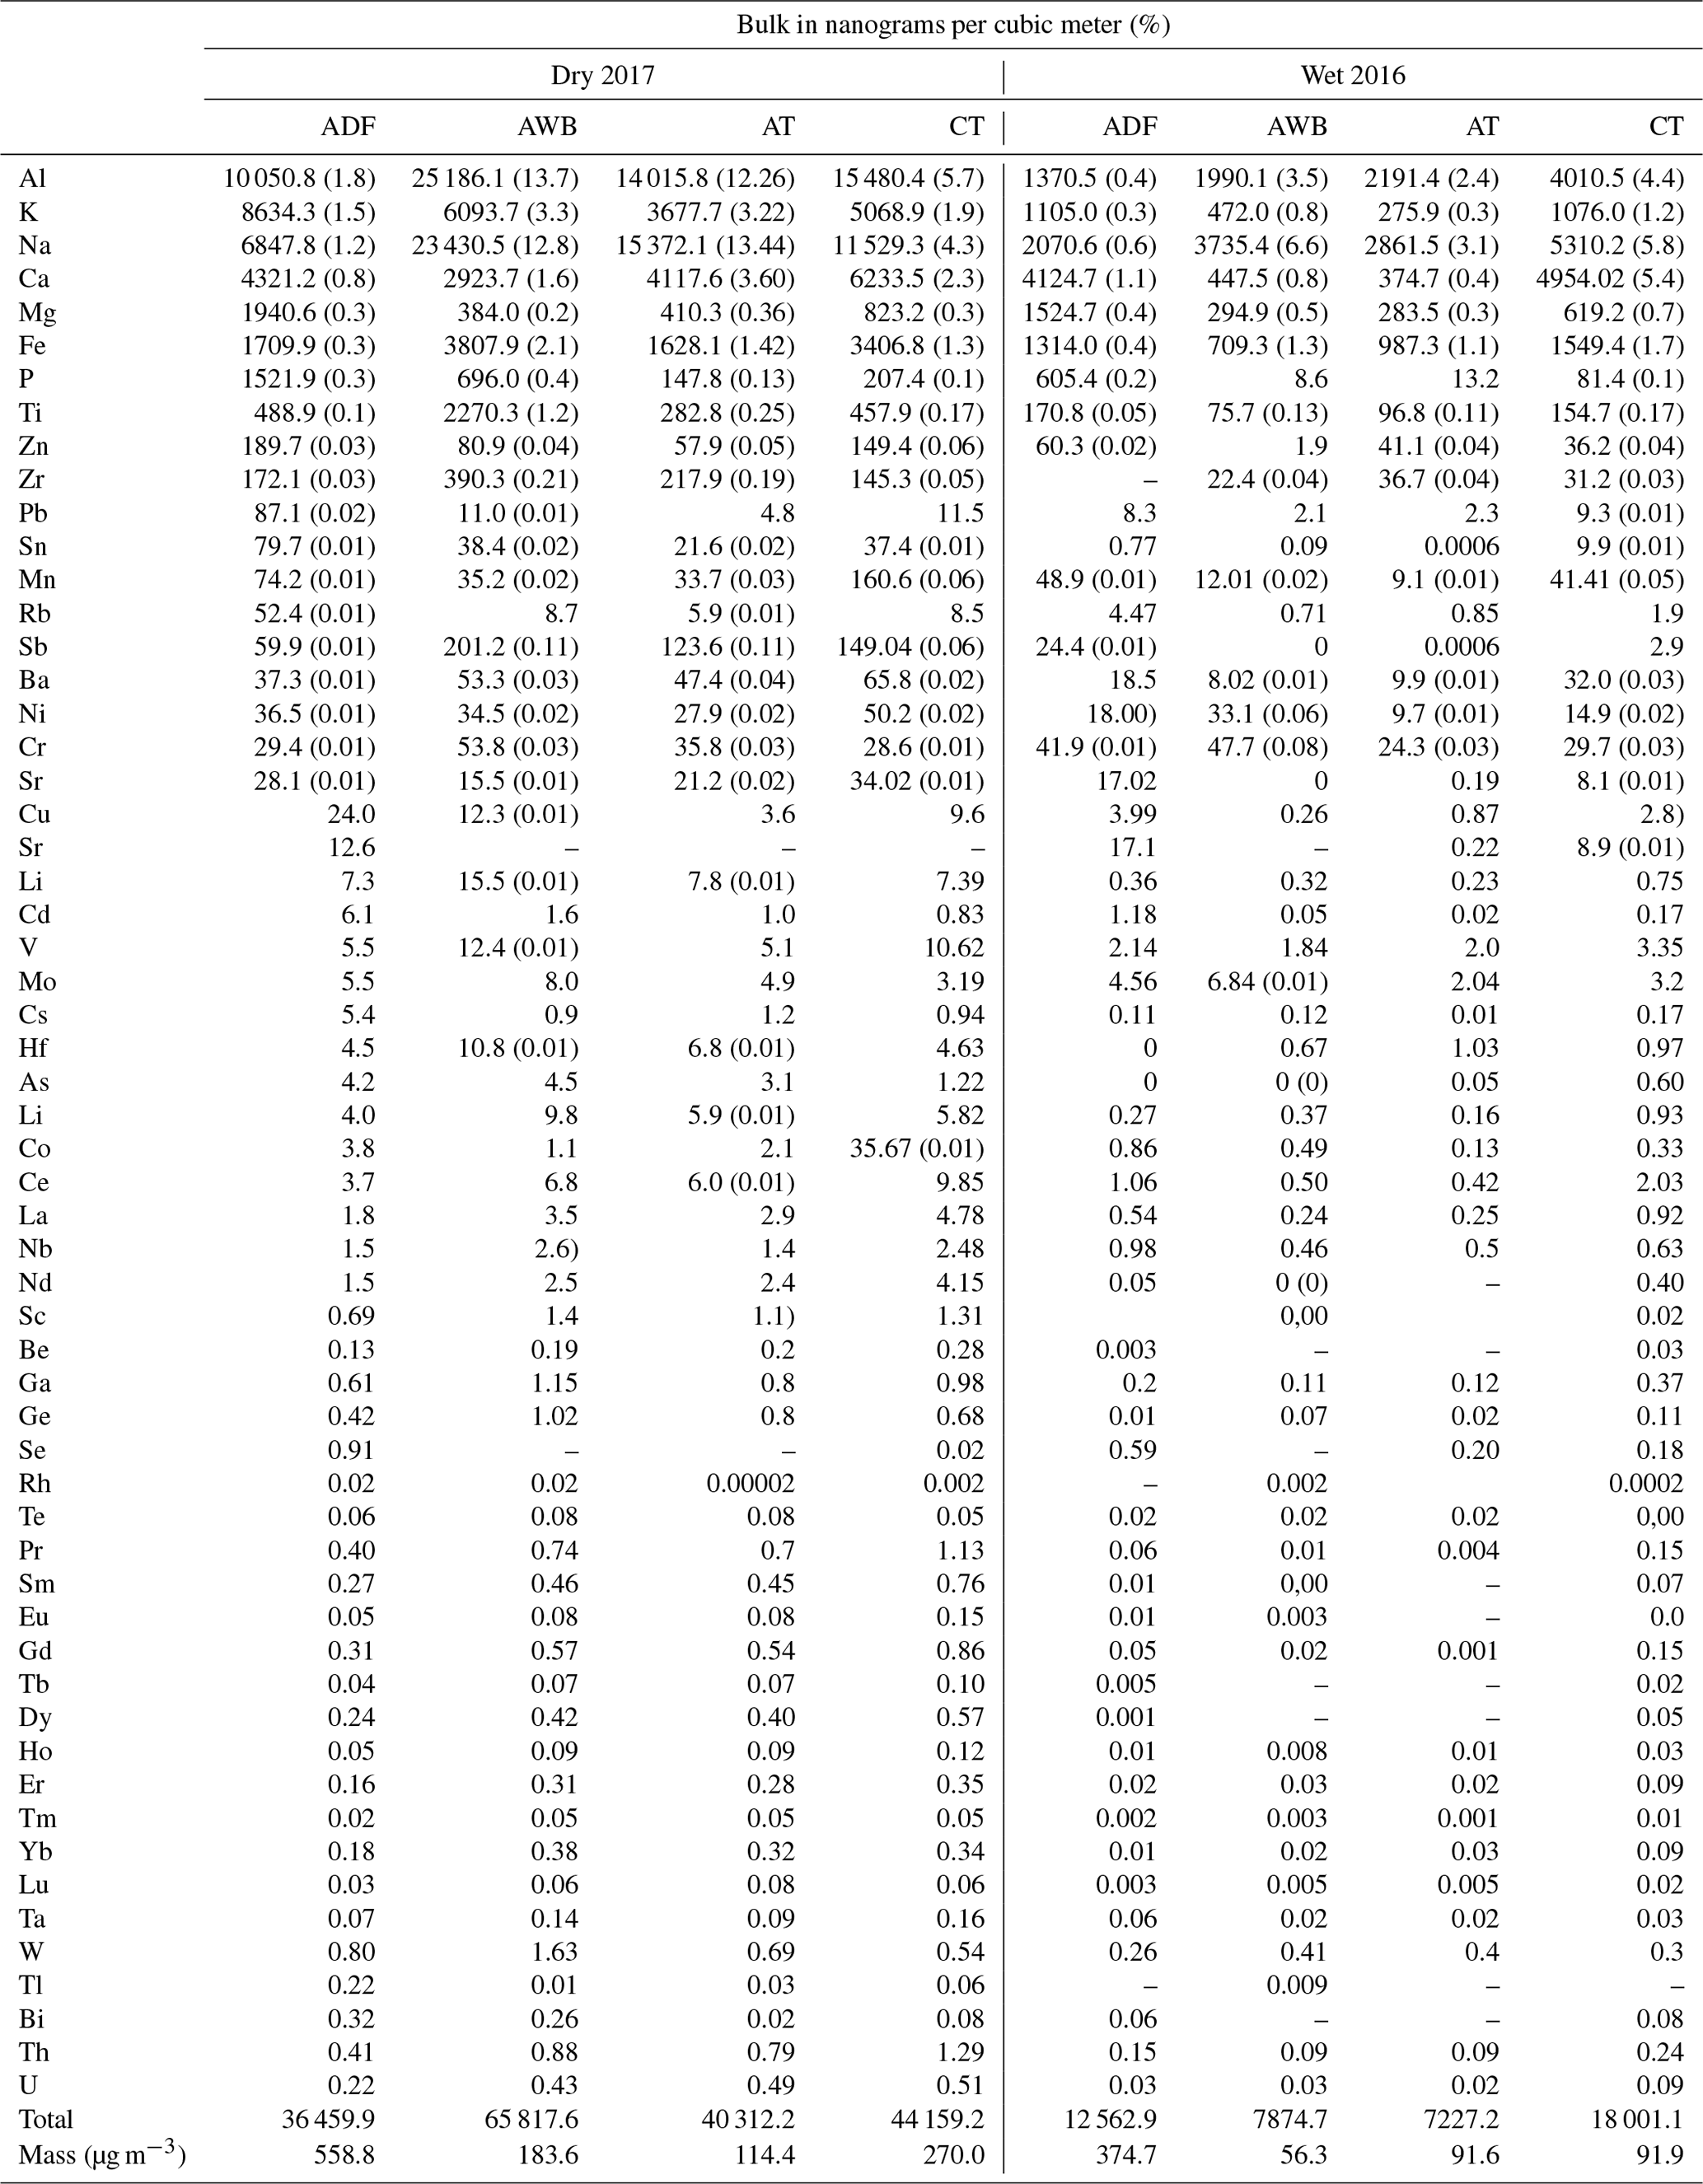
Table 3Trace element concentrations for bulk aerosol for each site and for DS2017 and WS2016.
3.4 Trace element concentrations
Table 3 shows the mean values of the major trace elements in bulk aerosol at the different studied sites in WS2016 and DS2017, with their corresponding relative abundances in the total aerosol mass into brackets. Let us recall that data are not available in WS2015 and DS2016. The concentrations of trace elements span a wide range, from 0.2 to 25.2 µg m−3. Among the measured elements, Al, K, Na, and Ca are the most abundant, followed by Fe and Mg. In DS2017, Al and Na concentrations are higher at the AWB site than at the other sites. The minimum value for these species is found at the ADF site. Values in traffic sites are of the same order of magnitude and higher than at the ADF site. The maximum of Ca and K values may be found at the CT and ADF sites, respectively. It is interesting to note that Al, K, and Na concentrations are higher in the dry season than in the wet season. Such a feature is less clear for Ca, whose seasonal variability is less marked except at AWB and AT sites. In terms of Mg, maximum values are observed at the ADF site and are of the same order of magnitude whatever the season. Fe abundance is higher at AWB and CT sites than at ADF and AT sites and higher in DS2017 than in WS2016 everywhere. The other metals (Ti, P, Zr, Zn, Cr, Mn, Pb, and Ni) represent less than 0.5 % and 2 % of the total mass in WS2016 and DS2017, respectively, at all sites, with Cr, Mn, Pb, and Ni exhibiting less seasonal variability compared to the rest of the metal elements.
To assess the relative contribution of crustal and non-crustal origin of elemental aerosol loadings, source enrichment factor (EF) values of a trace element X have been first calculated with the following formula using both literature data of the typical elemental composition of the upper continental crust (Mason and Moore, 1982; Taylor, 1964), measured elemental composition from this study, and Al as a reference element as follows:
where [X]atm and [Al]atm are the concentrations of the chemical element X and Al in the atmosphere, respectively, and [X]soil and [Al]soil are the typical concentrations of the element X and Al in the earth's crust, respectively. Al is frequently used as a reference element, assuming that its anthropogenic sources in the atmosphere are negligible (Gao et al., 2002; Cao et al., 2005; Xu et al., 2012). In all sampling sites, EF values typically lower than 5 are obtained for several trace elements (Be, Sc, Ti, V, Fe, Ga, Sr, Nb, Rh, Ba, La, Ce, Pr, Nd, Sm, Eu, Gd, Tb, Dy, Ho, Er, Tm, Yb, Lu, Ta, Th, and U). This suggests a natural origin of these species (Freitas et al., 2007; Gao et al., 2002). The most enriched elements (EF > 100) are Sb, Sn, Zn, Se, Te, Cd, Pb, Bi, and Mo at nearly all of the sites, indicating significant anthropogenic origin (Wang et al., 2006). These elements are mainly emitted into the atmosphere through fossil fuel combustion, traffic emission, wear of brake lining materials, and industrial processes (Watson and Chow, 2001; Samara and al., 2003). Secondly, source contributions have been estimated from these EF values following the method described by Arditsoglou and Samara (2005). Note that this study refers to ratios for a limited list of sources, perhaps not including the African source specificities. As a result, it may be seen that 30 % of trace element concentrations are of anthropogenic origin at the ADF site, while they are about 17 % at the other sites.
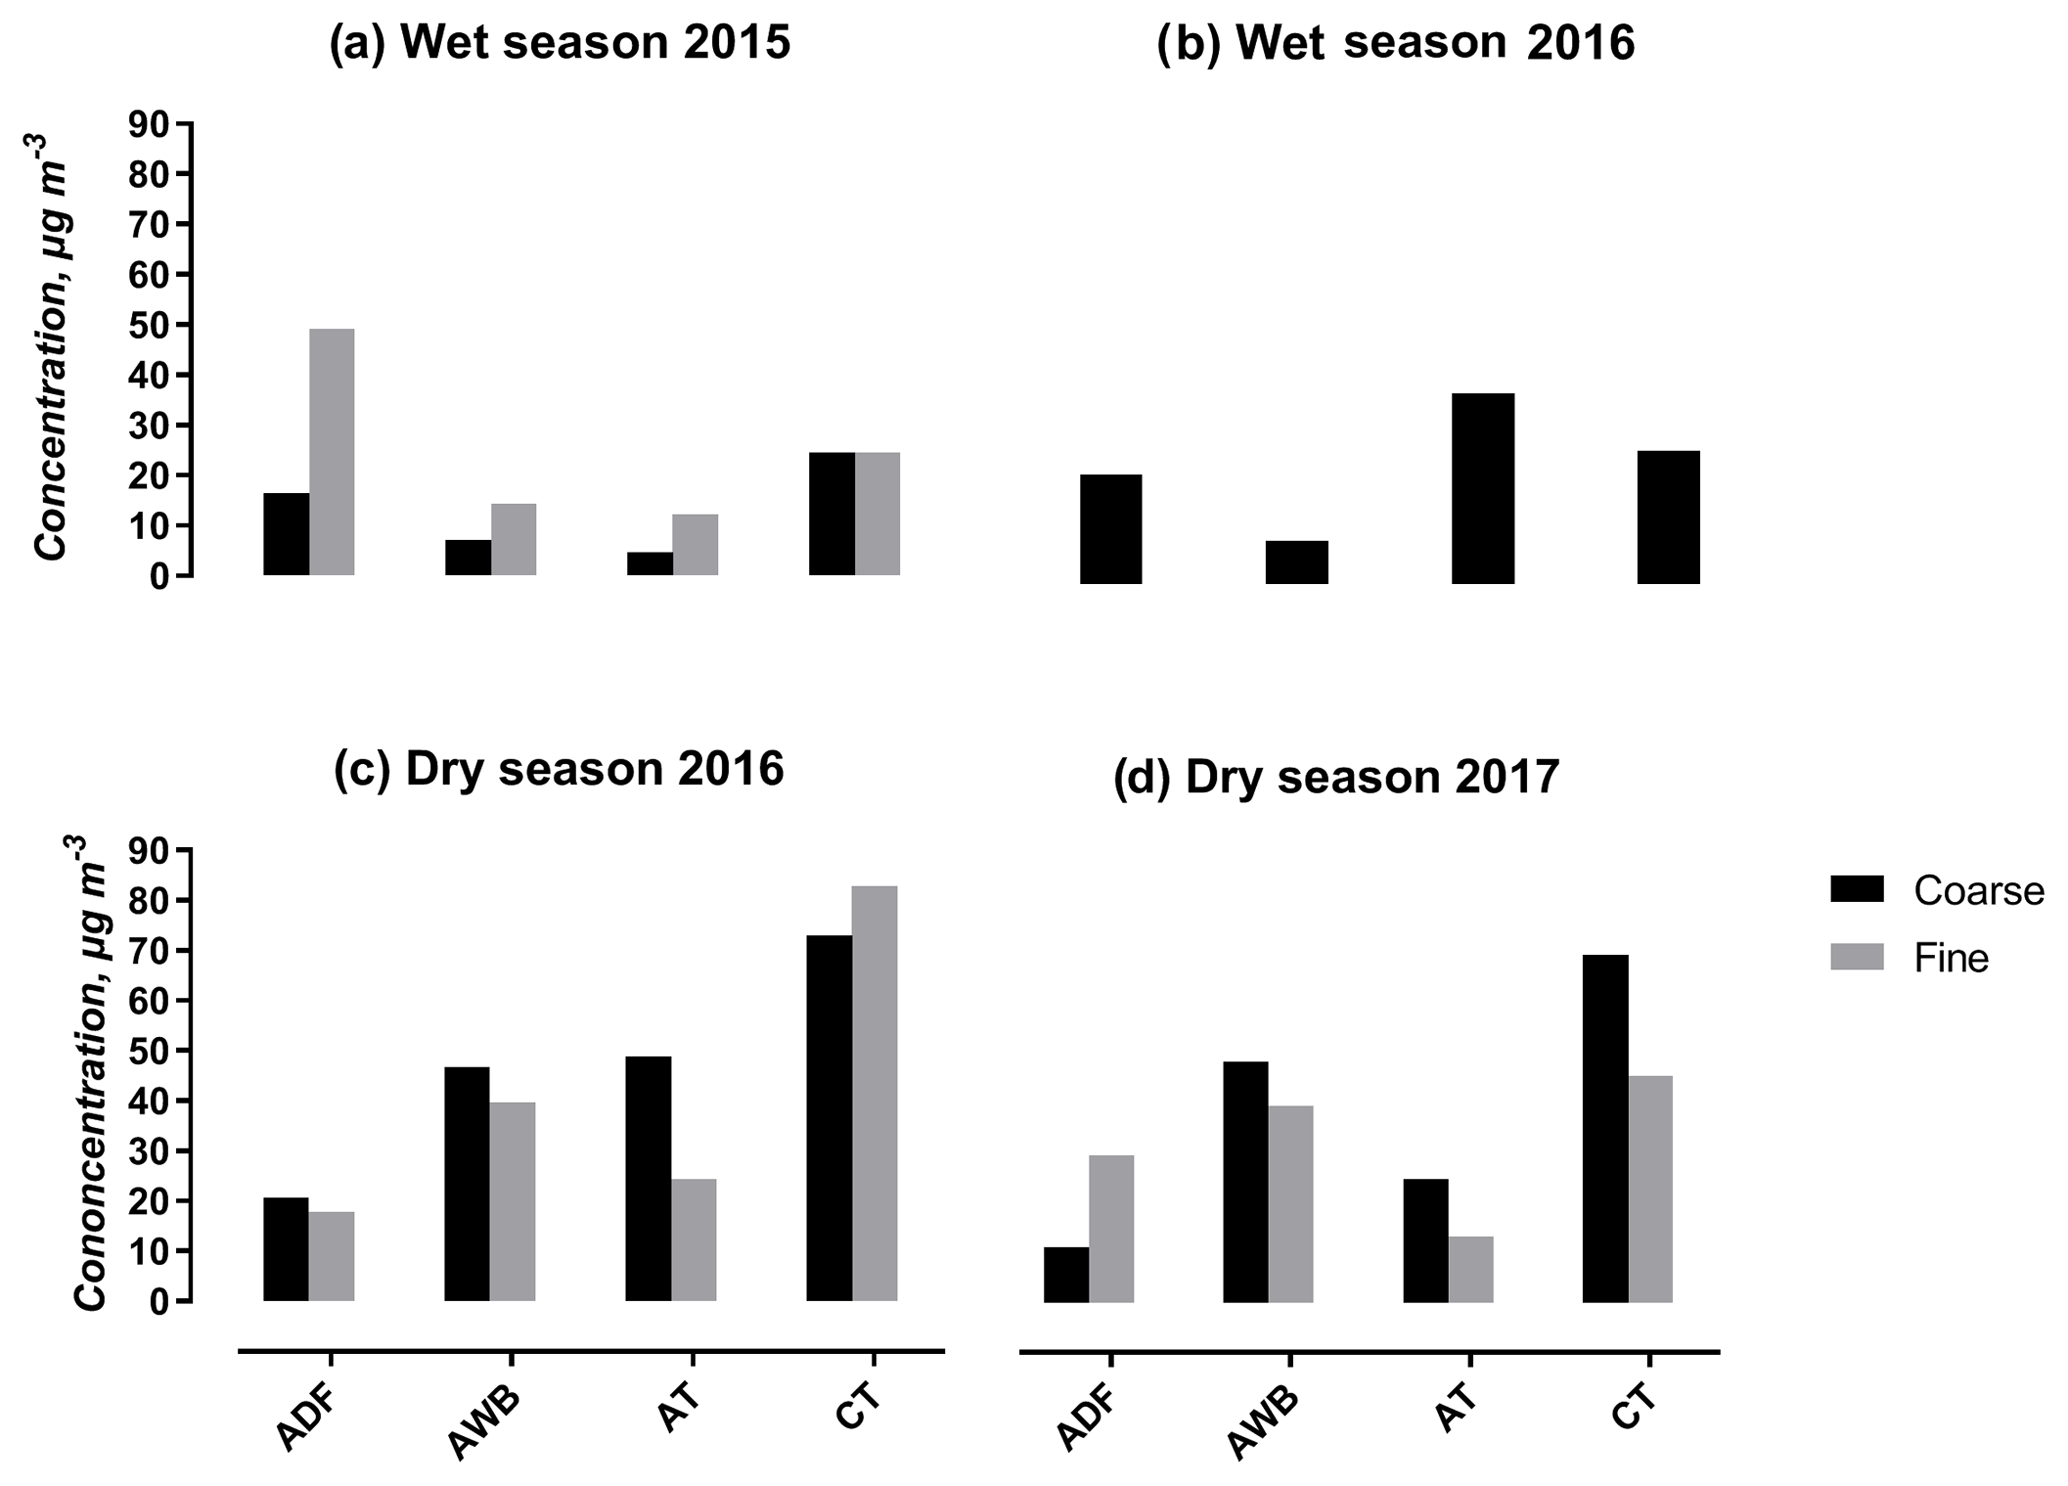
Figure 12Dust concentrations at the different study sites for each campaign and for the different sizes (C in black, fine in light grey, ultrafine in grey).
3.5 Dust
Figure 12 shows dust concentrations calculated from the Guinot et al. (2007) methodology (see Sect. 2.3.6) for C and F particle sizes at the different sites for each season. Note that as for WSI and trace elements and due to our sampling procedure, there are values for fine and coarse particles for all seasons except for WS2016 with values for coarse particles only.
During the wet season, coarse dust concentrations range from 5 to 25 µg m−3 in 2015 and 9 to 37 µg m−3 in 2016, with higher values at the CT and ADF sites in 2015 and at AT, CT, and ADF sites in 2016. In WS2015, fine dust concentrations range from 12 to 49 with maximum values at ADF and CT sites also. During the dry season, values range from 38 to 156 µg m−3 in 2016 and from 41 to 116 µg m−3 in 2017, with maximum concentrations obtained at the CT site, followed by the AWB site. When considering mean values of the dry seasons, total dust at the CT site is 2.4 times the values found at AT, 1.6 times the value at AWB, and 3.4 times the value at ADF. Seasonal comparison shows that total dust concentration is higher in the dry seasons than in WS2015 by a factor of 3 at the AT site, 2.6 at the CT site, and 4 at the AWB site but of the same order of magnitude at the ADF site.
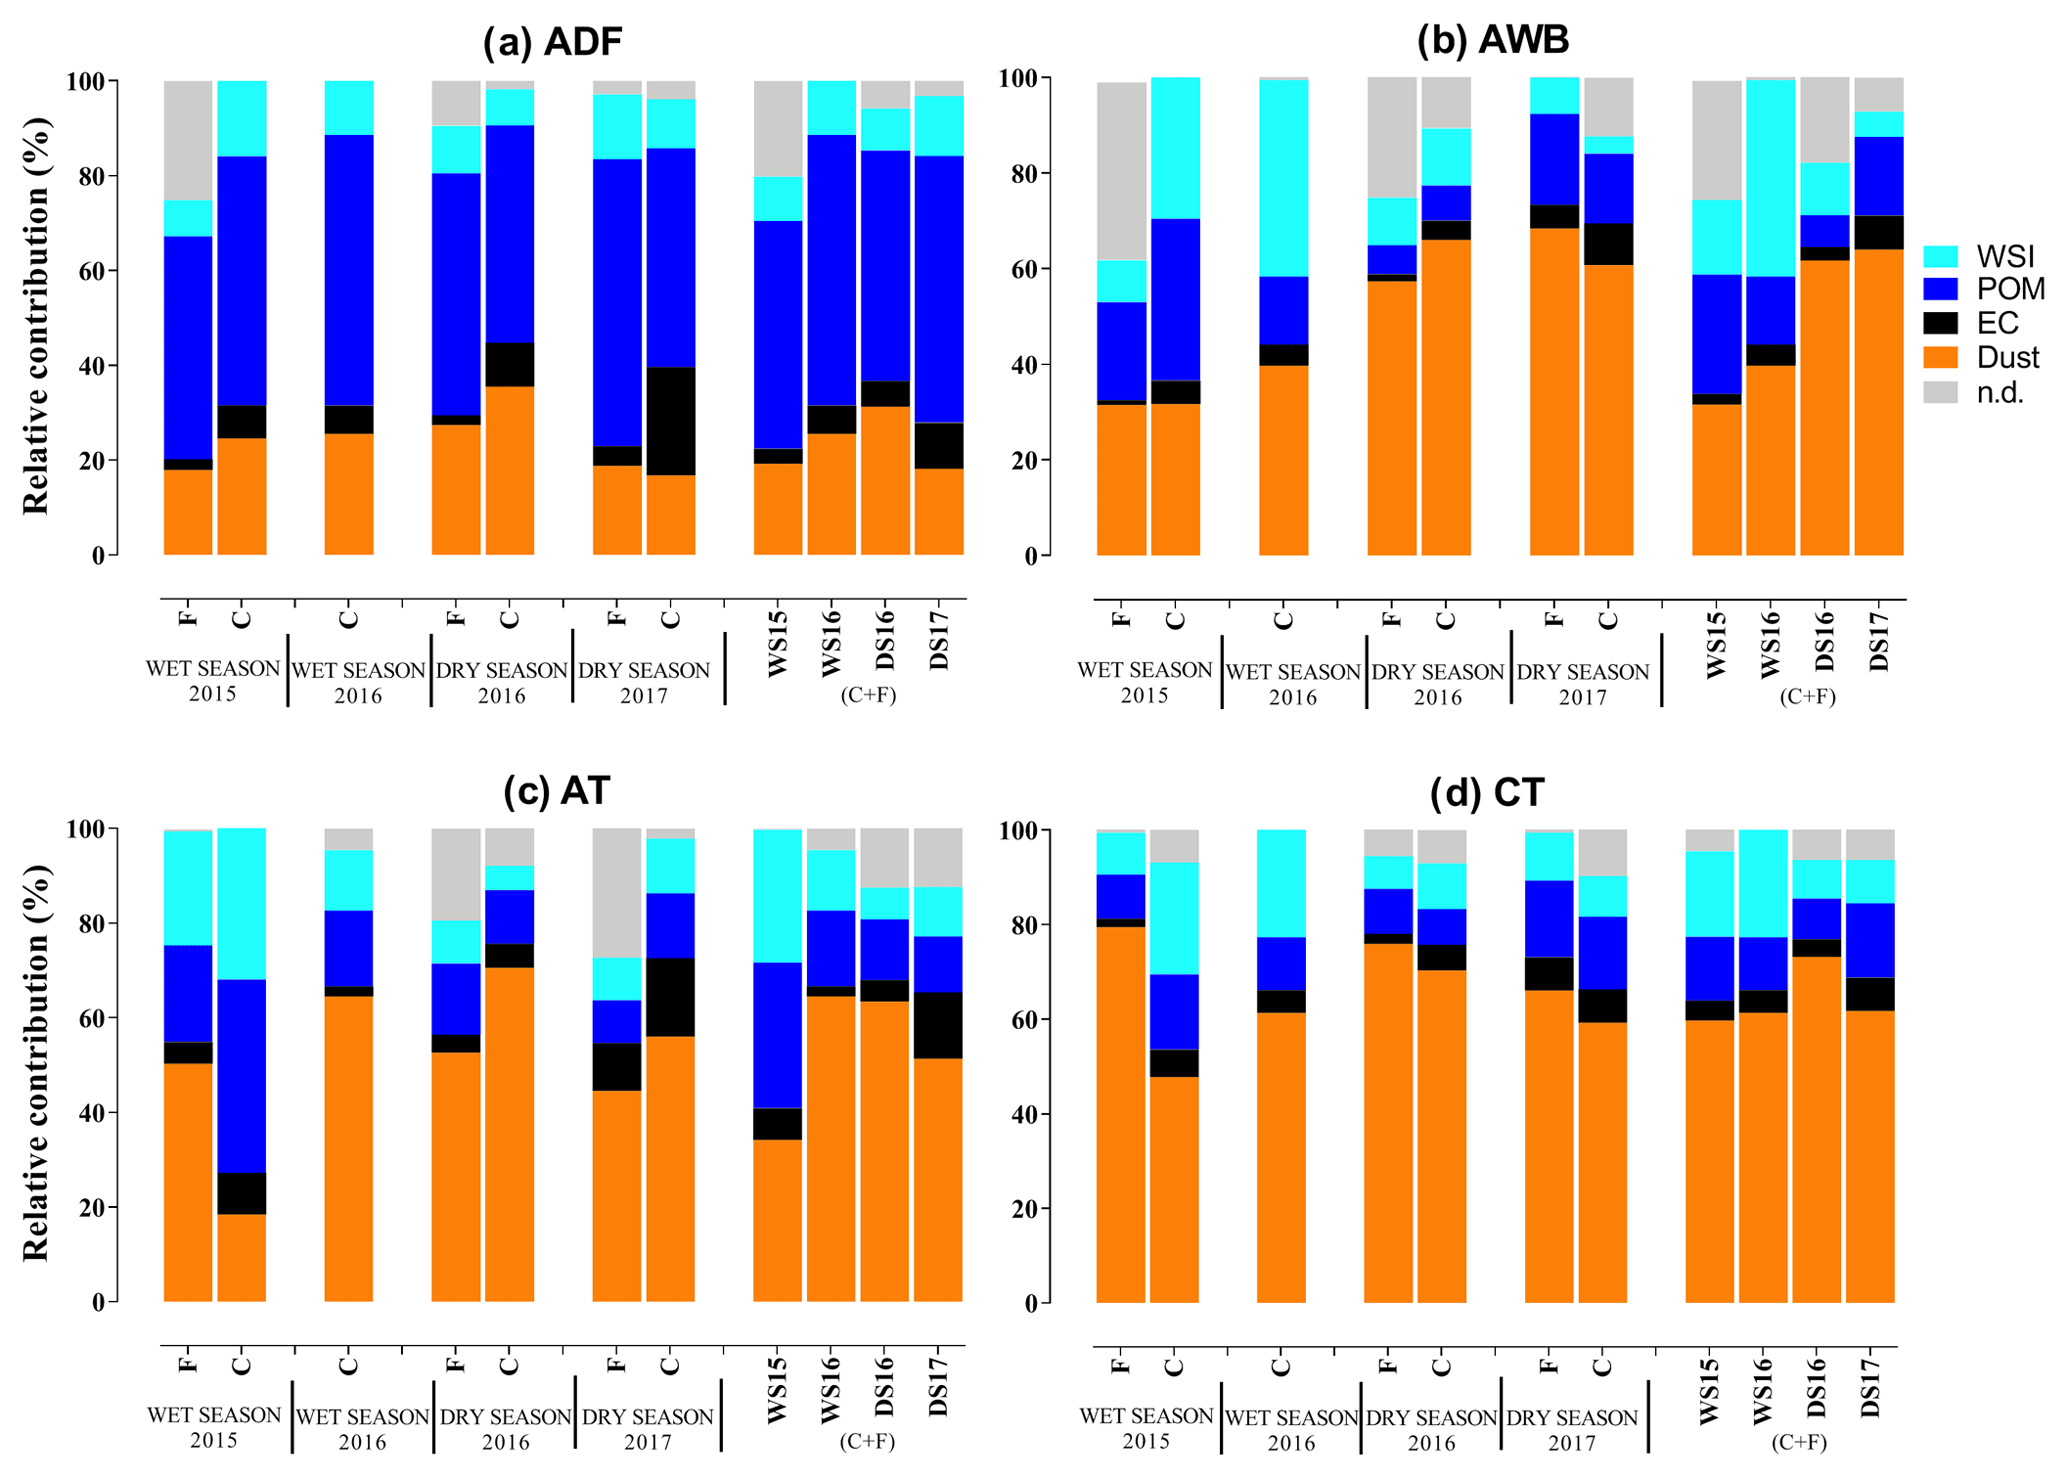
Figure 13Size-speciated aerosol chemical composition for each site, for each campaign, and each aerosol size.
3.6 Aerosol chemical closure
The aerosol chemical closure obtained using the Guinot et al. (2007) method (see below) at the different sites for each season is presented in Fig. 13. Results show clear intra- and interannual variations at all of the sites, as well as significant differences among the sites. In total, dust accounts for 39 %–75 % of the bulk PM mass at both traffic sites, with no clear seasonal cycle and higher contributions in Cotonou (Fig. 13c and d). These percentages vary from 32 % to 64 % at the AWB site and from 18 % to 35 % at the ADF site, with percentages 1.8 times higher in the dry season than in the wet season at the AWB site and no clear seasonal difference at the ADF site (Fig. 13a and b). Carbonaceous aerosol, the sum of EC, and POM show large contributions at the ADF site (from 49 % to 69 % of the total PM mass), with relatively similar proportions in each season (Fig. 13a). The absence of a clear seasonal pattern is also observed at the CT site, whereas carbonaceous aerosol is slightly higher in WS than in DS at the AWB site (23 % and 16 %, respectively) and at the AT site (37 % and 21 %, respectively) (Fig. 13b–d). Carbonaceous aerosol contribution accounts for about 11 %–49 % of the total mass at both traffic sites with higher values at the AT site (mean of 30 %) than at the CT site (13 %). The ion percentages in PM fractions present the same pattern at AT, CT, and AWB sites with higher values in wet than in dry seasons. In these sites, we may notice that mass concentration in coarse particles is larger in the wet season, while of the same order of magnitude as the one in fine particles in the dry season. In the ADF site, no marked difference may be found between the seasons and the sizes (Fig. 13).
A discussion of the results site by site (Abidjan domestic fire site, traffic sites both together and waste burning site) will be first proposed. We will scrutinize (1) the proximity between the sites and the sources, (2) the source specificity with more or less incomplete combustion (e.g., wood combustion and two-wheel vehicle emission factors are higher than gasoline emission factors; Keita et al., 2018), (3) the relative influence of other local sources or transported sources on the studied sites such as dust and biomass burning, (4) the occurrence of continental air masses, (5) the variation in the boundary layer height (as reported by Colette et al., 2007), and (6) the meteorological parameters (e.g., temperature, relative humidity, and wet deposition) to explain the differences in pollutant concentrations and their seasonal and interannual variabilities.
In a second part, we will present comparison of our values with other DACCIWA values and also with literature values for other intensive campaigns in Africa.
4.1 Abidjan domestic fires (ADF)
As shown in the above paragraphs, maximum values are obtained at the ADF site for aerosol mass, EC, OC, WSOC, water-soluble ionic species (e.g., Cl−, , Ca2+, and K+), and some trace elements such as Mg and K (whereas Al, Na, and Fe are lower than in the other sites). Also, aerosol PM2.5 values are well above the annual and daily WHO guidelines of 25 and 10 µg m−3, respectively, whatever the season.
Such a pattern is due to the proximity of the ADF site to the studied combustion source; in that area, the use of wood combustion is very active due to commercial activities of women drying fish and meat and domestic cooking. This is also confirmed by the high relative importance of total carbon in aerosol mass whatever the size (49 %–69 %) and by values of the source enrichment factor. Indeed, at least 30 % of trace element concentrations are of anthropogenic origin at the ADF site. In addition, wood combustion is well known to be highly polluting due to incomplete combustion; this is shown here by the measurements of very high OC ∕ EC ratios at ADF, on the order of the one measured at the source level by Keita et al. (2018). This is also shown by WSOC relative importance, which is expected for wood burning following Yu et al. (2020), Tang et al. (2016), Feng (2006), and Saxena and Hildemann (1996), and by the strong correlation of WSOC with biomass burning K+ tracer.
Chloride is most likely associated with the sea salt origin (normal chloride concentrations represent at least 55 % of marine aerosols following Goldberg, 1963) or secondary aerosol production (Li et al., 2016). Since chloride relative concentration at the ADF site remains lower than the that of sea salt aerosols, the secondary production source would be the better explanation for high chloride concentrations observed at ADF. The size distributions of Cl−, K+, , and support this conclusion; the predominance of these elements in fine-particle mode at the ADF site would be associated with anthropogenic emissions, particularly biomass combustion and domestic fires, or with secondary inorganic aerosol origin. This is confirmed by ratio values as shown earlier. Contrarily, Ca2+ and contributions to the total ions at the ADF site peak mainly in the large particle fraction and may be attributed to quasi-natural origin, primarily to dust emissions and nitrate formation by reaction processes, respectively. In addition, Na+ and Mg2+ display similar size distributions at the ADF site, with the major contribution in the coarse particle fraction, suggesting the common sea salt origin of these two elements (Belis et al., 2013).
As we have shown above, the lower proportion of metal elements at the ADF site (6.5 % of the bulk concentration) can be explained by the less dominant influence of resuspended dust particles compared to traffic sources. Elements such as Cr, Mn, Pb, and Ni have less seasonal variability than other metallic elements. These small proportions of these non-crust elements suggest a low contribution of elements emitted mainly by anthropogenic activities such as industrial processes (Viana et al., 2007, 2008; Minguillón et al., 2014). Finally, the Zn∕Cd ratio has been also examined. A value of 29 close to ratio reported for gasoline vehicle (27, Qin et al., 1997) is obtained for the ADF site, indicating that this site is also impacted by traffic sources.
High values of WSOC ∕ OC ratios are expected to be harmful to health (Ramgolam et al., 2009; Val et al., 2013). This effect is being enhanced by the particulate size measured at this site (Kim et al., 2003; Wilson et al., 2002). Indeed, the relative mass distribution of PM and OC particle sizes shows a major contribution of particles less than 1 µm (as high as 85 % of PM). This could be due to the fact that carbonaceous aerosols are formed near emission sources and are mainly of submicron size (Boucher, 2012). Nevertheless, note that EC also presents a large coarse-particle contribution. This could be due to the importance of wood burning at this site with less efficient combustion and large particle emissions (Watson et al., 2011).
In terms of seasonality, higher concentrations of aerosol mass, OC, WSOC, EC, and total water-soluble ionic species (, , and ) are observed in WS2015 and WS2016 than in DS2016. This may be explained by a more incomplete combustion in the wet seasons than in DS2016 due to the use of moist wood for cooking and smoking fish, which leads to large amount of smoke and higher particulate emission factor values. Note that DS2017 values are as important as the ones of wet seasons, which will be explained later in the text. With regard to WSOC, their variabilities may be also linked to meteorological factors, such as solar radiation (Tang et al., 2016; Favez et al., 2008) and relative humidity (Liang et al., 2016). At the ADF site, temperatures are roughly similar in both seasons. However, RH variability may play a role since it is higher in the wet season than in the dry season. Finally, our results indicate no clear seasonal cycle for Cl−, which confirms its anthropogenic origin, as previously shown.
4.2 Traffic sites (Abidjan traffic and Cotonou traffic sites)
Let us recall first that the two traffic sites have been chosen since they are representative of the traffic diversity in West Africa. At the CT site, both personal cars, taxis, and an important two-wheel fleet may be found, whereas at the AT site, there are buses, taxis, and personal cars. Also, the distance between the site and the traffic sources is the same for the two traffic sites, slightly larger than the distance between the site and the wood burning sources at the ADF site.

Figure 14MODIS Aerosol optical depth regional distribution over West Africa. Data are for 2017, focusing on our campaign date at Abidjan (a–c 11–12 January, left part) and Cotonou (b–d 6–7 January, right part).
In these two sites, concentrations are high with PM2.5 values well above the WHO guidelines. Average aerosol mass, EC, OC, dust, and water-soluble ionic concentrations (with and Ca2+ maximal at AT and CT sites, respectively) are higher at the CT than at the AT site by a factor of 1.5 to 2. Note that this poor air quality found in Cotonou has been reported by Cachon et al. (2014). The higher values found in Cotonou could be due to more intense traffic in Cotonou than in Abidjan. Also in Cotonou, this traffic is associated with the lack of public transportation and the use of highly polluted mopeds (aged over 15 years) (Gounougbe, 1999; Avogbe et al., 2011), despite the effort in the last 10 years to restrict their use. Several studies such as MMEH (2002) have shown that more than 94 000 mopeds and 350 000 secondhand vehicles are in circulation in Cotonou. Other factors contributing to the local pollution include outdoor restaurants using charcoal and motorcycle garages, which are more present around the Cotonou traffic site compared to the Abidjan site. It also includes anthropogenic dust. Indeed, at Cotonou, the lack of road infrastructure favors the resuspension of dust particles. Finally, other sources may potentially influence aerosol seasonal composition in these two sites, including marine aerosols, transported dust and biomass burning particles, and anthropogenic aerosols from the surrounding countries (Fig. 5). Note also that source enrichment factor values show that about 17 % of trace element concentrations are of anthropogenic origin at both traffic sites and that the relative importance of total carbon in mass is higher at the AT than at the CT site.
Aerosol mass, composition, and size depend on the season, and the two traffic sites are differently affected. The EC and OC concentrations measured in both traffic sites and averaged per season are higher in dry than in wet season. Such variations may be explained by several factors: particulate wet deposition occurring during the wet season, reduction in traffic flow due to school vacations, and meteorological influence. Higher EC and OC concentrations are obtained at the CT rather than at the AT site in dry seasons, whereas no statistical difference may been found between the two sites in wet seasons. Such a result is mainly explained by Fig. 5. In wet seasons, similar a back-trajectory pattern may be observed for both sites, whereas in dry seasons, the CT traffic site only would be influenced by Nigerian anthropogenic sources.
In terms of WSOC concentrations, concentrations at the AT site are on average higher than those recorded at the CT site in the wet season but lower in the dry season. The presence of dust can produce semivolatile organic gas scavenging and therefore WSOC and OC enhancement. Such a phenomenon can explain the highest WSOC concentrations observed in the dry season at the CT site where dust concentrations are highest (see dust paragraph). Moreover, this can also explain why the maximum WSOC values are in coarse particles at the CT site, while at the AT site maximum values are in ultrafine particles.
Total WSI concentrations are larger at the AT site in the wet than in the dry season with higher values in coarse particles. At the CT site, total WSI concentrations in fine particles are higher in the dry than in the wet season, whereas the same values are obtained in coarse particles for both seasons. Note that CT values are generally higher than AT values with a more important contribution of fine particles in the dry season. These WSI variations can be explained by the relative importance of Ca2+, , and at both sites.
Table 4Comparison of PM2.5 concentrations with literature data. Only literature data given at a daily scale have been selected.
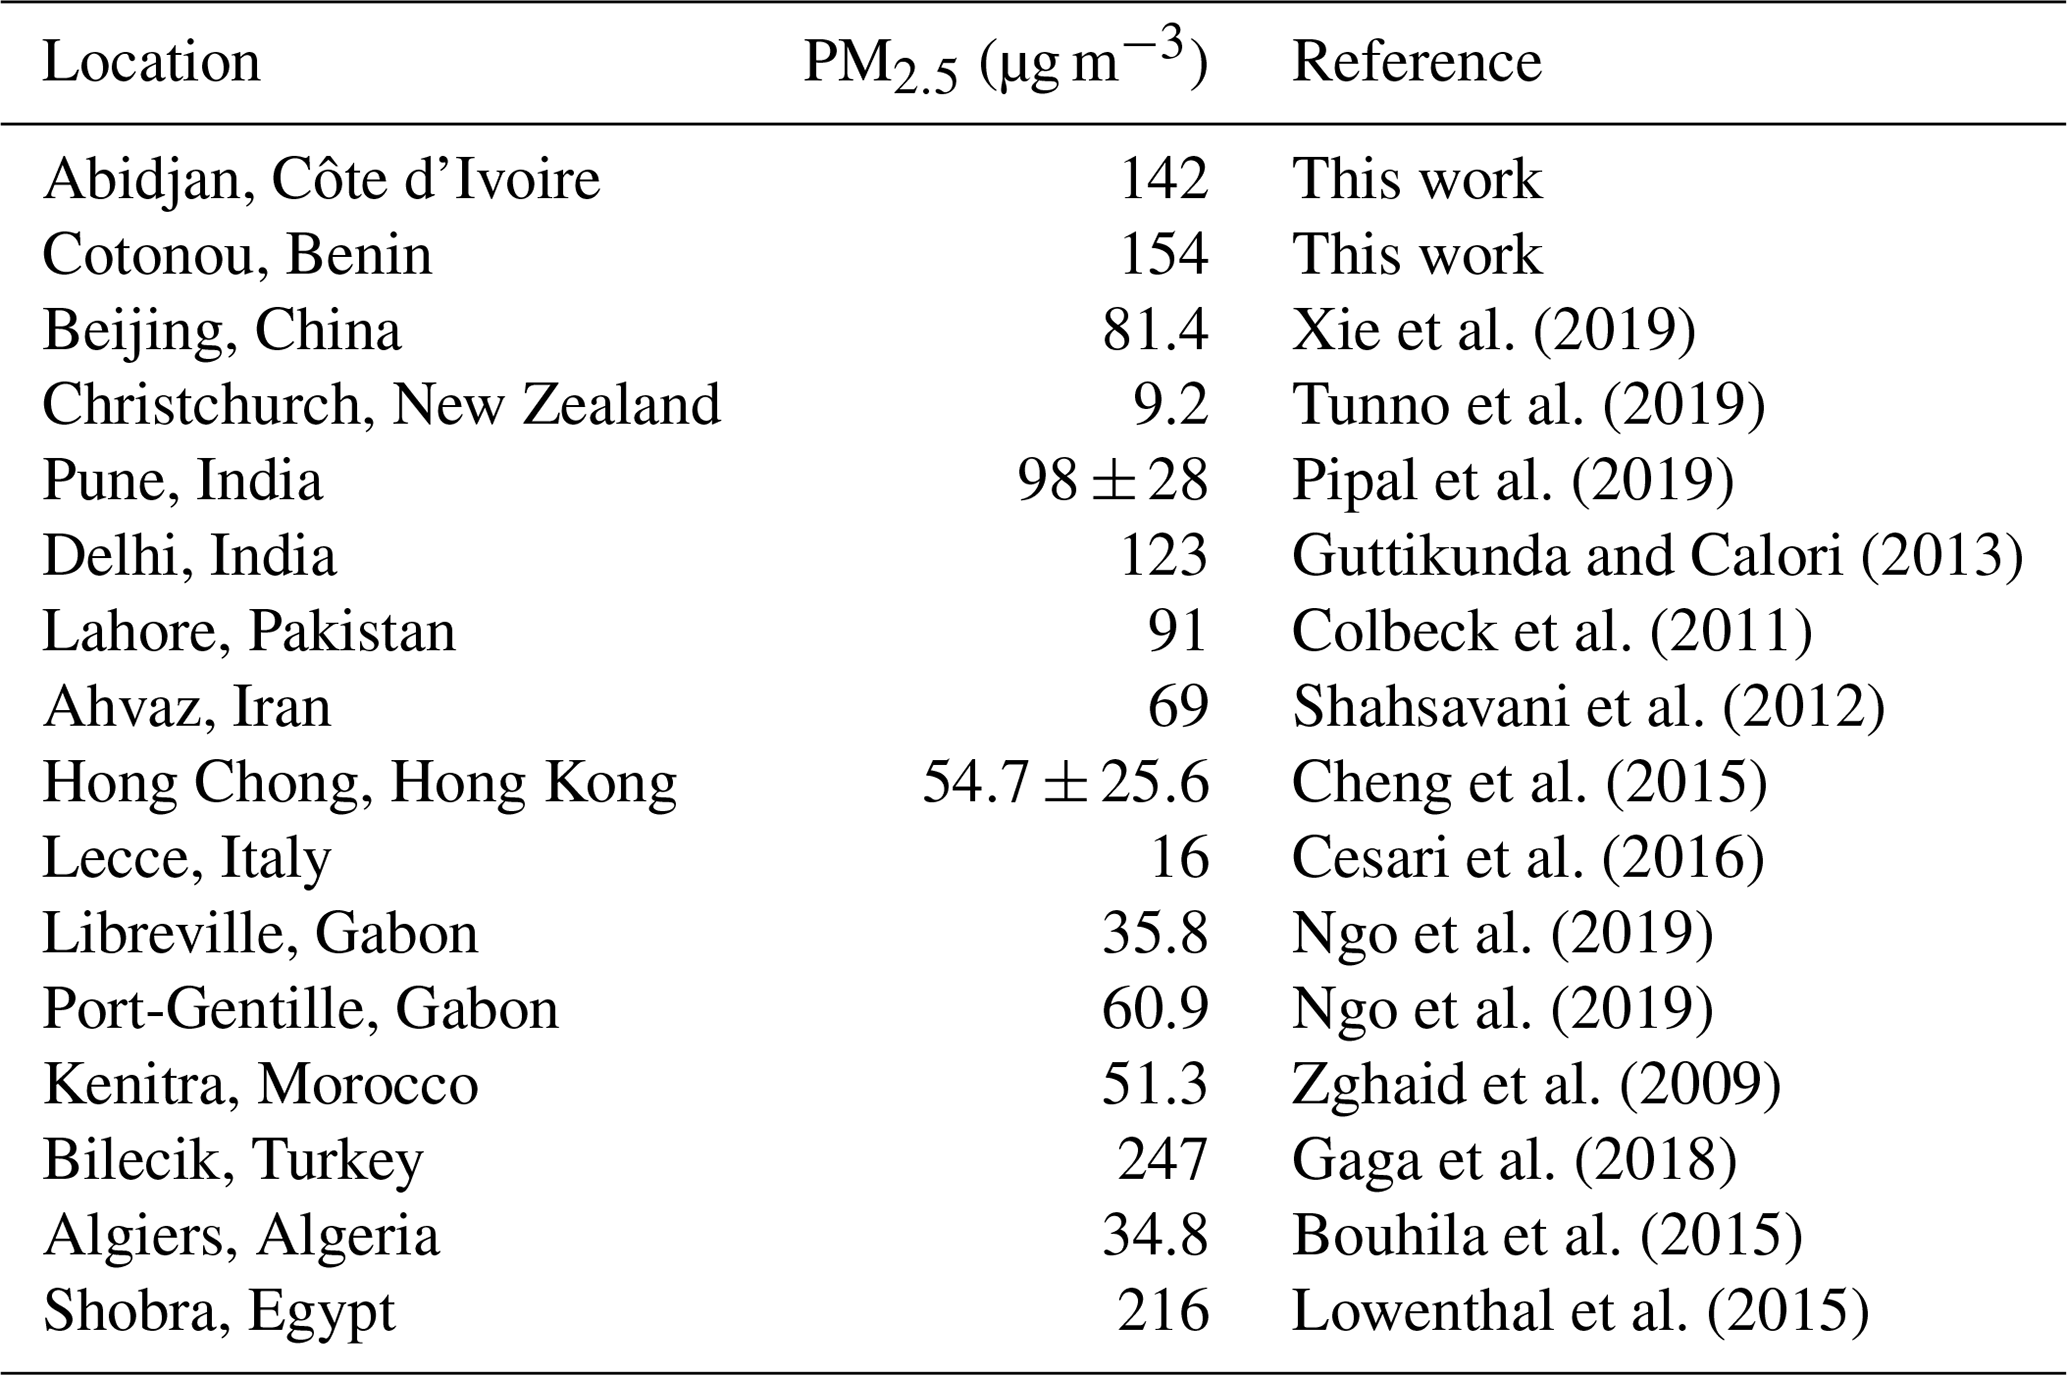
Table 5PM2.5–EC and PM2.5–OC comparison with Djossou et al. (2018) and Xu et al. (2019) values. Units are in micrograms of carbon per cubic meter (µg C m−3).
First, the Ca2+ contribution to total WSI is higher at the CT site than at the AT site, with no clear seasonal variation at the CT site and higher values in the dry season than in the wet season at the AT site. Also at the CT site, fine, and coarse Ca2+ particles are in the same range, whereas coarse Ca2+ particles are predominant at the AT site. Such a feature may be explained by the impact of dust sources including long-range dust transport at Abidjan and a combination of long-range dust transport and road resuspension at Cotonou.
Second, the relative contribution of , , and as a percentage of total WSI in the different particle modes is reduced in the wet season. During the wet season, the clean winds surrounding the ocean before reaching the measurement sites could contribute to lower the proportion of these species, in addition to the scavenging processes during the rainy days. Unlike the wet season, a relatively good correlation with r2 of 0.87 ( versus ), 0.73 ( versus ), and 0.87 ( versus ) has been found in coarse particles, indicating similar sources for these three species during the dry season. In order to try to identify these sources, the ratios of and have been determined. The average and ratios in combined coarse particles (1.07 and 2.58 during the wet season and 0.33 and 1.60 during the dry season) are higher than the corresponding ratios for typical soil (0.026 and 0.003, respectively). On the other hand, the ratio increases in the fine particles (5.07 during the wet season and 2.53 during the dry season), while that of remains almost constant (2.86 during the wet season and 1.65 during the dry season). This implies that the atmosphere at AT and CT sites is enriched by formed as anthropogenic secondary particles, possibly from sulfur-containing pollution sources (Seinfield and Pandis, 1998), particularly in fine-particle mode, and by mostly coming from nitrogen-containing sources in all particle sizes. The higher contributions of these elements during the dry season could result from a combination of several factors: (1) an atmosphere loaded with dust favoring heterogeneous chemistry to obtain secondary aerosol and the rise of biomass burning emissions; (2) the increase in photochemical activity and higher concentrations of hydroxyl radicals in the dry season, which can oxidize SO2 from combustion (Arndt et al., 1997) to (Li et al., 2014); and (3) the wind transport of anthropogenic secondary particles from the industrial zone located upstream from our sites. Finally, the proportion of Cl− relative to the total mass of ions is highest for coarse particles at both traffic sites especially during the wet season, suggesting that Cl− at AT and CT sites has a natural origin and is probably from sea salt emissions.
If we focus now on dust during the two wet seasons, concentrations are higher in 2016 than in 2015 at CT and AT sites for coarse particles (no data of fine particles are available in WS2016). This is consistent with observed aerosol optical depth (AOD) values at the CT site, which increased by a factor of 2 between 2015 and 2016. No AOD value is given by Léon et al. (2019) at Abidjan in WS2015 to allow such a comparison in Abidjan. Moreover, during the wet season, an Angström coefficient (AE) on the order of 1 has been found at the CT site, indicating smaller particles that could be due to road resuspension. It is interesting to note that during WS2016, AOD and AE are, respectively, higher and lower at Abidjan than at Cotonou. Again, this is consistent with our dust concentrations at the CT site. In Abidjan, we could assume that another source of Ca2+, which is not taken into account in our dust calculations, may explain our dust concentration data. That may be the result of anthropogenic Ca2+ emissions from residential combustion, more important in 2016 than in 2015 as shown earlier (http://naei.beis.gov.uk/overview/pollutants?pollutant_id=84, last access: 3- December 2019).
The relative contribution of dust generally peaks in the coarse mode and, to a lesser extent, in the fine mode, reflecting a natural origin. It is interesting to note that the dust contribution observed in this study for the year 2016 at the Abidjan site is in agreement with the results of Xu et al. (2019) which show a PM2.5 dust contribution of 35 %–50 % compared to our values of 18 %–52 %.
4.3 Abidjan waste burning site
Concentrations measured at the AWB site are slightly lower than values found in the other sites. This can be explained by the larger distance of the site to the main studied source (here waste burning source) than in the other sites. However, PM2.5 values are also higher than WHO guidelines.
Aerosol mass, EC, and OC concentrations are higher in the dry than in the wet season, which suggests less waste burning activities during the wet season or impacts of other local anthropogenic sources or long-range biomass burning sources. The highest values are found in DS2017 with the lowest OC ∕ EC ratio, as at the AT site. The OC ∕ EC ratio is highly variable at the AWB site (1–10), which confirms that the AWB site may be impacted by different types of sources as well as by secondary aerosol organic formation which can be detected for OC ∕ EC higher than 2 (Turpin et al., 1990; Hildemann et al., 1991; Chow et al., 1996). Note that OC ∕ EC typical for the waste burning source is on the order of 8 (Keita et al., 2018).
It is also observed at the AWB site that PM mass concentrations are mainly distributed in C mode (30 %–44 %) over the entire period of study, excepted during WS2015, and to a lesser extent in F mode (21 %–44 %). EC and OC are mainly distributed in C and UF modes. Water-soluble fraction of organic carbon is important (32 %) and on the order of the one found at the AT site. Same for WSI concentrations and WSI composition. At the AWB site, WSI values are globally slightly higher in the wet than in the dry season. However, it is interesting to underline that Ca2+ is much higher in the dry season than in the wet season, especially in DS2017. This is in agreement with dust concentrations and trace element concentrations, which have been found to be maximal at the AWB site, reaching 35.8 % of the total PM mass in the dry season. These maximum percentages are due to the large contribution of both Al and Na crustal elements, which account for about 26 %. Also note a Cu∕Sb of 0.08 in DS2017, which indicates an influence of resuspended particles. A Zn∕Cd value of 56 is obtained for the AWB site, which is in close agreement with values reported for oil burning (Watson et al., 2001; Samara et al., 2003). That could indicate that oil might be one of the waste burning materials.
Our result suggests that AWB aerosol mass is influenced by a mix of sources, including fuel combustion and mineral salt from sources around the measurement site, associated with the long-range source impact of dust and biomass burning, which will be further discussed in the next paragraph.
4.4 Interannual variability in aerosols in Abidjan and Cotonou
EC and OC concentrations are generally higher in DS2017 than in DS2016 for all of the sites. This is not due to the meteorological condition, which is similar in both years. This is also not due to biomass burning impacts. Indeed, when looking at MODIS burned areas for our period of study (http://www.aeris-data.fr/redirect/MODIS-MCD64A1, last access: 4 March 2019), burned areas of West African savannas are higher in 2016 than in 2017. Therefore, carbonaceous aerosol concentrations should be higher in 2016. Then, this could be due to a counter effect between biomass burning emission strength and air mass transport efficiency. As a result, biomass burning impact could not explain the difference in EC and OC during the dry season between 2016 and 2017. Rather, this is due to the variability in local sources. In DS2016 in Abidjan, there was a general strike of civil servants of the State with important consequences on urban activities. Lower activities were observed (lower fish smoking emissions, lower traffic, etc.) in DS2016 compared to DS2017, thus explaining the lower EC and OC concentrations at Abidjan sites. In Cotonou, highest carbonaceous aerosol values in DS2017 may be explained by back-trajectory patterns; Cotonou would be impacted by air masses coming from the highly polluted Lagos (Nigeria) area in that period, while from less polluted northern areas in DS2016. Such an assumption is validated by the AOD values at 550nm from MODIS satellite images (http://www.aeris-data.fr/redirect/MODIS-MCD64A1, last access: 6 February 2019), which show very high particulate concentrations in the Gulf of Guinea (Fig. 14).
Table 6EC and OC comparison with literature values. Only literature data given at a daily scale have been selected.
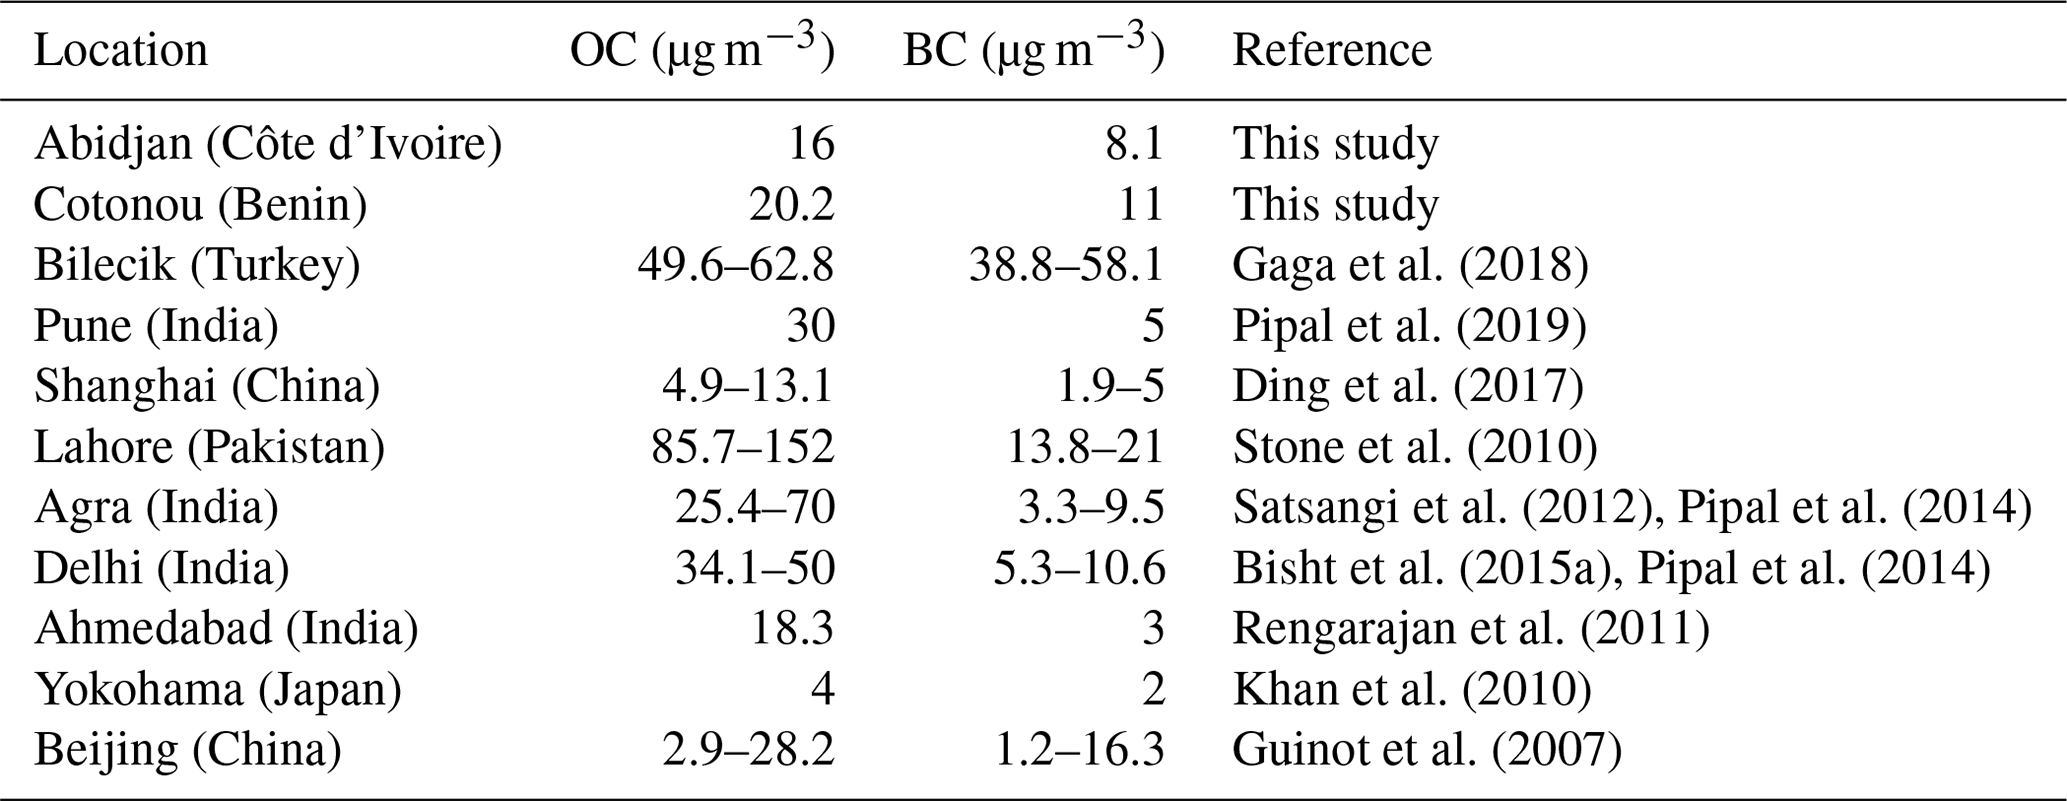
Table 7Comparison of WSOC concentrations with literature data. Only literature data given at a daily scale have been selected.
This figure also shows the AOD difference between Cotonou and Abidjan for DS2017, with higher values at Cotonou than in Abidjan for the campaign period, in agreement with our measurements of aerosol mass, EC, OC, and dust. This is confirmed by the DACCIWA sun photometer AOD and Angström coefficient (AE) measurements at Abidjan and Cotonou (Léon et al., 2019; Djossou et al., 2018). Indeed, in DS2017, during our period of measurements, mean AOD in Cotonou is on the order of 1.3 versus 0.9 in Abidjan for an AE of 0.6 for both sites, which clearly indicates the presence of coarse dust particles.
Finally, aerosol mass and dust concentrations have been seen to be higher in DS2016 than in DS2017 in Abidjan, whereas values are of the same order of magnitude at Cotonou. Such high values at Abidjan in DS2016 can be explained by the back-trajectory pattern, with air masses all coming from northern dusty areas in DS2016 (Bodélé depression in Tchad, Prospero et al., 2002; Washington et al., 2003; Knippertz et al., 2011; Balarabe et al., 2016) and/or from northern dusty countries (Mali, Niger) (Ozer, 2005), whereas in DS2017, contribution of southern marine clean air masses may also be noted.
In the wet season, aerosol mass, EC, and OC are higher in WS2015 than in WS2016. This may be due to particulate wet deposition, more efficient in WS2016, which has been seen earlier to be more rainy (4.7 mm) than in WS2015 (2 mm). Moreover, at the AT site, dust concentrations are higher for coarse particles in WS2016 than in WS2015. Such variations may be explained by long-range dust sources and/or road dust resuspension processes. As no dust event has been noticed, local source explanation seems to be more evident.
In AT, CT, and AWB sites, OC ∕ EC ratios are globally on the same order for WS2015, WS2016, and DS2016, with values lower than for DS2017. This could be due to lower traffic activities linked to the DS2016 strike and the wet season vacation periods. Indeed, much higher OC ∕ EC ratios measured in DS2017 are typical of those of diesel vehicles (Mmari et al., 2013; Keita et al., 2018). Finally, it is interesting to note that OC ∕ EC ratios measured in this study are in the range of those previously reported for other megacities such as Agra in India with 6.7 (Pachauri et al., 2013), Helsinki in Finland with 2.7 (Viidanoja, 2002), Cairo in Egypt with 2.9 (Favez, 2008), Paris in France with 3.5 (Favez, 2008), and Milan in Italy with 6.6 (Lonati et al., 2007).
4.5 Comparison with literature data
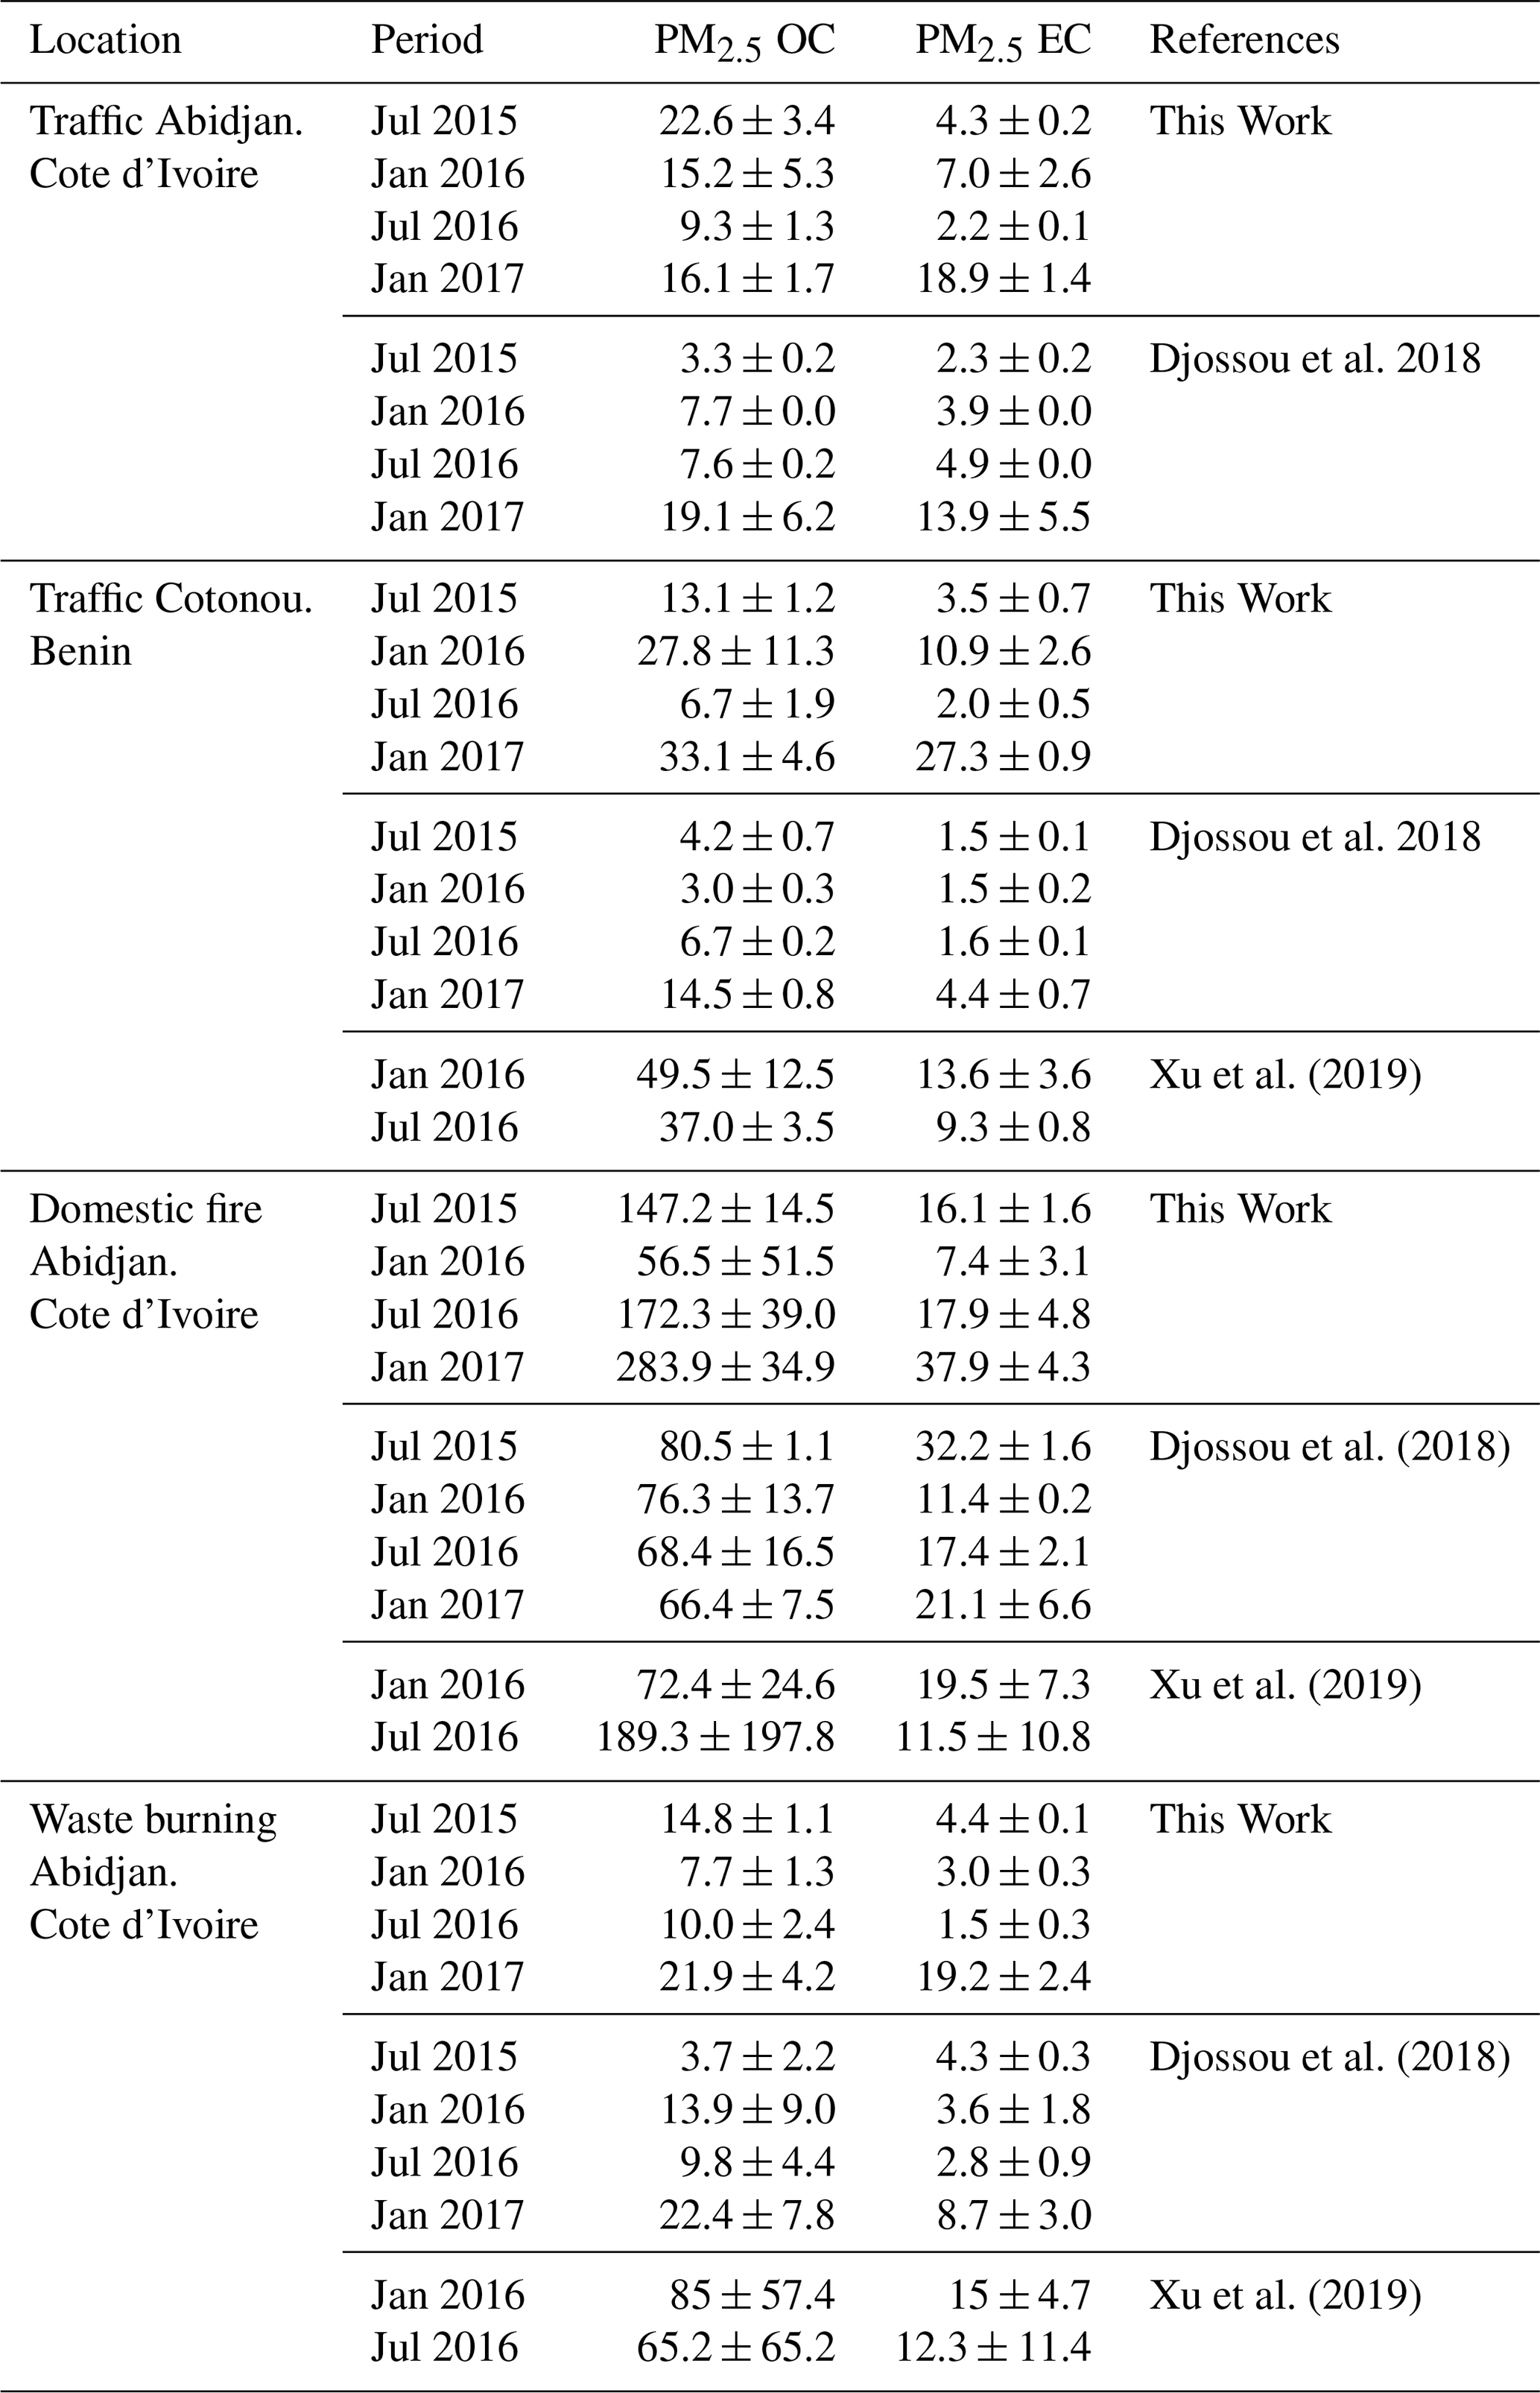
Firstly, the comparison between our data and other DACCIWA results including other time sampling focuses on PM2.5 levels, since these particle sizes are relevant for health impact studies (Xing et al., 2016). In addition to our values, Fig. 7 presents data from Xu et al. (2019) using personal samplers collected in the same area and on the same dates in 2016 during 12 h on women at the ADF site, students at the AWB site, and drivers at the CT site and from the Djossou et al. (2018) study based on filters exposed for 1 week and collected at the same areas and for the same periods as this study. We note that PM2.5 values directly measured on women are 2.3 and 0.9 times our values obtained at the ADF site in dry and wet seasons, respectively, and 3.4 and 4.9 times higher on students than at the AWB site and 1.6 and 2.1 times higher on drivers than at the CT site. Also, our values are on average 1.6, 3, 5, and 8 times higher than weekly integrated values of Djossou et al. (2018) including our 3 days of measurements at the AWB, ADF, AT, and CT sites, respectively. As it may be seen, the lowest concentrations are observed in Djossou et al. (2018), whereas the highest concentrations are recorded in Xu et al. (2019). This is valid for all sites, seasons, and campaigns. Differences between our values and Djossou values may be explained by the sampling times of the two studies. Indeed, as recalled, Djossou measurements are weekly integrated, taking into account diurnal activities during all of the week, including weekend and nights, which have expected lower PM2.5 concentrations. Our study includes only maximum pollution conditions for each site. The highest differences occur for the traffic sites. This may be clearly understood since diurnal and weekly variations in traffic sources are the most variable. Comparison between our values and Xu et al. (2019) values is also interesting. Indeed, it is at the ADF site that on-site and on-women PM2.5 concentrations are the closest, which shows that this site is the most representative of the pollution exposure to women. The biggest differences are found at the AWB site. As already mentioned, distance from the site to the waste burning source is more important than for other sites, which explains why concentrations obtained on students who are living close to the sources are much higher than on-site concentrations. At the Cotonou traffic site, measurements taken from people are also higher than on-site measurements. Such differences can be explained by additional pollution exposure as people move around. Note that the sampling technique may also play a role in such a comparison. In terms of seasonal variation, our results are in agreement with long-term EC measurements obtained by Djossou et al. (2018) for the same sites and period. Finally, Table 4 compares our mean PM2.5 results obtained from 3 h sampling for 3 consecutive days to literature data for different traffic sites in the world given at a daily scale. It is interesting to note that our values are situated at the higher end of the range of PM2.5 data observed from the other sites.
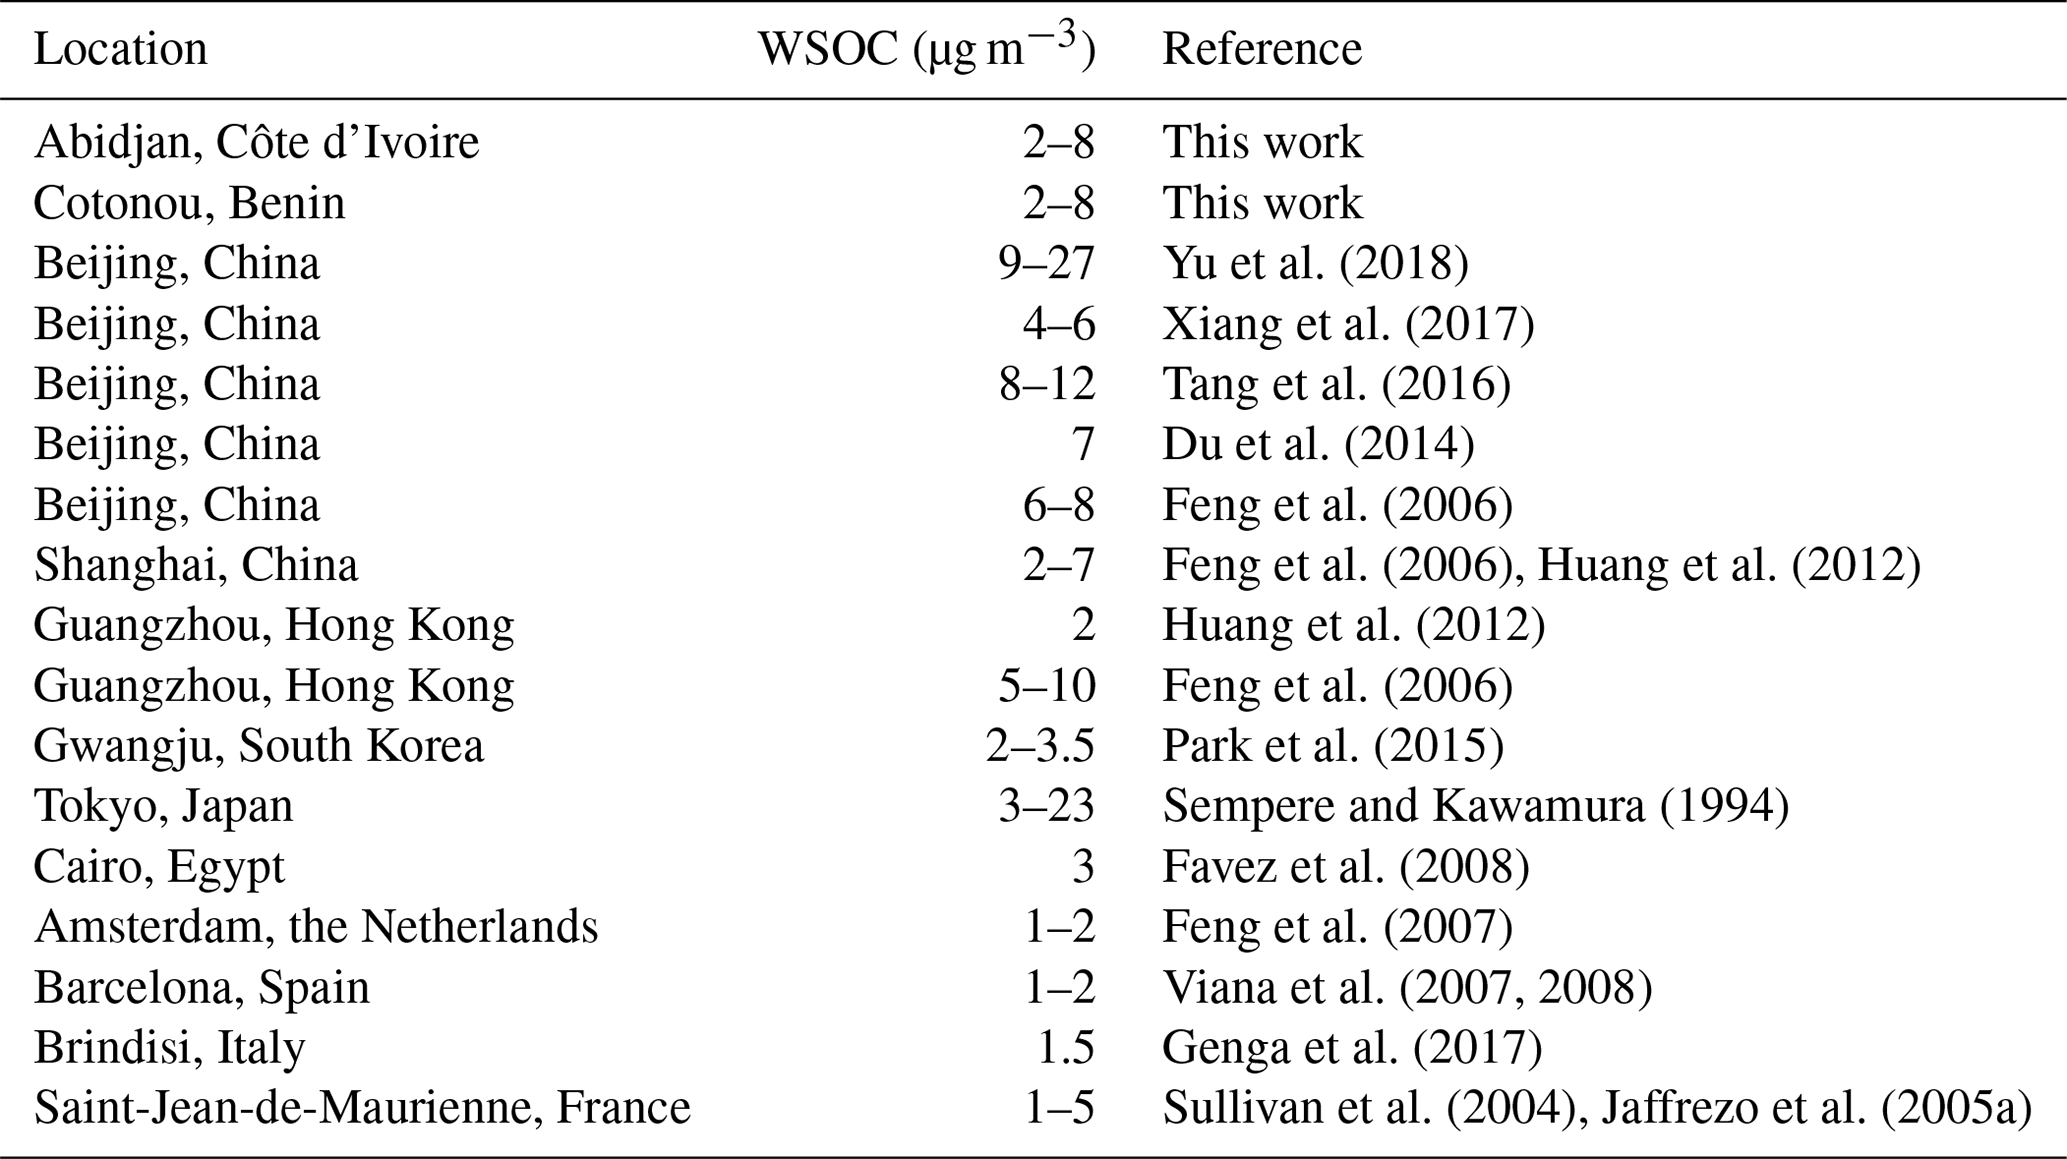
Secondly, Table 5 compares our OC and EC values to those obtained by Djossou et al. (2018) and Xu et al. (2019) as previously described for the same period and the same sites. Again, it is interesting to note that Djossou's values are in general lower than ours. Indeed, for the wet and dry seasons, our OC measurements are 4 and 1.4 times higher than Djoussou's at the AT site, 2.1 and 5.7 times higher at the CT site, and 2.5 and 2.5 times higher at the ADF site, respectively. As for PM2.5, this can be explained by the different sampling times between our experiments that were performed at the peak of urban activities, while Djossou's dataset represents weekly integrated values. Differences at the ADF site are largely explained by the temporal pattern of fish smoking activities which take place every day, only in the morning; as such the associated pollution is not well represented in the weekly sampling. Finally, there are less differences at the AWB site between both datasets. As explained above, there are no marked temporal variations of concentrations at the AWB site. The predominant waste burning emissions impacting our site can occur night and day on weekdays and weekends since the origin of such burning can be either anthropogenic or from spontaneous combustion. It may be also recalled that another reason for agreement between both datasets may come from the large distance between the site and the local and regional sources. Comparisons made between our values and those of Xu's personal data show that both OC and EC are of the same order at the ADF site, whereas Xu values are higher than ours at the CT and AWB sites. This result is in agreement with what we found with PM2.5 concentrations as detailed above. Finally, Table 6 presents OC and EC for the PM2.5 comparison between our values and other recent studies dealing with traffic sites in other regions of the world and with similar operational conditions. We find that our values are situated in the middle of the range observed in these different studies. Briefly, as presented in Table 7, it is interesting to compare our WSOC concentrations to literature data for different traffic sites of the world. We note that our values are on the same order as values found in Asia and higher than those found in Europe.
Thirdly, the percentages of the total WSI to PM mass (15 %–20 %) at the three Abidjan sites (ADF, AWB, and AT) are of the same order of magnitude as the data from PM2.5 personal exposure samples collected at the same locations in 2016 by Xu et al. (2019). Our results also are very close to the ionic contribution of 9 % of the PM10 mass found at the urban curbside site in Dar es Salaam in Tanzania during the wet season 2005 by Mkoma (2008).
This paper presents the mass and the size-speciated chemical composition of particulate matter (PM) obtained during the dry and wet seasons in 2015, 2016, and 2017. During each campaign, 3 h sampling at the peak period of pollution for 3 consecutive days was performed at three sites in Abidjan, representative of domestic fire (ADF), waste burning (AWB), and traffic (AT) sources, and at one traffic site in Cotonou (CT).
It is important to underline that our results and their temporal variations are very sensitive to (1) the source activities whose pollution levels are highly linked to socioeconomic status of each city; (2) the impact of imported pollution (sea salt, biomass burning, dust, anthropogenic emissions from neighboring countries), according to air mass origins; and (3) the particle wet deposition.
The comparison between our results and other DACCIWA measurements underlines the importance of the distance of the chosen site to the sources. At the source level (such as ADF), pollution results at the site are in agreement with exposure of people living at this site. However, at the other sites, comparison is more difficult since the sites are under the influence of a mix of transported sources. That shows the key importance of exposure studies to estimate air quality and health impacts. That shows also the need for long-term studies to really understand role of imported sources in urban air quality.
The main striking feature is that PM2.5 values are well above the annual and daily WHO guidelines of 25 and 10 µg m−3, respectively, whatever the site and the season. Also, measured concentrations from this study are situated in the middle to the high part of the range of worldwide urban aerosol concentrations given at a daily scale. In addition, we have stressed the importance of ultrafine and fine particles in the studied aerosol and of species such as particulate organic matter and water-soluble organic carbon, which are well known to be particularly harmful. This is again a warning signal for pollution levels in African capitals if nothing is done to reduce emissions in the future.
Our study constitutes an original database to characterize urban air pollution from specific African combustion sources. The next step will be to cross such an exhaustive aerosol chemical characterization with biological data in order to evaluate the impact of aerosol size and chemical composition on aerosol inflammatory properties.
The pollution data used in this study are original and are publicly available in the Supplement https://doi.org/10.5194/acp-20-1-2020-supplement.
AJA and CL conceived and designed the study. AJA, CL, and ETD contributed to the literature search, data analysis/interpretation, and paper writing. AJA, CL, ABS, and ETD contributed to paper revision. AJA, CL, JFL, HC, VY, ABA, CGL, CZ, EG, and SK carried out the particulate samples collection and chemical experiments and analyzed the experimental data.
The authors declare that they have no conflict of interest.
This article is part of the special issue “Results of the project `Dynamics-aerosol-chemistry-cloud interactions in West Africa' (DACCIWA) (ACP/AMT inter-journal SI)”. It is not associated with a conference.
The research leading to these results was made available thanks to the collaboration of the Seventh Framework Programme of the European Commission (FP7/2007–2013) in the framework of the European project DACCIWA. The authors would like to express their gratitude. The authors would also like greatly to thank all colleagues and operators who contributed to the sampling during the different campaigns.
This research has been supported by the European Commission Seventh Framework Programme (FP7/2007–2013) under grant agreement no. 603502 (EU project DACCIWA: Dynamics-aerosol-chemistry-cloud interactions in West Africa).
This paper was edited by Mathew Evans and reviewed by two anonymous referees.
Adon, M., Galy-Lacaux, C., Yoboué, V., Delon, C., Lacaux, J. P., Castera, P., Gardrat, E., Pienaar, J., Al Ourabi, H., Laouali, D., Diop, B., Sigha-Nkamdjou, L., Akpo, A., Tathy, J. P., Lavenu, F., and Mougin, E.: Long term measurements of sulfur dioxide, nitrogen dioxide, ammonia, nitric acid and ozone in Africa using passive samplers, Atmos. Chem. Phys., 10, 7467–7487, https://doi.org/10.5194/acp-10-7467-2010, 2010.
Alastuey, A., Querol, X., Castillo, S., Escudero, M., Avila, A., Cuevas, E., Torres, C., Romero, P., Exposito, F., and Garcia, O.: Characterisation of TSP and PM2.5 at Izaña and Sta, Cruz de Tenerife (Canary Islands, Spain) during a Saharan Dust Episode (July 2002), Atmos. Environ., 39, 4715–4728, https://doi.org/10.1016/j.atmosenv.2005.04.018, 2005.
Arditsoglou, A. and Samara, C.: Levels of total suspended particulate matter and major trace elements in Kosovo: a source identification and apportionment study, Chemosphere, 59, 669–678, https://doi.org/10.1016/j.chemosphere.2004.10.056, 2005.
Arndt, R. L., Carmichael, G. R., Streets, D. G., and Bhatti, N.: Sulfur dioxide emissions and sectorial contributions to sulfur deposition in Asia, Atmos. Environ., 31, 1553–1572, https://doi.org/10.1016/S1352-2310(96)00236-1, 1997.
Avogbe, P. H., Ayi-Fanou, L., Cachon, B., Chabi, N., Debende, A., Dewaele, D., Aissi, F., Cazier, F., and Sanni, A.: Hematological changes among Beninese motor-bike taxi drivers exposed to benzene by urban air pollution, Afr. J. Environ. Sci. Technol., 5, 464–472, 2011.
Balarabe, M., Abdullah, K., and Nawawi, M.: Seasonal Variations of Aerosol Optical Properties and Identification of Different Aerosol Types Based on AERONET Data over Sub-Sahara West-Africa, Atmos. Clim. Sci., 6, 13–28, https://doi.org/10.4236/acs.2016.61002, 2016.
Belis, C. A., Karagulian, F., Larsen, B. R., and Hopke, P. K.: Critical review and meta-analysis of ambient particulate matter source apportionment using receptor models in Europe, Atmos. Environ., 69, 94–108, https://doi.org/10.1016/j.atmosenv.2012.11.009, 2013.
Bisht, D. S., Dumka, U. C., Kaskaoutis, D. G., Pipal, A. S., Srivastava, A. K., Soni, V. K., Attri, S. D., Sateesh, M., and Tiwari, S.: Carbonaceous aerosols and pollutants over Delhi urban environment: Temporal evolution, source apportionment and radiative forcing, Sci. Total Environ., 521/522, 431–445, 2015.
Boucher, O.: Aérosols atmosphériques Propriétés et impacts climatiques, Springer Paris, 2012.
Bouhila, Z., Mouzai, M., Azli, T., Nedjar, A., Mazouzi, C., Zergoug, Z., Boukhadra, D., Chegrouche, S., and Lounici, H.: Investigation of aerosol trace element concentrations nearby Algiers for environmental monitoring using instrumental neutron activation analysis, Atmos. Res., 166, 49–59, https://doi.org/10.1016/j.atmosres.2015.06.013, 2015.
Cachier, H., Brémond, M.-P., and Buat-Ménard, P.: Carbonaceous aerosols from different tropical biomass burning sources, Nature, 340, 371–373, https://doi.org/10.1038/340371a0, 1989.
Cachon, B. F., Firmin, S., Verdin, A., Ayi-Fanou, L., Billet, S., Cazier, F., Martin, P. J., Aissi, F., Courcot, D., Sanni, A., and Shirali, P.: Proinflammatory effects and oxidative stress within human bronchial epithelial cells exposed to atmospheric particulate matter (PM2.5 and PM>2.5) collected from Cotonou, Benin, Environ. Pollut., 185, 340–351, https://doi.org/10.1016/j.envpol.2013.10.026, 2014.
Cao, J. J., Lee, S. C., Zhang, X. Y., Chow, J. C., An, Z. S., Ho, K. F., Watson, J. G., Fung, K., Wang, Y. Q., and Shen, Z. X.: Characterization of airborne carbonate over a site near Asian dust source regions during spring 2002 and its climatic and environmental significance, J. Geophys. Res., 110, D03203, https://doi.org/10.1029/2004JD005244, 2005.
Cassee, F. R., Héroux, M.-E., Gerlofs-Nijland, M. E., and Kelly, F. J.: Particulate matter beyond mass: recent health evidence on the role of fractions, chemical constituents and sources of emission, Inhal. Toxicol., 25, 802–812, https://doi.org/10.3109/08958378.2013.850127, 2013.
Celo, V., Dabek-Zlotorzynska, E., Mathieu, D., and Okonskaia, I.: Validation of simple microwave-assisted acid digestion method using microvessels for analysis of trace elements in atmospheric PM2.5 in monitoring and fingerprinting studies, Open Chem. Biomed. Method. J., 3, 141–150, 2010.
Cesari, D., Donateo, A., Conte, M., Merico, E., Giangreco, A., Giangreco, F., and Contini, D.: An inter-comparison of PM2.5 at urban and urban background sites: Chemical characterization and source apportionment, Atmos. Res., 174/175, 106–119, https://doi.org/10.1016/j.atmosres.2016.02.004, 2016.
Cheng, Z., Jiang, J., Chen, C., Gao, J., Wang, S., Watson, J. G., Wang, H., Deng, J., Wang, B., Zhou, M., Chow, J. C., Pitchford, M. L., and Hao, J.: Estimation of Aerosol Mass Scattering Efficiencies under High Mass Loading: Case Study for the Megacity of Shanghai, China, Environ. Sci. Technol., 49, 831–838, https://doi.org/10.1021/es504567q, 2015.
Chiapello, I., Bergametti, G., Chatenet, B., Bousquet, P., Dulac, F., and Soares, E. S.: Origins of African dust transported over the northeastern tropical Atlantic, J. Geophys. Res., 102, 13701–13709, https://doi.org/10.1029/97JD00259, 1997.
Chow, J. C., Watson, J. G., Lu, Z., Lowenthal, D. H., Frazier, C. A., Solomon, P. A., Thuillier, R. H., and Magliano, K.: Descriptive analysis of PM2.5 and PM10 at regionally representative locations during SJVAQS/AUSPEX, Atmos. Environ., 30, 2079–2112, https://doi.org/10.1016/1352-2310(95)00402-5, 1996.
Colbeck, I., Nasir, Z. A., Ahmad, S., and Ali, Z.: Exposure to PM10, PM2.5, PM1 and Carbon Monoxide on Roads in Lahore, Pakistan, Aerosol Air Qual. Res., 11, 689–695, https://doi.org/10.4209/aaqr.2010.10.0087, 2011.
Colette, A., Menut, L., Haeffelin, M., and Morille, Y.: Impact of the transport of aerosols from the free troposphere towards the boundary layer on the air quality in the Paris area, Atmos. Environ., 42, 390–402, https://doi.org/10.1016/j.atmosenv.2007.09.044, 2007.
Dieme, D., Cabral-Ndior, M., Garçon, G., Verdin, A., Billet, S., Cazier, F., Courcot, D., Diouf, A., and Shirali, P.: Relationship between physicochemical characterization and toxicity of fine particulate matter (PM2.5) collected in Dakar city (Senegal), Environ. Res., 113, 1–13, https://doi.org/10.1016/j.envres.2011.11.009, 2012.
Ding, A., Huang, X., and Fu, C.: Air Pollution and Weather Interaction in East Asia, Oxford Research Encyclopedias, Environ. Sci., 1, 1–26, https://doi.org/10.1093/acrefore/9780199389414.013.536, 2017.
Djossou, J., Léon, J.-F., Akpo, A. B., Liousse, C., Yoboué, V., Bedou, M., Bodjrenou, M., Chiron, C., Galy-Lacaux, C., Gardrat, E., Abbey, M., Keita, S., Bahino, J., Touré N'Datchoh, E., Ossohou, M., and Awanou, C. N.: Mass concentration, optical depth and carbon composition of particulate matter in the major southern West African cities of Cotonou (Benin) and Abidjan (Côte d'Ivoire), Atmos. Chem. Phys., 18, 6275–6291, https://doi.org/10.5194/acp-18-6275-2018, 2018.
Doumbia, E. H. T., Liousse, C., Galy-Lacaux, C., Ndiaye, S. A., Diop, B., Ouafo, M., Assamoi, E.M., Gardrat, E., Castera, P., Rosset, R., Akpo, A., and Sigha, L.: Real time black carbon measurements in West and Central Africa urban sites, Atmos. Environ., 54, 529–537, 2012..
Draxler, R. R. and Rolph, G. D.: Evaluation of the Transfer Coefficient Matrix (TCM) approach to model the atmospheric radionuclide air concentrations from Fukushima, J. Geophys. Res., 117, D05107, https://doi.org/10.1029/2011JD017205, 2012.
Du, Z., He, K., Cheng, Y., Duan, F., Ma, Y., Liu, J., Zhang, X., Zheng, M., and Weber, R.: A yearlong study of water-soluble organic carbon in Beijing I: Sources and its primary vs. secondary nature, Atmos. Environ., 92, 514–521, https://doi.org/10.1016/j.atmosenv.2014.04.060, 2014.
Favez, O.: Caractérisation physico-chimique de la pollution particulaire dans des mégapoles contrastées, Thèse de l'Université PARIS.DIDEROT (Paris 7), France, 2008.
Favez, O., Sciare, J., Cachier, H., Alfaro, S. C., and Abdelwahab, M. M.: Significant formation of water-insoluble secondary organic aerosols in semi-arid urban environment, Geophys. Res. Lett., 35, L15801, https://doi.org/10.1029/2008GL034446, 2008.
Feng, J., Guo, Z., Chan, C. K., and Fang, M.: Properties of organic matter in PM2.5 at Changdao Island, China – A rural site in the transport path of the Asian continental outflow, Atmos. Environ., 41, 1924–1935, https://doi.org/10.1016/j.atmosenv.2006.10.064, 2007.
Feng, J., Hu, M., Chan, C. K., Lau, P. S., Fang, M., He, L., and Tang, X.: A comparative study of the organic matter in PM2.5 from three Chinese megacities in three different climatic zones, Atmos. Environ., 40, 3983–3994, https://doi.org/10.1016/j.atmosenv.2006.02.017, 2006.
Freitas, M. C., Pacheco, A. M. G., Baptista, M. S., Dionísio, I., Vasconcelos, M. T. S. D., and Cabral, J. P.: Response of exposed detached lichens to atmospheric elemental deposition, Proc. ECOpole., 1, 15–21, 2007.
Gaga, E. O., Arı, A., Akyol, N., Üzmez, Ö. Ö., Kara, M., Chow, J. C., Watson, J. G., Özel, E., Döğeroğlu, T., and Odabasi, M.: Determination of real-world emission factors of trace metals, EC, OC, BTEX, and semivolatile organic compounds (PAHs, PCBs and PCNs) in a rural tunnel in Bilecik, Turkey, Sci. Total Environ., 643, 1285–1296, https://doi.org/10.1016/j.scitotenv.2018.06.227, 2018.
Gao, Y., Nelson, E. D., Field, M. P., Ding, Q., Li, H., Sherrell, R. M., Gigliotti, C. L., Van Ry, D. A., Glenn, T. R., and Eisenreich, S. J.: Characterization of atmospheric trace elements on PM2.5 particulate matter over the New York–New Jersey harbor estuary, Atmos. Environ., 36, 1077–1086, https://doi.org/10.1016/S1352-2310(01)00381-8, 2002.
Genga, A., Ielpo, P., Siciliano, T., and Siciliano, M.: Carbonaceous particles and aerosol mass closure in PM2.5 collected in a port city, Atmos. Res., 183, 245–254, https://doi.org/10.1016/j.atmosres.2016.08.022, 2017.
Goldberg, E. D.: Composition of sea Water, edited by: Hill, H. M., Comparative Oceanography, Vol. 2, SeaWiley, New York, 1963.
Gounougbe, F.: Pollution atmosphérique par les gaz d'échappement et état de santé des conducteurs de taxi-moto (Zemidjan) de Cotonou (Bénin), Thèse de doctorat en Médecine (832), 1999.
Guinot, B., Cachier, H., and Oikonomou, K.: Geochemical perspectives from a new aerosol chemical mass closure, Atmos. Chem. Phys., 7, 1657–1670, https://doi.org/10.5194/acp-7-1657-2007, 2007.
Guttikunda, S. K. and Calori, G.: A GIS based emissions inventory at 1 km × 1 km spatial resolution for air pollution analysis in Delhi, India, Atmos. Environ., 67, 101–111, https://doi.org/10.1016/j.atmosenv.2012.10.040, 2013.
Hara, K., Osada, K., Kido, M., Hayashi, M., Matsunaga, K., Iwasaka, Y., Yamanouchi, T., Hashida, G., and Fukatsu, T.: Chemistry of sea-salt particles and inorganic halogen species in Antarctic regions: Compositional differences between coastal and inland stations, J. Geophys. Res., 109, D20208, https://doi.org/10.1029/2004JD004713, 2004.
He, K., Yang, F., Ma, Y., Zhang, Q., Yao, X., Chan, C. K., Cadle, S., Chan, T., and Mulawa, P.: The characteristics of PM2.5 in Beijing, China, Atmos. Environ., 35, 4959–4970, https://doi.org/10.1016/S1352-2310(01)00301-6, 2001.
Hildemann, L. M., Markowski, G. R., and Cass, G. R.: Chemical composition of emissions from urban sources of fine organic aerosol, Environ. Sci. Technol., 25, 744–759, https://doi.org/10.1021/es00016a021, 1991.
Huang, H., Ho, K. F., Lee, S. C., Tsang, P. K., Ho, S. S. H., Zou, C. W., Zou, S. C., Cao, J. J., and Xu, H. M.: Characteristics of carbonaceous aerosol in PM2.5: Pearl Delta River Region, China, Atmos. Res., 104/105, 227–236, https://doi.org/10.1016/j.atmosres.2011.10.016, 2012.
Jaffrezo, J.-L., Aymoz, G., Delaval, C., and Cozic, J.: Seasonal variations of the water soluble organic carbon mass fraction of aerosol in two valleys of the French Alps, Atmos. Chem. Phys., 5, 2809–2821, https://doi.org/10.5194/acp-5-2809-2005, 2005.
Keita, S., Liousse, C., Yoboué, V., Dominutti, P., Guinot, B., Assamoi, E.-M., Borbon, A., Haslett, S. L., Bouvier, L., Colomb, A., Coe, H., Akpo, A., Adon, J., Bahino, J., Doumbia, M., Djossou, J., Galy-Lacaux, C., Gardrat, E., Gnamien, S., Léon, J. F., Ossohou, M., N&apos;Datchoh, E. T., and Roblou, L.: Particle and VOC emission factor measurements for anthropogenic sources in West Africa, Atmos. Chem. Phys., 18, 7691–7708, https://doi.org/10.5194/acp-18-7691-2018, 2018.
Khan, Md. F., Shirasuna, Y., Hirano, K., and Masunaga, S.: Characterization of PM2.5, PM2.5−10 and PM>10 in ambient air, Yokohama, Japan, Atmos. Res., 96, 159–172, https://doi.org/10.1016/j.atmosres.2009.12.009, 2010.
Kim, H., Liu, X., Kobayashi, T., Kohyama, T., Wen, F.-Q., Romberger, D. J., Conner, H., Gilmour, P. S., Donaldson, K., MacNee, W., and Rennard, S. I.: Ultrafine Carbon Black Particles Inhibit Human Lung Fibroblast-Mediated Collagen Gel Contraction, Am. J. Respir. Cell. Mol. Biol., 28, 111–121, https://doi.org/10.1165/rcmb.4796, 2003.
Knippertz, P., Tesche, M., Heinold, B., Kandler, K., Toledano, C., and Esselborn, M.: Dust mobilization and aerosol transport from West Africa to Cape Verde – a meteorological overview of SAMUM-2, Tellus B, 63, 430–447, https://doi.org/10.1111/j.1600-0889.2011.00544.x, 2011.
Kouassi, K. S., Billet, S., Garaßon, G., Verdin, A., Diouf, A., Cazier, F., Djaman, J., Courcot, D., and Shirali, P.: Oxidative damage induced in A549 cells by physically and chemically characterized air particulate matter (PM2.5) collected in Abidjan, Côte d'Ivoire, J. Appl. Toxicol., 30, 310–320, https://doi.org/10.1002/jat.1496, 2009.
Lamaison, L.: Caractérisation des particules atmosphériques et identification de leurs sources dans une atmosphère urbaine sous influence industrielle, Thèse Doctorat, Univ des Sciences et Technologies, Lille, 2006.
Léon, J.F., Akpo, A., Bedou, M., Djossou, J., Bodjrenou, M., Yoboué, V., and Liousse, C.: Profondeur optique des aérosols sur le sud de l'Afrique de l'Ouest, soumis à ACPD, 2019.
Li, T.-C., Yuan, C.-S., Hung, C.-H., Lin, H.-Y., Huang, H.-C., and Lee, C.-L.: Chemical Characteristics of Marine Fine Aerosols over Sea and at Offshore Islands during Three Cruise Sampling Campaigns in the Taiwan Strait-Sea Salts and Anthropogenic Particles, Atmos. Chem. Phys. Discuss., 1–27, https://doi.org/10.5194/acp-2016-384, 2016.
Li, Y., Schwandner, F. M., Sewell, H. J., Zivkovich, A., Tigges, M., Raja, S., Holcomb, S., Molenar, J. V., Sherman, L., Archuleta, C., Lee, T., and Collett, J. L.: Observations of ammonia, nitric acid and fine particles in a rural gas production region, Atmos. Environ., 83, 80–89, https://doi.org/10.1016/j.atmosenv.2013.10.007, 2014.
Liang, L., Engling, G., Du, Z., Cheng, Y., Duan, F., Liu, X., and He, K.: Seasonal variations and source estimation of saccharides in atmospheric particulate matter in Beijing, China, Chemosphere, 150, 365–377, 2016.
Liousse, C., Assamoi, E., Criqui, P., Granier, C., and Rosset, R.: Explosive growth in African combustion emissions from 2005 to 2030, Environ. Res. Lett., 9, 035003, https://doi.org/10.1088/1748-9326/9/3/035003, 2014.
Lonati, G., Ozgen, S., and Giugliano, M.: Primary and secondary carbonaceous species in PM2.5 samples in Milan (Italy), Atmos. Environ., 41, 4599–4610, https://doi.org/10.1016/j.atmosenv.2007.03.046, 2007.
Lowenthal, D., Zielinska, B., Samburova, V., Collins, D., Taylor, N., and Kumar, N.: Evaluation of assumptions for estimating chemical light extinction at U.S. national parks, J. Air Waste Manag. Assoc., 65, 249–260, https://doi.org/10.1080/10962247.2014.986307, 2015.
Mason, B. and Moore, B. C.: Principles of Geochemistry, 4th Edn., John Wiley and Sons, New York, 46–47, 1982.
Minguillón, M. C., Cirach, M., Hoek, G., Brunekreef, B., Tsai, M., de Hoogh, K., Jedynska, A., Kooter, I. M., Nieuwenhuijsen, M., and Querol, X.: Spatial variability of trace elements and sources for improved exposure assessment in Barcelona, Atmos. Environ., 89, 268–281, https://doi.org/10.1016/j.atmosenv.2014.02.047, 2014.
Mkoma, S. L.: Physico-Chemical characterisation of atmospheric aerosols in Tanzania, with emphasis on the carbonaceous aerosol components and on chemical mass closure, PhD, Ghent University, Ghent, Belguim, 2008.
Mmari, A. G., Potgieter-Vermaak, S. S., Bencs, L., McCrindle, R. I., and Van Grieken, R.: Elemental and ionic components of atmospheric aerosols and associated gaseous pollutants in and near Dar es Salaam, Tanzania, Atmos. Environ., 77, 51–61, https://doi.org/10.1016/j.atmosenv.2013.04.061, 2013.
MMEH (Ministère des Mines de l'Energie et d'Hydraulique): Tableau de bord de l'Energie 2002 au Bénin, Direction Générale de l'Energie, 2002.
Ngo, N. S., Asseko, S. V. J., Ebanega, M. O., Allo'o Allo'o, S. M., and Hystad, P.: The relationship among PM2.5, traffic emissions, and socioeconomic status: Evidence from Gabon using low-cost, portable air quality monitors, Transport. Res. Pt. D, 68, 2–9, https://doi.org/10.1016/j.trd.2018.01.029, 2019.
Ozer, P.: Estimation de la pollution particulaire naturelle de l'air en 2003 à Niamey (Niger) à partir de données de visibilité horizontale, 2005.
Pachauri, T., Singla, V., Satsangi, A., Lakhani, A., and Kumari, K. M.: Characterization of carbonaceous aerosols with special reference to episodic events at Agra, India, Atmos. Res., 128, 98–110, https://doi.org/10.1016/j.atmosres.2013.03.010, 2013.
Park, J. H., Mudunkotuwa, I. A., Mines, L. W. D., Anthony, T. R., Grassian, V. H., and Peters, T. M.: A Granular Bed for Use in a Nanoparticle Respiratory Deposition Sampler, Aerosol Sci. Technol., 49, 179–187, https://doi.org/10.1080/02786826.2015.1013521, 2015.
Person, A. and Tymen, G.: Mesurage des particules en suspension dans l'air en relation avec la santé, Pollution atmosphèrique, 271–285, 2005.
Pipal, A. S., Jan, R., Satsangi, P. G., Tiwari, S., and Taneja, A.: Study of Surface Morphology, Elemental Composition and Origin of Atmospheric Aerosols (PM2.5 and PM10) over Agra, India, Aerosol Air Qual. Res., 14, 1685–1700, https://doi.org/10.4209/aaqr.2014.01.0017, 2014.
Pipal, A. S., Singh, S., and Satsangi, G. P.: Study on bulk to single particle analysis of atmospheric aerosols at urban region, Urban Clim., 27, 243–258, https://doi.org/10.1016/j.uclim.2018.12.008, 2019.
Prospero, J. M., Ginoux, P., Torres, O., Nicholson, S. E., and Gill, T. E.: Environmental characterization of global sources of atmospheric soil dust identified with the NIMBUS 7 Total Ozone Mapping Spectrometer (TOMS) absorbing aerosol product, Rev. Geophys., 40, 1002, https://doi.org/10.1029/2000RG000095, 2002.
Qin, Y., Chan, C. K., and Chan, L. Y.: Characteristics of chemical compositions of atmospheric aerosols in Hong Kong: spatial and seasonal distributions, Sci. Total Environ., 206, 25–37, https://doi.org/10.1016/S0048-9697(97)00214-3, 1997.
Ramgolam, K., Favez, O., Cachier, H., Gaudichet, A., Marano, F., Martinon, L., and Baeza-Squiban, A.: Size-partitioning of an urban aerosol to identify particle determinants involved in the proinflammatory response induced in airway epithelial cells, Part Fibre Toxicol., 6, 10, https://doi.org/10.1186/1743-8977-6-10, 2009.
Rengarajan, R., Sudheer, A. K., and Sarin, M. M.: Aerosol acidity and secondary organic aerosol formation during wintertime over urban environment in western India, Atmos. Environ., 45, 1940–1945, https://doi.org/10.1016/j.atmosenv.2011.01.026, 2011.
Samara, C., Kouimtzis, T., Tsitouridou, R., Kanias, G., and Simeonov, V.: Chemical mass balance source apportionment of PM10 in an industrialized urban area of Northern Greece, Atmos. Environ., 37, 41–54, https://doi.org/10.1016/S1352-2310(02)00772-0, 2003.
Satsangi, A., Pachauri, T., Singla, V., Lakhani, A., and Kumari, K. M.: Organic and elemental carbon aerosols at a suburban site, Atmos. Res., 113, 13–21, https://doi.org/10.1016/j.atmosres.2012.04.012, 2012.
Saxena, P. and Hildemann, L. M.: Water-soluble organics in atmospheric particles: a critical review of the literature and application of thermodynamics to identify candidate compounds, J. Atmos. Chem., 24, 57–109, 1996.
Sciare, J., Oikonomou, K., Cachier, H., Mihalopoulos, N., Andreae, M. O., Maenhaut, W., and Sarda-Estève, R.: Aerosol mass closure and reconstruction of the light scattering coefficient over the Eastern Mediterranean Sea during the MINOS campaign, Atmos. Chem. Phys., 5, 2253–2265, https://doi.org/10.5194/acp-5-2253-2005, 2005.
Seinfeld, J. H. and Pandis, S. N.: Atmospheric Chemistry and Physics: from Air Pollution to Climate Change, John Wiley and Sons, Inc. New York, 1998.
Sempére, R. and Kawamura, K.: Comparative distributions of dicarboxylic acids and related polar compounds in snow, rain and aerosols from urban atmosphere, Atmos. Environ., 28, 449–459, https://doi.org/10.1016/1352-2310(94)90123-6, 1994.
Shahsavani, A., Naddafi, K., Jaafarzadeh Haghighifard, N., Mesdaghinia, A., Yunesian, M., Nabizadeh, R., Arhami, M., Yarahmadi, M., Sowlat, M. H., Ghani, M., Jonidi Jafari, A., Alimohamadi, M., Motevalian, S. A., and Soleimani, Z.: Characterization of ionic composition of TSP and PM10 during the Middle Eastern Dust (MED) storms in Ahvaz, Iran, Environ. Monit. Assess., 184, 6683–6692, https://doi.org/10.1007/s10661-011-2451-6, 2012.
Stone, R. S., Herber, A., Vitale, V., Mazzola, M., Lupi, A., Schnell, R. C., Dutton, E. G., Liu, P. S. K., Li, S.-M., Dethloff, K., Lampert, A., Ritter, C., Stock, M., Neuber, R., and Maturilli, M.: A three-dimensional characterization of Arctic aerosols from airborne Sun photometer observations: PAM-ARCMIP, April 2009, J. Geophys. Res., 115, D13203, https://doi.org/10.1029/2009JD013605, 2010.
Sullivan, A. P., Weber, R. J., Clements, A. L., Turner, J. R., Bae, M. S., and Schauer, J. J.: A method for on-line measurement of water-soluble organic carbon in ambient aerosol particles: Results from an urban site: on-line measurement of WSOC in aerosols, Geophys. Res. Lett., 31, L13105, https://doi.org/10.1029/2004GL019681, 2004.
Sun, Y., Zhuang, G., Wang, Y., Han, L., Guo, J., Dan, M., Zhang, W., Wang, Z., and Hao, Z.: The airborne particulate pollution in Beijing – concentration, composition, distribution and sources, Atmos. Environ., 38, 5991–6004, https://doi.org/10.1016/j.atmosenv.2004.07.009, 2004.
Tang, X., Zhang, X., Ci, Z., Guo, J., and Wang, J.: Speciation of the major inorganic salts in atmospheric aerosols of Beijing, China: Measurements and comparison with model, Atmos. Environ., 133, 123–134, https://doi.org/10.1016/j.atmosenv.2016.03.013, 2016.
Tapsoba, D.: Caractérisation événementielle des régimes pluviométriques ouestafricains et de leur récent changement, Thèse de Doctorat, Univ. Paris-XI (Orsay), 100 pp., 1997.
Taylor, S. R.: Abundance of chemical elements in the continental crust: a new table, Geochim. Cosmochim. Ac., 28, 1273–1285, https://doi.org/10.1016/0016-7037(64)90129-2, 1964.
Terzi, E., Argyropoulos, G., Bougatioti, A., Mihalopoulos, N., Nikolaou, K., and Samara, C.: Chemical composition and mass closure of ambient PM10 at urban sites, Atmos. Environ., 44, 2231–2239, https://doi.org/10.1016/j.atmosenv.2010.02.019, 2010.
Tunno, B., Longley, I., Somervell, E., Edwards, S., Olivares, G., Gray, S., Cambal, L., Chubb, L., Roper, C., Coulson, G., and Clougherty, J. E.: Separating spatial patterns in pollution attributable to woodsmoke and other sources, during daytime and nighttime hours, in Christchurch, New Zealand, Environ. Res., 171, 228–238, https://doi.org/10.1016/j.envres.2019.01.033, 2019.
Turpin, B. J., Cary, R. A., and Huntzicker, J. J.: An In Situ, Time-Resolved Analyzer for Aerosol Organic and Elemental Carbon, Aerosol Sci. Technol., 12, 161–171, https://doi.org/10.1080/02786829008959336, 1990.
United Nations: Department of Economic and Social Affairs, Population Division (2019), World Population Prospects 2019, Vol. II: Demographic Profiles, Made available under a Creative Commons license, available at: http://creativecommons.org/licenses/by/3.0/igo/ (last access: 25 March 2020), 2019.
Val, S., Liousse, C., Doumbia, E. H. T., Galy-Lacaux, C., Cachier, H., Marchand, N., Badel, A., Gardrat, E., Sylvestre, A., and Baeza-Squiban, A.: Physico-chemical characterization of African urban aerosols (Bamako in Mali and Dakar in Senegal) and their toxic effects in human bronchial epithelial cells: description of a worrying situation, Part Fibre Toxicol., 10, 10, https://doi.org/10.1186/1743-8977-10-10, 2013.
Viana, M., Maenhaut, W., ten Brink, H. M., Chi, X., Weijers, E., Querol, X., Alastuey, A., Mikuška, P., and Večeřa, Z.: Comparative analysis of organic and elemental carbon concentrations in carbonaceous aerosols in three European cities, Atmos. Environ., 41, 5972–5983, https://doi.org/10.1016/j.atmosenv.2007.03.035, 2007.
Viana, M., López, J. M., Querol, X., Alastuey, A., García-Gacio, D., Blanco-Heras, G., López-Mahía, P., Piñeiro-Iglesias, M., Sanz, M. J., Sanz, F., Chi, X., and Maenhaut, W.: Tracers and impact of open burning of rice straw residues on PM in Eastern Spain, Atmos. Environ., 42, 1941–1957, https://doi.org/10.1016/j.atmosenv.2007.11.012, 2008.
Viidanoja, J., Sillanpää, M., Laakia, J., Kerminen, V.-M., Hillamo, R., Aarnio, P., and Koskentalo, T.: Organic and black carbon in PM2.5 and PM10: 1 year of data from an urban site in Helsinki, Finland, Atmos. Environ., 36, 3183–3193, https://doi.org/10.1016/S1352-2310(02)00205-4, 2002.
Wang, X., Bi, X., Sheng, G., and Fu, J.: Chemical Composition and Sources of PM10 and PM2.5 Aerosols in Guangzhou, China, Environ. Monit. Assess., 119, 425–439, https://doi.org/10.1007/s10661-005-9034-3, 2006.
Washington, R., Todd, M., Middleton, N. J., and Goudie, A. S.: Dust-Storm Source Areas Determined by the Total Ozone Monitoring Spectrometer and Surface Observations, Ann. Assoc. Am. Geogr., 93, 297–313, https://doi.org/10.1111/1467-8306.9302003, 2003.
Watson, J. G. and Chow, J. C.: Estimating middle-, neighborhood-, and urban-scale contributions to elemental carbon in Mexico City with a rapid response aethalometer, J. Air Waste Manag. Assoc., 51, 1522–1528, 2001.
Watson, J. G., Chow, J. C., and Houck, J. E.: PM2.5 chemical source profiles for vehicle exhaust, vegetative burning, geological material, and coal burning in Northwestern Colorado during 1995, Chemosphere, 43, 1141–1151, https://doi.org/10.1016/S0045-6535(00)00171-5, 2001.
WHO (World Health Organization): 7 million premature deaths annually linked to air pollution. Media Centre news release, Geneva: World Health Organization, available at: http://www.who.int/mediacentre/news/releases/2014/air-pollution/en/ (last access: 14 November 2018), 2014.
Wilson, M. R., Lightbody, J. H., Donaldson, K., Sales, J., and Stone, V.: Interactions between ultrafine particles and transition metals in vivo and in vitro, Toxicol. Appl. Pharmacol., 184, 172–179, 2002.
Xiang, P., Zhou, X., Duan, J., Tan, J., He, K., Yuan, C., Ma, Y., and Zhang, Y.: Chemical characteristics of water-soluble organic compounds (WSOC) in PM2.5 in Beijing, China: 2011–2012, Atmos. Res., 183, 104–112, https://doi.org/10.1016/j.atmosres.2016.08.020, 2017.
Xie, Y., Wang, Y., Bilal, M., and Dong, W.: Mapping daily PM2.5 at 500 m resolution over Beijing with improved hazy day performance, Sci. Total Environ., 659, 410–418, https://doi.org/10.1016/j.scitotenv.2018.12.365, 2019.
Xu, H., Léon, J.-F., Liousse, C., Guinot, B., Yoboué, V., Akpo, A. B., Adon, J., Ho, K. F., Ho, S. S. H., Li, L., Gardrat, E., Shen, Z., and Cao, J.: Personal exposure to PM2.5 emitted from typical anthropogenic sources in southern West Africa: chemical characteristics and associated health risks, Atmos. Chem. Phys., 19, 6637–6657, https://doi.org/10.5194/acp-19-6637-2019, 2019.
Xu, J., Zhang, Y., Zheng, S., and He, Y.: Aerosol effects on ozone concentrations in Beijing: a model sensitivity study, J. Environ. Sci. (China), 24, 645–656, 2012.
Yu, P., Froyd, K. D., Portmann, R. W., Toon, O. B., Freitas, S. R., Bardeen, C. G., Katich, J. M., Schwarz, J. P., Williamson, C., Kupc, A., Brock, C., Liu, S., Gao, R.-S., Schill, G., Fan, T., Rosenlof, K. H., and Murphy, D. M.: An improved treatment of aerosol convective transport and removal in a chemistry-climate model, Geophys. Res. Lett., submitted, 2020.
Zghaid, M., Noack, Y., Bounakla, M., and Benyaich, F.: Pollution atmosphérique particulaire dans la ville de Kenitra (Maroc), Pollution atmosphérique [En ligne], no. 203, mis à jour le 12 October 2015, https://doi.org/10.4267/pollution-atmospherique.1184, 2009.
Zhang, X. Y., Gong, S. L., Shen, Z. X., Mei, F. M., Xi, X. X., Liu, L.C., Zhou, Z. J., Wang, D., Wang, Y. Q., and Cheng, Y.: Characterization of soil dust aerosol in China and its transport and distribution during 2001 ACE-Asia: 1. Network observations, J. Geophys. Res.-Atmos., 108, 4261, https://doi.org/10.1029/2002JD002632, 2003.