the Creative Commons Attribution 4.0 License.
the Creative Commons Attribution 4.0 License.
 | 05 May 2020
An observational study of the effects of aerosols on diurnal variation of heavy rainfall and associated clouds over Beijing–Tianjin–Hebei
Siyuan Zhou
Jing Yang
Wei-Chyung Wang
Chuanfeng Zhao
Daoyi Gong
Peijun Shi
Our previous study found that the observed rainfall diurnal variation over Beijing–Tianjin–Hebei shows the distinct signature of the effects of pollutants. Here we used the hourly rainfall data together with satellite-based daily information of aerosols and clouds to further investigate changes in heavy rainfall and clouds associated with aerosol changes. Because of the strong coupling effects, we also examined the sensitivity of these changes to moisture (specific humidity) variations. For heavy rainfall, three distinguished characteristics are identified: earlier start time, earlier peak time, and longer duration; and the signals are robust using aerosol indicators based on both aerosol optical depth and cloud droplet number concentration. In-depth analysis reveals that the first two characteristics occur in the presence of (absorbing) black carbon aerosols and that the third is related to more (scattering) sulfate aerosols and is sensitive to moisture abundance. Cloud changes are also evident, showing increases in cloud fraction, cloud top pressure, the liquid/ice cloud optical thickness and cloud water path and a decrease in ice cloud effective radius; and these changes are insensitive to moisture. Finally, the mechanisms for heavy rainfall characteristics are discussed and hypothesized.
- Article
(9098 KB) - Full-text XML
- BibTeX
- EndNote


Aerosols modify the hydrologic cycle through direct radiative and indirect cloud adjustment effects (IPCC, 2013). The direct effect, by absorbing and scattering solar radiation, leads to heating in the atmosphere (e.g., Jacobson, 2001; Lau et al., 2006) and cooling on the surface (Lelieveld and Heintzenberg, 1992; Guo et al., 2013; Yang et al., 2018), causing changes in atmospheric vertical static stability and subsequently modulation of rainfall (e.g., Rosenfeld et al., 2008). On the other hand, water-soluble aerosols serving as cloud condensation nuclei (CCN) affect the warm-rain and cold-rain processes by influencing the cloud droplet size distributions, cloud top heights and other cloud properties (Jiang et al., 2002; Givati and Rosenfeld, 2004; Chen et al., 2011; Lim and Hong, 2012; Tao et al., 2012). For Beijing–Tianjin–Hebei (BTH) the significant increase in pollution in recent decades has raised issues concerning aerosol–radiation–cloud–precipitation interactions. While the impact of aerosols on light rainfall or warm-rain processes is in general agreement among studies for this region (e.g., Qian et al., 2009), the uncertainties of the effects on heavy convective rainfall are still large (Guo et al., 2014; Wang et al., 2016).
The clouds that can generate heavy convective rainfall in the BTH region usually contain warm clouds, cold clouds and mixed-phase clouds (e.g., Guo et al., 2015). Because the aerosol–cloud interactions in different types of clouds are distinct (Gryspeerdt et al., 2014b), the aerosol indirect effect during heavy rainfall is more complicated than its direct effect (Sassen et al., 1995; Sherwood, 2002; Jiang et al., 2008; Tao et al., 2012). For warm clouds, by serving as CCN that nucleate more cloud droplets, aerosols can increase cloud albedo, the so-called albedo effect or Twomey effect (Twomey, 1977), lengthen the cloud lifetime, the so-called lifetime effect (Albrecht, 1989), and enhance thin cloud thermal emissivity, the so-called thermal emissivity effect (Garrett and Zhao, 2006). The above effects tend to increase the cloud microphysical stability and suppress warm-rain processes (Albrecht, 1989; Rosenfeld et al., 2014). For cold clouds and mixed-phase clouds, many studies reported that the cloud liquid accumulated by aerosols is converted to ice hydrometeors above the freezing level, which invigorates deep convective clouds and intensifies heavy precipitation, the so-called invigoration effect (Rosenfeld and Woodley, 2000; Rosenfeld et al., 2008; Lee et al., 2009; Guo et al., 2014). The Twomey effect infers that aerosols serving as CCN that increase the cloud droplets could reduce cloud droplet size within a constant liquid water path (Twomey, 1977). However, the opposite results of the relationship between aerosols and cloud droplet effective radius were reported in observations (Yuan et al., 2008; Panicker et al., 2010; Jung et al., 2013; Harikishan et al., 2016; Qiu et al., 2017), which might be related to the moisture supply near the cloud base (Yuan et al., 2008; Qiu et al., 2017). Besides, the influence of aerosols on ice clouds also depends upon the amount of moisture supply (Jiang et al., 2008). Therefore, how the aerosols modify the heavy convective rainfall and associated cloud changes has not been agreed upon, particularly when considering the different moisture conditions.
Heavy convective rainfall over the BTH region usually occurs within a few hours; thus, studying the relationship between aerosols and rainfall diurnal variation could deepen our understanding of aerosol effects on heavy rainfall. Several previous studies have found that aerosols are related to the changes in the rainfall diurnal variation in other regions (Kim et al., 2010; Gryspeerdt et al., 2014b; Fan et al., 2015; Guo et al., 2016; Lee et al., 2016). However, the above studies do not address the change in cloud properties and its sensitivity to different conditions of moisture supply. Although our recent work over the BTH region (Zhou et al., 2018) attempted to remove the meteorological effect including circulation and moisture and found that the peak of heavy rainfall shifts earlier on the polluted condition, it only excluded the extreme moisture conditions and focused on the aerosol radiative effect on the rainfall diurnal variation. Therefore, this study aims to deepen the previous study (Zhou et al., 2018) by investigating the following questions: (1) how do aerosols modify the behaviors of the heavy rainfall diurnal variation, including the start time, peak time, duration and intensity? And what are the roles of absorbing aerosols and scattering aerosols in them with inclusion of moisture? (2) How do aerosols influence the associated cloud properties with inclusion of moisture? To solve the above questions, we used aerosol optical depth (AOD) as a macro indicator of aerosol pollution and cloud droplet number concentration (CDNC) as a micro indicator of CCN served by aerosols, respectively, to compare the characteristics of heavy rainfall diurnal variation and associated cloud properties between clean and polluted conditions. We also applied the aerosol index (AI) to distinguish the different effects of absorbing aerosols and scattering aerosols. In addition, we used the specific humidity (SH) at 850 hPa as an indicator of the moisture condition to investigate the possible role of moisture in the relationship between aerosols and rainfall/clouds. The paper is organized as follows. The data and methodology are introduced in Sect. 2. Section 3 addresses the relationship between aerosol pollution and diurnal variation of heavy rainfall, covering the distinct characteristics of heavy rainfall diurnal variation on the clean/polluted condition, the different behaviors of heavy rainfall along with different types of aerosols, and the influence of moisture on the relationship between aerosols and heavy rainfall. Section 4 describes the concurrent changes in cloud properties associated with aerosols and compares the possible influences of CCN (represented by CDNC) and moisture (represented by SH) on the cloud properties. Section 5 gives the hypothesis about the mechanisms of aerosol effects on the heavy rainfall. Discussion and conclusions will be given in Sect. 6.
2.1 Data
Four types of datasets from the years 2002 to 2012 (11 years) are used in this study, which include (1) precipitation, (2) aerosols, (3) clouds, and (4) other meteorological fields.

Figure 1Selected rainfall stations (blue dots) and topography (shading, units: m) in the BTH region (red box, 36–41∘ N, 114–119∘ E).
2.1.1 Precipitation
To study the diurnal variation of heavy rainfall, the gauge-based hourly precipitation datasets are used, which were obtained from the National Meteorological Information Center (NMIC) of the China Meteorological Administration (CMA) (Yu et al., 2007) at 2420 stations in China from 1951 to 2012. The quality control made by CMA/NMIC includes the check for extreme values (the value exceeding the monthly maximum in daily precipitation was rejected), the internal consistency check (wiping off the erroneous records caused by incorrect units, reading, or coding) and spatial consistency check (comparing the time series of hourly precipitation with nearby stations) (Shen et al., 2010). Here we chose 176 stations in the plain area of the BTH region that are below the topography of 100 m above sea level as shown in Fig. 1, because we purposely removed the probable orographic influence on the rainfall diurnal variation, which is consistent with our previous work (Zhou et al., 2018). The record analyzed here is the period of 2002 to 2012. We selected heavy rainfall days when the hourly precipitation amount is more than 8.0 mm h−1 (defined by Atmospheric Sciences Thesaurus, 1994). Here “a day” is counted from 8 local solar time (LST) to 08:00 LST next day (00:00 to 24:00 UTC).
2.1.2 Aerosols
In this study, we used two satellite data and one reanalysis datum to investigate the aerosol optical amount and distinguish the different aerosol types.
AOD is a proxy for the optical amount of aerosol particles in a column of the atmosphere and serves as the macro indicator for the division of the aerosol pollution condition in this study, which was obtained from the MODIS (Moderate Resolution Imaging Spectroradiometer) Collection 6 Level-3 aerosol product with a horizontal resolution of onboard the Terra satellite (Tao et al., 2015). The quality assurance of marginal or higher confidence is used in this study. The reported uncertainty in MODIS AOD data is on the order of (−0.02–10 %) and ( %) (Levy et al., 2013). The Terra satellite overpass time at the Equator is around 10:30 LST in the daytime, and the satellite data are almost missing when it is rainy during the overpass time. As shown in Fig. 3, the occurrence of selected heavy rainfall events in this study is mainly later than the satellite overpass time. Therefore, the AOD used here represents the situation of the air quality in advance of heavy rainfall appearance. Many studies have indicated that the value of AOD is influenced by the moisture condition, which is the aerosol humidification effect (Twohy et al., 2009; Altaratz et al., 2013). Hence, we comprehensively analyzed the moisture effect on the rainfall and tried to remove the moisture effect from the relationship between aerosols and rainfall/clouds.
The ultraviolet AI from the Ozone Monitoring Instrument (OMI) onboard the Aura satellite, which was launched in July 2004, is used for detecting the different types of aerosols in this study. The OMI ultraviolet AI is a method of detecting absorbing aerosols from satellite measurements in the near-ultraviolet wavelength region (Torres et al., 1998). The positive values of ultraviolet AI are attributed to the absorbing aerosols, such as smoke and dust, while the negative values of AI stand for the non-absorbing aerosols (scattering aerosols) such as sulfate and sea salt (Tariq and Ali, 2015). The near-zero values of AI occur when clouds and Rayleigh scattering dominate (Hammer et al., 2018). Considering the near-zero values have more uncertainties, we only compare the extreme circumstances of absorbing aerosols and scattering aerosols in this study. The horizontal resolution of AI data is , and they cover the period of 2005 to 2012.
MACC-II (Monitoring Atmospheric Composition and Climate Interim Implementation) reanalysis products produced by the ECMWF (European Centre for Medium-Range Weather Forecasts) provided the AOD datasets for different kinds of aerosols (BC, sulfate, organic matter, mineral dust and sea salt). MACC-II reanalysis products are observationally based within a model framework, which can offer a more complete temporal and spatial coverage than observation and reduce the shortcomings of simulation that fail in simulating the complexity of real aerosol distributions (Benedetti et al., 2009). The horizontal resolution of MACC-II is also , with the time interval of 6 h covering the period of 2003 to 2012, and the daily mean values are used in this study in order to be consistent with other datasets.
2.1.3 Clouds
Daily cloud variables, including cloud fraction (CF), cloud top pressure (CTP), cloud optical thickness (COT, liquid and ice), cloud water path (CWP, liquid and ice) and cloud effective radius (CER, liquid and ice), were obtained from the MODIS Collection 6 Level-3 cloud product onboard the Terra satellite. The MODIS cloud product combines infrared emission and solar reflectance techniques to determine both physical and radiative cloud properties (Platnick et al., 2017). The validation of cloud top properties in this product has been conducted through comparisons with CALIOP (Cloud-Aerosol Lidar with Orthogonal Polarization) data and other lidar observations (Holz et al., 2008; Menzel et al., 2008), and the validation and quality control of cloud optical products are performed primarily using in situ measurements obtained during field campaigns as well as the MODIS Airborne Simulator instrument (https://modis-atmos.gsfc.nasa.gov/products/cloud, last access: 24 April 2020). Consistent with AOD, the measurement of above-cloud variables is before the occurrence of heavy rainfall.
In addition to the variables in the MODIS cloud product, we also calculated CDNC using the joint histogram of liquid COT and liquid CER from the MODIS Collection 6 Level-3 cloud product. CDNC is retrieved as the proxy for CCN and also the micro indicator for separating different aerosol conditions in this study. Currently, most derivations of CDNC assume that the clouds are adiabatic and horizontally homogeneous; CDNC is constant throughout the cloud's vertical extent, and cloud liquid water content varies linearly with altitude adiabatically (Min et al., 2012; Bennartz and Rausch, 2017). According to Boers et al. (2006) and Bennartz (2007), we calculated CDNC (unit: cm−3) through
where Cw is the moist adiabatic condensate coefficient, and its value depends slightly on the temperature of the cloud layer, ranging from 1 to g m−4 for a temperature between 0 and 40∘ (Brenguier, 1991). In this study, we calculated the Cw through the function of the temperature (see Fig. 1 in Zhu et al., 2018) at a given pressure that is 850 hPa. And we have tested the sensitivity of CDNC to the amount of Cw and found it almost stays the same when the Cw changes from 1 to g m−4. The coefficient k is the ratio between the volume mean radius and the effective radius and varies between 0.5 and 1 (Brenguier et al., 2000). Here we used k=1 because we cannot get the accurate value of k and the value of k does not influence the rank of CDNC for the division of the aerosol condition in this study. ρw is the cloud water density. τ and Re are the liquid COT and CER with 12 and 9 bins, respectively, in the joint histogram, and we calculated the CDNC of each bin and get the grid mean CDNC based on the probability distribution of the bin counts from the joint histogram. To reduce the uncertainty of CDNC retrieval caused by the heterogeneity effect from thin clouds (Nakajima and King, 1990; Quaas et al., 2008; Grandey and Stier, 2010; Grosvenor et al., 2018), we selected the CF of more than 80 %, the liquid COT of more than 4 and the liquid CER of more than 4 µm when calculating the CDNC (Quaas et al., 2008).
2.1.4 Other meteorological data
In this study, wind, temperature, pressure and SH data were obtained from the ERA-Interim reanalysis datasets with horizontal resolution and 37 vertical levels at 6 h intervals. The daily mean values of these variables are used in the study. ERA-Interim is a global atmospheric reanalysis produced by ECMWF, which covers the period from 1979 to near-real time (Dee et al., 2011).
2.2 Methodology
We used both station data of gauge-based precipitation and gridded data of aerosols, clouds and other meteorological variables. Gridded datasets in this study were downloaded with the horizontal resolution of , which is consistent with the resolution of MODIS Level-3 products. To unify the datasets, we interpolated all the gridded datasets onto the selected 176 rainfall stations using the average value in a grid as the background condition of each rainfall station; i.e., the stations in the same grid have the same aerosol, cloud and meteorological conditions.
2.2.1 Selection of sub-season and circulation
Consistent with our previous work, we focused on the early summer period (1 June to 20 July), which is before the large-scale rainy season start, in order to remove the influence of large-scale circulation and identify the effect of aerosols on local convective precipitation because BTH rainfall during this period is mostly convective rainfall (Yu et al., 2007) with heavy pollution (Zhou et al., 2018). And to unify the background atmospheric circulation, we only selected the rainfall days with southwesterly flow, which is the dominant circulation accounting for 40 % of total circulation patterns over the BTH region during early summer (Zhou et al., 2018).
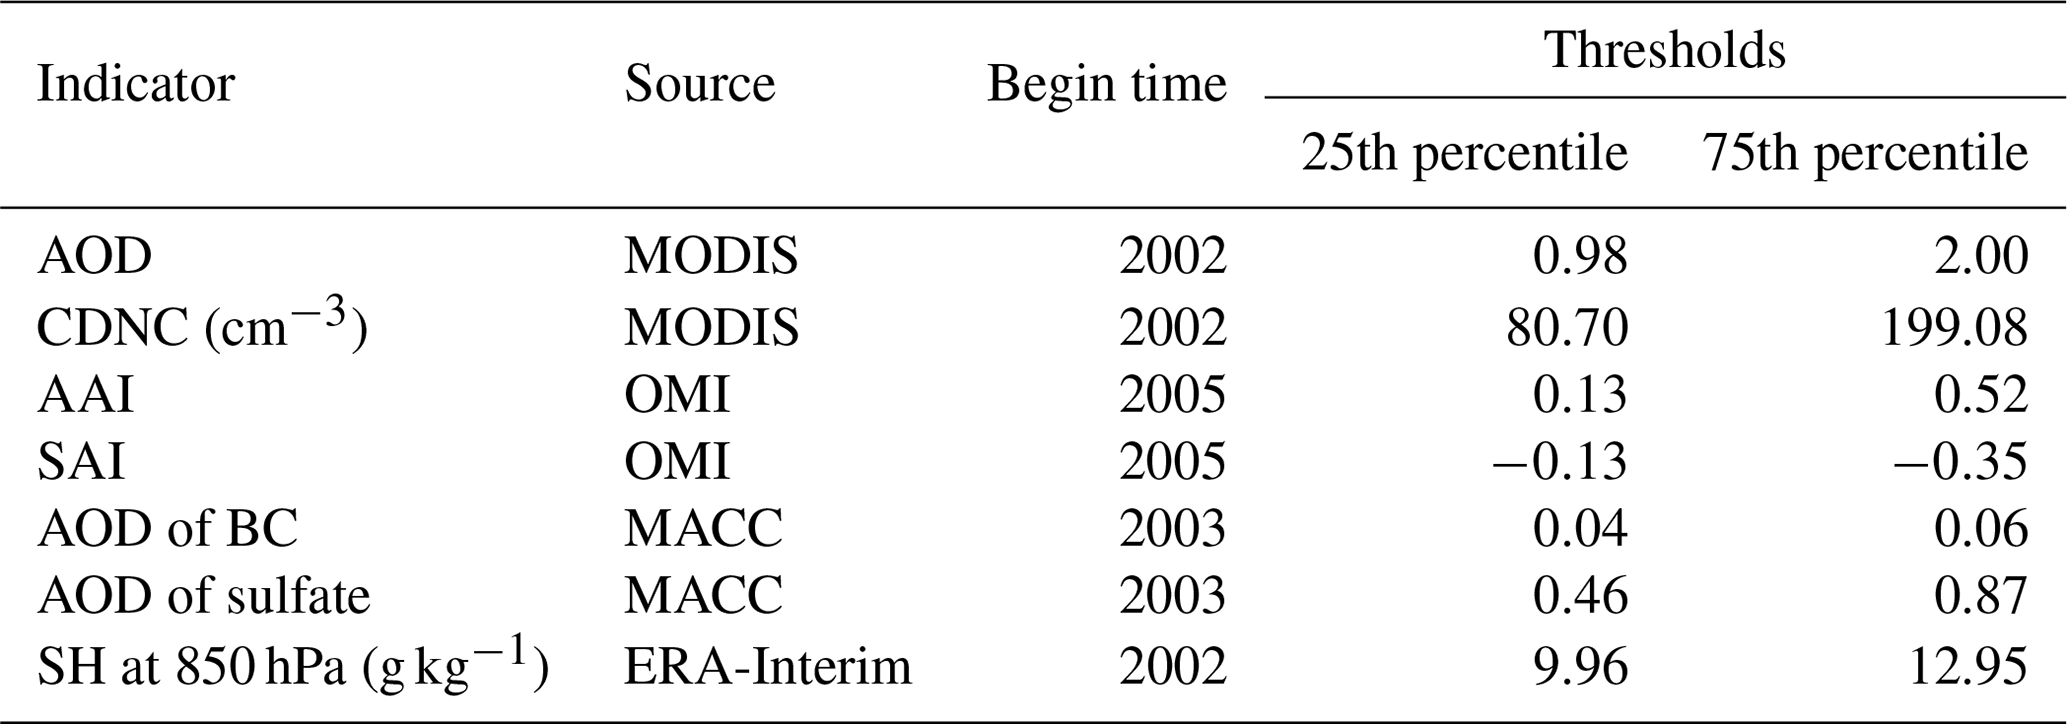
Table 1The indicators of aerosols and moisture used in the study and their sources, begin times and the thresholds (25th and 75th percentiles). The end time of all data is to 2012.
2.2.2 Classification of clean/polluted cases and moisture conditions
With the circulation of southwesterly flow, we used two indicators to distinguish the clean and polluted conditions from macro and micro perspectives, which are AOD and CDNC. The 25th and 75th percentiles of AOD / CDNC during the whole rainfall days are used as the thresholds of clean and polluted conditions, and the values are shown in Table 1. There are 514 cases of heavy rainfall on the polluted days and 406 cases of that on the clean days when using AOD, and 805/812 cases on the polluted/clean condition when using CDNC (Fig. 3).
The absorbing aerosols are detected using the positive values of the AI that is named the absorbing aerosol index (AAI) here, and we can retrieve the scattering aerosol index (SAI) using the negative values of AI. AAI and SAI are also divided into two groups using the threshold of the 25th/75th percentile as shown in Table 1. We used AAI/SAI more than the 75th percentile as the extreme circumstances of absorbing/scattering aerosols to compare their impacts on the heavy rainfall. The sample numbers are 375 and 550, respectively, for the extreme AAI and SAI cases. Using the same method, we chose cases with more BC/sulfate when the AOD of BC/sulfate is larger than the 75th percentile of itself during all rainy days and cases with less BC/sulfate when that is less than the 25th percentile of itself in the same situation. Accordingly, we selected 459 heavy rainfall cases with more BC and 274 cases with less BC. Similarly, 361 cases with more sulfate and 419 cases with less sulfate were selected (Fig. 6).
The SH at 850 hPa is used as the indicator of moisture condition under the cloud base. We chose wet cases when the SH on that day is larger than the 75th percentile of it and chose dry cases when the SH on that day is less than the 25th percentile of it during the whole rainy days (the thresholds are shown in Table 1).
2.2.3 Statistical analysis
We adopted the probability distribution function (PDF) to compare the features of heavy rainfall and cloud variables on different conditions of aerosols, through which we can understand the changes in rainfall/cloud properties more comprehensively. The numbers of bins we selected in the study have all been tested to better represent the PDF distribution. A Student's t test is used to examine the statistical significance level of the differences or correlations between the different groups of variables.
In this study, we applied two indicators (AOD and CDNC) to identify the aerosol pollution. AOD is usually used as the macro indicator of aerosol pollution, which represents the optical feature of aerosol particles rather than the micro CCN (Shinozuka et al., 2015). To better identify the aerosol–cloud interaction, we intentionally applied the CDNC as the indicator of CCN (Zeng et al., 2014; Zhu et al., 2018).

Figure 2PDFs of (a) AOD and (b) CDNC (cm−3) (data from MODIS) on non-rainfall days (black lines), rainfall days (blue lines) and heavy rainfall days (red lines) in southwesterly circulation during early summers from 2002 to 2012. Numbers in the legends denote the sample number.
We first investigated the value distribution of AOD and CDNC over the BTH region. Figure 2a and b show the PDFs of AOD and CDNC on the non-rainfall days, rainfall days and heavy rainfall days, respectively. We found that the ranges of AOD values under the above three conditions are almost similar, that is, between 0 and 5, and their probability peaks all occur at around 1.2 (Fig. 2a). In contrast, CDNC shows different ranges among the three conditions, which ranges from around 30 to 600 cm−3 on the rainfall days and heavy rainfall days and from around 50 to 800 cm−3 on the non-rainfall days. Besides, the proportion of low CDNC is relatively high on the non-rainfall days (Fig. 2b). Accordingly, the range of AOD remains similar, while the range of CDNC is shortened on the rainfall days, probably because the cloud droplets become larger on rainfall days, which could cause the reduction of number concentration. Therefore, to obtain comparable samples, we use the percentile method to select respective clean and polluted cases based on the above two indicators in order to better compare the characteristics of heavy rainfall. Hence the heavier pollution corresponds to a larger optical amount of aerosols measured by AOD and more aerosols that could serve as CCN measured by CDNC.

Figure 3PDFs of start time (units: LST), peak time (units: LST), duration (units: hours) and intensity (units: 0.1 mm h−1) of heavy rainfall (data from CMA) on selected clean (blue lines) and polluted (red lines) conditions, respectively, using indicators of (a) AOD and (b) CDNC (cm−3), during early summers from 2002 to 2012.
3.1 Characteristics
Our previous study (Zhou et al., 2018) reported the distinct peak shift of heavy rainfall diurnal variation between clean and polluted days using the indicator of AOD over the BTH region during early summer. Similarly to our previous study, the PDF of the heavy rainfall peak time shows that the maximum of the rainfall peak is about 2 h earlier on the polluted days (20:00 LST) than that on the clean days (22:00 LST) (Fig. 3a). To comprehensively recognize the changes in rainfall diurnal variation associated with air qualities, here we examined the PDF of the start time, the duration and the intensity besides the peak time of heavy rainfall.
As shown in Fig. 3a, the start time of heavy rainfall exhibits a significant advance on the polluted days. The secondary peak on the early morning is ignored here because the early-morning rainfall is usually associated with the mountain winds (Wolyn et al., 1994; Li et al., 2016) and the nighttime low-level jet (Higgins et al., 1997; Liu et al., 2012) that is beyond the scope of this study. The time for the maximum frequency of heavy rainfall initiation is around 6 h earlier on the polluted days, shifting from around 00:00 LST on the clean days to 18:00 LST (Fig. 3a). Regarding the rainfall durations, the average persistence of heavy rainfall on polluted days is 0.8 h longer than that on clean days (Table 2). According to the PDF shown as in Fig. 3a, the occurrence of short-term precipitation (≤ 6 h, Yuan et al., 2010) decreases, while that of long-term precipitation (> 6 h, Yuan et al., 2010) increases. The intensity of hourly rainfall exhibits a insignificant increase on the polluted days.
Table 2The mean values of start time (units: LST), peak time (units: LST), duration (units: hours) and intensity (units: 0.1 mm h−1) of heavy rainfall, respectively, on the clean and polluted conditions using two indicators of AOD and CDNC, and their differences (polluted minus clean) and significances. The numbers in the brackets stand for the standard deviations on the means. “P<0.05” stands for the difference that has passed the significance test of 95 %, and “P>0.1” stands for the difference that did not pass the significance test of 90 %.
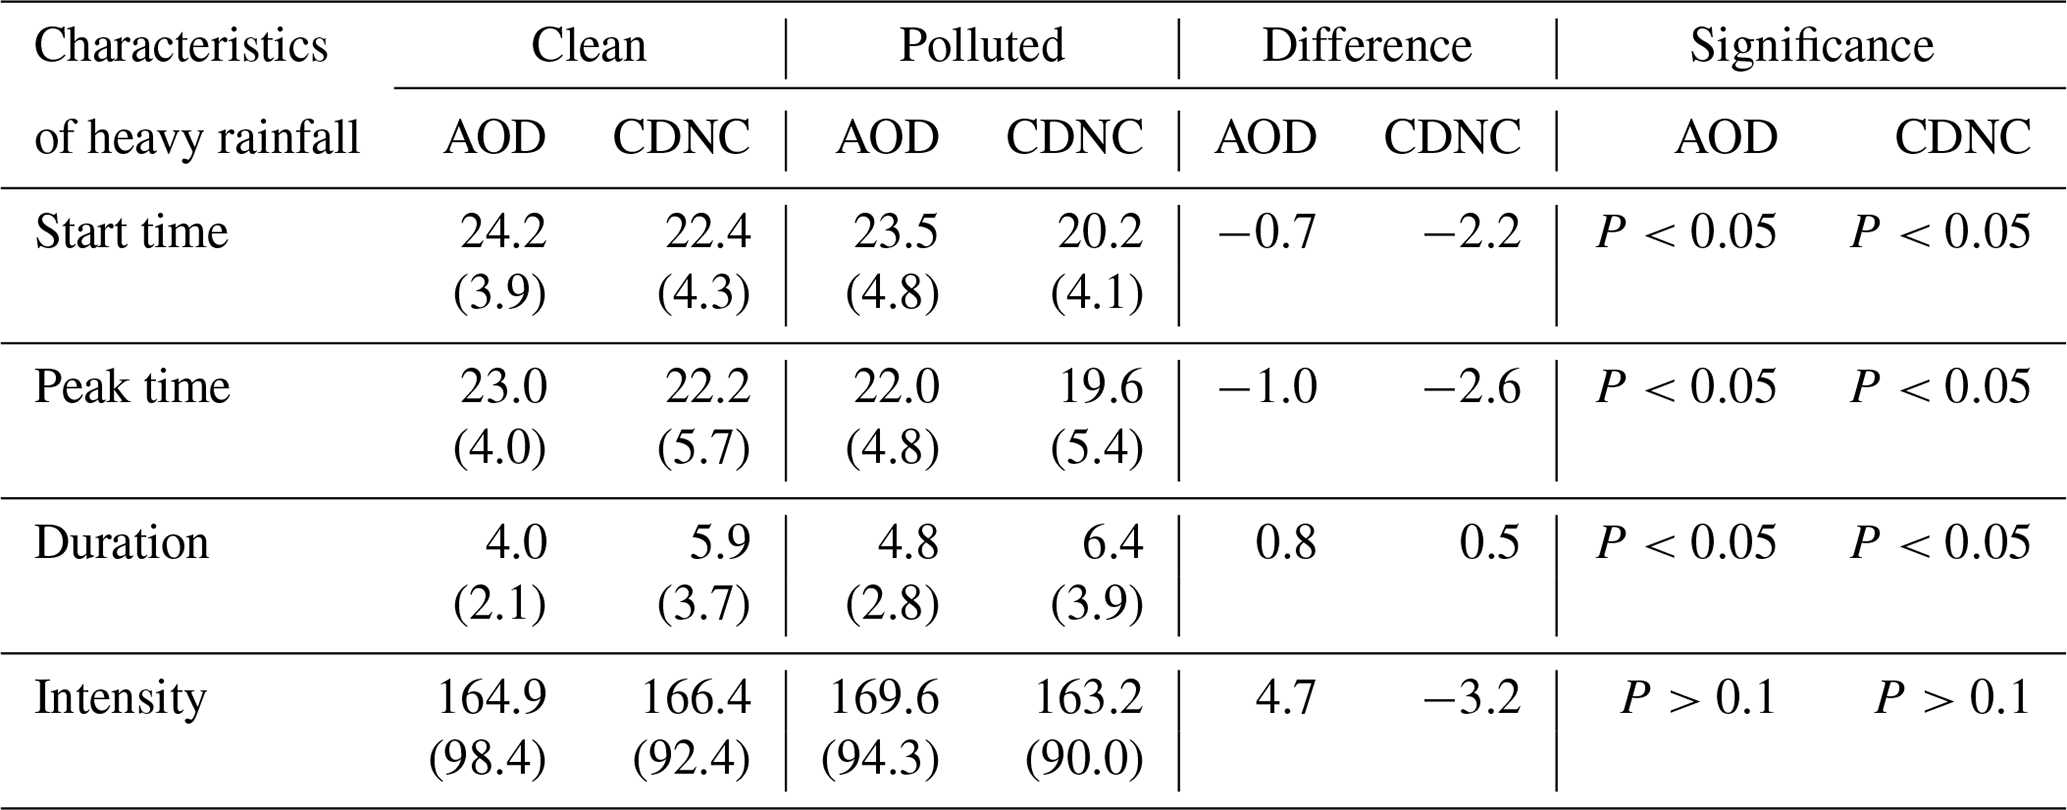
The distinct behaviors of heavy rainfall diurnal variation between clean and polluted days have been well demonstrated using the indicator of AOD. Using CDNC as the indicator of CCN, the above-mentioned results are also significant, as shown in Fig. 3b. The start time and peak time of heavy rainfall on the polluted condition also show significant advances compared with that on the clean condition, with the average advances of 2.2 and 2.6 h, respectively (Table 2). The duration of heavy rainfall on the polluted condition is also prolonged, which is 0.5 h longer on average (Table 2). Similarly to the results based on AOD, the difference of rainfall intensity between clean and polluted conditions using CDNC does not pass the 95 % statistical confidence level either.
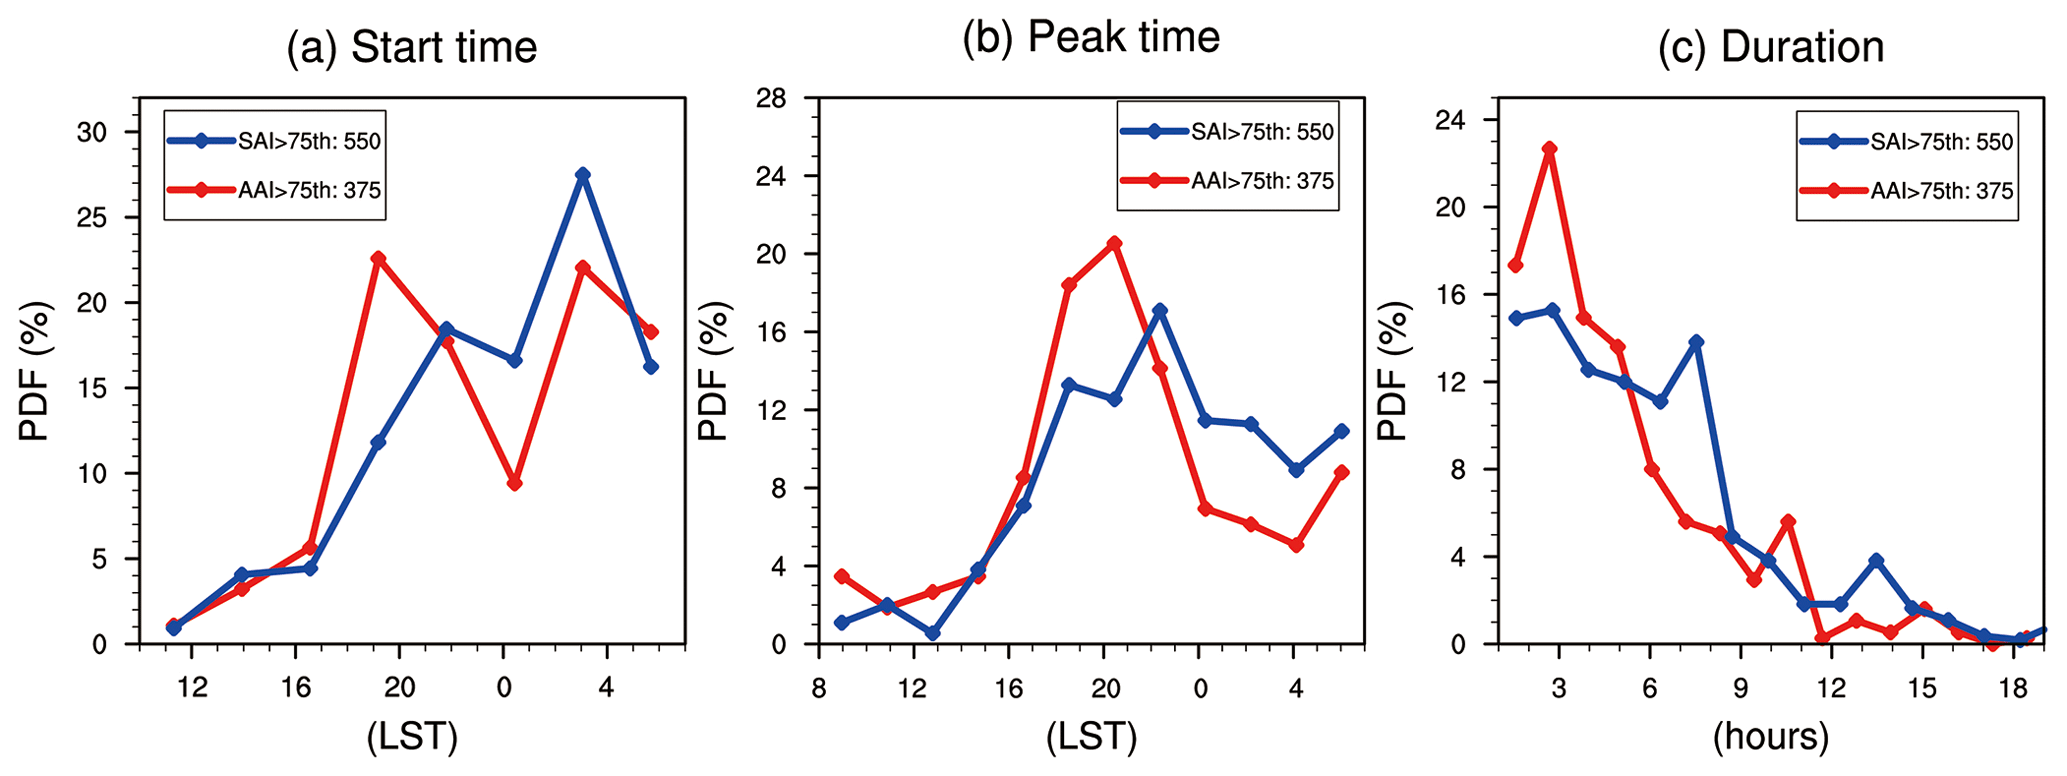
Figure 4PDFs of (a) start time (units: LST), (b) peak time (units: LST), and (c) duration (units: hours) of heavy rainfall on the days with SAI more than the 75th percentile (blue lines, data from OMI) and days with AAI more than the 75th percentile (red lines, data from OMI), during early summers from 2005 to 2012.
Hence, the results using either AOD or CDNC show that the start and peak times of heavy rainfall occur earlier and that the duration becomes longer under pollution. We found that the AOD and CDNC only have an insignificant positive correlation, which denotes that the selected cases could be different between using AOD and CDNC. The differences between the two indicators might be attributed to the non-linear relationship between CCN and aerosol pollution (e.g., Jiang et al., 2016), the misdetection of AOD when the humidity is high (Boucher and Quaas, 2012), the calculation uncertainty of CDNC, and the sampling differences between AOD and CDNC. Since the two indicators represent aerosols from the different perspectives, we cannot identify which one is more reliable. Because the change in rainfall intensity is not significant based on either AOD or CDNC, the following analysis only focuses on studying the changes in start time, peak time and duration of heavy rainfall along with aerosol pollution.
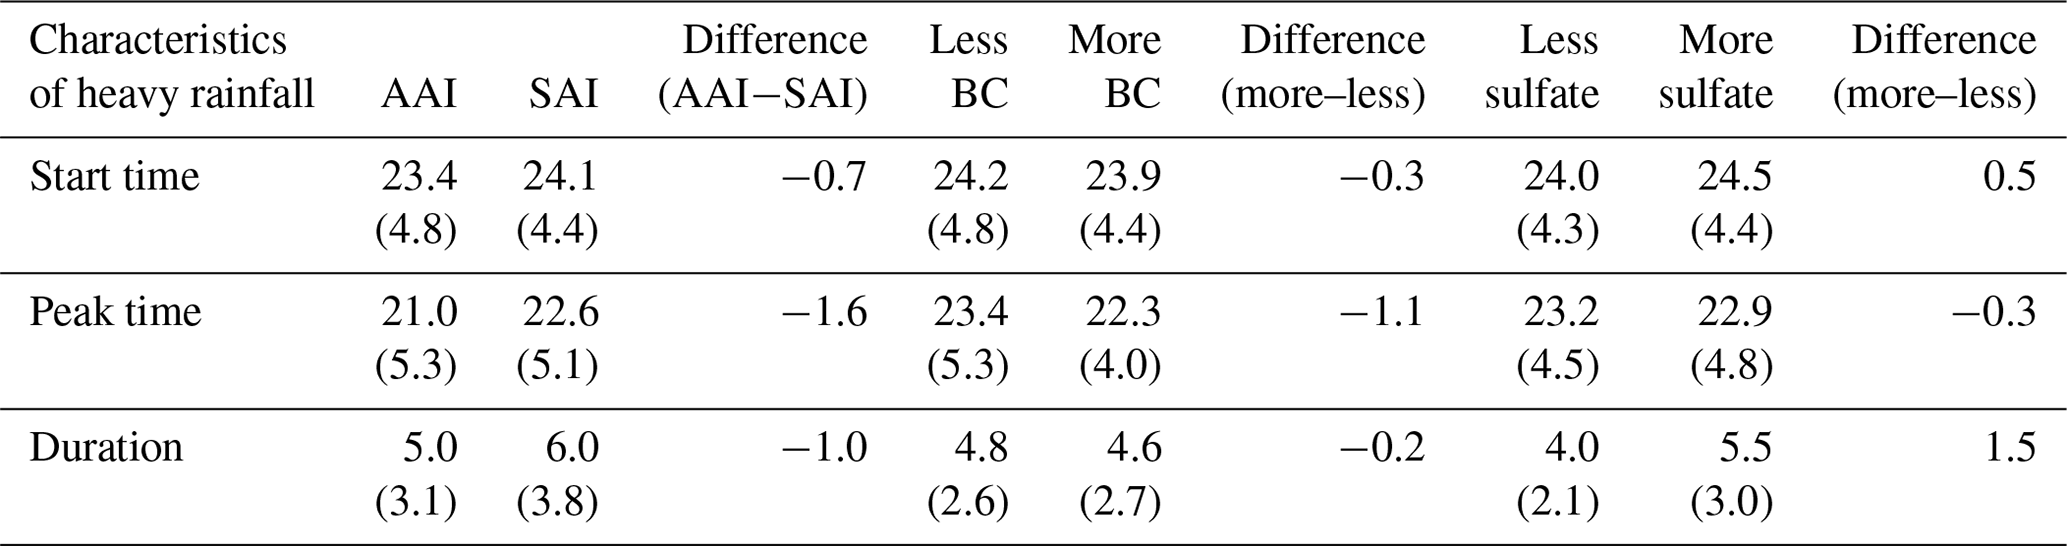
Table 3The mean values of start time (units: LST), peak time (units: LST) and duration (units: hours) of heavy rainfall, respectively, on the conditions with more absorbing aerosols (AAI more than the 75th percentile, from OMI), more scattering aerosols (SAI more than the 75th percentile, from OMI), less or more BC (AOD of BC less than the 25th or more than the 75th percentile, from MACC), less or more sulfate (AOD of sulfate less than the 25th or more than the 75th percentile, from MACC), and their differences. Numbers in the brackets stand for the standard deviations on the means. All differences have passed the significance test of 95 %.
3.2 Sensitivities to aerosol types
Using the indicator of AI, we further investigated the distinct behaviors of heavy rainfall diurnal variation related to absorbing aerosols and scattering aerosols, respectively. The PDFs of start time, peak time and duration of heavy rainfall under the extreme circumstances of absorbing aerosols and scattering aerosols are compared in Fig. 4. Here, we briefly named the days with extremely large amounts of absorbing aerosols as absorbing aerosol days and with more scattering aerosols as scattering aerosol days. The start time of heavy rainfall on absorbing aerosol days shows a significance earlier compared with that on scattering aerosol days (Fig. 4a), with a 0.7 h advance on average (Table 3). Similarly, the rainfall peak time also shows earlier on absorbing aerosol days (Fig. 4b), with an average advance of 1.6 h (Table 3). The rainfall duration on scattering aerosol days is longer than that on absorbing aerosol days, which are 6.0 and 5.0 h, respectively, on average (Table 3). All the above-mentioned differences between the two groups have passed the 95 % statistical confidence level. The results indicate that the absorbing aerosols and scattering aerosols may have different or inverse effects on the heavy rainfall that absorbing aerosols may generate the heavy rainfall in advance, while the scattering aerosols may delay and prolong the heavy rainfall.
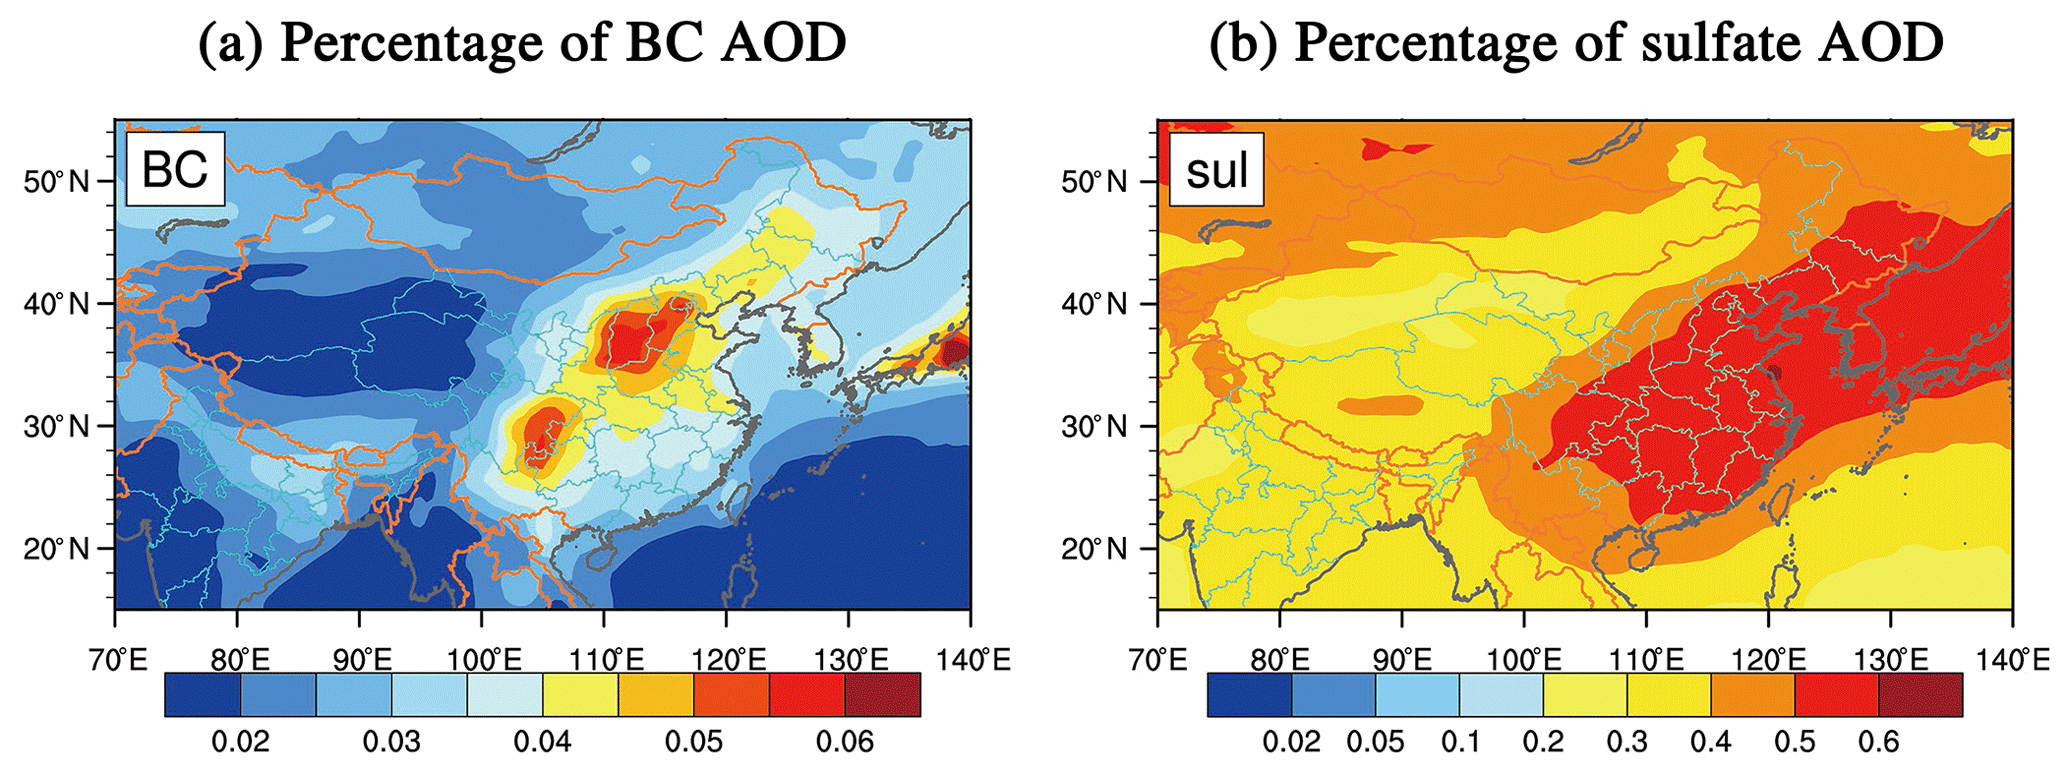
Figure 5Percentages of AOD for (a) BC and (b) sulfate from MACC reanalysis data in summers (June–August) during 2002 to 2012.
To further verify the different behaviors of heavy rainfall diurnal variation associated with two different types of aerosols, we purposely re-examine the above-mentioned phenomena using BC/sulfate that can represent typical absorbing/scattering aerosols over the BTH region. BC has its maximum center over the BTH region (Fig. 5a) and our previous study has indicated that the radiative effect of BC low-level warming may facilitate the convective rainfall generation (Zhou et al., 2018). The percentage of sulfate is also large over the BTH region (Fig. 5b) and sulfate is one of the most effective CCN that influence the precipitation in this region (Gunthe et al., 2011). Accordingly, we selected the cases with different AOD of BC and sulfate to compare their roles in the diurnal variation of heavy rainfall. The methods have been described in Sect. 2.2.2. The PDFs of the start time, peak time and duration of heavy rainfall in the cases with more/less BC are shown in Fig. 6a, respectively. The most striking result is that the maximum frequency of rainfall start time in the more BC cases evidently shifts earlier (Fig. 6a). Meanwhile, the mean peak time in the more BC cases shows 1.1 h earlier than that in the less BC cases (Table 3). And the duration of heavy rainfall is slightly shortened by the averaged 0.2 h in the more BC cases. The features in the more BC cases are consistent with the above results of absorbing aerosols. In contrast, when the sulfate has a larger amount, the mean start time of rainfall is delayed by 0.5 h, while the duration shows a significant increase by 1.5 h on average (Table 3). The behaviors in the more sulfate cases are also similar to the above results of scattering aerosols, except for the peak time that shows later in the scattering aerosol cases but a little earlier in the more sulfate cases (Table 3).

Figure 6PDFs of start time (units: LST), peak time (units: LST) and duration (units: hours) of heavy rainfall on the different conditions of (a) BC and (b) sulfate. Blue/red lines stand for the condition of less/more BC or sulfate (AOD of BC or sulfate less than the 25th/more than the 75th percentile, data from MACC) during early summers from 2003 to 2012.
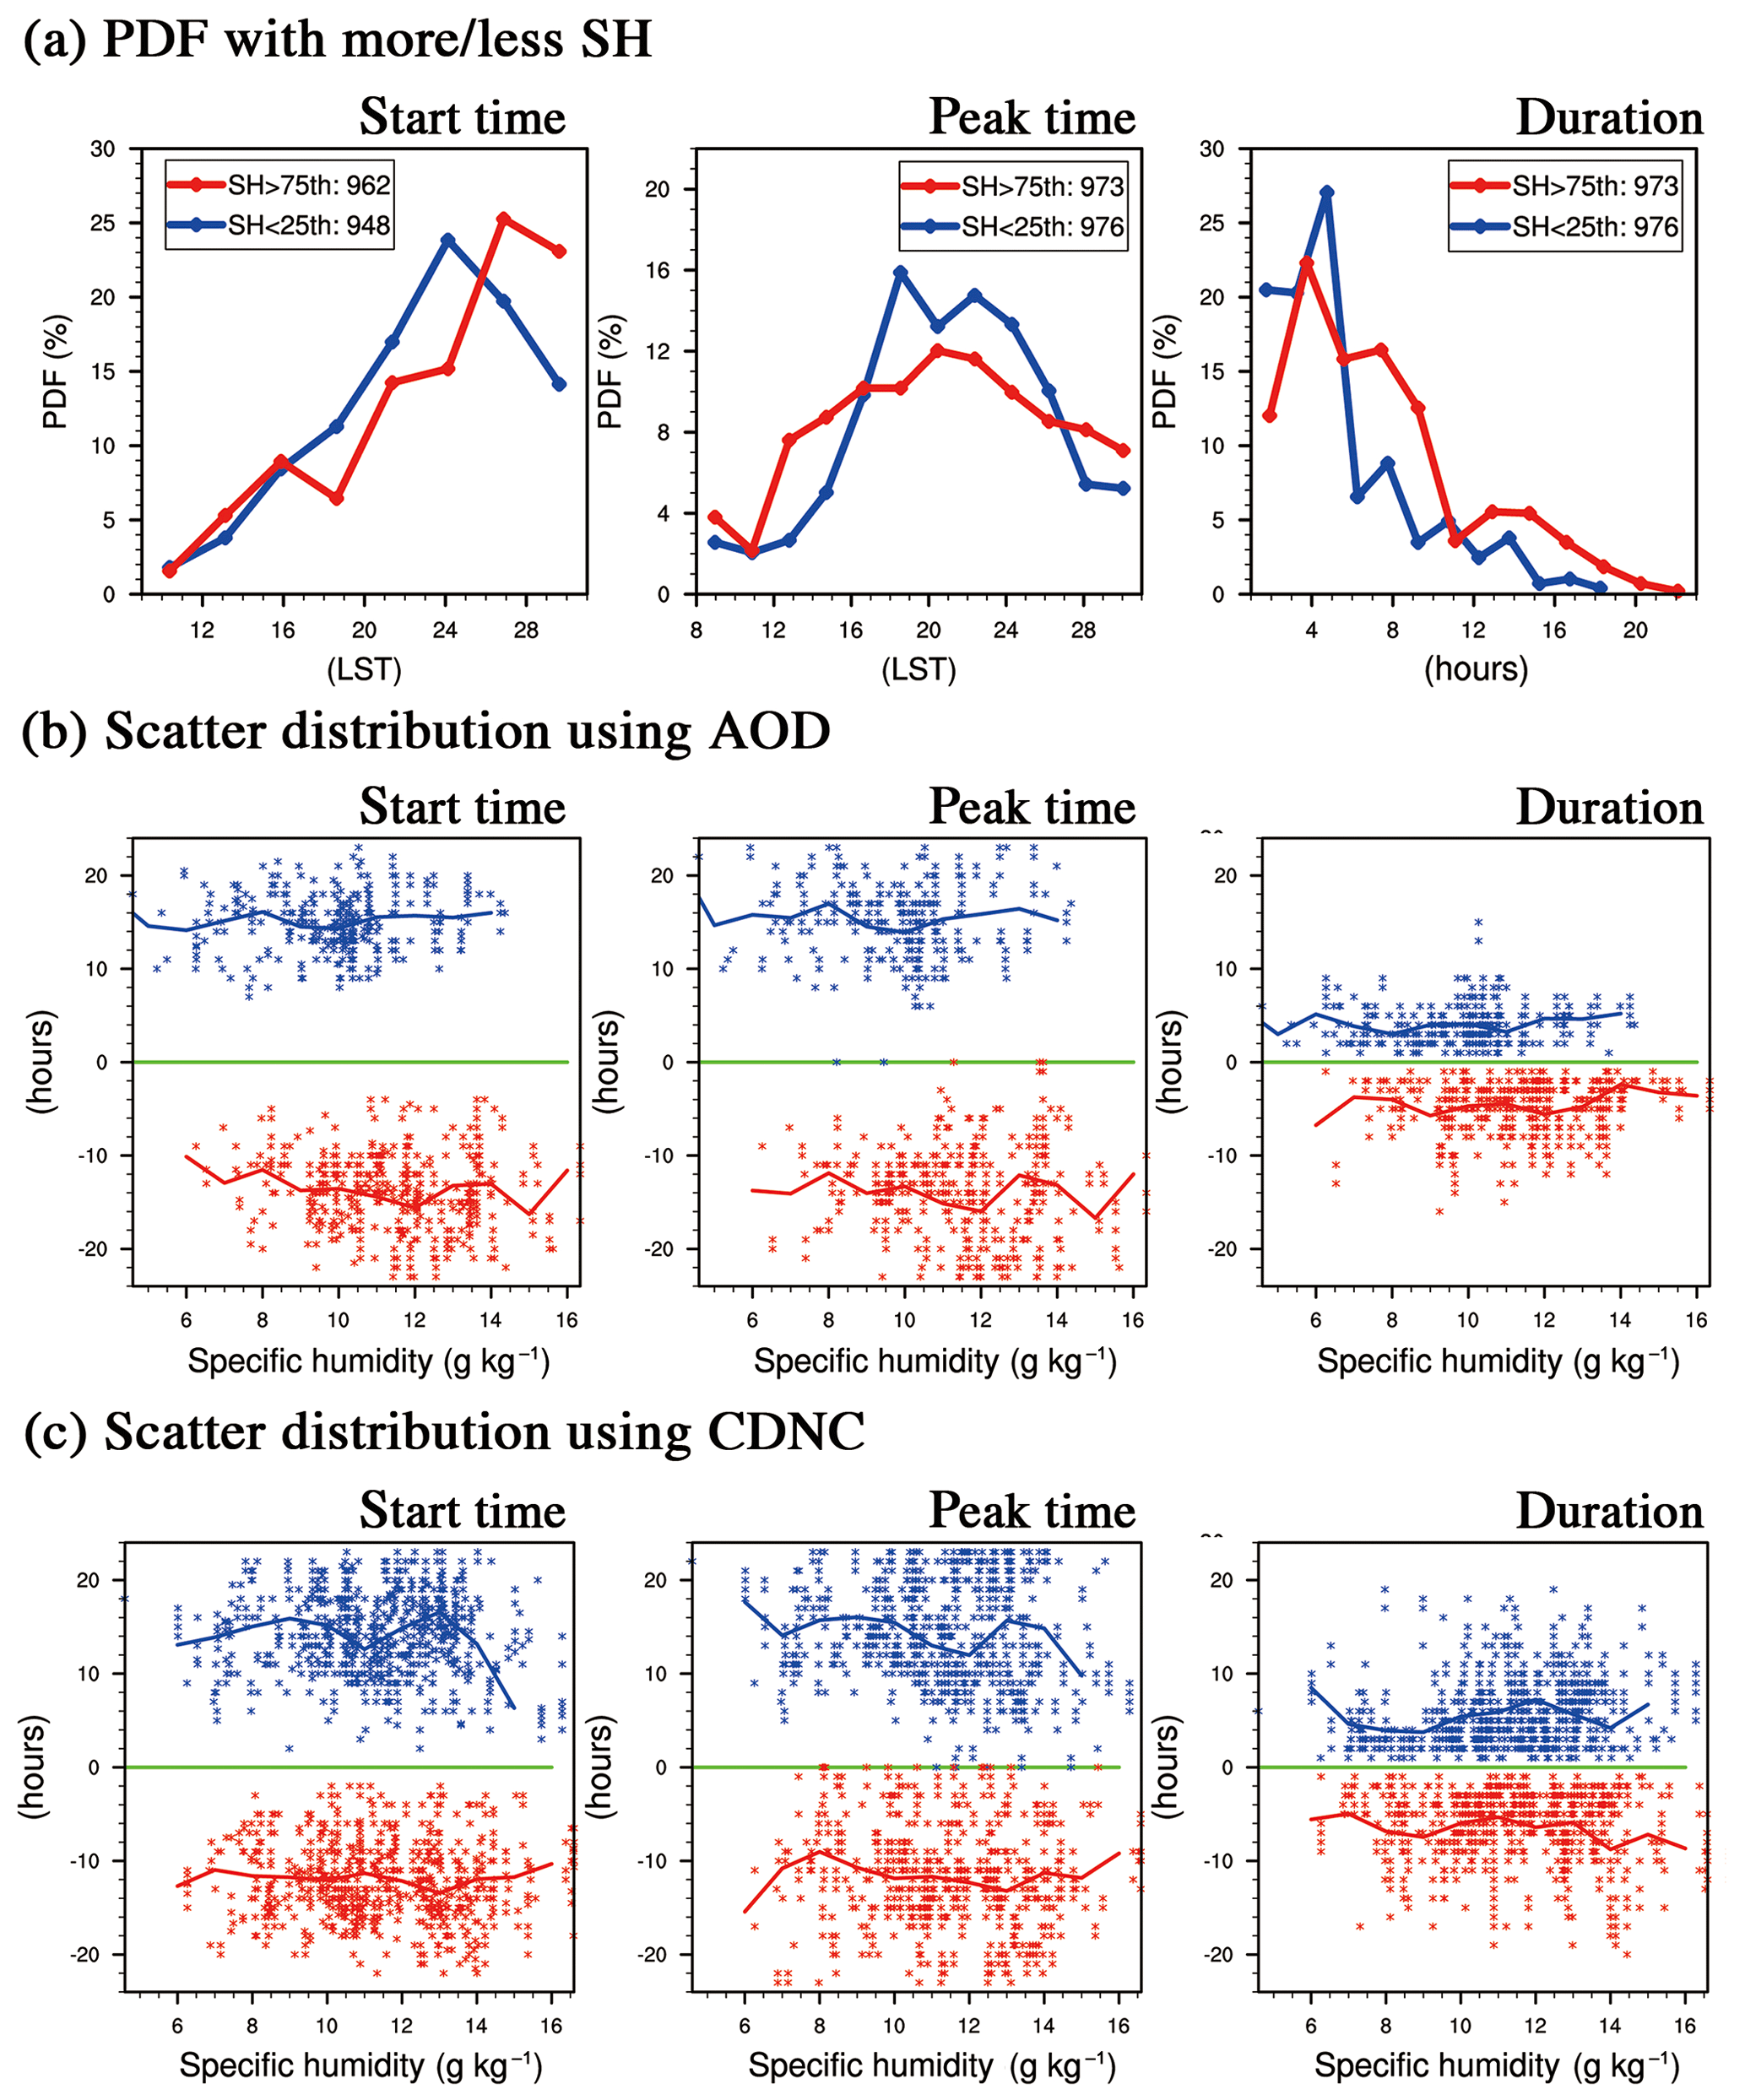
Figure 7(a) PDFs of start time (units: LST), peak time (units: LST), and duration (units: hours) of heavy rainfall with less moisture (blue lines, SH at 850 hPa less than the 25th percentile, data form ERA-Interim) and more moisture (red lines, SH at 850 hPa more than the 75th percentile, data from ERA-Interim). (b) and (c) are scatter distributions of SH start time/peak time/duration for clean cases (blue points) and polluted cases (red points), respectively, using AOD and CDNC. Green lines stand for the start/peak time at 08:00 LST or the duration is 0 h. Positive (negative) values stand for the hours away from 08:00 LST or 0 h in clean (polluted) cases. Blue (red) lines stand for the mean values of rainfall characteristics at each integer of SH in clean (polluted) cases.
3.3 Influence of moisture
Moisture supply is an indispensable factor for the precipitation formation, and it also has an important impact on AOD (Boucher and Quaas, 2012). Since the southwesterly circulation can transport not only pollutants, but also plenty of moisture to the BTH region (Wu et al., 2017), more pollution usually corresponds to more moisture for the BTH region (Sun et al., 2015), so that it is hard to completely remove the moisture effect on the above results in a pure observational study. Here we attempt to recognize the moisture effect on the heavy rainfall to further understand the above aerosol-associated changes. Because the moisture supply for BTH is mainly transported via low-level southwesterly circulation, we purposely used the SH at 850 hPa as the indicator of moisture condition.
Using the similar percentile method, we compared the heavy rainfall characteristics in the relatively wet (SH more than the 75th percentile) and relatively dry (SH less than the 25th percentile) environments regardless of the aerosol condition, as shown in Fig. 7a. The results show that the start time of heavy rainfall is delayed by 0.9 h, the peak time is 0.6 h earlier and the duration is prolonged by 2.0 h on average in the wet environment, which is similar to the results of the more sulfate cases. Besides, the same results are obtained using a different moisture indicator, e.g., the 850 hPa absolute humidity. These results indicate that the advance of a heavy rainfall start time on the polluted days is not caused by more moisture supply, while the longer duration and earlier peak in the more sulfate cases might be related to the increased moisture. To further identify the role of sulfate, we examined the sensitivities of the results associated with sulfate under a different moisture condition. In the dry (SH less than the 25th percentile) and intermediate cases (SH between the 25th and 75th percentiles), the heavy rainfall still shows a later start time, earlier peak and longer duration with the increase in sulfate, while the change in peak time is not significant in the dry cases; in the high-moisture cases (SH more than the 75th percentile), it shows an earlier peak and shorter duration in the more sulfate cases. Therefore, we suppose that the impact of sulfate aerosols on the heavy rainfall is sensitive to moisture, and notably the sulfate could contribute to the longer duration in the polluted cases when it is relatively dry.
We also investigate the distributions of moisture and rainfall behaviors in the clean and polluted cases, respectively, using AOD and CDNC (Fig. 7b, c). The results show that the relationship between moisture and rainfall start time/peak time/duration is not linear. The distribution of SH exhibits a slight increase with pollution in the AOD cases, indicating that the polluted cases selected by AOD are accompanied by more moisture than the clean cases. However, when fixing the moisture at a certain range, especially at the relatively dry condition (for example, the SH between 8 and 12 g kg−1), we can detect the similar phenomena of earlier start/peak time and longer duration in the polluted cases based on either AOD or CDNC. To further clarify the characteristics of heavy rainfall associated with pollution, we removed the samples with high SH (SH more than the 75th percentile) and found that the results in Sect. 3.1 remain; that is, the start/peak time of heavy rainfall is in advance and the duration is prolonged with the increase in AOD / CDNC when SH is less than 12.95 g kg−1 (75th percentile) (Fig. 8).
The above results indicate that the advance of heavy rainfall start in the polluted cases is independent of moisture condition, while the advance of peak time and longer duration could be influenced by the moisture effect. For the earlier peak time of heavy rainfall, we suppose the role of BC (absorbing aerosols) might be dominant because the change in peak time in the former analysis is more significant (Table 3), although the sulfate and moisture also have a positive contribution. The increased sulfate (scattering aerosols) contributes to the longer duration of heavy rainfall (Fig. 6b), but the role of sulfate is somewhat sensitive to the moisture condition. With the increase in sulfate, the duration is longer when the moisture condition is relatively dry, while it becomes shorter when it is extremely wet. Overall, when removing the extremely high moisture cases, the earlier start/peak time and longer duration of heavy rainfall associated with aerosol pollution are significant.
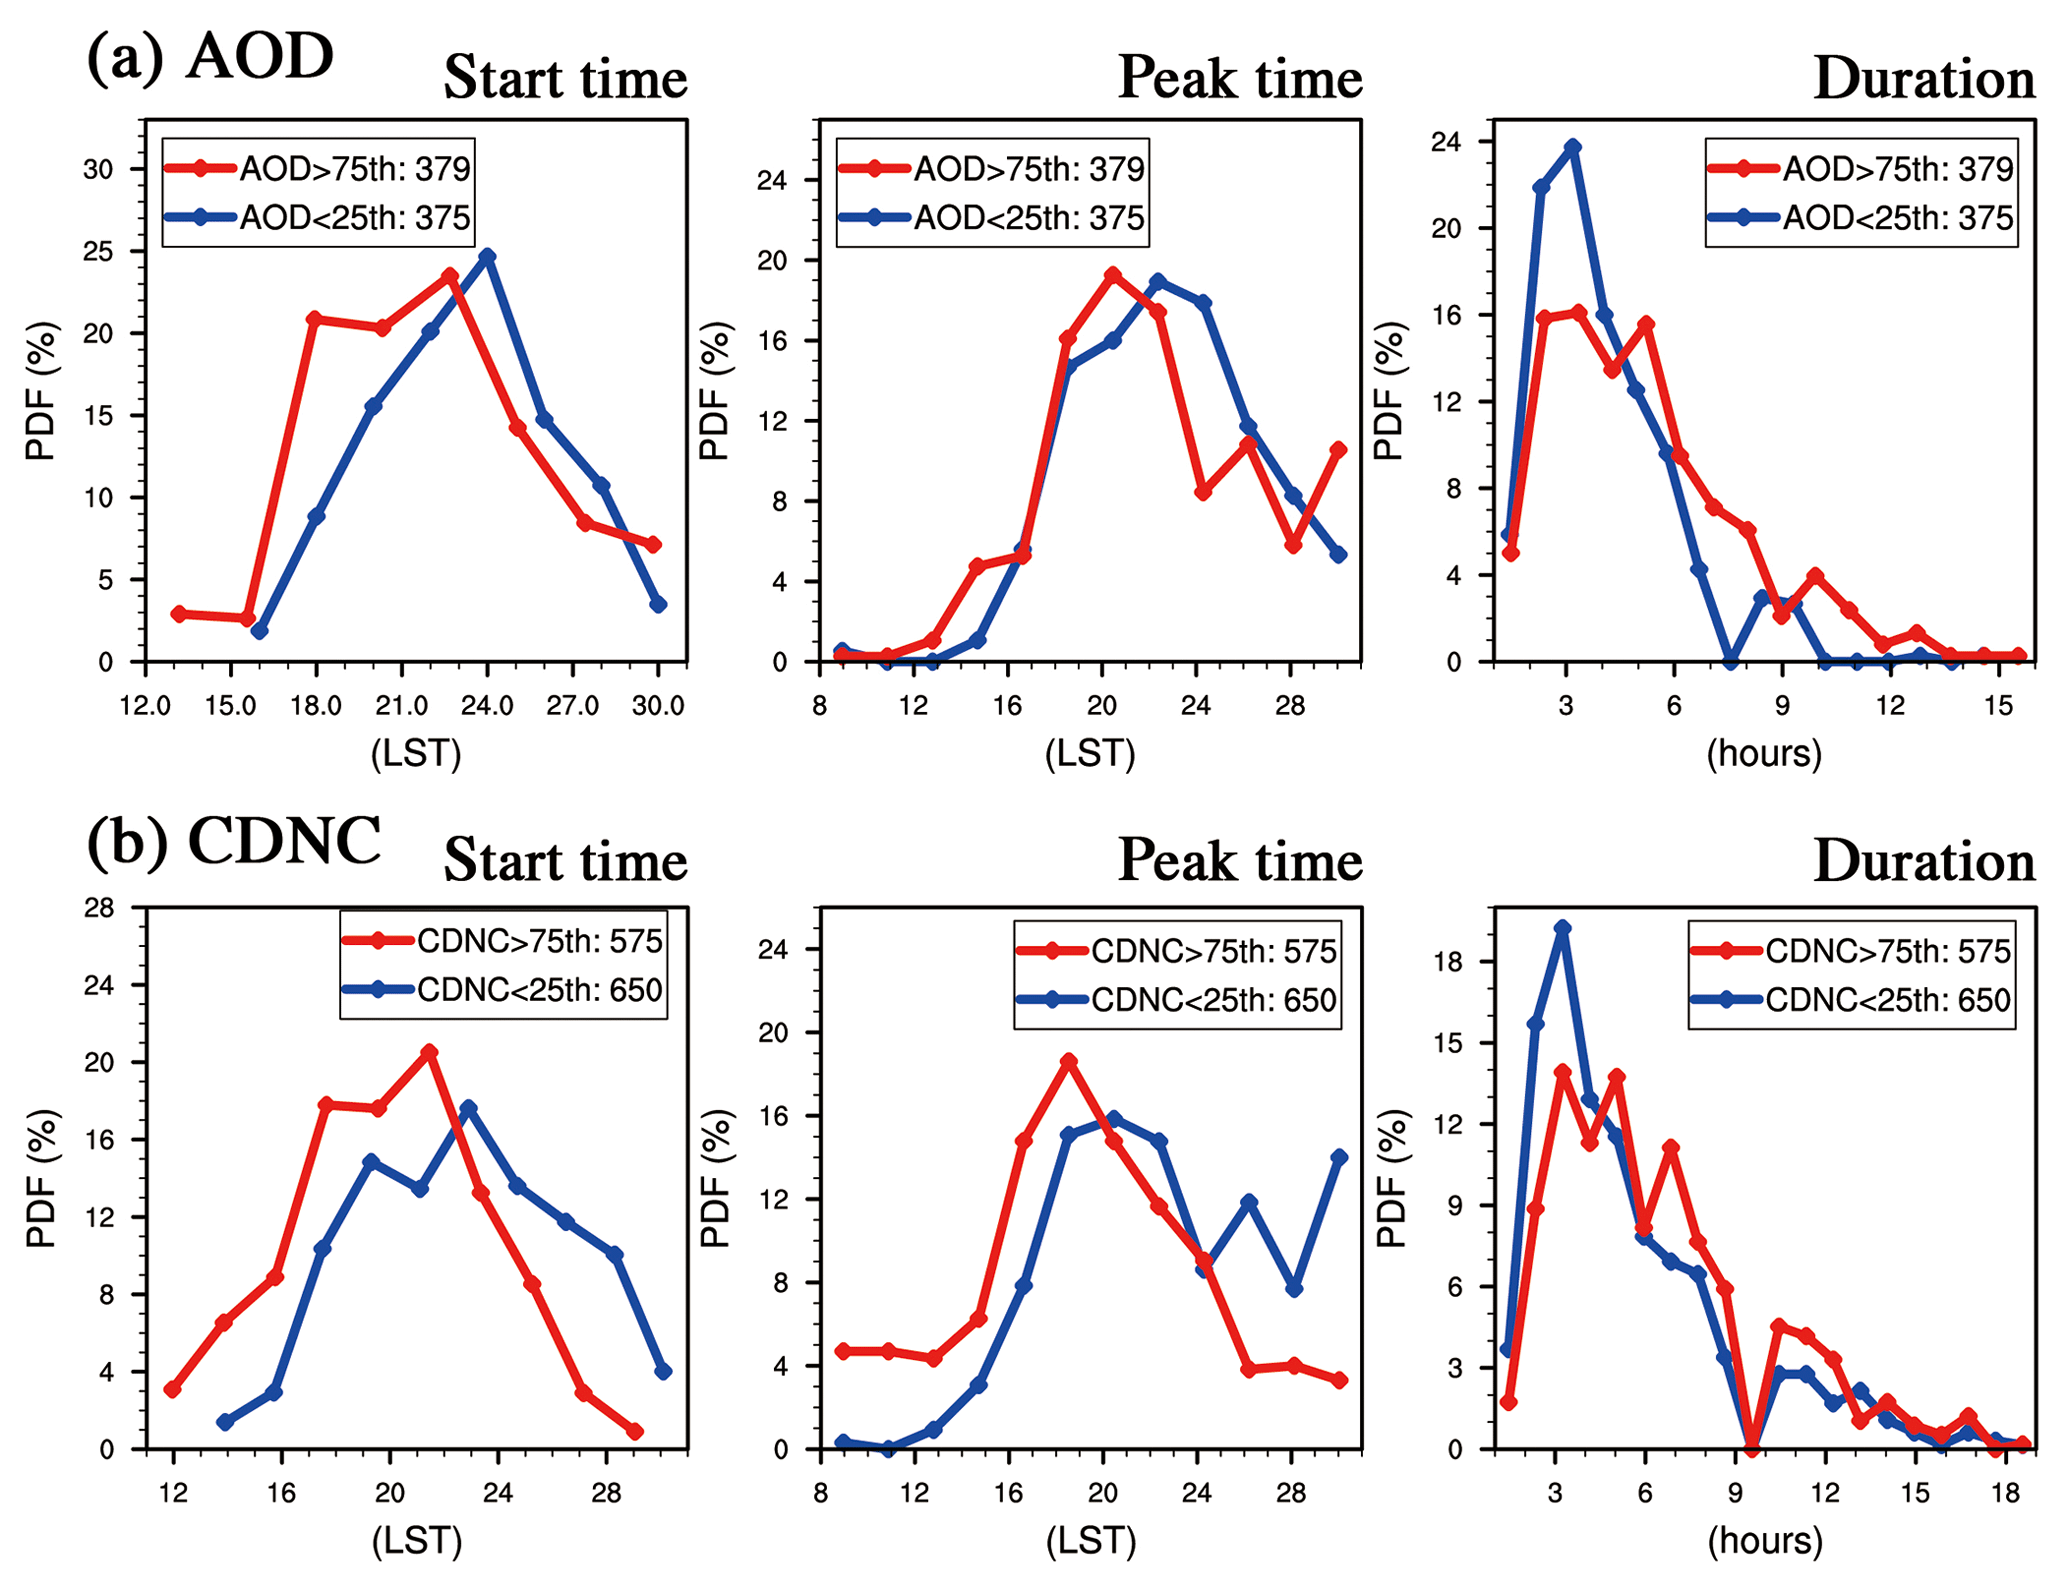
Figure 8PDFs of start time (units: LST), peak time (units: LST), and duration (units: hours) of heavy rainfall on selected clean (blue lines) and polluted (red lines) conditions with SH at 850 hPa (from ERA-Interim) less than the 75th percentile, respectively, using indicators of (a) AOD and (b) CDNC (cm−3), during early summers from 2002 to 2012.
To understand the cloud effect of aerosols during heavy rainfall, we need to recognize the associated cloud characteristics on the clean and polluted conditions. The cloud properties we used were obtained from the satellite product that was measured at the same time with aerosols before the occurrence of heavy rainfall. The differences of cloud features were examined in both macroscopic (including CF, CTP, COT and CWP) and microscopic properties (including CER) on the clean and polluted conditions based on AOD and CDNC, respectively.
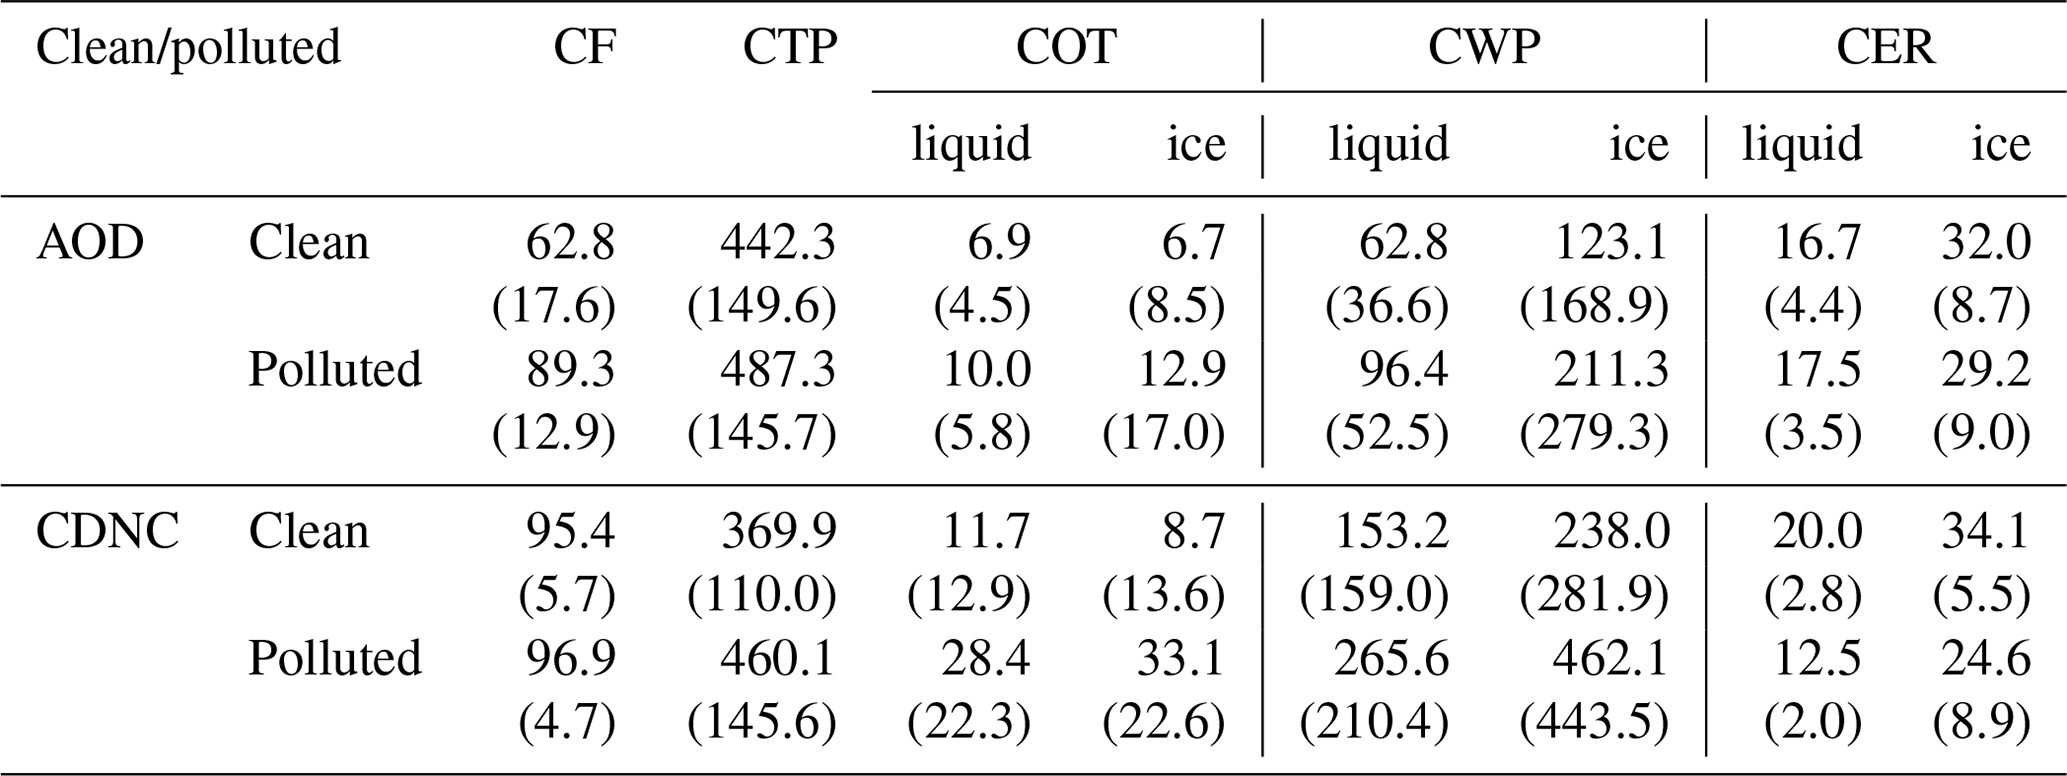
Table 4The mean values of CF (units: %), CTP (units: hPa), COT (liquid and ice, units: none), CWP (liquid and ice, units: g m−2) and CER (liquid and ice, units: µm) from the MODIS C6 cloud product on the clean condition (less than the 25th percentile) and polluted condition (more than the 75th percentile) using two indicators of AOD and CDNC. Numbers in the brackets stand for the standard deviations on the means. The differences between clean and polluted conditions have all passed the significance test of 95 %.
4.1 Characteristics
Using AOD as the macro aerosol indicator, as shown in Fig. 9, the PDF distribution shows that the CF on the polluted condition is evidently larger than that on the clean condition. The average CF is 62.8 % on the clean condition and 89.3 % on the polluted condition (Table 4). The average CTP on the polluted condition is 487.3 hPa, which is larger than 442.3 hPa on the clean condition, indicating that the cloud top height is lower on the polluted days. The COT, CWP and CER were further analyzed for the liquid and ice portions of clouds as shown in Fig. 9. Both liquid and ice COT on the polluted condition exhibit significant increases compared with that on the clean condition. The mean amount of liquid COT is increased by 3.1, and ice COT increases by 6.2 (Table 4). Similarly to COT, the amounts of liquid and ice CWP also increase under pollution, which increase by 33.6 and 88.2 g m−2, respectively. In addition, the liquid CER is increased by 0.8 µm and the ice CER is decreased by 2.8 µm on the polluted days. The differences of the above-cloud properties between clean and polluted cases have all passed the 95 % statistical confidence level.
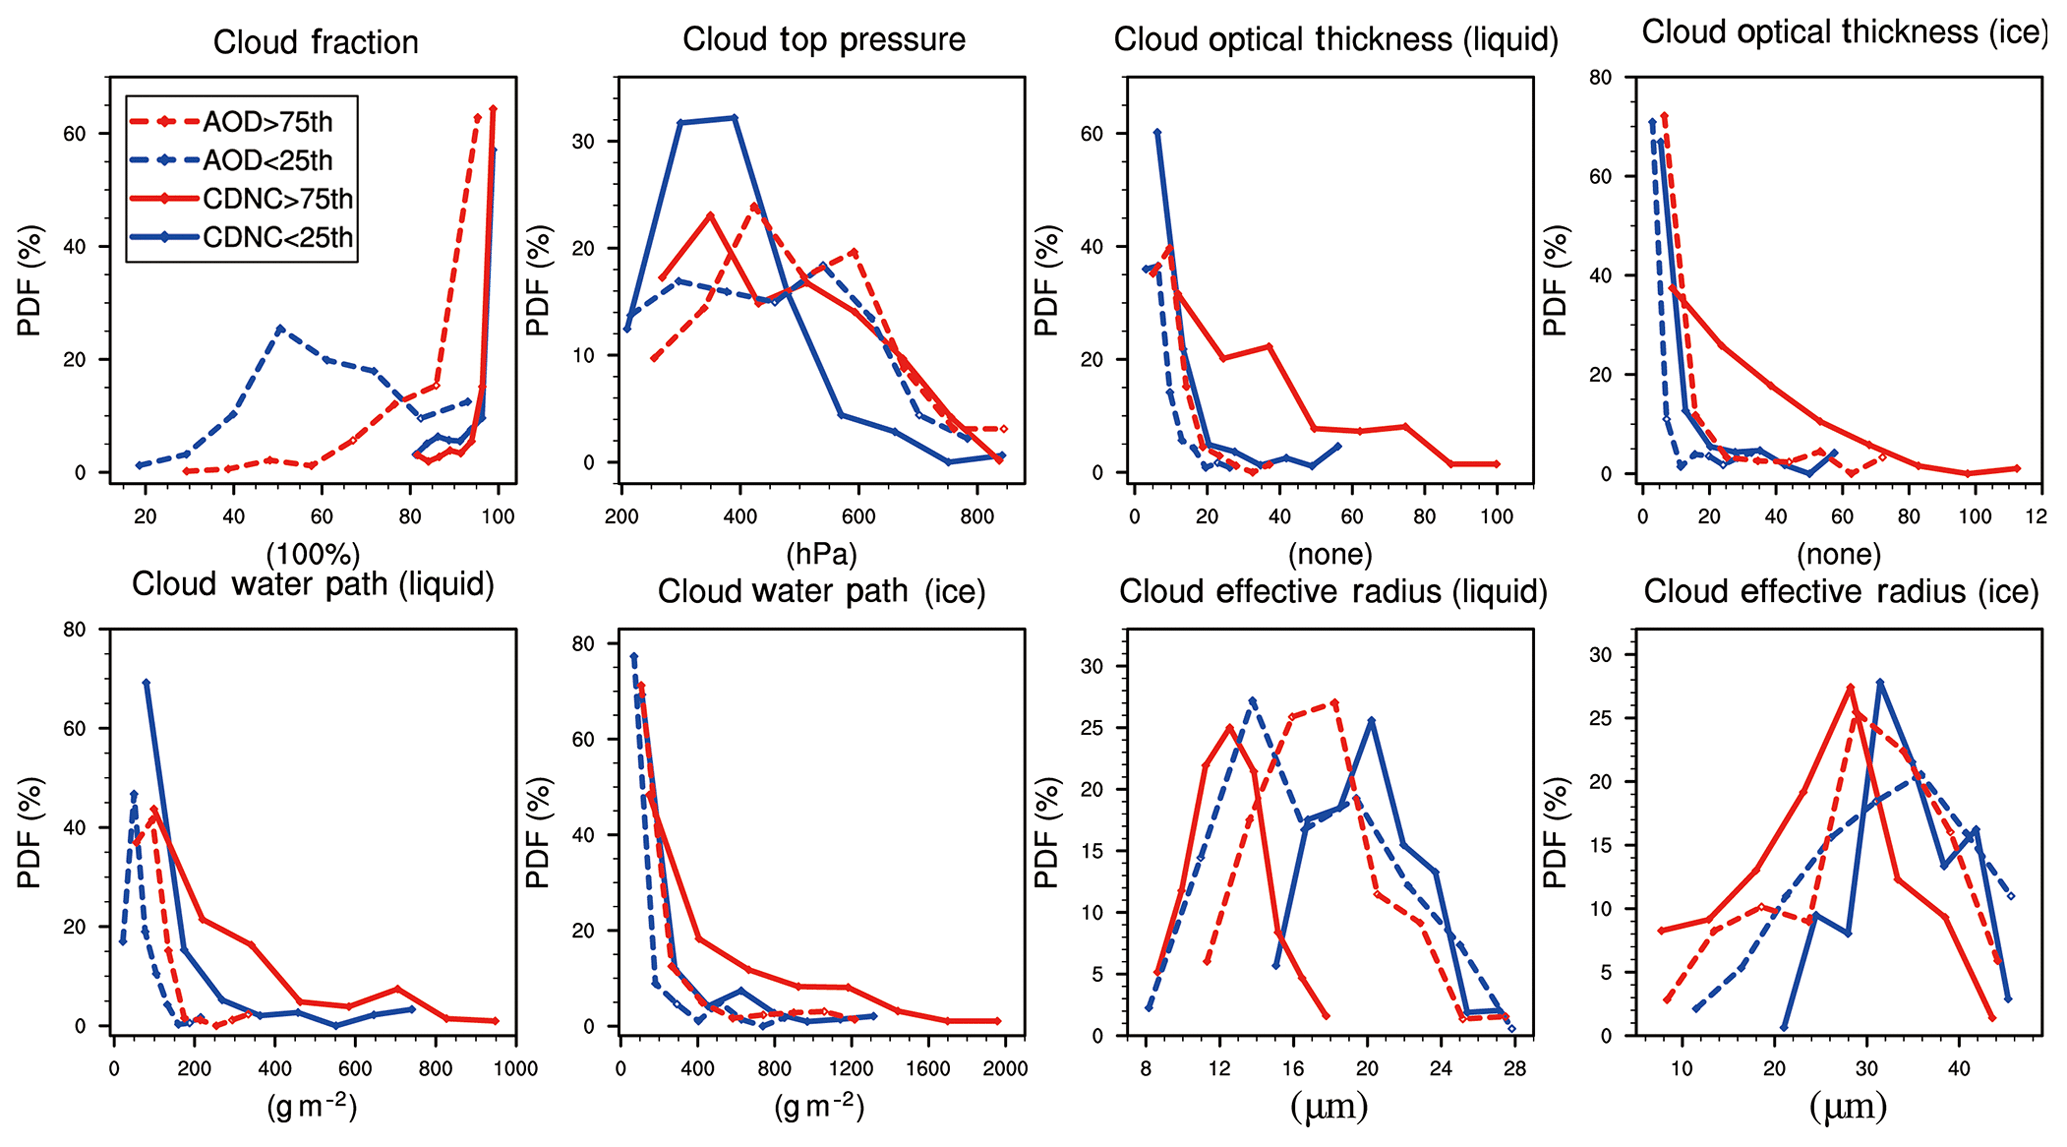
Figure 9PDFs of CF (units: %), CTP (units: hPa), COT (liquid and ice, units: none), CWP (liquid and ice, units: g m−2) and CER (liquid and ice, units: µm) on selected clean (blue dash lines: AOD < 25th percentile; blue solid lines: CDNC < 25th percentile) and polluted (red dash lines: AOD > 75th percentile; red solid lines: CDNC > 75th percentile) heavy rainfall days. All cloud variables are obtained from the MODIS C6 cloud product.
Using CDNC as the micro aerosol indicator, the above-mentioned changes in cloud properties are consistent with that using AOD, except for liquid CER (Fig. 9). Since the calculation method of CDNC is not independent of the liquid COT and liquid CER, we would not directly compare the results of liquid COT and CER based on CDNC with those based on AOD here. But according to other variables that are independent of the CDNC calculation, we found that the cases with more CDNC are accompanied by the increase in CTP, ice COT and liquid and ice CWP, which increase by 90.2 hPa, 24.4, 112.4 and 224.1 g m−2, respectively (Table 4), all of which are consistent with the results based on AOD. The CER of ice clouds also shows a consistent decrease by 9.5 µm on the polluted condition based on CDNC. We noticed that the changes in COT/CWP/CER for both liquid and ice based on CDNC are much larger than that based on AOD, which indicates that these cloud properties might be more sensitive to the indicator of CDNC rather than AOD.
Table 5The mean values of CF (units: %), CTP (units: hPa), COT (liquid and ice, units: none), CWP (liquid and ice, units: g m−2) and CER (liquid and ice, units: µm) in four groups. Numbers in the brackets stand for the standard deviations on the means. Italic numbers represent that the differences are not significant, in which “P>0.05” stands for the difference that did not pass the significance test of 95 %.
According to the above comparison, the concurrent changes in cloud properties along with heavy rainfall show consistent results using the two aerosol indicators (AOD and CDNC). The pollution corresponds to the increase in CF, ice COT, liquid and ice CWP but the decrease in cloud top height (the increase in CTP corresponds to the decrease in cloud top height) and ice CER. The liquid COT and liquid CER are also increased with the enhanced pollution in the AOD analysis. Besides, the above-mentioned results exhibit significance when we limited the moisture to the drier condition (SH less than the 25th percentile) or intermediate condition (SH between the 25th and 75th percentiles). When the moisture is higher (SH more than the 75th percentile), the change in CTP becomes insignificant based on CDNC.
According to these results, we made the following speculation: first, the CF, liquid and ice COT and CWP increase with pollution, because the aerosols serving as CCN can nucleate a larger number of cloud droplets which in a moisture-sufficient environment can hold more liquid water in the cloud. Second, the CTP increases (the cloud top height decreases) under pollution, because the earlier start of the precipitation process (Fig. 3) inhibits the vertical growth of clouds. Third, the ice CER decreases under pollution using either AOD or CDNC, because the increased cloud droplet number leads to more cloud droplets transforming into ice crystals and causes the decrease in ice CER (Chylek et al., 2006; Zhao et al., 2018; Gryspeerdt et al., 2018). However, the results of liquid CER might have uncertainties. The liquid CER is increased when AOD increases (Fig. 9), which might be related to the aerosol humidification effect, the misdetection of AOD and cloud water, and the earlier formation of the clouds and precipitation on the polluted days. Since we cannot distinguish the liquid part of mixed-phase clouds from liquid (warm) clouds in the observation, the above-mentioned change in liquid cloud properties might come from that of both the liquid (warm) clouds and the liquid part of mixed-phase clouds. Likewise, the above-mentioned change in ice cloud properties might come from that of both ice (cold) clouds and the ice part of mixed-phase clouds. Currently the physical processes of cold clouds and mixed-phase clouds have not been clarified yet, including the diffusional growth, accretion, riming and melting process of ice precipitation (Cheng et al., 2007, 2010), which needs numerical model simulations to be further explored.
4.2 Sensitivities to CCN (represented by CDNC) and moisture
Section 3.3 has shown that the diurnal variation of heavy rainfall with more moisture supply is similar to the changes in heavy rainfall with more sulfate aerosols. We assume that the moisture under the cloud base and the sulfate serving as CCN both influence the cloud properties (Yuan et al., 2008; Jiang et al., 2008; Jung et al., 2013; Qiu et al., 2017). To identify the effect of CCN on clouds and its sensitivity to moisture, using CDNC to represent CCN, we purposely investigated the changes in above-cloud properties on the different conditions of the CDNC and the low-level moisture (SH at 850 hPa), respectively.
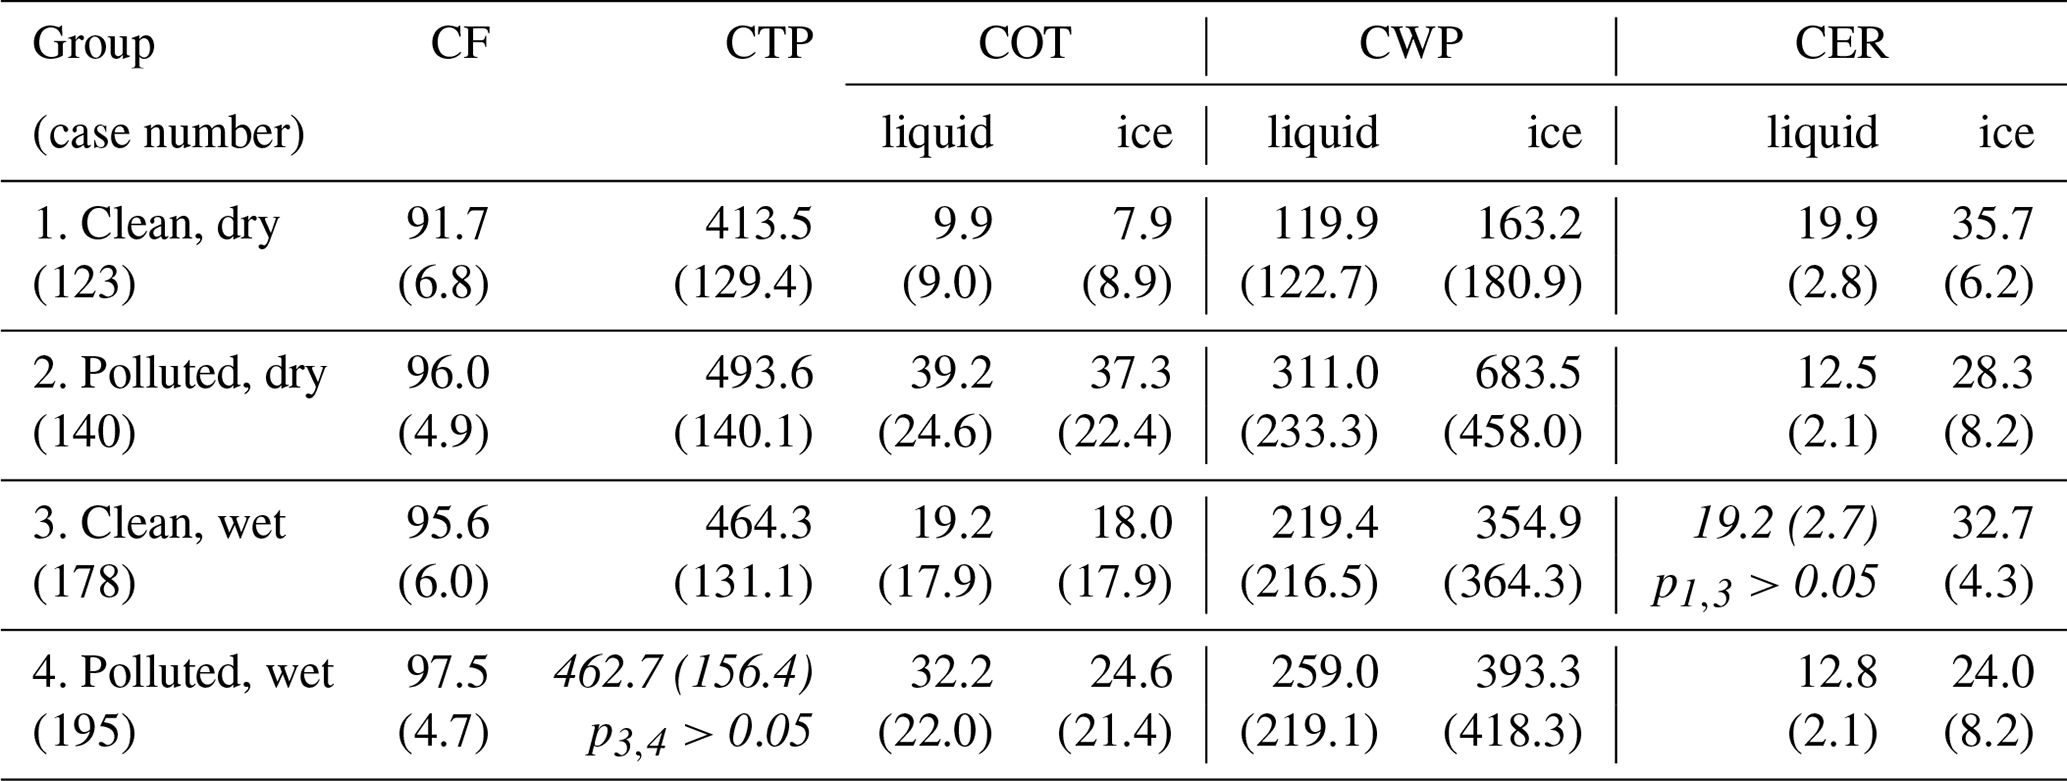
We categorized all cases of heavy rainfall into four groups, which are (1) clean and dry, (2) polluted and dry, (3) clean and wet, and (4) polluted and wet, and checked the changes in the above-cloud properties, as shown in Table 5. To retrieve the comparable samples, here “clean/polluted” refers to the CDNC on that day less/more than the 25th/75th percentile of the CDNC among the heavy rainfall days, and similarly, “dry/wet” refers to the SH on that day less/more than the 25th/75th percentile of itself among the heavy rainfall days. The average CDNC is 125.54 cm−3 on the dry condition and 120.71 cm−3 on the wet condition, and the average SH is 11.62 and 11.73 g kg−1 on the clean and polluted conditions, respectively; thus, we consider the CDNC or SH to remain almost the same when the other condition changes. We tested the significance of differences between groups 1 and 2, groups 1 and 3, groups 2 and 4, and groups 3 and 4. Because the CF is fixed above 80 % when calculating the CDNC (see in Sect. 2.1.3), here the selected groups all belong to the condition of higher CF.
Comparing the results of groups 1 and 2, which are both on the dry condition, we can identify the influence of CDNC on the cloud properties, which represents the effect of CCN. The changes in these cloud variables are the same as that in Sect. 4.1, that the CF, ice COT and liquid and ice CWP are increased on the polluted condition while the cloud top height and ice CER are decreased based on CDNC. Among these variables, the ice COT and liquid and ice CWP are especially larger on the polluted condition, which are 3–5 times larger than that on the clean condition (Table 5). On the wet condition, comparing groups 3 and 4, the changes are similar in that the CF, ice COT and liquid and ice CWP are increased and the ice CER is decreased, but the change in CTP becomes insignificant. However, the changes in these variables on the dry condition are evidently greater than that on the wet condition, which indicates that these cloud properties might be more sensitive to CDNC on the dry condition. The above comparisons indicate that with the increase in CDNC (CCN), the CF, ice COT and liquid and ice CWP are increased, while the ice CER is decreased regardless of the moisture amount.
Comparing the results of groups 1 and 3, we can get the changes in cloud properties related only to moisture on the same clean condition. A common feature is that CF, CTP, COT and CWP both for liquid and ice exhibit increases along with the increase in moisture. Compared with the CTP on the clean and dry condition, it increases on both polluted and dry condition (group 2) and clean and wet condition (group 3), but on the former condition its increase is larger, which indicates that the influence of moisture on CTP might be secondary compared to the CDNC (CCN) effect. Similarly, comparing the COT/CWP in groups 2 and 3 to that in group 1, the increases in COT and CWP both for liquid and ice in group 2 are much larger than that in group 3, which indicates that the influences of moisture on COT and CWP may not overcome the influence of CCN. With the increase in moisture, the change in liquid CER is not significant on the same clean condition, but the ice CER is significantly decreased. On the polluted condition, comparing groups 2 and 4, we found the COT and CWP both for liquid and ice on the wet condition are evidently smaller than that on the dry condition, which indicates that increasing the moisture might partly compensate for the influence of CDNC (CCN) on COT/CWP. Besides, the liquid CER exhibits a slight increase with increased moisture in the same polluted environment, which may further support the idea that the increased CCN could nucleate more cloud water with increased moisture.
The results above indicate that both CDNC (CCN) and moisture have impacts on cloud properties. They both contribute to the increases in CF, CTP, COT and CWP, in which the influences of CDNC (CCN) on COT and CWP are significantly larger than moisture. The increases in both CDNC and moisture correspond to the significant decrease in ice CER, while only the increase in CDNC corresponds to the decrease in liquid CER, and that might be ascribed to the calculation method of CDNC. To reduce the uncertainties, we have tested the SH at different levels (e.g., 700 and 800 hPa) and different moisture indicators (e.g., absolute humidity) to verify these results and found that most cloud variables show similar changes, except for the CTP and the liquid CER, which indicates that the changes in CTP and liquid CER are more sensitive and have larger uncertainties. Since the behaviors of cloud changes are similar along with the increase in either CDNC (CCN) or moisture but more sensitive to the former, the results in Sect. 4.1 might actually reflect the combined effect of CCN and moisture, and the aerosol (CCN) effect on these cloud properties might be dominant on the polluted days.
Therefore, considering the results from this subsection and Sect. 3.3 that with the increase in aerosols, the changes in cloud features become smaller in the higher moisture environment than that in the drier environment and the duration of heavy rainfall is relatively shortened when it is extremely wet (Sect. 3.3), we speculate that the sulfate (CCN) effect might be suppressed in a relatively wet environment. Due to the limitations of observational study, we currently cannot figure out the respective roles of aerosols and moisture.
According to all the above results, we have made hypotheses about the aerosol effects on the heavy rainfall over the BTH region. In Sect. 3.1 we found that the heavy rainfall has earlier start and peak times and a longer duration on the polluted condition. And afterwards, the earlier start of rainfall under pollution was found to be related to absorbing aerosols mainly referring to BC (Figs. 4a and 6a). We also compared the effect of BC on the associated clouds. Figure 10a shows that the CF larger than 90 % rarely occurs in the more BC environment, which might be associated with the semi-direct effect of BC (Ackerman, 2000) or the fact that estimated inversion strength and BC co-vary. This result indicates that the influence of BC on the heavy rainfall in Fig. 6a is mainly due to the radiative effect rather than the cloud effect. The mechanism of the BC effect on the heavy rainfall can be interpreted by our previous study (Zhou et al., 2018) as BC absorbs shortwave radiation during the daytime and warms the lower troposphere at around 850 hPa and then increases the instability of the lower to middle atmosphere (850–500 hPa), so that it enhances the local upward motion and moisture convergence. As a result, the BC-induced thermodynamic instability of the atmosphere triggers the occurrence of heavy rainfall in advance. Thus, the low-level heating effect of BC might play a dominant role in the beginning of rainfall, especially before the formation of clouds during the daytime.
The delayed start of heavy rainfall with scattering aerosols in Fig. 4a and more sulfate in Fig. 6b is consistent with many studies that both the radiative effect and cloud effect of sulfate-like aerosols could delay or suppress the occurrence of rainfall (Guo et al., 2013; Wang et al., 2016; Rosenfeld et al., 2014). Sulfate-like aerosols as scattering aerosols could prevent the shortwave radiation from arriving at the surface, thus cooling the surface and stabilizing the atmosphere, which suppresses the formation of rainfall (Guo et al., 2013; Wang et al., 2016). Sulfate-like aerosols serving as CCN can also suppress the rainfall by cloud effects by reducing the cloud droplet size and thus suppressing the collision–coalescence process of cloud droplets (Albrecht, 1989; Rosenfeld et al., 2014). Figure 10b shows that in contrast with BC, the CF larger than 90 % is significantly increased in the more sulfate environment, which indicates that the sulfate-like aerosols might have more evident influence on the clouds and that subsequently the rainfall changes associated with sulfate are probably due to the cloud effects. Another significant feature is the longer duration of heavy rainfall in the scattering aerosol cases, more sulfate cases and high moisture cases (Figs. 4c, 6b and 7a). We speculate that the longer duration is caused by both the cloud effect of sulfate-like aerosols and the increased moisture supply, because increasing either CCN or the moisture can increase cloud water (Sect. 4.2), which could lead to the longer rainfall duration. To further investigate the mechanism of longer duration, we need the assistance of numerical model simulations in future work.
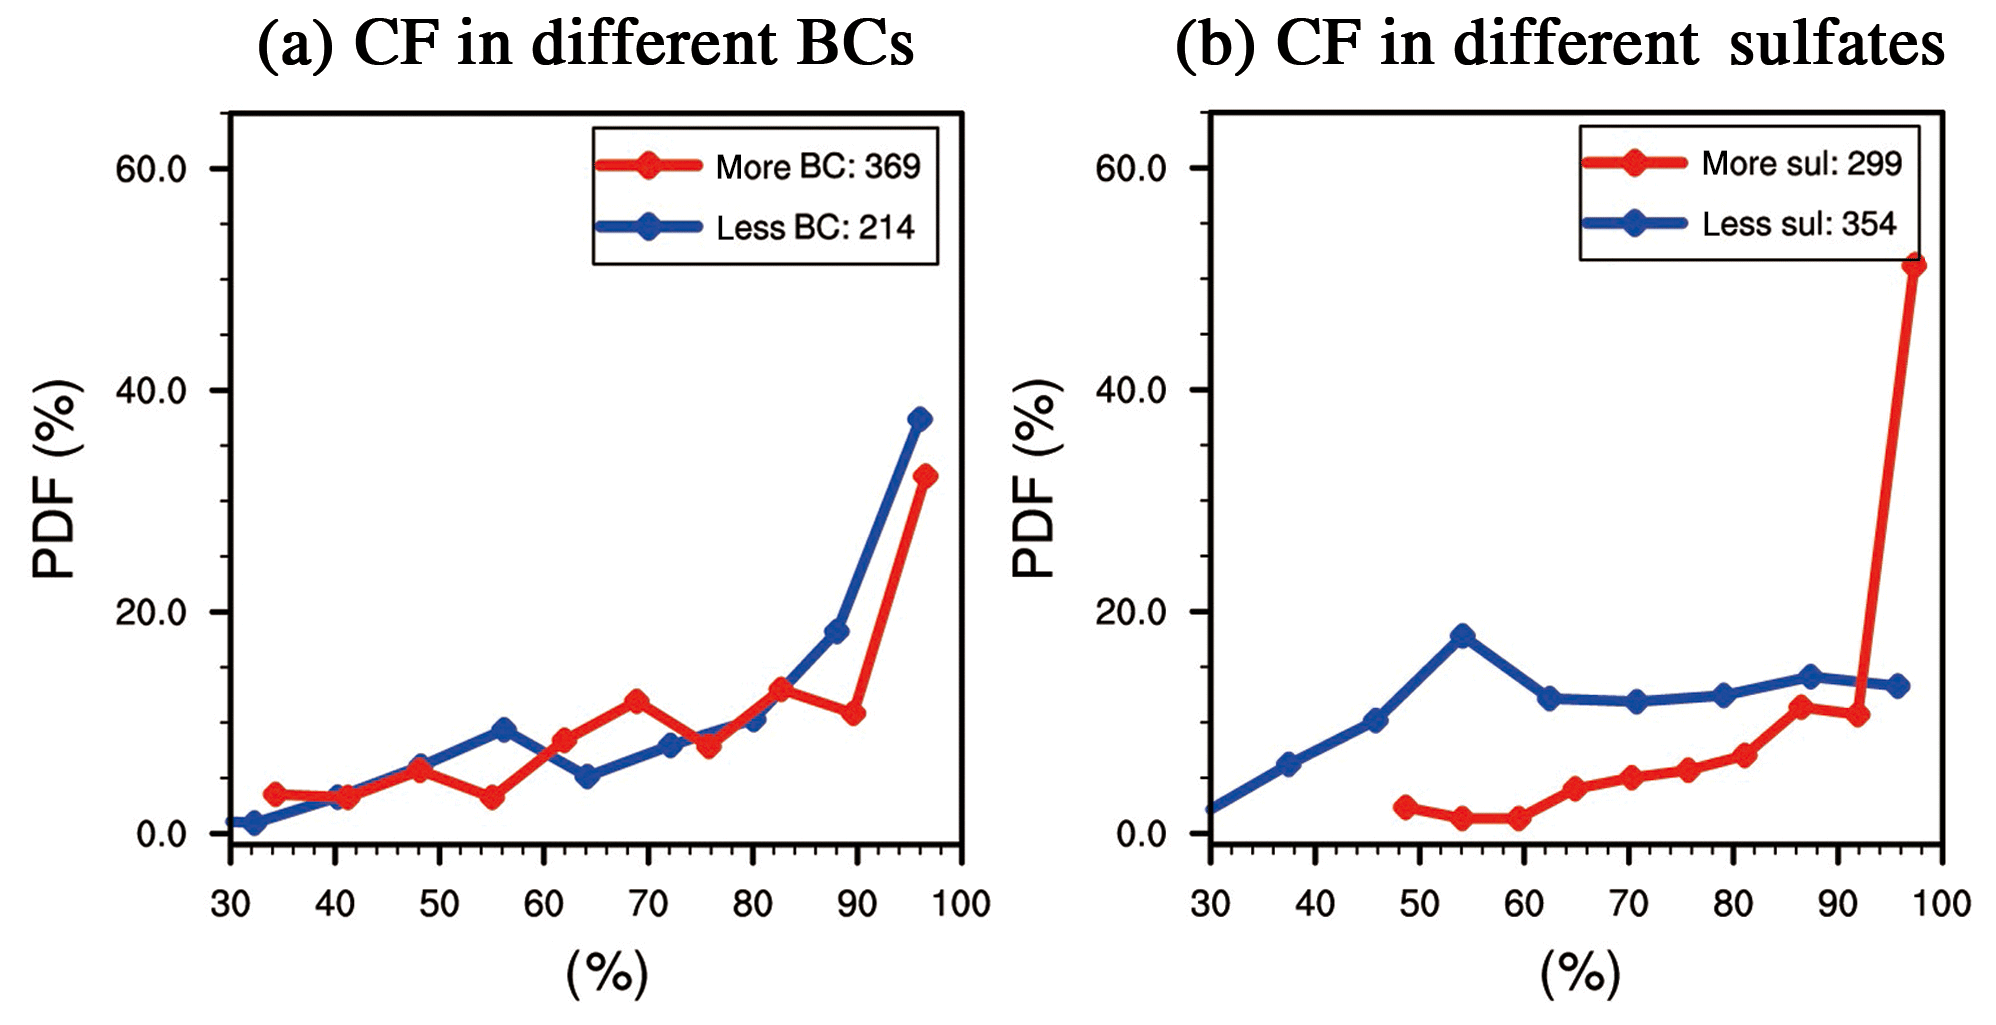
Figure 10PDFs of CF (units: %, data from MODIS), respectively, for the conditions of less BC/sulfate (blue lines, AOD of BC/sulfate less than the 25th percentile, data from MACC) and more BC/sulfate (red lines, AOD of BC/sulfate more than the 75th percentile, data from MACC) cases with heavy rainfall during 10 early summers (2003–2012).
Accordingly, we speculate that the earlier start time of heavy rainfall related to absorbing aerosols (BC) is due to the radiative heating of absorbing aerosols, while the longer rainfall duration is probably caused by both the cloud effect of sulfate-like aerosols and the increased moisture supply. As a summary we use a schematic diagram (Fig. 11) to illustrate how aerosols modify the heavy rainfall in the meteorological background of southwesterly flow over the BTH region. On the one hand, BC heats the lower troposphere, changing the thermodynamic condition of the atmosphere, which increases the upward motion and accelerates the formation of clouds and rainfall. On the other hand, the increased upward motion transports more sulfate-like particles and moisture into the clouds, so that the increased aerosols serving as CCN could nucleate more cloud water, thus prolonging the duration of rainfall. As a result, the earlier start and peak times and longer duration of heavy rainfall over the BTH region might be due to the combined effect of the aerosol radiative effect and aerosol cloud effect. To further verify the individual effect, we need to conduct numerical model simulations in our future study.
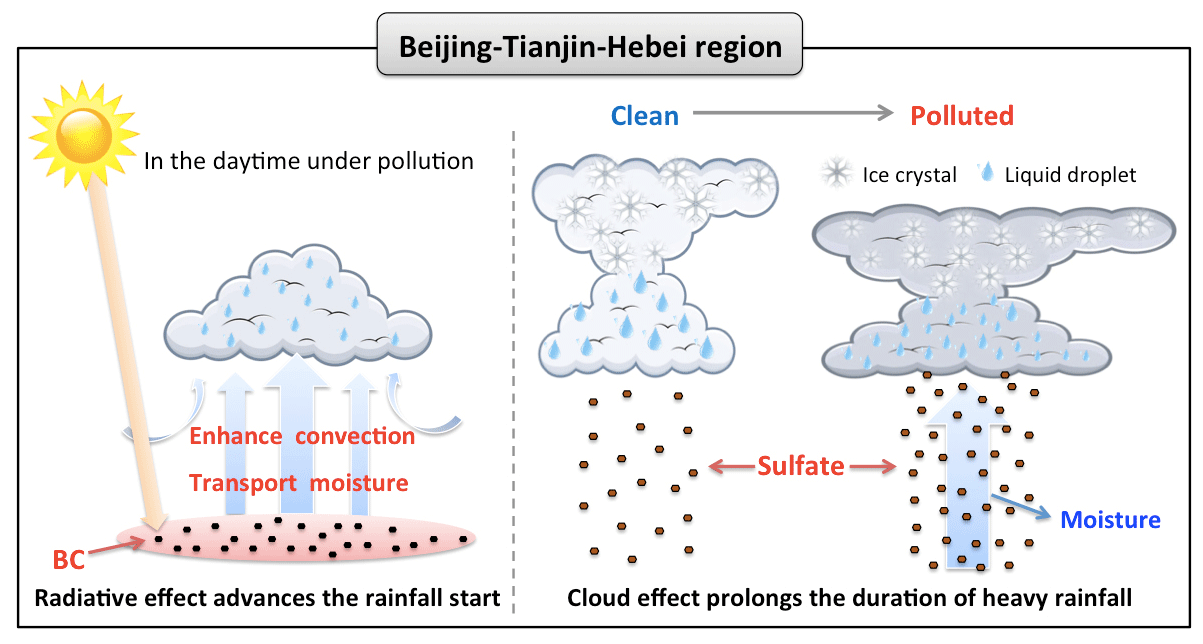
Figure 11A schematic diagram for aerosol impacts on heavy rainfall over the Beijing–Tianjin–Hebei region.
6.1 Discussion
In this study we used two aerosol indicators, AOD and CDNC, which discriminate the pollution levels for different purposes. AOD is a good proxy for the large-scale pollution level, but it stands for the optical feature of aerosols and cannot well represent CCN when we focused on the aerosol–cloud interaction (Shinozuka et al., 2015). CDNC is a better proxy for CCN compared with AOD, which facilitates the study on the cloud changes associated with aerosol pollution. But the retrieved CDNC has larger uncertainties. First, the assumptions in the calculation of CDNC are idealized that CDNC is constant with height in a cloud and cloud liquid water increases monotonically in an adiabatic environment (Grosvenor et al., 2018), but the target of this study is the convective clouds with rainfall that may be not consistent with the adiabatic assumption. Second, as indicated by Grosvenor et al. (2018), the uncertainties in the pixel-level retrievals of CDNC from MODIS with spatial resolution can be above 54 %, which come from the uncertainties of parameters and the original COT and CER data used in the calculation, and also the influence of the heterogeneity effect from thin clouds. To reduce the influence of the heterogeneity effect as much as possible, we have attempted to limit the conditions of CF, liquid COT and CER when calculating CDNC in the study. Besides, this study primarily focuses on the relative changes in CDNC, which may also be influenced by the potential systematic biases in the CDNC calculation, but actually reduced the uncertainties of absolute values. Another problem with CDNC in this study is that the CDNC could be influenced by updraft velocity because both increased CCN and updraft velocity could enhance aerosol activation and increase CDNC (Reutter et al., 2009). Since we cannot get any in-cloud long-term updraft data, we used the vertical velocity at 850 hPa obtained from ERA-Interim reanalysis data to roughly represent the cloud base updraft and investigated the possible relationship between CDNC and updraft. The results show that there is no significant correlation between CDNC and vertical velocity, although the updraft is relatively intensified in the polluted cases. We also examined the change in rainfall based on CDNC under three certain ranges of vertical velocity (less than the 25th percentile, between the 25th and 75th percentiles and more than the 75th percentile) and found that the primary results are similar.
In addition to AOD and CDNC, we also applied ultraviolet AI and AOD of BC/sulfate to identify different types of aerosols. We found that the AI has a weak positive correlation with AOD from MODIS, which indicates the results on absorbing aerosol days might represent the results on polluted days if identified by AOD. To avoid the uncertainty, we re-examined the results using AI when removing the polluted cases identified by AOD and found that the major results remain. The comparisons of BC/sulfate AOD cases also have uncertainties because they are retrieved from MACC reanalysis data. Although the above four indicators have their own uncertainties, currently we cannot find more reliable datasets in a long-term observational record. The major findings using these four indices could well identify the changes in rainfall and clouds accompanied by aerosols, but are insufficient to clarify the aerosol effect on clouds and precipitation.
This study has clearly identified the relationship of the aerosol pollution and the diurnal changes in heavy rainfall and associated clouds over the BTH region. However, although this work has attempted to exclude the impacts from the meteorological background, particularly circulation and moisture, the observation study still has its limitations on studying aerosol effects on rainfall and clouds: first, the observational datasets have their noise and uncertainty, including the misdetection of CF in the satellite product when AOD is large (Brennan et al., 2005; Levy et al., 2013) and the mutual interference between liquid and ice clouds (Holz et al., 2008; Platnick et al., 2017); second, the meteorological co-variations cannot be completely removed, thus bringing uncertainties of the results: e.g., the meteorology might affect the relationship between AOD and CF (Quaas et al., 2010; Grandey et al., 2013) and the relationship between AOD and CTP (Gryspeerdt et al., 2014a); third, the different types of aerosols cannot be completely well separated, although we used the AI index and AOD of BC/sulfate to identify the respective effects of absorbing aerosols and scattering aerosols. In addition, we selected the extreme ranges of AOD / CDNC to compare the characteristics of heavy rainfall and associated clouds, which could bring such uncertainties that these extreme conditions might be related to distinct microphysical processes or meteorological backgrounds. We further examined the results using the middle range of AOD and CDNC such as 25th–50th percentile versus 50th–75th percentile. The results are basically the same except that the peak time change is not significant based on AOD. Numerical model simulations are necessarily applied to further study on the specific impact of aerosols on the heavy rainfall. And the detailed processes of aerosol effect on the precipitation formation of mixed-phase and cold clouds also needs further exploration in our future study.
6.2 Conclusions
Using the gauge-based hourly rainfall records, aerosol and cloud satellite products and high temporal resolution reanalysis datasets during 2002–2012, this study investigated the different characteristics of heavy rainfall on the diurnal timescale on the clean and polluted conditions, respectively. Based on the macro and micro aerosol indicators, including AOD from the MODIS aerosol product and calculated CDNC from the MODIS cloud product, three significant features of heavy rainfall diurnal change associated with aerosols are found; that is, the rainfall start and peak times occur earlier and the duration becomes longer under pollution.
The different relationships of absorbing/scattering aerosols and the heavy rainfall diurnal changes were distinguishable using ultraviolet AI from OMI and reanalysis AOD of two aerosol types (BC and sulfate). The absorbing aerosols (BC) correspond to the earlier start and peak times of heavy rainfall, while the scattering aerosols (sulfate) correspond to the delayed start time and the longer duration. Considering the plausible effect of moisture, further analysis indicates that the duration of heavy rainfall in the presence of more sulfate is prolonged on the relatively dry condition, but is shortened on the extremely wet condition.
By comparing the characteristics of cloud macrophysics and microphysics variables, using both AOD and CDNC we found that the CF, ice COT, and liquid and ice CWP are increased on the polluted condition but that the cloud top height and the ice CER are reduced. Liquid COT and liquid CER are also increased in the AOD analysis. Comparing the influences of CDNC, which represents CCN, and SH at 850 hPa, which represents moisture, respectively, on these cloud variables, the cloud properties show consistent changes with the increase in CDNC and moisture, but are more sensitive to the CDNC (CCN).
According to these results, we speculate that both aerosol radiative effect and cloud effect have impacts on the diurnal variation of heavy rainfall over the BTH region. The heating effect of absorbing aerosols, especially BC, increases the instability of the lower to middle atmosphere so that it generates the heavy rainfall occurrence in advance. And with the sufficient moisture supply, the increased aerosols could nucleate more liquid water in the cloud, leading to the longer duration of heavy rainfall.
The Terra MODIS Level-3 aerosol and cloud datasets were acquired from the Level-1 and Atmosphere Archive & Distribution System Distributed Active Archive Center (LAADS DAAC) (https://ladsweb.modaps.eosdis.nasa.gov, last access: 25 April 2020). The ultraviolet AI data from OMI were obtained from the web page https://daac.gsfc.nasa.gov/datasets?keywords=OMI&page=1 (last access: 25 April 2020). The MACC-II and ERA-Interim reanalysis datasets were obtained from the ECMWF website (https://apps.ecmwf.int/datasets, last access: 25 April 2020).
JY and SZ conceived the study. SZ processed data and drew the figures. SZ and JY analyzed the observational results and WCW, CZ and DG gave professional guidance. PS provided the hourly precipitation dataset. SZ and JY prepared the manuscript with contributions from WCW and CZ.
The authors declare that they have no conflict of interest.
The authors are grateful for the financial support from the National Key R&D Program of China and the National Natural Science Foundation of China. Wei-Chyung Wang acknowledges the support of grants (to SUNYA) from the Office of Sciences (BER), U.S. DOE and the U.S. National Science Foundation in support of the Partnership for International Research and Education project at the University at Albany. Siyuan Zhou thanks the Chinese Scholarship Council for a visiting student scholarship at the University at Albany, State University of New York. We deeply appreciate two anonymous referees for their in-depth comments and constructive suggestions.
This study is supported by funds from the National Key R&D Program of China (grant nos. 2016YFA0602401, 2017YFC1501403, and 2018YFC1505903), the National Natural Science Foundation of China (grant nos. 41775071 and 41621061), and the U.S. National Science Foundation (grant no. 1545917).
This paper was edited by Philip Stier and reviewed by two anonymous referees.
Ackerman, A. S.: Reduction of Tropical Cloudiness by Soot, Science, 288, 1042–1047, https://doi.org/10.1126/science.288.5468.1042, 2000.
Albrecht, B. A.: Aerosols, cloud microphysics, and fractional cloudiness, Science, 245, 1227–1230, https://doi.org/10.1126/science.245.4923.1227, 1989.
Altaratz, O., Bar-Or, R. Z., Wollner, U., and Koren, I.: Relative humidity and its effect on aerosol optical depth in the vicinity of convective clouds, Environ. Res. Lett., 8, 034025, https://doi.org/10.1088/1748-9326/8/3/034025, 2013.
Anonymous: Atmospheric Sciences Thesaurus, China Meteorological Press: Beijing, China, 1994 (in Chinese).
Benedetti, A., Morcrette, J. J., Boucher, O., Dethof, A., Engelen, R. J., Fisher, M., Flentje, H., Huneeus, N., Jones, L., Kaiser, J. W., Kinne, S., Mangold, A., Razinger, M., Simmons, A. J., and Suttie, M.: Aerosol analysis and forecast in the European Centre for Medium-Range Weather Forecasts Integrated Forecast System: 2. Data assimilation, J. Geophys. Res., 114, D13205, https://doi.org/10.1029/2008JD011115, 2009.
Brennan, J., Kaufman, Y., Koren, I., and Rong, L.: Aerosol-cloud interaction-Misclassification of MODIS clouds in heavy aerosol, IEEE T. Geosci. Remote, 43, 911–915, https://doi.org/10.1109/TGRS.2005.844662, 2005.
Bennartz, R. and Rausch, J.: Global and regional estimates of warm cloud droplet number concentration based on 13 years of AQUA-MODIS observations, Atmos. Chem. Phys., 17, 9815–9836, https://doi.org/10.5194/acp-17-9815-2017, 2017.
Bennartz, R.: Global assessment of marine boundary later cloud droplet number concentration from satellite, J. Geophys. Res., 112, D02201, https://doi.org/10.1029/2006JD007547, 2007.
Boers, R., Acarreta, J. A., and Gras, J. L.: Satellite monitoring of the first indirect aerosol effect: Retrieval of the droplet concentration of water clouds, J. Geophys. Res., 111, D22208, https://doi.org/10.1029/2005JD006838, 2006.
Boucher, O. and Quaas, J.: Water vapour affects both rain and aerosol optical depth, Nat. Geosci., 6, 4–5, https://doi.org/10.1038/ngeo1692, 2012.
Brenguier, J. L.: Parameterization of the condensation process – a theoretical approach, J. Atmos. Sci., 48, 264–282, https://doi.org/10.1175/1520-0469(1991)048<0264:POTCPA>2.0.CO;2, 1991.
Brenguier, J.-L., Pawlowska, H., Schüller, L., Preusker, R., Fischer, J., and Fouquart, Y.: Radiative properties of boundary layer clouds: Droplet effective radius versus number concentration, J. Atmos. Sci., 57, 803–821, https://doi.org/10.1175/1520-0469(2000)057<0803:RPOBLC>2.0.CO;2, 2000.
Chen, Q., Yin, Y., Jin, L., Xiao, H., and Zhu, S.: The effect of aerosol layers on convective cloud microphysics and precipitation, Atmos. Res., 101, 327–340, https://doi.org/10.1016/j.atmosres.2011.03.007, 2011.
Cheng, C. T., Wang, W. C., and Chen, J. P.: A modeling study of aerosol impacts on cloud microphysics and radiative properties, Q. J. Roy. Meteor. Soc., 133, 283–297, https://doi.org/10.1002/qj.25, 2007.
Cheng, C. T., Wang, W. C., and Chen, J. P.: Simulation of the effects of increasing cloud condensation nuclei on mixed-phase clouds and precipitation of a front system, Atmos. Res., 96, 461–476, https://doi.org/10.1016/j.atmosres.2010.02.005, 2010.
Chylek, P., Dubey, M. K., Lohmann, U., Ramanathan, V., Kaufman, Y. J., Lesins, G., Hudson, J., Altmann, G., and Olsen, S.: Aerosol indirect effect over the Indian Ocean, Geophys. Res. Lett., 33, L06806, https://doi.org/10.1029/2005GL025397, 2006.
Dee, D. P., Uppala, S. M., Simmons, A. J., Berrisford, P., Poli, P., Kobayashi, S., Andrae, U., Balmaseda, M. A., Balsamo, G., Bauer, P., Bechtold, P., Beljaars, A. C. M., van de Berg, I., Biblot, J., Bormann, N., Delsol, C., Dragani, R., Fuentes, M., Greer, A. J., Haimberger, L., Healy, S. B., Hersbach, H., Holm, E. V., Isaksen, L., Kallberg, P., Kohler, M., Matricardi, M., McNally, A. P., Mong-Sanz, B. M., Morcette, J.-J., Park, B.-K., Peubey, C., de Rosnay, P., Tavolato, C., Thepaut, J. N., and Vitart, F.: The ERA-Interim reanalysis: Configuration and performance of the data assimilation system, Q. J. Roy. Meteorol. Soc., 137, 553–597, https://doi.org/10.1002/qj.828, 2011.
Fan, J. W., Rosenfeld, D., Yang, Y., Zhao, C., Leung, L. R., and Li, Z. Q.: Substantial contribution of anthropogenic air pollution to catastrophic floods in Southwest China, Geophys. Res. Lett., 42, 6066–6075, https://doi.org/10.1002/2015GL064479, 2015.
Garrett, T. J. and Zhao, C.: Increased Arctic cloud longwave emissivity associated with pollution from mid-latitudes, Nature, 440, 787–789, https://doi.org/10.1038/nature04636, 2006.
Givati, A. and Rosenfeld, D.: Quantifying precipitation suppression due to air pollution, J. Appl. Meteor., 43, 1038–1056, https://doi.org/10.1175/1520-0450(2004)043< 1038:QPSDTA> 2.0.CO;2, 2004.
Grandey, B. S. and Stier, P.: A critical look at spatial scale choices in satellite-based aerosol indirect effect studies, Atmos. Chem. Phys., 10, 11459–11470, https://doi.org/10.5194/acp-10-11459-2010, 2010.
Grandey, B. S., Stier, P., and Wagner, T. M.: Investigating relationships between aerosol optical depth and cloud fraction using satellite, aerosol reanalysis and general circulation model data, Atmos. Chem. Phys., 13, 3177–3184, https://doi.org/10.5194/acp-13-3177-2013, 2013.
Grosvenor, D. P., Sourdeval, O., Zuidema, P., Ackerman, A., Alexandrov, M. D., Bennartz, R., Boers, R., Cairns, B., Chiu, J. C., Christensen, M., Deneke, H., Diamond, M., Feingold, G., Fridlind, A., Hünerbein, A., Knist, C., Kollias, P., Marshak, A., McCoy, D., Merk, D., Painemal, D., Rausch, J., Rosenfeld, D., Russchenberg, H., Seifert, P., Sinclair, K., Stier, P., van Diedenhoven B., Wendisch, M., Werner, F., Wood, R., Zhang, Z., and Quaas, J.: Remote Sensing of Droplet Number Concentration in Warm Clouds: A Review of the Current State of Knowledge and Perspectives, Rev. Geophys., 56, 409–453, https://doi.org/10.1029/2017rg000593, 2018.
Gryspeerdt, E., Sourdeval, O., Quaas, J., Delanoë, J., Krämer, M., and Kühne, P.: Ice crystal number concentration estimates from lidar–radar satellite remote sensing – Part 2: Controls on the ice crystal number concentration, Atmos. Chem. Phys., 18, 14351–14370, https://doi.org/10.5194/acp-18-14351-2018, 2018.
Gryspeerdt, E., Stier, P., and Grandey, B. S.: Cloud fraction mediates the aerosol optical depth-cloud top height relationship, Geophys. Res. Lett., 41, 3622–3627, https://doi.org/10.1002/2014GL059524, 2014a.
Gryspeerdt, E., Stier, P., and Partridge, D. G.: Links between satellite-retrieved aerosol and precipitation, Atmos. Chem. Phys., 14, 9677–9694, https://doi.org/10.5194/acp-14-9677-2014, 2014b.
Gunthe, S. S., Rose, D., Su, H., Garland, R. M., Achtert, P., Nowak, A., Wiedensohler, A., Kuwata, M., Takegawa, N., Kondo, Y., Hu, M., Shao, M., Zhu, T., Andreae, M. O., and Pöschl, U.: Cloud condensation nuclei (CCN) from fresh and aged air pollution in the megacity region of Beijing, Atmos. Chem. Phys., 11, 11023–11039, https://doi.org/10.5194/acp-11-11023-2011, 2011.
Guo, C. W., Xiao, H., Yang, H. L., and Tang, Q.: Observation and modeling analyses of the macro-and microphysical characteristics of a heavy rain storm in Beijing, Atmos. Res., 156, 125–141, https://doi.org/10.1016/j.atmosres.2015.01.007, 2015.
Guo, J. P., Deng, M. J., Lee, S. S., Wang, F., Li, Z. Q., Zhai, P. M., Liu, H., Lv, W., Yao, W., and Li, X. W.: Delaying precipitation and lightning by air pollution over the Pearl River Delta, Part I: Observational analyses, J. Geophys. Res., 121, 6472–6488, https://doi.org/10.1002/2015JD023257, 2016.
Guo, L., Highwood, E. J., Shaffrey, L. C., and Turner, A. G.: The effect of regional changes in anthropogenic aerosols on rainfall of the East Asian Summer Monsoon, Atmos. Chem. Phys., 13, 1521–1534, https://doi.org/10.5194/acp-13-1521-2013, 2013.
Guo, X. L., Fu, D. H., Guo, X., and Zhang, C. M.: A case study of aerosol impacts on summer convective clouds and precipitation over northern China, Atmos. Res., 142, 142–157, https://doi.org/10.1016/j.atmosres.2013.10.006, 2014.
Hammer, M. S., Martin, R. V., Li, C., Torres, O., Manning, M., and Boys, B. L.: Insight into global trends in aerosol composition from 2005 to 2015 inferred from the OMI Ultraviolet Aerosol Index, Atmos. Chem. Phys., 18, 8097–8112, https://doi.org/10.5194/acp-18-8097-2018, 2018.
Harikishan, G., Padmakumari, B., Maheskumar, R. S., Pandithurai, G., and Min, Q. L.: Aerosol indirect effects from ground-based retrievals over the rain shadow region in Indian subcontinent, J. Geophys. Res., 121, 2369–2382, https://doi.org/10.1002/2015JD024577, 2016.
Higgins, R. W., Yao, Y., Yarosh, E. S., Janowiak, J. E., and Mo, K. C.: Influence of the Great Plains low-level jet on summertime precipitation and moisture transport over the central United States, J. Climate, 10, 481–507, https://doi.org/10.1175/1520-0442(1997)010<0481:IOTGPL>2.0.CO;2, 1997.
Holz, R. E., Ackerman, S. A., Nagle, F. W., Frey, R., Dutcher, S., Kuehn, R. E., Vaughan, M. A., and Baum, B.: Global Moderate Resolution Imaging Spectroradiometer (MODIS) cloud detection and height evaluation using CALIOP, J. Geophys. Res., 113, D00A19, https://doi.org/10.1029/2008JD009837, 2008.
IPCC: IPCC fifth assessment report, Weather, 68, 310–310, 2013.
Jacobson, M. Z.: Strong radiative heating due to the mixing state of black carbon in atmospheric aerosols, Nature, 409, 695–697, https://doi.org/10.1038/35055518, 2001.
Jiang, H., Feingold, G., and Cotton, W. R.: Simulations of aerosol-cloud-dynamical feedbacks resulting from entrainment of aerosol into the marine boundary layer during the Atlantic Stratocumulus Transition Experiment, J. Geophys. Res., 107, 4813, https://doi.org/10.1029/2001JD001502, 2002.
Jiang, J. H., Su, H., Schoeberl, M. R., Massie, S. T., Colarco, P., Platnick, S., and Livesey, N. J.: Clean and polluted clouds: Relationships among pollution, ice clouds, and precipitation in South America, Geophys. Res. Lett., 35, L14804, https://doi.org/10.1029/2008GL034631, 2008.
Jiang, M. J., Li, Z. Q., Wan, B. C., and Cribb, M.: Impact of aerosols on precipitation from deep convective clouds in eastern China, J. Geophys. Res., 121, 9607–9620, https://doi.org/10.1002/2015JD024246, 2016.
Jung, W. S., Panicker, A. S., Lee, D. I., and Park, S. H.: Estimates of aerosol indirect effect from Terra MODIS over Republic of Korea, Adv. Meteorol., 2013, 976813, https://doi.org/10.1155/2013/976813, 2013.
Kim, K.-M., Lau, K. M., Sud, Y. C., and Walker, G. K.: Influence of aerosol radiative forcings on the diurnal and seasonal cycles of rainfall over West Africa and Eastern Atlantic Ocean using GCM simulation, Clim. Dynam., 35, 115–126, https://doi.org/10.1007/s00382-010-0750-1, 2010.
Lau, K. M., Kim, M. K., and Kim, K. M.: Asian summer monsoon anomalies induced by aerosol direct forcing: the role of the Tibetan Plateau, Clim. Dynam., 26, 855–864, https://doi.org/10.1007/s00382-006-0114-z, 2006.
Lee, S. S., Donner, L. J., and Phillips, V. T. J.: Impacts of aerosol chemical composition on microphysics and precipitation in deep convection, Atmos. Res., 94, 220–237, https://doi.org/10.1016/j.atmosres.2009.05.015, 2009.
Lee, S. S., Guo, J., and Li, Z: Delaying precipitation by air pollution over the Pearl River Delta: 2. Model simulation, J. Geophys. Res., 121, 11739–11760, https://doi.org/10.1002/2015JD024362, 2016.
Lelieveld, J. and Heintzenberg, J.: Sulfate cooling effect on climate through in-cloud oxidation of anthropogenic SO2, Science, 258, 117–120, https://doi.org/10.1126/science.258.5079.117, 1992.
Levy, R. C., Mattoo, S., Munchak, L. A., Remer, L. A., Sayer, A. M., Patadia, F., and Hsu, N. C.: The Collection 6 MODIS aerosol products over land and ocean, Atmos. Meas. Tech., 6, 2989–3034, https://doi.org/10.5194/amt-6-2989-2013, 2013.
Li, H., Cui, X., Zhang, W., and Qiao, L.: Observational and dynamic downscaling analysis of a heavy rainfall event in Beijing, China during the 2008 Olympic Games, Atmos. Sci. Lett., 17, 368–376, https://doi.org/10.1002/asl.667, 2016.
Lim, K. S. and Hong, S.: Investigation of aerosol indirect effects on simulated flash-flood heavy rainfall over Korea, Meteor. Atmos. Phys., 118, 199–214, https://doi.org/10.1007/s00703-012-0216-6, 2012.
Liu, J., Wang, S., Zhang, W., and Wei, X.: Mechanism analysis of a strong convective weather in Hebei Province, Adv. Mar. Sci., 30, 9–16, 2012 (in Chinese).
Menzel, W. P., Frey, R. A., Zhang, H., Wylie, D. P., Moeller, C. C., Holz, R. E., Maddux, B., Baum, B. A., Strabala, K. I., and Gumley, L. E.: MODIS global cloud-top pressure and amount estimation: Algorithm description and results, J. Appl. Meteorol. Clim., 47, 1175–1198, https://doi.org/10.1175/2007JAMC1705.1, 2008.
Min, Q., Joseph, E., Lin, Y., Min, L., Yin, B., Daum, P. H., Kleinman, L. I., Wang, J., and Lee, Y.-N.: Comparison of MODIS cloud microphysical properties with in-situ measurements over the Southeast Pacific, Atmos. Chem. Phys., 12, 11261–11273, https://doi.org/10.5194/acp-12-11261-2012, 2012.
Nakajima, T. and King, M. D.: Determination of the optical thickness and effective particle radius of clouds from reflected solar radiation measurements – Part I: Theory, J. Atmos. Sci., 47, 1878–1893, https://doi.org/10.1175/1520-0469(1990)047<1878:DOTOTA>2.0.CO;2, 1990.
Panicker, A. S., Pandithurai, G., and Dipu, S.: Aerosol indirect effect during successive contrasting monsoon seasons over Indian subcontinent using MODIS data, Atmos. Environ., 44, 1937–1943, https://doi.org/10.1016/j.atmosenv.2010.02.015, 2010.
Platnick, S., Meyer, K., King, M. D., Wind, G., Amarasinghe, N., Marchant, B., Arnold, G. T., Zhang, Z., Hubanks, P. A., Holz, R. E., Yang, P., Ridgway, W. L., and Riedi, J.: The MODIS cloud optical and microphysical products: Collection 6 updates and examples from Terra and Aqua, IEEE T. Geosci. Remote, 55, 502–525, https://doi.org/10.1109/TGRS.2016.2610522, 2017.
Qian, Y., Gong, D. Y., Fan, J. W., Leung, L. R., Bennartz, R., Chen, D. L., and Wang, W. G.: Heavy pollution suppresses light rain in China: Observations and modeling, J. Geophys. Res., 114, D00K02, https://doi.org/10.1029/2008JD011575, 2009.
Qiu, Y., Zhao, C., Guo, J., and Li, J.: 8-Year ground-based observational analysis about the seasonal variation of the aerosol-cloud droplet effective radius relationship at SGP site, Atmos. Environ., 164, 139–146, https://doi.org/10.1016/j.atmosenv.2017.06.002, 2017.
Quaas, J., Boucher, O., Bellouin, N., and Kinne, S.: Satellite-based estimate of the direct and indirect aerosol climate forcing, J. Geophys. Res., 113, D05204, https://doi.org/10.1029/2007JD008962, 2008.
Quaas, J., Stevens, B., Stier, P., and Lohmann, U.: Interpreting the cloud cover – aerosol optical depth relationship found in satellite data using a general circulation model, Atmos. Chem. Phys., 10, 6129–6135, https://doi.org/10.5194/acp-10-6129-2010, 2010.
Reutter, P., Su, H., Trentmann, J., Simmel, M., Rose, D., Gunthe, S. S., Wernli, H., Andreae, M. O., and Pöschl, U.: Aerosol- and updraft-limited regimes of cloud droplet formation: influence of particle number, size and hygroscopicity on the activation of cloud condensation nuclei (CCN), Atmos. Chem. Phys., 9, 7067–7080, https://doi.org/10.5194/acp-9-7067-2009, 2009.
Rosenfeld, D., Lohmann, U., Raga, G. B., O'Dowd, C. D., Kulmala, M., Fuzzi, S., Reissell, A., and Andreae, M. O.: Flood or drought: How do aerosols affect precipitation?, Science, 321, 1309–1313, https://doi.org/10.1126/science.1160606, 2008.
Rosenfeld, D., Sherwood, S., Wood, R., and Donner, L.: Climate effects of aerosol-cloud interactions, Science, 343, 379–380, https://doi.org/10.1126/science.1247490, 2014.
Rosenfeld, D. and Woodley, W. L.: Convective clouds with sustained highly supercooled liquid water down to −37.5 ∘C, Nature, 405, 440–442, https://doi.org/10.1038/35013030, 2000.
Sassen, K., Starr, D., Mace, G. G., Poellot, M. R., Melfi, S. H., Eberhard, W. L., Spinhirne, J. D., Eloranta, E. W., Hagan, D. E., and Hallett, J.: The 5–6 December 1991 FIRE IFO II jet stream cirrus case study: Possible influences of volcanic aerosols, J. Atmos. Sci., 52, 97–123, https://doi.org/10.1175/1520-0469(1995) 052< 0097:TDFIIJ> 2.0.CO;2, 1995.
Shen, Y., Xiong, A., Wang, Y., and Xie, P.: Performance of high-resolution satellite precipitation products over China, J. Geophys. Res., 115, D02114, https://doi.org/10.1029/2009JD012097, 2010.
Sherwood, S.: Aerosols and ice particle size in tropical cumulonimbus, J. Clim., 15, 1051–1063, https://doi.org/10.1175/1520-0442(2002)015<1051:AAIPSI>2.0.CO;2, 2002.
Shinozuka, Y., Clarke, A. D., Nenes, A., Jefferson, A., Wood, R., McNaughton, C. S., Ström, J., Tunved, P., Redemann, J., Thornhill, K. L., Moore, R. H., Lathem, T. L., Lin, J. J., and Yoon, Y. J.: The relationship between cloud condensation nuclei (CCN) concentration and light extinction of dried particles: indications of underlying aerosol processes and implications for satellite-based CCN estimates, Atmos. Chem. Phys., 15, 7585–7604, https://doi.org/10.5194/acp-15-7585-2015, 2015.
Song, X. L. and Zhang, G. J.: Microphysics parameterization for connective clouds in a global climate model: Description and single-column model tests, J. Geophys. Res., 116, D02201, https://doi.org/10.1029/2010JD014833, 2011.
Sun, Y. L., Wang, Z. F., Du, W., Zhang, Q., Wang, Q. Q., Fu, P. Q., Pan, X. L., Li, J., Jayne, J., and Worsnop, D. R.: Long-term real-time measurements of aerosol particle composition in Beijing, China: seasonal variations, meteorological effects, and source analysis, Atmos. Chem. Phys., 15, 10149–10165, https://doi.org/10.5194/acp-15-10149-2015, 2015.
Tariq, S. and Ali, M.: Spatio–temporal distribution of absorbing aerosols over Pakistan retrieved from OMI onboard Aura satellite, Atmos. Pollut. Res., 6, 254–266, https://doi.org/10.5094/APR.2015.030, 2015.
Tao, M. H., Chen, L. F., Wang, Z. F., Tao, J. H., Che, H. Z., Wang, X. H., and Wang, Y.: Comparison and evaluation of the MODIS Collection 6 aerosol data in China, J. Geophys. Res., 120, 6992–7005, https://doi.org/10.1002/2015JD023360, 2015.
Tao, W. K., Chen, J. P., Li, Z., Wang, C., and Zhang, C.: Impact of aerosols on convective clouds and precipitation, Rev. Geophy., 50, RG2001, https://doi.org/10.1029/2011RG000369, 2012.
Torres, O., Bhartia, P. K., Herman, J. R., Ahmad, Z., and Gleason, J.: Derivation of aerosol properties from satellite measurements of backscattered ultraviolet radiation: Theoretical basis, J. Geophys. Res., 103, 17099–17110, https://doi.org/10.1029/98JD00900, 1998.
Twohy, C. H., Coakley, J. A., and Tahnk, W. R.: Effect of changes in relative humidity on aerosol scattering near clouds, J. Geophys. Res., 114, D05205, https://doi.org/10.1029/2008JD010991, 2009.
Twomey, S.: The influence of pollution on the shortwave albedo of clouds, J. Atmos. Sci., 34, 1149–1152, https://doi.org/10.1175/1520-0469(1977)034<1149:TIOPOT>2.0.CO;2, 1977.
Wang, J., Feng, J., Wu, Q., and Z. Yan, Z.: Impact of anthropogenic aerosols on summer precipitation in the Beijing-Tianjin-Hebei urban agglomeration in China: Regional climate modeling using WRF-Chem, Adv. Atmos. Sci., 33, 753–766, https://doi.org/10.1007/s00376-015-5103-x, 2016.
Wolyn, P. G. and Mckee, T. B.: The mountain plains circulation east of a 2-km-high north south barrier, Mon. Weather Rev., 122, 1490–1508, https://doi.org/10.1175/1520-0493(1994)122<1490:TMPCEO>2.0.CO;2, 1994.
Wu, P., Ding, Y. H., and Liu, Y. J.: Atmospheric circulation and dynamic mechanism for persistent haze events in the Beijing-Tianjin-Hebei region, Adv. Atmos. Sci., 34, 429–440, https://doi.org/10.1007/s00376-016-6158-z, 2017.
Yang, X., Zhao, C., Zhou, L., Li, Z., Cribb, M., and Yang, S.: Wintertime cooling and a potential connection with transported aerosols in Hong Kong during recent decades, Atmos. Res., 211, 52–61, https://doi.org/10.1016/j.atmosres.2018.04.029, 2018.
Yu, R. C., Zhou, T. J., Xiong, A. Y., Zhu, Y. J., and Li, J. M.: Diurnal variations of summer precipitation over contiguous China, Geophys. Res. Lett, 34, L017041, https://doi.org/10.1029/2006GL028129, 2007.
Yuan, T., Li, Z., Zhang, R., and Fan, J.: Increase of cloud droplet size with aerosol optical depth: An observation and modeling study, J. Geophys. Res., 113, D04201, https://doi.org/10.1029/2007JD008632, 2008.
Yuan, W. H., Yu, R. C., Chen, H. M., Li, J., and Zhang, M. H.: Subseasonal Characteristics of Diurnal Variation in Summer Monsoon Rainfall over Central Eastern China, J. Climate, 23, 6684–6695, https://doi.org/10.1175/2010JCLI3805.1, 2010.
Zeng, S., Riedi, J., Trepte, C. R., Winker, D. M., and Hu, Y.-X.: Study of global cloud droplet number concentration with A-Train satellites, Atmos. Chem. Phys., 14, 7125–7134, https://doi.org/10.5194/acp-14-7125-2014, 2014.
Zhao, B., Gu, Y., Liou, K. -N., Wang, Y., Liu, X., Huang, L., Jiang, J. H., and Su, H.: Type-Dependent Responses of Ice Cloud Properties to Aerosols From Satellite Retrievals, Geophys. Res. Lett., 45, 3297–3306, https://doi.org/10.1002/2018GL077261, 2018.
Zhou, S., Yang, J., Wang, W. C., Gong, D., Shi, P., and Gao, M.: Shift of daily rainfall peaks over the Beijing–Tianjin–Hebei region: An indication of pollutant effects?, Int. J. Climatol., 38, 5010–5019, https://doi.org/10.1002/joc.5700, 2018.
Zhu, Y., Rosenfeld, D., and Li, Z.: Under what conditions can we trust retrieved cloud drop concentrations in broken marine stratocumulus?, J. Geophys. Res., 123, 8754–8767, https://doi.org/10.1029/2017JD028083, 2018.