the Creative Commons Attribution 4.0 License.
the Creative Commons Attribution 4.0 License.
 | 06 Jan 2020
Evaluation and uncertainty investigation of the NO2, CO and NH3 modeling over China under the framework of MICS-Asia III
Xiao Tang
Jiang Zhu
Zifa Wang
Joshua S. Fu
Xuemei Wang
Syuichi Itahashi
Kazuyo Yamaji
Tatsuya Nagashima
Hyo-Jung Lee
Cheol-Hee Kim
Chuan-Yao Lin
Lei Chen
Meigen Zhang
Zhining Tao
Jie Li
Mizuo Kajino
Hong Liao
Kengo Sudo
Yuesi Wang
Yuepeng Pan
Guiqian Tang
Qizhong Wu
Baozhu Ge
Gregory R. Carmichael
Despite the significant progress in improving chemical transport models (CTMs), applications of these modeling endeavors are still subject to large and complex model uncertainty. The Model Inter-Comparison Study for Asia III (MICS-Asia III) has provided the opportunity to assess the capability and uncertainty of current CTMs in East Asian applications. In this study, we have evaluated the multi-model simulations of nitrogen dioxide (NO2), carbon monoxide (CO) and ammonia (NH3) over China under the framework of MICS-Asia III. A total of 13 modeling results, provided by several independent groups from different countries and regions, were used in this study. Most of these models used the same modeling domain with a horizontal resolution of 45 km and were driven by common emission inventories and meteorological inputs. New observations over the North China Plain (NCP) and Pearl River Delta (PRD) regions were also available in MICS-Asia III, allowing the model evaluations over highly industrialized regions. The evaluation results show that most models captured the monthly and spatial patterns of NO2 concentrations in the NCP region well, though NO2 levels were slightly underestimated. Relatively poor performance in NO2 simulations was found in the PRD region, with larger root-mean-square error and lower spatial correlation coefficients, which may be related to the coarse resolution or inappropriate spatial allocations of the emission inventories in the PRD region. All models significantly underpredicted CO concentrations in both the NCP and PRD regions, with annual mean concentrations that were 65.4 % and 61.4 % underestimated by the ensemble mean. Such large underestimations suggest that CO emissions might be underestimated in the current emission inventory. In contrast to the good skills for simulating the monthly variations in NO2 and CO concentrations, all models failed to reproduce the observed monthly variations in NH3 concentrations in the NCP region. Most models mismatched the observed peak in July and showed negative correlation coefficients with the observations, which may be closely related to the uncertainty in the monthly variations in NH3 emissions and the NH3 gas–aerosol partitioning. Finally, model intercomparisons have been conducted to quantify the impacts of model uncertainty on the simulations of these gases, which are shown to increase with the reactivity of species. Models contained more uncertainty in the NH3 simulations. This suggests that for some highly active and/or short-lived primary pollutants, like NH3, model uncertainty can also take a great part in the forecast uncertainty in addition to the emission uncertainty. Based on these results, some recommendations are made for future studies.
- Article
(8368 KB) - Full-text XML
-
Supplement
(1182 KB) - BibTeX
- EndNote


As the rapid growth in East Asia's economy with surging energy consumption and emissions, air pollution has become an increasingly important scientific topic and political concern in East Asia due to its significant environmental and health effects (Anenberg et al., 2010; Lelieveld et al., 2015). Chemical transport models (CTMs), serving as a critical tool in both the scientific research and policy making, have been applied into various air quality issues, such as air quality prediction, long-range transport of atmospheric pollutants, development of emission control strategies and understanding of observed chemical phenomena (e.g., Cheng et al., 2016; J. Li et al., 2017; Lu et al., 2017; Ma et al., 2019; Tang et al., 2011; Xu et al., 2019; Zhang et al., 2019). Nevertheless, air quality modeling remains a challenge due to the multi-scale and nonlinear nature of the complex atmospheric processes (Carmichael et al., 2008). It still suffers from large uncertainties related to the missing or poorly parameterized physical and chemical processes, inaccurate and/or incomplete emission inventories, as well as the poorly represented initial and boundary conditions (Carmichael et al., 2008; Dabberdt and Miller, 2000; Fine et al., 2003; Gao et al., 1996; Mallet and Sportisse, 2006). Understanding such uncertainties and their impacts on the air quality modeling is of great importance in assessing the robustness of models for their applications in scientific research and operational use.
There are specific techniques to assess these uncertainties. Monte Carlo simulations, based on different values of model parameters or input fields sampled from a predefined probability density function (PDF), can provide an approximation to the PDF of possible model output and serves as an excellent characterization of the uncertainties in simulations (Hanna et al., 2001). However, this method is more suited to deal with the uncertainty related to the continuous variables, such as input data or parameters in parameterization. The ensemble method, based on a set of different models, is an alternative approach to accounting for the range of uncertainties (Galmarini et al., 2004; Mallet and Sportisse, 2006). For example, the Air Quality Model Evaluation International Initiative (AQMEII) has been implemented in Europe and North America to investigate the model uncertainties of their regional-scale model predictions (Rao et al., 2011). To assess the model performances and uncertainties in East Asian applications, the Model Inter-Comparison Study for Asia (MICS-Asia) has been initiated in the year 1998. The first phase of MICS-Asia (MICS-Asia I) was carried out during the period 1998–2002, mainly focusing on the long-range transport and depositions of sulfur in Asia (Carmichael et al., 2002). In 2003, the second phase (MICS-Asia II) was initiated and took more species related to the regional health and ecosystem protection into account, including nitrogen compounds, O3 and aerosols. Launched in 2010, MICS-Asia III has greatly expanded its study scope by covering three individual and interrelated topics: (1) evaluate the strengths and weaknesses of current multi-scale air quality models and provide techniques to reduce uncertainty in Asia; (2) develop reliable anthropogenic emission inventories in Asia and understand the uncertainty of bottom-up emission inventories in Asia; and (3) provide multi-model estimates of radiative forcing and sensitivity analysis of short-lived climate pollutants.
This study addresses one component of topic 1, focusing on the three gas pollutants of NO2, CO and NH3. Compared with MICS-Asia II, more modeling results (14 different models with 13 regional models and 1 global model) were brought together within topic 1 of MICS-Asia III, run by independent modeling groups from China, Japan, Korea, United States of America and other countries/regions. The different models contain differences in their numerical approximations (time step, chemical solver, etc.) and parameterizations, which represent a sampling of uncertainties residing in the air quality modeling. However, it would be difficult to interpret the results from intercomparison studies wherein the models were driven by different meteorological fields and emission inventories. Thus, in MICS-Asia III the models were constrained so that they operated under the same conditions by using common emission inventories, meteorological fields, modeling domain and horizontal resolution. The simulations were also extended from the 4 months in MICS-Asia II to the entire year of 2010.
NO2, CO and NH3 are three important primary gas pollutants that has wide impacts on the atmospheric chemistry. As a major precursor of O3, NO2 plays an important role in the tropospheric O3 chemistry and also contributes to rainwater acidification and the formation of secondary aerosols (Dentener and Crutzen, 1993; Evans and Jacob, 2005). CO is a colorless and toxic gas ubiquitous throughout the atmosphere, which is of interest as an indirect greenhouse gas (Gillenwater, 2008) and a precursor for tropospheric O3 (Seinfeld and Pandis, 1998). Being the major sink of OH, CO also controls the atmosphere's oxidizing capacity (Levy, 1971; Novelli et al., 1998). As the only primary alkaline gas in the atmosphere, NH3 is closely associated with the acidity of precipitation and it can react with sulfuric acid and nitric acid, forming ammonium sulfate and ammonium nitrate, which account for a large proportion of fine particulate matter (Sun et al., 2012, 2013). Assessing their model performances is thus important to help us better understand their environmental consequences and also help explain the model performances for their related secondary air pollutants, such as O3 and fine particulate matter.
In a previous phase of MICS-Asia, no specific evaluation and intercomparison work was conducted for these gases, especially for CO and NH3. In MICS-Asia II, model performance of NO2 was evaluated as a relevant species to O3 (Han et al., 2008); however, such evaluations were limited to the observation sites from EANET (Acid Deposition Monitoring Network in East Asia). Model evaluations and intercomparisons in industrialized regions of China have not been performed due to the limited number of monitoring sites in China from EANET, which hindered our understanding of the model performance in industrialized regions. More dense observations over highly industrialized regions of China, namely the North China Plain (NCP) and Pearl River Delta (PRD) regions, were first included in MICS-Asia III, allowing the model evaluations over highly industrialized regions. Meanwhile, the emission inventories of these three gases are still subject to the large uncertainties (Kurokawa et al., 2013; M. Li et al., 2017), which is a major source of uncertainties in air quality modeling and forecasts. Evaluating these gases' emission inventories from a model perspective is also a useful way to identify the uncertainties in emission inventories (Han et al., 2009; van Noije et al., 2006; Pinder et al., 2006; Stein et al., 2014; Uno et al., 2007).
In all, this paper is aimed at evaluating NO2, CO and NH3 simulations using the multi-model data from MICS-Asia III; we try to address three questions: (1) what the performance of current CTMs is for simulating NO2, CO, and NH3 concentrations over highly industrialized regions of China; (2) what potential factors are responsible for the model deviations from observations and differences among models; and (3) how large the impacts are of model uncertainties on the simulations of these gases.
2.1 Description of the participating models and input datasets
Six different chemical transport models have participated in MICS-Asia III, with their major configurations summarized in Table 1. These models included NAQPMS (Wang et al., 2001), three versions of CMAQ (Byun and Schere, 2006), WRF-Chem (Grell et al., 2005), NU-WRF (Peters-Lidard et al., 2015), NHM-Chem (Kajino et al., 2012) and GEOS-Chem (http://acmg.seas.harvard.edu/geos/, lass access: 18 December 2019). All models employed a same modeling domain (Fig. 1), with a horizontal resolution of 45 km, except M13 (0.5∘ latitude × 0.667∘ longitude) and M14 (64 km × 64 km). Detailed information on each component of these CTMs can be obtained from Chen et al. (2019) and Tan et al. (2019).
Table 1Basic configurations of participating models in MICS-Asia III.

a Standard represents the reference meteorological field provided by
MICS-Asia III project; WRF/NCEP and WRF/MERRA represent the meteorological
field of the participating model itself, which was run by WRF driven by the
NCEP and Modern Era Retrospective-analysis for Research and Applications
(MERRA) reanalysis dataset. RAMS/NCEP is the meteorology field run by RAMS
driven by the NCEP reanalysis dataset.
b Boundary conditions of M10
are from MOZART and GOCART (Chin et al.,
2012; Horowitz et al., 2003), which provided results for gaseous pollutants
and aerosols, respectively.
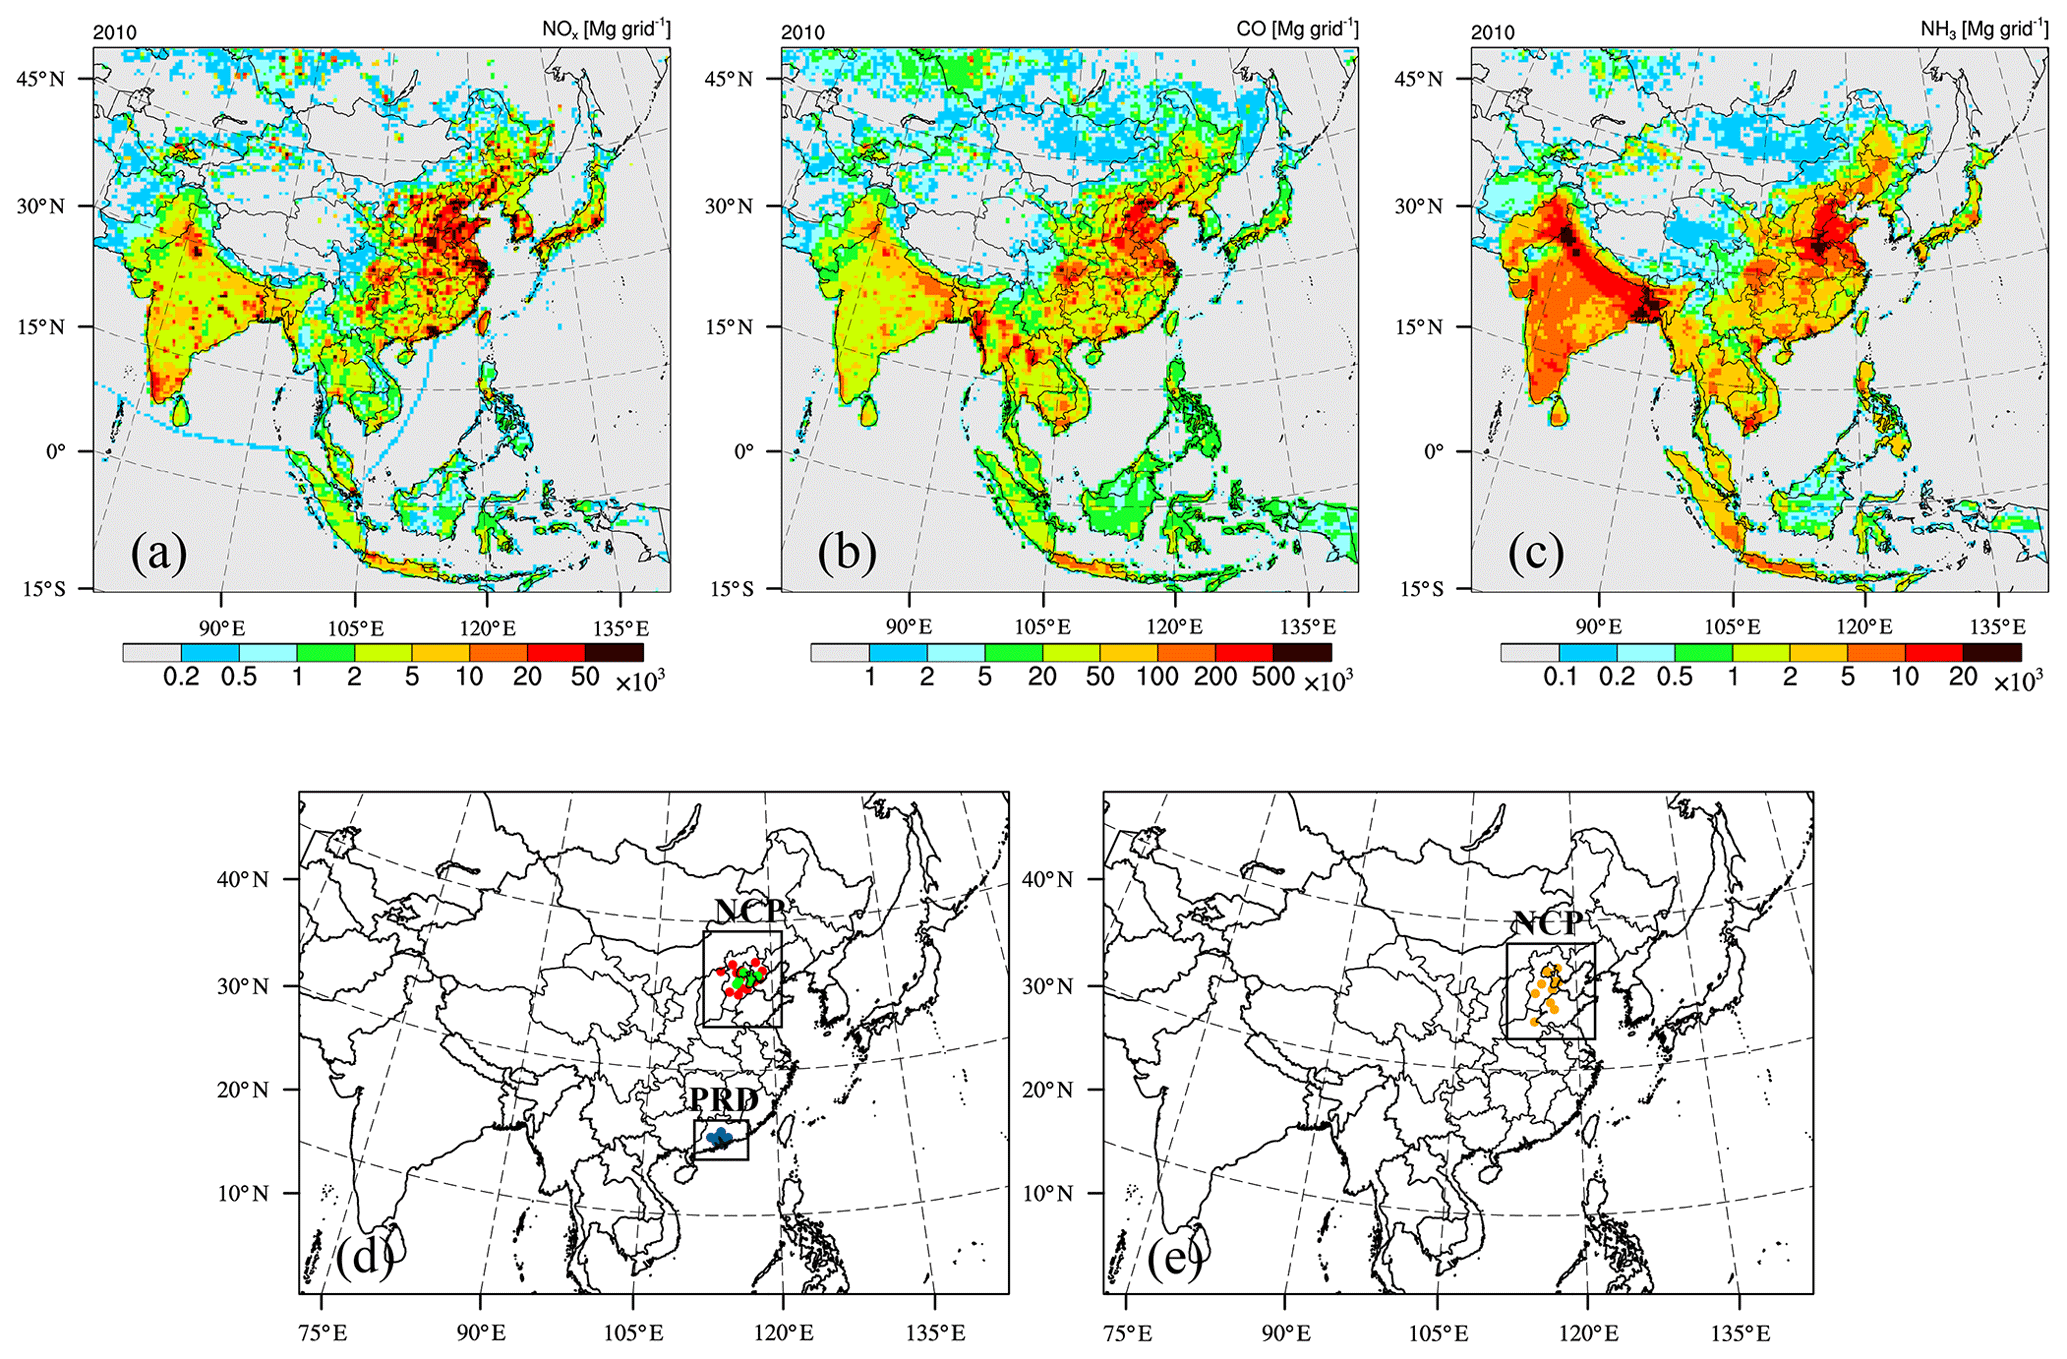
Figure 1Modeling domains of the participating models, except M13 and M14, along with spatial distributions of the total emissions of (a) NOx, (b) CO, and (c) NH3 in 2010 provided by MICS-Asia III and the distributions of observation stations of (d) NO2 and CO over the NCP and PRD regions, as well as (e) NH3 over the NCP region. The horizontal resolution is 45 km × 45 km. Note that domains of M13 and M14 are shown in Fig. 7 and that only 6 of 19 observational sites (green) over the NCP region have CO measurements.
Standard model input datasets of raw meteorological fields, emission inventories and boundary conditions were provided by MICS-Asia III for all participants. Raw meteorological fields were generated from a whole year of simulations in 2010 using Weather Research and Forecasting Model (WRF) version 3.4.1 (Skamarock, 2008) with a horizontal resolution of 45 km and 40 vertical layers from the surface to the model top (10 hPa). Initial and lateral boundary conditions for meteorological simulation were generated every 6 h by using the NCEP FNL (Final) Operational Global Analysis data (ds083.2). Real-time, global, sea surface temperature (RTG_SST_HR) analysis were used to generate and update lower boundary conditions for sea areas. Four-dimensional data assimilation nudging (gridded FDDA and SFDDA) was performed during the simulation to increase the accuracy of WRF after the objective analysis with NCEP FNL (Final) Operational Global Analysis data (ds083.2), NCEP Automatic Data Processing (ADP) Global Surface Observation Weather Data (ds461.0), and NCEP ADP Global Upper Air and Surface Weather Data (ds337.0). Detailed configurations of the standard meteorological model are available in Table S1 in the Supplement. The simulated wind speed, relative humidity and air temperature were evaluated against the observations over the NCP and PRD regions, with detailed results shown in Sect. S1. In general, the standard meteorological simulations captured the main features of meteorological conditions in the NCP and PRD regions well, with a high correlation coefficient, small biases and low errors for all meteorological parameters (Figs. S1–S3 and Table S2).
Standard emission inventories provided by the MICS-Asia III were used by all participants. The anthropogenic emissions were provided by a newly developed anthropogenic emission inventory for Asia (MIX), which integrated five national or regional inventories, including the Regional Emission inventory in Asia (REAS) developed at the Japan National Institute for Environment Studies, the Multi-resolution Emission Inventory for China (MEIC) developed at Tsinghua University, the High-Resolution Ammonia Emission Inventory in China developed at Peking University, the Indian emission inventory developed at Argonne National Laboratory in the United States and the Clean Air Policy Support System (CAPSS) Korean emission inventory developed at Konkuk University (M. Li et al., 2017). Hourly biogenic emissions for the entire year in 2010 in MICS-Asia III were provided by the Model of Emissions of Gases and Aerosols from Nature version 2.04 (Guenther et al., 2006). The Global Fire Emissions Database 3 (Randerson et al., 2013) was used for biomass burning emissions. Volcanic SO2 emissions were provided by the Asia Center for Air Pollution Research (ACAP) with a daily temporal resolution. Air and ship emissions with an annual resolution were provided by the HTAP version 2 emission inventory for 2010 (Janssens-Maenhout et al., 2015). NMVOC (non-methane volatile organic compound) emissions were spectated into the model-ready inputs for three chemical mechanisms (CBMZ, CB05 and SAPRC-99), and the weekly and diurnal profiles for emissions were also provided.
MICS-Asia III has provided two sets of top and lateral boundary conditions for the year 2010, which were derived from the 3-hourly global CTM outputs of CHASER (Sudo et al., 2002a, b) and GEOS-Chem (http://acmg.seas.harvard.edu/geos/), run by Nagoya University (Japan) and the University of Tennessee (USA), respectively. GEOS-Chem was run with resolution and 47 vertical layers, while the CHASER model was run with and 32 vertical layers.
All participants were required to use the standard model input data to drive their model run so that the impacts of model input data on simulations could be minimized. However, the models are quite different from each other, and it is difficult to keep all the inputs the same. The majority of models have applied the standard meteorology fields, while the GEOS-Chem and RAMS-CMAQ utilized their own meteorology models. The GEOS-Chem was driven by the GEOS-5 assimilated meteorological fields from the Goddard Earth Observing System of the NASA Global Modeling Assimilation Office, and the RAMS-CMAQ was driven by meteorological fields provided by Regional Atmospheric Modeling System (RAMS) (Pielke et al., 1992). WRF-Chem utilized the same meteorology model (WRF) as the standard meteorological simulation, but two of them considered the two-way coupling effects of pollutants and meteorological fields. The meteorological configurations of these WRF-Chem models were compared to the configurations of the standard meteorological model (Table S1), which shows slight differences from the standard meteorological model. The CTM part of NHM-Chem is coupled with the non-hydrostatic meteorological model (NHM) of the Japan Meteorological Agency (NHM) (Saito et al., 2006), but an interface to convert a meteorological model output of WRF to a CTM input was implemented (Kajino et al., 2018). Thus, the standard meteorology field was used in the NHM-Chem simulation, too.
2.2 Data and statistical methods
All modeling groups have performed a base of year-long simulations in 2010 and were required to submit their modeling results according to the data protocol designed in MICS-Asia III. Gridded monthly concentrations of NO2, CO, NH3 and ammonium () in the surface layer were used in this study. Note that modeling results from M3 and NH3 simulations from M8 were excluded due to their incredible results, thus only 13 modeling results were used in this study.
Hourly observed concentrations of NO2 and CO were collected over the NCP (19 stations) and PRD (13 stations) regions, obtained from the air quality network over northern China (Tang et al., 2012) and the Pearl River Delta regional air quality monitoring network (PRD RAQMN), respectively. The air quality monitoring network over northern China was set up by the Chinese Ecosystem Research Network (CERN), the Institute of Atmospheric Physics (IAP) and the Chinese Academy of Sciences (CAS) and has been operational since 2009 within an area of 500 × 500 km2 in northern China. All monitoring stations were selected and set up according to the US EPA method designations (Ji et al., 2012). The PRD RAQMN network was jointly established by the government of Guangdong Province and the Hong Kong Special Administrative Region, consisting of 16 automatic air quality monitoring stations across the PRD region (Zhong et al., 2013). A total of 13 of these stations are operated by the Environmental Monitoring Centers in Guangdong Province that were used in this study, while the other three are located in Hong Kong (not included in this study) and are managed by the Hong Kong Environmental Protection Department. Monthly averaged observations were calculated for the comparisons with the simulated monthly surface NO2 and CO concentrations. It should be noted that these networks measured the NO2 concentrations using a thermal conversion method, which would overestimate the NO2 concentrations due to the positive interference of other oxidized nitrogen compounds (Xu et al., 2013).
NH3 observations for long-term period are indeed challenging and limited due to its strong spatial and temporal variability, quick conversion from one phase to another, and its stickiness to the observational instruments (von Bobrutzki et al., 2010). Measurements of surface NH3 concentrations in the year 2010 were not available in this study; however, 1 year surface measurement of monthly NH3 concentrations over China from September of 2015 to August of 2016 were used as a reference dataset in this study, which were obtained from the Ammonia Monitoring Network in China (AMoN-China) (Pan et al., 2018). The AMoN-China was established based on the CERN and the Regional Atmospheric Deposition Observation Network in North China Plain (Pan et al., 2012), which consists of 53 sites over China and measured the monthly ambient NH3 concentrations using the passive diffusive technique. A total of 11 stations located in the NCP region were used in this study. Distributions of the observation sites of NO2, CO and NH3 over the NCP and PRD regions, as well as their total emissions in the year 2010 provided by MICS-Asia III, are shown in Fig. 1. Besides the surface observations, the satellite retrievals of NH3 total columns from IASI (Infrared Atmospheric Sounding Interferometer) were also used in this study to qualitatively evaluate the modeled monthly variations in NH3 concentrations. The ANNI-NH3-v2.1R-I retrieval product (Van Damme et al., 2017, 2018) was used in this study, which is the reanalysis version of NH3 retrievals from IASI instruments and provides the daily morning (∼09:30 local time) NH3 total columns from 2008 to 2016. More detailed information and the processing of satellite data are available in Sect. S2.
Mean bias error (MBE), normalized mean bias (NMB), root-mean-square error (RMSE) and correlation coefficient (R) were calculated for the assessment of model performances. Standard deviation of the ensemble models was used to measure the ensemble spread and the impacts of model uncertainty. Coefficient of variation (hereinafter, CV), defined as the standard deviation divided by the average, with a larger value denoting a lower consistency among models, was also used to measure the impacts of model uncertainty in a relative sense. However, by this definition, there is a tendency toward lower concentrations being more likely to be associated with a higher value of CV, thus we did not calculate the values of CV over model grids whose simulated concentrations were lower than 0.1 ppbv for NO2 and NH3 and 0.1 ppmv for CO, respectively. March–May, June–August, September–November and December–February were used to define the four seasons, spring, summer, autumn and winter, respectively.
3.1 Evaluating the ensemble models with observations
To facilitate comparisons, the modeling results were interpolated to the observation sites by taking the values from the grid cell where the monitoring stations are located. Model evaluation metrics defined in Sect. 2.2 were then calculated to evaluate the modeling results against the observations.
3.1.1 NO2
Figure 2 displays the comparisons between the observed and simulated annual mean NO2 concentrations over the NCP (Fig. 2a) and PRD (Fig. 2b) regions with calculated model evaluation metrics summarized in Table 2. M13 is not included in the evaluation of NO2 since it did not submit the NO2 concentrations. In general, the majority of models underpredicted NO2 levels in both the NCP and PRD regions. Calculated MBE (NMB) ranges from −6.54 ppbv (−28.4 %) to −2.45 ppbv (−10.6 %) over the NCP region and from −9.84 ppbv (−44.0 %) to −1.84 ppbv (−8.2 %) over the PRD region among these negatively biased models. These underpredicted NO2 concentrations are consistent with the overpredicted O3 concentrations by these models found in Li et al. (2019). O3 productions can either increase with NOx under NOx limited conditions or decrease under the NOx saturated (also called volatile organic compounds, VOCs, limited) conditions (Sillman, 1999). Both the NCP and PRD regions are industrialized regions in China with high NOx emissions (Fig. 1). Observations also showed that the NCP and PRD regions are falling into or changing into NOx-saturated regimes (Shao et al., 2009; Jin and Holloway, 2015). Therefore, the underestimated NO2 concentrations may contribute to the overpredicted O3 concentrations in these two regions. Detailed results about the O3 predictions can be found in Li et al. (2019). In addition, as we mentioned in Sect. 2.2, the negative biases in the simulated NO2 concentrations can be also partly attributed to the positive biases in the NO2 observations. M5, M8, M9, and M11 in the NCP region and M5, M8, and M11 in the PRD region were exceptions that overpredicted NO2 concentrations. M11 showed good performances in predicting NO2 levels in the NCP region, with the smallest RMSE, while M9 significantly overestimated NO2, with the largest MBE and RMSE values. NO2 predictions by M8 were close to the observations over the PRD region, with the smallest RMSE value. Meanwhile, we also found that models exhibited better NO2 modeling skills in the NCP region than in the PRD region, with smaller biases and RMSE values.
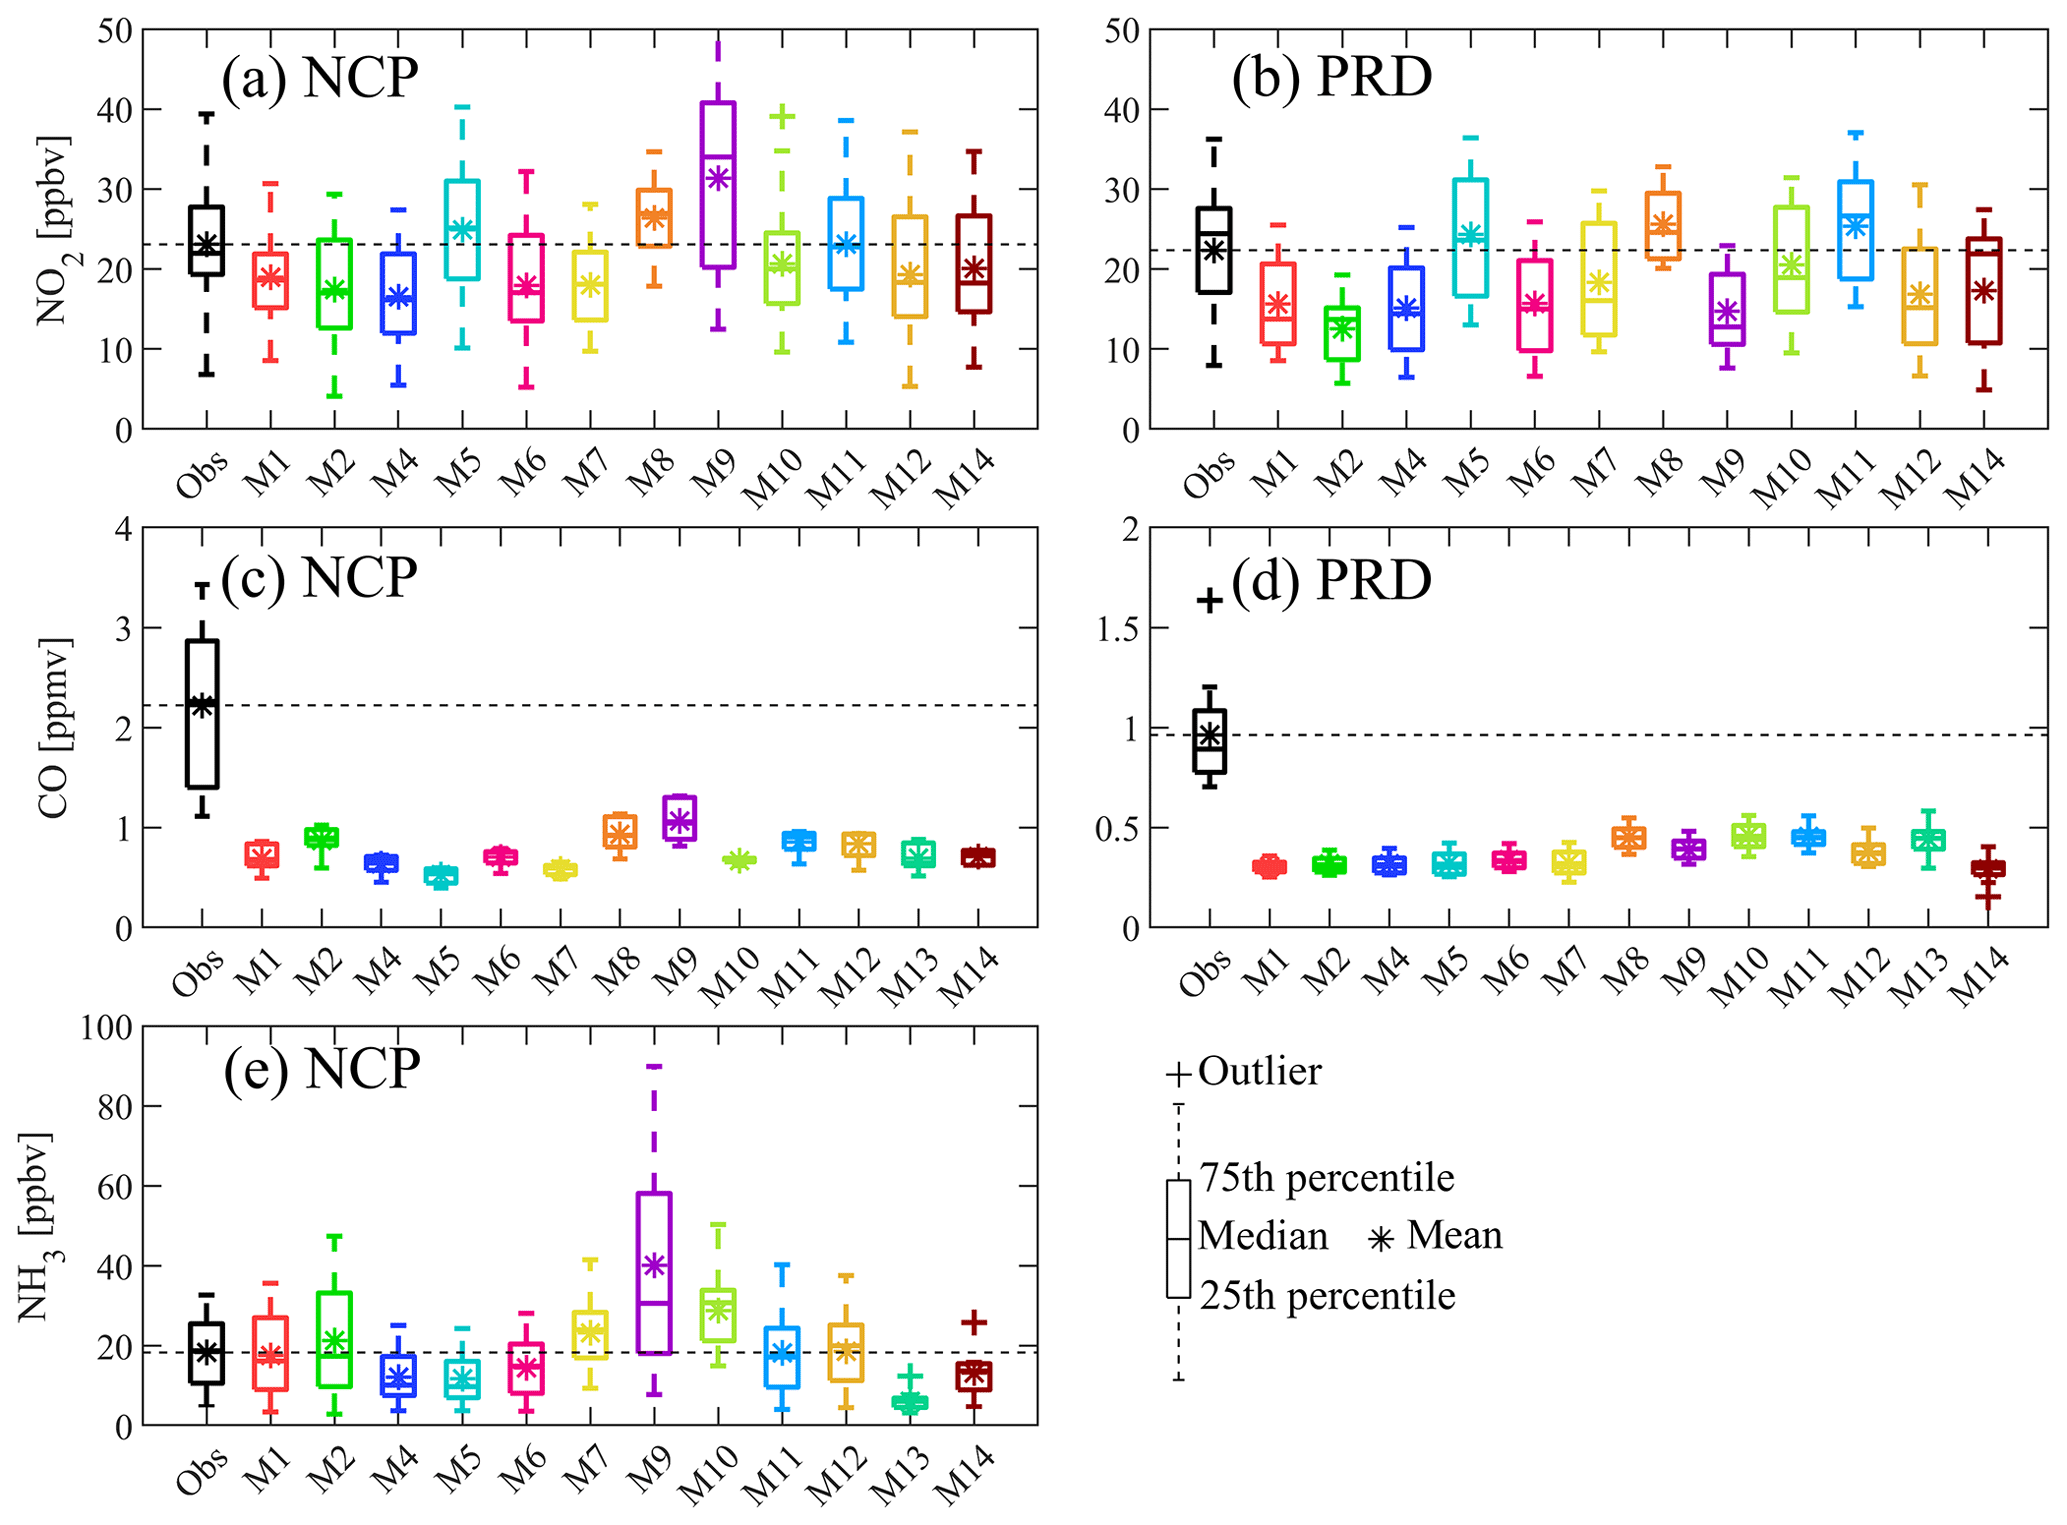
Figure 2Boxplot of simulated and observed annual mean NO2, CO and NH3 concentrations sampled from different stations over the NCP (a, c, e) and PRD (b, d) regions. The outlier was defined as values larger than or less than , where q3 denotes the 75th percentile and q1 the 25th percentile. This approximately corresponds to 99.3 % coverage if the data are normally distributed.
Table 2Statistics of simulated annual mean concentrations over the NCP and PRD regions.
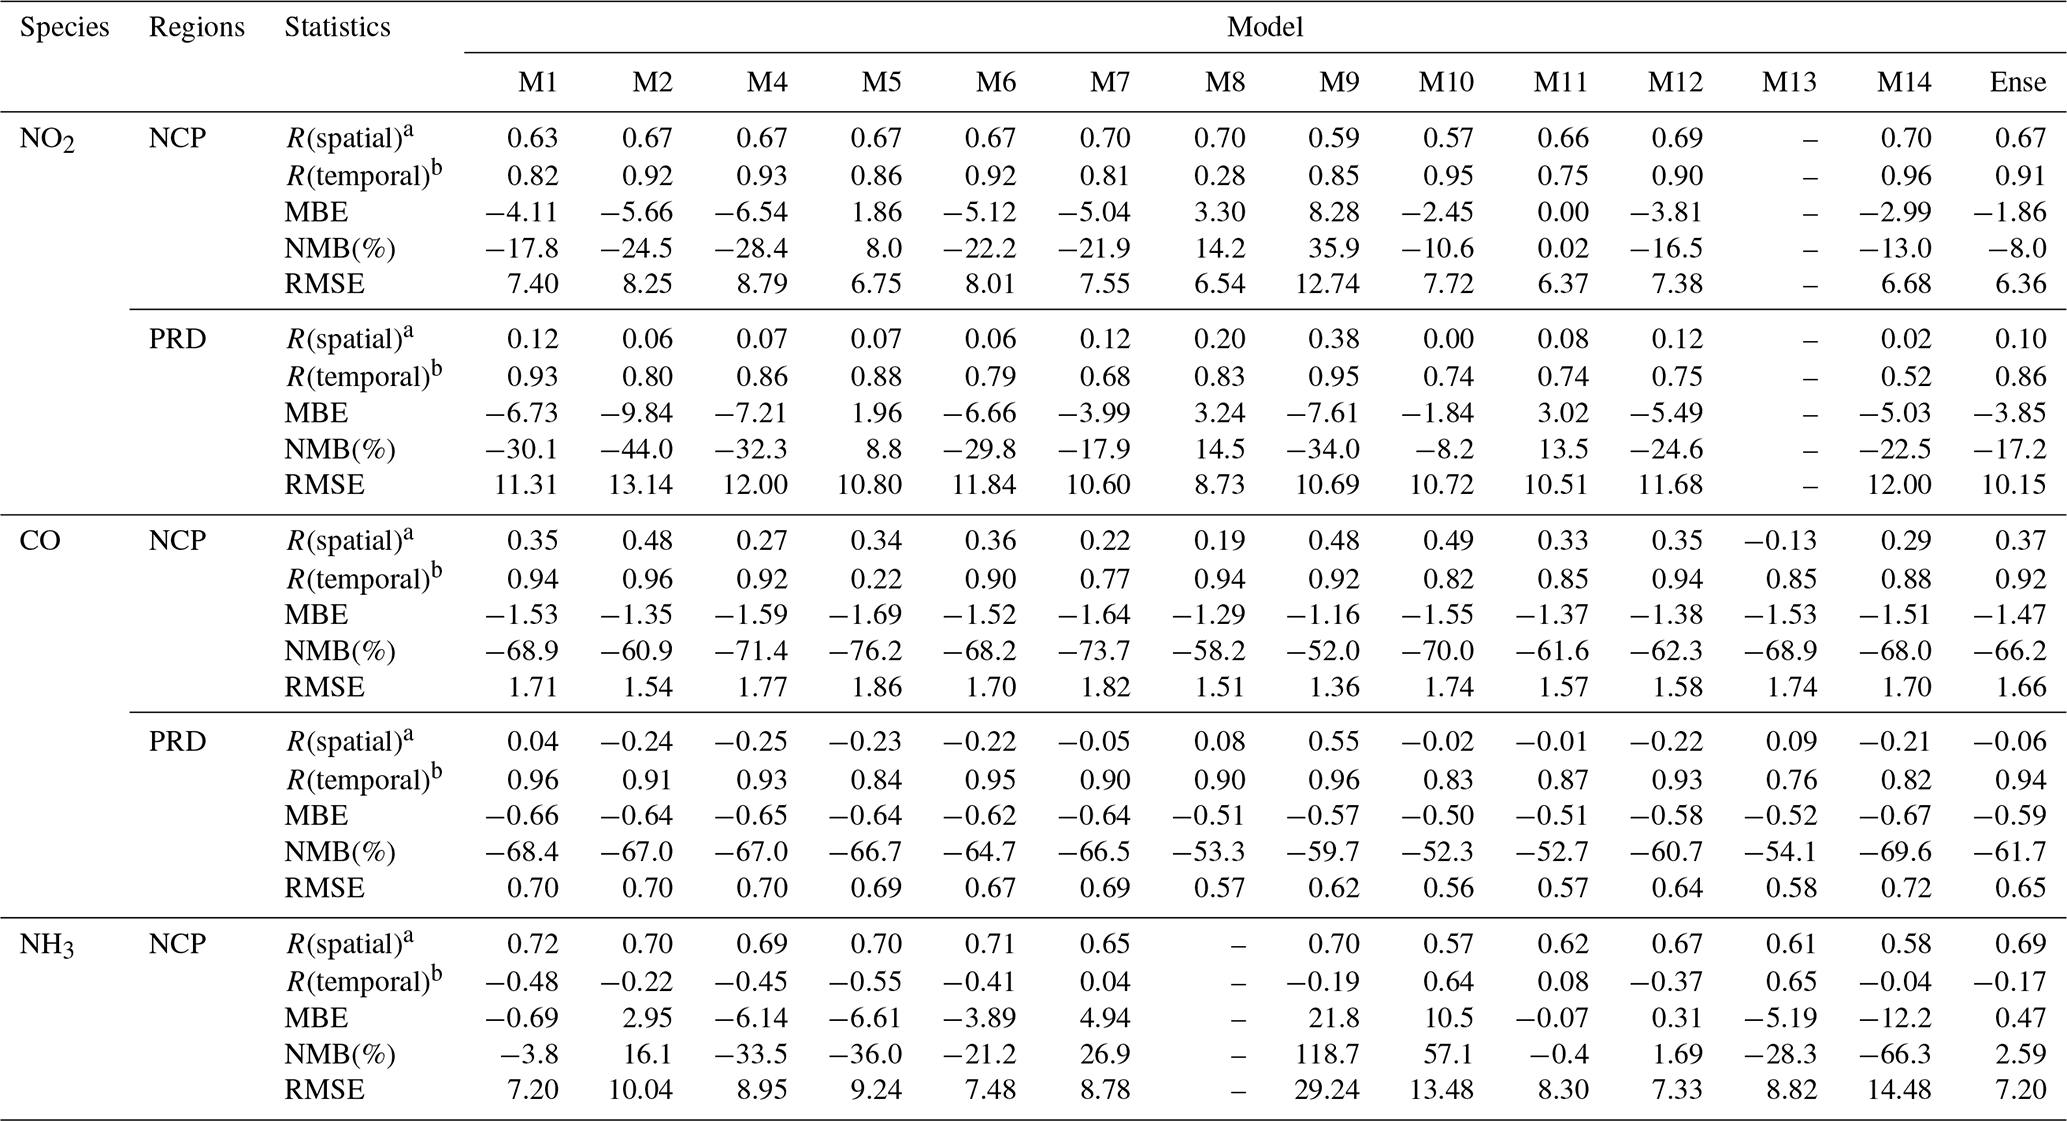
a R(spatial) represents the spatial correlation coefficients between simulated and observed concentrations sampled from different stations in the NCP and PRD regions. b R(temporal) represents the temporal correlation coefficients between simulated and observed monthly mean concentrations from January to December in 2010.
According to the spatial correlation coefficients (Table 2), all models reproduced the main features of the spatial variability of NO2 concentrations in the NCP region well, with correlation coefficients ranging from 0.57 to 0.70. However, models failed in capturing the spatial variability of NO2 concentrations in the PRD region with correlation coefficients only ranging from 0.00 to 0.38. Such low correlation might be attributed to the coarser model resolution (45 km), that some local impacts on the NO2 concentrations might not be well resolved in the model, and/or the uncertainties in emission inventories, which were not well resolved in the PRD region. To investigate this, we have conducted an additional 1 year simulation with finer horizontal resolutions (15 and 5 km, Fig. S4) in the PRD region using the NAQPMS model. Detailed experimental settings are presented in the Sect. S3. The experiment results indicate that when using the same emission inventory as the coarse-resolution simulation, the high-resolution simulation still show poor model performances in capturing the spatial variability of NO2 concentrations in the PRD region, with calculated correlation coefficient of only 0.03 and 0.02 for 15 and 5 km resolutions, respectively (Sect. S3, Figs. S5–S6 and Table S3). Thus, the poor model performance in the PRD region could be more related to the coarse resolution and/or inappropriate spatial allocation of the emission inventories. These results also suggested that only increasing the resolutions of model may not help improve the model performance.
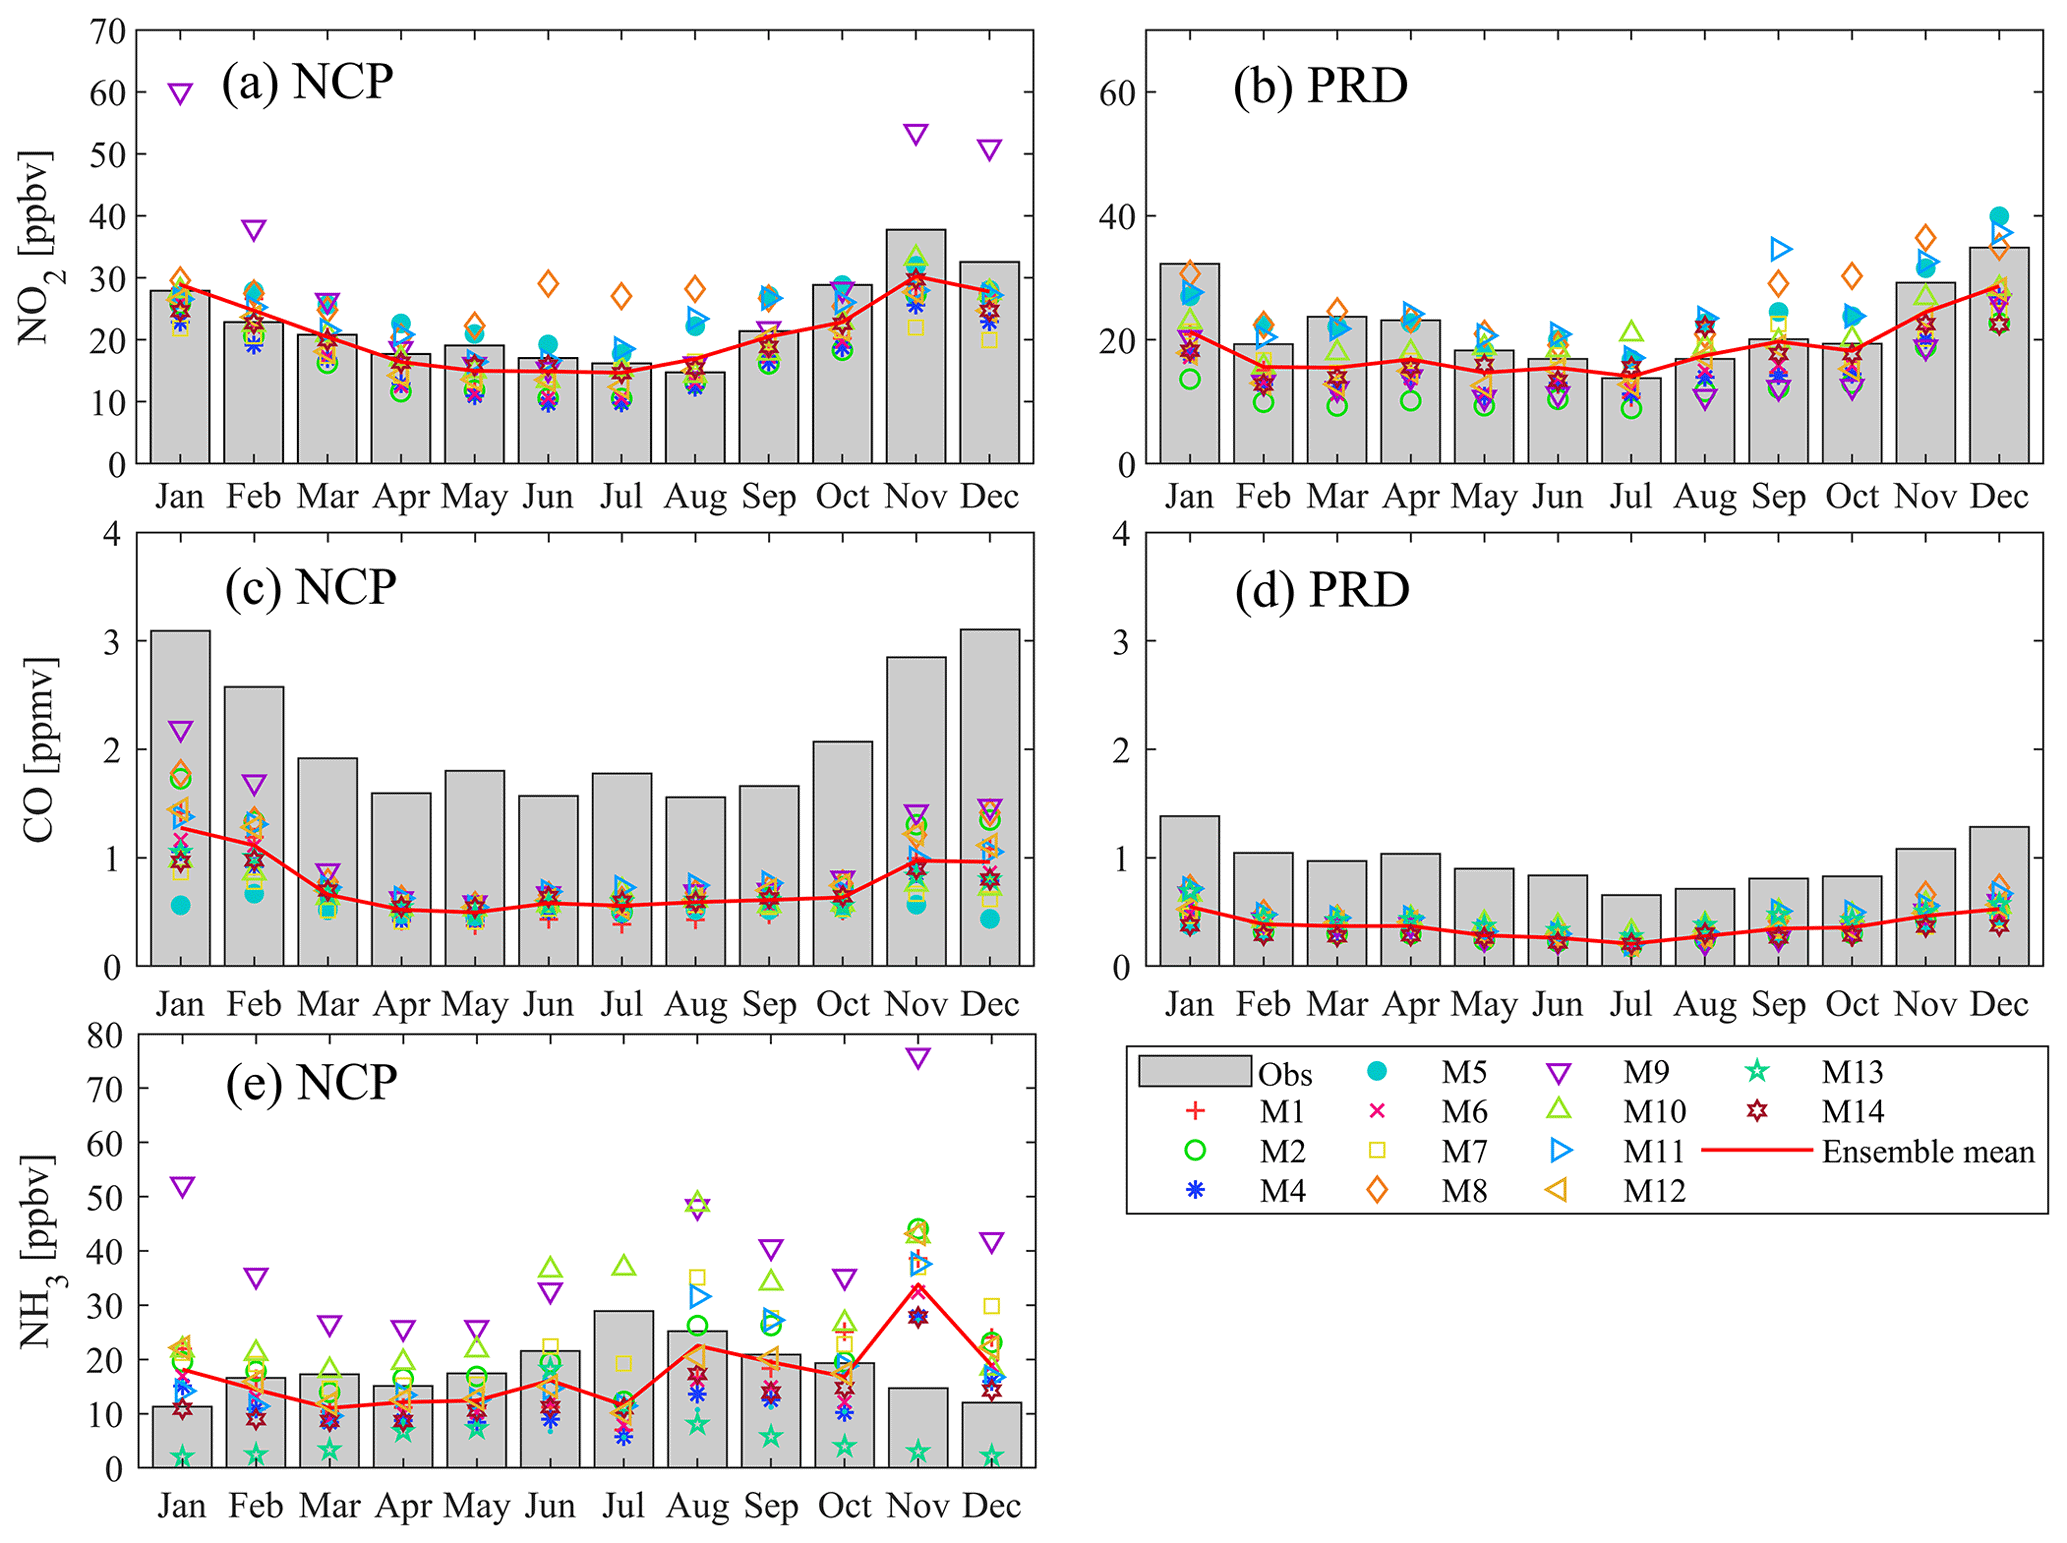
Figure 3Time series of regional mean NO2, CO concentrations over the NCP (a, c) and PRD (b, d) regions, as well as NH3 concentrations over the NCP (e) region from January to December in the year 2010.
Figure 3 presents the monthly time series of the observed and simulated regional mean NO2 concentrations over the NCP (Fig. 3a) and PRD (Fig. 3b) regions from January to December in 2010. The models captured the monthly variations in NO2 concentrations well both in the NCP and PRD regions. According to Table 2, the correlation coefficient ranges from 0.28 to 0.96 in the NCP region and from 0.52 to 0.95 in the PRD region. M8 showed the largest overestimation among all models in summer that MBE (NMB) can reach 12.1 ppbv (75.8 %) in the NCP region, which may help explain the low correlation of this model. M9 exhibited a significant overestimation in winter in the NCP region with MBE (NMB) up to 22.0 ppbv (79.3 %), while there was much less overestimation or even underestimation (summer) in other seasons. This discrepancy may be explained by the fact that M9 was an online coupled model that considers two-way coupling effects between the meteorology and chemistry. During the period with heavy haze, the radiation can be largely reduced by aerosol dimming effects, leading to weakened photochemistry, lowered boundary layer height, and thus an increase in NO2 concentrations. Severe haze was reported to occur in northern China in January 2010, with maximum hourly PM2.5 concentration even reached as high as ∼500 µg m−3 in urban Beijing (Gao et al., 2018). Such high aerosol loadings in the atmosphere could trigger interactions between chemistry and meteorology. Interestingly, M9 did not overestimate NO2 during winter in the PRD region. This might be related to the lower aerosol concentrations and weaker chemistry–meteorology coupling effects in the PRD region.
3.1.2 CO
Similar analyses were performed for modeling results of CO. All models significantly underestimated the annual mean CO concentrations both in the NCP and PRD regions (Fig. 2c–d and Table 2). Calculated MBE (NMB) ranges from −1.69 ppmv (−76.2 %) to −1.16 ppmv (−52.0 %) in the NCP region and from −0.67 ppmv (−69.6 %) to −0.50 ppmv (−52.3 %) in the PRD region (Table 2). Such large negative biases in all models were not likely to be explained by the model uncertainties, suggesting negative biases in the CO emissions over China. This is consistent with the inversion results of Tang et al. (2013), which indicates a significant underestimation of CO emissions over Beijing and the surrounding area in the summer of 2010. Over the most recent decades, global models also reported CO underestimations in the Northern Hemisphere (Naik et al., 2013; Stein et al., 2014), and a number of global model inversion studies have been conducted to derive the optimized CO emissions. Most of these studies have reported a significant underestimation of CO emissions in their a priori estimates (Bergamaschi et al., 2000; Miyazaki et al., 2012; Pétron et al., 2002, 2004). Our findings agree with these studies and indicate that more accurate CO emissions are needed in future studies. Model performances in simulating spatial variability of CO concentrations were still poor in the PRD region according to Table 2, with most models showing negative correlation coefficients.
Time series of the observed and simulated regional mean CO concentrations in the NCP and PRD regions are presented in Fig. 3c–d. It shows that the models except M5 reproduced the monthly variations in CO concentrations in both the NCP and PRD regions well, with a high temporal correlation coefficient (Table 2). All models, however, underestimated CO concentrations throughout the year and showed the largest underestimations in winter with MBE (NMB) by ensemble mean up to −2.1 ppmv (−64.9 %) in the NCP region and −0.75 ppmv (−60.6 %) in the PRD region.
3.1.3 NH3
Figure 2e shows the comparisons of the observed and simulated annual mean NH3 concentrations in the NCP region. Since we used the NH3 observations from September 2015 to August 2016, negative biases are expected according to the increasing trend of atmospheric ammonia during the period 2003–2016 detected by recently retrievals from the Atmospheric Infrared Sounder (AIRS) aboard NASA's Aqua satellite (Warner et al., 2016, 2017). Due to the interannual uncertainty, we mainly focused on the disparities among different models rather than the deviation from observations.
Large differences can be seen in simulated NH3 concentrations from different models. M14 simulated very low concentrations and exhibited the largest negative biases with MBE (NMB) of −12.2 ppbv (−66.3 %), which may be related to the higher conversion rate of NH3 to in M14 (discussed later in this section). In contrast, M9 provided much higher NH3 concentrations than other models, with MBE (NMB) up to 21.8 ppbv (118.7 %). For the CMAQ models, M1 and M2 exhibited higher NH3 concentrations and larger spatial variability compared to other CMAQ models. Such a discrepancy may be explained by the fact that M1 and M2 are two model runs using CMAQ version 5.0.2. The bidirectional exchange of NH3 has been integrated into CMAQ from version 5.0. This module can simulate the emitted and deposited processes of NH3 between atmosphere and the surface, allowing the additional NH3 emissions to the atmosphere (US EPA Office of Research and Development, 2012).
As can be seen in Table 2, the observed spatial variations in NH3 over the NCP region can be reproduced well by all models (R=0.57–0.71), indicating that the spatial variations in current NH3 emissions over the NCP region are well represented in emission inventories. However, all models failed to capture the observed monthly variations in NH3 concentrations, with most models mismatching the observed NH3 peak (July) and showing negative correlation coefficients. M10 and M13 are exceptions showing good temporal correlations of 0.64 and 0.65, respectively (Fig. 3e and Table 2). This is quite different from the model behavior in simulating the monthly variations in NO2 and CO concentrations. As seen in Fig. 3e, the observation showed the peak concentrations of NH3 in summer months and lower concentrations in autumn and winter, which is consistent with the previous NH3 observations in the NCP region (Shen et al., 2011; Xu et al., 2016; Meng et al., 2011). Newly derived satellite-measured NH3 at 918 hPa averaged between September 2002 and August 2015 also demonstrated higher concentrations in spring and summer and lower concentrations in autumn and winter (Warner et al., 2016). However, all models predicted a peak concentration in November except for M10 in August and M13 in June. We also used the satellite retrievals of NH3 total columns from IASI to further evaluate the modeled monthly variations in NH3 concentrations, since evaluating the model results using observations from different years may be inappropriate due to the emission change of NH3. Comparisons of the surface NH3 observations from AMoN-China and NH3 total columns from IASI (Fig. S7) suggest that the IASI measurement can represent the monthly variations in surface NH3 concentrations well, which can be used to qualitatively evaluate the modeled monthly variations in surface NH3 concentrations. The monthly time series of the regional mean NH3 total columns over the NCP region from January 2008 to December 2016 are shown in Fig. S8, which shows similar monthly variations to the surface observations, with the highest value in July, and confirms the poor model performances for reproducing the monthly variations in NH3 concentrations. The IASI measurement also indicates that the interannual variability of monthly variations in NH3 concentrations over the NCP region were small from 2008 to 2016, which suggests that using observations from different years could still provide valuable clues for verifying the modeled monthly variations.
The simulated monthly variations in NH3 concentrations were closely related to the monthly variations in the NH3 emissions. Most models predicted three peak values of NH3 concentrations in June, August and November but exhibited a significant decrease in July, which was in good agreement with the peaks and drops of the NH3 emission rates in these months (Fig. 4). The strong relationship between the simulated NH3 concentrations and the emission rates suggests that the poor model performance for reproducing the monthly variations in NH3 concentrations is probably related to the uncertainties in the monthly variations in NH3 emissions. This is consistent with the recent bottom-up and top-down estimates of agriculture ammonia emissions in China by Zhang et al. (2018), which shows more distinct seasonality of Chinese NH3 emissions.
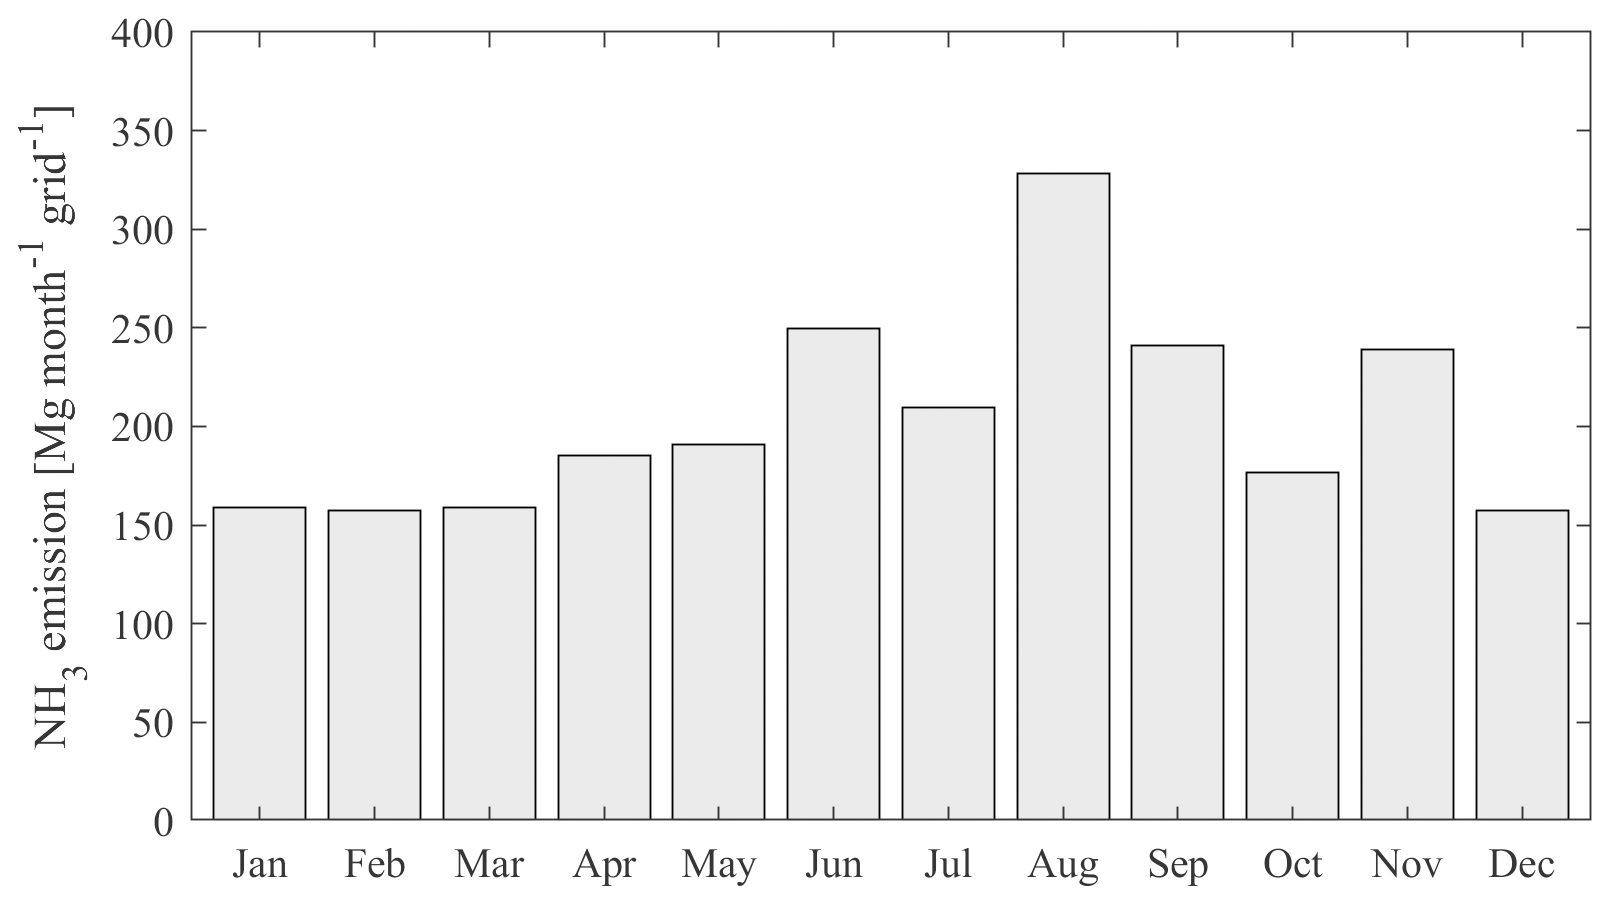
Figure 4Time series of NH3 emissions over the NCP region provided by MICS-Asia III at a horizontal resolution of 45 km from January to December in the year 2010.
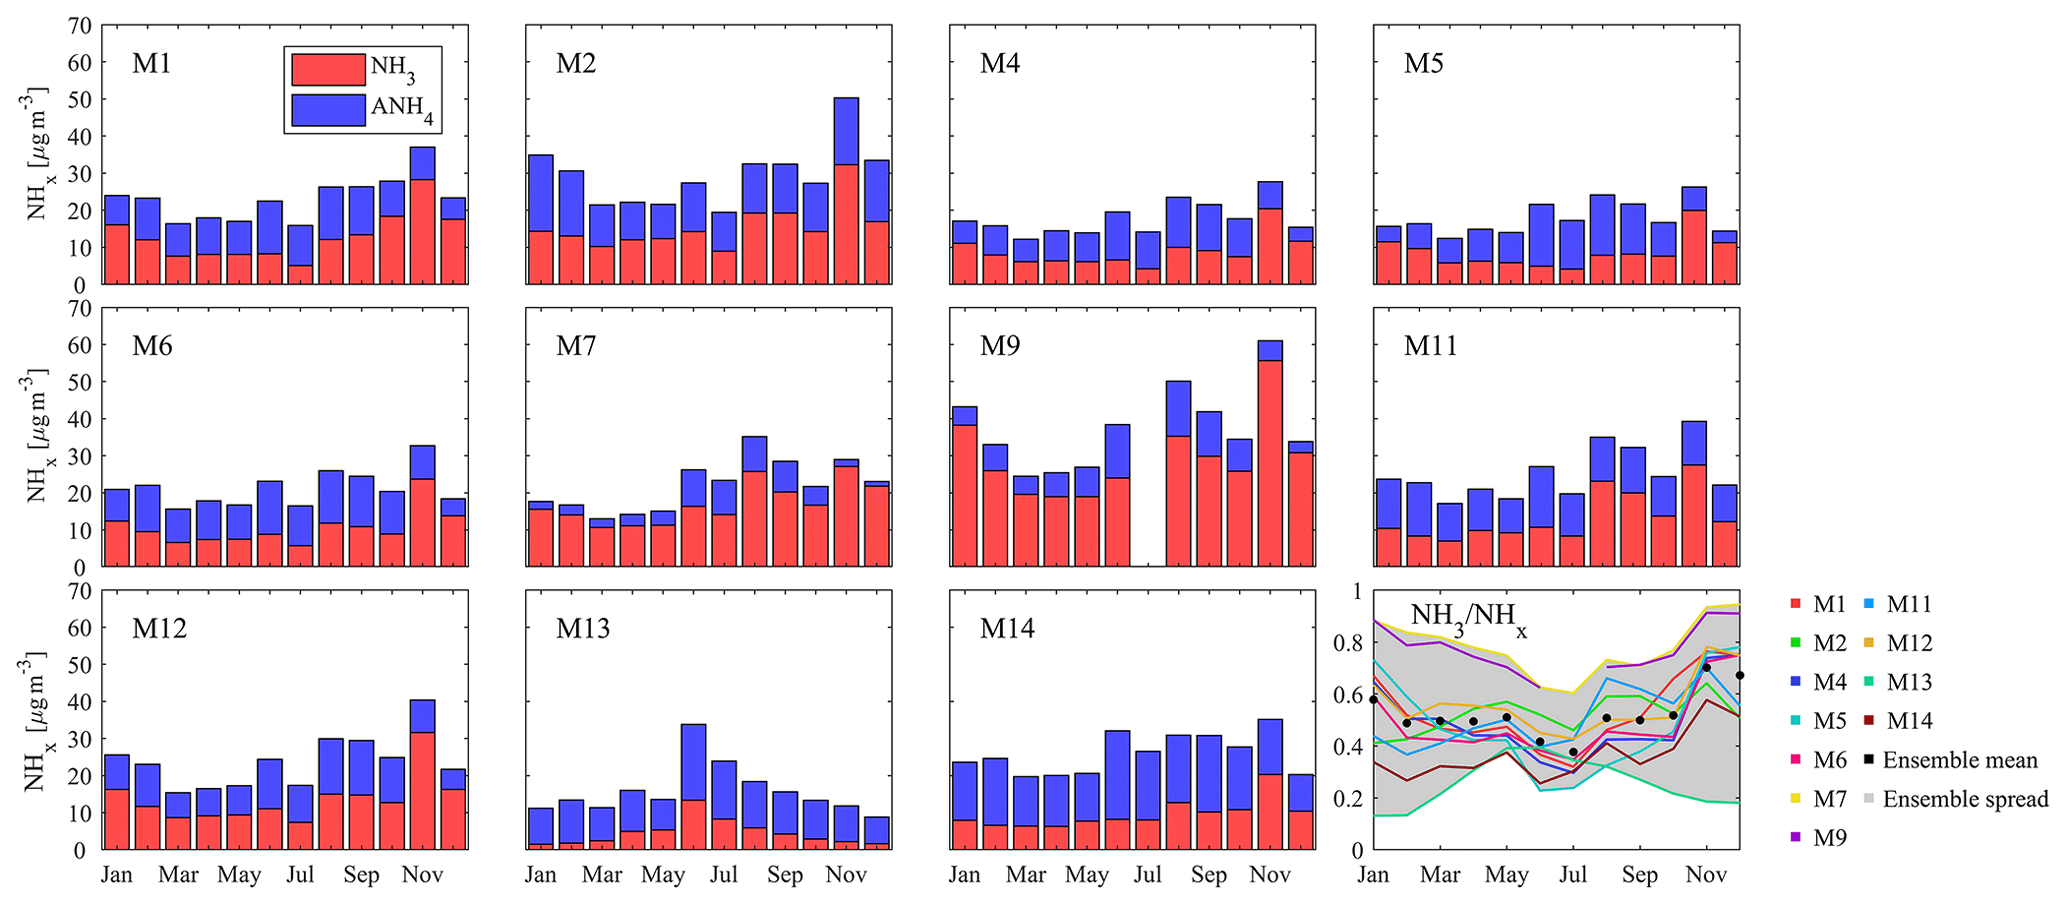
Figure 5Time series of the multi-model-simulated total ammonium () in the atmosphere, along with the ratio of gaseous NH3 to total ammonium, over the NCP region from January to December in the year 2010.
It is worth noting that there are also important uncertainties in the models beyond emission uncertainty. In order to investigate this issue, we have analyzed the impact of gas–aerosol partitioning of NH3 on the simulations of NH3 concentrations. Figure 5 shows the time series of the simulated total ammonium () in the atmosphere, along with the ratio of gaseous NH3 to total ammonium. M10 is excluded in Fig. 5 since the GOCART model does not predict concentrations. As a result, the emitted NH3 would be only presented as the gas phase in M10, leading to higher NH3 predictions. This may also help explain the different monthly variations in NH3 concentrations seen in M10. Without the considerations of , the monthly variations in NH3 concentrations in M10 were more consistent with the monthly variations in NH3 emissions, which highlighted the importance of gas–aerosol partitioning of NH3 on the predictions of monthly variations in NH3 concentrations. As seen in Fig. 5, there is a large discrepancy in the simulated gas–aerosol partitioning of NH3 from different models. M7 and M9 showed a higher NH3∕NHx ratio than other models, which means that these two models tended to retain the NH3 in the gas phase and thus predicted higher NH3 concentrations than other models. For example, M7 predicted comparable magnitude of total ammonium to most models, while gas NH3 concentration in M7 accounted for more than 60 % of total ammonium in summer and 90 % in winter. The lower conversion rate of NH3 to in M9 may be related to the gas-phase chemistry used in the model. M9 used the RADM2 mechanism, which gives lower reaction rates of oxidation of SO2 and NO2 by the OH radical, as compiled by Tan et al. (2019), leading to lower productions of acid and thus lower conversion rate of NH3 to . In the case of M7, the hydrolysis of N2O5 was not considered in M7, which leads to a lower tendency in the prediction of (Chen et al., 2019) and partly explains the higher NH3 predictions of M7. On the contrary, M14 showed a much lower NH3∕NHx ratio than most models, which is related to its higher production rates of sulfate than other models as seen in Chen et al. (2019). In terms of monthly variations, most models predicted a lower NH3∕NHx ratio in summer than that in other seasons, suggesting the higher conversion rates of NH3 from gas phase to aerosol phase in summer. This would be related to the higher yield of ammonium sulfate due to the enhanced photochemical oxidation activity in summer. However, different from the modeling results, the NH3 and observations over the NCP region indicated a lower NH3∕NHx ratio, with higher ammonium concentrations in autumn and winter (Shen et al., 2011; Xu et al., 2016). Although observed was largest in summer at a rural site in Beijing, the observed NH3∕NHx ratio was still highest in summer according to observations from Meng et al. (2011). These results indicate that there would be large uncertainties in the modeling of seasonal variations in the gas–aerosol partitioning of NH3 over the NCP region. The formation of mainly depends on the acid gas concentrations, temperature, water availability (Khoder, 2002) and the flux rates of NH3 (Nemitz et al., 2001). Compared with spring and summer, the lower temperature and higher SO2 and NOx emissions should favor the gas-to-particle phase conversion of NH3 and lead to higher concentrations. This contrast indicates that some reaction pathways of acid production (H2SO4 or HNO3) may be missing in current models, such as aqueous-phase and heterogeneous chemistry (Cheng et al., 2016; Wang et al., 2016; Zheng et al., 2015). Such uncertainty may be another important factor contributing to the poor model performances for reproducing the monthly variations in NH3 concentrations over the NCP region.
3.2 Quantifying the impacts of model uncertainty
In this section, we further investigate the discrepancies among the different models to quantify the impacts of model uncertainty on the simulations of these gases. As we mentioned in Sect. 2, most of these models employed common meteorology fields and emission inventories over China under the same modeling domain and horizontal resolutions, which comprised an appropriate set for investigating the model uncertainties.

Figure 6Spatial distribution of the annual mean NO2 concentrations from each modeling result of MICS-Asia III. Note that M13 is not included in this figure.
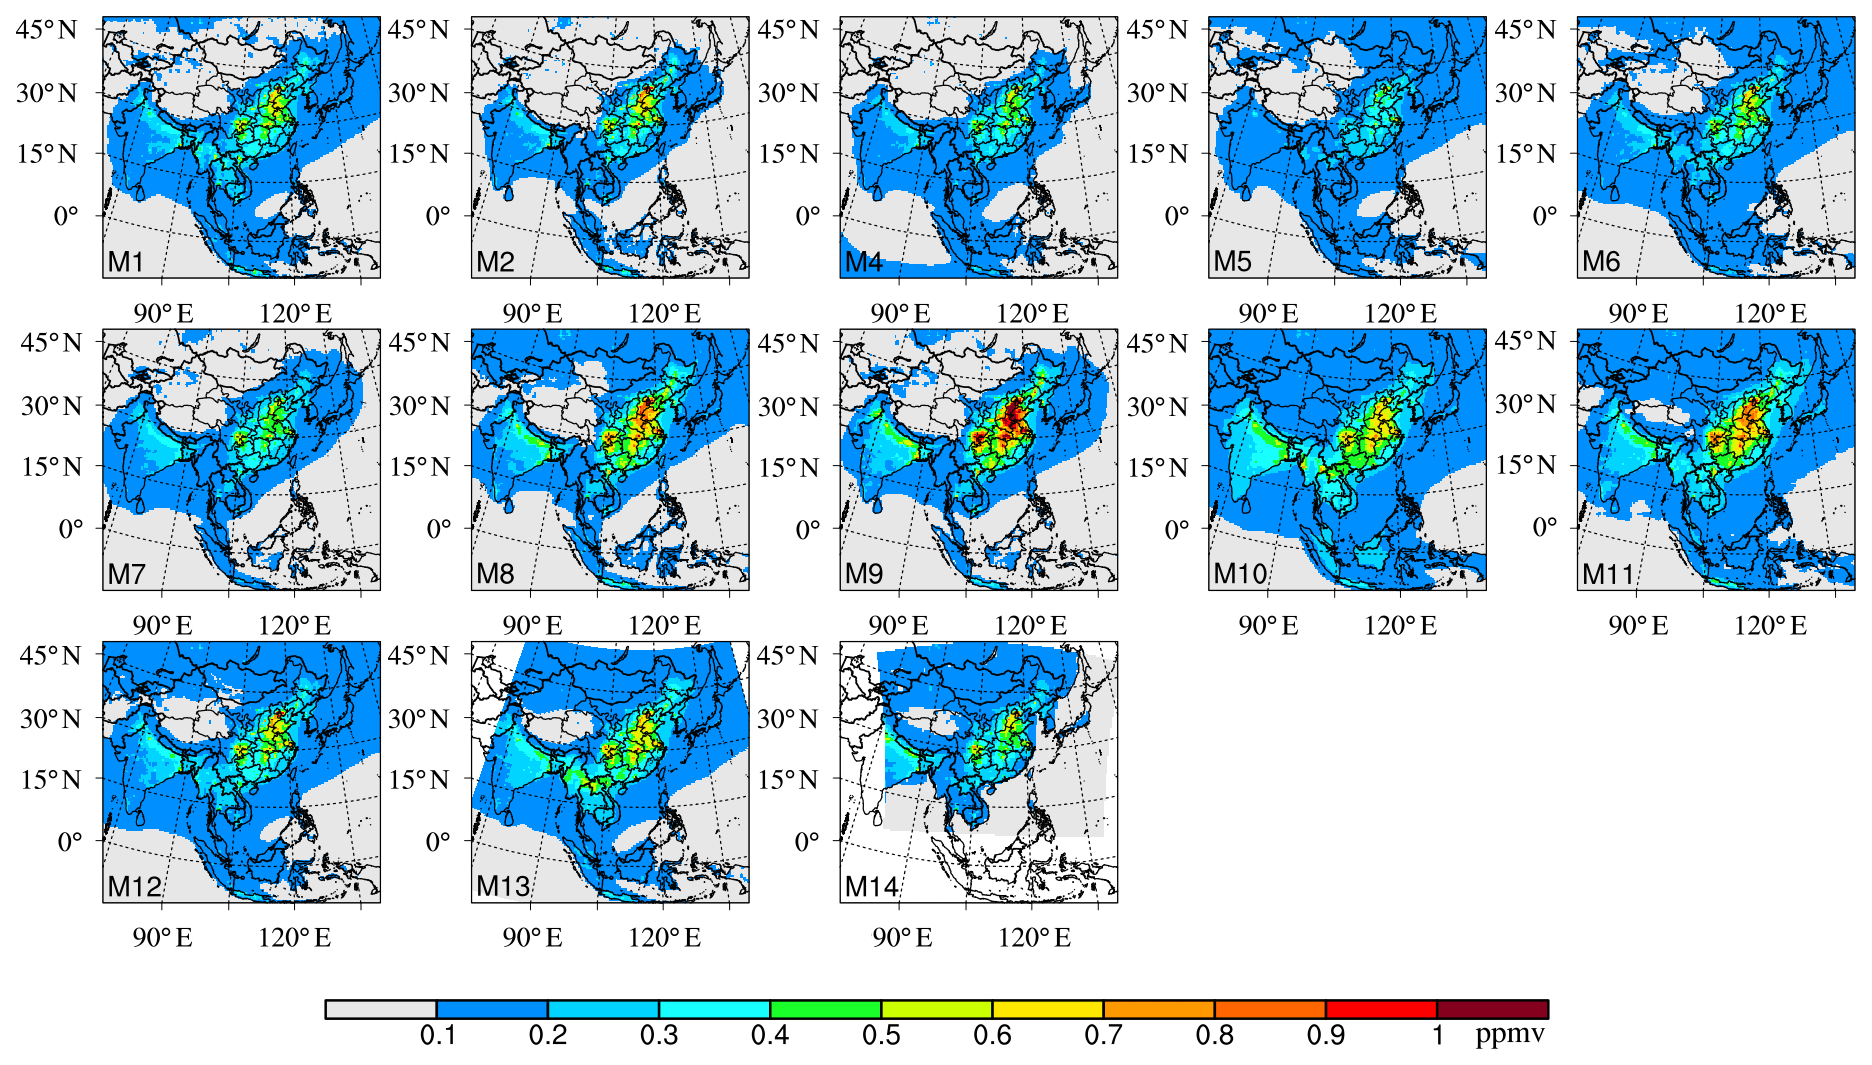
Figure 7Spatial distribution of the annual mean CO concentrations from each modeling results of MICS-Asia III.
Figure 8Spatial distribution of the annual mean NH3 concentrations from each modeling results of MICS-Asia III.
Figures 6–8 present the simulated annual mean concentrations of NO2, CO and NH3 from different models. The spatial distributions of the simulated NO2, CO and NH3 concentrations from different models agreed well with each other, similar to the spatial distributions of their emissions (Fig. 1). High NO2 concentrations were mainly located in northern and central eastern China, and several hot spots of NO2 were also detected in northeastern China and the PRD region. M5, M8, M9 and M11 predicted higher NO2 concentrations than other models, especially for M8, which also predicted very high NO2 levels over southeastern China. Similar to NO2, high CO concentrations were generally located over northern and central eastern China, as well as east of the Sichuan basin. M8, M9 and M11 predicted higher CO concentrations than other models as well. In terms of NH3, although most models shared similar spatial patterns of NH3 simulations, the simulated NH3 concentrations varied largely from different models. High NH3 concentrations were mainly located over northern China and the Indian subcontinent, which was in accordance with the distribution of agricultural activity intensity over East Asia. Among these models, M9 and M10 produced much higher NH3 concentrations over East Asia, while M4, M5, M6, M13 and M14 produced much lower concentrations.
The impacts of model uncertainty on the simulations of NH3 (Fig. 9a), CO (Fig. 9b) and NO2 (Fig. 9c) were then quantified in Fig. 9, denoted by the spatial distributions of the standard deviation (ensemble spread) and the corresponding distributions of CV on the annual and seasonal basis. Note that M13 and M14 were excluded in the calculation of ensemble spread and CV to reduce the influences of the meteorological input data and horizontal resolutions. It seems that the impacts of model uncertainty increase with the reactivity of gases. NH3 simulations were affected most by the model uncertainty, while CO suffered least from the uncertainty in models.
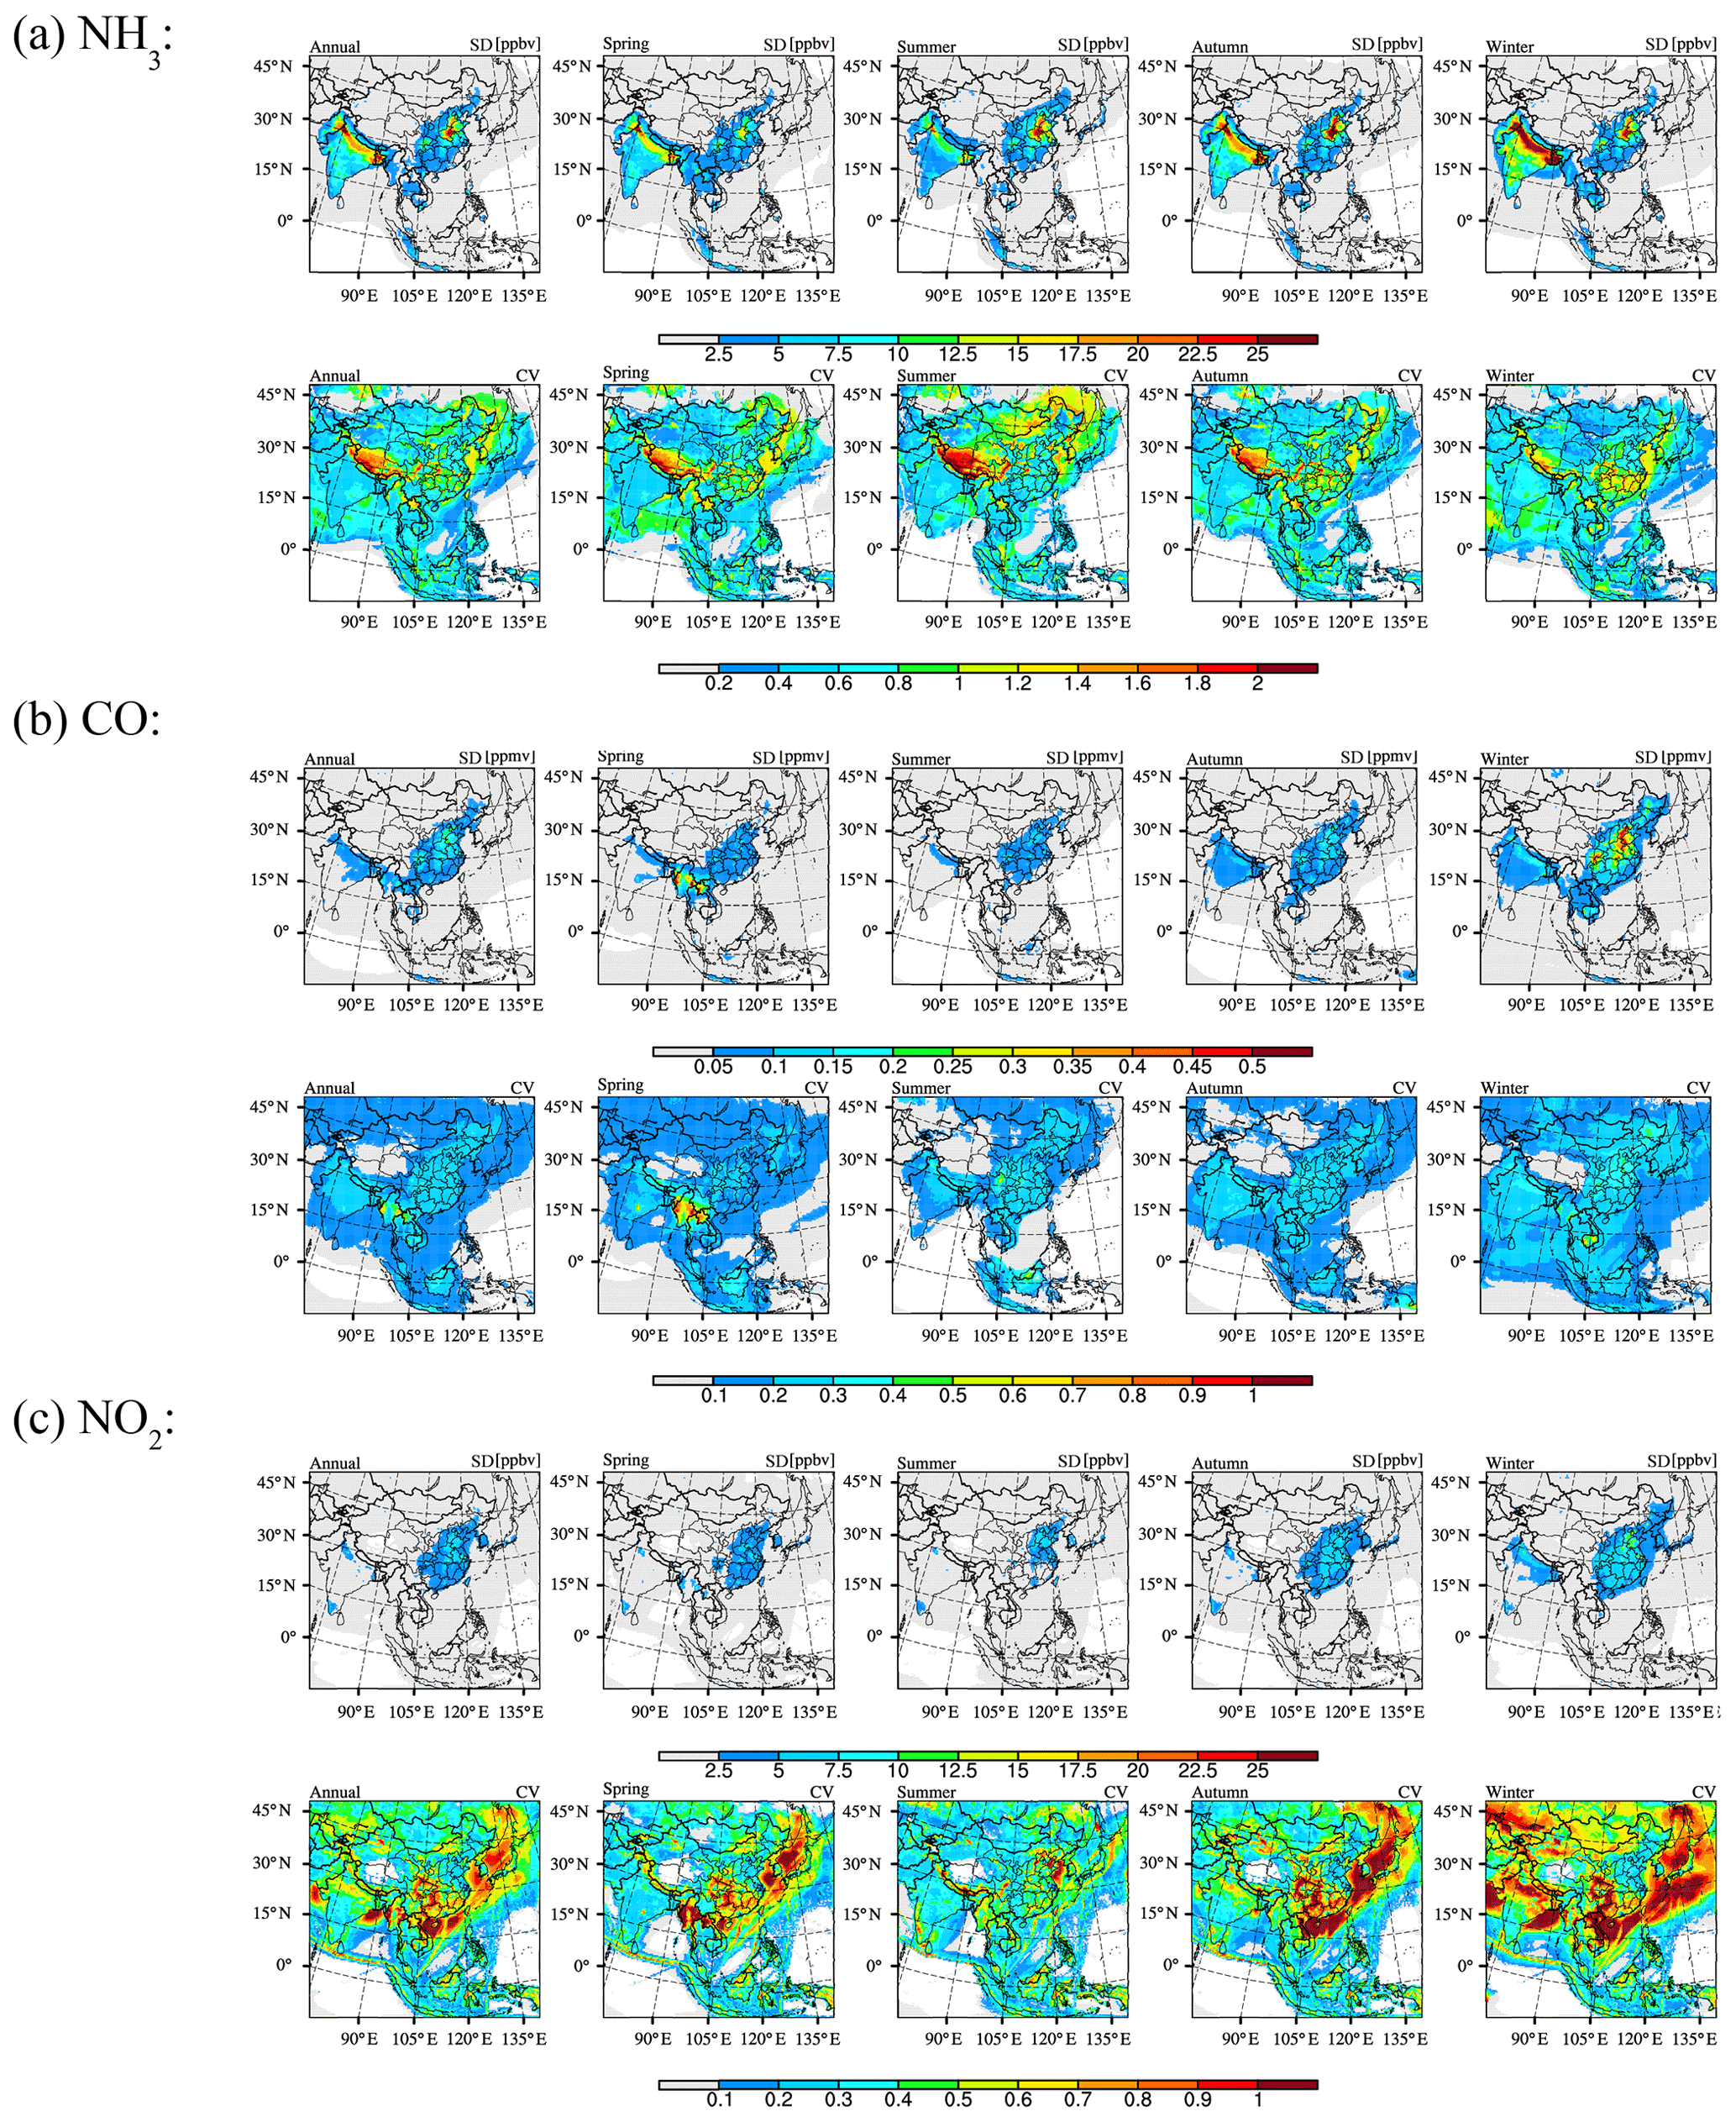
Figure 9Spatial distribution of the standard deviation of (a) NH3, (b) CO and (c) NO2 multi-model predictions from MICS-Asia III, as well as the corresponding distribution of CV on the annual and seasonal basis.
The ensemble spread of NH3 simulations exhibited a strong spatial variability, with higher values mainly located in the NCP region. Standard deviation of the annual mean NH3 concentrations can be over 20 ppbv in Henan province and 15 ppbv in the south of Hebei province, which is about 60 %–80 % and 40 %–60 % of the ensemble mean, respectively, according to the CV distribution. As we mentioned in Sect. 3.1.3, these large modeling differences can be partly explained by the differences in the bidirectional exchange and gas–aerosol partitioning of NH3 in different models. A strong seasonal pattern was also found in the differences of NH3 simulations over the NCP region. The ensemble spread was smallest in spring and largest in autumn, up to 25 ppbv in most areas of the NCP region. However, in the relative sense, the modeling differences were larger in summer and winter and smaller in spring and autumn. Southeastern China shared a similar magnitude of the ensemble spread (2–5 ppbv) and showed weaker seasonal variability. However, the modeling differences in the relative sense were larger than that in the NCP region with CV over 1.0 in all seasons except in summer. This could be due to the simulated concentrations being more influenced by the model processes over the areas with low emissions and more constrained by the emissions over high emission rate areas.
CO was least affected by the model uncertainty among the three gases, which is consistent with its weaker chemical activity and longer lifetime in the atmosphere. The ensemble spread of annual mean CO concentration was about 0.05–0.2 ppmv in eastern China, only about 20 %–30 % of the ensemble mean. Meanwhile, CO modeling differences were more uniformly distributed in eastern China with CV less than 0.3 over most areas of eastern China. However, large modeling differences were visible over Myanmar during spring when there were high CO emissions from biomass burning. Model differences turned out to be larger during winter in the NCP region with ensemble spread and CV about 0.3–0.5 ppmv and 0.3–0.4, respectively.
NO2 was moderately affected by the model uncertainty among the three gases. Ensemble spread of annual mean NO2 concentration was 5–7.5 ppbv in the NCP region and 2.5–5 ppbv in southeastern China, which accounted for about 20 %–30 % of the ensemble mean in the former but more than 70 % in the latter. The ensemble spread was largest in winter, which was over 10 ppbv in the NCP region (30 %–40 %) and 5–7.5 ppbv in southeastern China (over 70 %). Similar to NH3, southeastern China exhibited more modeling differences than the NCP region in a relative sense, with CV higher than 0.7 in most areas of southeastern China.
In this study, 13 modeling results of surface NO2, CO and NH3 concentrations from MICS-Asia III were compared with each other and evaluated against the observations over the NCP and PRD regions. Three questions have been addressed, related to the performance of current CTMs in simulating the NO2, CO, and NH3 concentrations over the highly industrialized regions of China; potential factors responsible for the model deviations from observations and differences among models; and the impacts of model uncertainty on the simulations of these gases.
Most models showed underestimations of NO2 concentrations in the NCP and PRD regions, which could be an important potential factor contributing to the overpredicted O3 concentrations in these regions. According to Xu et al. (2013), such underestimations would also be related to the positive biases in the NO2 observations. The models showed better NO2 model performance in the NCP region than in the PRD region, with smaller biases and RMSE. Most models reproduced the observed temporal and spatial patterns of NO2 concentrations well in the NCP region, while relatively poor model performance was found in the PRD region in terms of the spatial variations in NO2 concentrations. A sensitivity test with finer horizontal resolutions has been conducted to investigate the potential reasons for the poor model performance in the PRD region. The results show that increasing the model resolution alone cannot improve the model performance in the PRD region, which suggests that the poor model performance in the PRD region would be related more to the coarse resolution and/or inappropriate spatial allocations of the emission inventories in the PRD regions. All models significantly underestimated the CO concentrations in the NCP and PRD regions throughout the year. Such large underestimations of all models are not likely to be fully explained by the model uncertainty, which suggests that CO emissions may be underestimated in current emission inventories. A more accurate estimate of CO emissions is thus needed for the year 2010. Underestimations of CO emissions may have been alleviated in recent years due to the decreasing trends in Chinese CO emissions in recent years (Jiang et al., 2017; Zhong et al., 2017; Sun et al., 2018; Muller et al., 2018; Zheng et al., 2018, 2019). The inversion results of Zheng et al. (2018) also agree well with the MEIC inventory for CO emissions in China from 2013 to 2015. However, uncertainties still exist in the CO emissions for recent years, according to previous studies, the estimated CO emissions in China range from 134 to 202 Tg yr−1 in the year 2013 (Jiang et al., 2017; Zhong et al., 2017; Sun et al., 2018; Muller et al., 2018; Zheng et al., 2018, 2019). Zhao et al. (2017) also suggested a −29 %–40 % uncertainty of CO emissions from the industrial sector in the year 2012. For NH3 simulations, in contrast to the good skills in the monthly variations in NO2 and CO concentrations, all models failed to reproduce the observed monthly variations in NH3 concentrations in the NCP region, as shown by both the surface and satellite measurements. Most models mismatched the observed peak and showed negative correlation coefficient with observations, which may be closely related to the uncertainty in the monthly variations in NH3 emissions and also the uncertainty in the gas–aerosol partitioning of NH3.
Several potential factors were found to be responsible for the model deviation and differences, including the emission inventories, chemistry–meteorology coupling effects, bidirectional exchange of NH3 and the NH3 gas–aerosol partitioning, which are all important aspects with respect to the model improvements in future. Previous studies also suggest that the nitrous acid (HONO) chemistry plays an important role in the atmospheric nitrogen chemistry, which influences the simulations of NO2 and NH3 (Fu et al., 2019; Zhang et al., 2017, 2016). Heterogeneous conversion from NO2 to HONO () is one of the dominant sources of HONO in the atmosphere, which has been considered in most models of MICS-Asia III, including CMAQ since version 4.7, NAQPMS, NHM-Chem and GEOS-Chem. However, some other important sources of HONO may still be underestimated by models in MICS-Asia III. For example, Fu et al. (2019) suggested that the high relative humidity and strong light could enhance the heterogeneous reaction of NO2 and that the photolysis of total nitrate was also an important source of HONO. These sources have not been included in the models of MICS-Asia III, which would lead to the deviations from observations. The intercomparisons of the ensemble models quantified the impacts of model uncertainty on the simulations of these gases, which shows that the impacts of model uncertainty increase with the reactivity of these gases. Models contained more uncertainties in the prediction of NH3 than the other two gases. Based on these findings, we make the following recommendations for future studies.
-
More accurate estimation of CO and NH3 emissions are needed in future studies. Both bottom-up and top-down methods (inversion technique) can help address this problem. The inversion of NH3 emissions would be more complicated than the inversion of CO emissions due to the larger uncertainties in modeling the atmospheric processes of NH3. Nevertheless, it could still provide valuable clues for verifying the bottom-up emission inventories (Zhang et al., 2009) if the models are well validated. In addition, by using ground or satellite measurements, top-down methods could also give valuable information about the spatial and temporal patterns of NH3 emissions, such as the inversion studies by Paulot et al. (2014) and Zhang et al. (2018). However, more attention should be paid to the validations of the model before the inversion estimation of NH3 emissions. How to represent the model uncertainties in the current framework of emission inversion is also an important aspect in future studies. Things could be better for CO, considering its small and weakly spatially dependent model uncertainties.
-
For some highly active and/or short-lived primary pollutants, like NH3, model uncertainty can also make up a large part in the forecast uncertainty. Emission uncertainty alone may not be sufficient to explain the forecast uncertainty and may cause under-dispersive and overconfident forecasts. Future studies are needed of how to better represent the model uncertainties in the model predictions to obtain a better forecast skill. Such model uncertainties also emphasize the need to validate the individual model before using its results to make important policy recommendations.
-
Gas–aerosol partitioning of NH3 is shown to be an important source of uncertainties in NH3 simulation. The formation of particles is mainly limited by the availability of H2SO4 and HNO3 under ammonia-rich conditions, which involves complex chemical reactions, including gas-phase, aqueous-phase and heterogeneous chemistry (Cheng et al., 2016; Wang et al., 2016; Zheng et al., 2015). These processes are needed to be verified and incorporated into models to better represent the chemistry in the atmosphere.
-
The gas chemistry mechanisms used in this study are SAPRC 99, CB05, CBMZ, RACM and RADM2, some of which have an updated version, such as CB06 and SPARC 07. Our conclusions may not be applicable to these newer versions of mechanisms and thus more comparison studies should be performed to understand the differences in these new mechanisms.
The IASI measurements of NH3 total columns used in this study can be downloaded from https://doi.pangaea.de/10.1594/PANGAEA.894736 (last access: 19 December 2019; Van Damme et al., 2018). Simulation results from the 14 participating models are available at https://pan.baidu.com/s/1IaaCDhrAR-z2tO6yQNz2cg (last access: 19 December 2019; Chen et al., 2019). To request the surface observation data for scientific research purposes, please contact Xiao Tang for NO2 and CO concentrations via email (tangxiao@mail.iap.ac.cn) and Yuepeng Pan for NH3 concentrations via email (panyuepeng@mail.iap.ac.cn).
The supplement related to this article is available online at: https://doi.org/10.5194/acp-20-181-2020-supplement.
XT, JZ, ZiW and GRC conducted the design of this study. JSF, XW, SI, KY, TN, HJL, CHK, CYL, LC, MZ, ZT, JL, MK, HL and BG contributed to the modeling data. ZhW performed the simulations of the standard meteorological field. ML and QW provided the emission data. KS provided the CHASER output for boundary conditions. YW, YP and GT provided the observation data. LK and XT performed the analysis and prepared the manuscript with contributions from all authors.
The authors declare that they have no conflict of interest.
This article is part of the special issue “Regional assessment of air pollution and climate change over East and Southeast Asia: results from MICS-Asia Phase III”. It is not associated with a conference.
This study was supported by the National Natural Science Foundation (grant nos. 91644216 and 41620104008), the National Key R&D Program (grant no. 2018YFC0213503), and the Guangdong Provincial Science and Technology Development Special Fund (no. 2017B020216007). Yuepeng Pan acknowledges the National Key Research and Development Program of China (grant nos. 2017YFC0210100 and 2016YFC0201802) and the National Natural Science Foundation of China (grant no. 41405144) for their financial support. We are indebted to the staff who collected the samples at the AMoN-China sites during the study period.
This research has been supported by the National Natural Science Foundation (grant nos. 91644216, 41620104008 and 41405144), the National Key R&D Program (grant no. 2018YFC0213503), the Guangdong Provincial Science and Technology Development Special Fund (grant no. 2017B020216007), and the National Key Research and Development Program of China (grant nos. 2017YFC0210100 and 2016YFC0201802).
This paper was edited by Ashu Dastoor and reviewed by three anonymous referees.
Ackermann, I. J., Hass, H., Memmesheimer, M., Ebel, A., Binkowski, F. S., and Shankar, U.: Modal aerosol dynamics model for Europe: Development and first applications, Atmos. Environ., 32, 2981–2999, https://doi.org/10.1016/S1352-2310(98)00006-5, 1998.
Anenberg, S. C., Horowitz, L. W., Tong, D. Q., and West, J. J.: An Estimate of the Global Burden of Anthropogenic Ozone and Fine Particulate Matter on Premature Human Mortality Using Atmospheric Modeling, Environ. Health Persp., 118, 1189–1195, https://doi.org/10.1289/ehp.0901220, 2010.
Bergamaschi, P., Hein, R., Heimann, M., and Crutzen, P. J.: Inverse modeling of the global CO cycle 1. Inversion of CO mixing ratios, J. Geophys. Res.-Atmos., 105, 1909–1927, https://doi.org/10.1029/1999jd900818, 2000.
Binkowski, F. S. and Roselle, S. J.: Models 3-Community Multiscale Air Quality (CMAQ) model aerosol component: 1. Model description, J. Geophys. Res.-Atmos., 108, 4183, https://doi.org/10.1029/2001JD001409, 2003.
Byun, D. and Schere, K. L.: Review of the governing equations, computational algorithms, and other components of the models-3 Community Multiscale Air Quality (CMAQ) modeling system, Appl. Mech. Rev., 59, 51–77, https://doi.org/10.1115/1.2128636, 2006.
Carmichael, G. R., Calori, G., Hayami, H., Uno, I., Cho, S. Y., Engardt, M., Kim, S. B., Ichikawa, Y., Ikeda, Y., Woo, J. H., Ueda, H., and Amann, M.: The MICS-Asia study: model intercomparison of long-range transport and sulfur deposition in East Asia, Atmos. Environ., 36, 175–199, https://doi.org/10.1016/s1352-2310(01)00448-4, 2002.
Carmichael, G. R., Sakurai, T., Streets, D., Hozumi, Y., Ueda, H., Park, S., Fung, C., Han, Z., Kajino, M., and Engardt, M.: MICS-Asia II: The model intercomparison study for Asia Phase II methodology and overview of findings, Atmos. Environ., 42, 3468–3490, https://doi.org/10.1016/j.atmosenv.2007.04.007, 2008.
Carter, W. P. L.: Implementation of the SAPRC-99 Chemical Mechanism into the Models-3 Framework, Report to the United States Environmental Protection Agency, available at: http://www.cert.ucr.edu/~carter/absts.htm#s99mod3 (last access: 20 December 2019), 2000.
Chen, L., Gao, Y., Zhang, M., Fu, J. S., Zhu, J., Liao, H., Li, J., Huang, K., Ge, B., Wang, X., Lam, Y. F., Lin, C.-Y., Itahashi, S., Nagashima, T., Kajino, M., Yamaji, K., Wang, Z., and Kurokawa, J.: MICS-Asia III: multi-model comparison and evaluation of aerosol over East Asia, Atmos. Chem. Phys., 19, 11911–11937, https://doi.org/10.5194/acp-19-11911-2019, 2019.
Cheng, Y. F., Zheng, G. J., Wei, C., Mu, Q., Zheng, B., Wang, Z. B., Gao, M., Zhang, Q., He, K. B., Carmichael, G., Poschl, U., and Su, H.: Reactive nitrogen chemistry in aerosol water as a source of sulfate during haze events in China, Sci. Adv., 2, E1601530, https://doi.org/10.1126/sciadv.1601530, 2016.
Chin, M., Ginoux, P., Kinne, S., Torres, O., Holben, B., Duncan, B. N., Martin, R. V., Logan, J., Higurashi, A., and Nakajima T.: Tropospheric aerosol optical thickness from the GOCART model and comparisons with satellite and sun photometer measurements, J. Atmos. Phys., 59, 461–483, https://doi.org/10.1029/2000jd900384, 2012.
Colella, P. and Woodward, P. L.: The piecewise parabolic method (PPM) for gas-dynamical simulations, J. Comput. Phys., 54, 174–201, https://doi.org/10.1016/0021-9991(84)90143-8, 1984.
Dabberdt, W. F., and Miller, E.: Uncertainty, ensembles and air quality dispersion modeling: applications and challenges, Atmos. Environ., 34, 4667–4673, https://doi.org/10.1016/s1352-2310(00)00141-2, 2000.
Dentener, F. J. and Crutzen, P. J.: Reaction Of N2O5 On Tropospheric Aerosols – Impact On The Global Distributions Of NOx, O3, and OH, J. Geophys. Res.-Atmos., 98, 7149–7163, https://doi.org/10.1029/92jd02979, 1993.
Easter, R. C., Ghan, S. J., Zhang, Y., Saylor, R. D., Chapman, E. G., Laulainen, N. S., Abdul-Razzak, H., Leung, L. R., Bian, X. D., and Zaveri, R. A.: MIRAGE: Model description and evaluation of aerosols and trace gases, J. Geophys. Res.-Atmos., 109, D20210, https://doi.org/10.1029/2004jd004571, 2004.
Evans, M. J. and Jacob, D. J.: Impact of new laboratory studies of N2O5 hydrolysis on global model budgets of tropospheric nitrogen oxides, ozone, and OH, Geophys. Res. Lett., 32, L09813, https://doi.org/10.1029/2005gl022469, 2005.
Fine, J., Vuilleumier, L., Reynolds, S., Roth, P., and Brown, N.: Evaluating uncertainties in regional photochemicalair quality modeling, Annu. Rev. Env. Resour., 28, 59–106, https://doi.org/10.1146/annurev.energy.28.011503.163508, 2003.
Fountoukis, C. and Nenes, A.: ISORROPIA II: a computationally efficient thermodynamic equilibrium model for K+–Ca2+–Mg2+––Na+–––Cl−–H2O aerosols, Atmos. Chem. Phys., 7, 4639–4659, https://doi.org/10.5194/acp-7-4639-2007, 2007.
Fu, X., Wang, T., Zhang, L., Li, Q., Wang, Z., Xia, M., Yun, H., Wang, W., Yu, C., Yue, D., Zhou, Y., Zheng, J., and Han, R.: The significant contribution of HONO to secondary pollutants during a severe winter pollution event in southern China, Atmos. Chem. Phys., 19, 1–14, https://doi.org/10.5194/acp-19-1-2019, 2019.
Galmarini, S., Bianconi, R., Klug, W., Mikkelsen, T., Addis, R., Andronopoulos, S., Astrup, P., Baklanov, A., Bartniki, J., Bartzis, J. C., Bellasio, R., Bompay, F., Buckley, R., Bouzom, M., Champion, H., D'Amours, R., Davakis, E., Eleveld, H., Geertsema, G. T., Glaab, H., Kollax, M., Ilvonen, M., Manning, A., Pechinger, U., Persson, C., Polreich, E., Potemski, S., Prodanova, M., Saltbones, J., Slaper, H., Sofiev, M. A., Syrakov, D., Sørensen, J. H., Auwera, L. V. d., Valkama, I., and Zelazny, R.: Ensemble dispersion forecasting – Part I: concept, approach and indicators, Atmos. Environ., 38, 4607–4617, https://doi.org/10.1016/j.atmosenv.2004.05.030, 2004.
Gao, D. F., Stockwell, W. R., and Milford, J. B.: Global uncertainty analysis of a regional-scale gas-phase chemical mechanism, J. Geophys. Res.-Atmos., 101, 9107–9119, https://doi.org/10.1029/96jd00060, 1996.
Gao, M., Han, Z., Liu, Z., Li, M., Xin, J., Tao, Z., Li, J., Kang, J.-E., Huang, K., Dong, X., Zhuang, B., Li, S., Ge, B., Wu, Q., Cheng, Y., Wang, Y., Lee, H.-J., Kim, C.-H., Fu, J. S., Wang, T., Chin, M., Woo, J.-H., Zhang, Q., Wang, Z., and Carmichael, G. R.: Air quality and climate change, Topic 3 of the Model Inter-Comparison Study for Asia Phase III (MICS-Asia III) – Part 1: Overview and model evaluation, Atmos. Chem. Phys., 18, 4859–4884, https://doi.org/10.5194/acp-18-4859-2018, 2018.
Gillenwater, M.: Forgotten carbon: indirect CO2 in greenhouse gas emission inventories, Environ. Sci. Pol., 11, 195–203, https://doi.org/10.1016/j.envsci.2007.09.001, 2008.
Goliff, W. S., Stockwell, W. R., and Lawson, C. V.: The regional atmospheric chemistry mechanism, version 2, Atmos. Environ., 68, 174–185, https://doi.org/10.1016/j.atmosenv.2012.11.038, 2013.
Grell, G. A., Peckham, S. E., Schmitz, R., McKeen, S. A., Frost, G., Skamarock, W. C., and Eder, B.: Fully coupled “online” chemistry within the WRF model, Atmos. Environ., 39, 6957–6975, https://doi.org/10.1016/j.atmosenv.2005.04.027, 2005.
Guenther, A., Karl, T., Harley, P., Wiedinmyer, C., Palmer, P. I., and Geron, C.: Estimates of global terrestrial isoprene emissions using MEGAN (Model of Emissions of Gases and Aerosols from Nature), Atmos. Chem. Phys., 6, 3181–3210, https://doi.org/10.5194/acp-6-3181-2006, 2006.
Han, K. M., Song, C. H., Ahn, H. J., Park, R. S., Woo, J. H., Lee, C. K., Richter, A., Burrows, J. P., Kim, J. Y., and Hong, J. H.: Investigation of NOx emissions and NOx-related chemistry in East Asia using CMAQ-predicted and GOME-derived NO2 columns, Atmos. Chem. Phys., 9, 1017–1036, https://doi.org/10.5194/acp-9-1017-2009, 2009.
Han, Z., Sakurai, T., Ueda, H., Carmichael, G., Streets, D., Hayami, H., Wang, Z., Holloway, T., Engardt, M., and Hozumi, Y.: MICS-Asia II: Model intercomparison and evaluation of ozone and relevant species, Atmos. Environ., 42, 3491–3509, https://doi.org/10.1016/j.atmosenv.2007.07.031, 2008.
Hanna, S. R., Lu, Z. G., Frey, H. C., Wheeler, N., Vukovich, J., Arunachalam, S., Fernau, M., and Hansen, D. A.: Uncertainties in predicted ozone concentrations due to input uncertainties for the UAM-V photochemical grid model applied to the July 1995 OTAG domain, Atmos. Environ., 35, 891–903, https://doi.org/10.1016/s1352-2310(00)00367-8, 2001.
Hong, S. Y., Noh, Y., and Dudhia, J.: A new vertical diffusion package with an explicit treatment of entrainment processes, Mon. Weather Rev., 134, 2318–2341, https://doi.org/10.1175/MWR3199.1, 2006.
Horowitz, L. W., Walters, S. M., Mauzerall, D. L., Emmons, L. K., Rasch, P. J., Granier, C., Tie, X., Lamarque, J.-F., Schultz, M. G., and Brasseur, G. P: A global simulation of tropospheric ozone and related tracers: description and evaluation of MOZART, version 2, J. Geophys. Res.-Atmos., 108, 4784, https://doi.org/10.1029/2002JD002853, 2003.
Janssens-Maenhout, G., Crippa, M., Guizzardi, D., Dentener, F., Muntean, M., Pouliot, G., Keating, T., Zhang, Q., Kurokawa, J., Wankmüller, R., Denier van der Gon, H., Kuenen, J. J. P., Klimont, Z., Frost, G., Darras, S., Koffi, B., and Li, M.: HTAP_v2.2: a mosaic of regional and global emission grid maps for 2008 and 2010 to study hemispheric transport of air pollution, Atmos. Chem. Phys., 15, 11411–11432, https://doi.org/10.5194/acp-15-11411-2015, 2015.
Ji, D. S., Wang, Y. S., Wang, L. L., Chen, L. F., Hu, B., Tang, G. Q., Xin, J. Y., Song, T., Wen, T. X., Sun, Y., Pan, Y. P., and Liu, Z. R.: Analysis of heavy pollution episodes in selected cities of northern China, Atmos. Environ., 50, 338–348, https://doi.org/10.1016/j.atmosenv.2011.11.053, 2012.
Jiang, Z., Worden, J. R., Worden, H., Deeter, M., Jones, D. B. A., Arellano, A. F., and Henze, D. K.: A 15-year record of CO emissions constrained by MOPITT CO observations, Atmos. Chem. Phys., 17, 4565–4583, https://doi.org/10.5194/acp-17-4565-2017, 2017.
Jin, X. M. and Holloway, T.: Spatial and temporal variability of ozone sensitivity over China observed from the Ozone Monitoring Instrument, J. Geophys. Res.-Atmos., 120, 7229–7246, https://doi.org/10.1002/2015jd023250, 2015.
Kajino, M., Inomata, Y., Sato, K., Ueda, H., Han, Z., An, J., Katata, G., Deushi, M., Maki, T., Oshima, N., Kurokawa, J., Ohara, T., Takami, A., and Hatakeyama, S.: Development of the RAQM2 aerosol chemical transport model and predictions of the Northeast Asian aerosol mass, size, chemistry, and mixing type, Atmos. Chem. Phys., 12, 11833–11856, https://doi.org/10.5194/acp-12-11833-2012, 2012.
Kajino, M., Deushi, M., Sekiyama, T. T., Oshima, N., Yumimoto, K., Tanaka, T. Y., Ching, J., Hashimoto, A., Yamamoto, T., Ikegami, M., Kamada, A., Miyashita, M., Inomata, Y., Shima, S., Adachi, K., Zaizen, Y., Igarashi, Y., Ueda, H., Maki, T., and Mikami, M.: NHM-Chem, the Japan MeteorologicalAgency's regional meteorology – chemistry model (v1.0): model description and aerosol representations, Geosci. Model Dev. Discuss., https://doi.org/10.5194/gmd-2018-128, 2018.
Khoder, M. I.: Atmospheric conversion of sulfur dioxide to particulate sulfate and nitrogen dioxide to particulate nitrate and gaseous nitric acid in an urban area, Chemosphere, 49, 675–684, https://doi.org/10.1016/s0045-6535(02)00391-0, 2002.
Kurokawa, J., Ohara, T., Morikawa, T., Hanayama, S., Janssens-Maenhout, G., Fukui, T., Kawashima, K., and Akimoto, H.: Emissions of air pollutants and greenhouse gases over Asian regions during 2000–2008: Regional Emission inventory in ASia (REAS) version 2, Atmos. Chem. Phys., 13, 11019–11058, https://doi.org/10.5194/acp-13-11019-2013, 2013.
Lelieveld, J., Evans, J. S., Fnais, M., Giannadaki, D., and Pozzer, A.: The contribution of outdoor air pollution sources to premature mortality on a global scale, Nature, 525, 367–371, https://doi.org/10.1038/nature15371, 2015.
Levy, H.: Normal Atmosphere – Large Radical And Formaldehyde Concentrations Predicted, Science, 173, 141–143, https://doi.org/10.1126/science.173.3992.141, 1971.
Li, J., Du, H. Y., Wang, Z. F., Sun, Y. L., Yang, W. Y., Li, J. J., Tang, X., and Fu, P. Q.: Rapid formation of a severe regional winter haze episode over a mega-city cluster on the North China Plain, Environ. Pollut., 223, 605–615, https://doi.org/10.1016/j.envpol.2017.01.063, 2017.
Li, J., Nagashima, T., Kong, L., Ge, B., Yamaji, K., Fu, J. S., Wang, X., Fan, Q., Itahashi, S., Lee, H.-J., Kim, C.-H., Lin, C.-Y., Zhang, M., Tao, Z., Kajino, M., Liao, H., Li, M., Woo, J.-H., Kurokawa, J., Wang, Z., Wu, Q., Akimoto, H., Carmichael, G. R., and Wang, Z.: Model evaluation and intercomparison of surface-level ozone and relevant species in East Asia in the context of MICS-Asia Phase III – Part 1: Overview, Atmos. Chem. Phys., 19, 12993–13015, https://doi.org/10.5194/acp-19-12993-2019, 2019.
Li, M., Zhang, Q., Kurokawa, J.-I., Woo, J.-H., He, K., Lu, Z., Ohara, T., Song, Y., Streets, D. G., Carmichael, G. R., Cheng, Y., Hong, C., Huo, H., Jiang, X., Kang, S., Liu, F., Su, H., and Zheng, B.: MIX: a mosaic Asian anthropogenic emission inventory under the international collaboration framework of the MICS-Asia and HTAP, Atmos. Chem. Phys., 17, 935–963, https://doi.org/10.5194/acp-17-935-2017, 2017.
Lin, J. T. and McElroy, M. B.: Impacts of boundary layer mixing on pollutant vertical profiles in the lower troposphere: implications to satellite remote sensing, Atmos. Environ., 44, 1726–1739, https://doi.org/10.1016/j.atmosenv.2010.02.009, 2010.
Lu, M. M., Tang, X., Wang, Z. F., Gbaguidi, A., Liang, S. W., Hu, K., Wu, L., Wu, H. J., Huang, Z., and Shen, L. J.: Source tagging modeling study of heavy haze episodes under complex regional transport processes over Wuhan megacity, Central China, Environ. Pollut., 231, 612–621, https://doi.org/10.1016/j.envpol.2017.08.046, 2017.
Ma, C. Q., Wang, T. J., Mizzi, A. P., Anderson, J. L., Zhuang, B. L., Xie, M., and Wu, R. S.: Multiconstituent Data Assimilation With WRF-Chem/DART: Potential for Adjusting Anthropogenic Emissions and Improving Air Quality Forecasts Over Eastern China, J. Geophys. Res.-Atmos., 124, 7393–7412, https://doi.org/10.1029/2019jd030421, 2019.
Mallet, V. and Sportisse, B.: Uncertainty in a chemistry-transport model due to physical parameterizations and numerical approximations: An ensemble approach applied to ozone modeling, J. Geophys. Res.-Atmos., 111, D01302, https://doi.org/10.1029/2005jd006149, 2006.
Martin, R. V., Jacob, D. J., Logan, J. A., Bey, I., Yantosca, R. M., Staudt, A. C., Li, Q., Fiore, A. M., Duncan, B. N., and Liu, H.: Interpretation of TOMs observations of tropical tropospheric ozone with a global model and in situ observations, J. Geophys. Res.-Atmos, 107, 4351, https://doi.org/10.1029/2001JD001480, 2002.
Meng, Z. Y., Lin, W. L., Jiang, X. M., Yan, P., Wang, Y., Zhang, Y. M., Jia, X. F., and Yu, X. L.: Characteristics of atmospheric ammonia over Beijing, China, Atmos. Chem. Phys., 11, 6139–6151, https://doi.org/10.5194/acp-11-6139-2011, 2011.
Miyazaki, K., Eskes, H. J., Sudo, K., Takigawa, M., van Weele, M., and Boersma, K. F.: Simultaneous assimilation of satellite NO2, O3, CO, and HNO3 data for the analysis of tropospheric chemical composition and emissions, Atmos. Chem. Phys., 12, 9545–9579, https://doi.org/10.5194/acp-12-9545-2012, 2012.
Muller, J. F., Stavrakou, T., Bauwens, M., George, M., Hurtmans, D., Coheur, P. F., Clerbaux, C., and Sweeney, C.: Top-Down CO Emissions Based On IASI Observations and Hemispheric Constraints on OH Levels, Geophys. Res. Lett., 45, 1621–1629, https://doi.org/10.1002/2017gl076697, 2018.
Naik, V., Voulgarakis, A., Fiore, A. M., Horowitz, L. W., Lamarque, J.-F., Lin, M., Prather, M. J., Young, P. J., Bergmann, D., Cameron-Smith, P. J., Cionni, I., Collins, W. J., Dalsøren, S. B., Doherty, R., Eyring, V., Faluvegi, G., Folberth, G. A., Josse, B., Lee, Y. H., MacKenzie, I. A., Nagashima, T., van Noije, T. P. C., Plummer, D. A., Righi, M., Rumbold, S. T., Skeie, R., Shindell, D. T., Stevenson, D. S., Strode, S., Sudo, K., Szopa, S., and Zeng, G.: Preindustrial to present-day changes in tropospheric hydroxyl radical and methane lifetime from the Atmospheric Chemistry and Climate Model Intercomparison Project (ACCMIP), Atmos. Chem. Phys., 13, 5277–5298, https://doi.org/10.5194/acp-13-5277-2013, 2013.
Nemitz, E., Milford, C., and Sutton, M. A.: A two-layer canopy compensation point model for describing bi-directional biosphere-atmosphere exchange of ammonia, Q. J. Roy. Meteor. Soc., 127, 815–833, https://doi.org/10.1256/smsqj.57305, 2001.
Nenes, A., Pandis, S. N., and Pilinis, C.: ISORROPIA: A new thermodynamic equilibrium model for multiphase multicomponent inorganic aerosols, Aquat. Geoch., 4, 123–152, https://doi.org/10.1023/a:1009604003981, 1998.
Novelli, P. C., Masarie, K. A., and Lang, P. M.: Distributions and recent changes of carbon monoxide in the lower troposphere, J. Geophys. Res.-Atmos., 103, 19015–19033, https://doi.org/10.1029/98jd01366, 1998.
Pan, Y. P., Wang, Y. S., Tang, G. Q., and Wu, D.: Wet and dry deposition of atmospheric nitrogen at ten sites in Northern China, Atmos. Chem. Phys., 12, 6515–6535, https://doi.org/10.5194/acp-12-6515-2012, 2012.
Pan, Y. P., Tian, S., Zhao, Y., Zhang, L., Zhu, X., Gao, J., Huang, W., Zhou, Y., Song, Y., Zhang, Q., and Wang, Y.: Identifying ammonia hotspots in China using a national observation network, Environ. Sci. Technol., 52, 3926–3934, https://doi.org/10.1021/acs.est.7b05235, 2018.
Paulot, F., Jacob, D. J., Pinder, R. W., Bash, J. O., Travis, K., and Henze, D. K.: Ammonia emissions in the United States, European Union, and China derived by high-resolution inversion of ammonium wet deposition data: Interpretation with a new agricultural emissions inventory (MASAGE_NH3), J. Geophys. Res.-Atmos., 119, 4343–4364, https://doi.org/10.1002/2013jd021130, 2014.
Peters-Lidard, C. D., Kemp, E. M., Matsui, T., Santanello, J. A., Kumar, S. V., Jacob, J. P., Clune, T., Tao, W. K., Chin, M., Hou, A., Case, J. L., Kim, D., Kim, K. M., Lau, W., Liu, Y. Q., Shi, J., Starr, D., Tan, Q., Tao, Z. N., Zaitchik, B. F., Zavodsky, B., Zhang, S. Q., and Zupanski, M.: Integrated modeling of aerosol, cloud, precipitation and land processes at satellite-resolved scales, Environ. Modell. Softw., 67, 149–159, https://doi.org/10.1016/j.envsoft.2015.01.007, 2015.
Pétron, G., Granier, C., Khattatov, B., Lamarque, J. F., Yudin, V., Muller, J. F., and Gille, J.: Inverse modeling of carbon monoxide surface emissions using Climate Monitoring and Diagnostics Laboratory network observations, J. Geophys. Res.-Atmos., 107, 4761, https://doi.org/10.1029/2001jd001305, 2002.
Pétron, G., Granier, C., Khattatov, B., Yudin, V., Lamarque, J. F., Emmons, L., Gille, J., and Edwards, D. P.: Monthly CO surface sources inventory based on the 2000–2001 MOPITT satellite data, Geophys. Res. Lett., 31, L21107, https://doi.org/10.1029/2004gl020560, 2004.
Pielke, R. A., Cotton, W. R., Walko, R. L., Tremback, C. J., Lyons, W. A., Grasso, L. D., Nicholls, M. E., Moran, M. D., Wesley, D. A., Lee, T. J., and Copeland, J. H.: A Comprehensive Meteorological Modeling System – RAMS, Meteorol. Atmos. Phys., 49, 69–91, https://doi.org/10.1007/bf01025401, 1992.
Pinder, R. W., Adams, P. J., Pandis, S. N., and Gilliland, A. B.: Temporally resolved ammonia emission inventories: Current estimates, evaluation tools, and measurement needs, J. Geophys. Res.-Atmos., 111, D16310, https://doi.org/10.1029/2005jd006603, 2006.
Pleim, J. E.: A combined local and nonlocal closure model for the atmospheric boundary layer, Part I: Model description and testing, J. Appl. Meteorol. Clim., 46, 1383–1395, https://doi.org/10.1175/JAM2539.1, 2007.
Pleim, J. E., Xiu, A., Finkelstein, P. L., and Otte, T. L.: A Coupled Land-Surface and Dry Deposition Model and Comparison to Field Measurements of Surface Heat, Moisture, and Ozone Fluxes, Water Air Soil Poll., 1, 243–252, https://doi.org/10.1023/a:1013123725860, 2001.
Randerson, J. T., van der Werf, G. R., Giglio, L., Collatz, G. J., and Kasibhatla, P. S.: Global Fire Emissions Database, Version 3 (GFEDv3.1). Data set, Oak Ridge National Laboratory Distributed Active Archive Center, Oak Ridge, Tennessee, USA, https://doi.org/10.3334/ORNLDAAC/1191, 2013.
Rao, S. T., Galmarini, S., and Puckett, K.: Air Quality Model Evaluation International Initiative (AQMEII) Advancing the State of the Science in Regional Photochemical Modeling and Its Applications, B. Am. Meteorol. Soc., 92, 23–30, https://doi.org/10.1175/2010bams3069.1, 2011.
Saito, K., Fujita, T., Yamada, Y., Ishida, J. I., Kumagai, Y., Aranami, K., Ohmori, S., Nagasawa, R., Kumagai, S., Muroi, C., Kato, T., Eito, H., and Yamazaki, Y.: The operational JMA nonhydrostatic mesoscale model, Mon. Weather Rev., 134, 1266–1298, https://doi.org/10.1175/mwr3120.1, 2006.
Seinfeld, J. H. and Pandis, S. N.: Atmospheric Chemistry and Physics – From Air Pollution to Climate Change, John Wiley & Sons, New York, USA, 1998.
Shao, M., Zhang, Y. H., Zeng, L. M., Tang, X. Y., Zhang, J., Zhong, L. J., and Wang, B. G.: Ground-level ozone in the Pearl River Delta and the roles of VOC and NOx in its production, J. Environ. Manage., 90, 512–518, https://doi.org/10.1016/j.jenvman.2007.12.008, 2009.
Shen, J. L., Liu, X. J., Zhang, Y., Fangmeier, A., Goulding, K., and Zhang, F. S.: Atmospheric ammonia and particulate ammonium from agricultural sources in the North China Plain, Atmos. Environ., 45, 5033–5041, https://doi.org/10.1016/j.atmosenv.2011.02.031, 2011.
Sillman, S.: The relation between ozone, NOx and hydrocarbons in urban and polluted rural environments, Atmos. Environ., 33, 1821–1845, https://doi.org/10.1016/s1352-2310(98)00345-8, 1999.
Skamarock, W. C.: A description of the advanced research WRF version 3, Ncar Technical, 113, 7–25, 2008.
Stein, O., Schultz, M. G., Bouarar, I., Clark, H., Huijnen, V., Gaudel, A., George, M., and Clerbaux, C.: On the wintertime low bias of Northern Hemisphere carbon monoxide found in global model simulations, Atmos. Chem. Phys., 14, 9295–9316, https://doi.org/10.5194/acp-14-9295-2014, 2014.
Stockwell, W. R., Middleton, P., Chang, J. S., and Tang, X.: The second generation regional Acid Deposition Model chemical mechanism for regional air quality modeling, J. Geophys. Res., 95, 16343–16367, https://doi.org/10.1029/JD095iD10p16343, 1990.
Sudo, K., Takahashi, M., Kurokawa, J., and Akimoto, H.: CHASER: A global chemical model of the troposphere – 1. Model description, J. Geophys. Res.-Atmos., 107, 4339, https://doi.org/10.1029/2001jd001113, 2002a.
Sudo, K., Takahashi, M., and Akimoto, H.: CHASER: A global chemical model of the troposphere – 2. Model results and evaluation, J. Geophys. Res.-Atmos., 107, 4586, https://doi.org/10.1029/2001jd001114, 2002b.
Sun, W., Shao, M., Granier, C., Liu, Y., Ye, C. S., and Zheng, J. Y.: Long-Term Trends of Anthropogenic SO2, NOx, CO, and NMVOCs Emissions in China, Earth Future, 6, 1112–1133, https://doi.org/10.1029/2018ef000822, 2018.
Sun, Y. L., Wang, Z. F., Dong, H. B., Yang, T., Li, J., Pan, X. L., Chen, P., and Jayne, J. T.: Characterization of summer organic and inorganic aerosols in Beijing, China with an Aerosol Chemical Speciation Monitor, Atmos. Environ., 51, 250–259, https://doi.org/10.1016/j.atmosenv.2012.01.013, 2012.
Sun, Y. L., Wang, Z. F., Fu, P. Q., Yang, T., Jiang, Q., Dong, H. B., Li, J., and Jia, J. J.: Aerosol composition, sources and processes during wintertime in Beijing, China, Atmos. Chem. Phys., 13, 4577–4592, https://doi.org/10.5194/acp-13-4577-2013, 2013.
Tan, J., Fu, J. S., Carmichael, G. R., Itahashi, S., Tao, Z., Huang, K., Dong, X., Yamaji, K., Nagashima, T., Wang, X., Liu, Y., Lee, H.-J., Lin, C.-Y., Ge, B., Kajino, M., Zhu, J., Zhang, M., Hong, L., and Wang, Z.: Why models perform differently on particulate matter over East Asia? – A multi-model intercomparison study for MICS-Asia III, Atmos. Chem. Phys. Discuss., https://doi.org/10.5194/acp-2019-392, in review, 2019.
Tang, G., Wang, Y., Li, X., Ji, D., Hsu, S., and Gao, X.: Spatial-temporal variations in surface ozone in Northern China as observed during 2009–2010 and possible implications for future air quality control strategies, Atmos. Chem. Phys., 12, 2757–2776, https://doi.org/10.5194/acp-12-2757-2012, 2012.
Tang, X., Zhu, J., Wang, Z. F., and Gbaguidi, A.: Improvement of ozone forecast over Beijing based on ensemble Kalman filter with simultaneous adjustment of initial conditions and emissions, Atmos. Chem. Phys., 11, 12901–12916, https://doi.org/10.5194/acp-11-12901-2011, 2011.
Tang, X., Zhu, J., Wang, Z. F., Wang, M., Gbaguidi, A., Li, J., Shao, M., Tang, G. Q., and Ji, D. S.: Inversion of CO emissions over Beijing and its surrounding areas with ensemble Kalman filter, Atmos. Environ., 81, 676–686, https://doi.org/10.1016/j.atmosenv.2013.08.051, 2013.
Uno, I., He, Y., Ohara, T., Yamaji, K., Kurokawa, J.-I., Katayama, M., Wang, Z., Noguchi, K., Hayashida, S., Richter, A., and Burrows, J. P.: Systematic analysis of interannual and seasonal variations of model-simulated tropospheric NO2 in Asia and comparison with GOME-satellite data, Atmos. Chem. Phys., 7, 1671–1681, https://doi.org/10.5194/acp-7-1671-2007, 2007.
US EPA Office of Research and Development: CMAQv5.0, Zenodo, https://doi.org/10.5281/zenodo.1079888, 2012.
Van Damme, M., Whitburn, S., Clarisse, L., Clerbaux, C., Hurtmans, D., and Coheur, P.-F.: Version 2 of the IASI NH3 neural network retrieval algorithm: near-real-time and reanalysed datasets, Atmos. Meas. Tech., 10, 4905–4914, https://doi.org/10.5194/amt-10-4905-2017, 2017.
Van Damme, M., Clarisse, L., Whitburn, S., Hadji-Lazaro, J., Hurtmans, D., Clerbaux, C., and Coheur, P.-F.: Level 2 dataset and Level 3 oversampled average map of the IASI/Metop-A ammonia (NH3) morning column measurements (ANNI-NH3-v2.1R-I) from 2008 to 2016, PANGAEA, https://doi.org/10.1594/PANGAEA.894736, 2018.
van Noije, T. P. C., Eskes, H. J., Dentener, F. J., Stevenson, D. S., Ellingsen, K., Schultz, M. G., Wild, O., Amann, M., Atherton, C. S., Bergmann, D. J., Bey, I., Boersma, K. F., Butler, T., Cofala, J., Drevet, J., Fiore, A. M., Gauss, M., Hauglustaine, D. A., Horowitz, L. W., Isaksen, I. S. A., Krol, M. C., Lamarque, J.-F., Lawrence, M. G., Martin, R. V., Montanaro, V., Müller, J.-F., Pitari, G., Prather, M. J., Pyle, J. A., Richter, A., Rodriguez, J. M., Savage, N. H., Strahan, S. E., Sudo, K., Szopa, S., and van Roozendael, M.: Multi-model ensemble simulations of tropospheric NO2 compared with GOME retrievals for the year 2000, Atmos. Chem. Phys., 6, 2943–2979, https://doi.org/10.5194/acp-6-2943-2006, 2006.
von Bobrutzki, K., Braban, C. F., Famulari, D., Jones, S. K., Blackall, T., Smith, T. E. L., Blom, M., Coe, H., Gallagher, M., Ghalaieny, M., McGillen, M. R., Percival, C. J., Whitehead, J. D., Ellis, R., Murphy, J., Mohacsi, A., Pogany, A., Junninen, H., Rantanen, S., Sutton, M. A., and Nemitz, E.: Field inter-comparison of eleven atmospheric ammonia measurement techniques, Atmos. Meas. Tech., 3, 91–112, https://doi.org/10.5194/amt-3-91-2010, 2010.
Walcek, C. J. and Aleksic, N. M.: A simple but accurate mass conservative peak-preserving, mixing ratio bounded advection algorithm with fortran code, Atmos. Environ., 32, 3863–3880, https://doi.org/10.1016/S1352-2310(98)00099-5, 1998.
Wang, G., Zhang, R., Gomez, M. E., Yang, L., Zamora, M. L., Hu, M., Lin, Y., Peng, J., Guo, S., and Meng, J.: Persistent sulfate formation from London Fog to Chinese haze, P. Natl. Acad. Sci. USA, 113, 13630, https://doi.org/10.1073/pnas.1616540113, 2016.
Wang, Z. F., Maeda, T., Hayashi, M., Hsiao, L. F., and Liu, K. Y.: A nested air quality prediction modeling system for urban and regional scales: Application for high-ozone episode in Taiwan, Water Air Soil Pollut., 130, 391–396, https://doi.org/10.1023/a:1013833217916, 2001.
Warner, J. X., Wei, Z., Strow, L. L., Dickerson, R. R., and Nowak, J. B.: The global tropospheric ammonia distribution as seen in the 13-year AIRS measurement record, Atmos. Chem. Phys., 16, 5467–5479, https://doi.org/10.5194/acp-16-5467-2016, 2016.
Warner, J. X., Dickerson, R. R., Wei, Z., Strow, L. L., Wang, Y., and Liang, Q.: Increased atmospheric ammonia over the world's major agricultural areas detected from space, Geophys. Res. Lett., 44, 2875–2884, https://doi.org/10.1002/2016gl072305, 2017.
Wesely, M. L.: Parameterization of surface resistances to gaseous dry deposition in regional-scale numerical models, Atmos. Environ., 23, 1293–1304, https://doi.org/10.1016/0004-6981(89)90153-4, 1989.
Xu, W., Wu, Q. H., Liu, X. J., Tang, A. H., Dore, A., and Heal, M.: Characteristics of ammonia, acid gases, and PM2.5 for three typical land-use types in the North China Plain, Environ. Sci. Pollut. R., 23, 1158–1172, https://doi.org/10.1007/s11356-015-5648-3, 2016.
Xu, Z., Wang, T., Xue, L. K., Louie, P. K. K., Luk, C. W. Y., Gao, J., Wang, S. L., Chai, F. H., and Wang, W. X.: Evaluating the uncertainties of thermal catalytic conversion in measuring atmospheric nitrogen dioxide at four differently polluted sites in China, Atmos. Environ., 76, 221–226, https://doi.org/10.1016/j.atmosenv.2012.09.043, 2013.
Xu, Z., Liu, M., Zhang, M., Song, Y., Wang, S., Zhang, L., Xu, T., Wang, T., Yan, C., Zhou, T., Sun, Y., Pan, Y., Hu, M., Zheng, M., and Zhu, T.: High efficiency of livestock ammonia emission controls in alleviating particulate nitrate during a severe winter haze episode in northern China, Atmos. Chem. Phys., 19, 5605–5613, https://doi.org/10.5194/acp-19-5605-2019, 2019.
Yamartino, R. J.: Nonnegative, conserved scalar transport using grid-cell-centered, spectrally constrained Blackman cubics for applications on a variable-thickness mesh, Mon. Weather Rev., 121, 753–763, https://doi.org/10.1175/1520-0493(1993)121<0753:NCSTUG>2.0.CO;2, 1993.
Yarwood, G., Rao, S., Yocke, M., and Whitten, G. Z.: Updates to the Carbon Bond chemical mechanism: CB05, ENVIRON International Corporation, Novato, CA, available at: http://www.camx.com/publ/pdfs/cb05_final_report_120805.pdf (last access: 2 January 2020), 2005.
Zaveri, R. A. and Peters, L. K.: A new lumped structure photochemical mechanism for large-scale applications, J. Geophys. Res., 104, 30387–30415, https://doi.org/10.1029/1999JD900876, 1999.
Zhang, L., Brook, J. R., and Vet, R.: A revised parameterization for gaseous dry deposition in air-quality models, Atmos. Chem. Phys., 3, 2067–2082, https://doi.org/10.5194/acp-3-2067-2003, 2003.
Zhang, L., Wang, T., Zhang, Q., Zheng, J. Y., Xu, Z., and Lv, M. Y.: Potential sources of nitrous acid (HONO) and their impacts on ozone: A WRF-Chem study in a polluted subtropical region, J. Geophys. Res.-Atmos., 121, 3645–3662, https://doi.org/10.1002/2015jd024468, 2016.
Zhang, L., Li, Q., Wang, T., Ahmadov, R., Zhang, Q., Li, M., and Lv, M.: Combined impacts of nitrous acid and nitryl chloride on lower-tropospheric ozone: new module development in WRF-Chem and application to China, Atmos. Chem. Phys., 17, 9733–9750, https://doi.org/10.5194/acp-17-9733-2017, 2017.
Zhang, L., Chen, Y., Zhao, Y., Henze, D. K., Zhu, L., Song, Y., Paulot, F., Liu, X., Pan, Y., Lin, Y., and Huang, B.: Agricultural ammonia emissions in China: reconciling bottom-up and top-down estimates, Atmos. Chem. Phys., 18, 339–355, https://doi.org/10.5194/acp-18-339-2018, 2018.
Zhang, Q., Streets, D. G., Carmichael, G. R., He, K. B., Huo, H., Kannari, A., Klimont, Z., Park, I. S., Reddy, S., Fu, J. S., Chen, D., Duan, L., Lei, Y., Wang, L. T., and Yao, Z. L.: Asian emissions in 2006 for the NASA INTEX-B mission, Atmos. Chem. Phys., 9, 5131–5153, https://doi.org/10.5194/acp-9-5131-2009, 2009.
Zhang, Q., Pan, Y., He, Y., Zhao, Y., Zhu, L., Zhang, X., Xu, X., Ji, D., Gao, J., Tian, S., Gao, W., and Wang, Y.: Bias in ammonia emission inventory and implications on emission control of nitrogen oxides over North China Plain, Atmos. Environ., 214, 116869, https://doi.org/10.1016/j.atmosenv.2019.116869, 2019.
Zhao, Y., Zhou, Y. D., Qiu, L. P., and Zhang, J.: Quantifying the uncertainties of China's emission inventory for industrial sources: From national to provincial and city scales, Atmos. Environ., 165, 207–221, https://doi.org/10.1016/j.atmosenv.2017.06.045, 2017.
Zheng, B., Zhang, Q., Zhang, Y., He, K. B., Wang, K., Zheng, G. J., Duan, F. K., Ma, Y. L., and Kimoto, T.: Heterogeneous chemistry: a mechanism missing in current models to explain secondary inorganic aerosol formation during the January 2013 haze episode in North China, Atmos. Chem. Phys., 15, 2031–2049, https://doi.org/10.5194/acp-15-2031-2015, 2015.
Zheng, B., Chevallier, F., Ciais, P., Yin, Y., Deeter, M. N., Worden, H. M., Wang, Y. L., Zhang, Q., and He, K. B.: Rapid decline in carbon monoxide emissions and export from East Asia between years 2005 and 2016, Environ. Res. Lett., 13, 044007, https://doi.org/10.1088/1748-9326/aab2b3, 2018.
Zheng, B., Chevallier, F., Yin, Y., Ciais, P., Fortems-Cheiney, A., Deeter, M. N., Parker, R. J., Wang, Y., Worden, H. M., and Zhao, Y.: Global atmospheric carbon monoxide budget 2000–2017 inferred from multi-species atmospheric inversions, Earth Syst. Sci. Data, 11, 1411–1436, https://doi.org/10.5194/essd-11-1411-2019, 2019.
Zhong, L. J., Louie, P. K. K., Zheng, J. Y., Wai, K. M., Ho, J. W. K., Yuan, Z. B., Lau, A. K. H., Yue, D. L., and Zhou, Y.: The Pearl River Delta Regional Air Quality Monitoring Network - Regional Collaborative Efforts on Joint Air Quality Management, Aerosol Air Qual. Res., 13, 1582–1597, https://doi.org/10.4209/aaqr.2012.10.0276, 2013.
Zhong, Q. R., Huang, Y., Shen, H. Z., Chen, Y. L., Chen, H., Huang, T. B., Zeng, E. Y., and Tao, S.: Global estimates of carbon monoxide emissions from 1960 to 2013, Environ. Sci. Pollut. R., 24, 864–873, https://doi.org/10.1007/s11356-016-7896-2, 2017.