the Creative Commons Attribution 4.0 License.
the Creative Commons Attribution 4.0 License.
 | 22 Dec 2020
Measurement report: dual-carbon isotopic characterization of carbonaceous aerosol reveals different primary and secondary sources in Beijing and Xi'an during severe haze events
Haiyan Ni
Ru-Jin Huang
Max M. Cosijn
Lu Yang
Jie Guo
Junji Cao
Ulrike Dusek
To mitigate haze pollution in China, a better understanding of the sources of carbonaceous aerosols is required due to the complexity in multiple emissions and atmospheric processes. Here we combined the analysis of radiocarbon and the stable isotope 13C to investigate the sources and formation of carbonaceous aerosols collected in two Chinese megacities (Beijing and Xi'an) during severe haze events of a “red alarm” level from December 2016 to January 2017. The haze periods with daily PM2.5 concentrations as high as ∼ 400 µg m−3 were compared to subsequent clean periods (i.e., PM2.5 less than median concentrations during the winter 2016/2017) with PM2.5 concentrations below 100 µg m−3 in Xi'an and below 20 µg m−3 in Beijing. In Xi'an, liquid fossil fuel combustion was the dominant source of elemental carbon (EC; 44 %–57 %), followed by biomass burning (25 %–29 %) and coal combustion (17 %–29 %). In Beijing, coal combustion contributed 45 %–61 % of EC, and biomass burning (17 %–24 %) and liquid fossil fuel combustion (22 %–33 %) contributed less. Non-fossil sources contributed 51 %–56 % of organic carbon (OC) in Xi'an, and fossil sources contributed 63 %–69 % of OC in Beijing. Secondary OC (SOC) was largely contributed by non-fossil sources in Xi'an (56±6 %) and by fossil sources in Beijing (75±10 %), especially during haze periods. The fossil vs. non-fossil contributions to OC and EC did not change drastically during haze events in both Xi'an and Beijing. However, compared to clean periods, the contribution of coal combustion to EC during haze periods increased in Xi'an and decreased in Beijing. During clean periods, primary OC from biomass burning and fossil sources constituted ∼ 70 % of OC in Xi'an and ∼ 53 % of OC in Beijing. From clean to haze periods, the contribution of SOC to total OC increased in Xi'an but decreased in Beijing, suggesting that the contribution of secondary organic aerosol formation to increased OC during haze periods was more efficient in Xi'an than in Beijing. In Beijing, the high SOC fraction in total OC during clean periods was mainly due to an elevated contribution from non-fossil SOC. In Xi'an, a slight day–night difference was observed during the clean period with enhanced fossil contributions to OC and EC during the day. This day–night difference was negligible during severe haze periods, likely due to the enhanced accumulation of pollutants under stagnant weather conditions.
- Article
(1993 KB) - Full-text XML
-
Supplement
(893 KB) - BibTeX
- EndNote


Severe haze pollution with high PM2.5 (i.e., particulate matter with aerodynamic diameter ≤ 2.5 µm) concentrations and reduced visibility occurs frequently during winter in China (An et al., 2019). Field measurements show that carbonaceous aerosol contributes a significant fraction of PM2.5 loading during severe haze events in China (Huang et al., 2014; Elser et al., 2016; Liu et al., 2016). Therefore, a better understanding of the sources and atmospheric processes of carbonaceous aerosols is needed for mitigating haze pollution. Many previous studies focus solely on Beijing, the capital of China. However, studies on other megacities are also needed for comparison, as well as for a more comprehensive understanding of haze pollution in China.
Carbonaceous aerosol constituents are separated into elemental carbon (EC) and organic carbon (OC) fractions differing in their thermal refractiveness with EC being thermally refractory and OC weakly refractory (Pöschl, 2003, 2005; Petzold et al., 2013). EC is emitted as primary particles from incomplete combustion sources (i.e., biomass burning and fossil fuel combustion). Unlike EC, OC can either be emitted as primary OC (POC) from combustion sources and non-combustion sources (e.g., biogenic emissions) or formed in the atmosphere as secondary OC (SOC) via the reaction of gas precursors (Hallquist et al., 2009; Jimenez et al., 2009). The sources and abundance of different carbon fractions in carbonaceous aerosols vary considerably in different Chinese cities as a result of complex interplay between meteorology, local and regional emissions sources, and atmospheric processes (Zhang et al., 2008; Cui et al., 2015; Tie et al., 2017; An et al., 2019). Therefore, quantifying the sources of carbonaceous aerosol in China is a challenging task.
Radiocarbon (14C) analysis of carbonaceous aerosols is the most direct and effective method to distinguish their main sources, exploiting the fact that OC and EC of fossil origins (i.e., vehicle emissions, coal combustion) do not contain 14C (Heal, 2014; Cao et al., 2017; Dusek et al., 2013). The 14C analysis of OC and EC separately provides a clear-cut division of carbonaceous aerosols into four major fractions: fossil OC, non-fossil OC (e.g., OC from biomass burning, biogenic emissions, and cooking), fossil EC and biomass-burning EC (e.g., Gustafsson et al., 2009; Szidat et al., 2009; Zotter et al., 2014; Dusek et al., 2017; Ni et al., 2018, 2019a). For example, Liu et al. (2014) demonstrated that fossil sources including coal burning and vehicle emissions dominated EC during winter haze events in Guangzhou, China. Zhang et al. (2015) showed that the elevated carbonaceous aerosols during the severe haze event in January 2013 in China were by a large extent driven by SOC from both fossil and non-fossil precursors. In addition, the analysis of the 13C∕12C ratio can refine 14C source apportionment because coal combustion and vehicle emissions have different 13C source signatures although they are both completely depleted of 14C (e.g., Andersson et al., 2015; Li et al., 2016; Winiger et al., 2016, 2017; Fang et al., 2017, 2018; Ni et al., 2018).
A critical question for effective haze mitigation is whether carbonaceous aerosols in different Chinese cities have similar characteristics during haze events. However, there are not many studies highlighting the differences in sources of primary and secondary carbonaceous aerosols between cities, especially for studies employing the analysis of 14C or the stable isotope 13C (e.g., Zhang et al., 2015; Andersson et al., 2015; Liu et al., 2016). In this work, we compare the severe haze events reaching the “red alarm” level (i.e., the highest air quality warning level in China) in two Chinese megacities (Beijing and Xi'an) during December 2016 and January 2017. We present measurements of dual carbon isotopes (i.e., 14C and the stable carbon isotope 13C) for EC and OC. The sources of carbonaceous aerosols are elucidated and compared between haze and clean periods in Beijing and Xi'an with the following main objectives: (1) quantitative understanding of the difference in EC contribution from the burning of biomass, coal, and liquid fossil fuel (i.e., vehicle emissions) under different pollution conditions and (2) constraining the sources of both primary and secondary OC. Furthermore, the comparison of daytime and nighttime results in Xi'an yields insight into diurnal variation in sources of carbonaceous aerosols.
2.1 Aerosol collection
To collect PM2.5 samples, high-volume aerosol samplers (flow rate = 1.0 m3 min−1; TE-6070 MFC, Tisch Inc., Cleveland, OH, USA) were used at an urban background site in Xi'an and Beijing (see Table S1 for details about the sampling sites). Xi'an is the largest city in northwestern China with over 8.8 million residents and 2.5 million vehicles in 2016 (Xi'an Municipal Bureau of Statistics and NBS Survey Office in Xi'an, 2017). Surrounded by the Qinling Mountains to the south and the Loess Plateau to the north, days with low wind speed occur frequently in Xi'an, promoting the accumulation of air pollutants. Xi'an is now facing increased serious air quality issues due to the rapid increase in motor vehicles and energy consumption in the past 2 decades. Besides residential coal combustion, biomass burning is also a major emission source in Xi'an and its surrounding areas (i.e., Guanzhong Plain) for heating and cooking, especially in winter (Zhang et al., 2014; Xu et al., 2016). Beijing, the capital of China, is a megacity with over 21 million residents and 5.7 million vehicles in 2016 (Beijing Municipal Bureau of Statistics and NBS Survey Office in Beijing, 2017). Beijing is located in the Beijing–Tianjin–Hebei (BTH) region, the most economically developed region in northern China. However, the rapid economic growth and urbanization associated with heavy coal consumption and the rapid increase in the usage of vehicles led to the poor air quality in Beijing. Besides local emissions, regional transport of pollutants between neighboring cities also contributes to air pollution in Beijing (Zheng et al., 2015; An et al., 2019). The 12 h integrated (daytime: 08:00 to 20:00 CST, China standard time; nighttime: 20:00 to 08:00 CST of the following day) PM2.5 was sampled on pre-combusted quartz filters (20.3 cm × 25.4 cm; QM-A, Whatman Inc., Clifton, NJ, USA) in Xi'an from 1 to 10 January 2017. In Beijing, the 24 h integrated (10:00 to 10:00 CST the following day) PM2.5 was collected from 2 December 2016 to 8 January 2017. Field blanks were collected by exposing filters to ambient air for 15 min. Immediately after collection, the filters were transferred into pre-combusted aluminum foils and stored at −18 ∘C.
2.2 Concentration measurements of OC and EC
The IMPROVE_A protocol (Chow et al., 2007) was implemented on a carbon analyzer (DRI Model 2001, Atmoslytic Inc., USA) for the measurement of carbon concentrations. The relative standard deviations for the replicate analyses were smaller than 10 % for OC and EC. OC mass was corrected for field blanks (0.4 µg cm−2). EC was too small to be detected on field blanks. Acidification to remove potential interferences from carbonates is not necessary because carbonate carbon in PM2.5 samples is found to be negligible compared to the relatively larger OC and EC amounts for both mass determination and carbon isotopic analysis (Supplement Sect. S1).
2.3 Analysis of carbon isotope
Six samples from haze and clean days were selected per sampling site for carbon isotope analysis (Tables S1 and S2). We define clean days at each site as PM2.5 less than the median concentration in the winter heating season from 15 November 2016 to 15 March 2017. In Xi'an, there were four composite samples (two daytime and two nighttime) from haze days and two composite samples (one daytime and one nighttime) from clean days. In Beijing, five 24 h samples were selected from haze days and one composite sample from 2 clean days. Each composite sample consists of two filter pieces with similar PM2.5 loadings that agree within 20 % (Fig. S1).
2.3.1 Stable isotope 13C
Filter samples were placed in a quartz tube with CuO grains. The tube was subsequently evacuated and sealed before heating for 3 h at 375 ∘C to remove OC. Then the EC was extracted by heating the remaining carbon for 5 h at 850 ∘C. The 13C∕12C ratio of EC was measured by an isotope mass spectrometer (Finnigan MAT-251; Bremen, Germany) and expressed in the delta notation:
The δ13C values are usually reported in per mil (‰). (13C∕12C)V-PDB is the 13C∕12C ratio of the international standard Vienna Pee Dee Belemnite (V-PDB). A well-characterized standard was measured every working day. Duplicate analysis of δ13C of EC showed an analytical precision better than ±0.3 ‰. This method was detailed in Ni et al. (2019b), in which the impacts of potential charred OC on the isolated EC were evaluated using an isotope-mass-balance-based sensitivity analysis. We concluded that the expected differences in δ13CEC are smaller than 1 ‰ under the assumption that the fraction of charred OC in the isolated EC is at most 20 %.
2.3.2 Radiocarbon
OC and EC in PM2.5 samples were converted to CO2 using an aerosol combustion system (ACS; Dusek et al., 2014). The ACS has been evaluated in two intercomparison studies (Szidat et al., 2013; Zenker et al., 2017). The isolated CO2 was subsequently reduced to graphite (de Rooij et al., 2010) before 14C measurements could be conducted with the accelerator mass spectrometer (AMS) at the Center for Isotope Research (CIO; van der Plicht et al., 2000). The temperature protocol for OC and EC combustion has been detailed in Ni et al. (2018) and is summarized in Fig. S2. To remove possible interfering gas (e.g., NOx, halogen, and water vapor) from CO2, a reduction oven filled with copper grains and silver, a dry-ice–ethanol bath, and a flask filled with phosphorus pentoxide were installed on the ACS.
Fraction modern (F14C) is used to report the 14C data (Reimer et al., 2004). F14C relates the 14C∕12C ratio of a sample to the ratio of the unperturbed atmosphere in the reference year 1950:
Both ratios are normalized to δ13C of −25 ‰ to remove the effect of isotope fractionation. Practically, (14C∕12C equals the 14C∕12C ratio of an oxalic acid standard (OXII) multiplied by a factor of 0.7459. Contamination during graphitization and AMS measurements was quantified from the measured F14C of standards (OXII with known F14C of 1.3407 and Rommenhöller with F14C = 0) which was processed in the same way as samples. The resulting estimated dead and modern contamination was used to correct the 14C data according to Santos et al. (2007). The reliability of data correction was further verified by measuring two secondary standards (i.e., IAEA-C7 and IAEA-C8) on the same wheel of samples. The measured values of IAEA-C7 (0.495 ± 0.008) and IAEA-C8 (0.154 ± 0.007) agree with their respective consensus value (0.4953 ± 0.0012 and 0.1503 ± 0.0017) within uncertainties.
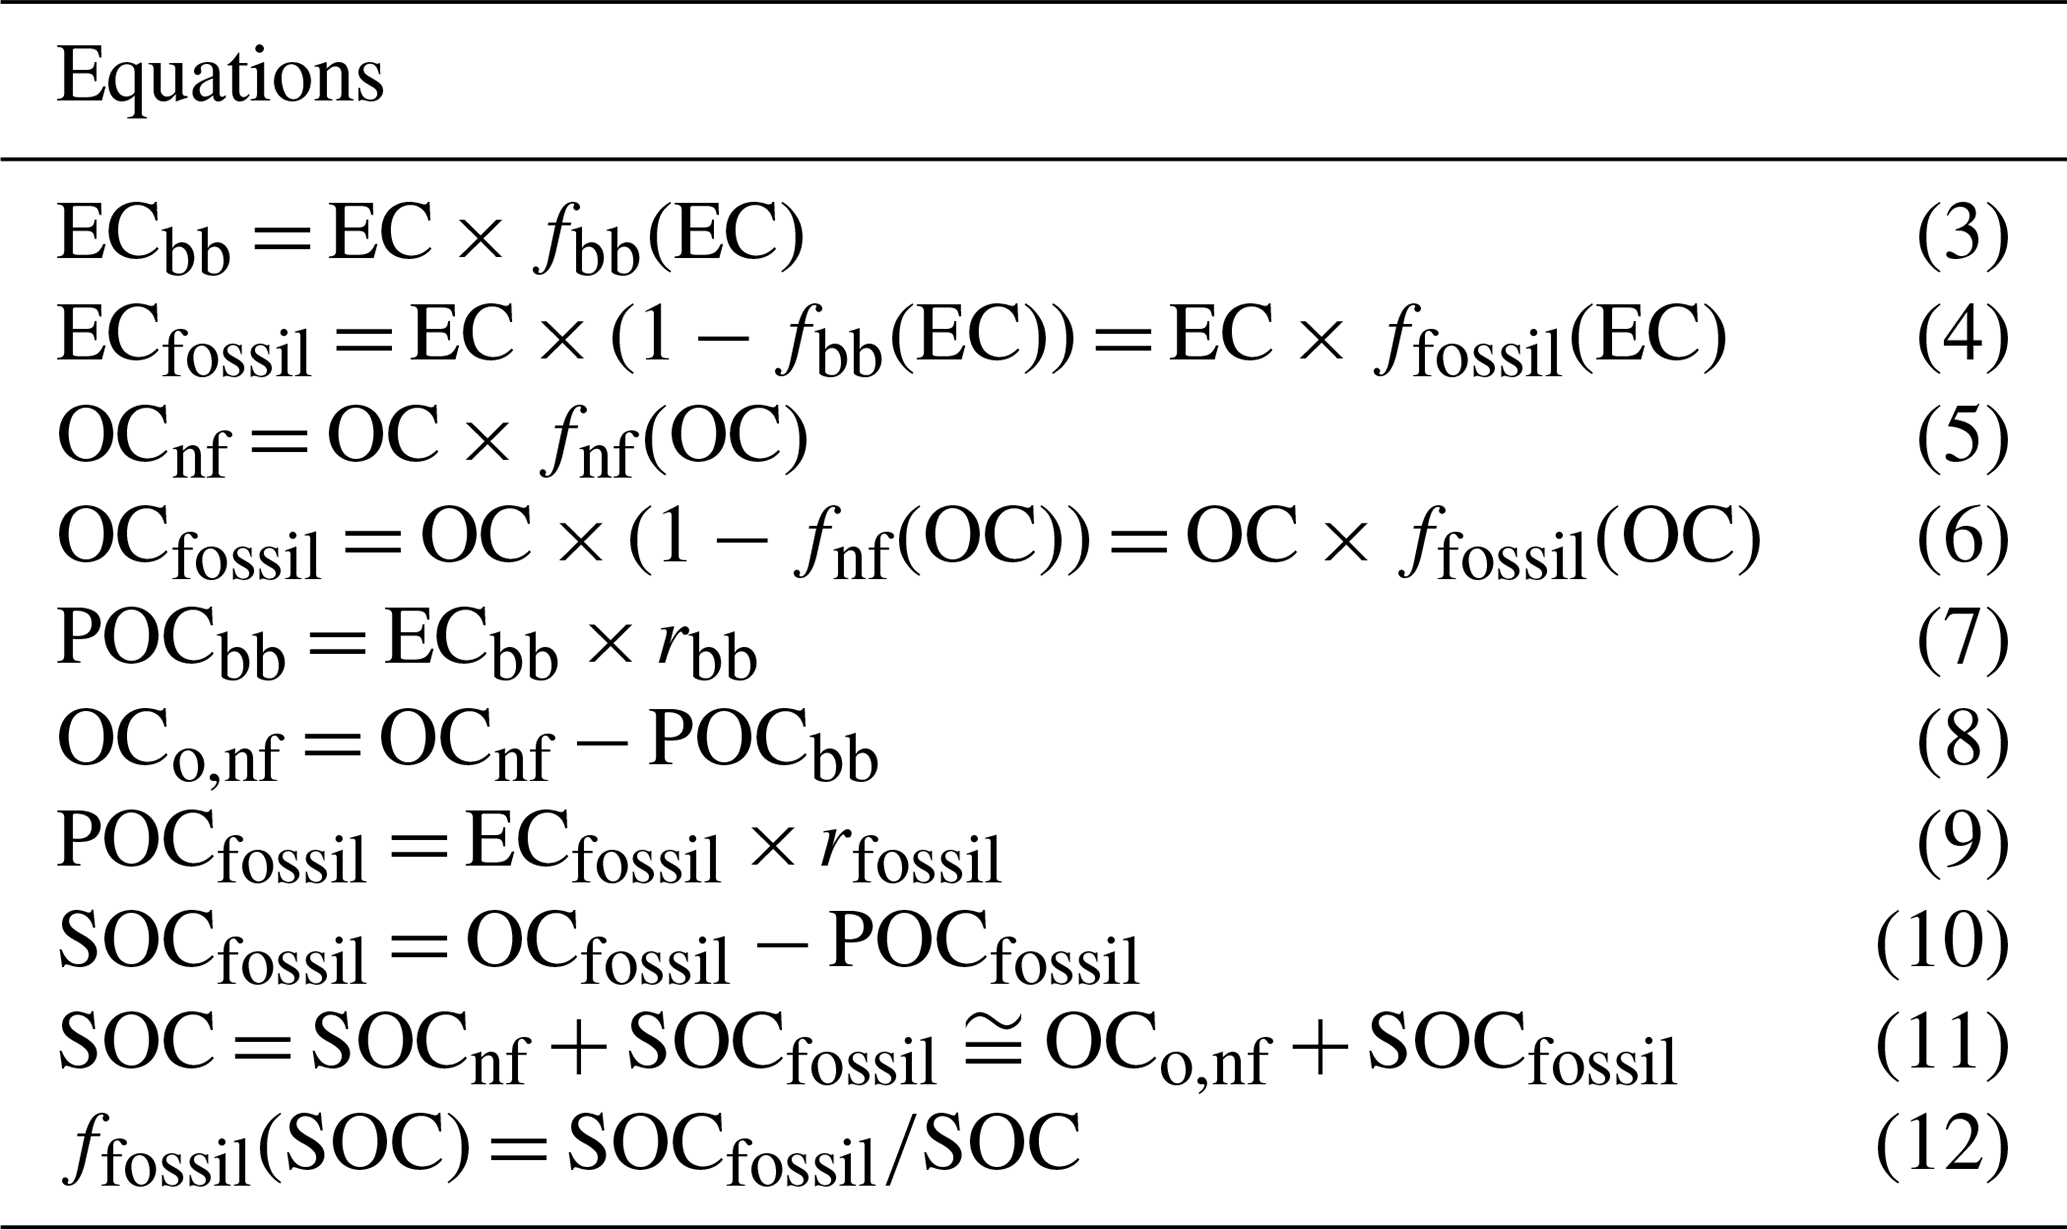
Table 1Equations for 14C source apportionment of EC and OC. See Sect. 2.4 for details. Respectively, rbb and rfossil are the primary OC∕EC ratio for biomass burning and fossil fuel combustion. The estimation of rbb and rfossil is presented in Supplement Sect. S2.
2.4 Source apportionment methods
F14C is larger than the fraction of non-fossil carbon (i.e., fnf(OC) for OC, fbb(EC) for EC) due to the large release of 14C into the atmosphere from the nuclear bomb tests in the 1960s. To eliminate this effect, F14C is divided by the F14C of non-fossil sources (F14Cnf). F14Cnf is estimated as 1.09 ± 0.05 for OC and 1.10 ± 0.05 for EC (see details in Ni et al., 2019b) using a tree growth model and the contemporary atmospheric 14CO2 over the past years (Lewis et al., 2004; Mohn et al., 2008; Levin et al., 2010) with the assumption that biomass-burning OC and biogenic OC contribute to 85 % and 15 % of total OC, respectively. Once fnf(OC) and fbb(EC) are known, carbon concentrations can be apportioned into EC and OC from non-fossil sources (ECbb, OCnf) and fossil sources (ECfossil, OCfossil) (Eqs. 3–6 in Table 1). OCnf and OCfossil are further divided into POC from biomass burning (POCbb), other non-fossil OC (OCo,nf) (Eqs. 7–8), and primary and secondary fossil OC (POCfossil and SOCfossil, respectively; Eqs. 9–10). POCbb and POCfossil are estimated using EC as a tracer of primary emissions (i.e., the EC tracer method; Turpin and Huntzicker, 1995). Based on OCo,nf and SOCfossil, total SOC and the fraction of fossil carbon in SOC (ffossil(SOC)) are estimated using Eqs. (11–12). OCo,nf mainly includes SOC of non-fossil origins (SOCnf), primary biogenic OC, and cooking OC. OCo,nf is approximately SOCnf as contributions of primary biogenic sources and cooking to OCo,nf are likely small (Hu et al., 2010; Guo et al., 2012). If cooking is prominent, OCo,nf is an overestimate of SOCnf. To estimate the uncertainties of the source apportionment results, a Monte Carlo simulation (n=10 000) using Eqs. (3–12) was carried out as described in Supplement Sect. S3. The 14C source apportionment results are presented in Tables S3 and S4.
The dual carbon isotope signatures of EC were used in a Bayesian Markov chain Monte Carlo (MCMC) scheme (Andersson, 2011) to conduct the mass-balance three source apportionment of EC (e.g., Andersson et al., 2015; Li et al., 2016; Winiger et al., 2016, 2017; Fang et al., 2017, 2018). That is to say that the F14C and δ13C of ambient EC (F14C(EC) and δ13CEC) can be explained by the burning of biomass (bb), coal (coal), and liquid fossil fuel (liq.fossil; i.e., vehicle emissions):
F14Ccoal and F14Cliq.fossil are equal to zero since coal and liquid fossil fuel do not contain 14C, and δ13Cbb, δ13Ccoal, and δ13Cliq.fossil are δ13C signatures for EC from the three sources. Their values were established as δ13Cbb (−26.7 ± 1.8 ‰ for C3 plants and −16.4 ± 1.4 ‰ for corn stalk; mean ± SD, standard deviation), δ13Ccoal ( ‰), and δ13Cliq.fossil ( ‰), based on critical evaluations of studies from the literature (Andersson et al., 2015; Ni et al., 2018; and references therein). Uncertainties in F14C and δ13C source signatures and the measured F14C(EC) and δ13CEC are considered in the MCMC technique (Parnell et al., 2010, 2013). MCMC outputs are the posterior probability density functions for fbb, fcoal, and fliq.fossil (i.e., the relative contribution of each source to EC). The median and interquartile range (25th–75th percentile) are used as the best estimate and the uncertainties, respectively.
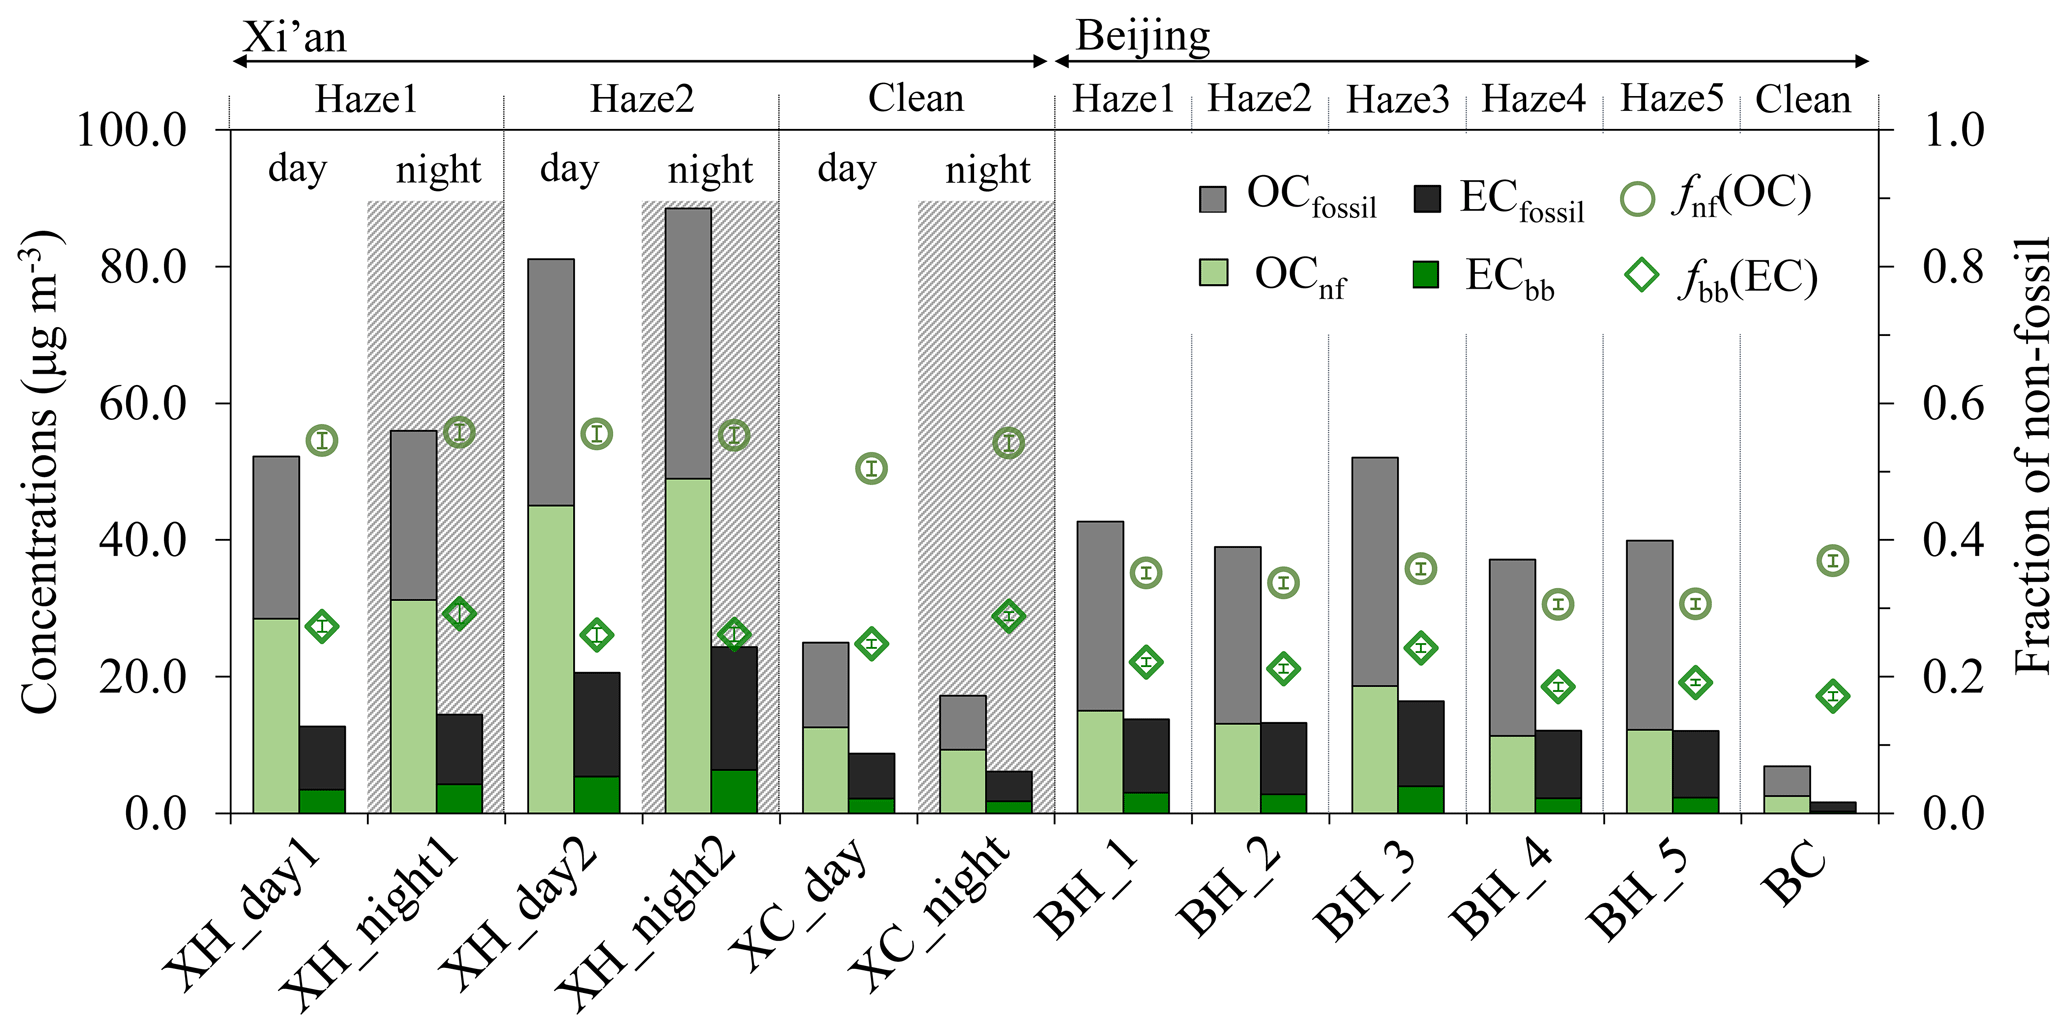
Figure 1Mass concentrations of OC and EC from fossil and non-fossil sources (OCfossil, OCnf, ECfossil, and ECbb), as well as fraction of non-fossil carbon in OC and EC (fnf(OC) and fbb(EC), respectively), for daytime and nighttime PM2.5 samples in Xi'an and 24 h integrated PM2.5 samples in Beijing during haze and clean periods during the measurement periods (2 December 2016 to 10 January 2017). For each city, “haze” and “clean” are used to represent high and low pollution events, and clean days at each site are defined as days with PM2.5 less than the median concentration in the winter heating season from 15 November 2016 to 15 March 2017. Uncertainties of 14C-apportioned fnf(OC) and fbb(EC) are indicated but are too small to be visible. The data are shown in Table S3.
3.1 Fossil and non-fossil contributions to EC and OC
During the measurement periods, the highest daily mass concentrations of PM2.5 in Xi'an (∼ 250–420 µg m−3) and Beijing (∼ 210–360 µg m−3; Fig. S1) were 10–17 and 8–14 times higher than the standard of the World Health Organization (25 µg m−3; WHO, 2006), respectively. Using radiocarbon measurements, we investigated the sources of carbonaceous aerosols in PM2.5 in both cities during several haze periods and compared them to clean periods with PM2.5 concentrations below 100 µg m−3 in Xi'an and below 20 µg m−3 in Beijing. In Xi'an, even during the clean periods that we defined here, daily PM2.5 concentrations were higher than the Chinese pollution standard of 75 µg m−3, reflecting severe air quality problems. PM2.5, OC, and EC concentrations during haze periods were >2 times higher in Xi'an and >5 times higher in Beijing than those during clean periods, respectively. OC∕EC ratios in Xi'an slightly decreased from ∼ 4 during haze periods to ∼ 3 during clean periods, while OC∕EC ratios in Beijing were lower during haze periods (∼ 3) than clean periods (∼ 4). This reflects different sources and formation mechanisms of haze pollution in the two cities. In Xi'an, we collected day and night PM2.5 samples. No consistent day–night variations in concentrations of PM2.5, OC, and EC (Figs. 1 and S1) were observed. This results from the diurnal cycle of human activities (e.g., traffic, usage of biomass and coal for heating or cooking) and the development of the planetary boundary layer height which controls the vertical mixing and dilution of pollutants.
Radiocarbon (14C) in EC and OC was measured to distinguish their fossil (mainly coal burning and traffic emissions) and non-fossil (mainly biomass burning) sources. The most important contributor to EC was fossil fuel combustion, both in Xi'an and Beijing, contributing 73 ± 2 % in Xi'an and 80 ± 3 % in Beijing. The remaining EC arose from biomass burning (27 ± 2 % in Xi'an and 20 ± 3 % in Beijing; Fig. 1). In Xi'an, the fraction of biomass-burning EC in total EC (fbb(EC)) was largely constant during haze and clean periods (range: 25 %–29 %) regardless of the wide concentration range of EC from biomass burning (ECbb; 1.8–6.4 µg m−3) and fossil fuel combustion (ECfossil; 4.3–18 µg m−3). This suggests that the increase in ECfossil and ECbb concentrations during haze periods in Xi'an is likely caused by the enhanced emissions from both fossil fuel and biomass burning by a similar factor and due to meteorological conditions favoring the accumulation of particulate air pollution. The fbb(EC) values in Beijing (20 ± 3 % with a range of 17 %–24 %) were consistently smaller than those in Xi'an (range: 25 %–29 %), showing that fossil sources contribute more strongly to EC in Beijing. Moreover, during haze periods in Beijing, fbb(EC) increased with increasing total EC concentrations (Fig. 2).
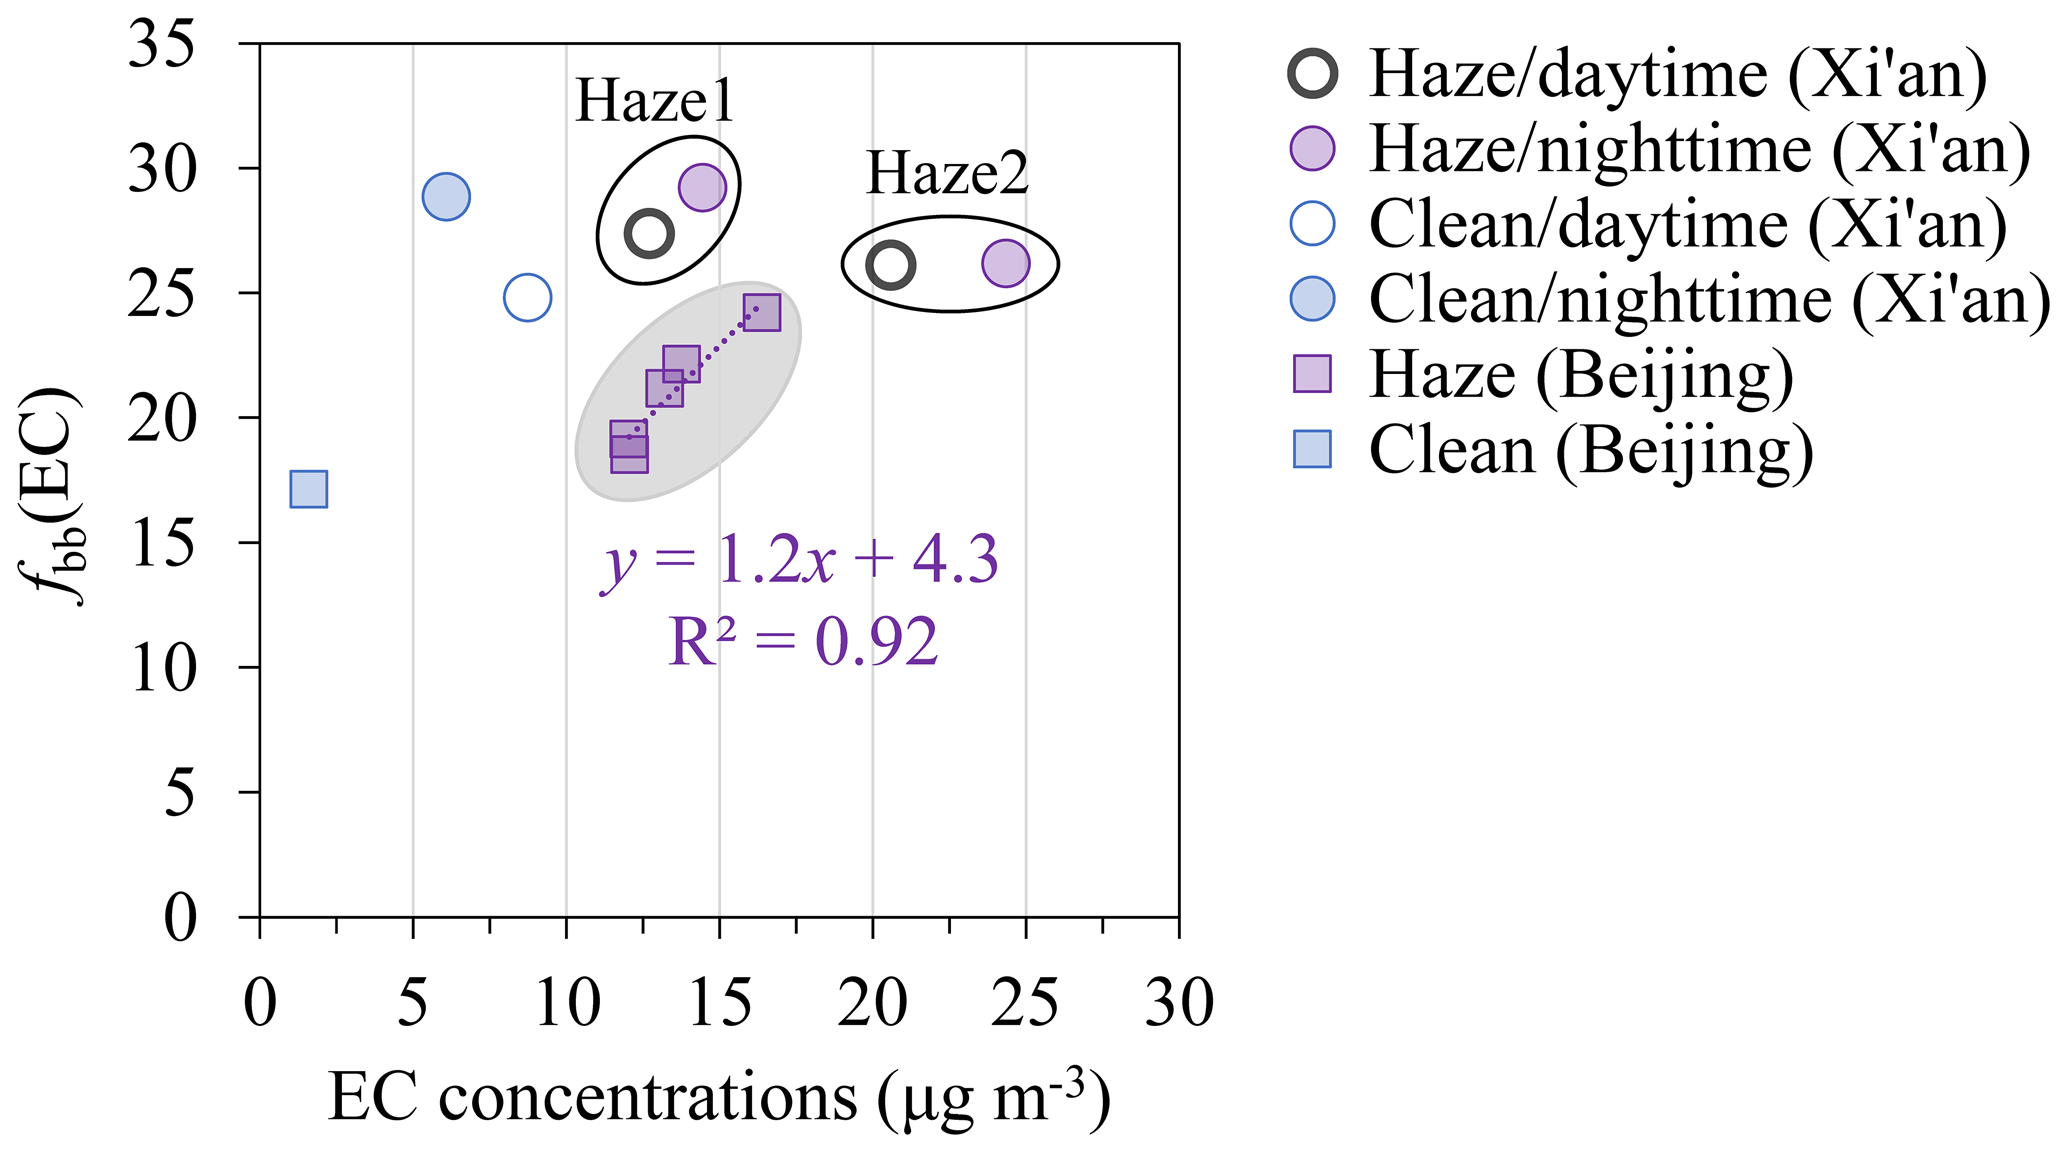
Figure 2Scatter plot of the relative contribution of biomass burning to EC (fbb(EC); %) against EC concentrations.
In Xi'an, OC concentrations from non-fossil sources averaged 29 ± 16 µg m−3 (OCnf; range: 9–49 µg m−3), slightly higher than those from fossil sources (OCfossil; 24 ± 13 µg m−3; range: 8–40 µg m−3) at 95 % confidence level (paired t test, p value = 0.01). However, in Beijing, OCnf (12 ± 5 µg m−3; 3–19 µg m−3) was significantly lower than OCfossil (24 ± 10 µg m−3; 4–33 µg m−3) (p value = 0.001). Consequently, the relative contribution of OCnf to total OC (fnf(OC)) was much higher in Xi'an (average 54 ± 2 %) than in Beijing (34 ± 3 %). The fnf(OC) value in both cities was considerably higher than the corresponding fbb(EC) for all samples (Fig. 1). The main reason for larger fnf(OC) than fbb(EC) is that primary OC∕EC ratios from biomass-burning emissions are higher than those from fossil sources. So even though biomass burning contributes a small portion of EC, its contribution to primary OC will be much higher. In addition, other non-combustion sources (e.g., biogenic emissions, cooking fumes) and secondary formation contribute only to OC and not to EC.
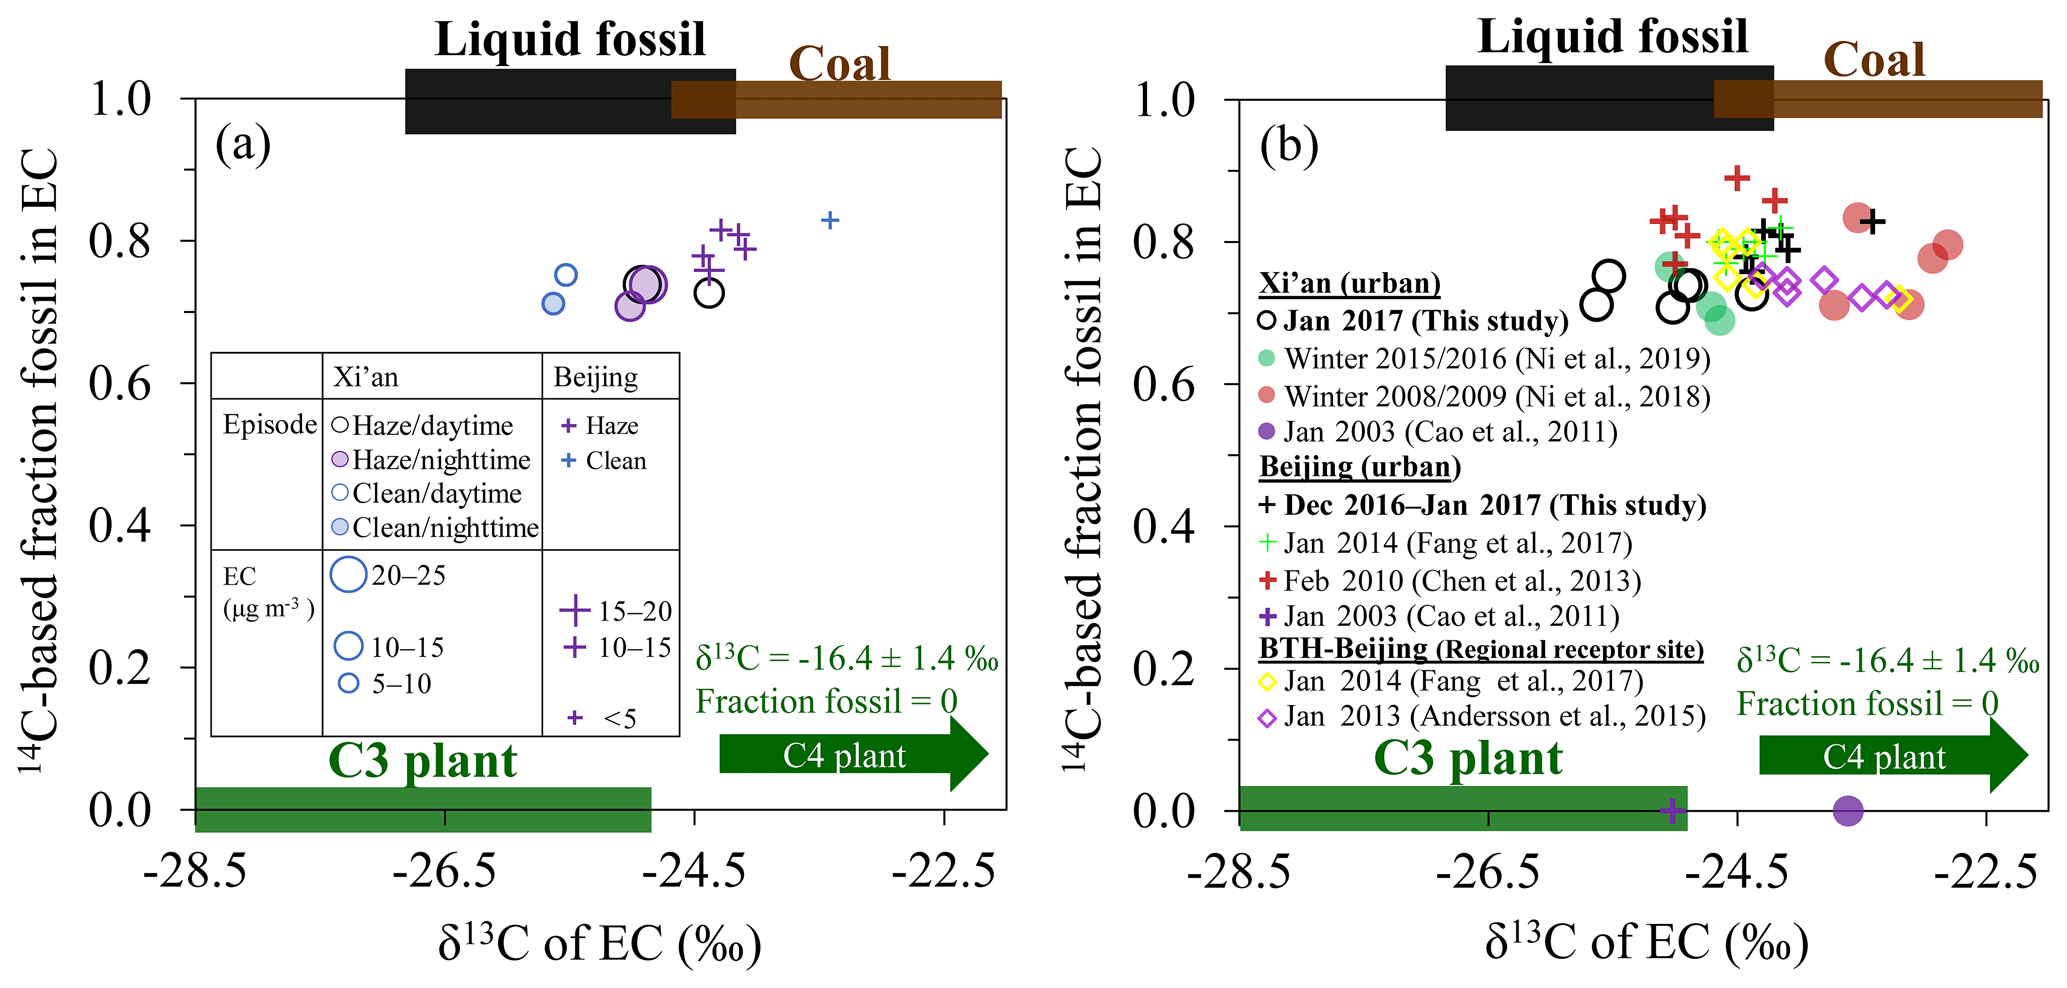
Figure 3(a) The 14C-based fraction fossil vs. δ13C for EC during haze and clean periods in Xi'an and Beijing, China. The symbol size is an indicator of EC concentrations. (b) Comparison with previous observations in Xi'an and Beijing, in which BTH-Beijing is a regional receptor site of Beijing located 100 km southwest of Beijing. Samples from Cao et al. (2011) are placed on the x axis because no 14C data were available. The expected 14C and δ13C endmember ranges for emissions from C3 plant burning, liquid fossil fuel burning, and coal burning are shown as green, black, and brown bars, respectively. The δ13C source signatures are indicated as mean plus or minus the standard deviation (SD) (Sect. 2.4). The δ13C signature of corn stalk burning (i.e., C4 plant; −16.4 ± 1.4 ‰) is also indicated.
In this study, the ffossil(EC) values in Xi'an during winter 2016/2017 are comparable with those previously measured during winter 2015/2016 and winter 2008/2009 (Ni et al., 2018, 2019b), as illustrated in Fig. 3b, pointing to a relatively constant contribution of fossil fuel combustion vs. biomass burning to EC in Xi'an over the past decade. As shown in Fig. 3b, the ffossil(EC) values in Beijing during winter 2016/2017 agree with the values reported at an urban site of Beijing in January 2014 (Fang et al., 2017). A slightly higher ffossil(EC) in urban Beijing was observed during February 2010 (Chen et al., 2013). Despite the slight variation of ffossil(EC) over time, ffossil(EC) in Beijing is generally higher than that in Xi'an (Fig. 3b). The overall average ffossil(OC) presented for winter 2016/2017 in Beijing (66 ± 3 %) was higher than that in Xi'an (46 ± 2 %), which is consistent with previously reported ffossil(OC) in Beijing and Xi'an (Zhang et al., 2015; Ni et al., 2019a). Lower ffossil(OC) values in winter were reported in Chongqing (24 %), and higher ffossil(OC) was observed in Taiyuan (71 %) during winter 2013/2014 (Ni et al., 2019a). The comparison of ffossil(EC) and ffossil(OC) in different Chinese cities indicates that the relative importance of fossil sources in carbonaceous aerosols varies spatially and can change over the years. In Xi'an, clean periods showed a slight day–night difference with increased contributions of fossil sources to EC and OC during the day. During haze periods, especially the second haze event (XH_day2, XH_night2), this day–night difference disappeared, which suggests a long residence time of the pollution particles in the urban atmosphere during haze events.
Overall, our 14C data show that fossil sources contribute more strongly to EC and OC in Beijing than in Xi'an, which is consistent with previous observations. Both in Beijing and Xi'an, the fossil vs. non-fossil contributions to EC and OC did not change drastically during haze and clean periods. In Xi'an, a slight day–night difference was observed during clean periods but disappeared during haze periods, suggesting a large accumulation of particles.
3.2 Fossil EC apportioned by stable carbon isotopes: coal vs. liquid fossil fuel
Besides F14C, the δ13C of EC adds an additional dimension in which fossil EC can be distinguished into EC from the burning of coal and of liquid fossil fuel (i.e., vehicle emissions). Considerable geographical differences in δ13CEC signatures were observed with more depleted values in Xi'an (−25.1 ± 0.5 ‰; −25.6 ‰ to −24.4 ‰) relative to those in Beijing (−24.1 ± 0.4 ‰; −24.4 ‰ to −23.4 ‰; Fig. 3). The Xi'an signatures are consistent with the signature of liquid fossil fuel combustion (δ13C ‰; Sect. 2.4), whereas the more enriched values in Beijing indicate the influence of coal combustion (δ13Ccoal = ‰).
In both Xi'an and Beijing, moderate differences exist in δ13CEC between clean and haze days, pointing to a shift in combustion sources. In Xi'an, δ13CEC during clean periods (∼ −25.5 ‰) was slightly depleted compared to that during haze periods (−25.0 ‰ to −24.4 ‰), whereas Beijing exhibited more enriched δ13CEC during clean periods (−23.4 ‰) than during haze periods (−24.4 ‰ to −24.1 ‰). This suggests a moderate increase in coal combustion contribution to EC in Xi'an during haze days and a decrease in Beijing. In Xi'an, no strong day–night difference in δ13CEC was observed with the largest absolute differences of 0.5 ‰ between XH_day1 and XH_night1. The day–night differences are small relative to the uncertainties of the potential sources; for example, the endmember range for coal combustion is more uncertain (±1.3 ‰). The small day–night differences in δ13CEC reflect well-mixed EC emissions.
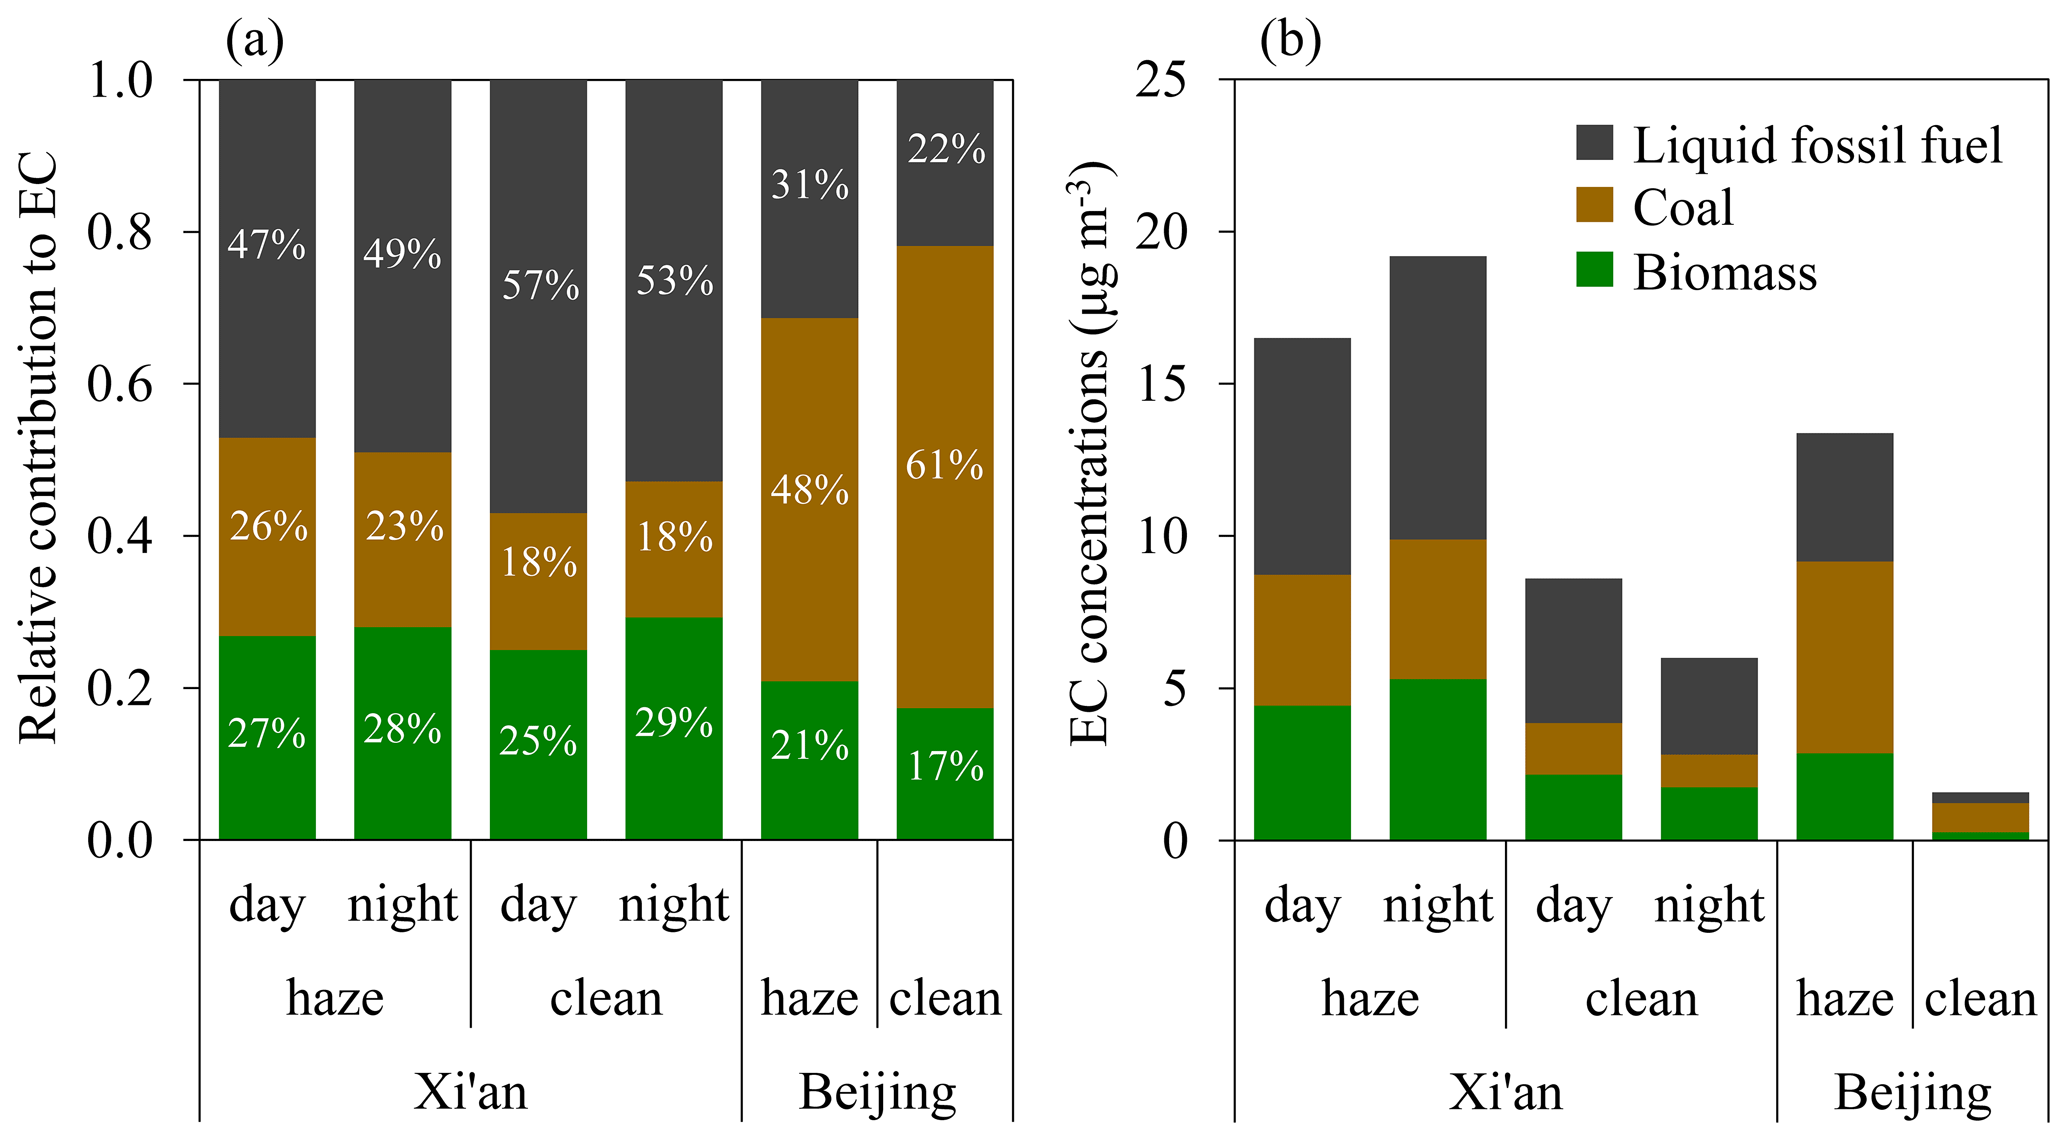
Figure 4(a) Fractional contributions of three combustion sources to EC during haze and clean periods in Xi'an and Beijing. (b) EC concentrations (µg m−3) from each combustion source. The data are presented in Tables S5 and S6.
The Bayesian MCMC model takes into account the uncertainties of the δ13C and F14C endmembers and statistically apportions EC into the fractions of biomass burning (fbb), coal combustion (fcoal), and liquid fossil fuel combustion (fliq.fossil). The MCMC-derived fbb is in principle the same as the 14C-based fbb(EC) (Fig. S3). The MCMC results (Fig. 4) show that there were no strong day–night differences in EC sources during haze and clean periods in Xi'an. Liquid fossil fuel combustion was the most important contributor to EC in Xi'an with an increased contribution during clean periods. In Beijing, coal combustion was the dominant source of EC, with the relative contribution ranging from 48 % (median; 31 %–61 %, interquartile range) during haze periods to 61 % (45 %–71 %) during clean periods. The fbb value was fairly constant between haze and clean periods with respect to fcoal and fliq.fossil for all samples. In Xi'an, fbb was comparable to fcoal during haze days and larger than fcoal during clean days. In Beijing, biomass-burning EC was the smallest fraction in total EC with smaller fbb than fcoal during both haze and clean days. Concentrations of total EC increased by 2 times from clean days (∼ 7.4 µg m−3) to haze days (18.0 µg m−3) in Xi'an and 8 times in Beijing (1.6 to 13.5 µg m−3). The increased EC concentrations during haze periods in Xi'an were attributed to liquid fossil fuel combustion (43 %), coal combustion (29 %), and biomass burning (28 %). However, in Beijing, coal combustion contributed most of the increased concentrations of EC (45 %), followed by the burning of liquid fossil fuel (33 %) and biomass (22 %).
In summary, complementing 14C with δ13C allows for quantitative constraints on EC sources: EC was dominated by liquid fossil fuel combustion (i.e., vehicle emissions) in Xi'an and by coal burning in Beijing, especially during clean periods. In Xi'an, no strong day–night differences in EC sources were observed during haze and clean periods. Compared with earlier observations in Xi'an (Fig. 3b), we found that the δ13CEC values in January 2017 from this study are comparable with wintertime δ13CEC in 2015/2016 (Ni et al., 2019b) but much more depleted than wintertime δ13CEC in 2008/2009 (Ni et al., 2018) and January 2003 (Cao et al., 2011). This suggests that fossil sources of EC in Xi'an have changed in the past decade with a decreasing relative contribution from coal combustion. This is in line with recent changes in energy use and the decreasing enrichment factors of As and Pb (i.e., indicators of coal combustion) in Xi'an, as documented in recent studies (Xu et al., 2016). As shown in Fig. 3b, in Beijing, variations in δ13CEC from January 2003 (Cao et al., 2011) to January 2017 (this study) are much narrower than those in Xi'an, indicating that EC combustion sources did not change significantly throughout the years in Beijing. Our δ13CEC values overlap with those in January 2014 (Fang et al., 2017) and fall into the range of reported δ13CEC values in urban Beijing (Cao et al., 2011; Chen et al., 2013) and the regional receptor site of Beijing (Andersson et al., 2015; Fang et al., 2017).
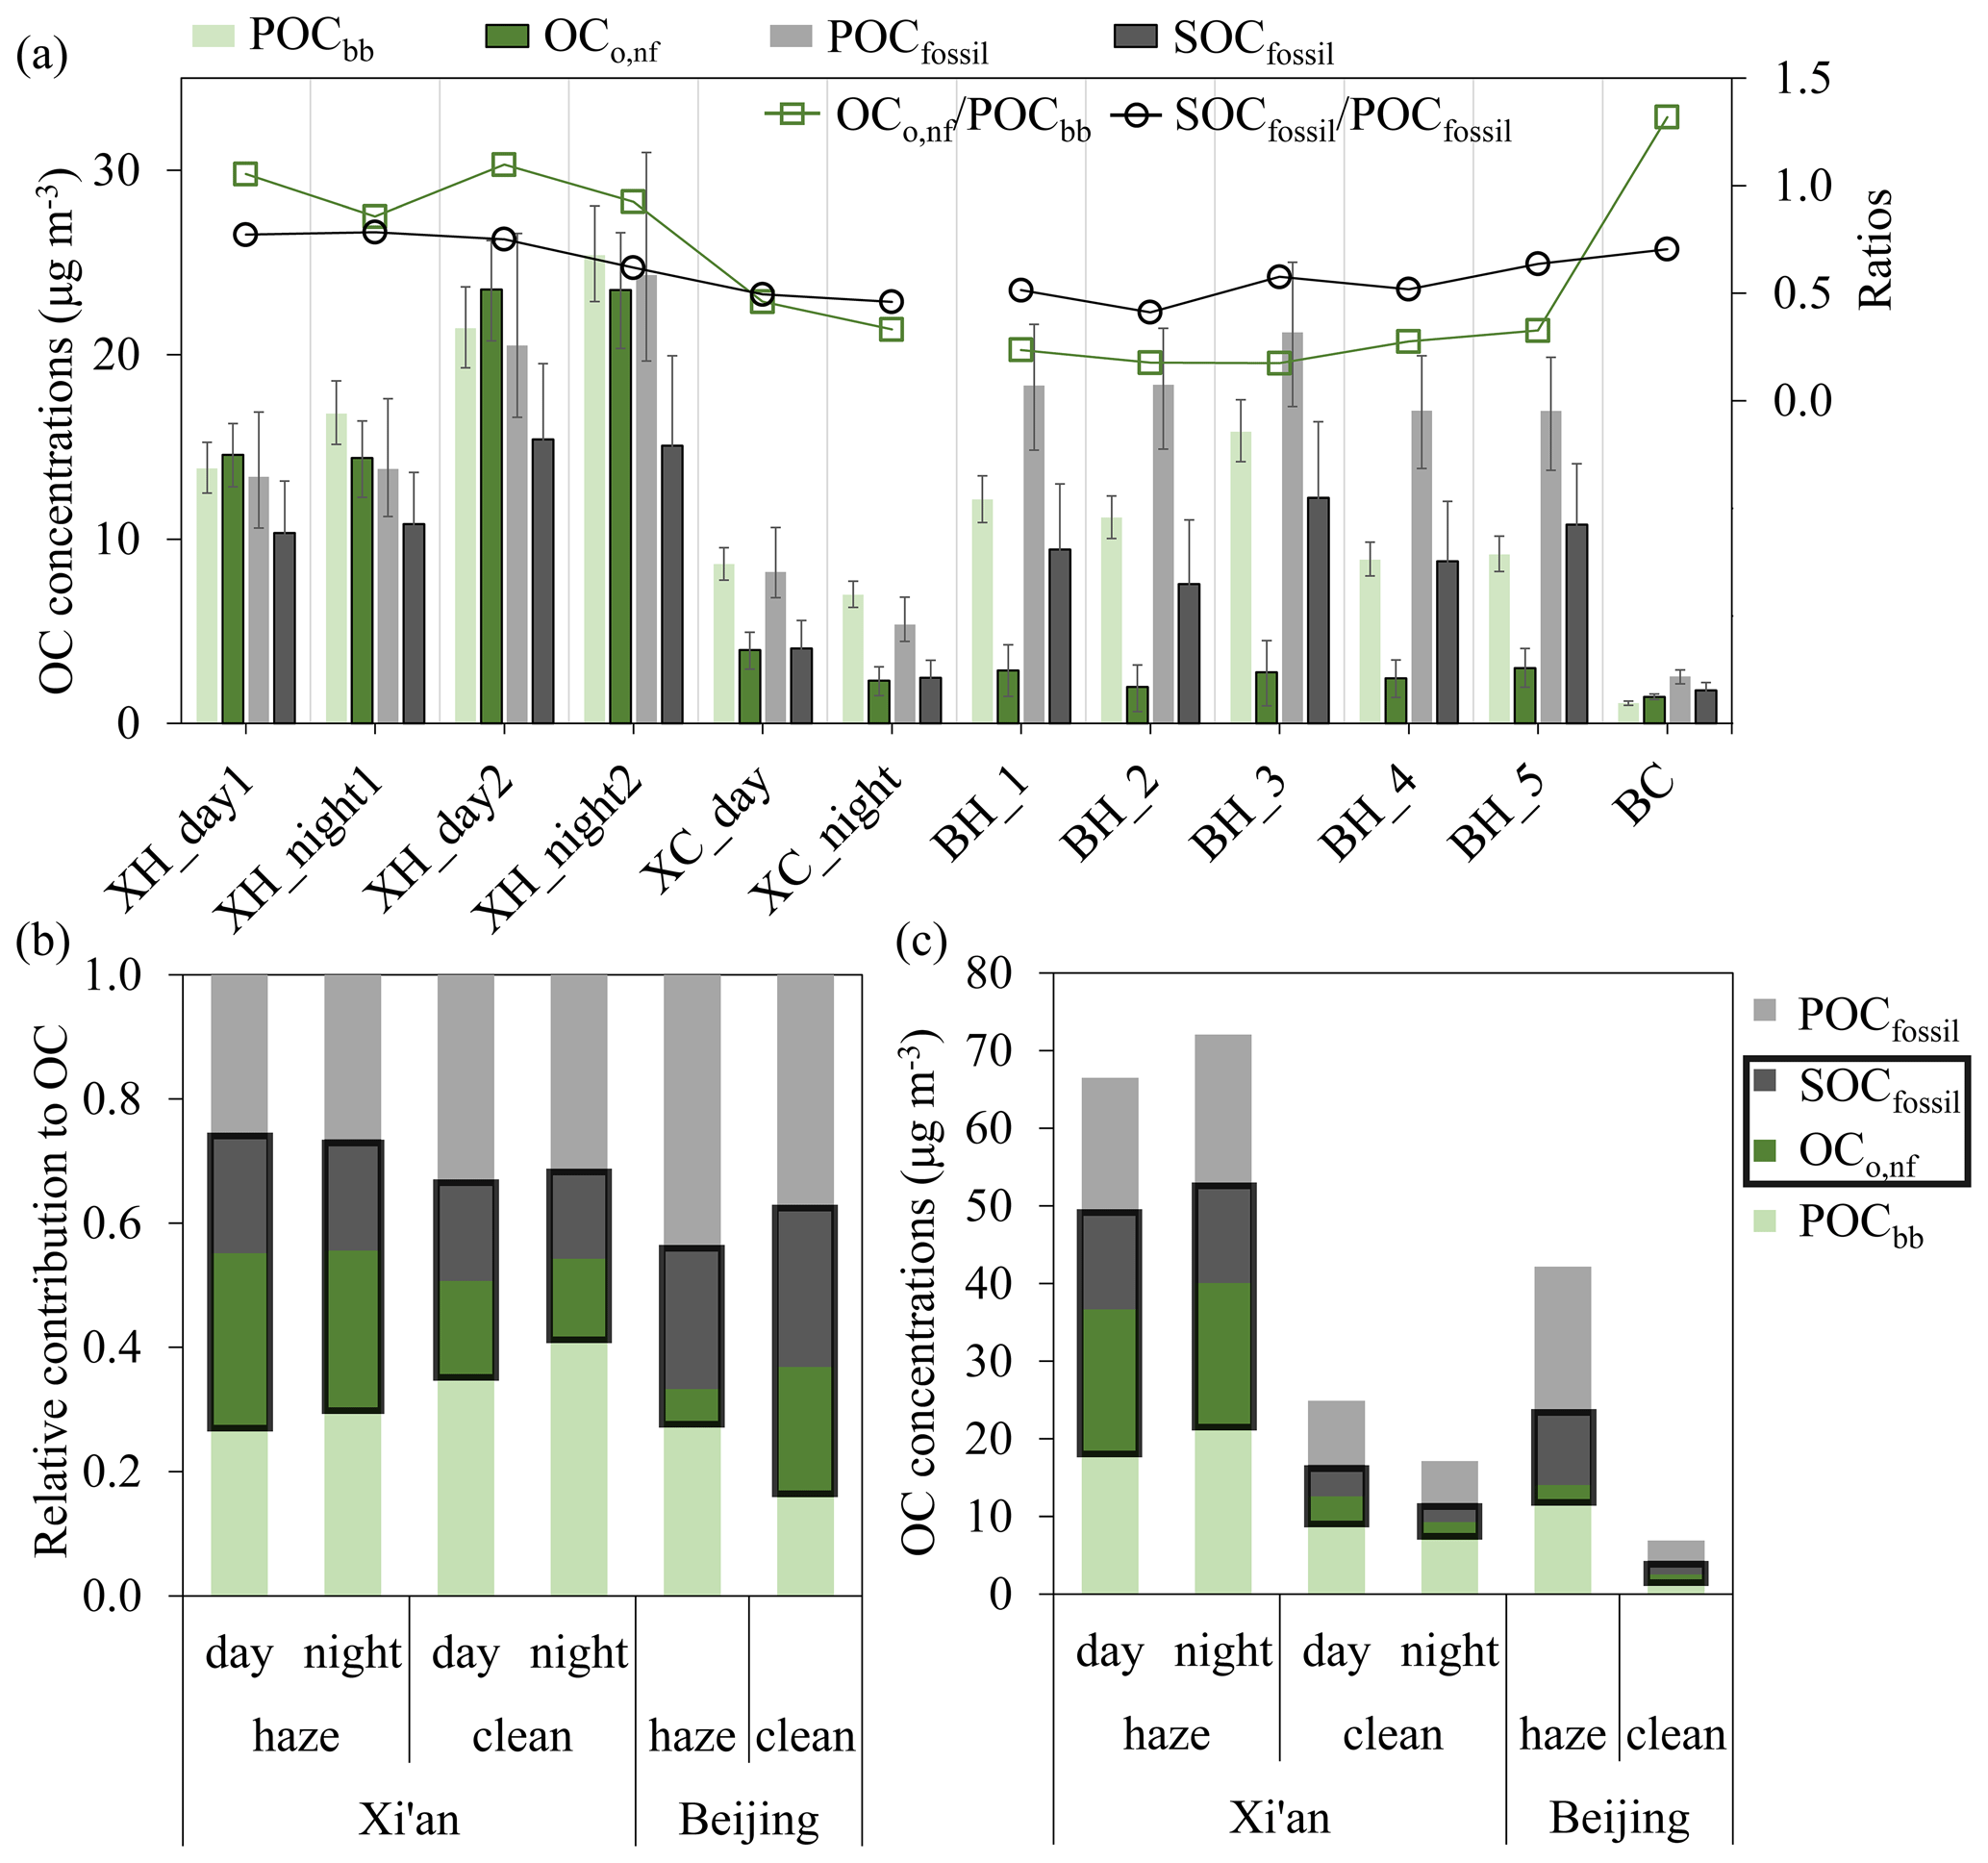
Figure 5(a) Concentrations of POCbb, OCo,nf, POCfossil, and SOCfossil(µg m−3) and the mass ratio of OCo,nf∕POCbb and SOCfossil∕POCfossil of each sample. The error bars indicate the interquartile range (25th–75th percentile) of the median concentrations. Averaged fractions (b) and concentrations (c) of POCbb, OCo,nf, POCfossil, and SOCfossil in total OC during haze and clean periods in Xi'an and Beijing, China. The data are given in Table S4.
3.3 Primary and secondary OC
As explained in Sect. 2.4, OCnf and OCfossil are apportioned into primary (POCbb, POCfossil) and secondary OC (OCo,nf, SOCfossil; Fig. 5). The large error bars of their concentrations reflect the large uncertainties in rbb and rfossil. It should be noted that OCo,nf is used as an approximation of SOCnf or can be regarded as an upper limit of SOCnf if cooking is a prominent OC source.
In Xi'an, both ratios of OCo,nf∕POCbb and SOCfossil∕POCfossil increased during haze periods (Fig. 5a). The OCo,nf∕POCbb ratio increased by 2.5 times from 0.33–0.46 during clean periods to 0.86–1.1 during haze periods; in contrast, SOCfossil∕POCfossil increased by 1.5 times from 0.46–0.50 to 0.62–0.78. This underlines that haze episodes in Xi'an were mainly caused by additional SOC formation with a larger contribution from non-fossil sources than fossil sources. As shown in Fig. 5b, the contribution of SOC (i.e., SOC ≅ OCo,nf + SOCfossil) to OC increased from clean periods (28 %–32 %) to haze periods (44 %–48 %); this mainly resulted from the increased contribution of OCo,nf to total OC (i.e., from 14 %–16 % to 26 %–29 %). In Xi'an, the day–night difference was larger during clean periods with less SOC at night for both absolute concentration and relative contribution to total OC (Fig. 5b, c).
In contrast, Beijing had the opposite variation trends of OCo,nf∕POCbb and SOCfossil∕POCfossil from clean to haze periods. OCo,nf∕POCbb ratios during clean periods (1.3) were on average 5 times higher than those during haze periods (0.18–0.33), and SOCfossil∕POCfossil ratios during clean periods (0.71) were slightly higher than those during haze periods (0.41–0.64). This suggests that in Beijing the increased OC concentrations during haze periods were mainly derived from elevated concentrations of POCbb and POCfossil. As shown in Fig. 5b, the high SOC contribution to total OC was observed during clean periods mainly due to elevated contribution from OCo,nf. The OCo,nf is not likely attributed to biogenic OC because the biogenic emissions are very low in winter. As a result, the elevated contribution from OCo,nf to OC during clean periods in Beijing could be attributed to regional sources. During clean periods, concentrations of OC and OCo,nf are small, and the measured carbon concentrations can reflect regional sources, which are dominated by secondary sources due to long-range transport. It could also be that the contribution of cooking OC to OCo,nf can be noticeable during clean conditions.
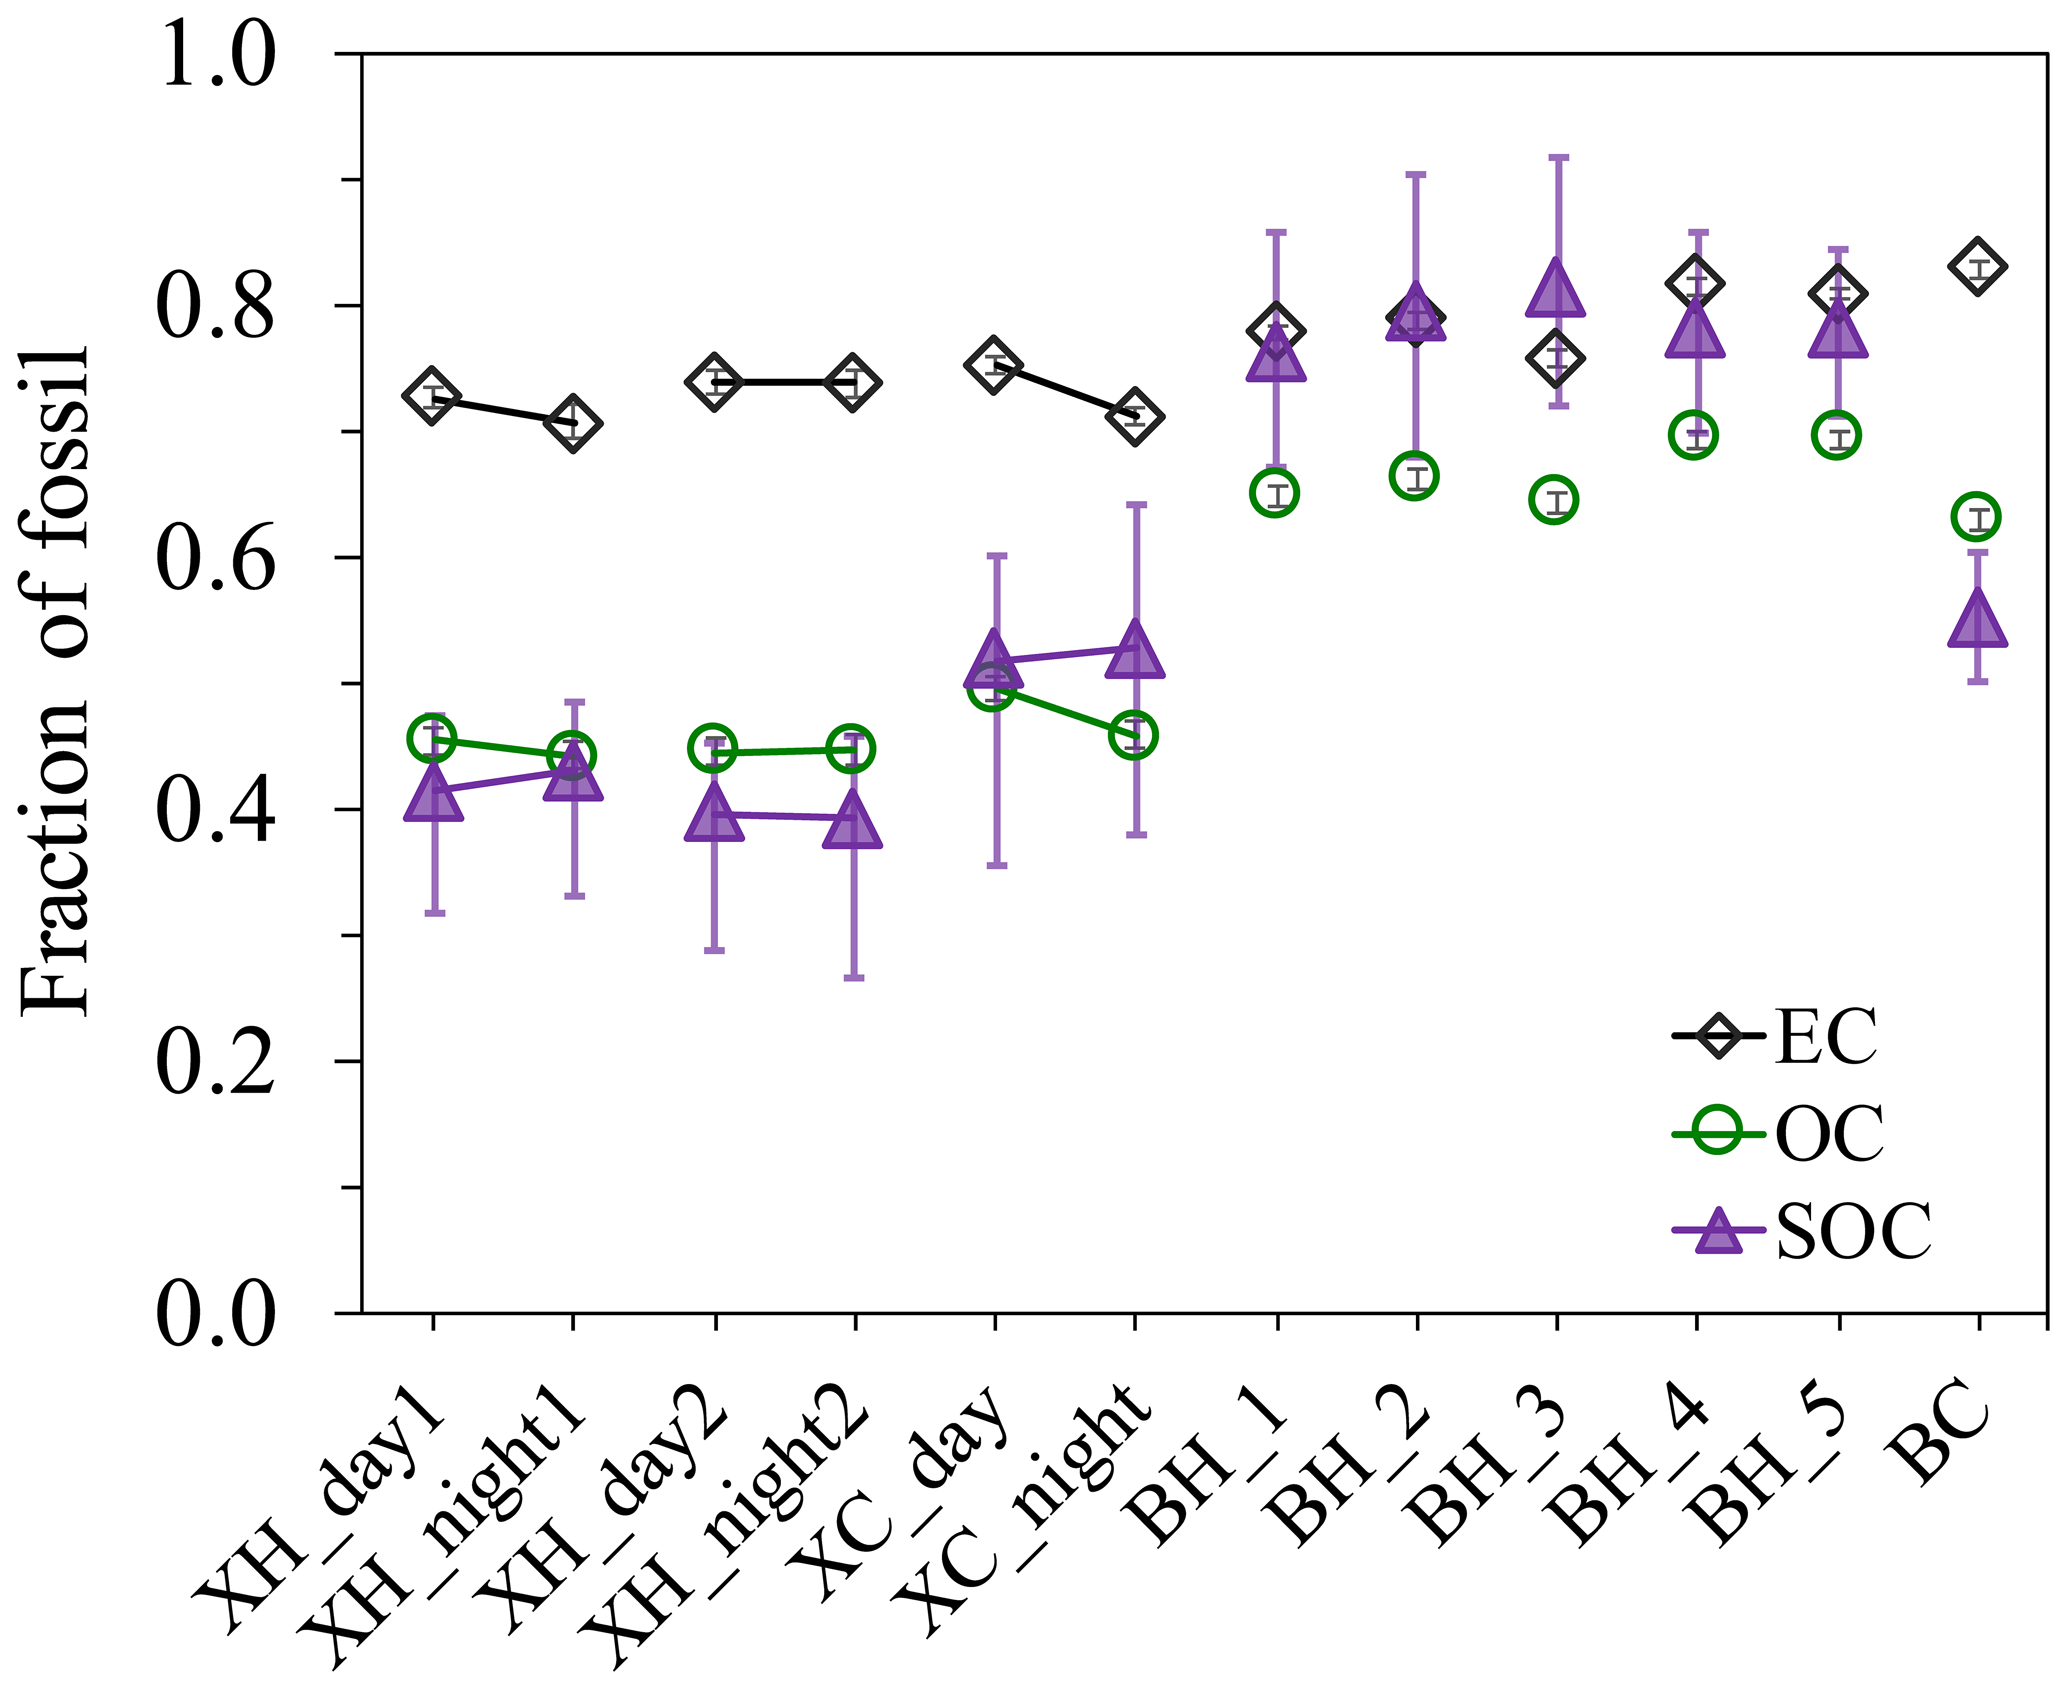
Figure 6Fraction of fossil carbon in EC, OC, and SOC (ffossil(EC), ffossil(OC), and ffossil(SOC), respectively) during haze and clean periods in Xi'an and Beijing. Interquartile ranges (25th–75th percentile) of the median ffossil(SOC) are shown as vertical bars in purple. Uncertainties of 14C-apportioned ffossil(EC) and ffossil(OC) are indicated but are too small to be visible. The studied samples include day and night samples in Xi'an (X) and 24 h integrated samples in Beijing (B) during haze periods (“H” samples) and clean periods (“C” samples). For details of each sample (x axis), see Fig. 1 and Table S1.
The fossil fraction of the total SOC can be defined as ffossil(SOC) = SOCfossil∕SOC. In Xi'an, around half of SOC was derived from fossil sources (ffossil(SOC) = 44 ± 6 %), whereas ffossil(SOC) = 75 ± 10 % in Beijing. Using a similar approach with this study, Zhang et al. (2015) also found that Beijing had higher ffossil(SOC) (48 %–63 %) than in Xi'an (30 %–35 %) during the January 2013 severe haze events. These findings suggest the important contribution of fossil sources to SOC in Beijing and non-fossil sources in Xi'an. The ffossil(SOC) value in Beijing increased during haze periods, whereas the opposite trend was found in Xi'an (Fig. 6). During haze periods in Beijing, ffossil(SOC) overlapped with ffossil(EC) and was clearly higher than ffossil(OC).
Together these results reveal the differences in primary and secondary OC in two Chinese megacities. The contribution of SOC to total OC increased from clean to haze periods in Xi'an. In contrast, SOC∕OC ratios increased from haze to clean periods in Beijing mainly due to increased SOC from non-fossil sources. SOC was dominated by fossil sources in Beijing but by non-fossil sources in Xi'an, especially during haze periods. In Xi'an, the day–night difference was larger during clean periods with less SOC at night.
3.4 Differences between the fractions of non-fossil carbon in OC and EC
The differences between fnf(OC) and fbb(EC) were smaller in Beijing, ranging from 11 % to 20 % compared to 25 %–29 % in Xi'an. To better understand what governs the differences, we express fnf(OC) in terms of fossil to biomass-burning ratio in EC and primary OC∕EC emissions ratios. Starting from the formulas of fbb(EC) andfnf(OC), we find the following:
We find that
where rfossil is the weighted average of rcoal and rvehicle.
Comparing Eqs. (14) and (16), we find that fnf(OC) and fbb(EC) would be equal if . Since rfossil is usually smaller than rbb, fnf(OC) tends to be larger than fbb(EC), assuming that SOC formation is comparable for fossil and non-fossil sources (i.e., ). With smaller rfossil than rbb, similar fnf(OC) and fbb(EC) can result from larger secondary formation from fossil sources than non-fossil sources (i.e., ). However, the coal combustion fossil source has a higher primary OC to EC ratio than vehicle emissions (i.e., rcoal>rvehicle). Therefore, in a city where biomass burning and coal combustion are the dominant pollution sources, fnf(OC) andfbb(EC) will be more similar than in a city where the main sources are biomass burning and vehicle emissions.
Compared to Xi'an, Beijing had significantly smaller differences between fbb(EC) and fnf(OC) (Fig. 1), which was also observed in previous studies during the haze event in January 2013 (Zhang et al., 2015). Comparing Eqs. (14) and (16), this suggests either a strong contribution from coal combustion in Beijing, large secondary formation from fossil sources, or both. The stronger contribution of coal combustion to OC in Beijing than in Xi'an was a direct consequence of a larger proportion of coal combustion in EC in Beijing, as demonstrated by the Bayesian MCMC results of EC (Sect. 3.2). The latter was further validated by the variation of SOC. The ffossil(SOC) in Beijing was higher than that in Xi'an despite the variations between haze and clean periods (Sect. 3.3). By combining 14C measurements with other state-of-the-art analytical techniques (e.g., aerosol mass spectrometry), Huang et al. (2014) also found that fossil OC was mostly secondary in nature in Beijing, and non-fossil SOC formation was dominant in Xi'an during a wintertime haze episode (i.e., Beijing had a larger ffossil(SOC) than Xi'an). However, atmospheric mechanisms responsible for the enhancement of fossil-derived secondary organic aerosol formation in Beijing remain unclear.
Furthermore, as shown in Fig. 1, unlike Xi'an where the differences between fnf(OC) and fbb(EC) were relatively constant for all samples, in Beijing the differences between fnf(OC) and fbb(EC) were smaller during haze periods than clean periods, which was caused by decreased fbb(EC) and slightly increased fnf(OC) during clean periods. This might indicate a higher relative contribution from coal combustion and/or fossil-dominated SOC during haze periods in Beijing. However, the Bayesian MCMC results of EC show the opposite; i.e., in Beijing the contribution of coal combustion to EC was lower during haze periods than during clean periods (Sect. 3.2). Therefore, the only possible explanation is that, during haze periods in Beijing, SOC was dominated by fossil sources. This is validated by significantly larger ffossil(SOC) during haze periods (76 %–81 %) than during clean periods (∼ 55 %; Sect. 3.3).
In conclusion, this section discusses the factors that govern the differences between fbb(EC) and fnf(OC) and concludes that smaller differences suggest a stronger contribution from coal combustion and/or larger secondary formation from fossil sources. This is further examined and validated by source apportionment results of EC and OC (Sect. 3.1–3.3).
In this study, the sources of carbonaceous aerosol were quantified using a dual-carbon isotopic approach for PM2.5 samples collected in urban Xi'an and Beijing that reached the red alarm level during December 2016 and January 2017. The 14C results showed that fossil sources dominated EC, contributing on average 73 ± 2 % of EC in Xi'an and 80 ± 3 % of EC in Beijing. The remaining EC was attributed to biomass burning. In Xi'an, fbb(EC) was fairly constant during haze and clean periods despite the wide range of EC concentrations. However, in Beijing, fbb(EC) increased with increasing EC concentrations. Complementing 14C with δ13C in a Bayesian MCMC approach allows for the separation of fossil sources of EC into coal combustion and liquid fossil fuel combustion. The MCMC results in Xi'an suggest that liquid fossil fuel combustion contributed 44 %–49 % of EC during haze periods and 54 %–57 % of EC during clean periods. In Beijing, coal combustion was the dominant fossil source of EC with a decreasing contribution to EC from clean periods (∼ 61 %) to haze periods (∼ 48 %).
The 14C measurements of OC showed that the contribution of non-fossil sources to OC was larger than that to EC and was on average 54 ± 2 % in Xi'an and 34 ± 3 % in Beijing. The differences between the non-fossil fraction in OC and EC were smaller in Beijing and larger in Xi'an. In Xi'an, the fraction of SOC in total OC was larger during haze periods than during clean periods mainly due to increased SOC from non-fossil sources. Beijing showed the opposite trends with a larger fraction of SOC in total OC during clean periods than during haze periods mainly due to the elevated contribution from non-fossil SOC during clean periods.
SOC was dominated by non-fossil sources in Xi'an but by fossil sources in Beijing, especially during haze periods. The relative contribution of fossil sources to SOC (ffossil(SOC)) was consistently higher in Beijing than in Xi'an. In Beijing, ffossil(SOC) was higher during haze periods (76 %–81 %) than during clean periods (55 %), whereas an opposite trend was found in Xi'an, with ffossil(SOC) increasing from ∼ 39 %–43 % during haze periods to ∼ 52 % during clean periods. In Xi'an, a slight day–night difference was found during clean periods with increasing fossil contribution to OC and EC during the day and less SOC at night. During strong haze, this day–night difference was negligible, suggesting a large accumulation under stagnant weather conditions during the severe haze periods.
Data used to support the findings in this study are archived at the Institute of Earth Environment, Chinese Academy of Sciences, and are available upon request from the corresponding author.
The supplement related to this article is available online at: https://doi.org/10.5194/acp-20-16041-2020-supplement.
RJH and UD designed the study. JC supervised the project. LY contributed to sample preparation. Isotope measurements were made by HN, MMC, and JG. Data analysis and interpretation were done by HN, MMC, RJH, and UD. HN wrote the paper with contributions from all coauthors.
The authors declare that they have no conflict of interest.
We acknowledge the financial support from the Gratama Foundation. We thank Marc Bleeker and Henk Been for their help with the 14C measurements. Special thanks are also given to Anita Aerts-Bijma and Dicky van Zonneveld for their assistance in 14C data correction at CIO.
This research has been supported by the National Key Research and Development Program of China (grant no. 2017YFC0212701), the National Natural Science Foundation of China (grant nos. 41925015, 91644219, and 41877408), the KNAW (grant no. 530-5CDP30), the Chinese Academy of Sciences (grant no. ZDBS-LY-DQC001), and the Cross Innovative Team fund from the State Key Laboratory of Loess and Quaternary Geology (grant no. SKLLQGTD1801).
This paper was edited by Willy Maenhaut and reviewed by two anonymous referees.
An, Z., Huang, R.-J., Zhang, R., Tie, X., Li, G., Cao, J., Zhou, W., Shi, Z., Han, Y., Gu, Z., and Ji, Y.: Severe haze in northern China: a synergy of anthropogenic emissions and atmospheric processes, P. Natl. Acad. Sci. USA, 116, 8657–8666, https://doi.org/10.1073/pnas.1900125116, 2019.
Andersson, A.: A systematic examination of a random sampling strategy for source apportionment calculations, Sci. Total Environ., 412, 232–238, 2011.
Andersson, A., Deng, J., Du, K., Zheng, M., Yan, C., Sköld, M., and Gustafsson, Ö.: Regionally-varying combustion sources of the January 2013 severe haze events over eastern China, Environ. Sci. Technol., 49, 2038–2043, 2015.
Beijing Municipal Bureau of Statistics and NBS Survey Office in Beijing: Beijing Statistical Yearbook, China Statistics Press, Beijing, China, 2017 (in Chinese).
Cao, F., Zhang, Y., Ren, L., Liu, J., Li, J., Zhang, G., Liu, D., Sun, Y., Wang, Z., Shi, Z., and Fu, P.: New insights into the sources and formation of carbonaceous aerosols in China: potential applications of dual-carbon isotopes, Natl. Sci. Rev., 4, 804–806, 2017.
Cao, J.-J., Chow, J. C., Tao, J., Lee, S. C., Watson, J. G., Ho, K. F., Wang, G. H., Zhu, C. S., and Han, Y. M.: Stable carbon isotopes in aerosols from Chinese cities: influence of fossil fuels, Atmos. Environ., 45, 1359–1363, 2011.
Chen, B., Andersson, A., Lee, M., Kirillova, E. N., Xiao, Q., Kruså, M., Shi, M., Hu, K., Lu, Z., Streets, D. G., Du, K., and Gustafsson, Ö.: Source forensics of black carbon aerosols from China, Environ. Sci. Technol., 47, 9102–9108, 2013.
Chow, J. C., Watson, J. G., Chen, L.-W. A., Chang, M. O., Robinson, N. F., Trimble, D., and Kohl, S.: The IMPROVE_A temperature protocol for thermal-optical carbon analysis: maintaining consistency with a long-term database, J. Air Waste Manage., 57, 1014–1023, 2007.
Cui, H., Mao, P., Zhao, Y., Nielsen, C. P., and Zhang, J.: Patterns in atmospheric carbonaceous aerosols in China: emission estimates and observed concentrations, Atmos. Chem. Phys., 15, 8657–8678, https://doi.org/10.5194/acp-15-8657-2015, 2015.
de Rooij, M., van der Plicht, J., and Meijer, H.: Porous iron pellets for AMS 14C analysis of small samples down to ultra-microscale size (10–25µgC), Nucl. Instrum. Meth. B, 268, 947–951, 2010.
Dusek, U., Ten Brink, H., Meijer, H., Kos, G., Mrozek, D., Röckmann, T., Holzinger, R., and Weijers, E.: The contribution of fossil sources to the organic aerosol in the Netherlands, Atmos. Environ., 74, 169–176, 2013.
Dusek, U., Monaco, M., Prokopiou, M., Gongriep, F., Hitzenberger, R., Meijer, H. A. J., and Röckmann, T.: Evaluation of a two-step thermal method for separating organic and elemental carbon for radiocarbon analysis, Atmos. Meas. Tech., 7, 1943–1955, https://doi.org/10.5194/amt-7-1943-2014, 2014.
Dusek, U., Hitzenberger, R., Kasper-Giebl, A., Kistler, M., Meijer, H. A. J., Szidat, S., Wacker, L., Holzinger, R., and Röckmann, T.: Sources and formation mechanisms of carbonaceous aerosol at a regional background site in the Netherlands: insights from a year-long radiocarbon study, Atmos. Chem. Phys., 17, 3233–3251, https://doi.org/10.5194/acp-17-3233-2017, 2017.
Elser, M., Huang, R.-J., Wolf, R., Slowik, J. G., Wang, Q., Canonaco, F., Li, G., Bozzetti, C., Daellenbach, K. R., Huang, Y., Zhang, R., Li, Z., Cao, J., Baltensperger, U., El-Haddad, I., and Prévôt, A. S. H.: New insights into PM2.5 chemical composition and sources in two major cities in China during extreme haze events using aerosol mass spectrometry, Atmos. Chem. Phys., 16, 3207–3225, https://doi.org/10.5194/acp-16-3207-2016, 2016.
Fang, W., Andersson, A., Zheng, M., Lee, M., Holmstrand, H., Kim, S.-W., Du, K., and Gustafsson, Ö.: Divergent evolution of carbonaceous aerosols during dispersal of East Asian haze, Sci. Rep.-UK, 7, 10422, https://doi.org/10.1038/s41598-017-10766-4, 2017.
Fang, W., Du, K., Andersson, A., Xing, Z., Cho, C., Kim, S. W., Deng, J., and Gustafsson, Ö.: Dual-isotope constraints on seasonally-resolved source fingerprinting of Black Carbon aerosols in sites of the four emission hotspot regions of China, J. Geophys. Res.-Atmos., 123, 11735–11747, https://doi.org/10.1029/2018JD028607, 2018.
Guo, S., Hu, M., Guo, Q., Zhang, X., Zheng, M., Zheng, J., Chang, C. C., Schauer, J. J., and Zhang, R.: Primary sources and secondary formation of organic aerosols in Beijing, China, Environ. Sci. Technol., 46, 9846–9853, 2012.
Gustafsson, Ö., Kruså, M., Zencak, Z., Sheesley, R. J., Granat, L., Engström, E., Praveen, P., Rao, P., Leck, C., and Rodhe, H.: Brown clouds over South Asia: biomass or fossil fuel combustion?, Science, 323, 495–498, 2009.
Hallquist, M., Wenger, J. C., Baltensperger, U., Rudich, Y., Simpson, D., Claeys, M., Dommen, J., Donahue, N. M., George, C., Goldstein, A. H., Hamilton, J. F., Herrmann, H., Hoffmann, T., Iinuma, Y., Jang, M., Jenkin, M. E., Jimenez, J. L., Kiendler-Scharr, A., Maenhaut, W., McFiggans, G., Mentel, Th. F., Monod, A., Prévôt, A. S. H., Seinfeld, J. H., Surratt, J. D., Szmigielski, R., and Wildt, J.: The formation, properties and impact of secondary organic aerosol: current and emerging issues, Atmos. Chem. Phys., 9, 5155–5236, https://doi.org/10.5194/acp-9-5155-2009, 2009.
Heal, M. R.: The application of carbon-14 analyses to the source apportionment of atmospheric carbonaceous particulate matter: a review, Anal. Bioanal. Chem., 406, 81–98, 2014.
Hu, D., Bian, Q., Lau, A. K. H., and Yu, J. Z.: Source apportioning of primary and secondary organic carbon in summer PM2.5 in Hong Kong using positive matrix factorization of secondary and primary organic tracer data, J. Geophys. Res.-Atmos., 115, D16204, https://doi.org/10.1029/2009jd01249, 2010.
Huang, R. J., Zhang, Y., Bozzeti, C., Ho, K. F., Cao, J. J., Han, Y., Daellenbach, K. R., Slowik, J. G., Platt, S. M., Canonaco, F., Zotter, P., Wolf, R., Pieber, S. M., Bruns, E. A., Crippa, M., Ciarelli, G., Piazzalunga, A., Schwikowski, M., Abbaszade, G., Schnelle Kreis, J., Zimmermann, R., An, Z., Szidat, S., Baltensperger, U., El Haddad, I., and Prévôt, A. S. H.: High secondary aerosol contribution to particulate pollution during haze events in China, Nature, 514, 218–222, https://doi.org/10.1038/nature13774, 2014.
Jimenez, J. L., Canagaratna, M. R., Donahue, N. M., Prevot, A. S. H., Zhang, Q., Kroll, J. H., DeCarlo, P. F., Allan, J. D., Coe, H., Ng, N. L., Aiken, A. C., Docherty, K. S., Ulbrich, I. M., Grieshop, A. P., Robinson, A. L., Duplissy, J., Smith, J. D., Wilson, K. R., Lanz, V. A., Hueglin, C., Sun, Y. L., Tian, J., Laaksonen, A., Raatikainen, T., Rautiainen, J., Vaattovaara, P., Ehn, M., Kulmala, M., Tomlinson, J. M., Collins, D. R., Cubison, M. J., Dunlea, J., Huffman, J. A., Onasch, T. B., Alfarra, M. R., Williams, P. I., Bower, K., Kondo, Y., Schneider, J., Drewnick, F., Borrmann, S., Weimer, S., Demerjian, K., Salcedo, D., Cottrell, L., Griffin, R., Takami, A., Miyoshi, T., Hatakeyama, S., Shimono, A., Sun, J. Y., Zhang, Y. M., Dzepina, K., Kimmel, J. R., Sueper, D., Jayne, J. T., Herndon, S. C., Trimborn, A. M., Williams, L. R., Wood, E. C., Middlebrook, A. M., Kolb, C. E., Baltensperger, U., and Worsnop, D. R.: Evolution of organic aerosols in the atmosphere, Science, 326, 1525–1529, 2009.
Levin, I., Naegler, T., Kromer, B., Diehl, M., Francey, R. J., Gomez-Pelaez, A., Steele, P., Wagenbach, D., Weller, R., and Worthy, D.: Observations and modelling of the global distribution and long-term trend of atmospheric 14CO2, Tellus B, 62, 26–46, 2010.
Lewis, C. W., Klouda, G. A., and Ellenson, W. D.: Radiocarbon measurement of the biogenic contribution to summertime PM2.5 ambient aerosol in Nashville, TN, Atmos. Environ., 38, 6053–6061, 2004.
Li, C., Bosch, C., Kang, S., Andersson, A., Chen, P., Zhang, Q., Cong, Z., Chen, B., Qin, D., and Gustafsson, Ö.: Sources of black carbon to the Himalayan-Tibetan Plateau glaciers, Nat. Commun., 7, 12574, https://doi.org/10.1038/ncomms12574, 2016.
Liu, J., Li, J., Zhang, Y., Liu, D., Ding, P., Shen, C., Shen, K., He, Q., Ding, X., Wang, X., Chen, D., and Zhang, G.: Source apportionment using radiocarbon and organic tracers for PM2.5 carbonaceous aerosols in Guangzhou, South China: contrasting local-and regional-scale haze events, Environ. Sci. Technol., 48, 12002–12011, 2014.
Liu, J., Li, J., Liu, D., Ding, P., Shen, C., Mo, Y., Wang, X., Luo, C., Cheng, Z., Szidat, S., Zhang, Y., Chen, Y., and Zhang, G.: Source apportionment and dynamic changes of carbonaceous aerosols during the haze bloom-decay process in China based on radiocarbon and organic molecular tracers, Atmos. Chem. Phys., 16, 2985–2996, https://doi.org/10.5194/acp-16-2985-2016, 2016.
Mohn, J., Szidat, S., Fellner, J., Rechberger, H., Quartier, R., Buchmann, B., and Emmenegger, L.: Determination of biogenic and fossil CO2 emitted by waste incineration based on 14CO2 and mass balances, Bioresource Technol., 99, 6471–6479, 2008.
Ni, H., Huang, R.-J., Cao, J., Liu, W., Zhang, T., Wang, M., Meijer, H. A. J., and Dusek, U.: Source apportionment of carbonaceous aerosols in Xi'an, China: insights from a full year of measurements of radiocarbon and the stable isotope 13C, Atmos. Chem. Phys., 18, 16363–16383, https://doi.org/10.5194/acp-18-16363-2018, 2018.
Ni, H., Huang, R.-J., Cao, J., Dai, W., Zhou, J., Deng, H., Aerts-Bijma, A., Meijer, H. A. J., and Dusek, U.: High contributions of fossil sources to more volatile organic aerosol, Atmos. Chem. Phys., 19, 10405–10422, https://doi.org/10.5194/acp-19-10405-2019, 2019a.
Ni, H., Huang, R.-J., Cao, J., Guo, J., Deng, H., and Dusek, U.: Sources and formation of carbonaceous aerosols in Xi'an, China: primary emissions and secondary formation constrained by radiocarbon, Atmos. Chem. Phys., 19, 15609–15628, https://doi.org/10.5194/acp-19-15609-2019, 2019b.
Parnell, A. C., Inger, R., Bearhop, S., and Jackson, A. L.: Source partitioning using stable isotopes: coping with too much variation, PloS ONE, 5, e9672, https://doi.org/10.1371/journal.pone.0009672, 2010.
Parnell, A. C., Phillips, D. L., Bearhop, S., Semmens, B. X., Ward, E. J., Moore, J. W., Jackson, A. L., Grey, J., Kelly, D. J., and Inger, R.: Bayesian stable isotope mixing models, Environmetrics, 24, 387–399, 2013.
Petzold, A., Ogren, J. A., Fiebig, M., Laj, P., Li, S.-M., Baltensperger, U., Holzer-Popp, T., Kinne, S., Pappalardo, G., Sugimoto, N., Wehrli, C., Wiedensohler, A., and Zhang, X.-Y.: Recommendations for reporting “black carbon” measurements, Atmos. Chem. Phys., 13, 8365–8379, https://doi.org/10.5194/acp-13-8365-2013, 2013.
Pöschl, U.: Aerosol particle analysis: challenges and progress, Anal. Bioanal. Chem., 375, 30–32, 2003.
Pöschl, U.: Atmospheric aerosols: composition, transformation, climate and health effects, Angew. Chem. Int. Edit., 44, 7520–7540, 2005.
Reimer, P. J., Brown, T. A., and Reimer, R. W.: Discussion: reporting and calibration of post-bomb 14C data, Radiocarbon, 46, 1299–1304, 2004.
Santos, G. M., Southon, J. R., Griffin, S., Beaupre, S. R., and Druffel, E. R. M.: Ultra small-mass AMS 14C sample preparation and analyses at KCCAMS/UCI Facility, Nucl. Instrum. Meth. B, 259, 293–302, https://doi.org/10.1016/j.nimb.2007.01.172, 2007.
Szidat, S., Ruff, M., Perron, N., Wacker, L., Synal, H.-A., Hallquist, M., Shannigrahi, A. S., Yttri, K. E., Dye, C., and Simpson, D.: Fossil and non-fossil sources of organic carbon (OC) and elemental carbon (EC) in Göteborg, Sweden, Atmos. Chem. Phys., 9, 1521–1535, https://doi.org/10.5194/acp-9-1521-2009, 2009.
Szidat, S., Bench, G., Bernardoni, V., Calzolai, G., Czimczik, C. I., Derendorp, L., Dusek, U., Elder, K., Fedi, M. E., Genberg, J., Gustafsson, Ö., Kirillova, E., Kondo, M., McNichol, A. P., Perron, N., Santos, G. M., Stenström. K., Swietlicki, E., Uchida, M., Vecchi, R., Wacher, L., Zhang, Y., and Prévôt, A. S. H.: Intercomparison of 14C analysis of carbonaceous aerosols: exercise 2009, Radiocarbon, 55, 1496–1509, 2013.
Tie, X., Huang, R.-J., Cao, J., Zhang, Q., Cheng, Y., Su, H., Chang, D., Pöschl, U., Hoffmann, T., Dusek, U., Li, G., Worsnop, D. R., and O'Dowd, C. D.: Severe pollution in China amplified by atmospheric moisture, Sci. Rep.-UK, 7, 15760, doi:10.1038/s41598-017-15909-1, 2017.
Turpin, B. J. and Huntzicker, J. J.: Identification of secondary organic aerosol episodes and quantitation of primary and secondary organic aerosol concentrations during SCAQS, Atmos. Environ., 29, 3527–3544, 1995.
van der Plicht, J., Wijma, S., Aerts, A., Pertuisot, M., and Meijer, H.: Status report: the Groningen AMS facility, Nucl. Instrum. Meth. B, 172, 58–65, 2000.
WHO: Air Quality Guidelines: Global Update 2005: Particulate Matter, Ozone, Nitrogen Dioxide and Sulfur Dioxide, World Health Organization, Geneva, Switzerland, 2006.
Winiger, P., Andersson, A., Eckhardt, S., Stohl, A., and Gustafsson, Ö.: The sources of atmospheric black carbon at a European gateway to the Arctic, Nat. Commun., 7, 12776, https://doi.org/10.1038/ncomms12776, 2016.
Winiger, P., Andersson, A., Eckhardt, S., Stohl, A., Semiletov, I. P., Dudarev, O. V., Charkin, A., Shakhova, N., Klimont, Z., and Heyes, C.: Siberian Arctic black carbon sources constrained by model and observation, P. Natl. Acad. Sci. USA, 114, 1054–1061, https://doi.org/10.1073/pnas.1613401114, 2017.
Xi'an Municipal Bureau of Statistics and NBS Survey Office in Xi'an: Xi'an Statistical Yearbook, China Statistics Press, Beijing, China, 201709, 2017 (in Chinese).
Xu, H., Cao, J., Chow, J. C., Huang, R.-J., Shen, Z., Chen, L. A., Ho, K. F., and Watson, J. G.: Inter-annual variability of wintertime PM2.5 chemical composition in Xi'an, China: evidences of changing source emissions, Sci. Total Environ., 545, 546–555, 2016.
Zenker, K., Vonwiller, M., Szidat, S., Calzolai, G., Giannoni, M., Bernardoni, V., Jedynska, A. D., Henzing, B., Meijer, H. A., and Dusek, U.: Evaluation and Inter-comparison of oxygen-based OC-EC separation methods for radiocarbon analysis of ambient aerosol particle samples, Atmosphere, 8, 226, https://doi.org/10.3390/atmos8110226, 2017.
Zhang, T., Cao, J.-J., Chow, J. C., Shen, Z.-X., Ho, K.-F., Ho, S. S. H., Liu, S.-X., Han, Y.-M., Watson, J. G., Wang, G.-H., and Huang, R.-J.: Characterization and seasonal variations of levoglucosan in fine particulate matter in Xi'an, China, J. Air Waste Manage., 64, 1317–1327, https://doi.org/10.1080/10962247.2014.944959, 2014.
Zhang, X. Y., Wang, Y. Q., Zhang, X. C., Guo, W., and Gong, S. L.: Carbonaceous aerosol composition over various regions of China during 2006, J. Geophys. Res., 113, D14111, https://doi.org/10.1029/2007JD009525, 2008.
Zhang, Y.-L., Huang, R.-J., El Haddad, I., Ho, K.-F., Cao, J.-J., Han, Y., Zotter, P., Bozzetti, C., Daellenbach, K. R., Canonaco, F., Slowik, J. G., Salazar, G., Schwikowski, M., Schnelle-Kreis, J., Abbaszade, G., Zimmermann, R., Baltensperger, U., Prévôt, A. S. H., and Szidat, S.: Fossil vs. non-fossil sources of fine carbonaceous aerosols in four Chinese cities during the extreme winter haze episode of 2013, Atmos. Chem. Phys., 15, 1299–1312, https://doi.org/10.5194/acp-15-1299-2015, 2015.
Zheng, G. J., Duan, F. K., Su, H., Ma, Y. L., Cheng, Y., Zheng, B., Zhang, Q., Huang, T., Kimoto, T., Chang, D., Pöschl, U., Cheng, Y. F., and He, K. B.: Exploring the severe winter haze in Beijing: the impact of synoptic weather, regional transport and heterogeneous reactions, Atmos. Chem. Phys., 15, 2969–2983, https://doi.org/10.5194/acp-15-2969-2015, 2015.
Zotter, P., Ciobanu, V. G., Zhang, Y. L., El-Haddad, I., Macchia, M., Daellenbach, K. R., Salazar, G. A., Huang, R.-J., Wacker, L., Hueglin, C., Piazzalunga, A., Fermo, P., Schwikowski, M., Baltensperger, U., Szidat, S., and Prévôt, A. S. H.: Radiocarbon analysis of elemental and organic carbon in Switzerland during winter-smog episodes from 2008 to 2012 – Part 1: Source apportionment and spatial variability, Atmos. Chem. Phys., 14, 13551–13570, https://doi.org/10.5194/acp-14-13551-2014, 2014.