the Creative Commons Attribution 4.0 License.
the Creative Commons Attribution 4.0 License.
 | 04 Dec 2020
The “urban meteorology island”: a multi-model ensemble analysis
Peter Huszár
Tereza Nováková
Michal Belda
Filip Švábik
Jana Ďoubalová
Tomáš Halenka
Cities and urban areas are well-known for their impact on meteorological variables and thereby modification of the local climate. Our study aims to generalize the urban-induced changes in specific meteorological variables by introducing a single phenomenon – the urban meteorology island (UMI). A wide ensemble of 24 model simulations with the Weather Research and Forecasting (WRF) regional climate model and the Regional Climate Model (RegCM) on a European domain with 9 km horizontal resolution were performed to investigate various urban-induced modifications as individual components of the UMI. The results show that such an approach is meaningful, because in nearly all meteorological variables considered, statistically significant changes occur in cities. Besides previously documented urban-induced changes in temperature, wind speed and boundary-layer height, the study is also focused on changes in cloud cover, precipitation and humidity. An increase in cloud cover in cities, together with a higher amount of sub-grid-scale precipitation, is detected on summer afternoons. Specific humidity is significantly lower in cities. Further, the study shows that different models and parameterizations can have a strong impact on discussed components of the UMI. Multi-layer urban schemes with anthropogenic heat considered increase winter temperatures by more than 2 ∘C and reduce wind speed more strongly than other urban models. The selection of the planetary-boundary-layer scheme also influences the urban wind speed reduction, as well as the boundary-layer height, to the greatest extent. Finally, urban changes in cloud cover and precipitation are mostly sensitive to the parameterization of convection.
- Article
(7234 KB) - Full-text XML
- BibTeX
- EndNote


Climate is one of the most important factors that influences the conditions for life at a specific place. Considering the fact that half of the current global population lives in cities (United Nations, Department of Economic and Social Affairs, 2014) and the populations of the largest cities are still projected to increase (Baklanov et al., 2016) and that the total number of cities of different sizes is rising (Mirzaei, 2015), general knowledge of typical urban climate features and the difference with respect to their rural counterparts is becoming more and more crucial.
The most well-known urban climate feature is the so-called urban heat island (UHI), first described several decades ago (Oke and Maxwell, 1975), and means, in simple terms, that urban temperatures are higher compared to rural ones. In following years, a large number of UHI observations were performed (e.g. Oke, 1982; Godowitch et al., 1985; Wolters and Brandsma, 2012; Theeuwes et al., 2015) and several empirical relations for UHI intensity (difference in city centre and vicinity temperature) were introduced (Oke, 1982; Theeuwes et al., 2017). More recently, once computational power enabled a finer grid resolution, many modelling studies focusing primarily on UHIs have been performed (e.g. Ryu et al., 2013; Huszar et al., 2014; Trusilova et al., 2016; Göndöcs et al., 2017; Karlický et al., 2018; Huang et al., 2019). Specialized models of urban canopies within standard numerical weather prediction and regional climate models have been used to capture the specifics of urban climate features.
However, several observations and model-based studies show that other meteorological variables are significantly altered by urban canopies too. The impact of cities on boundary-layer structure was already documented many years ago (Godowitch et al., 1985; Oke, 1987; Angevine et al., 2003), similarly to the impact on wind flow (Oke, 1987; Klein et al., 2001; Droste et al., 2018). These modifications of atmospheric dynamics over cities have considerable consequences for the mixing and dispersion of pollutants and air quality in urban areas, which has also been confirmed by model studies investigating the urban-induced changes in dispersion conditions (Karlický et al., 2018) and in primary or secondary pollutant concentrations (Fallmann et al., 2016; Huszár et al., 2018; Huszar et al., 2018; Li et al., 2019; Huszar et al., 2020a, b; Ďoubalová et al., 2020).
Recently, some studies have investigated the impact of urban canopies on convection, cloud cover and rainfall. E.g. Theeuwes et al. (2019) describe the observed cloud cover enhancement over Paris and London during summer as a consequence of increased convection caused by UHIs. Manola et al. (2020) show increased summer precipitation intensities and also an overall precipitation increase in the city of Amsterdam in comparison to rural surroundings. Enhanced convection, turbulence and mixing can even cause, under special weather conditions, increased wind speed over cities (Droste et al., 2018). Finally, humidity is also impacted by the urban canopy; e.g. Langendijk et al. (2019) show a significant decrease in relative humidity in Berlin (primarily in summer) and a less expressed decrease in specific humidity.
All these urban-induced meteorological changes, forming island-like features in the spatial distribution of the mentioned variables over urban areas, have resulted in a formulation of new concepts describing the urban weather and climate. Apart from the UHI (Oke and Maxwell, 1975), other meteorology-related “urban islands” have been defined recently: urban dry island (UDI; Moriwaki et al., 2013), urban cool island (UCI; Theeuwes et al., 2015), surface urban heat island (SUHI; Göndöcs et al., 2017) and urban wind island (UWI; Droste et al., 2018). Such a relatively wide range of well-documented island-like perturbations of physical fields over urban areas in contrast to their rural counterparts basically means that the meteorological conditions differ due to changes in all the atmospheric physics and dynamics in urban areas. Therefore, we introduce here a generalization of the above-mentioned urban area islands: the urban meteorology island (UMI), which we consider to be an urban area that has significantly different meteorological conditions from surrounding rural areas. The specific “one-variable” islands like the UHI, UDI, UCI, SUHI and UWI can be regarded as components of the UMI, denoted as the UXI, in general.
Considering the above-mentioned modelling studies, models simulate well, at least qualitatively, most of the processes leading to the UHI, and other elements of the UMI are also simulated with all expected features. However, large differences exist in the magnitude of individual elements of the UMI between different models and their configurations (e.g. Trusilova et al., 2016; Karlický et al., 2018; Huang et al., 2019; Huszar et al., 2020a, b). It is clear that the resulting UMI will be highly dependent on how the relevant UXI-forming processes are represented in models, which include the parameterization of sub-grid processes such as boundary-layer turbulence, convection, air–surface heat and water exchange, microphysics, and urban canopy physics. The choice of driving model itself can also have a potentially strong impact.
Motivated by this, here we present a novel study that (1) perceives the urban-induced meteorological changes as one UMI concept where urban perturbations of specific variables (UXI) are considered components of the whole UMI. Further, (2) a large number of cities from different locations in a model domain are taken into account to enable a robust, city-independent view on the impact of a specific model and parameterization on the resulting UMI. Next, (3) a wide range of the model simulation ensemble provides a robust estimation of different components of the UMI, including their magnitudes and temporal evolution. Finally, (4) a multi-variable validation of the whole model ensemble is performed here that provides a useful view for other model users and can be feedback for model developers.
The paper is composed as follows: after the Introduction, the models, the data and the design of the experiments are presented, followed by the “Results” section which contains a detailed validation of different model setups and the comparison of UMI components. Finally, the results are discussed and conclusions are drawn.
2.1 Models used
To achieve results of the study, several model simulations were performed by involving two meteorological models, namely the Weather Research and Forecasting (WRF; Skamarock et al., 2008) model in version 4.0.3 and Regional Climate Model (RegCM; Giorgi et al., 2012) in version 4.7. In both cases, the ERA-Interim data (Dee et al., 2011) were used as the driving meteorology. The computational domain was also the same for both models, specifically a 190 × 166 domain with 9 km horizontal resolution over Europe, centred over Prague, Czech Republic (Figs. 1, 2). The simulation time range is 2 years (2015–2016), with December 2014 as spin-up. Despite the fact that 2015 was abnormally warmer than usual in central Europe (not so for 2016), the variability in the local climate characteristic across the domain is certainly larger than the year-to-year variability within the individual cities (e.g. Warsaw with an annual average temperature of about 8 ∘C versus Belgrade with 12 ∘C, following https://www.climate-data.org, last access: 28 October 2020). We thus conclude that the spread of the magnitude of the urban meteorological effects given by considering a wide range of cities is well above the spread given by choosing different years during a recent decade. Static geographic data are taken from standard WRF and RegCM input, except land-use fields are derived from CORINE Land Cover data, version CLC 2012. While WRF uses dominant land use (i.e. one land-use type for a particular grid box, Fig. 1), the RegCM works with fractional land use (more land-use types included proportionally in one grid box, Fig. 2). Urban canopy parameters are the same as in Karlický et al. (2018).
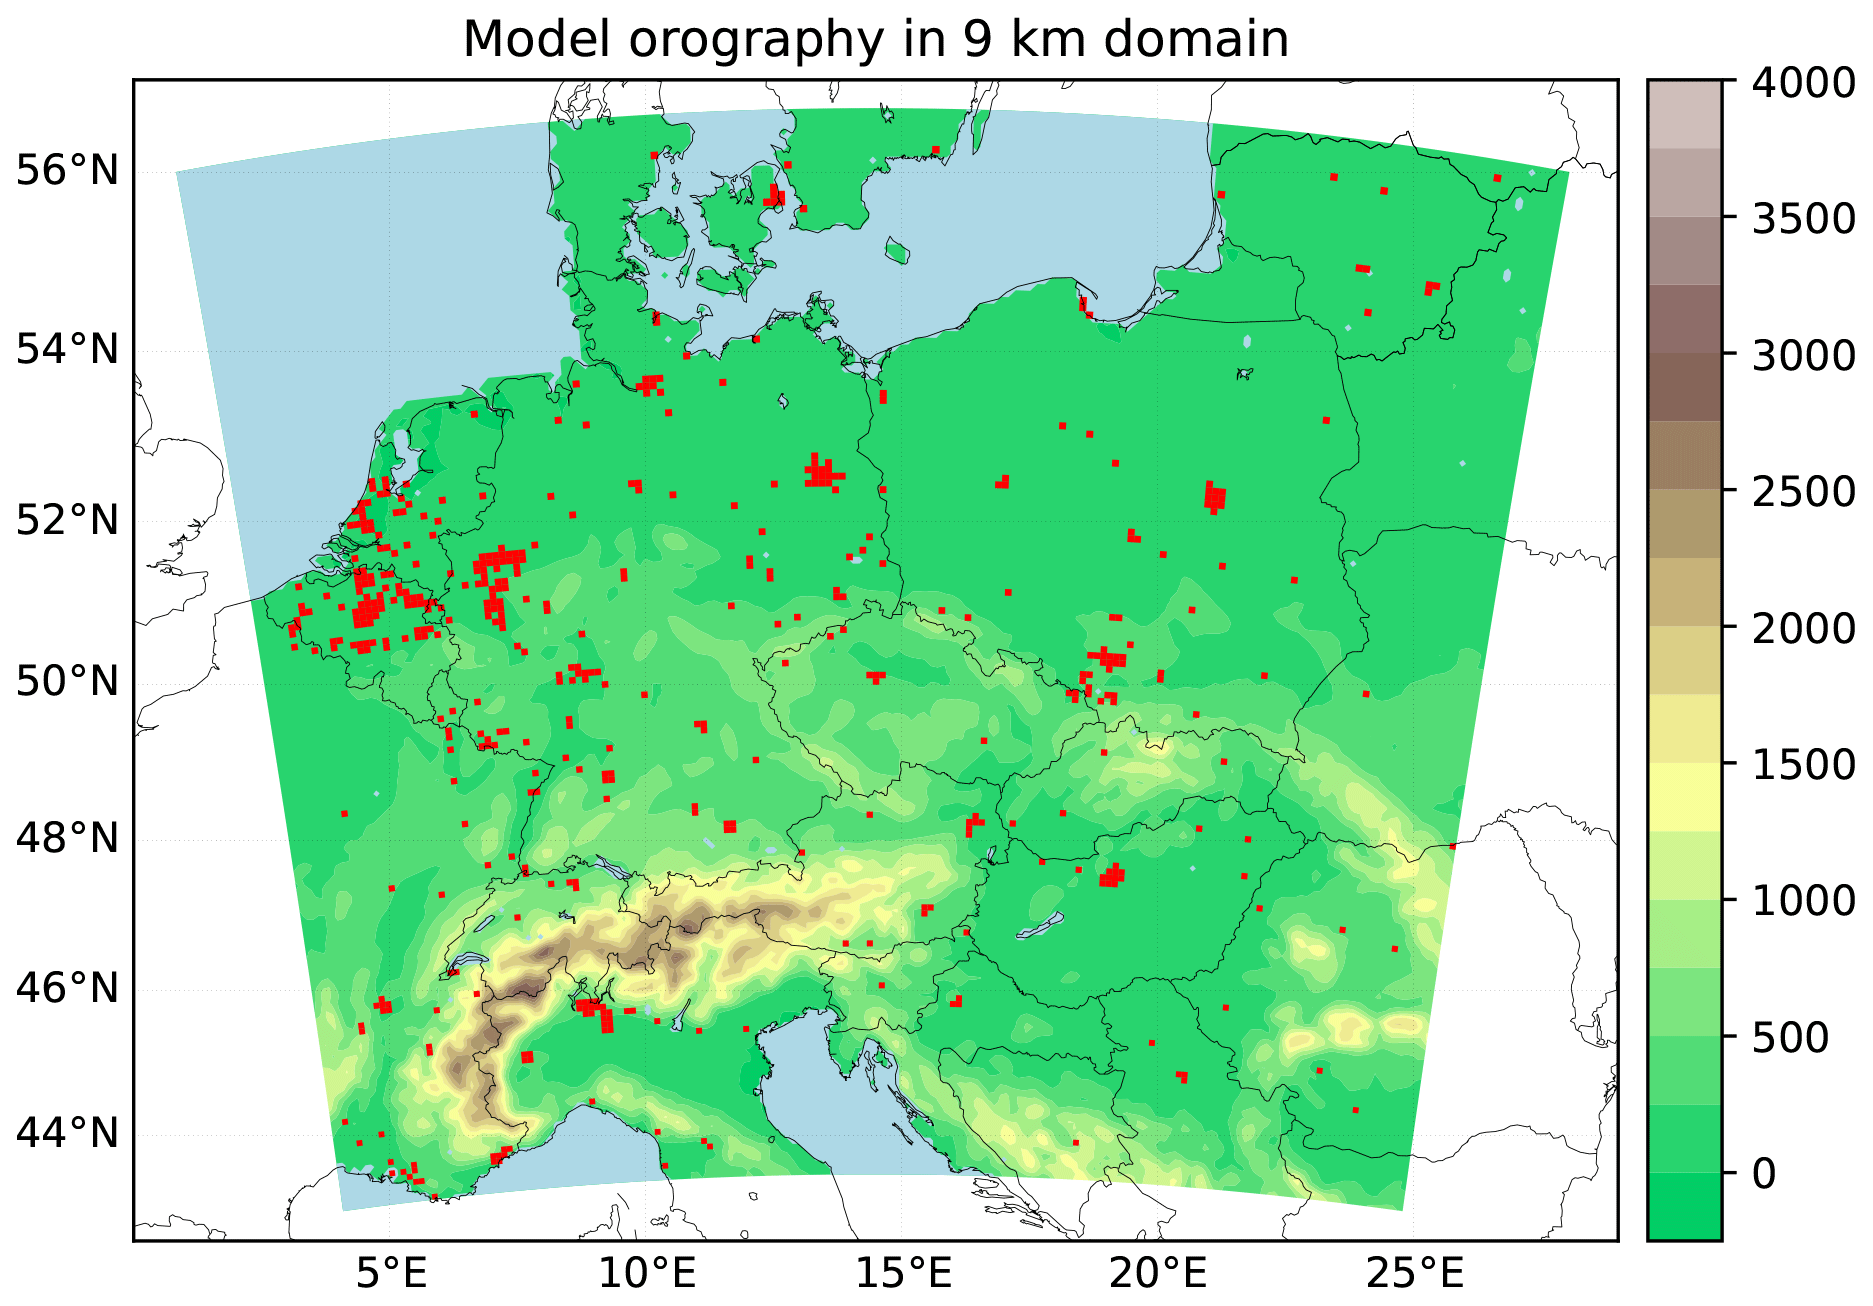
Figure 1Position of model domain with model orography (m) and grid boxes marked with red, in which the urban land-use type is dominant.
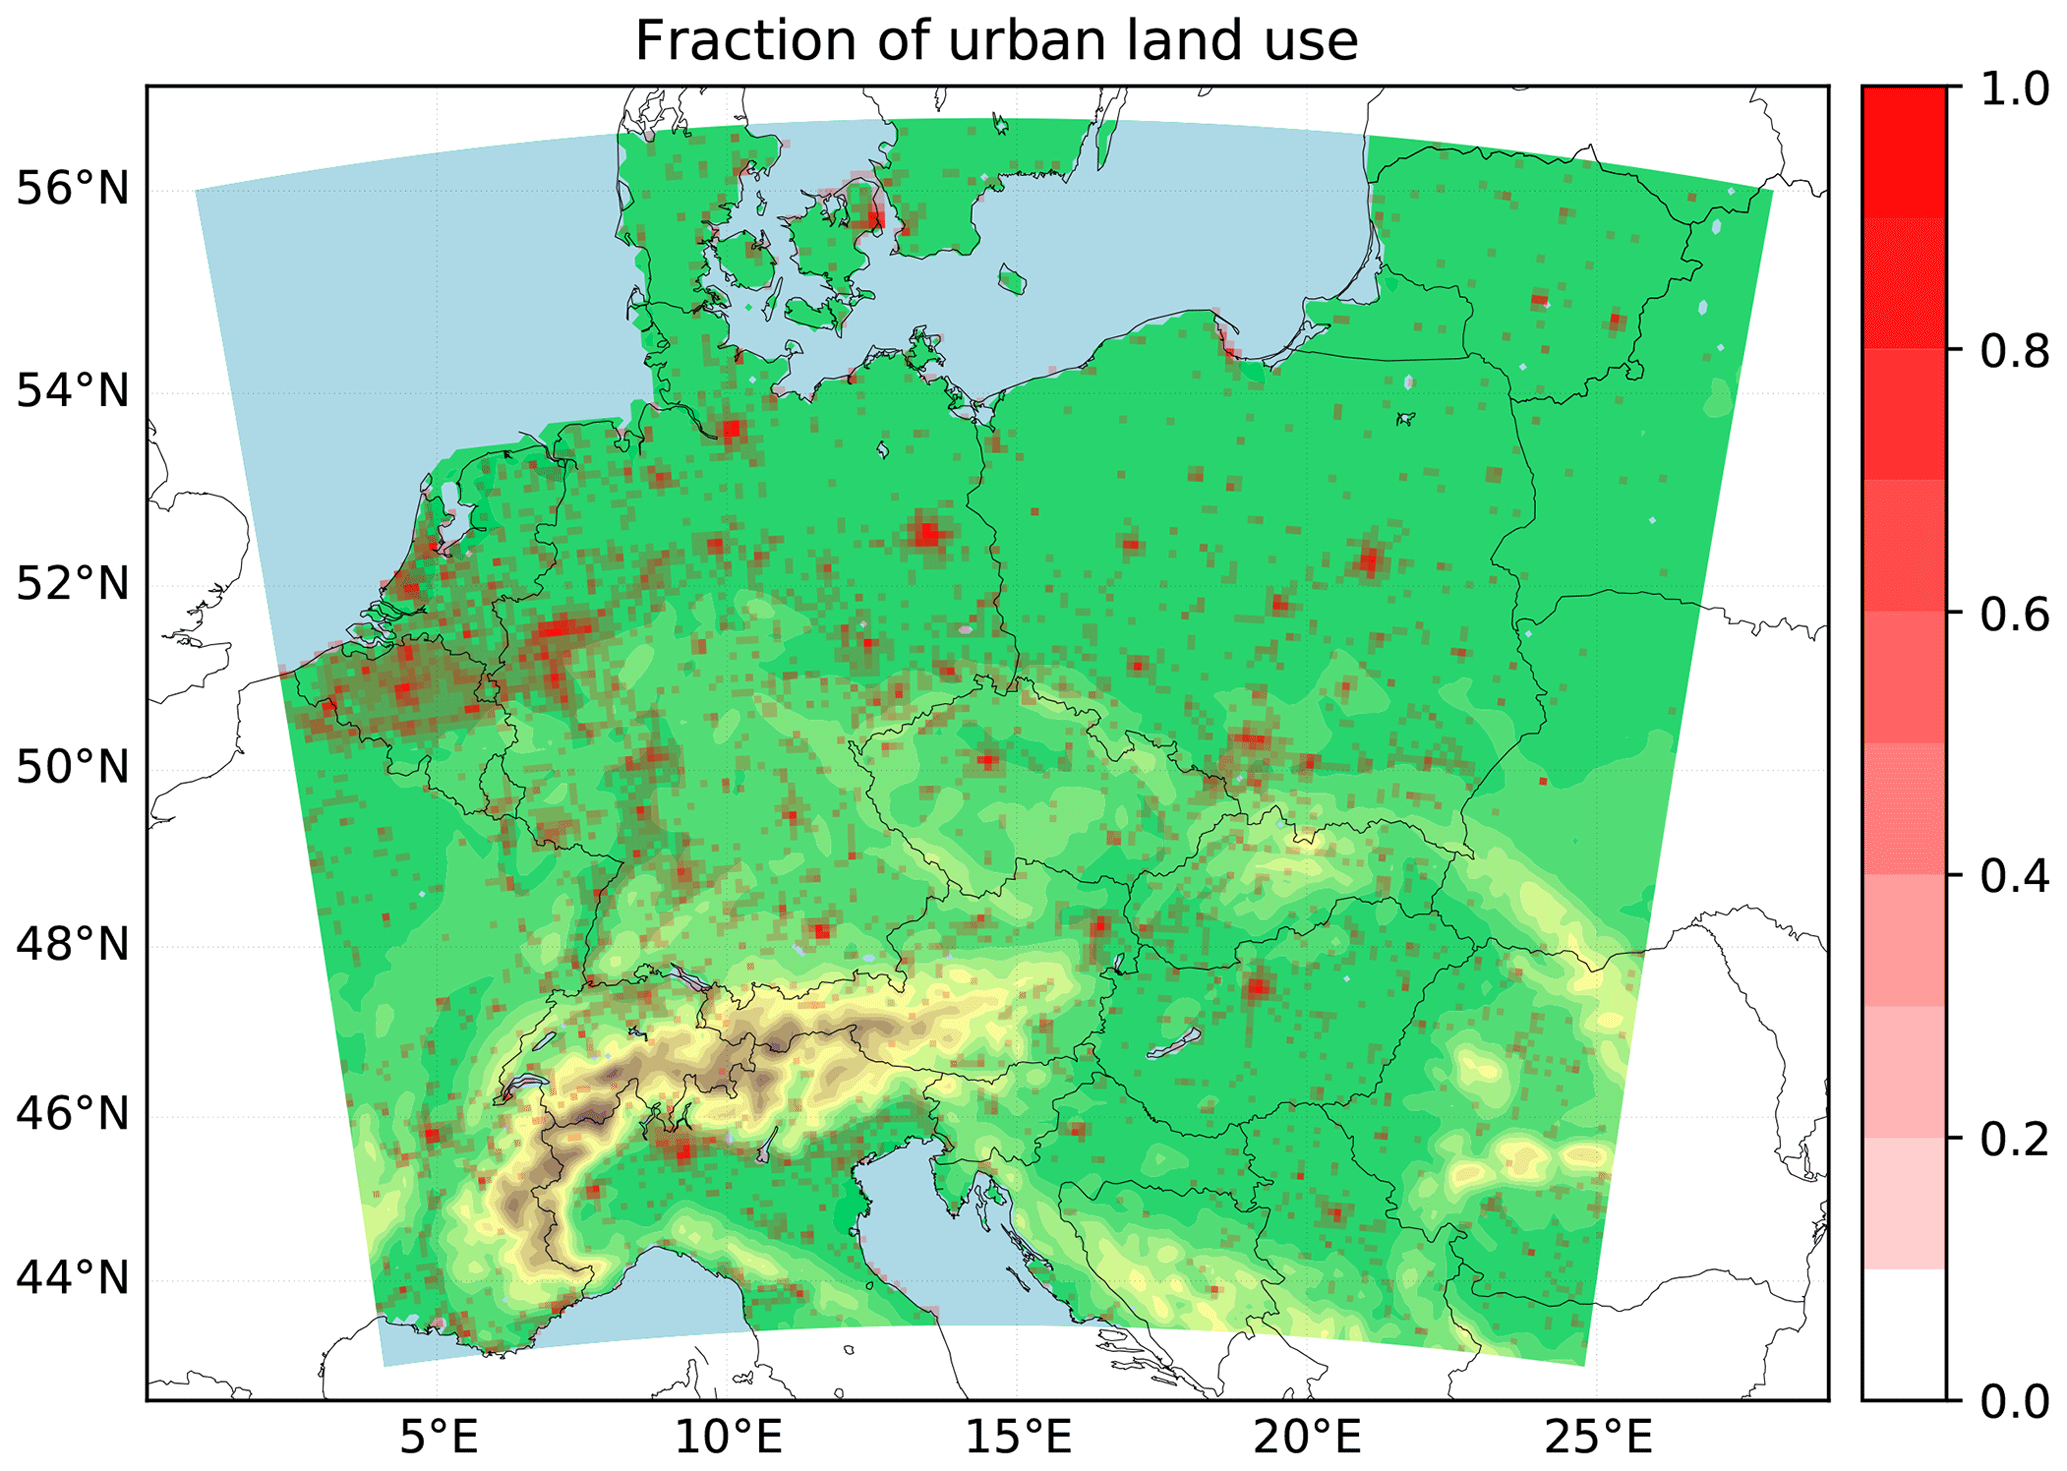
Figure 2As in Fig. 1 but with red marking urban land-use proportion.
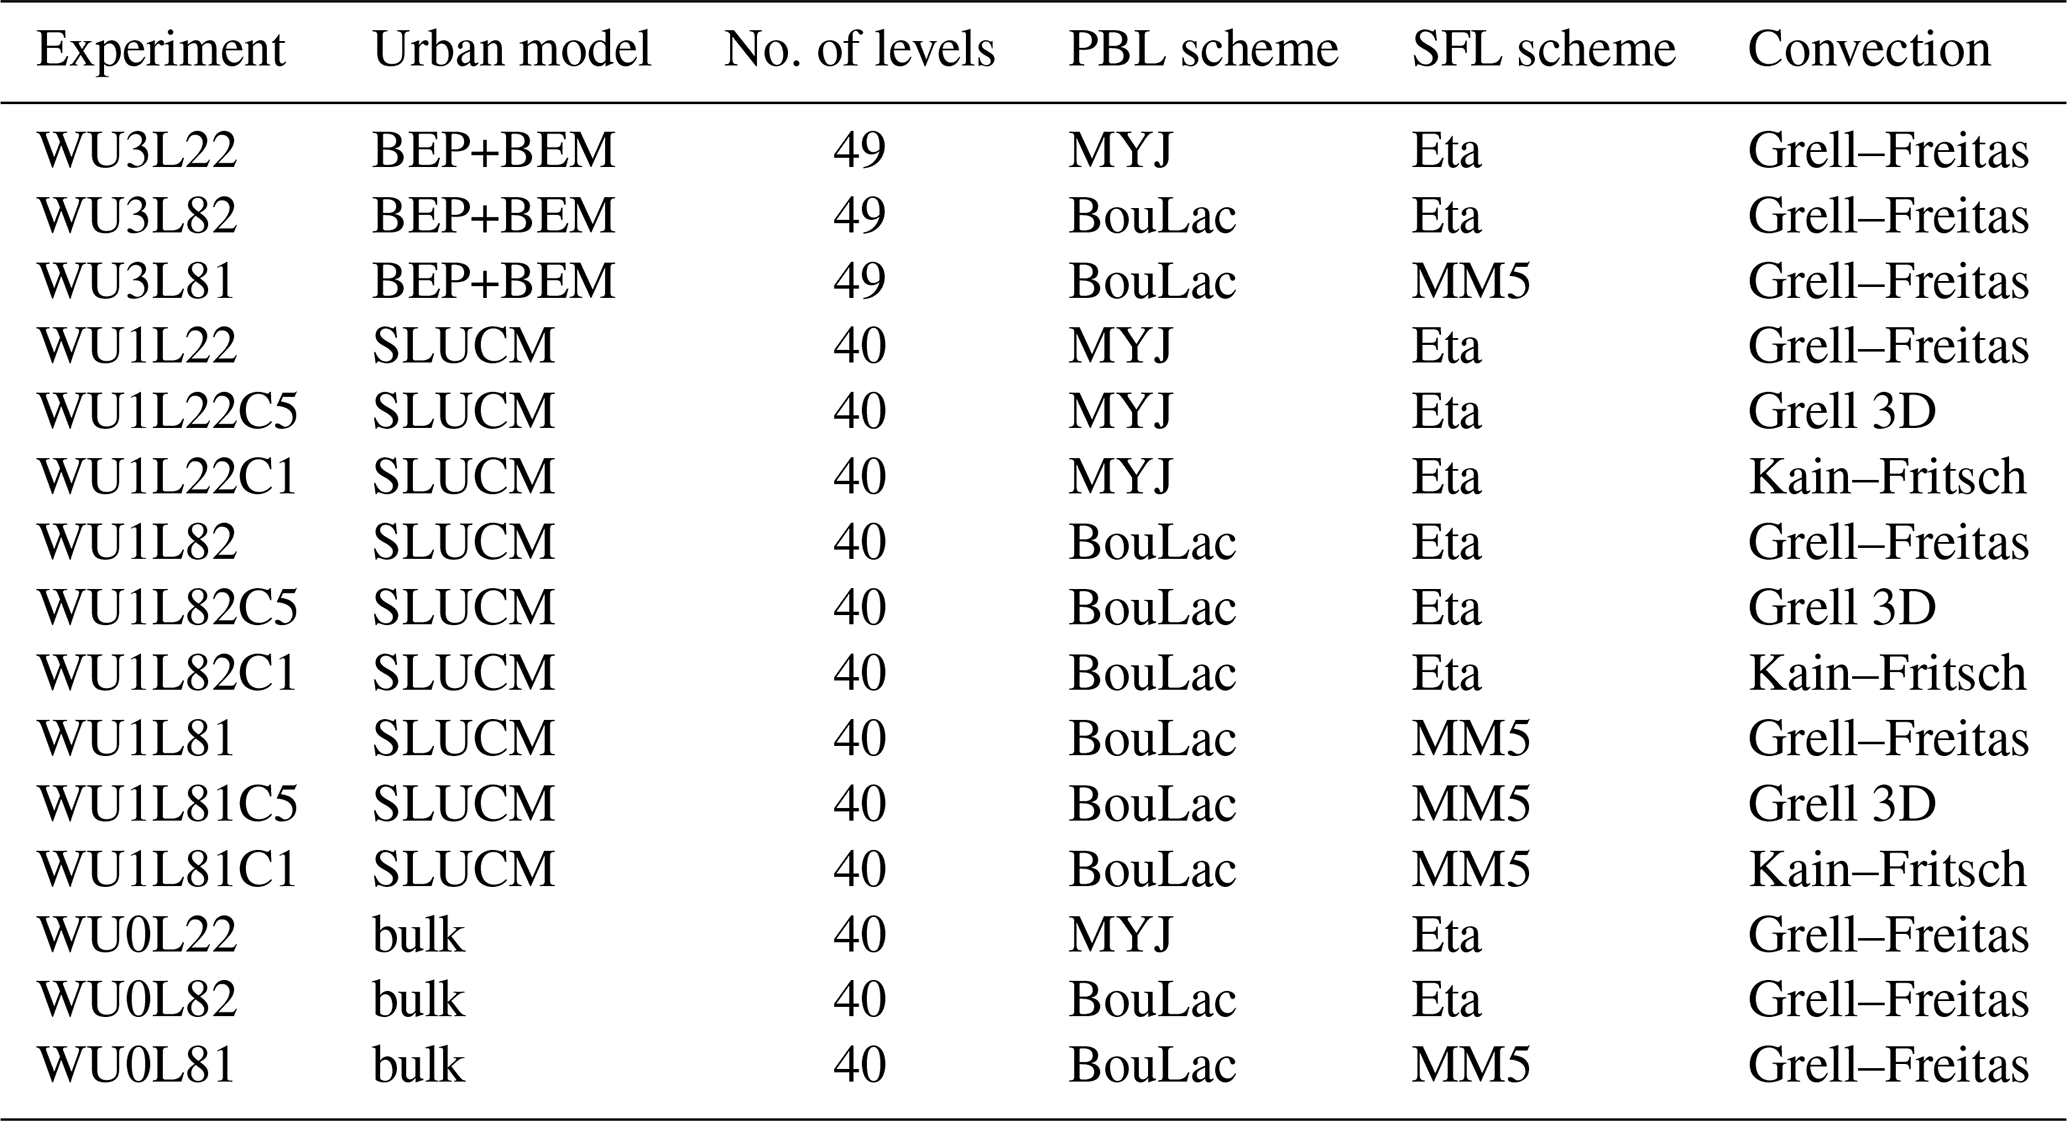
The selection of model schemes is based on their availability, restrictions in their different combinations and their expected impact on the urban effects and to enable cumulus radiation feedback. In all WRF simulations, the radiative transfer is parameterized by the Rapid Radiative Transfer Model for general circulation models (RRTMG; Iacono et al., 2008), microphysical processes are resolved by the Purdue Lin scheme (Chen and Sun, 2002) and land surface exchange is resolved by the Noah land surface model (Chen and Dudhia, 2001). The specific WRF simulations differ in parameterizations of the boundary-layer processes, which are resolved by the Mellor–Yamada–Janjić (MYJ) scheme (Janjić, 1994) or the BouLac planetary boundary layer (PBL) scheme (Bougeault and Lacarrere, 1989), and in surface layer (SFL) process description, using the scheme as in the Eta Model (Janjić, 1994) or the revised MM5 scheme (Jiménez et al., 2012). Further, the multi-layer building environment parameterization (BEP; Martilli et al., 2002) linked to a building energy model (BEM; Salamanca et al., 2009), a single-layer urban canopy model (SLUCM; Kusaka et al., 2001) and bulk parameterization are tested for processes in the urban environment. Convection is parameterized by the Grell–Freitas (Grell and Freitas, 2014), Grell 3D (Grell, 1993) and Kain–Fritsch (Kain, 2004) schemes. In total, 15 specific combinations of chosen schemes were used, and they are described in Table 1.
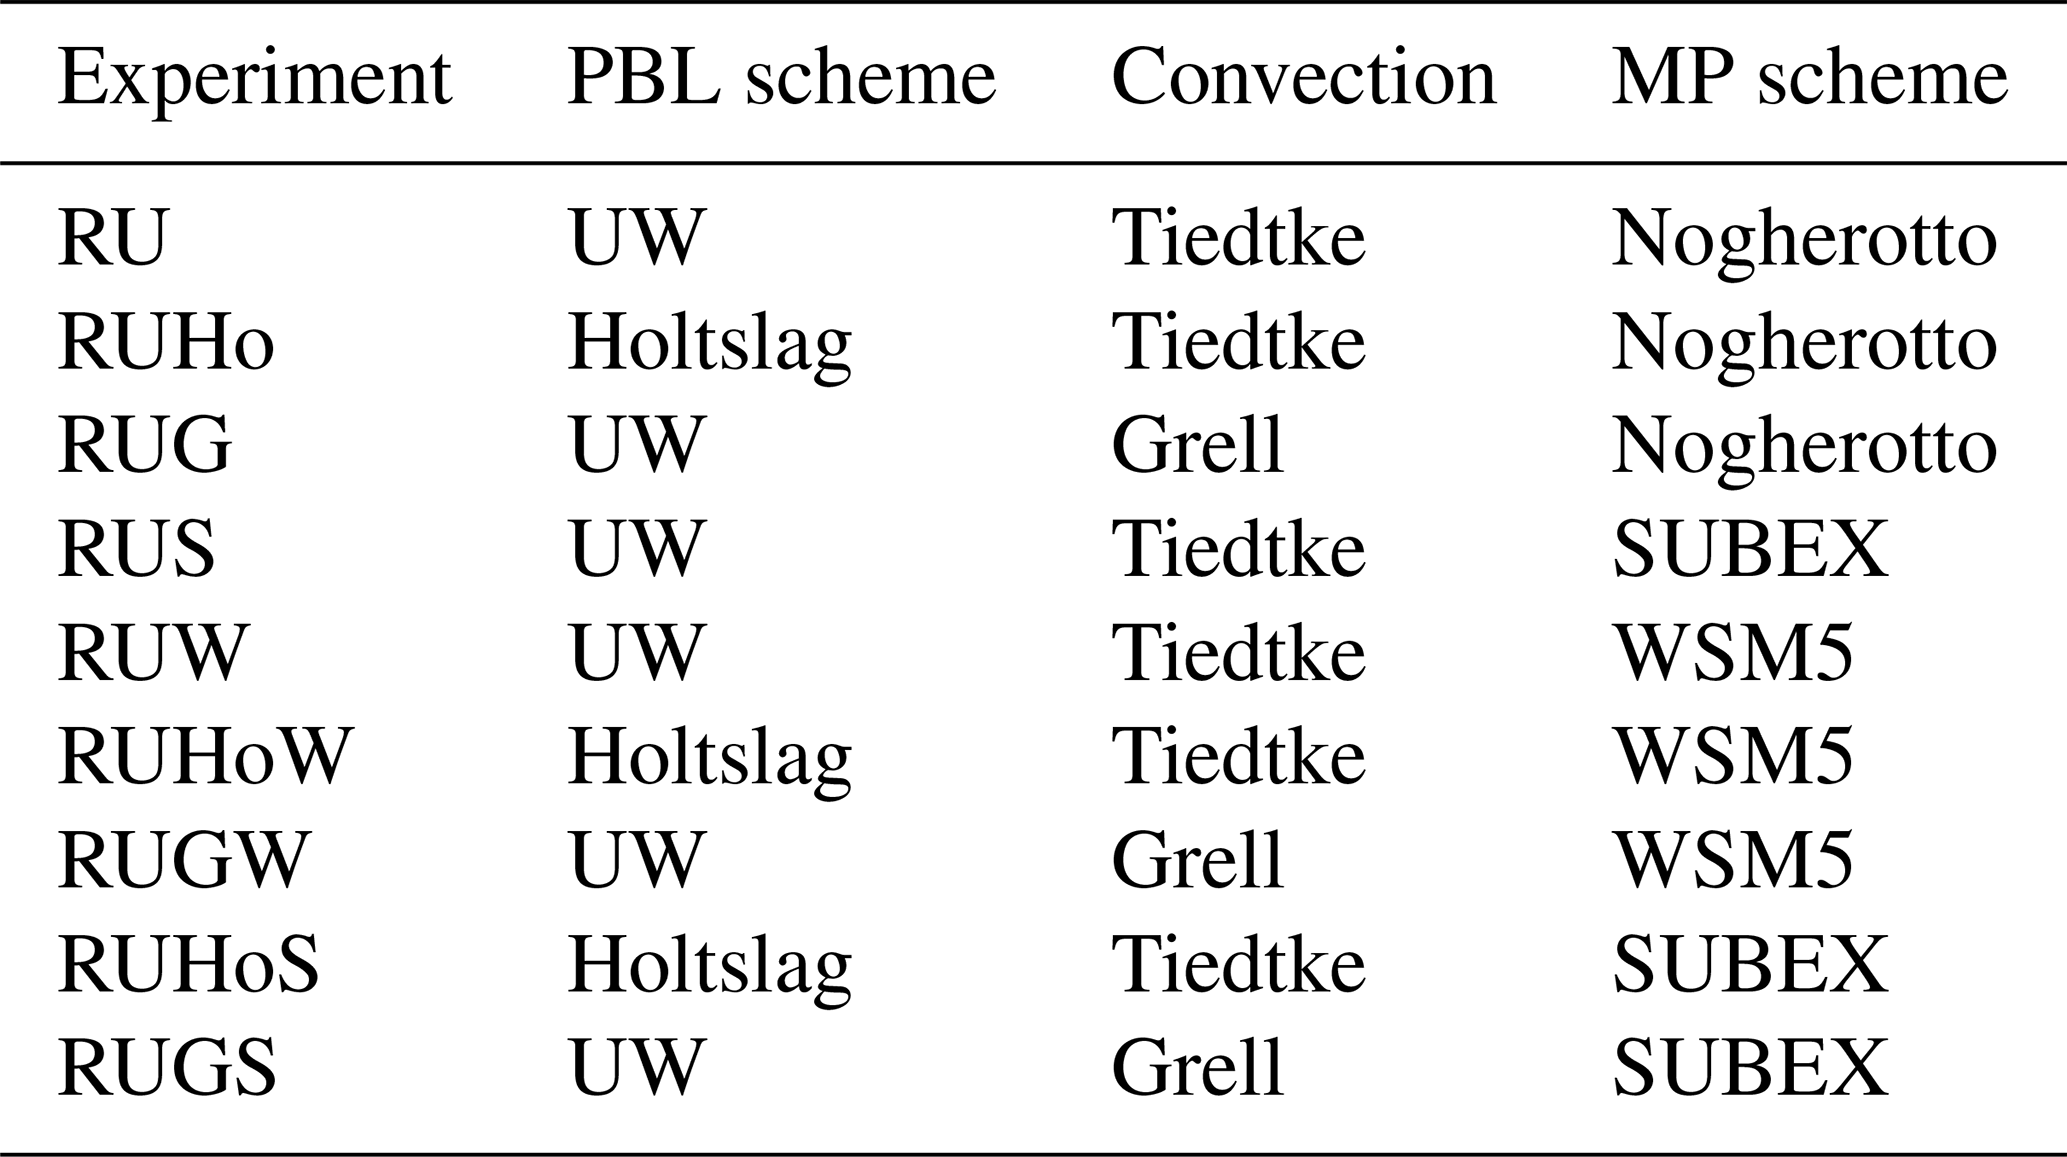
In terms of the RegCM setup, all simulations are run on 40 model layers, the NCAR Community Climate Model version 3 (CCM3; Kiehl et al., 1996) is used to parameterize the radiation transfer, land surface transfer is resolved by the Community Land Model version 4.5 (CLM4.5; Lawrence et al., 2011; Oleson et al., 2013) scheme, and urban-canopy-layer processes are solved by the Community Land Model Urban (CLMU; Oleson et al., 2008) scheme. Here, the model ensemble is created by two different parameterizations of boundary-layer processes – the University of Washington (UW; Grenier and Bretherton, 2001; Bretherton et al., 2004) and the Holtslag (Holtslag et al., 1990) PBL scheme; by two different approaches of solving sub-grid convection – the Tiedtke scheme (Tiedtke, 1989) and the Grell scheme (Grell, 1993); and by three schemes of microphysical (MP) processes – the explicit one-moment scheme by Nogherotto et al. (2016), the older SUBEX scheme (Pal et al., 2000) and the explicit five-class single-moment WSM5 model (Hong et al., 2004). The specific combinations of chosen schemes in terms of the RegCM are described in Table 2; the first model setup is considered a baseline setup.
2.2 Validation data
To assess the model biases for temperature and precipitation over the entire domain, the E-OBS dataset (Haylock et al., 2008) version 17.0 is chosen. Further, station-based data from the European Climate Assessment and Dataset (ECAD; Klein Tank et al., 2002) are used for more detailed validation of model results in terms of daily maximum and minimum temperatures, cloud cover, relative humidity, downward shortwave radiation, and wind speed. For every variable, 10 stations were chosen that are equally distributed over the domain. The specific stations are listed in Table 3.

Model surface (skin) temperature is validated by data from the Moderate Resolution Imaging Spectroradiometer (MODIS), operated by the Terra and Aqua satellites (Wan et al., 2015a, b). For further use, monthly values of surface temperature with 0.05∘ horizontal resolution are selected. These are computed only from observations with clear-sky conditions, when satellite sensors are able to scan the Earth's surface. In our area of interest, four observations per day are performed, approximately at 10:00 and 21:00 UTC by the Terra satellite and at 02:00 and 12:00 UTC by the Aqua satellite.
3.1 Model validation of model simulation ensemble
First, the general comparison of model temperatures and precipitation against E-OBS data is performed. Seasonal temperature and rainfall sums are averaged over the whole domain (excluding 20 rows and columns at the domain edges) and compared with corresponding E-OBS data. Results are shown in Fig. 3. Most of the WRF simulations predict average temperatures correctly; only simulations with the MYJ PBL and Eta SFL schemes give notable underestimations (up to 2 ∘C). RegCM simulations with the Nogherotto MP scheme produce substantial biases, mainly in spring and summer seasons. Precipitation biases are related mainly to the chosen convection scheme: for WRF, the average summer overestimation is partly reduced by using the Grell 3D scheme. In the RegCM, the Nogherotto MP scheme influences precipitation (besides temperature), resulting in a high bias during the whole year. Further, it seems that experiments with the Grell convection scheme are marked with higher summer overestimation than those with the Tiedtke convection.
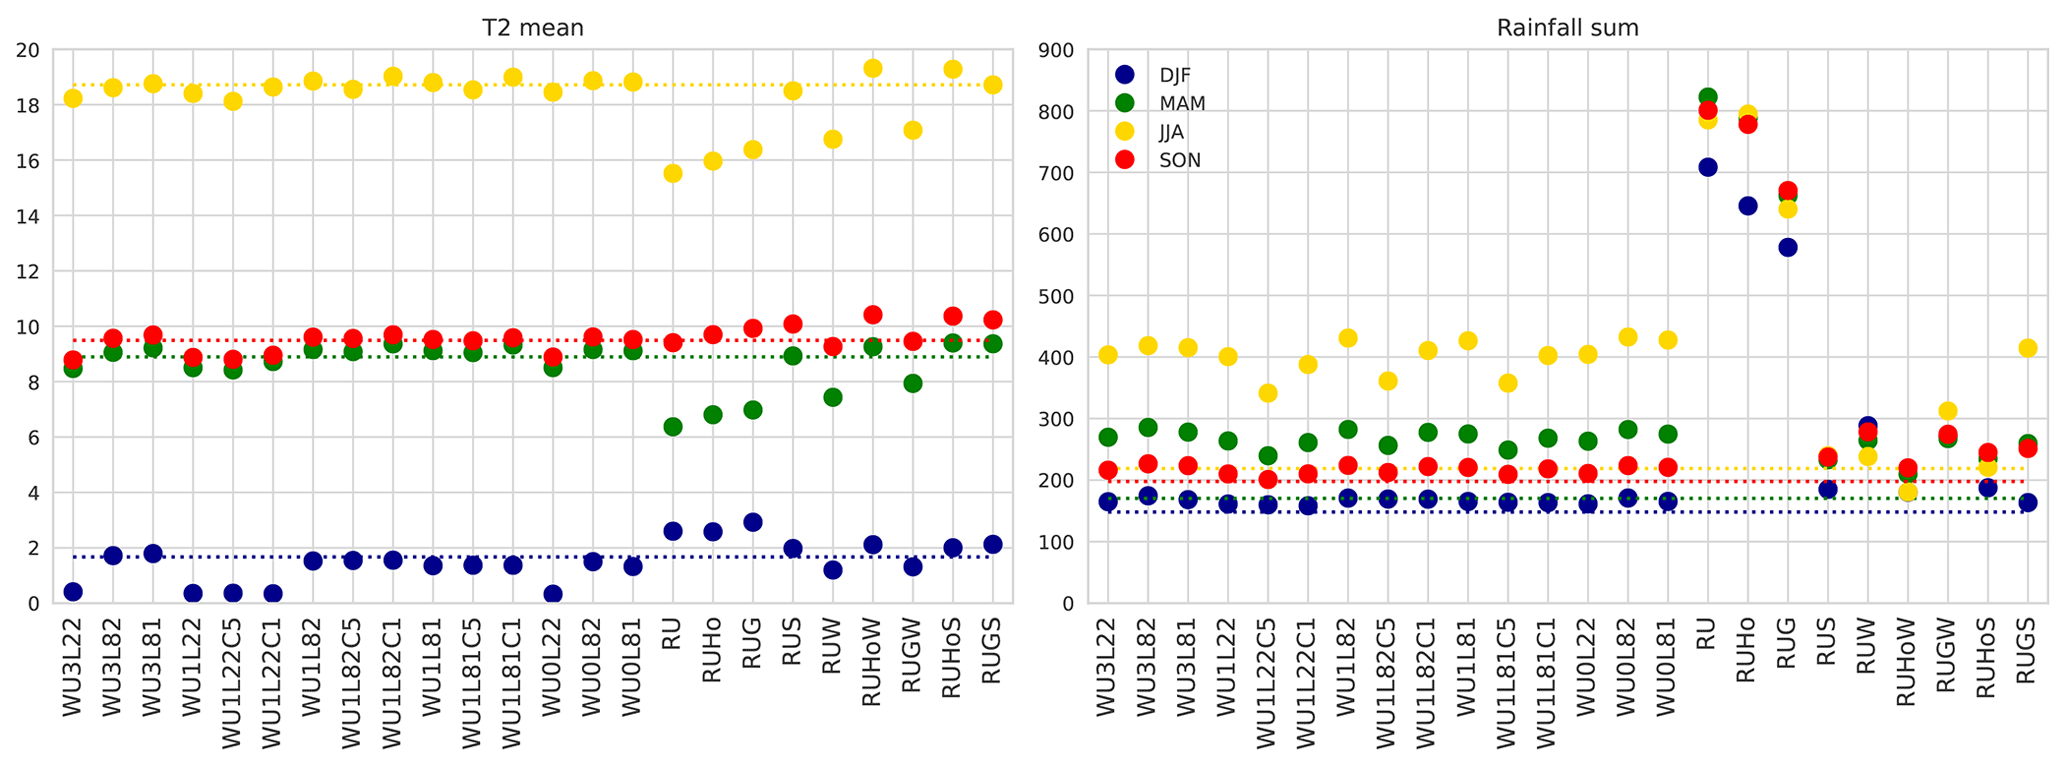
Figure 3Domain-averaged seasonal 2 m air temperatures (∘C) and accumulated precipitation (mm) for individual simulations and E-OBS data (dotted lines).
Daily ECAD values from selected stations are used for more detailed model validation over European urban areas, which are the main focus of the paper. The bias, correlation coefficient and regression coefficient (slope) are computed for all model simulations between ECAD and model time series including values for every day of a specific season and for all stations. The results are presented in Fig. 4 (winter season) and Fig. 5 (summer season).
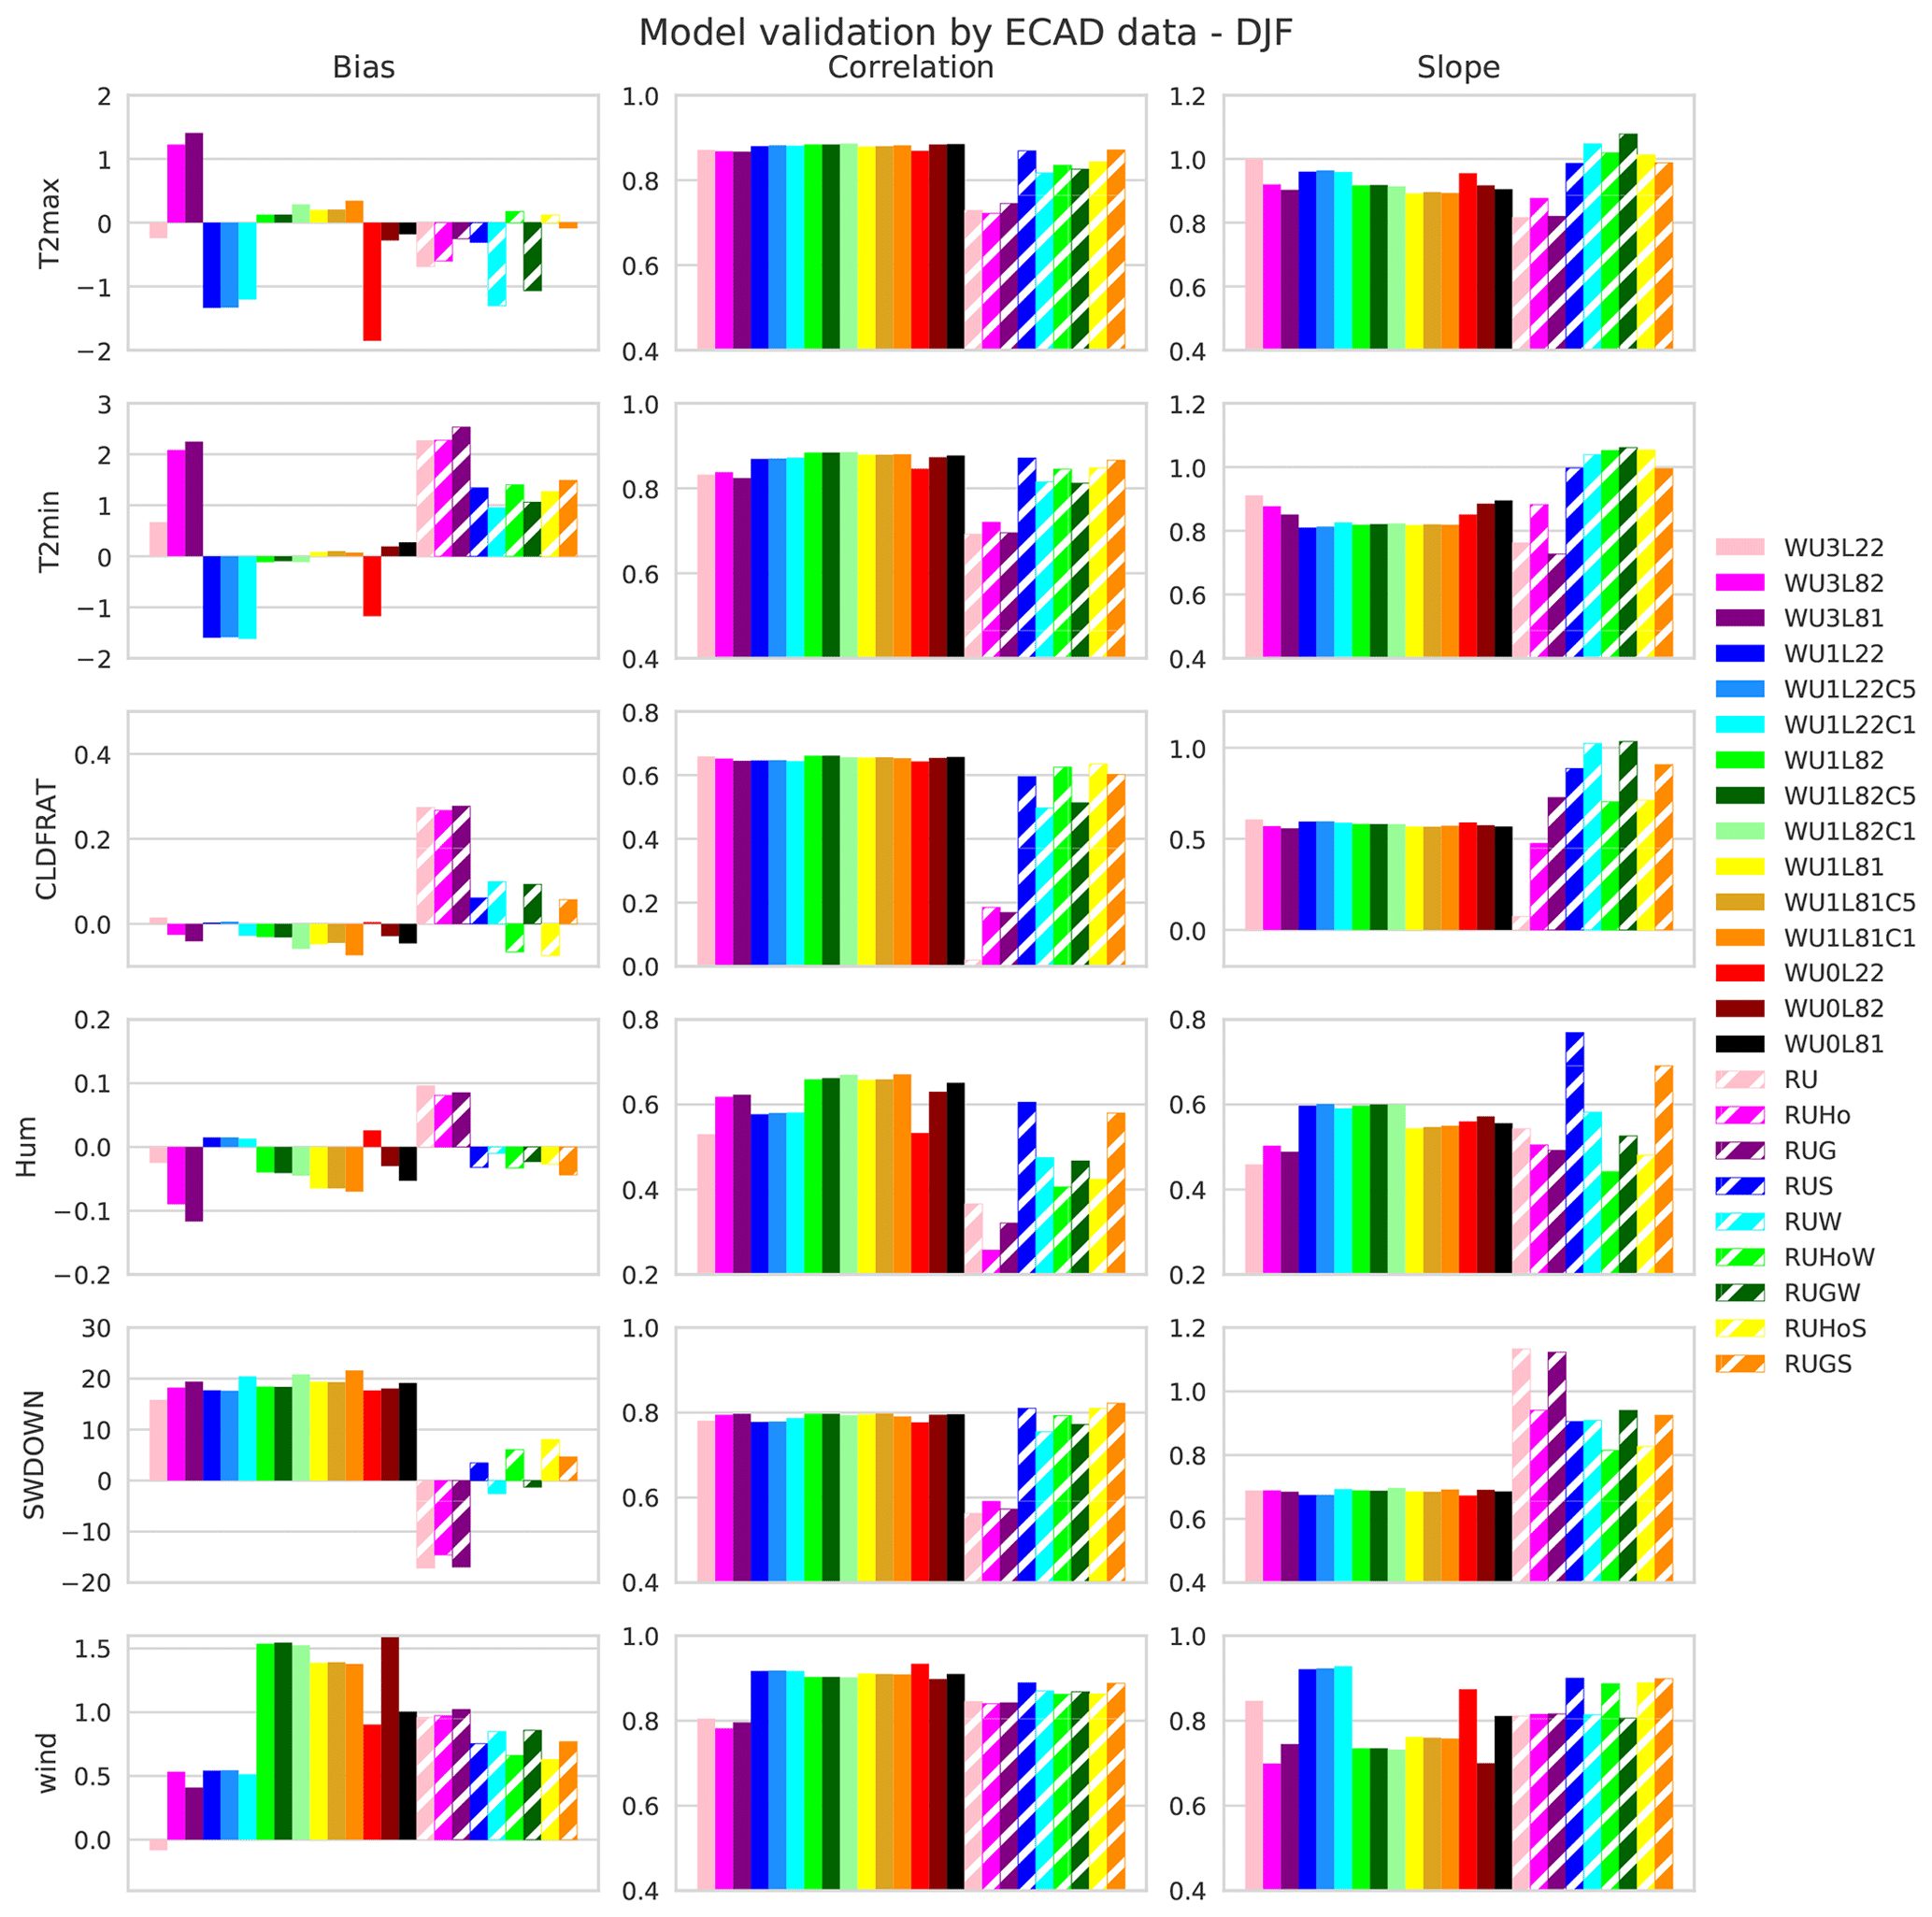
Figure 4Statistical evaluation of individual simulations using ECAD station data for selected variables in the winter season. Units are ∘C (temperature), fractions of 1 (cloud cover and relative humidity), W m−2 (downward shortwave radiation) and m s−1 (wind speed).
Because measuring stations are located mainly in cities (Table 3), the type of urban canopy parameterization impacts the results too. E.g. the BEP+BEM urban canopy model gives temperature extremes clearly higher than SLUCM or bulk and with a bias of up to 2 ∘C. Again, the combination of the MYJ PBL and Eta SFL schemes gives lower temperatures than other combinations, which mostly means a negative temperature bias. The remaining WRF simulations predict temperatures reasonably well. For the RegCM, simulations with the Nogherotto MP scheme exhibit the highest biases in minimum temperatures, as well as in the case of cloud fraction. The biases in humidity and radiation are less than 0.1 and 20 W m−2, respectively. Wind speed is overestimated by models, but the biases vary significantly between specific models and setups; the BEP+BEM urban model and simulations with the MYJ PBL and Eta SFL schemes, as well as all RegCM simulations, exhibit a lower bias. Correlations of temperatures, radiation and wind speed are, in general, around 0.8 or higher. On the other hand, for cloud fraction and humidity, they are only about 0.6. However, RegCM simulations with the Nogherotto MP scheme have a substantially lower correlation (except wind speed).
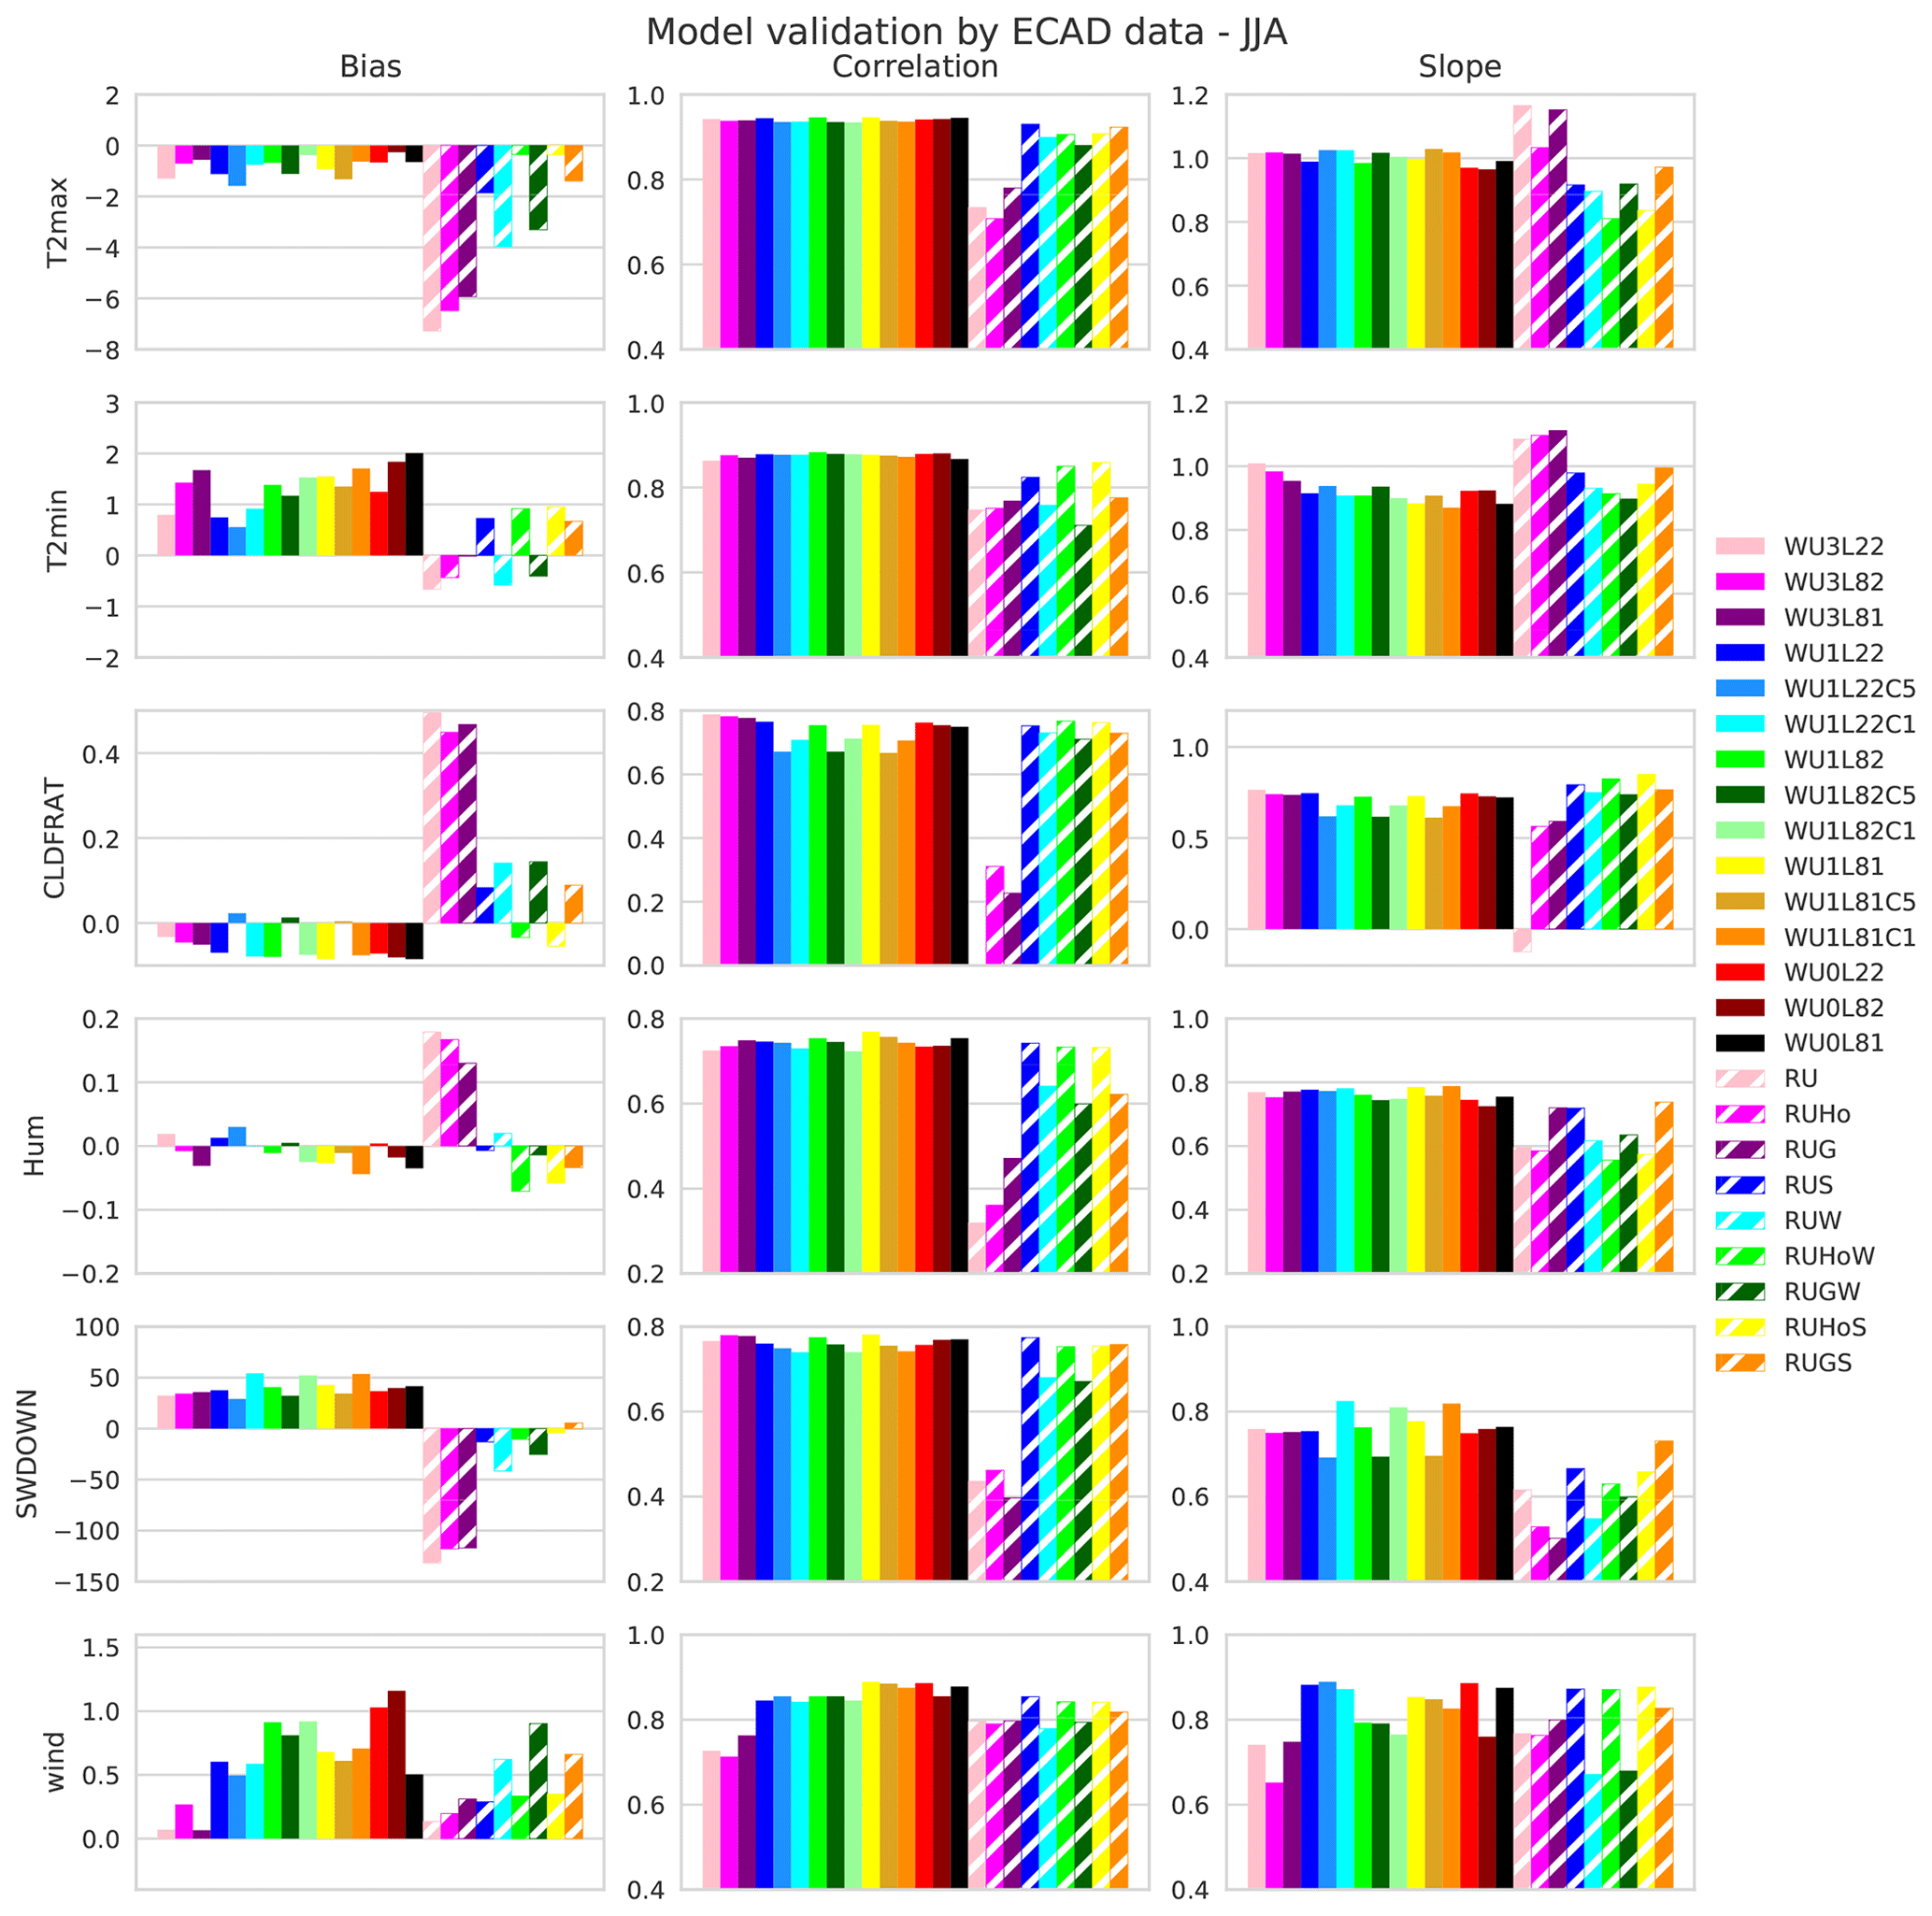
In summer, again, RegCM simulations with the Nogherotto MP scheme are marked with the highest biases and the lowest correlations (with the exception of minimum temperature and wind speed). Further, WRF simulations predict temperatures with biases of less than 2 ∘C, while biases in some other RegCM simulations are up to 4 ∘C in the case of maximum temperature. Biases in cloud fraction and humidity are mostly less than 0.1, and the sign of the cloud fraction bias is clearly linked to the sign of the radiation bias. WRF simulations are characterized by a positive radiation bias of up to 50 W m−2. In the case of the RegCM, a negative radiation bias prevails. As in winter, simpler urban models produce higher wind speeds in cities that result in higher positive biases. Biases in the RegCM for wind speed depend mainly on the choice of PBL scheme. Correlations between model and observed values are of a similar magnitude to those in winter.
Being an important parameter of the urban canopy thermodynamic state, we also compare the modelled surface (skin) temperatures with satellite-based data. With consideration of the fact that satellite-based data are available only at specific times of day, roughly at 02:00 UTC, 12:00 UTC (Aqua satellite), 21:00 UTC and 10:00 UTC (Terra satellite), and the comparison of both daytime and nighttime satellite data with corresponding model values shows very similar features, averaging over both satellites is performed to obtain simple daytime and nighttime satellite data of surface temperature. Seasonal and domain averages of daytime and nighttime data together with the corresponding model simulation results are displayed in Fig. 6. Considering the fact that only clear-sky days are included in satellite-based data, Fig. 6 offers a rough comparison of modelled and observed values. In general, summer surface temperatures are predicted more accurately than winter ones, where model values are significantly higher (by 2–4 ∘C). Analogously to temperature biases against E-OBS (Fig. 3), the highest deviations are detected in RegCM simulations with the Nogherotto MP scheme, mainly in the summer daytime (exceeding 5 ∘C). Again, WRF simulations with the MYJ PBL and Eta SFL schemes give surface temperatures up to 2 ∘C lower than remaining WRF simulations. Modelled and observed surface temperatures are consistent in that daytime spring values are higher than autumn ones, while nighttime spring surface temperatures are lower than autumn ones.
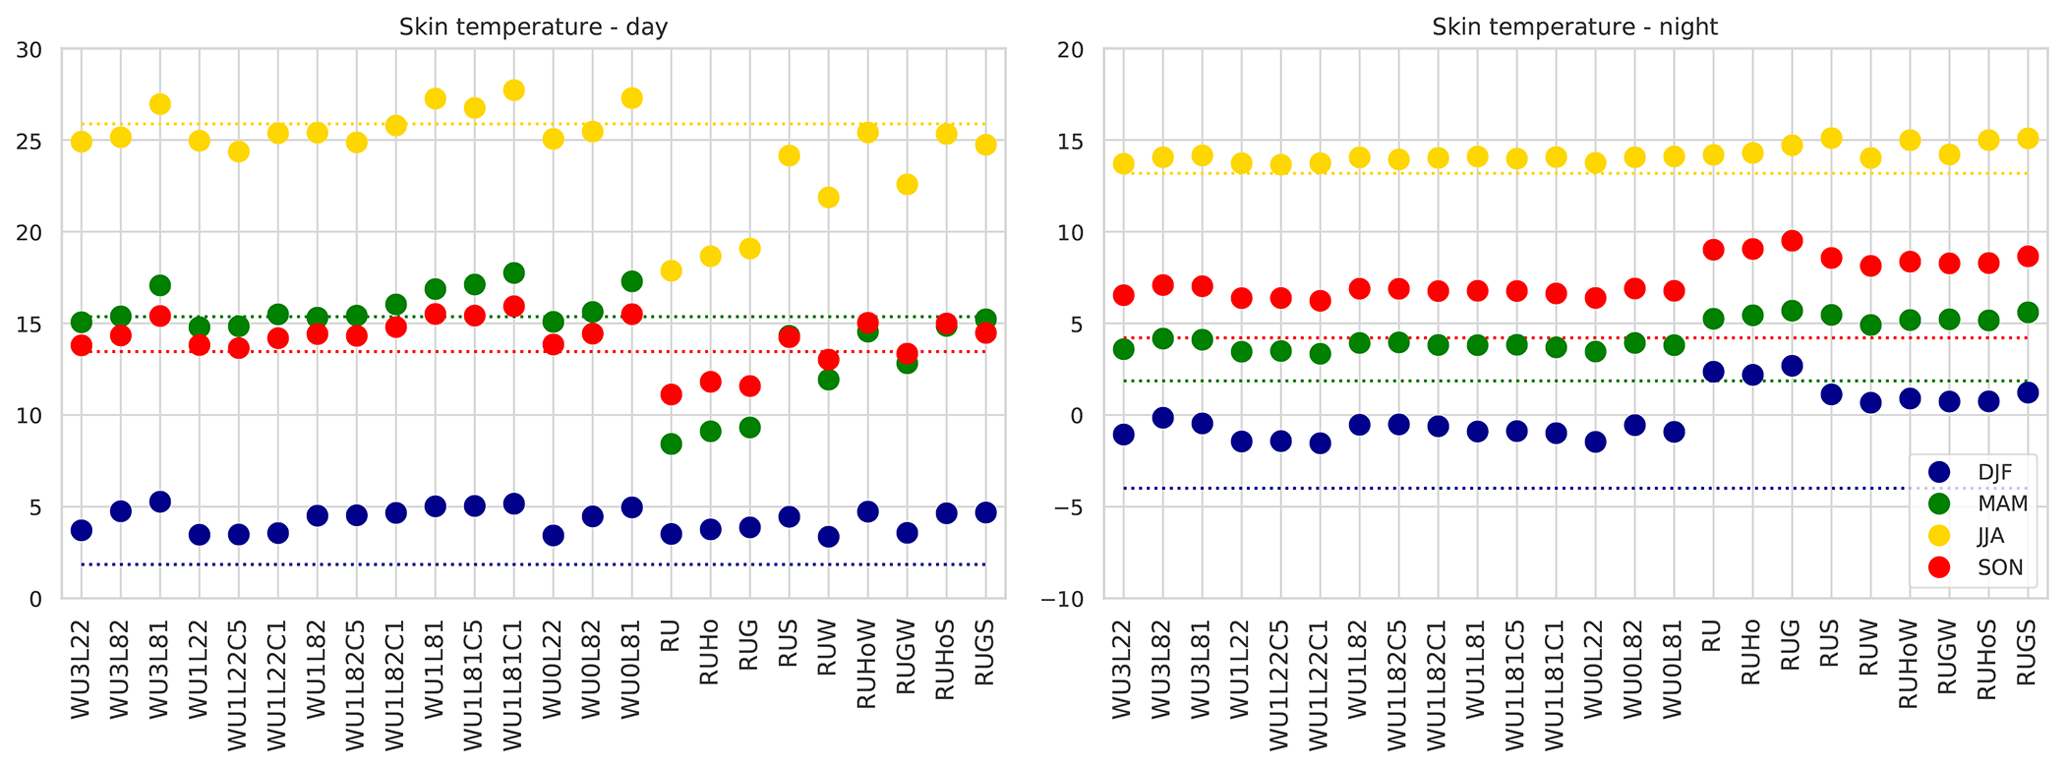
Figure 6Averaged seasonal whole-domain surface temperatures (∘C) in the daytime (includes 10:00 and 12:00 UTC satellite and model data) and nighttime (02:00 and 21:00 UTC) given by specific simulations and satellites (dotted line).
3.2 Components of the urban meteorology island
As the most important component of the UMI, we show here the air temperature alteration over urban areas. Because of many previous studies describing the classical UHI, we show only a multi-model average of hourly temperatures for chosen big cities and adjacent surroundings over the domain for the winter and summer season (Fig. 7). The UHI is clearly visible with a magnitude of about 1 ∘C in winter and 1.5 ∘C in summer, even using a relatively coarse model resolution (9 km).
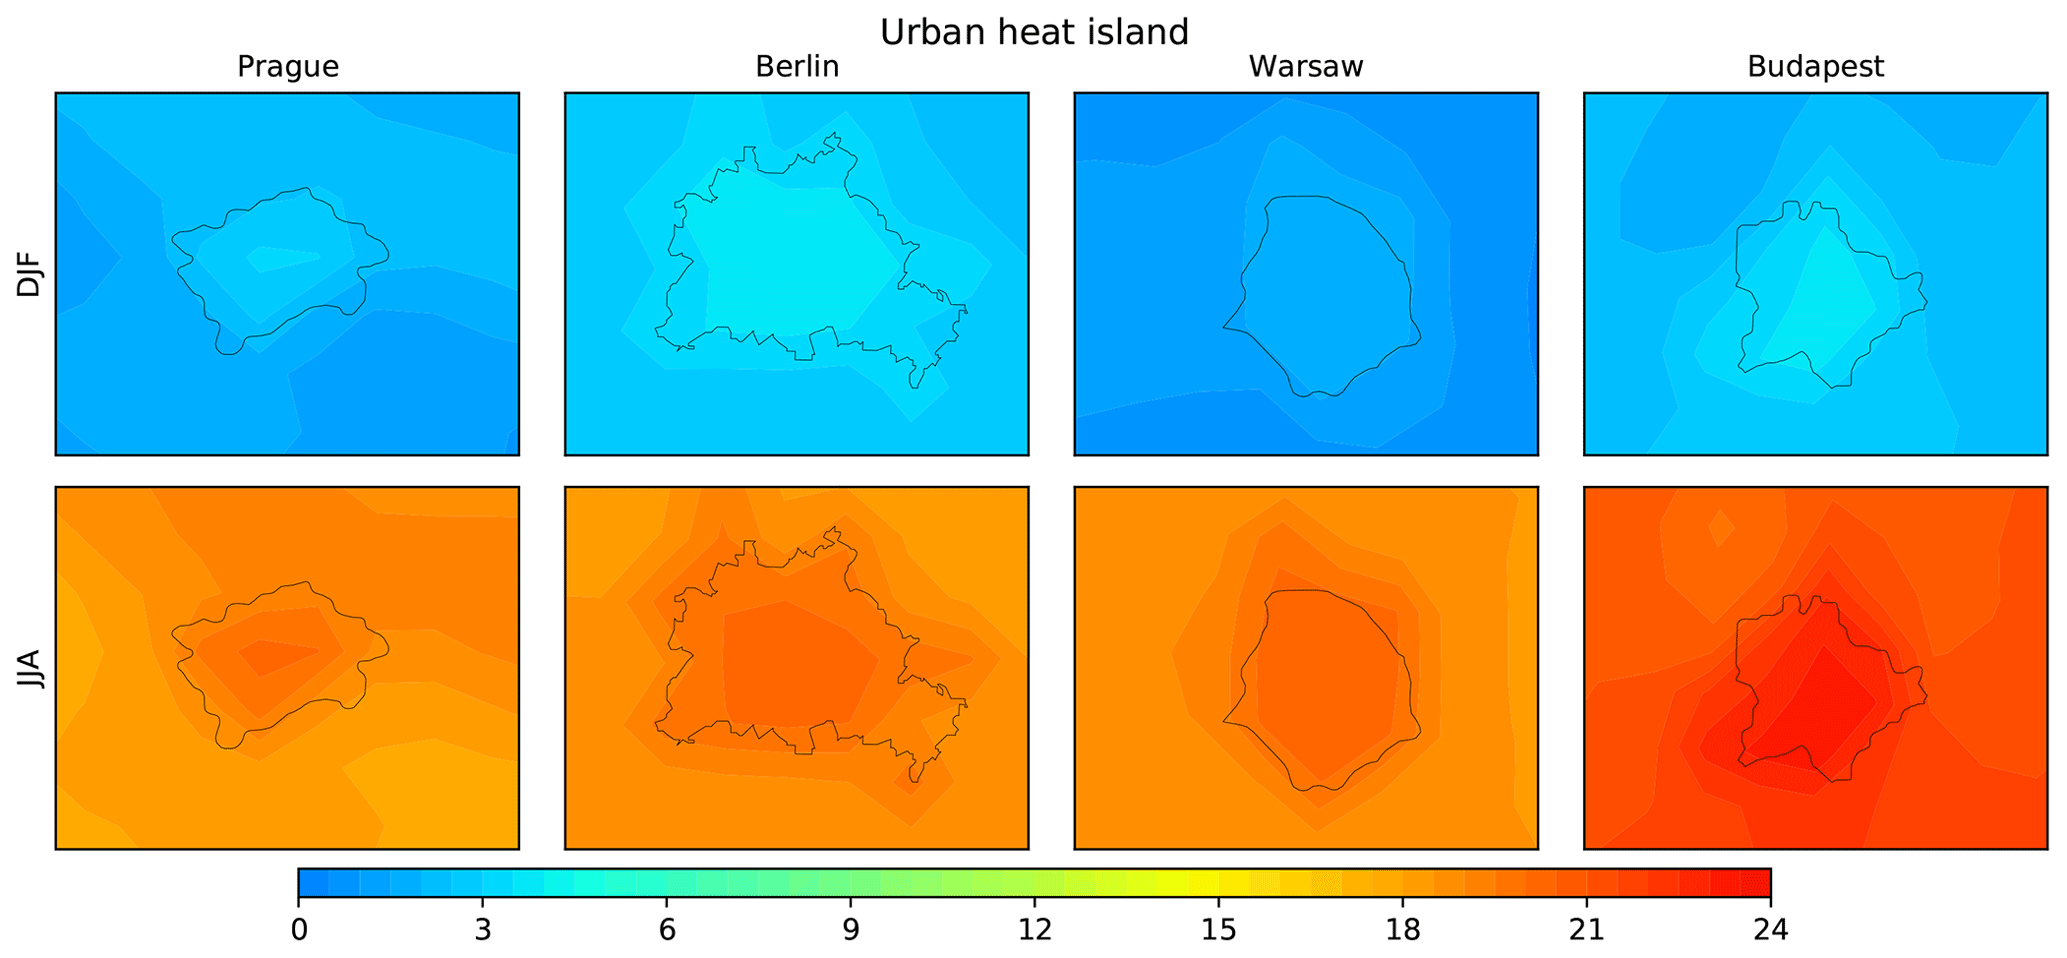
Figure 7Multi-model-averaged winter and summer 2 m air temperatures (∘C) around Prague, Berlin, Warsaw and Budapest.
Similarly, surface (skin) temperature is significantly altered by urban surfaces, which is obvious from satellite-based measurements of surface temperature, during clear-sky conditions. The same procedure as in the previous section was used to determine daytime (Fig. 8) and nighttime (Fig. 9) values. The SUHI is most pronounced in the summer daytime, when urban temperatures are approximately 4 ∘C higher. During the nighttime, the SUHI intensity is slightly smaller, about 3 ∘C. In winter, the SUHI is not as clearly pronounced as in summer and reaches 2 ∘C, except for in Warsaw and Budapest where it is very small.
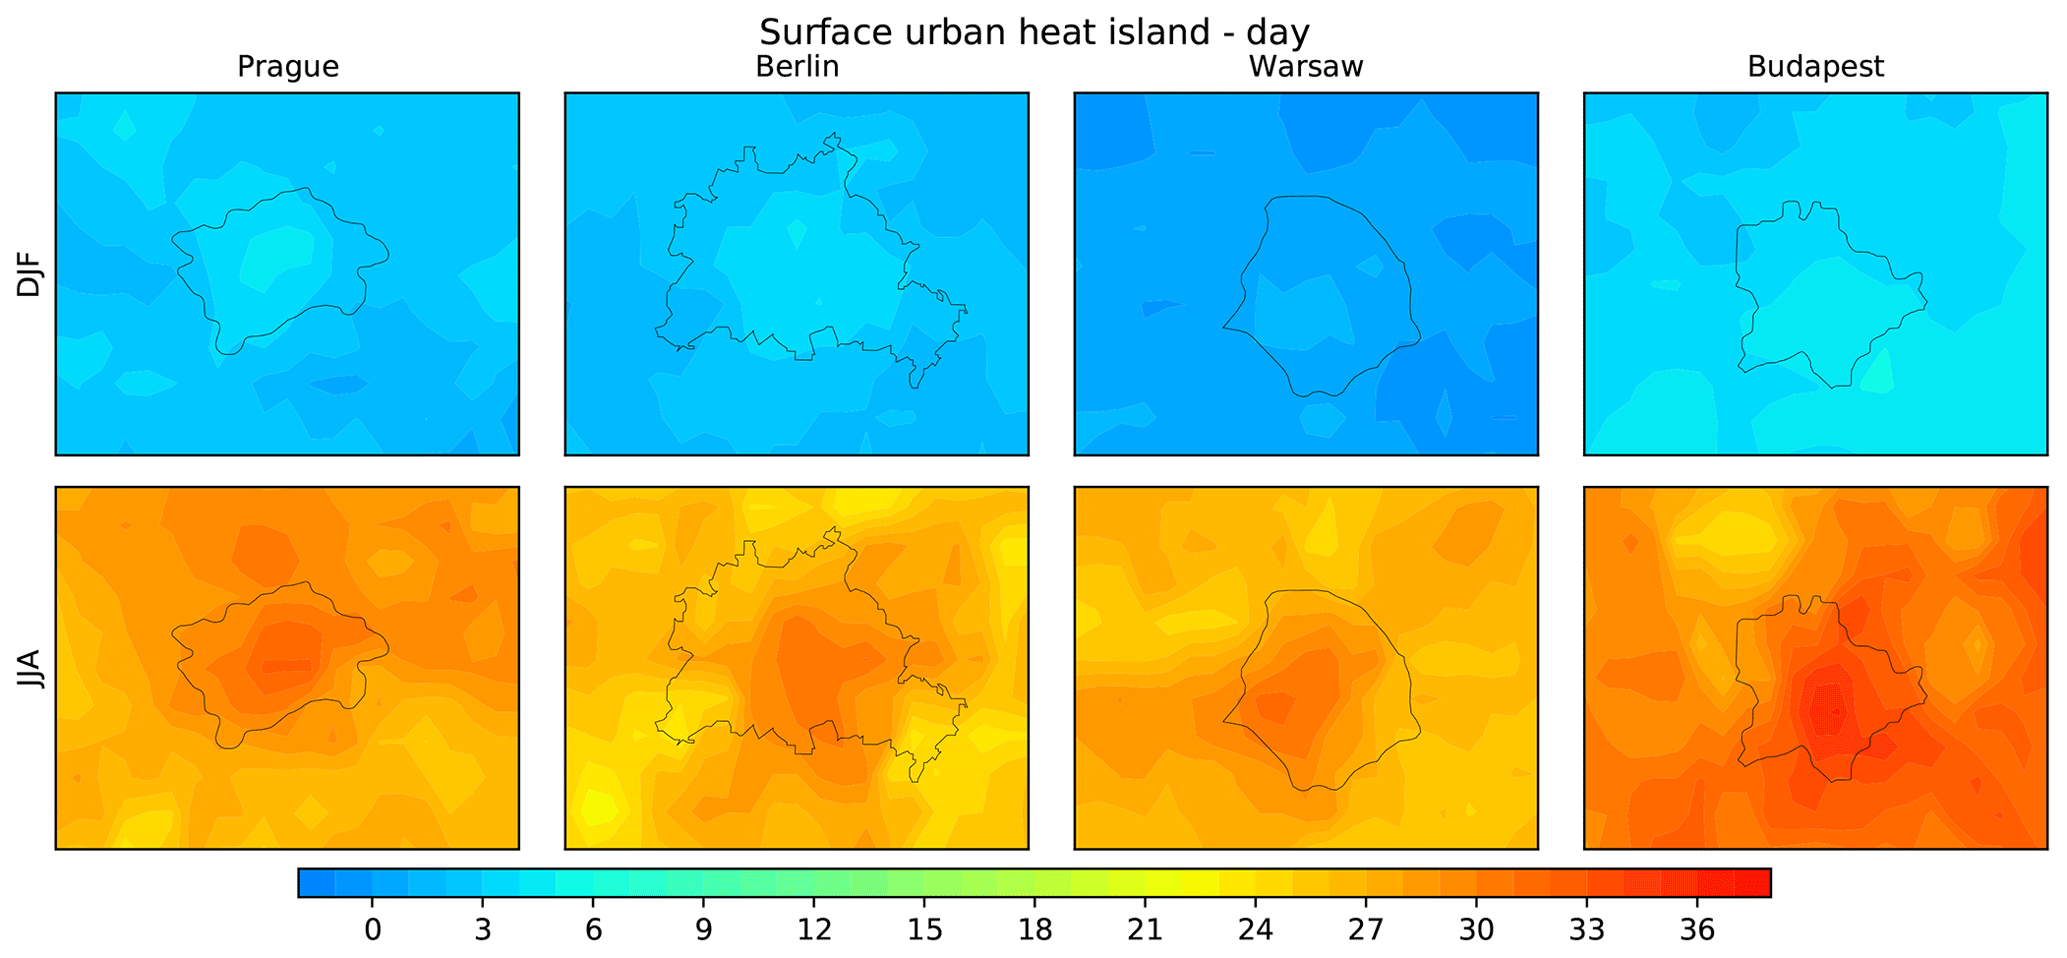
Figure 8Satellite-based daily winter and summer surface temperatures (∘C) around Prague, Berlin, Warsaw and Budapest (includes 10:00 and 12:00 UTC satellite data).
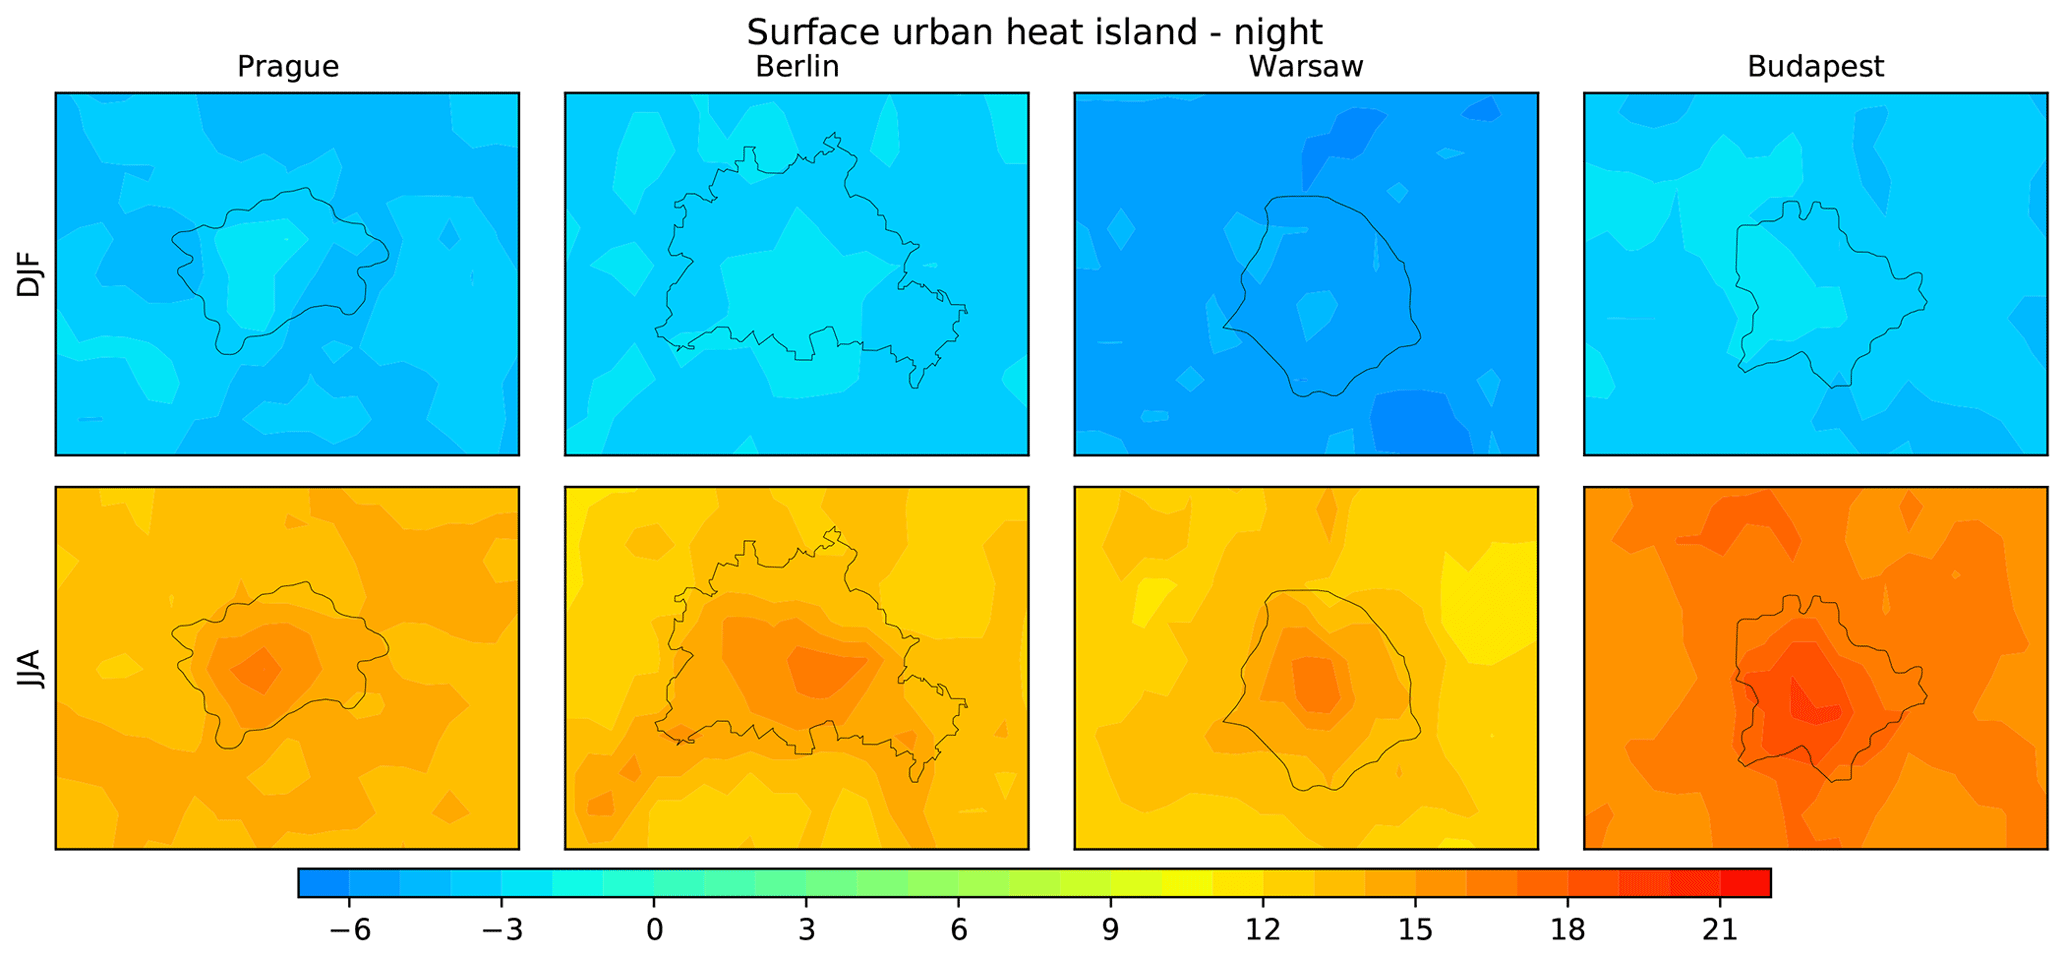
Figure 9Same as in Fig. 8 but for the nighttime (02:00 and 21:00 UTC).
For further investigation of UMI components and to eliminate the effect of specific conditions occurring in different cities, we have chosen 10 large European cities across the whole model domain (Table 4). For every city, we define the city centre together with three points in its surroundings at a distance of 30 km from the centre forming an equilateral triangle with one apex directed to the north. The bilinear interpolation is used to determine model values in the chosen locations. Values from the three surrounding points are averaged to obtain one value for the city centre and one value for the vicinity for each city.
Table 4Positions of city centres and vicinities (vic.) for chosen cities.
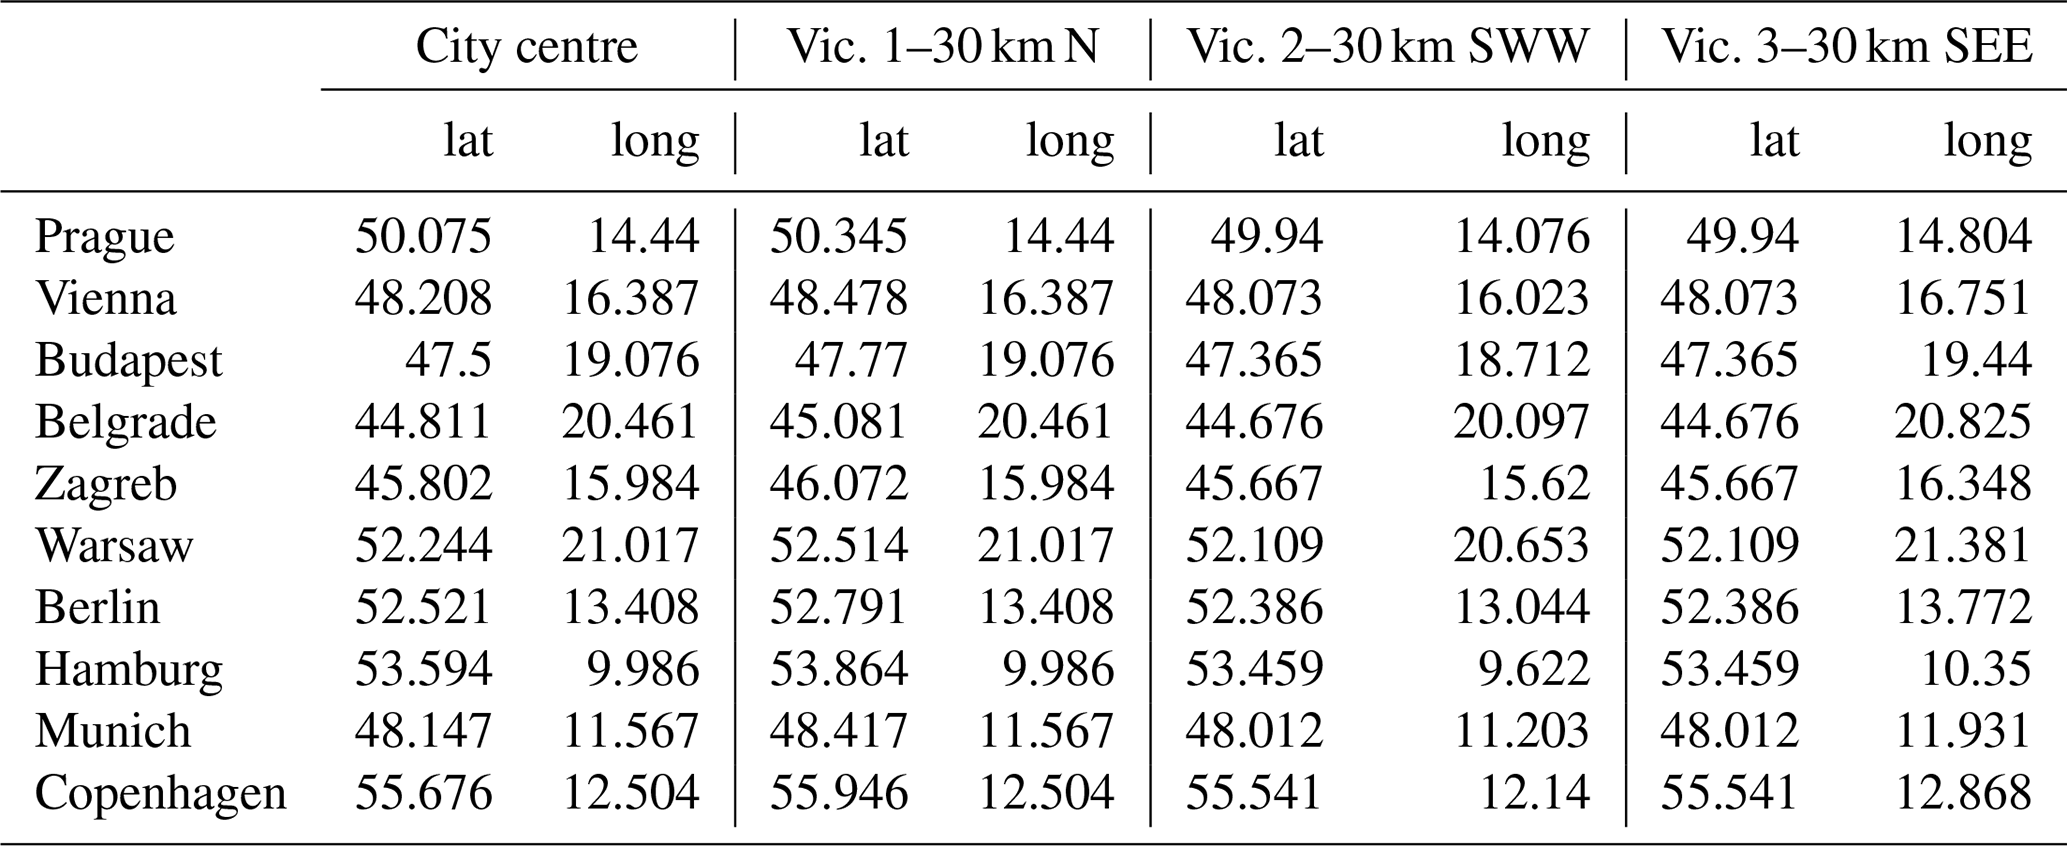
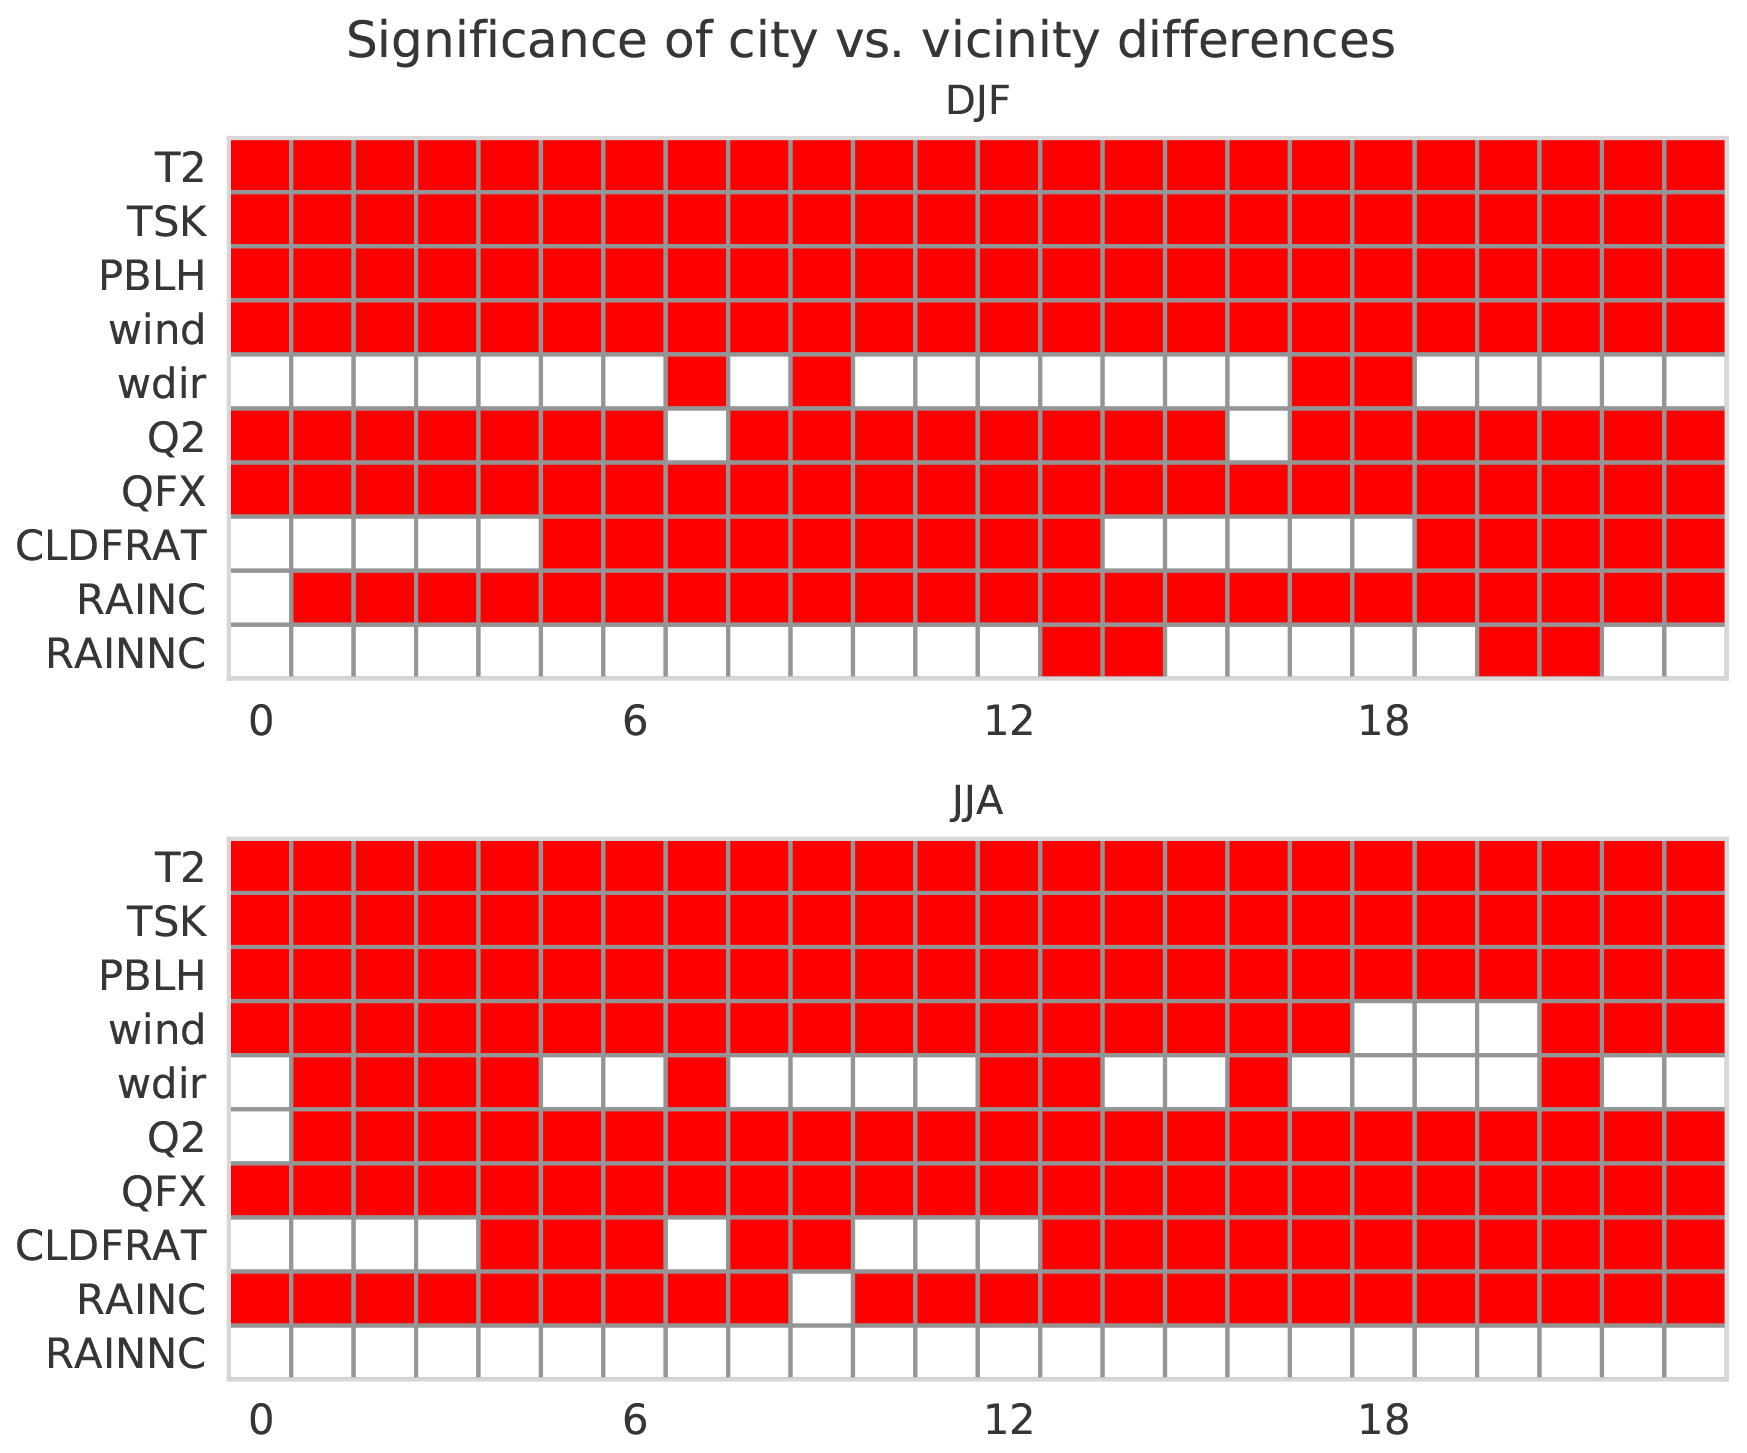
Figure 10Significance of urban meteorology island components during the day. From above: 2 m air temperature (T2), surface temperature (TSK), boundary-layer height (PBLH), wind speed (wind), wind direction (wdir), specific humidity (Q2), upward moisture flux (QFX), cloud cover (CLDFRAT), sub-grid-scale precipitation (RAINC), large-scale (resolved) precipitation (RAINNC). The red colour means statistical significance on the 98 % level.
Firstly, different components of the UMI are investigated in their diurnal cycles for every season. One sample t test on the 98 % significance level was used to determine the statistical significance of the non-zero difference between the city centre and vicinity values averaged over all models and cities, separately for the specific season and hour in the day. The results for the winter and summer seasons are shown in Fig. 10, with the red colour meaning the statistical significance. UMI elements such as air and surface temperature, boundary layer, and moisture flux are always significantly altered by urban surfaces, and with some exceptions the wind speed, specific humidity and sub-grid-scale precipitation are as well. Cloud cover is influenced by cities at specific times of the day, most continuously during summer afternoons and evenings. The significance test did not reveal cross-model significant impact on wind direction and large-scale precipitation.
Alterations of the temperature, wind speed and boundary-layer height in urban areas and their diurnal cycles have been described in detail in many previous studies (e.g. Huszar et al., 2014; Huszár et al., 2018; Karlický et al., 2018; Huszar et al., 2020a, b); therefore other components of the UMI will be discussed in more detail in the following paragraphs. In Fig. 11, differences between urban and rural cloud cover are presented. Statistically significant differences are detected mainly in summer afternoons and during evenings, probably as a result of the enhanced convection, as the sub-grid-scale precipitation is also increased in cities during this time (Fig. 12). In winter, a small but significant reduction in cloud cover is detected in models from morning to noon and during the night.

Fig. 12 shows the alterations of sub-grid-scale precipitation. The most distinct feature is the summer afternoon and evening increase, above 5 mm per season during some hours. However, a significant increase in sub-grid-scale precipitation is detected in nearly the whole winter and summer diurnal cycle but with a much smaller magnitude: up to 1 mm in the remaining summer hours and up to 0.3 mm in the winter diurnal cycle.

Figure 12Diurnal cycle of city–vicinity differences for sub-grid-scale precipitation (in mm, differences between seasonal sums).
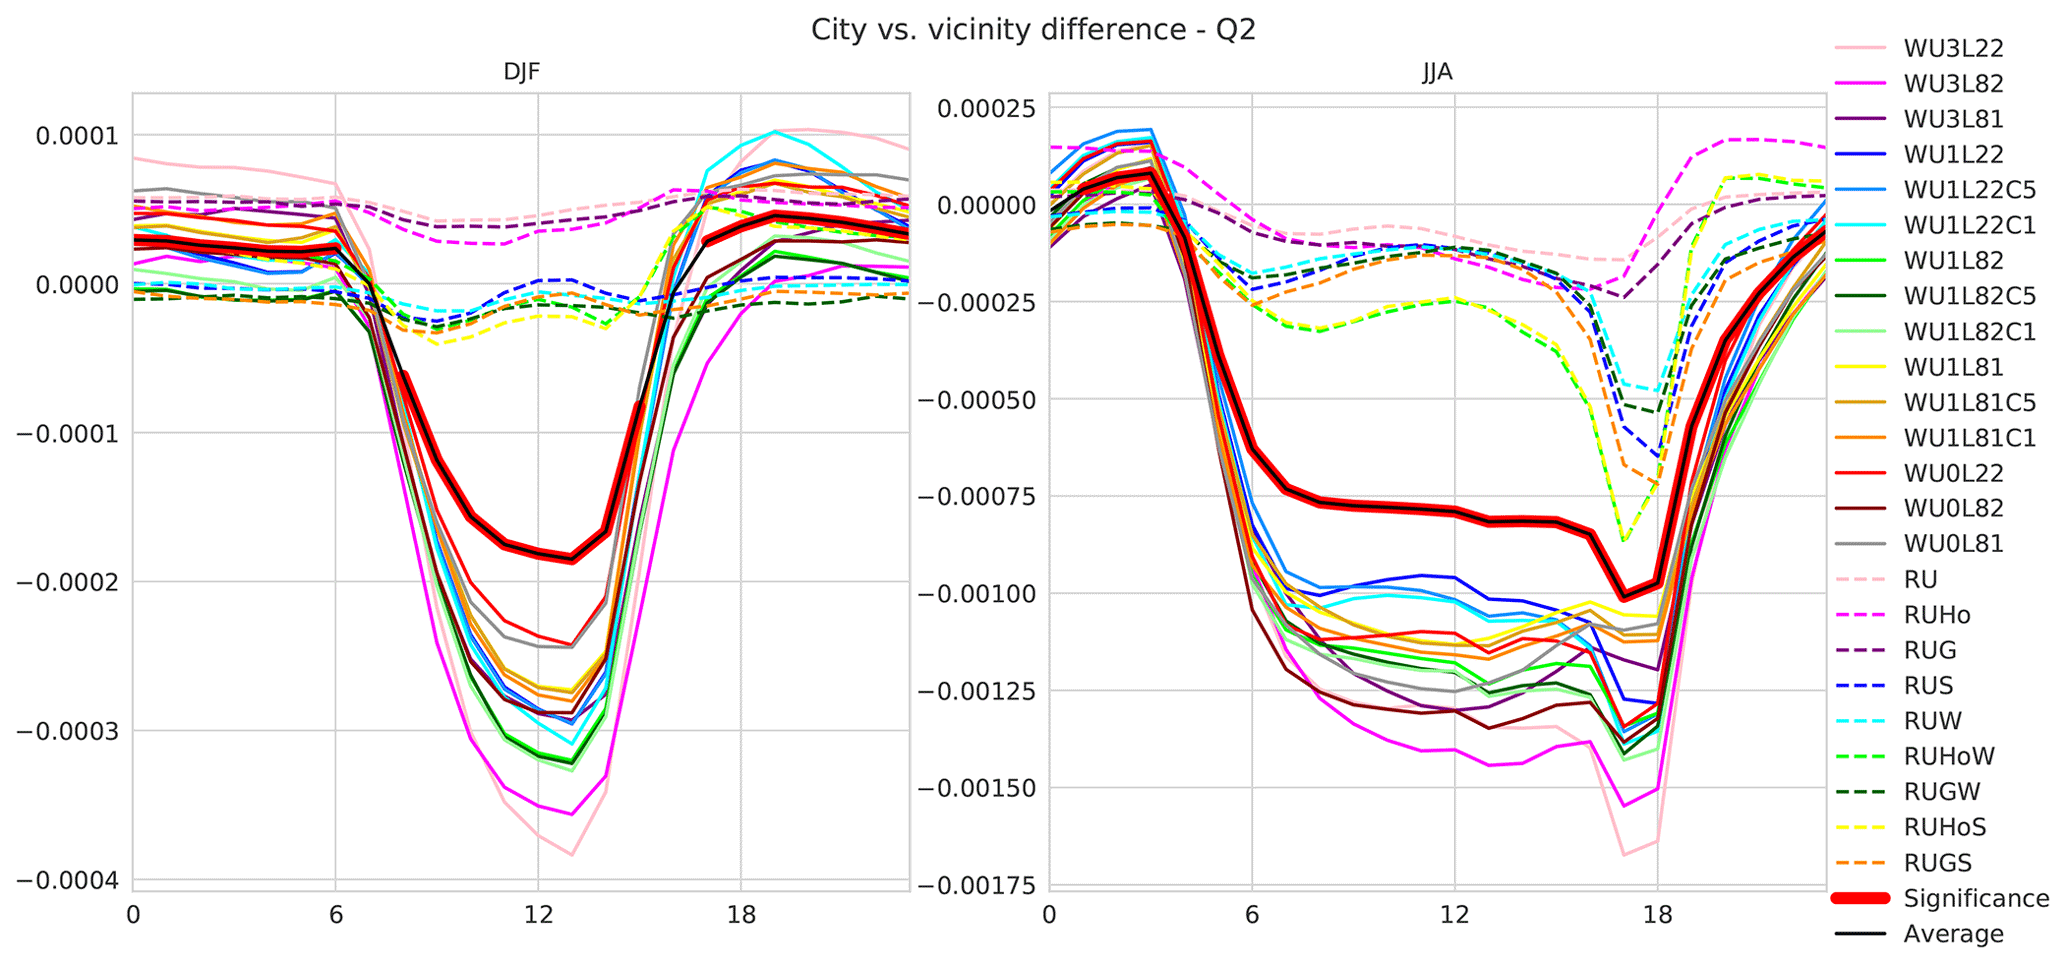
In terms of specific humidity, a statistically significant urban decrease prevails during the summer and winter daytime (Fig. 13). The magnitude in summer (up to 1 × 10⁻³ kg kg−1) is more pronounced compared to winter (up to 0.2 × 10⁻³ kg kg−1). During the nighttime, slight humidity increases are detected (up to 0.1 × 10⁻³ kg kg−1).
3.3 Impact of models and their parameterizations
Here we focus on the analysis of how different parameterization influences the resulting UMI component. Figure 14 shows a spread of city–vicinity differences for different components of UMI, separately for every model simulation. In general, differences between WRF and RegCM results are large. In case of city–vicinity differences in seasonal daily temperature: in WRF simulations they are about 2 ∘C in summer and about 1–1.5 ∘C in winter, while simulations with the BEP+BEM urban parameterization make the difference even larger, up to 3 ∘C. On the other hand, in RegCM simulations, differences are much lower – about 1 ∘C only. Similarly, in terms of specific humidity, city–vicinity differences in summer are also more pronounced in WRF simulations (0.6–1.0 × 10⁻³ kg kg−1), while the RegCM gives differences of up to 0.3 × 10⁻³ kg kg−1. In winter, the urban specific humidity reduction reaches 0.1 × 10⁻³ kg kg−1.
Also the enhancement of the PBL height in urban centres is greater in summer than in winter. In this season, the positive change is mainly between 200 and 300 m, but in terms of the RegCM, only the simulations with the Holtslag PBL scheme without the Nogherotto MP scheme reach such values. In winter, the difference is smaller: over cities, the PBL is about 100 m higher than over vicinities, and only the BEP+BEP urban model makes this difference higher. In terms of wind speed, the highest urban reductions are detected (independently of season) in WRF simulations with the BEP+BEP urban scheme. Simulations with the SLUCM urban scheme give the smallest reduction, but it also depends on the PBL parameterization. The combination of MYJ PBL and Eta SFL schemes makes the wind speed reduction about 1 m s−1; the combination of BouLac and Eta schemes produces the reduction of about 0.5 m s−1, and the combination of BouLac and MM5 schemes even results in a slight wind speed increase. In terms of WRF simulations with the bulk urban parameterization, the wind speed also depends on PBL and SFL schemes: in winter a reduction occurs, but in summer the increase dominates. RegCM simulations exhibit urban wind speed reductions of up to 1 m s−1, and they are higher in winter than in summer.
The impact of cities on cloud cover in summer is mostly positive, with a high dependency on model simulation. In winter, a cloud cover reduction dominates. In terms of sub-grid-scale precipitation, WRF simulations produce a significant summer increase in cities (mostly of between 50 and 100 mm), but the winter urban modifications are negligible. In most RegCM simulations, the precipitation increase is much smaller in comparison to WRF simulations.
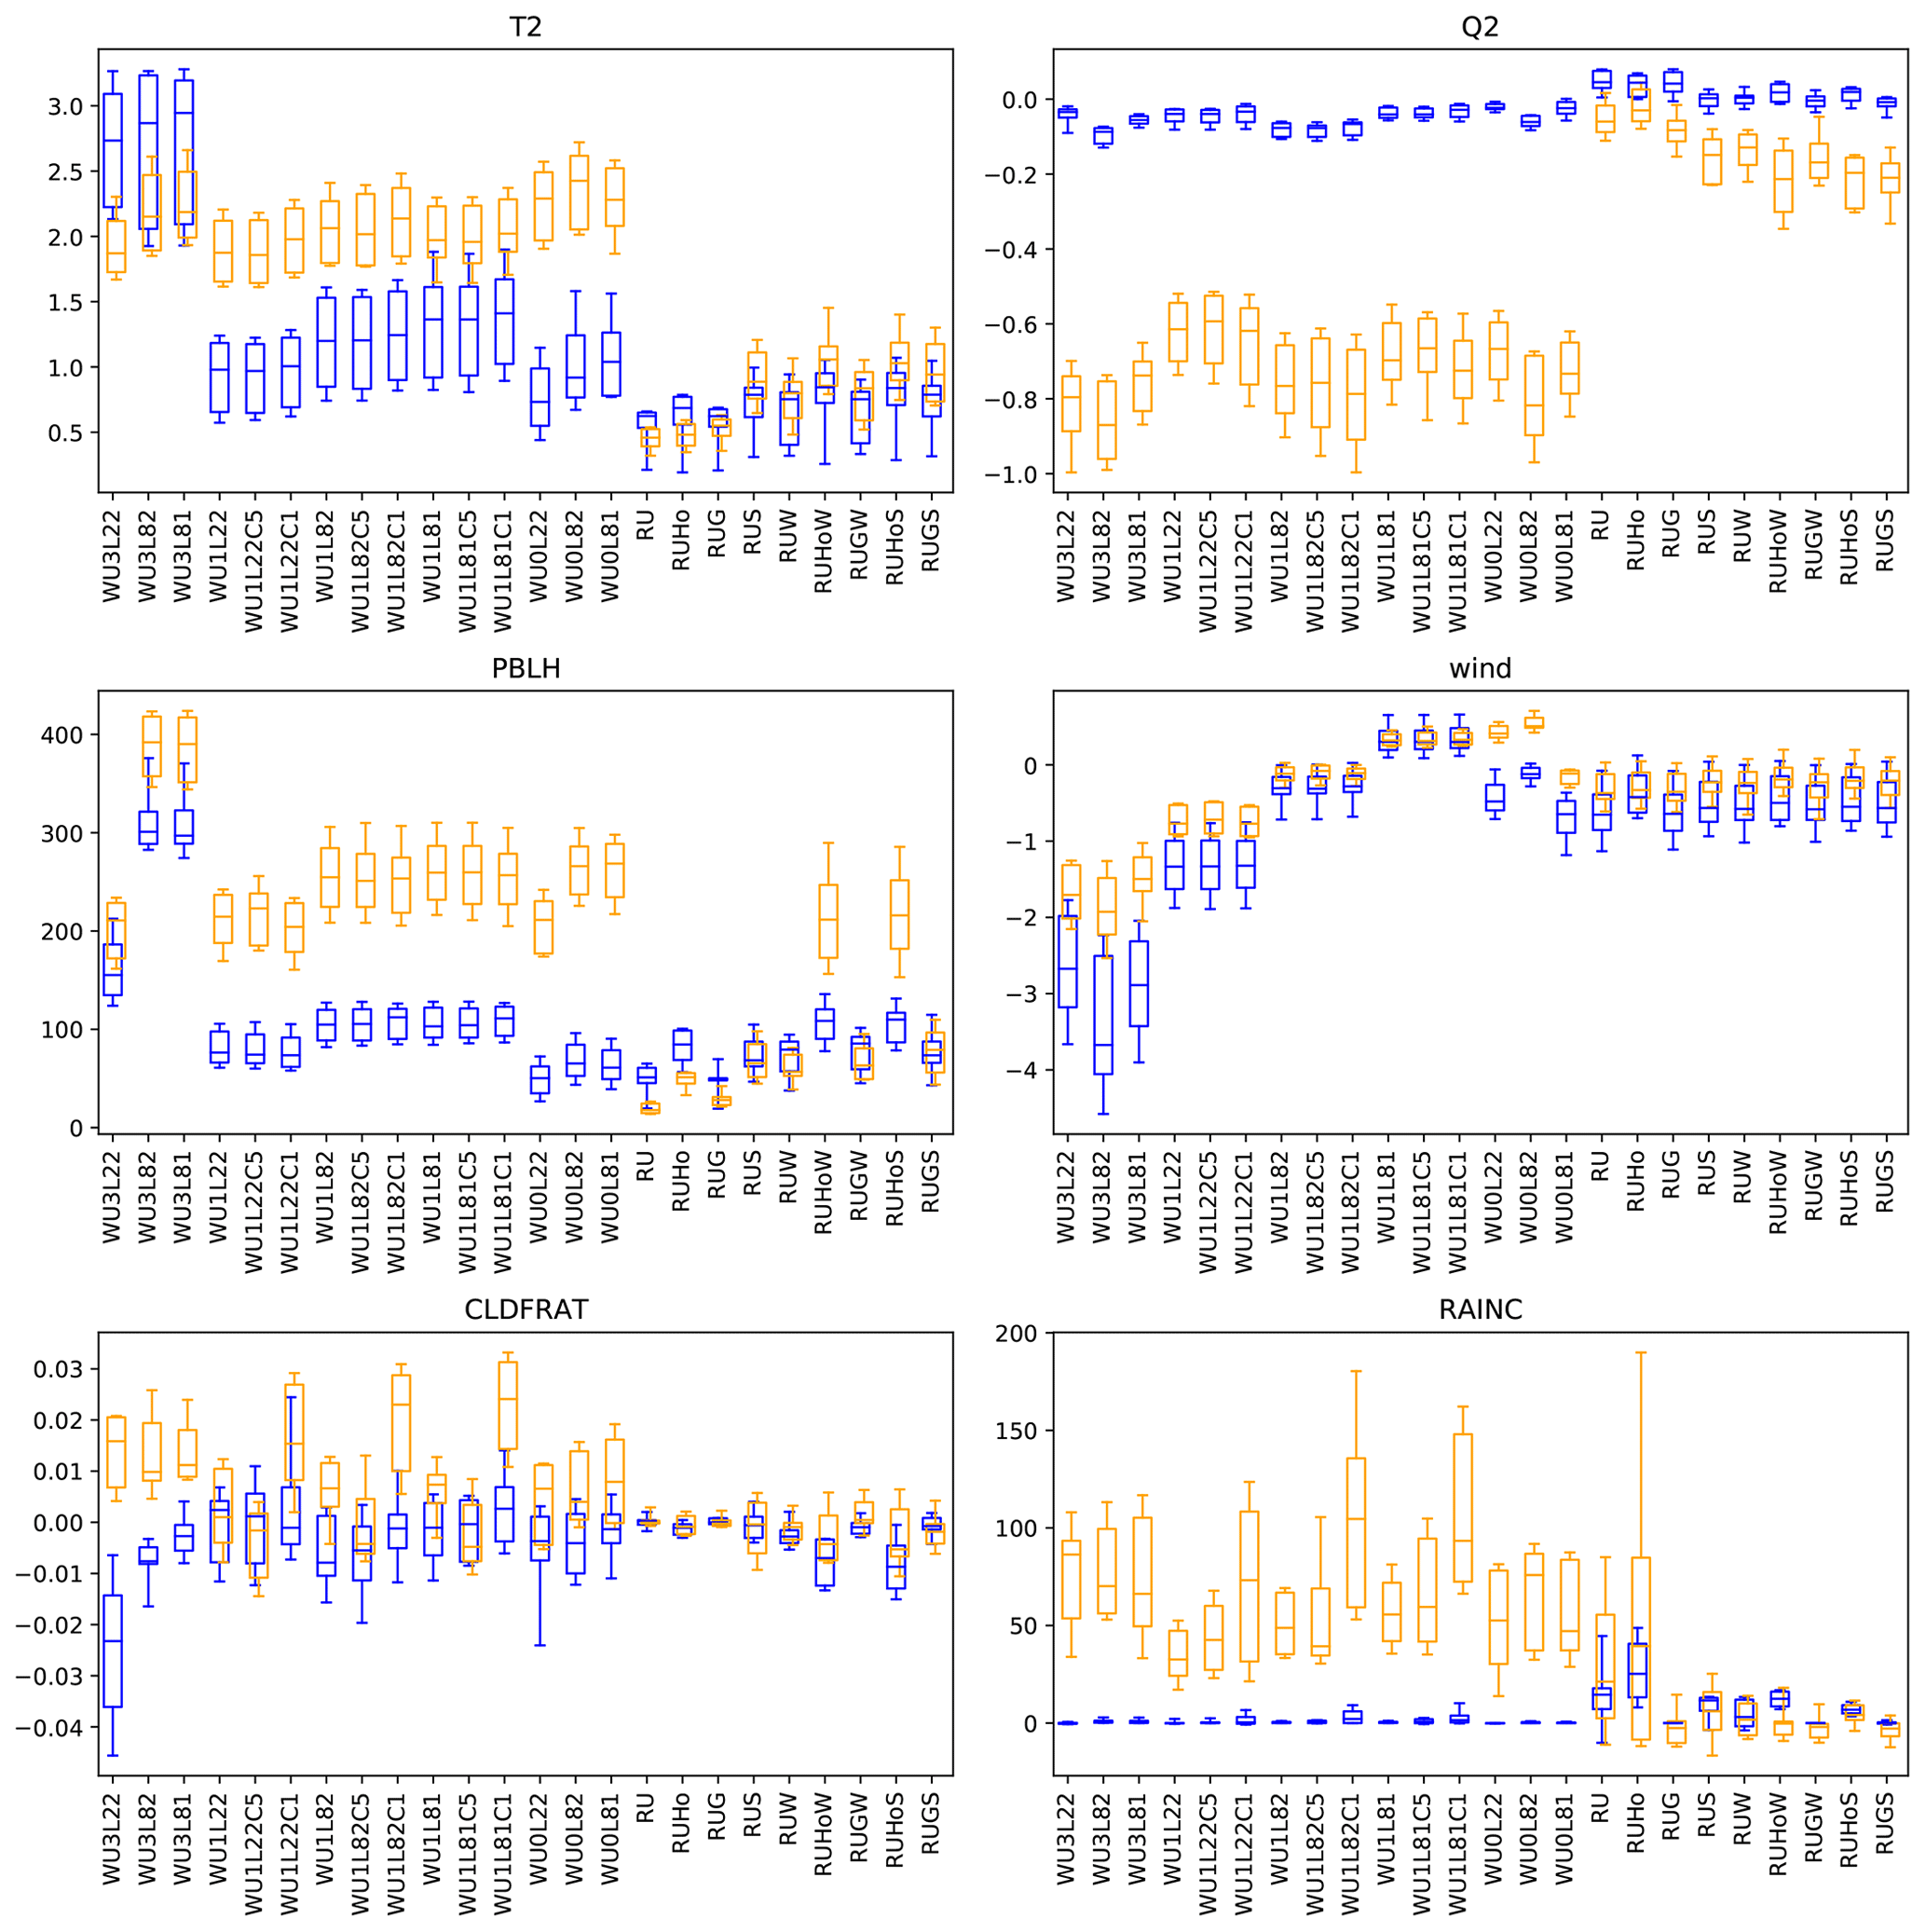
Figure 14Winter (blue) and summer (orange) differences between city and vicinity values of 2 m air temperature (T2; in ∘C), specific humidity (Q2; 10−3 kg kg−1), boundary-layer height (PBLH; m), wind speed (wind; m s−1), cloud cover (CLDFRAT; fractions of 1) and sub-grid-scale precipitation (RAINC; mm in seasonal sums). Whiskers indicate 5th and 95th percentiles.
The temperature underestimation of WRF simulations with the MYJ PBL and Eta SFL schemes (Fig. 3) in the winter season is similar to that detected by Karlický et al. (2018); summer temperatures are probably influenced by the Tiedtke convection scheme (Tiedtke, 1989), which is not tested in this study but makes a smaller summer overestimation of precipitation, related to higher summer temperatures. Zhong et al. (2017), who used the MYJ scheme of PBL in their study, also show a slight temperature underestimation. The BouLac PBL scheme seems to give more accurate temperature means and extremes. In terms of RegCM simulations, great temperature biases in simulations with the Nogherotto MP scheme imply a great overprediction of cloud cover, specific humidity and underestimation of downward shortwave radiation both in winter (Fig. 4) and summer (Fig. 5). This also leads to great precipitation biases and a slight temperature overprediction in winter. The remaining RegCM simulations show smaller temperature biases in summer, even less than those of Huszár et al. (2018), who used a very similar model setup. Huszar et al. (2020b) used the model configuration corresponding to RU simulation (i.e. the Nogherotto MP, Tiedtke convection and UW PBL schemes), but it gives, in 9 km resolution, smaller biases: summer underestimation and winter overestimation of temperatures in the range of 1–2 ∘C and precipitation overprediction by approximately 100 mm.
Focusing on cities, differences caused by distinct urban schemes appear. Winter positive biases in temperature in BEP+BEM simulations are well in line with our previous study (Karlický et al., 2018). Huang et al. (2019) also described lower wind speeds and thereby a more reduced bias in simulations with BEP+BEM in comparison to SLUCM. On the contrary, the correlation of model and observed data of wind speed with values of the coefficient between 0.25 and 0.35 is substantially worse than in this study. In terms of temperatures, correlations are comparable.
Validation of model surface temperatures using MODIS satellite data (Fig. 6) results in similar features to the air temperature validation (Fig. 3), keeping in mind that MODIS monthly means are calculated only from days with clear-sky conditions. RegCM simulations with the Nogherotto MP scheme, by overestimating cloud cover during all seasons, show large negative biases (mainly in the summer daytime). During the nighttime, the positive cloud cover bias leads to a temperature increase, mainly in winter. A general agreement of model surface temperatures with values derived from MODIS is also shown by Zhong et al. (2017) in annual averages.
Despite significant differences between specific simulations in terms of the UHI magnitude (Fig. 14), a multi-model-averaged UHI is still clearly visible around the selected big cities (Fig. 7). It is important to note that no adjustment on the same altitude was made, so the results can be influenced partly by orography, which concerns mainly Prague and Budapest, due to the relatively complicated terrain within those cities and their surroundings. The UHI magnitudes of about 1 ∘C in winter and 1.5 ∘C in summer are in general agreement with Trusilova et al. (2016), who analysed the observation-based UHI for Berlin. However, the results depend on the location of stations: the urban site Alexanderplatz corresponds well with the modelled summer UHI, but semi-urban sites Tempelhof and Tegel make the UHI less intensive. Langendijk et al. (2019), presenting results of a wide model ensemble, give the annual UHI intensity for Berlin in 2015 of almost 2 ∘C. Our previous study (Karlický et al., 2018), presenting observation-based data as well as model results, gives smaller UHI intensities in Prague around 0.5 to 1 ∘C.
The satellite-based observations of surface temperature (Figs. 8 and 9) confirm the fact that the surface temperatures are significantly affected by urban surfaces too (Fig. 10). The intensities of the SUHI around Budapest (Figs. 8 and 9) are less than those given by Göndöcs et al. (2017), who also investigated the daytime and nocturnal SUHI by MODIS around this city and found, for the city centre and a 1-week period in summer, intensities of 6 and 4 ∘C for the daytime and nighttime, respectively. Zhong et al. (2017), who presented an annual mean of surface temperatures taken from MODIS for the Yangtze River Delta region of China, give the intensity of the SUHI of above 2 ∘C, which is comparable to our results if we consider daytime and nocturnal values in winter and summer. Satellites sampled the surface temperature only during clear-sky conditions, which means that the SUHI deduced from these measurements is somewhat stronger than the average for the whole season, given the fact that the SUHI is more pronounced during sunny days with higher solar input.
The significance of urban-induced alterations of urban canopy air temperature, surface temperature and PBL height has been well documented in many previous simulation and observation-based studies (e.g. Huszar et al., 2014; Trusilova et al., 2016; Göndöcs et al., 2017; Karlický et al., 2018; Huszár et al., 2018; Huszar et al., 2018, 2020a, b). The moisture flux decrease in cities is also a well-known phenomenon as already shown by Oke (1987) or more recently by Theeuwes et al. (2019) from latent-heat-flux comparison. In terms of wind speed changes in urban areas, no statistically significant differences occur during summer evening hours, when the cross-model average is nearly zero. This is probably caused by the combination of the UHI, enhanced turbulence, convection and mixing in a deeper urban boundary layer, as described by Droste et al. (2018), who concluded that under special conditions and during certain daytime periods, the urban wind speed can be even higher.
The impact of cities on the cloud fraction (Fig. 11) is also well documented by Theeuwes et al. (2019), who investigated cloud cover and its differences in Paris and London and their surroundings during the warm season. They also found a cloud cover urban increase during the afternoon and evening, despite a drier atmosphere above cities that leads to a cloud base located higher by approximately 250 m. Higher temperatures in cities probably result in the partial dissolution of non-precipitation stratiform clouds and fog in winter, with a statistically significant cloud cover reduction during morning hours, because urban precipitation is not reduced (but rather increased, Fig. 12). The reduction in low-level clouds and fog was also found by Yan et al. (2020). In summer, higher temperatures lead to enhanced convection and the more frequent occurrence of convective clouds, which leads to an increase in sub-grid-scale precipitation.
The summer afternoon and evening sub-grid-scale precipitation enhancement in cities is also documented by Manola et al. (2020), who analysed observed precipitation features in Amsterdam and its surroundings. Differences occur in the summer morning, when they found an increase of the same magnitude as in the afternoon. Secondly, they found that the impact of cities on precipitation is higher in winter in relative numbers, which contrasts our results (except one RegCM experiment). This can be partly explained by the choice of cities for investigation (Table 4), which are located in central Europe with a greater distance to oceans and, thus, a less maritime climate compared to Amsterdam. Zhu et al. (2019), who analysed the impact of urban areas on precipitation in the Beijing area, also found the impact to be positive but only in the time range of 10–21 h, which is close to our results.
In terms of the impact of cities on specific humidity, Langendijk et al. (2019) give for the annual difference between Berlin and its surroundings about 0.7 × 10⁻³ kg kg−1, which corresponds to our summer values (Fig. 13) and particularly to WRF simulations (Fig. 14). Winter differences are much smaller, even in WRF simulations. During the nighttime, a slight humidity increase is visible (Fig. 13), probably caused by a reduced occurrence of dew in cities connected to smaller humidity losses by condensation on surfaces, given that latent heat in cities is still positive during nights, in contrast to surrounding areas (Theeuwes et al., 2019). The daytime urban humidity decrease can be explained by less water availability, enhanced convection and higher vertical turbulent mixing (higher PBL) over cities.
The differences between the WRF model and the RegCM in terms of the intensities of specific UMI elements are largely caused by the fact that WRF uses dominant land use (Fig. 1), while the RegCM considers fractional land use (Fig. 2), so the urban effects in RegCM simulations, on the one hand, do not have to be as intensive in city centres and, on the other hand, are non-zero in their surroundings, where non-zero urban fractions occur, which leads to smaller differences between cities and their rural vicinities. In other words, the modelled UMI is smoother. This feature is responsible for smaller UHI intensities in RegCM simulations (Fig. 14). In terms of WRF, higher winter urban temperatures in simulations with the BEP+BEM urban scheme are consistent with results of previous studies (Liao et al., 2014; Karlický et al., 2018) and are probably caused by higher amounts of anthropogenic heat, internally computed within the scheme. In simulations with the bulk urban scheme, no anthropogenic heat is considered, and therefore the winter UHI is suppressed.
As expected, differences between urban and rural PBL heights are sensitive, not only to the model and urban scheme but also to the chosen parameterization of boundary-layer processes. In WRF simulations, the MYJ PBL scheme produces a smaller urban PBL increase compared to the BouLac PBL scheme. Halenka et al. (2019), also using WRF and the RegCM to investigate urban effects over Prague, reported urban PBL increases of only about 50 m in winter and 100 m in summer in terms of WRF and about 100 m in terms of the RegCM (using the Holtslag PBL scheme without the Nogherotto MP scheme). In terms of the urbanization-induced wind speed changes, parameterization of urban processes and PBL are, again, the main influencing factors. Halenka et al. (2019) also gave the highest wind speed reduction in the BEP+BEM simulation, in the range of 1.5–2 m s−1, but in our case of more cities (Fig. 14), the reduction is much higher. In terms of SLUCM simulations, the reduction is similar, about 1 m s−1, similarly to RegCM simulations (about 0.5 m s−1 reduction). The wind speed urban increase in bulk simulation is visible only in the summer season in Halenka et al. (2019). The wind speed reduction is mostly smaller in summer, when higher urban roughness can be compensated for by enhanced turbulence, convection and mixing (Droste et al., 2018); i.e. many counteracting effects play a simultaneous role, and each model configuration prefers only a subset of these effects.
The impact of cities on cloud cover is clearly influenced by the convection parameterization: the Kain–Fritsch scheme makes the summer urban cloud cover increase stronger, despite the fact that this setup does not give the highest precipitation in general. This is very similar to the summer urban increase in sub-grid-scale precipitation. The great increases in RegCM simulations with the Nogherotto MP scheme can be explained by overall precipitation bias, where increased urban convection leads to a higher difference. In all simulations, it seems that urban changes in sub-grid-scale precipitation are largely city-dependent, in the case of the RegCM this concerns even the sign of the change. This indicates that some other climate elements such as seasonal total precipitation climatology may influence the urban increase in sub-grid-scale precipitation, and more research has to be conducted in this regard.
The study presented results of a model ensemble of 24 simulations using the WRF model and the RegCM performed over a European domain with 9 km horizontal resolution and covering a 2-year period. Such a great ensemble enables the robust investigation of the impact of urban surfaces on the overall climate and weather in cities, because model uncertainties given by specific model setups were eliminated in the whole ensemble. Urban-induced changes, manifesting in various meteorological variables, were generalized as one concept called the urban meteorology island (UMI), where urban perturbations of different meteorological quantities were regarded as components of the overall UMI.
The results of the study showed that this concept is justified and our approach is meaningful, because almost all investigated meteorological variables are significantly altered in cities with respect to their rural counterparts, independently of the chosen city and the model setup. However, quantitative or even (to some extent) qualitative differences were detected between models.
The main conclusions of the presented study are as follows:
-
Validation showed large differences between individual model simulations given by different parameterizations of the different physical processes driving urban meteorology. In the RegCM, the microphysics parameterization has the greatest impact on temperature and precipitation biases. The impact of other parameterizations is smaller; the Tiedtke convective scheme overpredicts precipitation less than the Grell scheme, and the Holtslag PBL scheme slightly improves the temperature. In WRF, temperature biases are smaller, especially in simulations with the BouLac PBL scheme, and significant overestimation is encountered mainly for summer precipitation.
-
For ECAD stations (often in cities), the type of urban canopy schemes turned out to be the most important factor determining the model's accuracy. The BEP+BEM urban scheme gives winter temperature minima that are about 2 ∘C higher than observed values and reduces the positive wind speed bias by 0.5–1 m s−1. Most of the model simulations correlate well with ECAD observations, with the correlation coefficient being about 0.8 or higher, with the exception of cloud cover and relative humidity in winter.
-
In general, the UMI components are more pronounced in WRF which used a dominant-land-use approach compared to the RegCM fractional-land-use approach, pointing out the importance of the land-use model representation.
-
An increase in cloud cover in cities is modelled, mainly for summer afternoons. This is connected with a summer afternoon urban increase in sub-grid-scale precipitation (by 5 mm). These changes are probably caused by enhanced convection over urban areas, given by higher near-surface temperatures, while specific humidity is significantly lower in cities.
-
The impact of urban and other parameterizations are as follows. The BEP+BEM urban model increases the winter UHI by more than 2 ∘C and leads to the highest reductions in urban wind speeds. In terms of the PBL height and its urban increase in summer, the MYJ PBL scheme in WRF simulations makes this UMI element about 50 m smaller, while the Holtslag PBL scheme in the RegCM increases it to the WRF level. The choice of PBL scheme further influences the wind speed reduction in cities. Modifications of cloud cover and sub-grid-scale precipitation in cities are influenced mainly by the parameterization of convection, and here, the Kain–Fritsch scheme results in the most pronounced UMI, mainly during the summer season.
-
Besides results based on model simulations, satellite measurements of surface temperature show significant increases in urban areas too, with a magnitude of 3–4 ∘C in summer and about 2 ∘C in winter, during clear-sky days.
Our study showed the great importance of the multi-model approach when describing the urban meteorological phenomenon, as large differences exist between models in their way of resolving different city- and regional-scale physical processes. Future research on urban atmospheric processes should thus be based on model or physical ensembles rather than on single-model experiments.
Source codes of the WRF model and the RegCM are publicly available. Resulting data from the simulation performed (stored in the Charles University data storage facilities totalling about 30 TB) can be obtained upon request to the authors.
PH conceived the main scientific idea and organized the project team, in collaboration with TH. MB prepared the input and validation data; JK and PH performed the model simulation; JK analysed the resulting data, with contribution from TN, FŠ and JĎ. JK wrote the text, and PH revised it.
The authors declare that they have no conflict of interest.
This work has been funded by the Czech Science Foundation (GACR) project no. 19-10747Y and partly by the project OP-PPR (Operational Program Prague – Growth Pole) CZ.07.1.02/0.0/0.0/16_040/0000383 “URBI PRAGENSI – Urbanization of weather forecast, air-quality prediction and climate scenarios for Prague” and by projects PROGRES Q47 and SVV 2020 – programmes of Charles University. This work was also supported by the Ministry of Education, Youth and Sports from the Large Infrastructures for Research, Experimental Development and Innovation project “IT4Innovations National Supercomputing Center – LM2015070”. We further acknowledge the E-OBS dataset from the EU-FP6 project UERRA (http://www.uerra.eu, last access: 14 March 2019), the Copernicus Climate Change Service, the data providers in the ECA&D project (https://www.ecad.eu, last access: 25 November 2019) and NASA's Land Processes Distributed Active Archive Center for providing MODIS satellite data.
This research has been supported by the Grantová Agentura České Republiky (grant no. 19-10747Y), OP-PPR (grant no. CZ.07.1.02/0.0/0.0/16_040/0000383) and Univerzita Karlova (Progres Q47 and SVV 2020).
This paper was edited by Yun Qian and reviewed by Bert Holtslag and two anonymous referees.
Angevine, W. M., White, A. B., Senff, C. J., Trainer, M., Banta, R. M., and Ayoub, M. A.: Urban-rural contrasts in mixing height and cloudiness over Nashville in 1999, J. Geophys. Res.-Atmos., 108, 4092, https://doi.org/10.1029/2001JD001061, 2003. a
Baklanov, A., Molina, L. T., and Gauss, M.: Megacities, air quality and climate, Atmos. Environ., 126, 235–249, https://doi.org/10.1016/j.atmosenv.2015.11.059, 2016. a
Bougeault, P. and Lacarrere, P.: Parameterization of Orography-Induced Turbulence in a Mesobeta–Scale Model, Mon. Weather Rev., 117, 1872–1890, https://doi.org/10.1175/1520-0493(1989)117<1872:POOITI>2.0.CO;2, 1989. a
Bretherton, C. S., McCaa, J. R., and Grenier, H.: A New Parameterization for Shallow Cumulus Convection and Its Application to Marine Subtropical Cloud-Topped Boundary Layers. Part I: Description and 1D Results, Mon. Weather Rev., 132, 864–882, https://doi.org/10.1175/1520-0493(2004)132<0864:ANPFSC>2.0.CO;2, 2004. a
Chen, F. and Dudhia, J.: Coupling an Advanced Land Surface–Hydrology Model with the Penn State–NCAR MM5 Modeling System. Part I: Model Implementation and Sensitivity, Mon. Weather Rev., 129, 569–585, https://doi.org/10.1175/1520-0493(2001)129<0569:CAALSH>2.0.CO;2, 2001. a
Chen, S.-H. and Sun, W.-Y.: A One-dimensional Time Dependent Cloud Model, J. Meteorol. Soc. Jpn., 80, 99–118, https://doi.org/10.2151/jmsj.80.99, 2002. a
Dee, D. P., Uppala, S. M., Simmons, A. J., Berrisford, P., Poli, P., Kobayashi, S., Andrae, U., Balmaseda, M. A., Balsamo, G., Bauer, P., Bechtold, P., Beljaars, A. C. M., van de Berg, L., Bidlot, J., Bormann, N., Delsol, C., Dragani, R., Fuentes, M., Geer, A. J., Haimberger, L., Healy, S. B., Hersbach, H., Hólm, E. V., Isaksen, L., Kållberg, P., Köhler, M., Matricardi, M., McNally, A. P., Monge-Sanz, B. M., Morcrette, J.-J., Park, B.-K., Peubey, C., de Rosnay, P., Tavolato, C., Thépaut, J.-N., and Vitart, F.: The ERA-Interim reanalysis: configuration and performance of the data assimilation system, Q. J. Roy. Meteorol. Soc., 137, 553–597, https://doi.org/10.1002/qj.828, 2011. a
Droste, A., Steeneveld, G.-J., and Holtslag, B.: Introducing the Urban Wind Island Effect, Environ. Res. Lett., 13, 094007, https://doi.org/10.1088/1748-9326/aad8ef, 2018. a, b, c, d, e
Fallmann, J., Forkel, R., and Emeis, S.: Secondary effects of urban heat island mitigation measures on air quality, Atmos. Environ., 125, 199–211, https://doi.org/10.1016/j.atmosenv.2015.10.094, 2016. a
Giorgi, F., Coppola, E., Solmon, F., Mariotti, L., Sylla, M. B., Bi, X., Elguindi, N., Diro, G. T., Nair, V., Giuliani, G., Cozzini, S., Guettler, I., O’Brien, T. A., Tawfi, A. B., Shalaby, A., Zakey, A., Steiner, A., Stordal, F., Sloan, L., and Brankovic, C.: RegCM4: Model description and preliminary tests over multiple CORDEX domains, Clim. Res., 52, 7–29, 2012. a
Godowitch, J. M., Ching, J. K. S., and Clarke, J. F.: Evolution of the Nocturnal Inversion Layer at an Urban and Nonurban Location, J. Clim. Appl. Meteorol., 24, 791–804, https://doi.org/10.1175/1520-0450(1985)024<0791:EOTNIL>2.0.CO;2, 1985. a, b
Grell, G. A.: Prognostic Evaluation of Assumptions Used by Cumulus Parameterizations, Mon. Weather Rev., 121, 764–787, https://doi.org/10.1175/1520-0493(1993)121<0764:PEOAUB>2.0.CO;2, 1993. a, b
Grell, G. A. and Freitas, S. R.: A scale and aerosol aware stochastic convective parameterization for weather and air quality modeling, Atmos. Chem. Phys., 14, 5233–5250, https://doi.org/10.5194/acp-14-5233-2014, 2014. a
Grenier, H. and Bretherton, C. S.: A Moist PBL Parameterization for Large-Scale Models and Its Application to Subtropical Cloud-Topped Marine Boundary Layers, Mon. Weather Rev., 129, 357–377, https://doi.org/10.1175/1520-0493(2001)129<0357:AMPPFL>2.0.CO;2, 2001. a
Göndöcs, J., Breuer, H., Pongrácz, R., and Bartholy, J.: Urban heat island mesoscale modelling study for the Budapest agglomeration area using the WRF model, Urban Climate, 21, 66–86, https://doi.org/10.1016/j.uclim.2017.05.005, 2017. a, b, c, d
Halenka, T., Belda, M., Huszar, P., Karlicky, J., Novakova, T., and Zak, M.: On the comparison of urban canopy effects parameterisation, Int. J. Environ. Pollut., 65, 177–194, https://doi.org/10.1504/IJEP.2019.101840, 2019. a, b, c
Haylock, M. R., Hofstra, N., Klein Tank, A. M. G., Klok, E. J., Jones, P. D., and New, M.: A European daily high-resolution gridded data set of surface temperature and precipitation for 1950–2006, J. Geophys. Res.-Atmos., 113, d20119, https://doi.org/10.1029/2008JD010201, 2008. a
Holtslag, A. A. M., Bruijn, E. I. F. D., and Pan, H.-L.: A High Resolution Air Mass Transformation Model for Short-Range Weather Forecasting, Mon. Weather Rev., 118, 1561–1575, https://doi.org/10.1175/1520-0493(1990)118<1561:AHRAMT>2.0.CO;2, 1990. a
Hong, S.-Y., Dudhia, J., and Chen, S.-H.: A Revised Approach to Ice Microphysical Processes for the Bulk Parameterization of Clouds and Precipitation, Mon. Weather Rev., 132, 103–120, https://doi.org/10.1175/1520-0493(2004)132<0103:ARATIM>2.0.CO;2, 2004. a
Huang, M., Gao, Z., Miao, S., and Chen, F.: Sensitivity of urban boundary layer simulation to urban canopy models and PBL schemes in Beijing, Meteorol. Atmos. Phys., 131, 1235–1248, https://doi.org/10.1007/s00703-018-0634-1, 2019. a, b, c
Huszar, P., Halenka, T., Belda, M., Zak, M., Sindelarova, K., and Miksovsky, J.: Regional climate model assessment of the urban land-surface forcing over central Europe, Atmos. Chem. Phys., 14, 12393–12413, https://doi.org/10.5194/acp-14-12393-2014, 2014. a, b, c
Huszar, P., Belda, M., Karlický, J., Bardachova, T., Halenka, T., and Pisoft, P.: Impact of urban canopy meteorological forcing on aerosol concentrations, Atmos. Chem. Phys., 18, 14059–14078, https://doi.org/10.5194/acp-18-14059-2018, 2018. a, b
Huszar, P., Karlický, J., Ďoubalová, J., Nováková, T., Šindelářová, K., Švábik, F., Belda, M., Halenka, T., and Žák, M.: The impact of urban land-surface on extreme air pollution over central Europe, Atmos. Chem. Phys., 20, 11655–11681, https://doi.org/10.5194/acp-20-11655-2020, 2020a. a, b, c, d
Huszar, P., Karlický, J., Ďoubalová, J., Šindelářová, K., Nováková, T., Belda, M., Halenka, T., Žák, M., and Pišoft, P.: Urban canopy meteorological forcing and its impact on ozone and PM2.5: role of vertical turbulent transport, Atmos. Chem. Phys., 20, 1977–2016, https://doi.org/10.5194/acp-20-1977-2020, 2020b. a, b, c, d, e
Huszár, P., Karlický, J., Belda, M., Halenka, T., and Pišoft, P.: The impact of urban canopy meteorological forcing on summer photochemistry, Atmos. Environ., 176, 209–228, https://doi.org/10.1016/j.atmosenv.2017.12.037, 2018. a, b, c, d
Iacono, M. J., Delamere, J. S., Mlawer, E. J., Shephard, M. W., Clough, S. A., and Collins, W. D.: Radiative forcing by long-lived greenhouse gases: Calculations with the AER radiative transfer models, J. Geophys. Res.-Atmos., 113, D13103, https://doi.org/10.1029/2008JD009944, 2008. a
Janjić, Z. I.: The Step-Mountain Eta Coordinate Model: Further Developments of the Convection, Viscous Sublayer, and Turbulence Closure Schemes, Mon. Weather Rev., 122, 927–945, https://doi.org/10.1175/1520-0493(1994)122<0927:TSMECM>2.0.CO;2, 1994. a, b
Jiménez, P. A., Dudhia, J., González-Rouco, J. F., Navarro, J., Montávez, J. P., and García-Bustamante, E.: A Revised Scheme for the WRF Surface Layer Formulation, Mon. Weather Rev., 140, 898–918, https://doi.org/10.1175/MWR-D-11-00056.1, 2012. a
Kain, J. S.: The Kain-Fritsch Convective Parameterization: An Update, J. Appl. Meteorol., 43, 170–181, https://doi.org/10.1175/1520-0450(2004)043<0170:TKCPAU>2.0.CO;2, 2004. a
Karlický, J., Huszár, P., Halenka, T., Belda, M., Žák, M., Pišoft, P., and Mikšovský, J.: Multi-model comparison of urban heat island modelling approaches, Atmos. Chem. Phys., 18, 10655–10674, https://doi.org/10.5194/acp-18-10655-2018, 2018. a, b, c, d, e, f, g, h, i, j
Kiehl, J. T., Hack, J. J., Bonan, G. B., Boville, B. A., Briegleb, B. P., Williamson, D. L., and Rasch, P. J.: Description of the NCAR Community Climate Model (CCM3), NCAR Technical Note NCAR/TN-420+STR, https://doi.org/10.5065/D6FF3Q99, 1996. a
Klein, P., Fedorovich, E., and Rotach, M.: A wind tunnel study of organised and turbulent air motions in urban street canyons, J. Wind Eng. Ind. Aerod., 89, 849–861, 2001. a
Klein Tank, A. M. G., Wijngaard, J. B., Können, G. P., Böhm, R., Demarée, G., Gocheva, A., Mileta, M., Pashiardis, S., Hejkrlik, L., Kern-Hansen, C., Heino, R., Bessemoulin, P., Müller-Westermeier, G., Tzanakou, M., Szalai, S., Pálsdóttir, T., Fitzgerald, D., Rubin, S., Capaldo, M., Maugeri, M., Leitass, A., Bukantis, A., Aberfeld, R., van Engelen, A. F. V., Forland, E., Mietus, M., Coelho, F., Mares, C., Razuvaev, V., Nieplova, E., Cegnar, T., Antonio López, J., Dahlström, B., Moberg, A., Kirchhofer, W., Ceylan, A., Pachaliuk, O., Alexander, L. V., and Petrovic, P.: Daily dataset of 20th-century surface air temperature and precipitation series for the European Climate Assessment, Int. J. Climatol., 22, 1441–1453, https://doi.org/10.1002/joc.773, 2002. a
Kusaka, H., Kondo, H., Kikegawa, Y., and Kimura, F.: A Simple Single-Layer Urban Canopy Model For Atmospheric Models: Comparison With Multi-Layer And Slab Models, Bound.-Lay. Meteorol., 101, 329–358, https://doi.org/10.1023/A:1019207923078, 2001. a
Langendijk, G., Rechid, D., and Jacob, D.: Urban Areas and Urban–Rural Contrasts under Climate Change: What Does the EURO-CORDEX Ensemble Tell Us? –Investigating Near Surface Humidity in Berlin and Its Surroundings, Atmosphere, 10, 730, https://doi.org/10.3390/atmos10120730, 2019. a, b, c
Lawrence, D. M., Oleson, K. W., Flanner, M. G., Thornton, P. E., Swenson, S. C., Lawrence, P. J., Zeng, X., Yang, Z.-L., Levis, S., Sakaguchi, K., Bonan, G. B., and Slater, A. G.: Parameterization improvements and functional and structural advances in Version 4 of the Community Land Model, J. Adv. Model. Earth Sy., 3, m03001, https://doi.org/10.1029/2011MS00045, 2011. a
Li, X., Hu, X.-M., Ma, Y., Wang, Y., Li, L., and Zhao, Z.: Impact of planetary boundary layer structure on the formation and evolution of air-pollution episodes in Shenyang, Northeast China, Atmos. Environ., 214, 116850, https://doi.org/10.1016/j.atmosenv.2019.116850, 2019. a
Liao, J., Wang, T., Wang, X., Xie, M., Jiang, Z., Huang, X., and Zhu, J.: Impacts of different urban canopy schemes in WRF/Chem on regional climate and air quality in Yangtze River Delta, China, Atmos. Res., 145, 226–243, https://doi.org/10.1016/j.atmosres.2014.04.005, 2014. a
Manola, I., Steeneveld, G.-J., Uijlenhoet, R., and Holtslag, A. A. M.: Analysis of urban rainfall from hourly to seasonal scales using high-resolution radar observations in the Netherlands, Int. J. Climatol., 40, 822–840, https://doi.org/10.1002/joc.6241, 2020. a, b
Martilli, A., Clappier, A., and Rotach, M. W.: An Urban Surface Exchange Parameterisation for Mesoscale Models, Bound.-Lay. Meteorol., 104, 261–304, https://doi.org/10.1023/A:1016099921195, 2002. a
Mirzaei, P. A.: Recent challenges in modeling of urban heat island, Sustain. Cities Soc., 19, 200–206, https://doi.org/10.1016/j.scs.2015.04.001, 2015. a
Moriwaki, R., Watanabe, K., and Morimoto, K.: Urban dry island phenomenon and its impact on cloud base level, J. JSCE, 1, 521–529, https://doi.org/10.2208/journalofjsce.1.1_521, 2013. a
Nogherotto, R., Tompkins, A. M., Giuliani, G., Coppola, E., and Giorgi, F.: Numerical framework and performance of the new multiple-phase cloud microphysics scheme in RegCM4.5: precipitation, cloud microphysics, and cloud radiative effects, Geosci. Model Dev., 9, 2533–2547, https://doi.org/10.5194/gmd-9-2533-2016, 2016. a
Oke, T. and Maxwell, G.: Urban heat island dynamics in Montreal and Vancouver, Atmos. Environ., 9, 191–200, https://doi.org/10.1016/0004-6981(75)90067-0, 1975. a, b
Oke, T. R.: The energetic basis of the urban heat island, Q. J. Roy. Meteor. Soc., 108, 1–24, https://doi.org/10.1002/qj.49710845502, 1982. a, b
Oke, T. R.: Boundary Layer Climates, Routledge, London, 1987. a, b, c
Oleson, K., Lawrence, D. M., Bonan, G. B., Drewniak, B., Huang, M., Koven, C. D., Levis, S., Li, F., Riley, W. J., Subin, Z. M., Swenson, S. C., Thornton, P. E., Bozbiyik, A., Fisher, R., Heald, C. L., Kluzek, E., Lamarque, J.-F., Lawrence, P. J., Leung, L. R., Lipscomb, W., Muszala, S., Ricciuto, D. M., Sacks, W., Sun, Y., Tang, J., and Yang, Z.-L.: Technical Description of version 4.5 of the Community Land Model (CLM), NCAR Tehcnical Notes, https://doi.org/10.5065/D6RR1W7M, 2013. a
Oleson, K. W., Bonan, G. B., Feddema, J., Vertenstein, M., and Grimmond, C. S. B.: An Urban Parameterization for a Global Climate Model. Part I: Formulation and Evaluation for Two Cities, J. Appl. Meteorol. Clim., 47, 1038–1060, https://doi.org/10.1175/2007JAMC1597.1, 2008. a
Pal, J. S., Small, E. E., and Eltahir, E. A. B.: Simulation of regional-scale water and energy budgets: Representation of subgrid cloud and precipitation processes within RegCM, J. Geophys. Res.-Atmos., 105, 29579–29594, https://doi.org/10.1029/2000JD900415, 2000. a
Ryu, Y.-H., Baik, J.-J., Kwak, K.-H., Kim, S., and Moon, N.: Impacts of urban land-surface forcing on ozone air quality in the Seoul metropolitan area, Atmos. Chem. Phys., 13, 2177–2194, https://doi.org/10.5194/acp-13-2177-2013, 2013. a
Salamanca, F., Krpo, A., Martilli, A., and Clappier, A.: A new building energy model coupled with an urban canopy parameterization for urban climate simulations – part I. formulation, verification, and sensitivity analysis of the model, Theor. Appl. Climatol., 99, 345–356, https://doi.org/10.1007/s00704-009-0142-9, 2009. a
Skamarock, W. C., Klemp, J. B., Dudhia, J., Gill, D. O., Barker, D. M., Duda, M., Huang, X.-Y., Wang, W., and Powers, J. G.: A Description of the Advanced Research WRF Version 3, NCAR Technical Note, National Center for Atmospheric Research, Boulder CO, USA, https://doi.org/10.5065/D68S4MVH, 2008. a
Theeuwes, N. E., Steeneveld, G.-J., Ronda, R. J., Rotach, M. W., and Holtslag, A. A. M.: Cool city mornings by urban heat, Environ. Res. Lett., 10, 114022, https://doi.org/10.1088/1748-9326/10/11/114022, 2015. a, b
Theeuwes, N. E., Steeneveld, G.-J., Ronda, R. J., and Holtslag, A. A. M.: A diagnostic equation for the daily maximum urban heat island effect for cities in northwestern Europe, Int. J. Climatol., 37, 443–454, https://doi.org/10.1002/joc.4717, 2017. a
Theeuwes, N. E., Barlow, J., Teuling, A., Grimmond, C., and Kotthaus, S.: Persistent cloud cover over mega-cities linked to surface heat release, npj Climate and Atmospheric Science, 2, 15, https://doi.org/10.1038/s41612-019-0072-x, 2019. a, b, c, d
Tiedtke, M.: A Comprehensive Mass Flux Scheme for Cumulus Parameterization in Large-Scale Models, Mon. Weather Rev., 117, 1779–1800, https://doi.org/10.1175/1520-0493(1989)117<1779:ACMFSF>2.0.CO;2, 1989. a, b
Trusilova, K., Schubert, S., Wouters, H., Früh, B., Grossman-Clarke, S., Demuzere, M., and Becker, P.: The urban land use in the COSMO-CLM model: a comparison of three parameterizations for Berlin, Meteorol. Z., 25, 231–244, https://doi.org/10.1127/metz/2015/0587, 2016. a, b, c, d
United Nations, Department of Economic and Social Affairs, P. D.: World Urbanization Prospects: The 2014 Revision, Highlights, NCAR Technical Note, National Center for Atmospheric Research, Boulder CO, USA, available at: https://esa.un.org/unpd/wup/publications/files/wup2014-highlights.pdf (last access: 1 May 2020), 2014. a
Wan, Z., Hook, S., and Hulley, G.: MOD11C3 MODIS/Terra Land Surface Temperature/Emissivity Monthly L3 Global 0.05Deg CMG V006, NASA EOSDIS Land Processes DAAC, https://doi.org/10.5067/MODIS/MOD11C3.006, 2015a. a
Wan, Z., Hook, S., and Hulley, G.: MYD11C3 MODIS/Aqua Land Surface Temperature/Emissivity Monthly L3 Global 0.05Deg CMG V006, NASA EOSDIS Land Processes DAAC, https://doi.org/10.5067/MODIS/MYD11C3.006, 2015b. a
Wolters, D. and Brandsma, T.: Estimating the Urban Heat Island in Residential Areas in the Netherlands Using Observations by Weather Amateurs, J. Appl. Meteorol. Climatol., 51, 711–721, https://doi.org/10.1175/JAMC-D-11-0135.1, 2012. a
Yan, S., Zhu, B., Huang, Y., Zhu, J., Kang, H., Lu, C., and Zhu, T.: To what extents do urbanization and air pollution affect fog?, Atmos. Chem. Phys., 20, 5559–5572, https://doi.org/10.5194/acp-20-5559-2020, 2020. a
Zhong, S., Qian, Y., Zhao, C., Leung, R., Wang, H., Yang, B., Fan, J., Yan, H., Yang, X.-Q., and Liu, D.: Urbanization-induced urban heat island and aerosol effects on climate extremes in the Yangtze River Delta region of China, Atmos. Chem. Phys., 17, 5439–5457, https://doi.org/10.5194/acp-17-5439-2017, 2017. a, b, c
Zhu, X., Zhang, Q., Sun, P., Singh, V. P., Shi, P., and Song, C.: Impact of urbanization on hourly precipitation in Beijing, China: Spatiotemporal patterns and causes, Global Planet. Change, 172, 307–324, https://doi.org/10.1016/j.gloplacha.2018.10.018, 2019. a
Ďoubalová, J., Huszár, P., Eben, K., Benešová, N., Belda, M., Vlček, O., Karlický, J., Geletič, J., and Halenka, T.: High Resolution Air Quality Forecasting over Prague within the URBI PRAGENSI Project: Model Performance during the Winter Period and the Effect of Urban Parameterization on PM, Atmosphere, 11, 625, https://doi.org/10.3390/atmos11060625, 2020. a