the Creative Commons Attribution 4.0 License.
the Creative Commons Attribution 4.0 License.
 | 07 Feb 2020
China's emission control strategies have suppressed unfavorable influences of climate on wintertime PM2.5 concentrations in Beijing since 2002
Zirui Liu
Dongsheng Ji
Peter Sherman
Shaojie Song
Jinyuan Xin
Cheng Liu
Yuesi Wang
Qiang Zhang
Jia Xing
Jingkun Jiang
Zifa Wang
Gregory R. Carmichael
Michael B. McElroy
Severe wintertime PM2.5 pollution in Beijing has been receiving increasing worldwide attention, yet the decadal variations remain relatively unexplored. Combining field measurements and model simulations, we quantified the relative influences of anthropogenic emissions and meteorological conditions on PM2.5 concentrations in Beijing over the winters of 2002–2016. Between the winters of 2011 and 2016, stringent emission control measures resulted in a 21 % decrease in mean mass concentrations of PM2.5 in Beijing, with 7 fewer haze days per winter on average. Given the overestimation of PM2.5 by the model, the effectiveness of stringent emission control measures might have been slightly overstated. With fixed emissions, meteorological conditions over the study period would have led to an increase in haze in Beijing, but the strict emission control measures have suppressed the unfavorable influences of the recent climate. The unfavorable meteorological conditions are attributed to the weakening of the East Asia winter monsoon associated particularly with an increase in pressure associated with the Aleutian Low.
- Article
(3063 KB) - Full-text XML
-
Supplement
(405 KB) - BibTeX
- EndNote


In recent years, persistent and severe haze episodes with high PM2.5 concentrations occur frequently in China, attracting worldwide attention (Cheng et al., 2016; Gao et al., 2016a). High aerosol concentrations during haze have been reported to cause traffic jams and flight cancelations (Wu et al., 2005) and have been linked to health damage (Dockery et al., 1993), climate change (Ramanathan and Carmichael, 2008), and ecosystem degradation (Chameides et al., 1999). The annual mean PM2.5 concentrations in Beijing exceeded 90 µg m−3 in 2013, nearly twice China's National Ambient Air Quality Standard (NAAQS) of 35 µg m−3 (Ministry of Environmental Protection (MEP) 2012). January 2013 was reported as the haziest month over the past 60 years in Beijing, with maximum hourly and daily mean PM2.5 concentrations exceeding 1000 and 500 µg m−3, respectively (Wang et al., 2014).
Since then, the State Council of China has issued the Air Pollution Prevention and Control Action Plan (APPCAP), which describes explicitly the pollution control measures, and proposed specific goals for concentrations by 2017 (China State Council, 2013). This action has been considered the most stringent air pollution control policy in Chinese history. The Beijing–Tianjin–Hebei, Yangtze River Delta, and Pearl River Delta regions were required to reduce annual mean PM2.5 concentrations by 15 %–25 % compared with the concentrations in 2013, and the annual mean concentrations of PM2.5 in Beijing should not exceed 60 µg m−3 (Cheng et al., 2019; China State Council, 2013). Specific control measures included eliminating small coal-fired boilers, phasing out small high-emitting factories, installing control facilities for emissions of VOCs (volatile organic compounds), and replacing residential coal burning with electricity and natural gas among others (Zheng et al., 2018). With these rigorous control measures, China has made impressive progress, with annual mean PM2.5 concentrations reduced in major metropolitan regions by 28 %–40 % between 2013 and 2017 (Zheng et al., 2018).
A number of studies have used visibility as a surrogate to indicate trends of haze pollution in China over the past several decades (Che et al., 2009; Chen and Wang, 2015; Ding and Liu, 2014; Wang and Chen, 2016). Chen and Wang (2015) reported that haze days increased rapidly in the 1970s and remained relatively stable up to the present. However, Che et al. (2009) illustrated that there was a decreasing haze trend in winter for many cities over the interval 1981–2005. Wang et al. (2019) argued that visibility is impacted significantly by meteorological factors, especially relative humidity, and thus visibility does not accordingly reflect the real changes in air pollution. The influences of anthropogenic emissions and meteorological conditions on air quality over shorter periods have been investigated extensively (Gao et al., 2017a, 2011; Liu et al., 2017; Wang et al., 2016; Xing et al., 2011). Due to the lack of long-term measurements of PM2.5 in China, limited studies have been conducted exploring the roles of anthropogenic emissions and meteorological conditions for the long-term variations of PM2.5 in China. Yang et al. (2016) used the GEOS-Chem model to simulate PM2.5 in China between 1985 and 2005 and concluded that the increase in winter PM2.5 was dominated over this period by the increase in anthropogenic emissions. They found that weakening of winds was the dominant meteorological factor. The variability of winds in North China has also been linked to air quality over the Yangtze River Delta, which is a downwind region of North China (Kang et al., 2019). While Yang et al. (2016) have explored the relative roles of emissions and meteorology, no model validation of PM2.5 was provided, and the recent decades were not covered in the study period. Long-term measurements of PM2.5 in Beijing reveal a slight decreasing trend of annual mean concentration over 2004–2012 (Liu et al., 2015). With the increase in availability of recent measurements, a closer reading of long-term variations is needed to better define the relative roles of anthropogenic emissions and meteorology.
In this study, we present a comprehensive analysis of the decadal trend of wintertime PM2.5 in Beijing based on regional meteorology–chemistry modeling, a new decadal emission inventory, and long-term observations of PM2.5, including their composition. We address the following topics: (1) the influences of decadal changes in anthropogenic emissions and meteorology on the variations of winter PM2.5 in Beijing and (2) the key driving factors for the decadal variation of meteorology. The descriptions of model, emissions, and numerical experiments are presented in Sect. 2. The two questions highlighted above are addressed in detail in Sect. 3; Sect. 4 provides an overall summary of the study.

Figure 1WRF-Chem modeling domain settings and locations of observations.
2.1 Meteorology–chemistry modeling
We used the WRF-Chem (Weather Research and Forecasting model coupled with chemistry) model version 3.6.1 to simulate meteorology and emissions, transport, mixing, and the chemical transformation of trace gases and aerosols. Two nested domains were applied with the outer domain covering East Asia and part of Southeast Asia and with the inner domain focusing on North China (Fig. 1). Horizontal resolutions of 81 and 27 km were configured for these two domains, respectively, and the model accounted for 27 vertical layers extending from the surface to 50 hPa. The gas phase chemical mechanism CBMZ (Zaveri and Peters, 1999) coupled with the 8-bin sectional MOSAIC model with aqueous chemistry (Zaveri et al., 2008) was adopted. The model treats all the important aerosol species, including sulfate, nitrate, chloride, ammonium, sodium, black carbon (BC), and primary organic and inorganic material. The Fast-J radiation scheme (Wild et al., 2000) was selected to calculate photolysis rates. These configurations have been shown in previous studies (Gao et al., 2016a, b, 2017b) to be capable of reproducing winter haze episodes in North China.
2.2 Emissions
The monthly Multi-resolution Emission Inventory for China (MEIC, http://www.meicmodel.org/, last access: 1 May 2019) covering the years 2002–2017 (Zheng et al., 2018) was used for anthropogenic emissions. This inventory considers emissions of sulfur dioxide (SO2), nitrogen oxides (NOx), carbon monoxide (CO), non-methane volatile organic compounds (NMVOC), ammonia (NH3), black carbon (BC), organic carbon (OC), PM2.5, PM10, and carbon dioxide (CO2) associated with power generation and the industrial, residential, transportation, and agricultural sectors. The trends of wintertime emissions of these species in the Beijing–Tianjin–Hebei region over the interval 2002–2016 are displayed in Fig. S1. Emissions of SO2 have decreased continuously since 2004, while NOx emissions have declined since 2011. Emissions of all involved species have decreased rapidly since 2012. Biogenic emissions were calculated online using the MEGAN model (Guenther et al., 2006). Emissions from biomass burning were taken from the GFED v3 dataset (Randerson et al., 2015). Dust emissions and sea-salt emissions were also calculated online.
2.3 Numerical experiments
Meteorological initial and boundary conditions were obtained from the National Centers for Environmental Prediction (NCEP) final analysis (FNL) dataset. Chemical initial and boundary conditions were taken from the climatological data provided by the NOAA Aeronomy Lab Regional Oxidant Model (NALROM). Wintertime periods defined as the last month of the year and the following 2 months of the next year were simulated for the years 2002–2016. For example, the winter of 2002 includes December of 2002, January of 2003, and February of 2003. Nudging (assimilation) of the analyses was applied to produce realistic meteorological simulations. The simulations were conducted month by month (15 years × 3 months yr−1 = 45 months). To overcome the impacts of initial conditions, 5 more days were simulated for each month and discarded as spin-up. Two sets of simulations were performed to elucidate the relative roles of changes in anthropogenic emissions and meteorological conditions: (1) CTL (control) simulation, simulations of winter periods from 2002 to 2016 with varying meteorological conditions and anthropogenic emissions, and (2) MET (meteorology) simulation, simulations of winter periods from 2002 to 2016 with varying meteorological conditions only, with anthropogenic emissions fixed at levels that applied in 2002. The MET simulation can be used to answer the following question: what would the climate have done to the variations of PM2.5 if emissions were not changing? The CTL simulation contains the information of changes in both meteorological conditions and emissions.
3.1 Model evaluation
Model evaluation was conducted in terms of both PM2.5 concentrations and PM2.5 chemical compositions, using measurements from urban Beijing (location is marked with a red triangle in Fig. 1). PM2.5 was measured using the two tapered element oscillating microbalance (TEOM) systems at the Institute of Atmospheric Physics (Chinese Academy of Sciences) site. More descriptions of the observations were archived in Liu et al. (2015). Figure 2 displays the variations of simulated and observed daily mean PM2.5 concentrations over winters from 2002 to 2016. Temporal variations of simulated and observed PM2.5 concentrations are generally consistent, with correlation coefficients ranging from 0.75 to 0.83 (Fig. 2). Notably, the model overestimates PM2.5 concentrations for all periods. However, the overestimations decline gradually over time. Values of the mean bias decrease from 54.1 µg m−3 over the 2004–2006 period to 15.9 µg m−3 for recent winters. The broad ranges of errors in different periods reflect the changing uncertainty of emission inventories for different periods. In earlier times, documentations of emission sources were not as comprehensive as those available for recent years, leading to larger errors in early inventories.
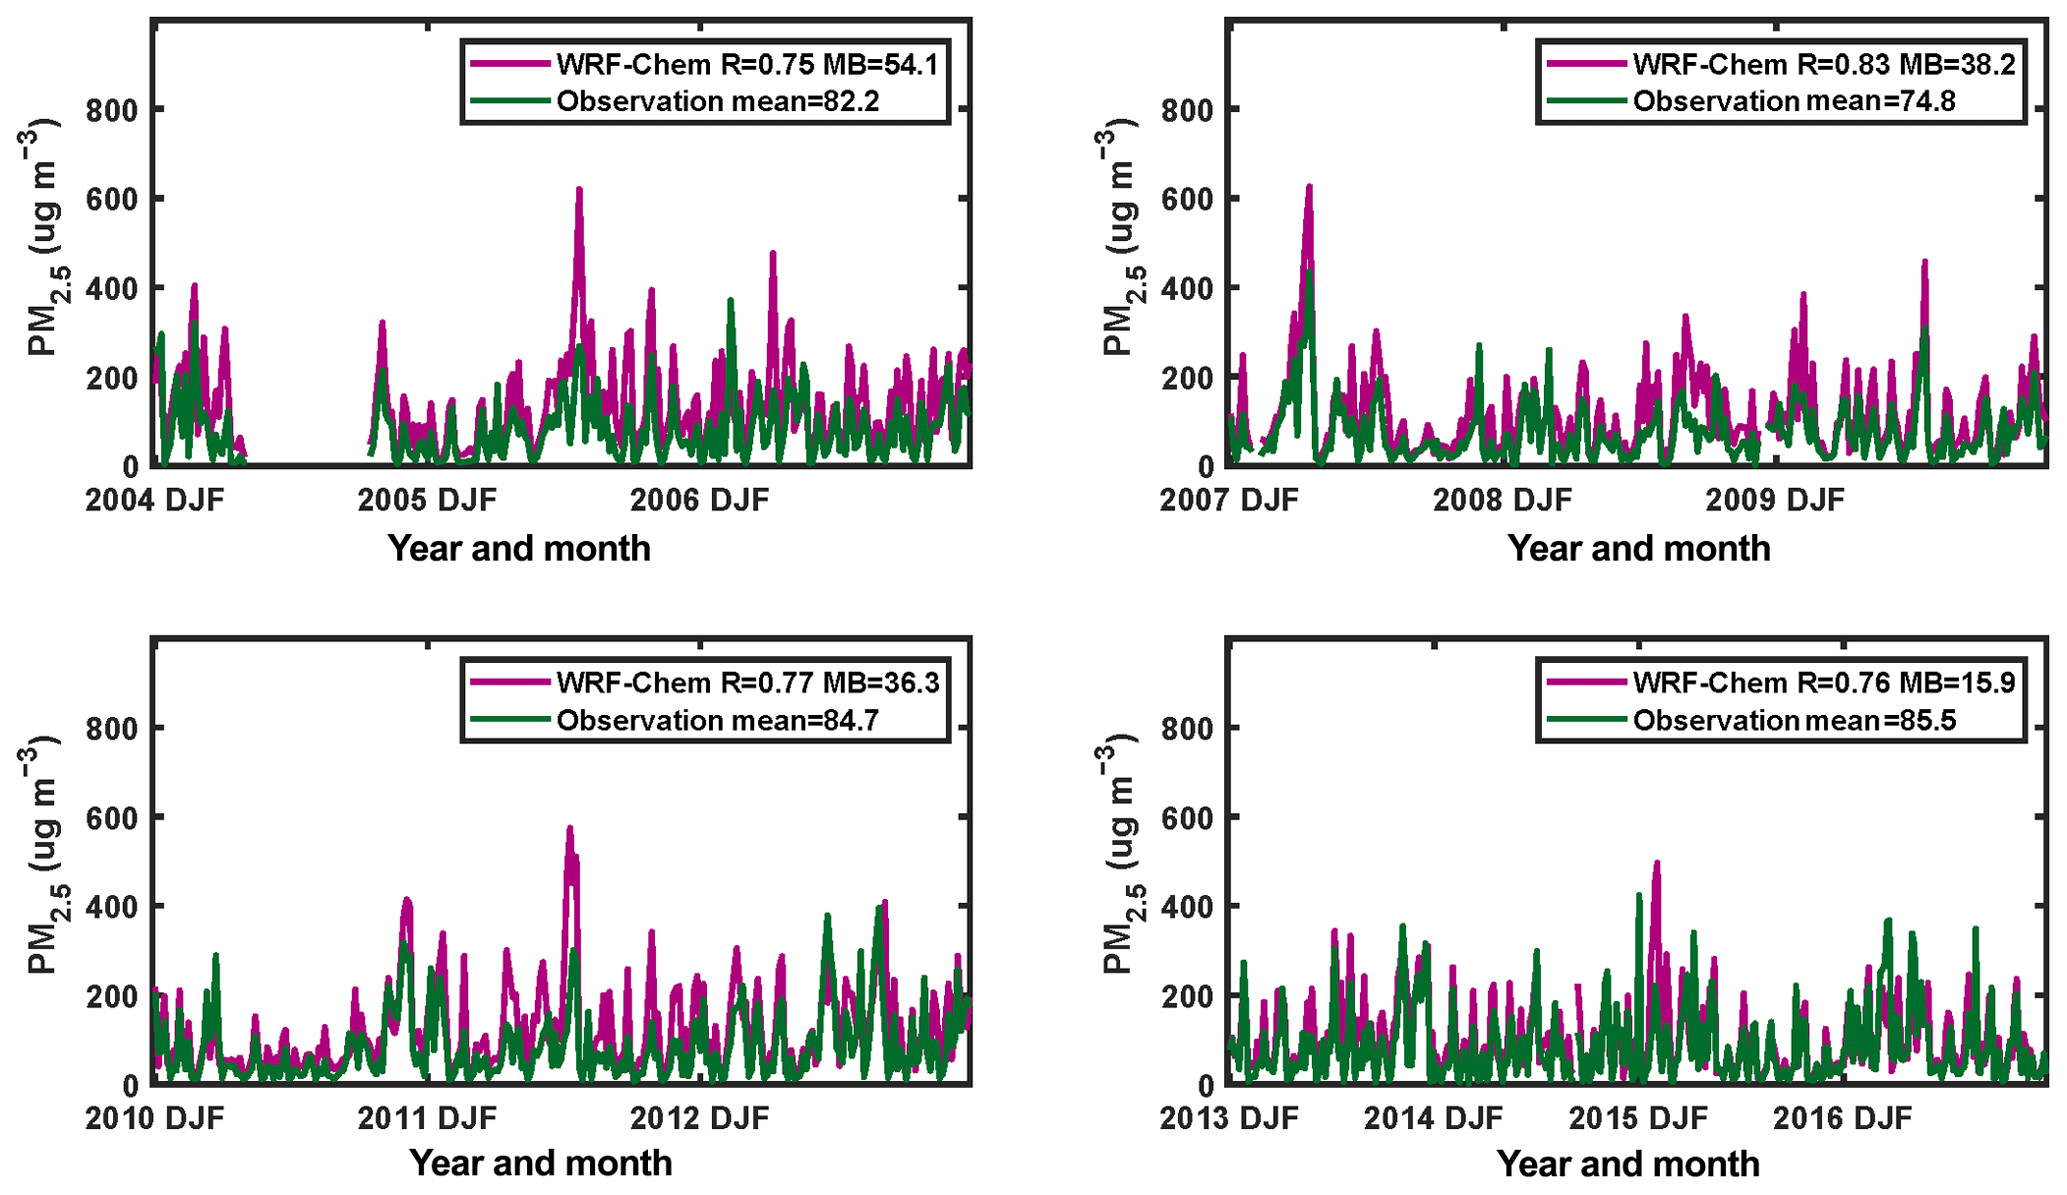
Figure 2Simulated and observed temporal variations of daily mean PM2.5 concentrations in Beijing, with correlation coefficient and mean bias.
According to results reported by Zheng et al. (2018), SO2 emissions decreased by 59 %, NOx emissions decreased by 21 %, BC emissions decreased by 28 %, and OC emissions decreased by 32 % for China between 2013 and 2017. These remarkable changes in emissions are expected to lead to notable changes in both the abundance and composition of PM2.5. As shown in Fig. 3, sulfate and OC exhibit the largest declines and ammonium and BC show slight decreases, while nitrate concentrations remain relatively stable over 2013–2017. These measured trends are captured generally well by the model, except that sulfate is still underestimated and BC in Beijing is overestimated. The underestimate of sulfate by models and the overestimate of BC in Beijing have been well documented in previous studies (Cheng et al., 206; Gao et al., 2016a, 2018a; Song et al., 2018), attributed to missing reaction pathways and aging and deposition treatments in models (Song et al., 2019). Several heterogeneous reaction pathways for sulfate formation have been proposed, including the oxidation of SO2 by NO2, transition-metal-catalyzed O2, or H2O2 in aerosol water and by NO2 or O2 on aerosol surfaces (Cheng et al., 2016; He et al., 2014; Hung et al., 2018; Li et al., 2018). More recently, Song et al. (2019) proposed that the heterogeneous production of hydroxymethanesulfonate (HMS) from the reaction of SO2 and formaldehyde could be an important chemical mechanism for wintertime haze in China. With the rapid declines in sulfate in Beijing, the relative importance of nitrate in PM2.5 is enhanced, a circumstance worthy of special attention for future pollution control policy.

Figure 3Simulated and observed temporal variations of monthly mean concentrations of PM2.5 chemical components from 2013 to 2017.
3.2 Influences of anthropogenic emissions and meteorological conditions on haze in Beijing
Figure 4 illustrates the wintertime mean concentrations of PM2.5 and the numbers of haze days from the CTL and MET simulations. Haze days are defined as occasions with daily mean concentrations exceeding 150 µg m−3. With fixed anthropogenic emissions, wintertime-averaged concentrations of PM2.5 would have increased at a rate of 2.1 µg m−3 yr−1 in Beijing (Fig. 4a). Due to the implementation of China's emission control strategies, the wintertime-averaged concentrations of PM2.5 have been declining since 2012. Over the 2002–2016 winters, mean concentrations of PM2.5 in Beijing decreased at a rate of 1.4 µg m−3 yr−1. Compared to concentrations in the MET simulation, the mean mass concentrations of PM2.5 decreased by 21 % in Beijing over the winters of 2011–2016.
The effectiveness of China's emission control strategies has been highlighted also in the decline in the number of haze days in Beijing. In the MET simulation, the total number of haze days over the 2011–2016 winters amounted to 157 d, reduced by 44 d as a result of the emission controls implemented over this period (Fig. 4b). On average, China's emission control strategies resulted in 7 fewer haze days per winter over 2011–2016. Over the entire study period 2002–2016, China's emission control strategies altered the direction of changes in wintertime haze days, with rates changing from 0.8 to 0.3 d yr−1. The differences in both mean concentrations of PM2.5 and numbers of haze days from the two sets of simulations underscore the impressive success of China's emission control strategies. Given the more serious overestimate of PM2.5 in early periods (Fig. 2), the declining rates inferred from the CTL simulation might have been slightly overstated. With unchanged anthropogenic emissions, the increasing trend of haze pollution that would have occurred for Beijing highlights the unfavorable influences of recent changes in local meteorology. We explored if different thresholds of haze days would change the findings and found the variations are similar when a threshold of 75 µg m−3 is used (Fig. S2). Due to the overestimation of number of haze days by the model in early years, the declining rates of number of haze days inferred from the CTL simulation might have been overstated. As seen from Fig. S3, there is no notable declining trend in number of haze days inferred from observations over 2005–2016. However, it is consistent that both model and observations indicate rapid declines in number of haze days (−4.8 and −3.0 d per winter, respectively) over 2012–2016. With fixed emissions, the MET simulation suggests that unfavorable climate conditions would have led to more haze days, emphasizing the significance of emission control in recent years.
Using a similar approach, Cheng et al. (2019) found that meteorological conditions explain 12.1 % of the improved PM2.5 air quality during 2013–2017, while large portions of the improvement are dominated by local (65.4 %) and regional (22.5 %) emission reductions. Zhou et al. (2019) concluded that emission reductions play a more important role than meteorological conditions in determining the declines in PM2.5 over 2011/2012–2017/2018. The current study examines longer-term trends since 2002, but the more favorable meteorological conditions mentioned in Cheng et al. (2019) are also illustrated in Fig. 4. Our findings also highlight the significance of emission reductions, especially after 2013, while the long-term trend of meteorological conditions since 2002 differs from it during 2013–2017.

Figure 4Wintertime mean concentrations of PM2.5 and number of haze days (defined as daily mean concentration above 150 µg m−3) from the CTL and MET simulations.
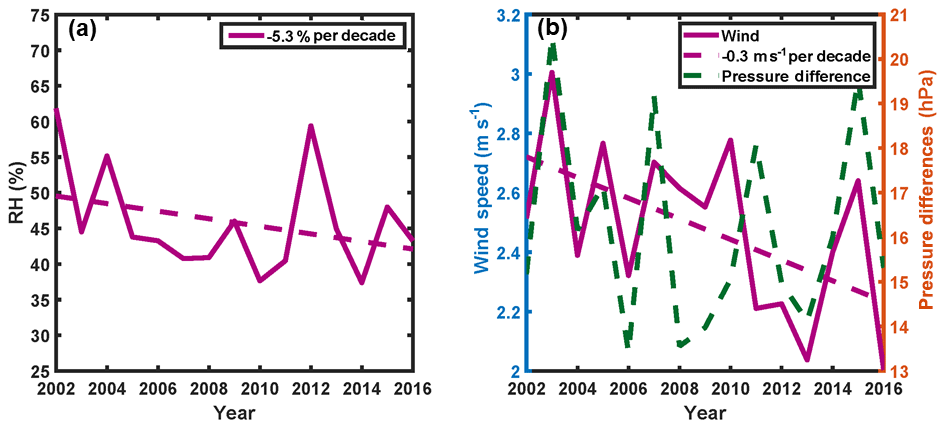
Figure 5Simulated winter mean near-surface RH, wind speeds in Beijing with declining rates, and pressure difference indicating the intensity of East Asia winter monsoon.
3.3 Significance of different meteorological variables
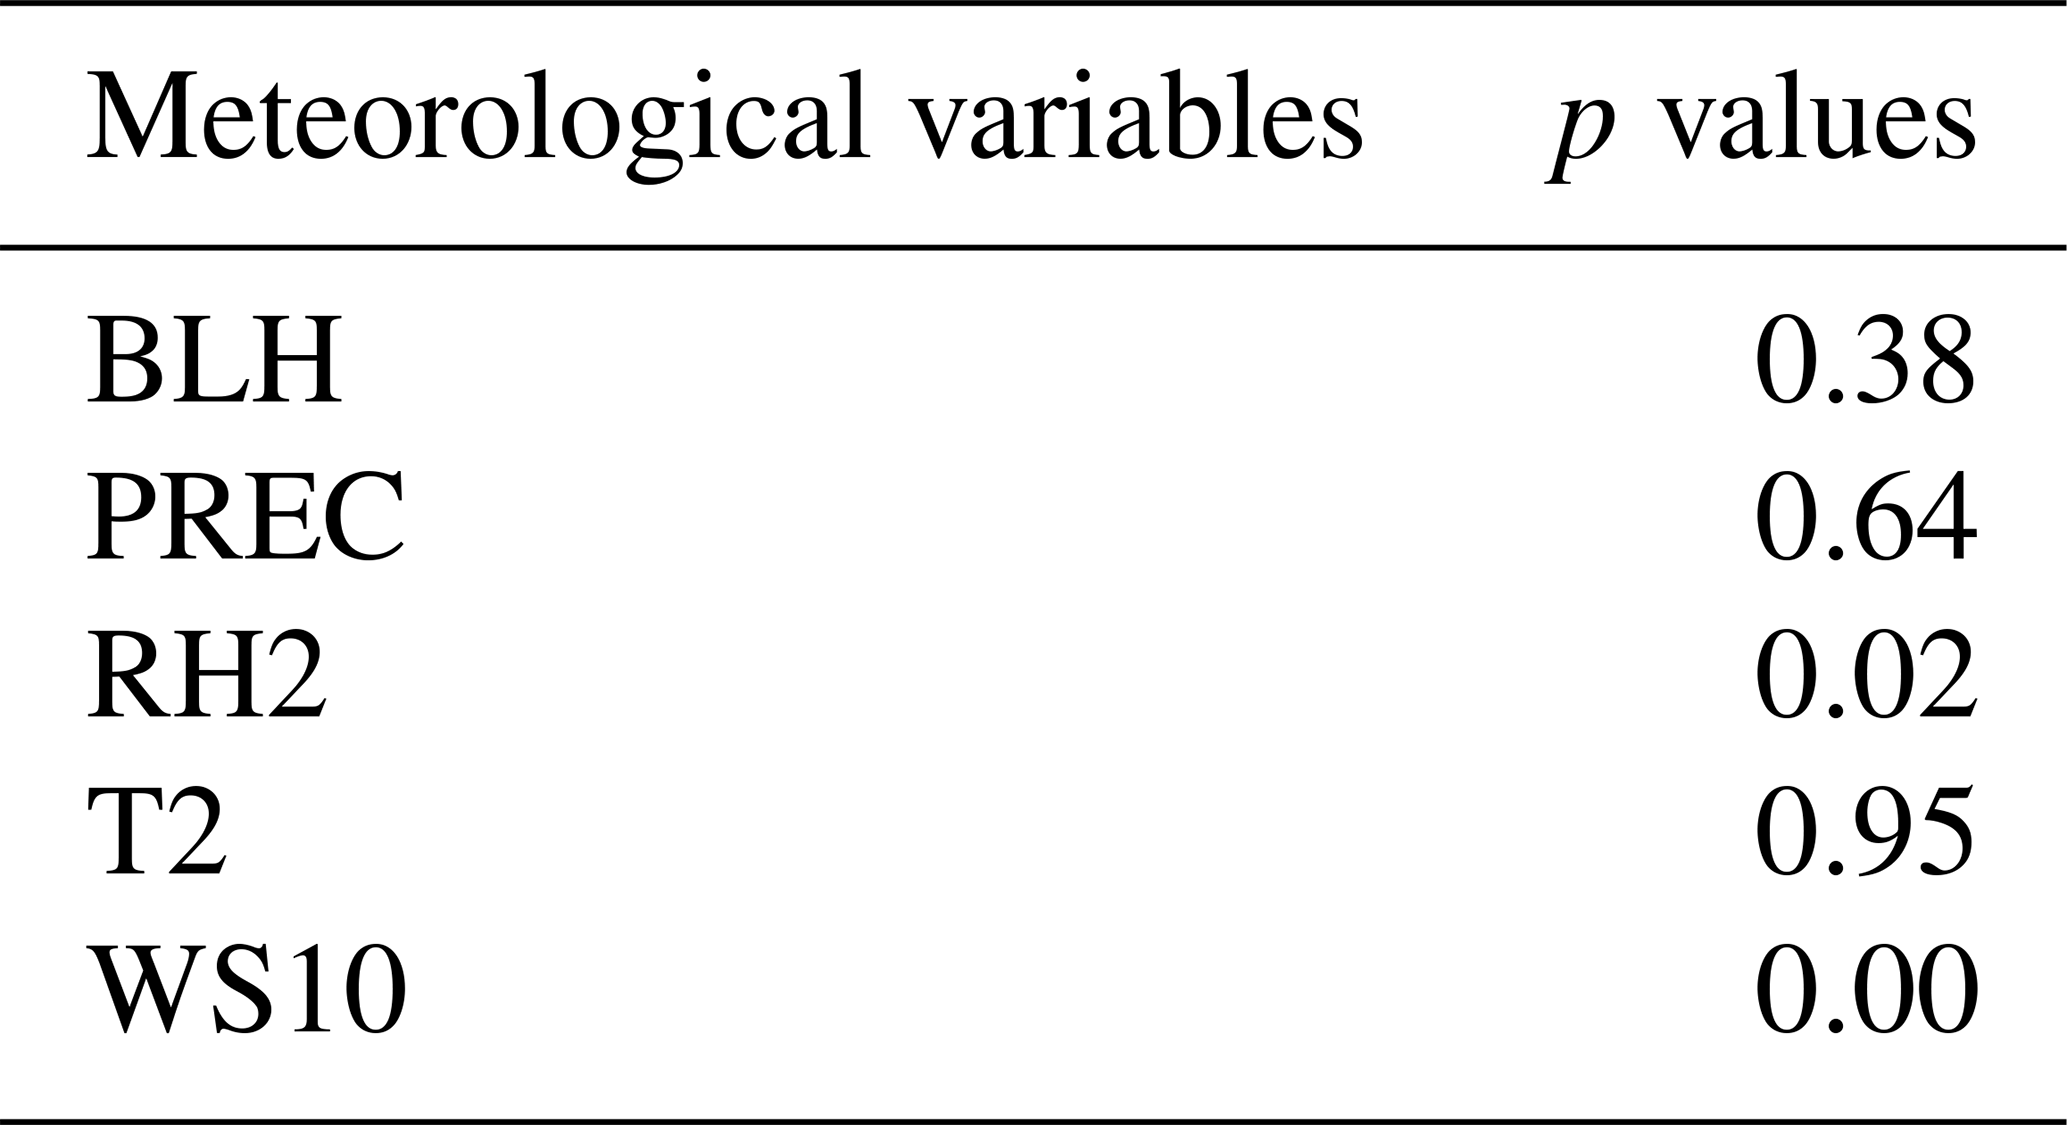
To identify the key meteorological variables for the unfavorable influences on air quality, we applied a stepwise linear regression model (SLR) to determine the relative significance of multiple meteorological variables in terms of their contributions to the variations of PM2.5 concentrations. In an SLR model, the selected predictors are included in the regression equation one by one. The predictor that contributes the most to the model is included first, and the process is continued if the additional predictor can statistically improve the regression (Bendel and Afifi, 1977). Thus, SLR models are widely used to select meaningful predictors. In this study, boundary layer heights (BLH), precipitation (PREC), near-surface relative humidity (RH2), near-surface temperature (T2), and near-surface wind speeds (WS10) were selected as predictors for the SLR model. These variables were extracted from the WRF-Chem meteorological simulations with analyses nudging applied. Table 1 summarizes the p values for each predictor. RH2 and WS10 were selected as the most significant predictors for wintertime PM2.5 in Beijing (p values < 0.05). The influence of WS10 is greater than that of RH2. Shen et al. (2018) and Zhang et al. (2018) reported also that relative humidity (RH) and meridional wind speeds drive stagnation and chemical production of PM2.5 in Beijing.
Table 1The p values for the stepwise linear regression model for Beijing.
The impacts of RH on aerosol composition and processes in winter were examined using measurements in Beijing, and the largest impacts were found for the growth of sulfate and organic aerosols associated with coal combustion (Sun et al., 2013; Wang et al., 2017). Although RH2 has been shown to be a good predictor of PM2.5, it decreases slightly (−5.3 % per decade) between the 2002 to 2016 period (Fig. 5a), which contradicts the predicted increasing trend of PM2.5 under fixed emissions (Fig. 4a). RH2 has been found to explain the interannual variability of PM2.5 but not the increasing trend. Thus, the variability of RH2 is unlikely to be the driver of enhanced PM2.5 under changing conditions of climate. As suggested by Ding et al. (2014), the decrease of RH2 was partly caused by the increase in surface temperature.
Between 2002 and 2016, simulated wintertime WS10 in Beijing declined gradually at a rate of 0.3 m s−1 per decade (Fig. 5b), in agreement with the declining trends inferred from observations (Fig. S4). Weaker wintertime near-surface wind speeds are associated with enhanced PM2.5 concentrations and increasing numbers of haze days since 2002. In winter, the North China Plain features northwesterly winds associated with the East Asia winter monsoon (EAWM), properties of which depend largely on the development of both the Siberian High and the Aleutian Low (Jhun and Lee, 2004). We calculated the intensity of the EAWM index using the pressure difference between area mean sea level pressure (SLP; data were taken from MERRA-2 (The Modern-Era Retrospective analysis for Research and Applications, Version 2) reanalysis) over the region 40–50∘ N, 90–110∘ E and the area mean SLP over the region 40–60∘ N, 120–170∘ E. These two regions represent the central focal areas of the Siberian High and the Aleutian Low, respectively. Figure 5b indicates that the variations of EAWM intensity have declined gradually over time, consistent with the variations of wind speeds in Beijing. The weakening of EAWM intensity is due partially to the increasing pressure in the regions of the Aleutian Low. As shown in Fig. 6, there is no significant change in SLP over the regions of the Siberian High, but SLP of the Aleutian Low intensity decreased significantly between 2002 and 2016 (more than 50 Pa yr−1). Although no significant trend was observed for the strength of the Siberian High, the changes in the position of the Siberian High have been linked to wintertime air quality in China over the past decades (Jia et al., 2015).
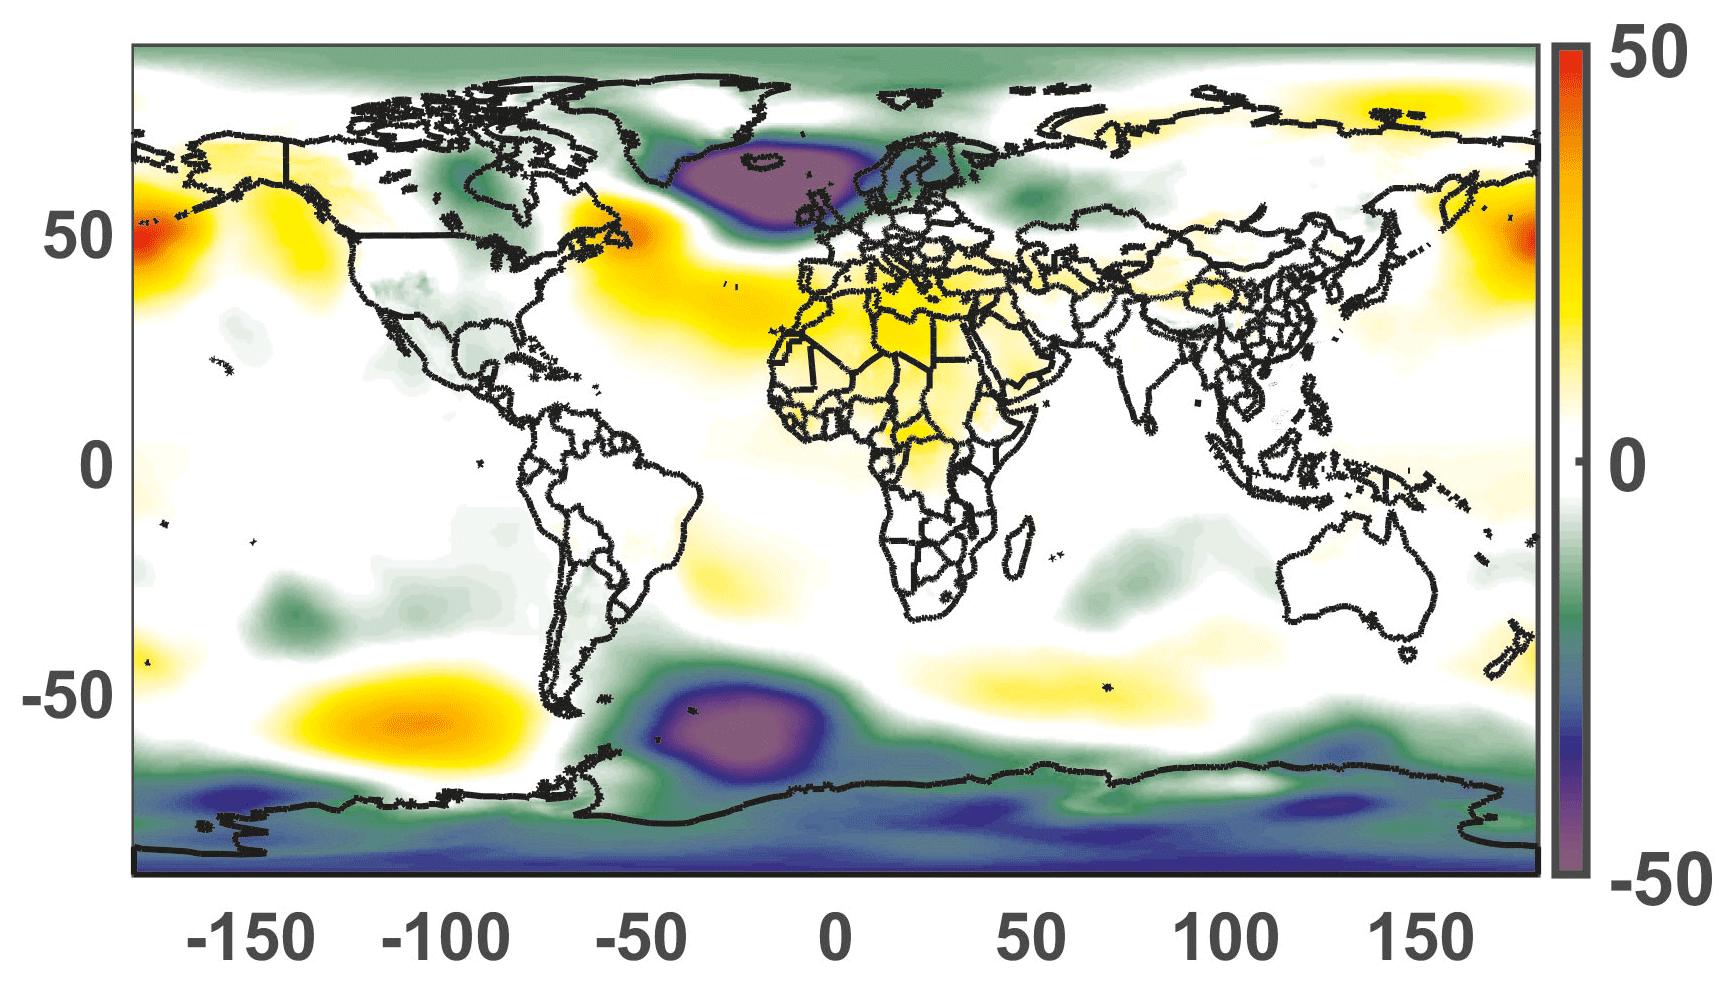
Figure 6Trends of winter sea level pressure during the 2002–2016 period (Pa yr−1).
Yin et al. (2015) found a significant negative correlation between winter haze and the East Asia winter monsoon from 1986 to 2010. Deterioration of air quality in China has been linked also to a weaker East Asia summer monsoon (Chin et al., 2012). The slacking of winds is observed not only for China (Sherman et al., 2017) but also for other countries including India (Gao et al., 2018b). Analyses using climate projections suggest that wind speeds in continental regions in the Northern Hemisphere will continue to decline under a warming climate (Karnauskas et al., 2018), imposing greater pressure on measures for future control of air pollution.
Combining field measurements and model simulations, we quantified the relative influences on PM2.5 concentrations in Beijing of anthropogenic emissions and meteorological conditions over the winters of 2002–2016. China's emission control strategies have been effective in reducing both mass concentrations of PM2.5 and the number of haze days. With fixed emissions, meteorological conditions over the study period should have resulted in an increase in haze in Beijing, but the strict emission control measures implemented by the government have suppressed the unfavorable influences associated with the recent climate. Using a statistical method, we concluded that RH2 and WS10 offer useful predictors for wintertime PM2.5 in Beijing, with the variations of WS10 in particularly good agreement with the increasing trend of PM2.5 concentrations with fixed emissions. The increasing trend of PM2.5 under unfavorable meteorological conditions was attributed further to the weakening of Aleutian Low and the EAWM. The variations of PM2.5 concentrations were investigated in this study for the urban Beijing region as were the changes in wind speeds. We do not exclude the possibility that the trend may have been influenced by other factors, including for example increases in surface roughness (Vautard et al, 2010).
The measurements and model simulations data can be accessed through contacting the corresponding authors.
The supplement related to this article is available online at: https://doi.org/10.5194/acp-20-1497-2020-supplement.
MG and MBM designed the study. MG performed model simulations and analyzed the data with help from SS, PS, JX, JKJ, and GRC. BZ and QZ provided the emission inventory. ZW, YW, ZL, DJ, JYX, and CL provided measurements. MG and MBM wrote the paper with inputs from all the other authors.
The authors declare that they have no conflict of interest.
This work was supported by the special fund of the State Key Joint Laboratory of Environment Simulation and Pollution Control (grant no. 19K03ESPCT), the Harvard Global Institute, the Natural Science Foundation of Guangdong Province (no. 2019A1515011633), and the National Natural Science Foundation of China (no. NSFC91543202).
This paper was edited by Xiaohong Liu and reviewed by Bin Zhu and three anonymous referees.
Bendel, R. B. and Afifi, A. A.: Comparison of stopping rules in forward “stepwise” regression, J. Am. Stat. Assoc., 72, 46–53, https://doi.org/10.1080/01621459.1977.10479905, 1977.
Chameides, W., Yu, H., Liu, S., Bergin, M., Xhou, X., Mearns, L., Wang, G., Kiang, C., Saylor, R. D., Luo, C., Huang, Y., Steiner, A., and Giorgi, F.: Study of the effects of atmospheric regional haze on agriculture?: enhance crop yields in China through emission controls?, P. Natl. Acad. Sci. USA, 96, 13626–13633, 1999.
Che, H., Zhang, X., Li, Y., Zhou, Z., Qu, J. J., and Hao, X.: Haze trends over the capital cities of 31 provinces in China, 1981-2005, Theor. Appl. Climatol., 97, 235–242, https://doi.org/10.1007/s00704-008-0059-8, 2009.
Chen, H. and Wang, H.: Haze days in North China and the associated atmospheric circulations based on daily visibility data from 1960 to 2012, J. Geophys. Res.-Atmos., 120, 5895–5909, https://doi.org/10.1002/2015JD023225, 2015.
Cheng, J., Su, J., Cui, T., Li, X., Dong, X., Sun, F., Yang, Y., Tong, D., Zheng, Y., Li, Y., Li, J., Zhang, Q., and He, K.: Dominant role of emission reduction in PM2.5 air quality improvement in Beijing during 2013–2017: a model-based decomposition analysis, Atmos. Chem. Phys., 19, 6125–6146, https://doi.org/10.5194/acp-19-6125-2019, 2019.
Cheng, Y., Zheng, G., Wei, C., Mu, Q., Zheng, B., Wang, Z., Gao, M., Zhang, Q., He, K., Carmichael, G., and Pöschl, U.: Reactive nitrogen chemistry in aerosol water as a source of sulfate during haze events in China, Sci. Adv., 2, e1601530, https://doi.org/10.1126/sciadv.1601530, 2016.
Chin, M.: Atmospheric science: Dirtier air from a weaker monsoon, Nat. Geosci., 5, 449–450, https://doi.org/10.1038/ngeo1513, 2012.
China State Council: Action Plan on Prevention and Control of Air Pollution, China State Council, Beijing, China, available at: http://www.gov.cn/zwgk/2013-09/12/content_2486773.htm (last access: 30 March 2019), 2013.
Ding, Y. H. and Liu, Y. J.: Analysis of long-term variations of fog and haze in China in recent 50 years and their relations with atmospheric humidity, Sci. China Earth Sci., 57, 36–46, https://doi.org/10.1007/s11430-013-4792-1, 2014.
Dockery, D. W., Pope, C. A., Xu, X., Spengler, J. D., Ware, J. H., Fay, M. E., Ferris Jr., B. G., and Speizer, F. E. : An association between air pollution and mortality in six U.S. cities, N. Engl. J. Med., 329, 1753–1759, 1993.
Gao, M., Carmichael, G. R., Wang, Y., Saide, P. E., Yu, M., Xin, J., Liu, Z., and Wang, Z.: Modeling study of the 2010 regional haze event in the North China Plain, Atmos. Chem. Phys., 16, 1673–1691, https://doi.org/10.5194/acp-16-1673-2016, 2016a.
Gao, M., Carmichael, G. R., Saide, P. E., Lu, Z., Yu, M., Streets, D. G., and Wang, Z.: Response of winter fine particulate matter concentrations to emission and meteorology changes in North China, Atmos. Chem. Phys., 16, 11837–11851, https://doi.org/10.5194/acp-16-11837-2016, 2016b.
Gao, M., Liu, Z., Wang, Y., Lu, X., Ji, D., Wang, L., Li, M., Wang, Z., Zhang, Q., and Carmichael, G. R.: Distinguishing the roles of meteorology, emission control measures, regional transport, and co-benefits of reduced aerosol feedbacks in “APEC Blue”, Atmos. Env., 167, 476–486, https://doi.org/10.1016/j.atmosenv.2017.08.054, 2017a.
Gao, M., Saide, P. E., Xin, J., Wang, Y., Liu, Z., Wang, Y., Wang, Z., Pagowski, M., Guttikunda, S. K., and Carmichael, G. R.: Estimates of Health Impacts and Radiative Forcing in Winter Haze in Eastern China through Constraints of Surface PM2.5 Predictions, Environ. Sci. Technol., 51, 2178–2185, https://doi.org/10.1021/acs.est.6b03745, 2017b.
Gao, M., Han, Z., Liu, Z., Li, M., Xin, J., Tao, Z., Li, J., Kang, J. E., Huang, K., Dong, X., Zhuang, B., Li, S., Ge, B., Wu, Q., Cheng, Y., Wang, Y., Lee, H. J., Kim, C. H., Fu, J. S., Wang, T., Chin, M., Woo, J. H., Zhang, Q., Wang, Z. and Carmichael, G. R.: Air quality and climate change, Topic 3 of the Model Inter-Comparison Study for Asia Phase III (MICS-Asia III) – Part 1: Overview and model evaluation, Atmos. Chem. Phys., 18(7), 4859–4884, https://doi.org/10.5194/acp-18-4859-2018, 2018a.
Gao, M., Ding, Y., Song, S., Lu, X., Chen, X., and McElroy, M. B.: Secular decrease of wind power potential in India associated with warming in the Indian Ocean, Sci. Adv., 4, eaat5256, https://doi.org/10.1126/sciadv.aat5256, 2018b.
Gao, Y., Liu, X., Zhao, C., and Zhang, M.: Emission controls versus meteorological conditions in determining aerosol concentrations in Beijing during the 2008 Olympic Games, Atmos. Chem. Phys., 11, 12437–12451, https://doi.org/10.5194/acp-11-12437-2011, 2011.
Guenther, A., Karl, T., Harley, P., Wiedinmyer, C., Palmer, P. I., and Geron, C.: Estimates of global terrestrial isoprene emissions using MEGAN (Model of Emissions of Gases and Aerosols from Nature), Atmos. Chem. Phys., 6, 3181–3210, https://doi.org/10.5194/acp-6-3181-2006, 2006.
He, H., Wang, Y., Ma, Q., Ma, J., Chu, B., Ji, D., Tang, G., Liu, C., Zhang, H., and Hao, J.: Mineral dust and NOx promote the conversion of SO2 to sulfate in heavy pollution days, Sci. Rep., 4, 1–6, https://doi.org/10.1038/srep04172, 2014.
Hung, H. M., Hsu, M. N., and Hoffmann, M. R.: Quantification of SO2Oxidation on Interfacial Surfaces of Acidic Micro-Droplets: Implication for Ambient Sulfate Formation, Environ. Sci. Technol., 52, 9079–9086, https://doi.org/10.1021/acs.est.8b01391, 2018.
Jhun, J. G. and Lee, E. J.: A new East Asian winter monsoon index and associated characteristics of the winter monsoon, J. Clim., 17, 711–726, https://doi.org/10.1175/1520-0442(2004)017<0711:ANEAWM>2.0.CO;2, 2004.
Jia, B., Wang, Y., Yao, Y., and Xie, Y.: A new indicator on the impact of large-scale circulation on wintertime particulate matter pollution over China, Atmos. Chem. Phys., 15, 11919–11929, https://doi.org/10.5194/acp-15-11919-2015, 2015.
Kang, H., Zhu, B., Gao, J., He, Y., Wang, H., Su, J., Pan, C., Zhu, T., and Yu, B.: Potential impacts of cold frontal passage on air quality over the Yangtze River Delta, China, Atmos. Chem. Phys., 19, 3673–3685, https://doi.org/10.5194/acp-19-3673-2019, 2019.
Karnauskas, K. B., Lundquist, J. K., and Zhang, L.: Southward shift of the global wind energy resource under high carbon dioxide emissions, Nat. Geosci., 11, 38–43, https://doi.org/10.1038/s41561-017-0029-9, 2018.
Li, L., Hoffmann, M. R., and Colussi, A. J.: Role of Nitrogen Dioxide in the Production of Sulfate during Chinese Haze-Aerosol Episodes, Environ. Sci. Technol., 52, 2686–2693, https://doi.org/10.1021/acs.est.7b05222, 2018.
Liu, T., Gong, S., He, J., Yu, M., Wang, Q., Li, H., Liu, W., Zhang, J., Li, L., Wang, X., Li, S., Lu, Y., Du, H., Wang, Y., Zhou, C., Liu, H., and Zhao, Q.: Attributions of meteorological and emission factors to the 2015 winter severe haze pollution episodes in China's Jing-Jin-Ji area, Atmos. Chem. Phys., 17, 2971–2980, https://doi.org/10.5194/acp-17-2971-2017, 2017.
Liu, Z., Hu, B., Wang, L., Wu, F., Gao, W., and Wang, Y.: Seasonal and diurnal variation in particulate matter (PM10 and PM25) at an urban site of beijing: Analyses from a 9-year study, Environ. Sci. Pollut. Res., 22, 627–642, https://doi.org/10.1007/s11356-014-3347-0, 2015.
Ministry of Environmental Protection of China and General Administration of Quality Supervision and Inspection Quarantine: Ambient air quality standard (GB 3095-2012), available at: http://chinacsrmap.org/CSRTool_Show_EN.asp?ID=285 (last access: 28 January 2020), 2012.
Ramanathan, V. and Carmichael, G.: Global and regional climate changes due to black carbon, Nat. Geosci., 1, 221–227, 2008.
Randerson, J. T., Van Der Werf, G. R., Giglio, L., Collatz, G. J., and Kasibhatla, P. S.: Global Fire Emissions Database, Version 4.1 (GFEDv4), https://doi.org/10.3334/ORNLDAAC/1293, 2015.
Shen, L., Jacob, D. J., Mickley, L. J., Wang, Y., and Zhang, Q.: Insignificant effect of climate change on winter haze pollution in Beijing, Atmos. Chem. Phys., 18, 17489–17496, https://doi.org/10.5194/acp-18-17489-2018, 2018.
Sherman, P., Chen, X., and McElroy, M. B.: Wind-generated Electricity in China: Decreasing Potential, Inter-annual Variability and Association with Changing Climate, Sci. Rep., 7, 16294, https://doi.org/10.1038/s41598-017-16073-2, 2017.
Song, S., Gao, M., Xu, W., Shao, J., Shi, G., Wang, S., Wang, Y., Sun, Y., and McElroy, M. B.: Fine-particle pH for Beijing winter haze as inferred from different thermodynamic equilibrium models, Atmos. Chem. Phys., 18, 7423–7438, https://doi.org/10.5194/acp-18-7423-2018, 2018.
Song, S., Gao, M., Xu, W., Sun, Y., Worsnop, D. R., Jayne, J. T., Zhang, Y., Zhu, L., Li, M., Zhou, Z., Cheng, C., Lv, Y., Wang, Y., Peng, W., Xu, X., Lin, N., Wang, Y., Wang, S., Munger, J. W., Jacob, D. J., and McElroy, M. B.: Possible heterogeneous chemistry of hydroxymethanesulfonate (HMS) in northern China winter haze, Atmos. Chem. Phys., 19, 1357–1371, https://doi.org/10.5194/acp-19-1357-2019, 2019.
Sun, Y., Wang, Z., Fu, P., Jiang, Q., Yang, T., Li, J., and Ge, X.: The impact of relative humidity on aerosol composition and evolution processes during wintertime in Beijing, China, Atmos. Environ., 77, 927–934, https://doi.org/10.1016/j.atmosenv.2013.06.019, 2013.
Vautard, R., Cattiaux, J., Yiou, P., Thépaut, J. N., and Ciais, P.: Northern Hemisphere atmospheric stilling partly attributed to an increase in surface roughness, Nat. Geosci., 3, 756–761, https://doi.org/10.1038/ngeo979, 2010.
Wang, H.-J. and Chen, H.-P.: Understanding the recent trend of haze pollution in eastern China: roles of climate change, Atmos. Chem. Phys., 16, 4205–4211, https://doi.org/10.5194/acp-16-4205-2016, 2016.
Wang, L., Ji, D., Li, Y., Gao, M., Tian, S., Wen, T., Liu, Z., Wang, L., Xu, P., Jiang, C., and Wang, Y.: The impact of relative humidity on the size distribution and chemical processes of major water-soluble inorganic ions in the megacity of Chongqing, China, Atmos. Res., 192, 19–29, https://doi.org/10.1016/j.atmosres.2017.03.016, 2017.
Wang, L. T., Wei, Z., Yang, J., Zhang, Y., Zhang, F. F., Su, J., Meng, C. C., and Zhang, Q.: The 2013 severe haze over southern Hebei, China: model evaluation, source apportionment, and policy implications, Atmos. Chem. Phys., 14, 3151–3173, https://doi.org/10.5194/acp-14-3151-2014, 2014.
Wang, X., Zhang, R., and Yu, W.: The Effects of PM2.5 Concentrations and Relative Humidity on Atmospheric Visibility in Beijing, J. Geophys. Res.-Atmos., 2235–2259, https://doi.org/10.1029/2018JD029269, 2019.
Wang, Y., Zhang, Y., Schauer, J. J., de Foy, B., Guo, B., and Zhang, Y.: Relative impact of emissions controls and meteorology on air pollution mitigation associated with the Asia-Pacific Economic Cooperation (APEC) conference in Beijing, China, Sci. Total Env., 571, 1467–1476, https://doi.org/10.1016/j.scitotenv.2016.06.215, 2016.
Wild, O., Zhu, X., and Prather, M. J.: Fast-J: Accurate simulation of in- and below-cloud photolysis in tropospheric chemical models, J. Atmos. Chem., 37, 245–282, https://doi.org/10.1029/2006JD008007, 2000.
Wu, D., Tie, X., Li, C., Ying, Z., Lau, A. K. H., Huang, J., Deng, X., and Bi, X.: An extremely low visibility event over the Guangzhou region: A case study, Atmos. Environ., 39, 6568–6577, https://doi.org/10.1016/j.atmosenv.2005.07.061, 2005.
Xing, J., Zhang, Y., Wang, S., Liu, X., Cheng, S., Zhang, Q., Chen, Y., Streets, D. G., Jang, C., Hao, J., and Wang, W.: Modeling study on the air quality impacts from emission reductions and atypical meteorological conditions during the 2008 Beijing Olympics, Atmos. Env., 45, 1786–1798, https://doi.org/10.1016/j.atmosenv.2011.01.025, 2011.
Yang, Y., Liao, H., and Lou, S.: Increase in winter haze over eastern China in recent decades: Roles of variations in meteorological parameters and anthropogenic emissions, J. Geophys. Res., 121, 13050–13065, https://doi.org/10.1002/2016JD025136, 2016.
Yin, Z., Wang, H., and Yuan, D.: Interdecadal increase of haze in winter over North China and the Huang-huai Area and the weakening of the East Asia Winter Monsoon, Chinese Sci. Bull., 60, 1395–1400, https://doi.org/10.1360/n972014-01348, 2015.
Zaveri, R. A., Easter, R. C., Fast, J. D., and Peters, L. K.: Model for Simulating Aerosol Interactions and Chemistry (MOSAIC), J. Geophys. Res., 113, D13204, https://doi.org/10.1029/2007JD008782, 2008.
Zaveri, R. A. and Peters, L. K.: A new lumped structure photochemical mechanism for large-scale applications, J. Geophys. Res., 104, 30387, https://doi.org/10.1029/1999JD900876, 1999.
Zhang, Z., Kim, S. J., and Ma, Z.: Significant decrease of PM2.5 in Beijing based on long-term records and Kolmogorov-Zurbenko filter approach, Aero. Air Qual. Res., 18, 711–718, https://doi.org/10.4209/aaqr.2017.01.0011, 2018.
Zheng, B., Tong, D., Li, M., Liu, F., Hong, C., Geng, G., Li, H., Li, X., Peng, L., Qi, J., Yan, L., Zhang, Y., Zhao, H., Zheng, Y., He, K., and Zhang, Q.: Trends in China's anthropogenic emissions since 2010 as the consequence of clean air actions, Atmos. Chem. Phys., 18, 14095–14111, https://doi.org/10.5194/acp-18-14095-2018, 2018.
Zhou, W., Gao, M., He, Y., Wang, Q., Xie, C., Xu, W., Zhao, J., Du, W., Qiu, Y., Lei, L., Fu, P., Wang, Z., Worsnop, D. R., Zhang, Q., and Sun, Y.: Response of aerosol chemistry to clean air action in Beijing, China: Insights from two-year ACSM measurements and model simulations, Environ. Polutt., 255, 113345, https://doi.org/10.1016/j.envpol.2019.113345, 2019.