the Creative Commons Attribution 4.0 License.
the Creative Commons Attribution 4.0 License.
 | 12 Nov 2020
Sensitivity analysis of the surface ozone and fine particulate matter to meteorological parameters in China
Zhihao Shi
Lin Huang
Jingyi Li
Hongliang Zhang
Jianlin Hu
Meteorological conditions play important roles in the formation of ozone (O3) and fine particulate matter (PM2.5). China has been suffering from serious regional air pollution problems, characterized by high concentrations of surface O3 and PM2.5. In this study, the Community Multiscale Air Quality (CMAQ) model was used to quantify the sensitivity of surface O3 and PM2.5 to key meteorological parameters in different regions of China. Six meteorological parameters were perturbed to create different meteorological conditions, including temperature (T), wind speed (WS), absolute humidity (AH), planetary boundary layer height (PBLH), cloud liquid water content (CLW) and precipitation (PCP). Air quality simulations under the perturbed meteorological conditions were conducted in China in January and July of 2013. The changes in O3 and PM2.5 concentrations due to individual meteorological parameters were then quantified. T has a great influence on the daily maximum 8 h average O3 (O3-8 h) concentrations, which leads to O3-8 h increases by 1.7 in January in Chongqing and 1.1 ppb K−1 in July in Beijing. WS, AH, and PBLH have a smaller but notable influence on O3-8 h with maximum change rates of 0.3 ppb %−1, −0.15 ppb %−1, and 0.14 ppb %−1, respectively. T, WS, AH, and PBLH have important effects on PM2.5 formation of both in January and July. In general, PM2.5 sensitivities are negative to T, WS, and PBLH and positive to AH in most regions of China. The sensitivities in January are much larger than in July. PM2.5 sensitivity to T, WS, PBLH, and AH in January can be up to −5 µg m−3 K−1, −3 µg m−3 %−1, −1 µg m−3 %−1, and +0.6 µg m−3 %−1, respectively, and in July it can be up to −2 µg m−3 K−1, −0.4 µg m−3 %−1, −0.14 µg m−3 %−1, and +0.3 µg m−3 %−1, respectively. Other meteorological factors (CLW and PCP) have negligible effects on O3-8 h (less than 0.01 ppb %−1) and PM2.5 (less than 0.01 µg m−3 %−1). The results suggest that surface O3 and PM2.5 concentrations can change significantly due to changes in meteorological parameters, and it is necessary to consider these effects when developing emission control strategies in different regions of China.
- Article
(5265 KB) - Full-text XML
-
Supplement
(6094 KB) - BibTeX
- EndNote


China has serious air pollution problems, and fine particulate matter (PM2.5) and ozone (O3) are the two major air pollutants (Lin et al., 2010; Hu et al., 2016; Lu et al., 2019; Wu et al., 2019). The annual average PM2.5 concentrations were higher than 50 µg m−3 in 26 out of the total 31 provincial capital cities in mainland China during 2013–2014 (Wang et al., 2014a), and the national fourth highest daily maximum 8 h average O3 (O3-8 h) was 86.0 ppb during the warm seasons (April–September) in 2013–2017, which is 6.3 %–30 % higher than that in other industrialized regions of the world (Lu et al., 2018). PM2.5 alone caused 0.87–1.36 million deaths every year in China, and long-term exposure to O3 was responsible for an extra 254 000 deaths (Cohen et al., 2017; Silver et al., 2018; Apte et al., 2015; Hu et al., 2017b). China has made remarkable improvement in air quality during recent years (Zhang et al., 2017; Zheng et al., 2018; Zhao et al., 2017); however, air pollution is still severe, making it the fourth-ranked health risk factor (Stanaway et al., 2018).
Surface PM2.5 and O3 concentrations are determined by atmospheric processes of emissions, transport and dispersion, chemical transformation (due to gas-phase, aqueous-phase, and aerosol chemistry), and dry and wet deposition. These processes are affected by meteorological conditions. Studies have shown that the surface O3 and PM2.5 concentrations are sensitive to different meteorological parameters. For example, Dawson et al. (2007b) investigated the sensitivity of surface O3 to different meteorological parameters in the eastern United States (US) using the comprehensive air quality model with extensions (CAMX). The results showed that temperature (T) had the greatest influence on daily O3-8 h of 0.34 ppb K−1, followed by absolute humidity (AH) of 0.025 ppb %−1. Bernard et al. (2001) also confirmed that T presented a notable positive correlation with the surface O3 concentration. The effects of meteorological parameters on PM2.5 are even more complicated. Tran and Mölders (2011) showed that elevated PM2.5 concentrations tended to occur under the conditions of calm wind, low T, and relative humidity in Fairbanks, Alaska. Olvera Alvarez et al. (2018) used a land use regression model to analyze the effects of different meteorological parameters on PM2.5 in El Paso, Texas, and obtained the same conclusion in winter, but in spring, the high PM2.5 level was associated with high wind speed (WS) and low humidity. Dawson et al. (2007a) studied the effects of individual meteorological parameters in the eastern US and found that PM2.5 concentration decreased markedly as the precipitation increased (PCP) in winter, but in summer, the main meteorological factors affecting the PM2.5 concentration were T, WS, and planetary boundary layer height (PBLH). Dawson et al. (2009) simulated the effects of climate change on regional and urban air quality in the eastern US and found that PM2.5 concentration decreased by 0.3 µg m−3 in January, mostly due to increasing PCP, and increased by 2.5 µg m−3 in July, largely due to decreasing PBLH and WS. Horne and Dabdub (2017) altered various meteorological parameters to investigate their effects on O3, PM2.5, and secondary organic aerosols (SOA) and found that the T predominated the effects of meteorology in California.
Many studies have proved that meteorological conditions play very important roles in air pollution events in China. Studies found that the pollutant concentrations could vary by up to several times, due to meteorological changes with the same emission sources (Zhang et al., 2010; Zheng et al., 2015; Cai et al., 2017; Ning et al., 2018; Yang et al., 2018; Li et al., 2019b; Xing et al., 2011; Liu et al., 2017). For example, Xing et al. (2011) studied the difference between the effects of 2007 and 2008 meteorological conditions on air quality during the 2008 Beijing Olympics. They found that higher humidity in August 2008 was beneficial to the formation of by up to ∼60 %, and lower T prevented the evaporation of by up to ∼60 %. Liu et al. (2017) reported that the monthly mean PM2.5 concentrations in the Jing–Jin–Ji (JJJ) area in December 2015 increased by 5 %–137 % due to the unfavorable weather conditions such as low WS and high humidity.
A few studies investigated the relationships between air quality and meteorological conditions in China. Zhang et al. (2015) conducted a correlation analysis between air quality and meteorology in three megacities: Beijing, Shanghai, and Guangzhou in China. The result showed that air pollutants were significantly negatively correlated with WS, and O3 had a positive correlation with T. Yin et al. (2016) found that the relationship between WS and PM2.5 has a complicated influence, with higher PM at low and high WS than in light to moderate winds in Beijing from 2008 to 2014. Xu et al. (2018) examined the variations of PM2.5 concentration in January 2017 in China compared to that in January 2016 and found that meteorological conditions of low WS, high humidity, low PBLH, and low PCP contributed to PM2.5 concentration worsening by 29.7 %, 42.6 %, and 7.9 % in the JJJ region, the Pearl River delta (PRD) region, and the Cheng–Yu Basin (CYB) region, respectively. Ma et al. (2019) analyzed the effects of meteorology on air pollution in the Yangtze River delta (YRD) region during 2014–2016 and found that PM2.5 was highly negatively correlated with WS, while O3 concentration was positively correlated with T but negatively related to relative humidity. Zhu et al. (2017) reported that the surface concentrations of O3 increased by 2–6 in January and 8–12 ppb in July 2014 in the PRD, mainly due to the increase in T and the decrease in NOx emissions.
These studies have investigated the impacts of meteorological conditions on PM2.5 and O3 in certain regions of China; however, quantitative sensitivity of PM2.5 and O3 to meteorological parameters has not been examined. The objective of this study is to quantify the sensitivity of O3 and PM2.5 to different meteorological parameters in winter and summer in different regions of China. The paper is constructed as follows: Sect. 2 describes the method used to estimate the sensitivity, and Sect. 3 presents the effects of each meteorological variable on O3 and PM2.5 in China and in five representative cities. Conclusions are then summarized in Sect. 4.
The sensitivity of O3 and PM2.5 associated with changes in meteorological parameters was quantified using the Community Multiscale Air Quality (CMAQ) model version 5.0.2. The meteorological parameters include T, WS, AH, PBLH, PCP, and cloud liquid water content (CLW). A base case was firstly simulated with meteorological fields predicted by the Weather Research and Forecasting (WRF) model v3.7.1 (https://www2.mmm.ucar.edu/wrf/users/) using the NCEP FNL Operational Model Global Tropospheric Analyses dataset as the initial and boundary conditions. The base case has been described in a previous study and the model configurations of the base case were reported there (Hu et al., 2015). The WRF-predicted meteorological parameters and the CMAQ-predicted surface O3 and PM2.5 have been evaluated against observations at 422 sites in 60 major cities in China, and the accuracy of the model performance has been validated (Hu et al., 2016).
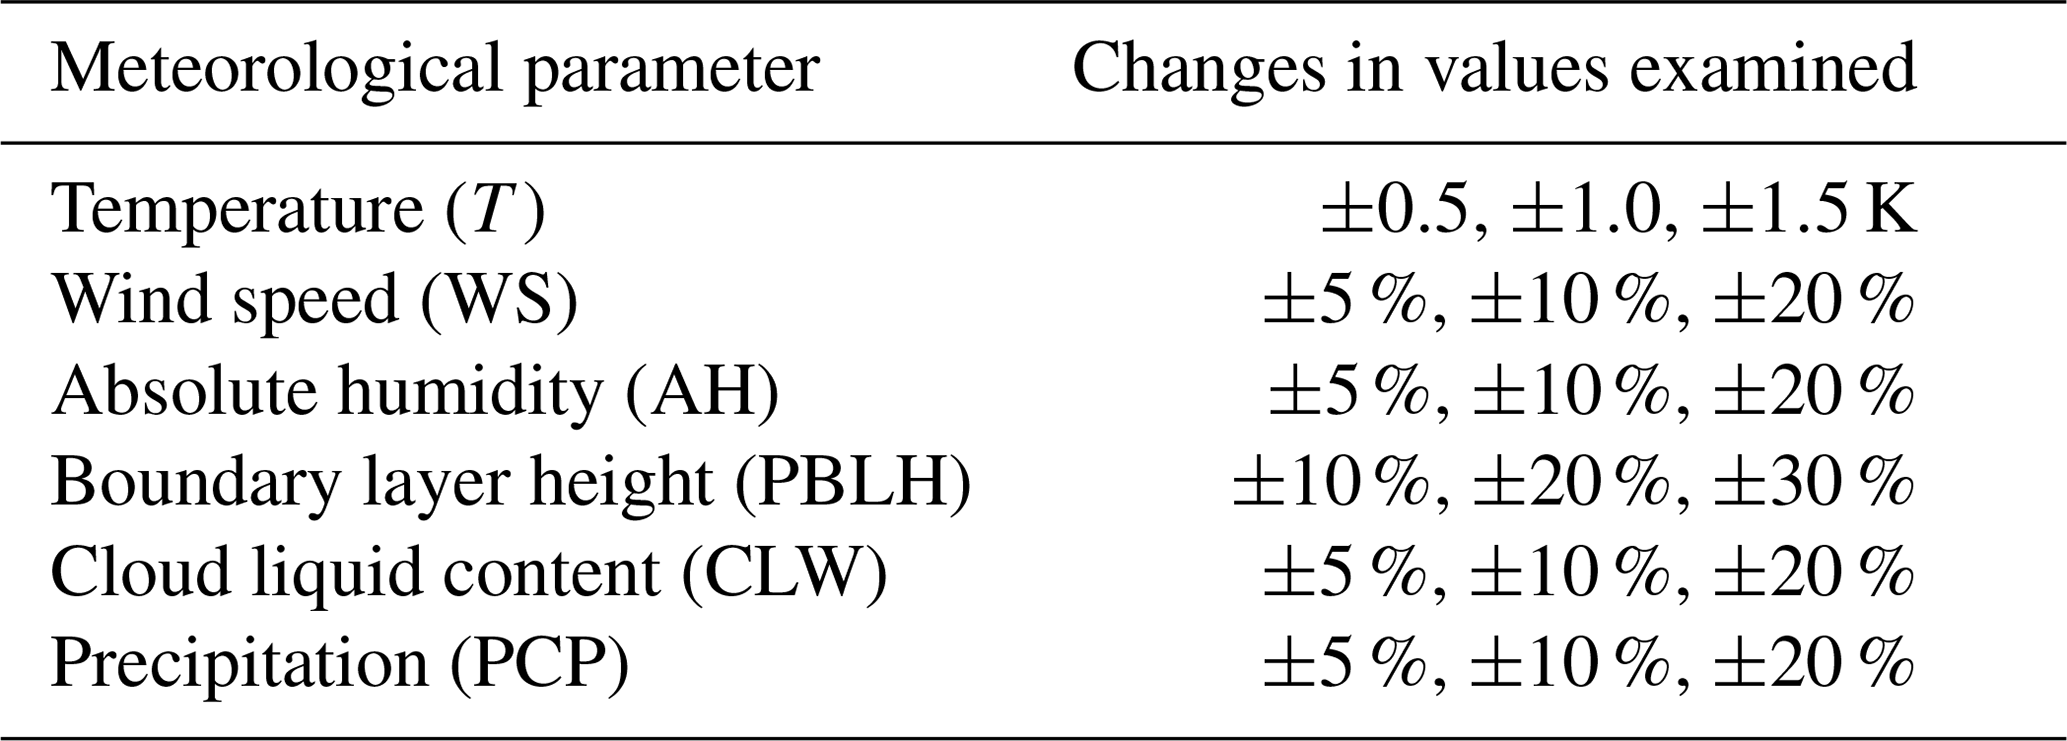
A suite of perturbation scenarios was created, and in each scenario, a certain meteorological parameter was perturbed to a certain extent. The details of the perturbation scenarios are listed in Table 1. Among those changes, T was absolute changes and other parameters were relative variations. The magnitude ranges of perturbations are based on the IPCC AR5 report and the study of Dawson et al. (2007a, 2007b), and the references therein. For each parameter, three positive and three negative perturbations were then designed within its range to have a more comprehensive examination of the sensitivity of PM2.5 and O3 to this parameter. All perturbations were implemented uniformly in space on the modeling domain and in time through the modeling periods. The perturbations on temperature, wind speed, and absolute humidity were made in all layers. To separate the effects of individual meteorological parameters, only one parameter was changed in each case, while all the other parameters were kept unchanged. Therefore, cloud dissipating or forming in response to changing temperature was not considered in the simulations. Please note that these types of perturbations are not what happens in the real world, where meteorological parameters are inter-linked. When perturbing horizontal wind speed, to avoid unphysical situations that mass would not be conserved, the vertical wind speed was adjusted in the vertical transport calculation based on the air density changes to conserve mass.
Then the CMAQ model was re-run to predict the air quality under the perturbed meteorological condition. The emissions and other inputs were kept unchanged in each perturbed meteorological scenario; therefore, the difference of O3 and PM2.5 concentrations between each of the perturbation case and the base case was due to the change in the specific meteorological parameter, and the sensitivity of O3 and PM2.5 to individual meteorological parameters could be quantitatively determined. It is worthwhile noting that some meteorological parameters could have significant impacts on emissions, such as the effect of T on biogenic VOC and soil NOx emissions, the cloud cover/convection on lightning NOx emissions, and the effect of T on power plant NOx emissions (high T leads to higher electricity demand in summer), which would affect air quality. Therefore, the sensitivities in this study only include the “direct” effects of individual meteorological parameters on air quality. A full evaluation of the impacts of climate/weather changes on air quality should consider effects of the emissions changes.
The modeling domain covers East Asia, including all of China, with a horizontal resolution of 36×36 km2. The base and perturbation cases were conducted in January and July in 2013, representing the winter and summer conditions, respectively. In addition to the regional analysis, five representative megacities were selected, i.e., Beijing, Shanghai, Guangzhou, Chongqing, and Xi'an (Fig. 1). These cities are located in the North China Plain (NCP), YRD, PRD, CYB, and Guanzhong Plain, respectively, where serious air pollution problems often occur. In this study, O3-8 h was used in the O3 analyses, and 24 h average PM2.5 was used in the PM2.5 analyses, if not specifically stated. The O3–T relationship is examined using the method in Rasmussen et al. (2012) in the five cities. Observed and predicted O3–T relationships were estimated using the daily observed and predicted O3-8 h concentrations and daily maximum T in July (O3 observations became available from March 2013 in China, so no O3 observations in January). The results are shown in Fig. S1 (in the Supplement). CMAQ predicts a positive O3–T relationship in most cities except in Beijing, and the model tends to underestimate the daily O3–T relationship except in Shanghai. The underestimation of O3–T by the CMAQ model in this study is consistent with the findings in Rasmussen et al. (2012). Please note that we only have 1-month data and that we use daily O3-8 h and daily maximum temperature in the evaluation, while a much more meaningful evaluation should be performed to use monthly average O3 and monthly average temperature over a long-term period (Rasmussen et al., 2012).
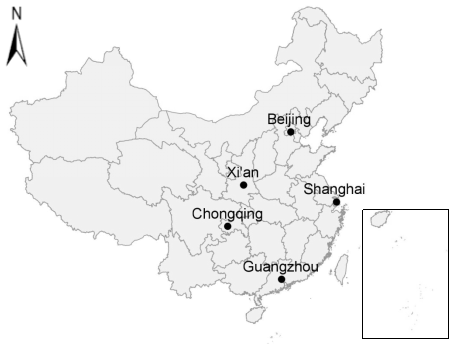
Figure 1Location map of China and the five cities.
3.1 Impacts of meteorological parameters on surface O3
Figure 2a and b show the spatial distribution of the predicted monthly average O3-8 h concentrations in January and July, respectively. In January, the highest average concentrations are about 70 ppb in the Sichuan basin, and the concentrations in South and East China are generally higher than those in North China. In July, the highest average concentrations are over 80 ppb in the large areas of NCP and YRD, CYB, and Guangzhou in the PRD.
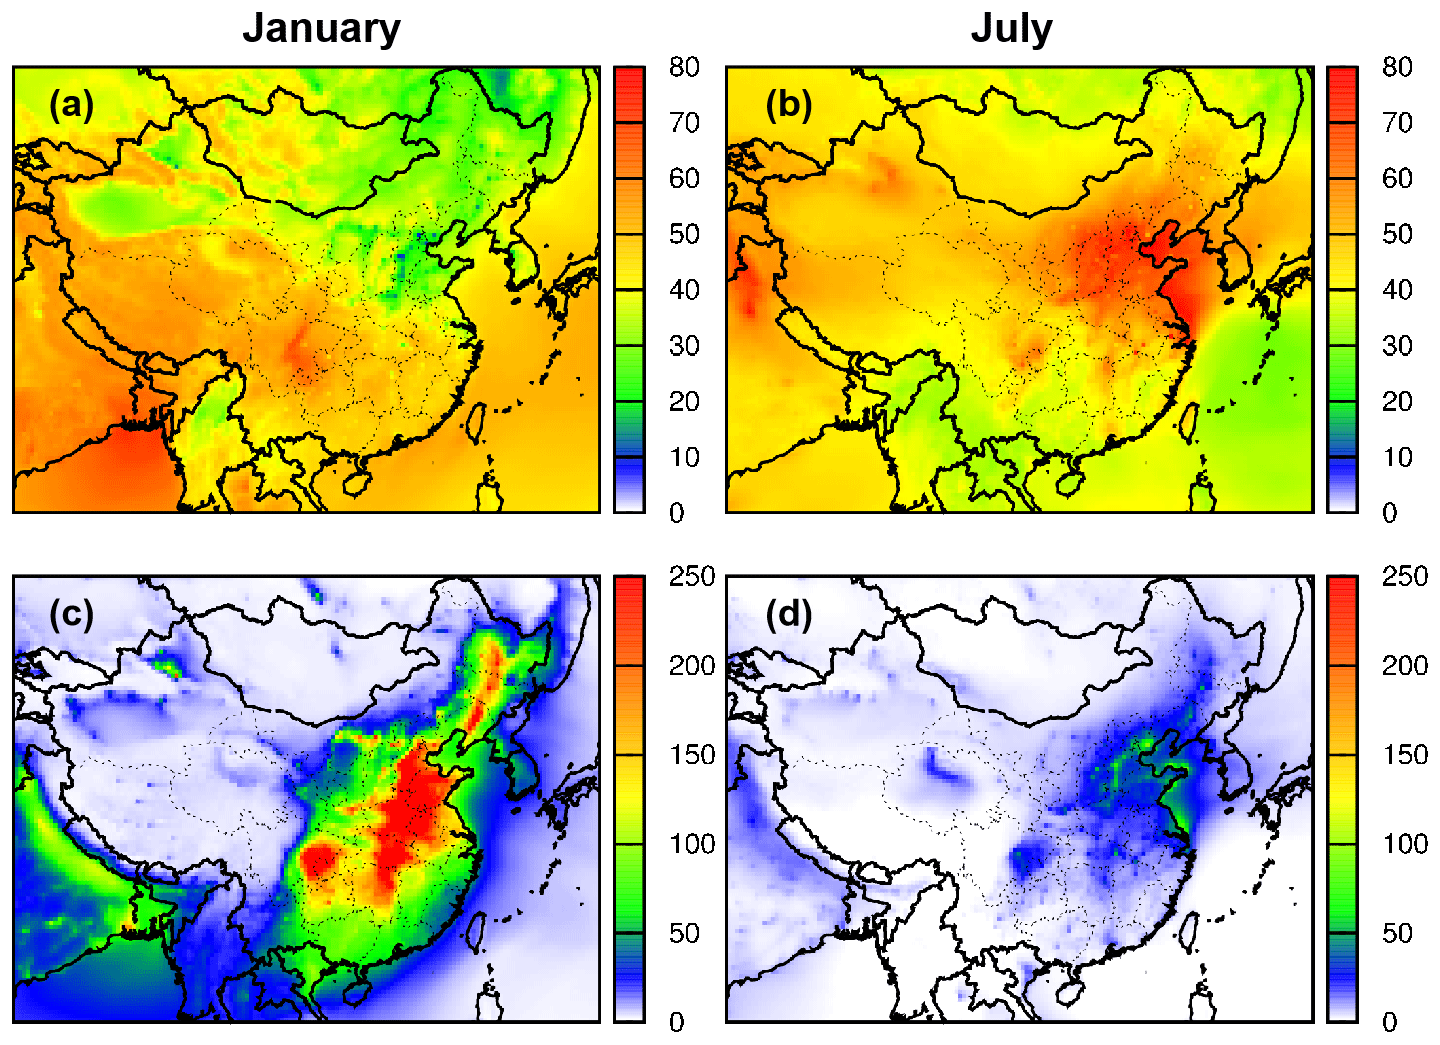
Figure 2Spatial distributions of monthly average O3-8 h (ppb) in (a) January and (b) July and monthly average PM2.5 (µg m−3) in (c) January and (d) July 2013.
Figure 3 shows the spatial distribution of the concentration changes in O3-8 h in January and July due to changes of T+1.0 K, WS − 10 %, AH + 10 %, PBLH − 20 %, CLW + 10 %, and PCP + 10 %, respectively. Figures S2–S4 show the results due to other extent changes in these parameters. When T increases by 1.0 K (Fig. 3a), O3-8 h increases by 1–2 ppb in most areas of East and Central China in January and in NCP and YRD in July, which is consistent with the high O3 spatial distribution in the base case (shown in Fig. 2). O3-8 h decreases by up to 4 ppb in January in Northeast China and by up to 2 ppb in the southwestern border of China and the East China Sea, which are the areas of low O3 concentrations (generally less than the background O3 concentration of 35 ppb). Therefore, the effect of T on O3 is dependent on the O3 formation regime. An increase in T promotes O3 formation chemistry in net O3 formation areas (O3 concentrations greater than 35 ppb) but accelerates O3 consumption chemistry in the net O3 loss areas (O3 concentrations less than 35 ppb).
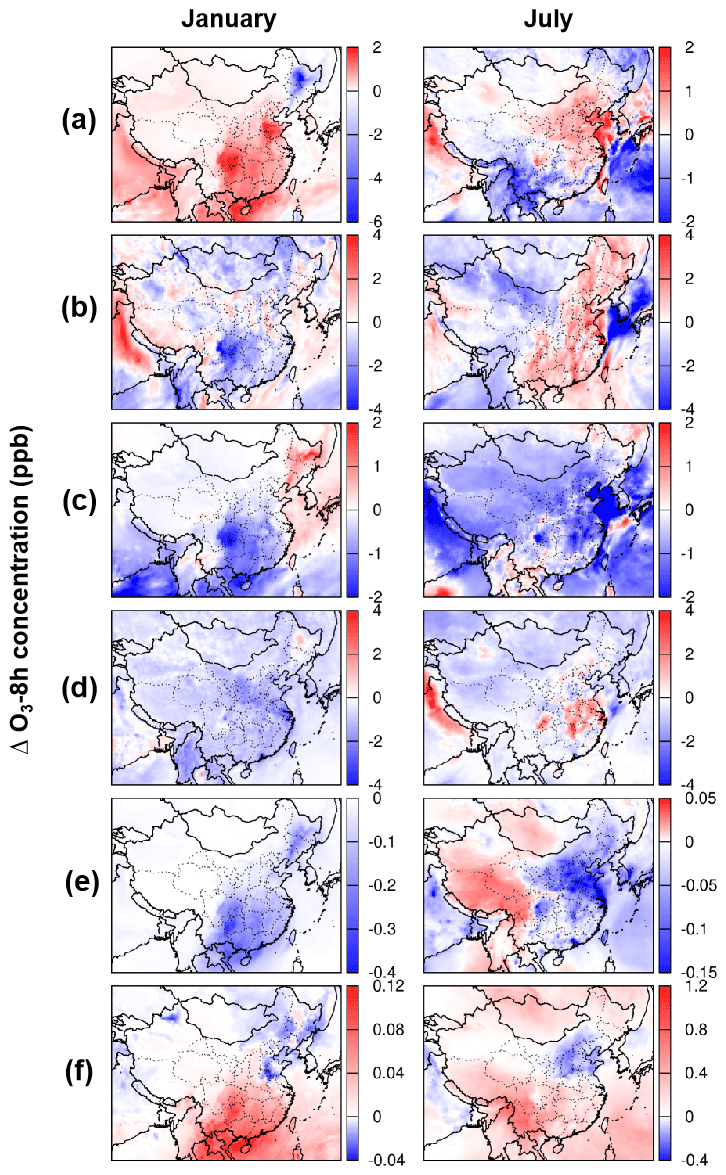
Figure 3Changes in monthly average O3-8 h (ppb) in January and July 2013 due to (a) T+1.0 K, (b) WS − 10 %, (c) AH + 10 %, (d) PBLH − 20 %, (e) CLW + 10 %, and (f) PCP + 10 %.
Figure 3b shows the differences of O3-8 h in January and July when WS is 10 % less than the base case in 2013. The influence of wind on O3 concentration is complex, but generally, slower WS decreases O3 in January in most parts of China, particularly in Sichuan by up to 3 ppb, but increases O3 in July by a few ppb over most areas in East and Central China. Therefore, the impact of WS on O3 appears opposite in winter and summer. Weaker winds slow down the dispersion of NOx and VOCs, which is conducive to O3 formation in summer when the vertical mixing is strong but increases O3 titration in the surface in winter due to weaker vertical mixing.
Figure 3c shows that the surface O3 is expected to decrease generally less than 1 ppb when AH increases by 10 % (relative change) in both January and July in most land areas of China except in the northeastern area. Figure 3d shows that a 20 % decrease in PBLH leads to O3-8 h decreases by a few ppb in most areas in January, while in July O3-8 h increases in the eastern and central regions, especially in YRD, CYB, and areas in Hubei–Hunan–Jiangxi in Central China. Sensitivity of O3 to CLW and PCP is relatively small. Figure 3e demonstrates that O3-8 h changes by −0.03 to 0.03 ppb in January and July for a 10 % increase in CLW. Figure 3f demonstrates that a 10 % increase in PCP results in −0.1 to 0.2 ppb changes in O3-8 h. O3 changes due to the six meteorological factors with different extents of perturbation. Figs. S2–S4 show the similar trends and spatial patterns.
3.2 Impacts of meteorological parameters on surface PM2.5
Figure 2c and d show the spatial distribution of the monthly average surface PM2.5 concentrations in January and July. PM2.5 in January reaches over 200 µg m−3 in JJJ, SYB, Central China, and urban areas in Northeast China. PM2.5 is much lower in July, generally lower than 50 µg m−3, but is high (up to 70 µg m−3) in areas in the JJJ, YRD, and Central China regions.
Figure 4 shows the spatial distribution of PM2.5 changes due to the same changes in meteorological factors, as in Fig. 3. The PM2.5 results of other cases of the sensitivity study are shown in Figs. S5–S7 of the Supplement. The results indicate that in January, a 1.0 K increase in T leads to an up to 5–6 µg m−3 decrease in PM2.5 in JJJ and Central China; in July, a 1.0 K increase in T causes a PM2.5 increase by about 1 µg m−3 in South China but a decrease by 1–3 µg m−3 in JJJ and the eastern coastal region. A 10 % decrease in WS causes a PM2.5 increase to over 40 µg m−3 in January and up to 5 µg m−3 in July. A 10 % relative increase in AH leads to a PM2.5 increase of up to 6 µg m−3 in January and up to 2 µg m−3 in JJJ and northeastern regions but a slight decrease of less than 1 µg m−3 in South China in July. A 20 % decrease in PBLH causes PM2.5 increases by up to 20 µg m−3 in January and up to 4 µg m−3 in July. The impact of CLW and PCP on PM2.5 is small, and generally an increase in CLW increases surface PM2.5 and an increase in PCP decreases PM2.5.

Figure 4Changes in monthly average PM2.5 concentration (µg m−3) in January and July 2013 due to (a) T+1.0 K, (b) WS − 10 %, (c) AH + 10 %, (d) PBLH − 20 %, (e) CLW + 10 %, and (f) PCP + 10 %.
The changes in the total PM2.5 mass concentrations are determined by the changes in the chemical components of PM2.5. Figure S9 displays the fraction of PM2.5 species, elemental carbon (EC), primary organic carbon (POC), secondary organic aerosol (SOA), sulfate (), nitrate (), and ammonium (), in five representative cities. Secondary inorganic aerosols (, , ) are the major PM components, accounting for over 50 % of PM2.5 in January and about 40 % in July. Figures 5 and 6 show the changes in the major PM2.5 components due to the same changes in meteorological factors as in Fig. 4 in January and in July, respectively. The results show that the effects of the meteorological parameters on the total PM2.5 (shown in Fig. 4) are mainly due to their effects on , , and in January and due to the changes in , , , and SOA in July. In general, PBLH, WS, and PCP are negatively correlated with , , and formation, but AH and CLW are positively correlated with these components. SOA concentrations are much higher in July than in January due to the contribution from biogenic emissions (Hu et al., 2017a). SOA formation is affected by reaction rates (positively affected by T), availability of oxidants (such as changes in O3), and hydrogen ion strength (affected by changes in , , and ). SOA concentrations mainly increase in South China.
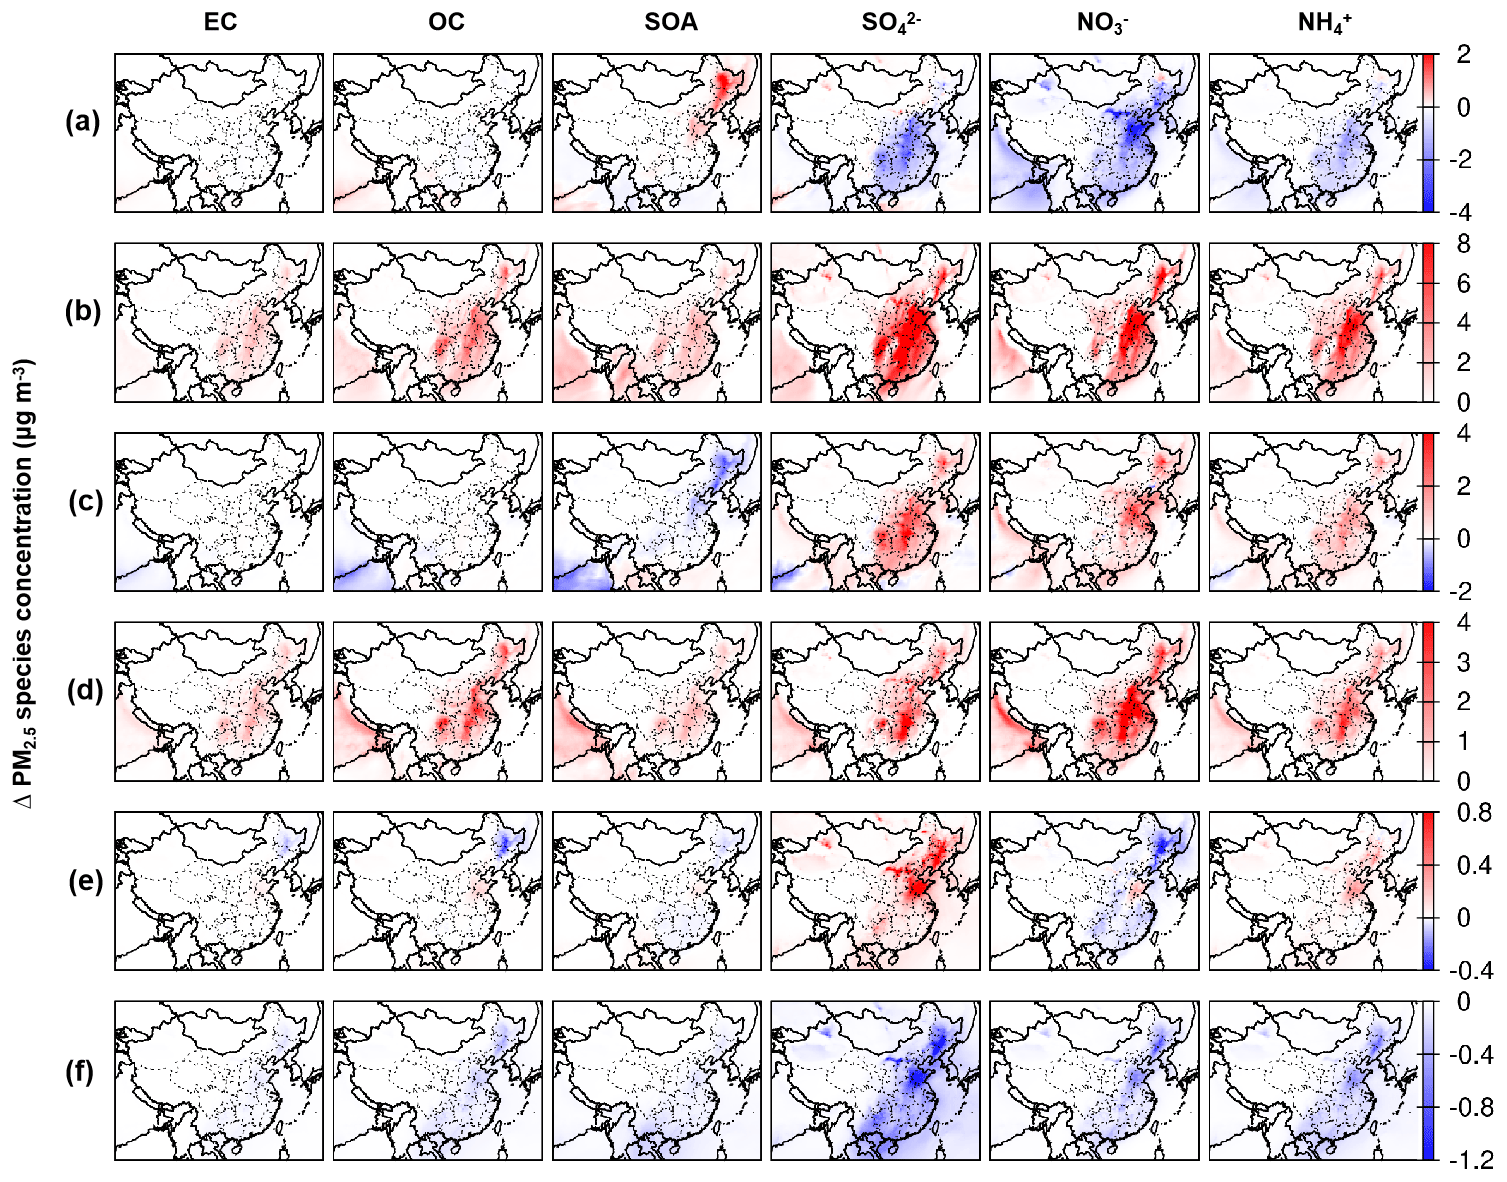
Figure 5Changes in monthly average PM2.5 component concentration (µg m−3) in January due to (a) T+1.0 K, (b) WS − 10 %, (c) AH + 10 %, (d) PBLH − 20 %, (e) CLW + 10 %, and (f) PCP + 10 %.
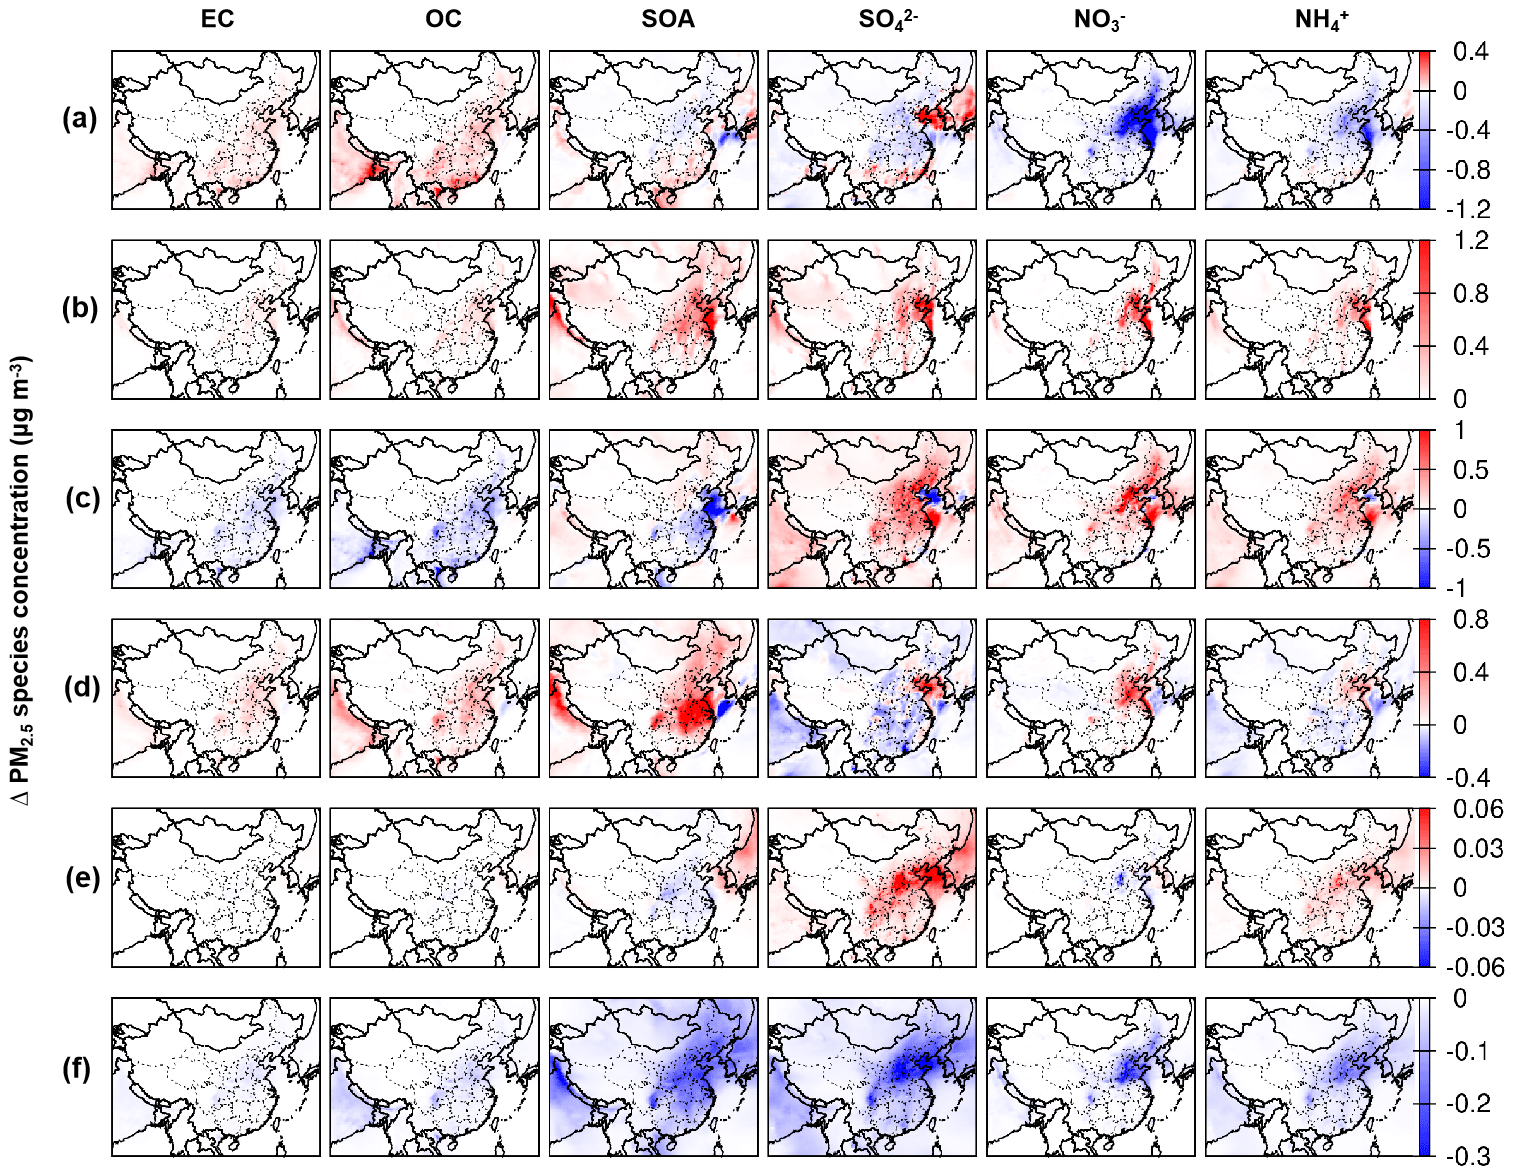
Figure 6Changes in monthly average PM2.5 component concentration (µg m−3) in July due to (a) T+1.0 K, (b) WS − 10 %, (c) AH + 10 %, (d) PBLH − 20 %, (e) CLW + 10 %, and (f) PCP + 10 %.
It is worthwhile noting the effects of T on and (changes in are determined by changes in and ). In both January and July, an increase in T decreases and in the major areas of East China. The decrease is expected because volatile NH4NO3 favors more the gas phase at higher temperature, and this result is consistent with studies in other regions (Dawson et al., 2007a; Horne and Dabdub, 2017). is found to increase with T increase in those studies because of faster gas- and aqueous-phase reactions of . However, our finding of in China is the opposite. The CMAQ-Sulfur Tracking Model (CMAQ-STM) was further used to track the formation from different processes. The results confirm that the production from the gas and aqueous phases increases with T increase, but meanwhile production from heterogeneous reactions is reduced more when T is increased. Heterogeneous formation has been proposed as a major formation pathway during China haze events (Gen et al., 2019; Huang et al., 2019; Li et al., 2019a; Wang et al., 2014b), and in this study it accounts for up to ∼75 % of total production. The treatment of heterogeneous formation currently is modeled as a surface-controlled uptake process in which the formation rate is determined by the aerosol surface area and the uptake coefficient of SO2 on the particle surface (Ying et al., 2014). When T is increased, the particle surface area decreases (as particle mass concentration decreases due to a combined effect of other components), resulting in a decrease in the heterogeneous formation.
An additional simulation was run to illustrate the combined effects of perturbations in all meteorological parameters (T+1.0 K, WS − 10 %, AH + 10 %, PBLH − 20 %, CLW + 10 %, and PCP + 10 %) on O3 and PM2.5 in January and July. The results are shown in Fig. S8. The average O3-8 h concentration in this combined-change simulation dropped by ∼2 ppb in January, except in the northeast. In July, O3 in East China and the Sichuan basin rose by 2 ppb. The changes in PM2.5 resulting from this combined-change simulation were significantly higher compared to the base-case concentrations and even increased by up to 50 µg m−3 in January.
3.3 Quantitative sensitivity of O3 and PM2.5 to individual meteorology parameters
The quantitative sensitivity of O3 and PM2.5 concentrations to individual meteorological parameters is calculated by linear fitting of the changes in monthly average concentrations under all of the six perturbed cases of the meteorological parameter. Figures S10–S12 in the Supplement show the calculation examples of T, WS, and AH on O3 at the five major cities of Beijing, Chongqing, Guangzhou, Shanghai and Xi'an, and Figs. S13–S15 show the examples for the PM2.5 cases. Figure 7 demonstrates the sensitivities of O3-8 h and PM2.5 and its components to each meteorological parameter in the five cities. In January, T has a positive impact on O3 in all cities, and the largest impact is in Chongqing with a rate of +1.69 ppb K−1. In July, O3 also shows a strong positive sensitivity to T in Beijing with +1.06 and in Shanghai with +0.98 ppb K−1 but has a small negative sensitivity (−0.15 ppb K−1) in Xi'an and a moderate negative sensitivity (−0.74 ppb K−1) in Guangzhou. The O3 sensitivity to T in Guangzhou in July shows a highly nonlinear trend and is very different from other cities (Fig. S10c). More studies are needed to investigate the effects of T on O3 pollution in the YRD region during summertime. WS and PBLH both have positive effects on O3-8 h in January: the effects vary significantly among cities, with 0.004 ppb %−1–0.3 ppb %−1 for WS and 0.04 ppb %−1–0.14 ppb %−1 for PBLH. AH has a negative effect on O3-8 h in January, ranging from −0.01 ppb %−1 to −0.15 ppb %−1, but in July, the impacts of WS, AH, and PBLH are negative in most cities, with ranges of −0.05 ppb %−1 to −0.18 ppb %−1, −0.05 ppb %−1 to −0.13 ppb %−1, and −0.02 ppb %−1 to −0.07 ppb %−1, respectively. Generally speaking, T, WS, AH, and PBLH led to rather larger O3 changes. The sensitivity of O3 to CLW and PCP is even minimal (less than 0.1 ppb %−1) and mostly negative.
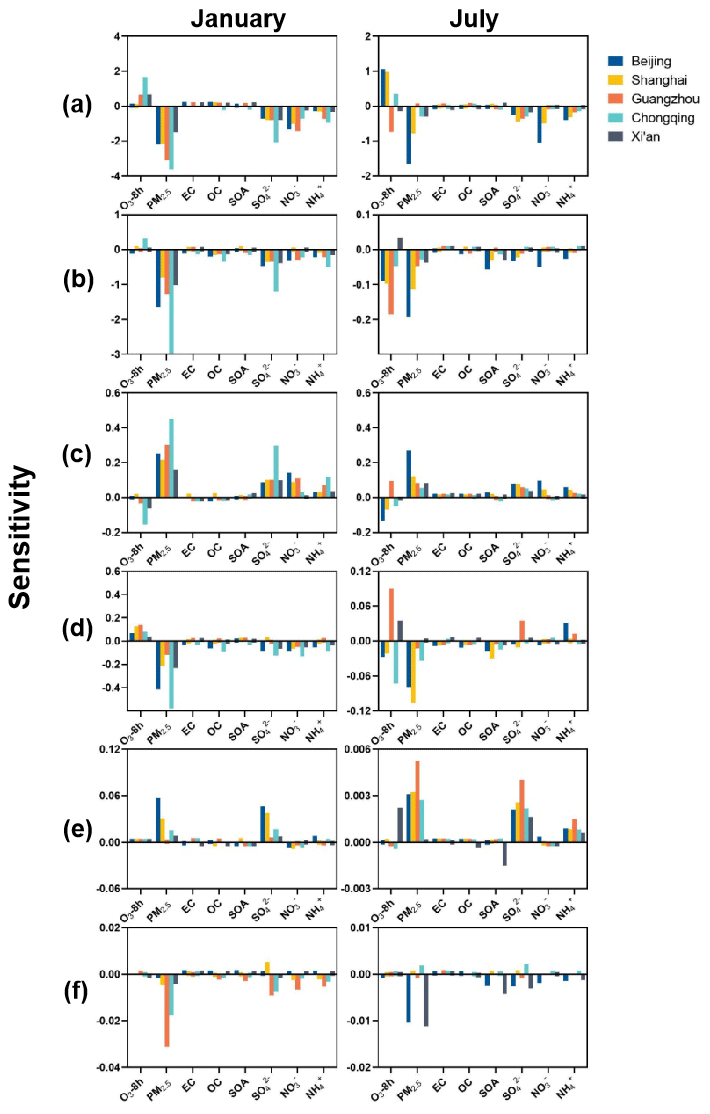
Figure 7Sensitivity of O3-8 h, PM2.5, and its components to the meteorological parameter of (a) T, (b) WS, (c) AH, (d) PBLH, (e) CLW, and (f) PCP in five cities in China. The unit of sensitivity is ppb K−1 for O3-8 h to T and is ppb %−1 for O3-8 h to other meteorological parameters; the unit is µg m−3 K−1 for PM2.5 and its components to T and is µg m−3 %−1 for PM2.5 and its components to other meteorological parameters.
Negative sensitivities are found for surface PM2.5 concentrations to T, WS, PBLH, and PCP and positive sensitivities for PM2.5 to AH and CLW. The sensitivity of T in the five cities ranges from −1.5 to −3.6 µg m−3 K−1 in January and −0.3 to −1.65 µg m−3 K−1 in July. PM2.5 is also very sensitive to WS in January, with a range of −0.8 µg m−3 %−1 to −2.97 µg m−3 %−1, while the sensitivity (−0.03 µg m−3 %−1 to −0.19 µg m−3 %−1) becomes much smaller in July. The sensitivity to PBLH is −0.12 µg m−3 %−1 to −0.58 µg m−3 %−1 in January and −0.003 µg m−3 %−1 to −0.23 µg m−3 %−1 in July. The sensitivity to AH is 0.16 µg m−3 %−1 to 0.30 µg m−3 %−1 in January and 0.05 µg m−3 %−1 to 0.27 µg m−3 %−1 in July. Sensitivity to CLW and PCP is small in January and July, mostly less than 0.01 µg m−3 %−1. The PM2.5 sensitivities can be explained by the major components of , , and in January and by , , , and SOA in July.
Figure 8 shows the spatial variations of the sensitivity of O3-8 h and PM2.5 to the meteorological parameters. The sensitivity of O3-8 h to temperature is more significant in Sichuan and southern provinces of China in January, and, in the NCP and YRD in July, up to +2 ppb K−1 in both January and July. O3-8 h sensitivity to WS is diverse in space and is generally positive in Sichuan and southern provinces in January, and it is negative in East China but positive in West China. O3-8 h sensitivity to AH is generally negative in both months in most regions of China, except the northeast in January and southwest in July. O3-8 h sensitivity to PBLH is mostly positive in January but becomes negative in the YRD, CYB, and NCP and Central China in July. O3-8 h sensitivity to CLW and PCP is negligible.
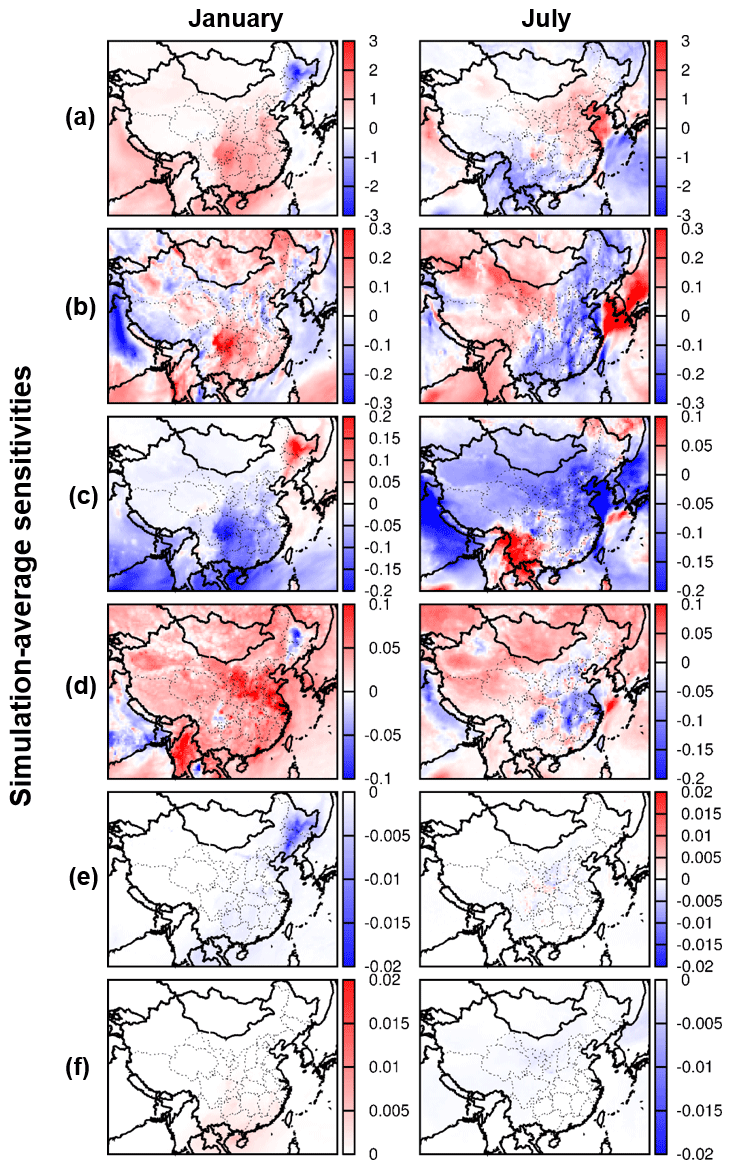
Figure 8Sensitivity of the O3-8 h mean to meteorological perturbations (a) T, (b) WS, (c) AH, (d) PBLH, (e) CLW, and (f) PCP in China. The value in T is measured in ppb K−1 and others in ppb %−1.
Figure 9 displays the spatial variations of the sensitivity of surface PM2.5 to the meteorological parameters. PM2.5 sensitivities to the meteorological parameters are more consistent in January and July than the cases of O3, i.e., negative sensitivity to T, WS, PBLH, and PCP and positive to AH and CLW in most regions of China in both months. On the other hand, PM2.5 sensitivities are more profound in January than in July. PM2.5 sensitivity to T is up to −5 µg m−3 K−1 in January and up to −2 µg m−3 K−1 in July. PM2.5 sensitivity to WS is up to −3 µg m−3 %−1 in January and up to −0.4 µg m−3 %−1 in July. PM2.5 sensitivity to PBLH is up to −1 µg m−3 %−1 in January and up to −0.14 µg m−3 %−1 in July. PM2.5 sensitivity to AH is up to +0.6 µg m−3 %−1 in January and up to 0.3 µg m−3 %−1 in July. The sensitivities to CLW and PCP are small compared to the other four meteorological parameters. PM2.5 sensitivity to T is negative in most land areas of China in January and in the NCP and YRD in July because of the negative effects of T on , , and , as discussed in previous sections. PM2.5 sensitivity to T is positive in South China in July due to more SOA with higher T.
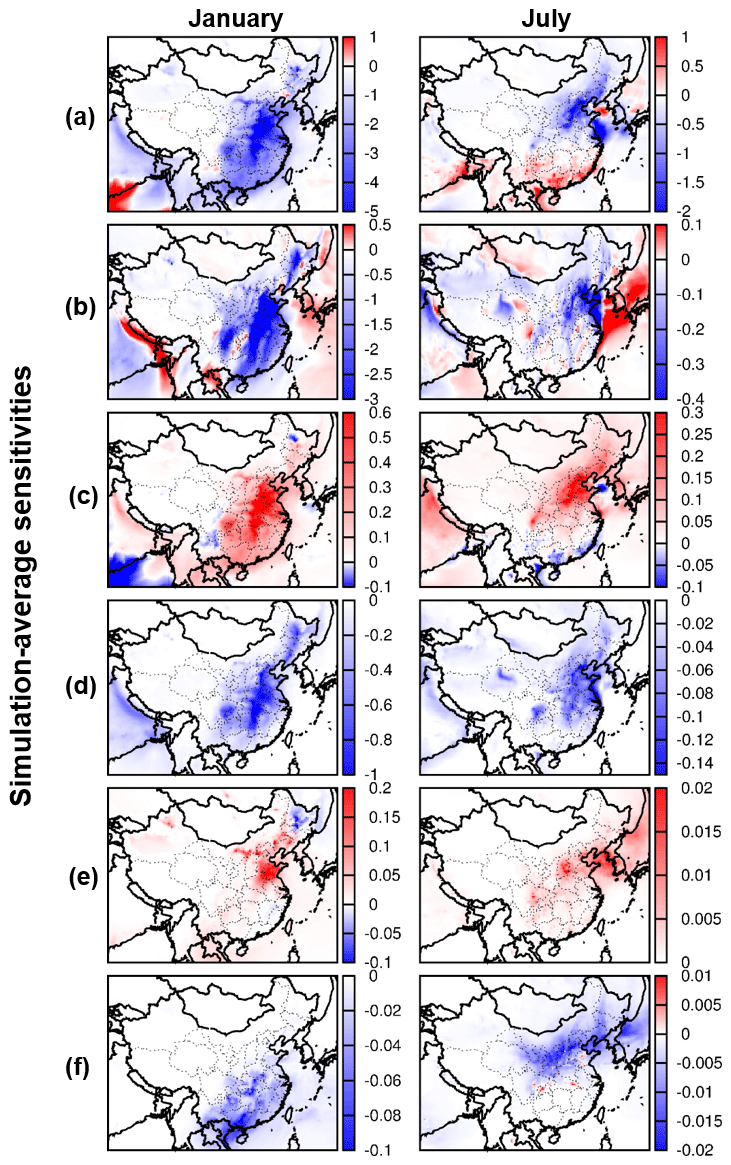
Figure 9Sensitivity of the PM2.5 mean to meteorological perturbations (a) T, (b) WS, (c) AH, (d) PBLH, (e) CLW, and (f) PCP in China. The value in T is measured in µg m−3 K−1 and others in µg m−3 %−1.
Meteorological conditions can have a great influence on surface O3 and PM2.5 concentrations. In this study, the sensitivities of O3-8 h and PM2.5 to T, WS, AH, PBLH, PCP, and CLW are quantitatively estimated in January and July, respectively, in China. The response of O3-8 h to T is important and the sensitivity can be up to +2 ppb K−1 in both January and July, and the sensitivity is dependent on the O3 chemistry formation or loss regime, i.e., positive in the net O3 formation areas and negative in the O3 consumption areas. In general, PM2.5 sensitivities are negative to T, WS, PBLH, and PCP and positive to AH and CLW in most regions of China in both January and July. The sensitivities in January are much larger than in July. PM2.5 sensitivities to T, WS, AH, and PBLH are important. The PM2.5 sensitivities to these meteorological parameters are through major effects on , , , and SOA. The sensitivities of O3 and PM2.5 to CLW and PCP are negligible. The results show that O3 and PM2.5 concentrations in China are greatly affected by meteorological conditions; therefore, changes in these meteorological parameters due to climate change or inter-annual meteorological variations could potentially alter O3 and PM2.5 concentrations significantly, and it should consider these effects when developing emission control strategies. The results also show that the O3 and PM2.5 sensitivities to meteorological parameters have substantial spatial variations. Future studies can further investigate how the changes in meteorological conditions affect the effectiveness of emission control plans in reaching the designed air quality objectives in the different regions of China.
All of the modeling results will be available online after we publish the paper. The data used in this paper can be provided upon request from the corresponding author: Jianlin Hu (jianlinhu@nuist.edu.cn).
The supplement related to this article is available online at: https://doi.org/10.5194/acp-20-13455-2020-supplement.
ZS and JH designed the research. ZS, LH, JL, QY, HZ, and JH contributed to model development and configuration. ZS, LH, JL, and JH analyzed the data. ZS prepared the manuscript and all the coauthors helped improve the manuscript.
The authors declare that they have no conflict of interest.
This work has been supported by the National Key R&D Program of China (2016YFC0203500 and 2018YFC0213800), the National Natural Science Foundation of China (41975162, 41675125 and 41705102), and the Jiangsu Environmental Protection Research Project (2016015).
This research has been supported by the National Key R&D Program of China (grant no. 2016YFC0203500, and 2018YFC0213800), the National Natural Science Foundation of China (grant nos. 41975162, 41675125, and 41705102), and the Jiangsu Environmental Protection Research Project (grant no. 2016015).
This paper was edited by Jianping Huang and reviewed by two anonymous referees.
Apte, J. S., Marshall, J. D., Cohen, A. J., and Brauer, M.: Addressing global mortality from ambient PM2.5, Environ. Sci. Technol., 49, 8057–8066, 2015.
Bernard, S. M., Samet, J. M., Grambsch, A., Ebi, K. L., and Romieu, I.: The potential impacts of climate variability and change on air pollution-related health effects in the United States, Environ. Health Persp., 109, 199–209, 2001.
Cai, W., Li, K., Liao, H., Wang, H., and Wu, L.: Weather conditions conducive to Beijing severe haze more frequent under climate change, Nat. Clim. Change, 7, 257–262, 2017.
Cohen, A. J., Brauer, M., Burnett, R., Anderson, H. R., Frostad, J., Estep, K., Balakrishnan, K., Brunekreef, B., Dandona, L., Dandona, R., Feigin, V., Freedman, G., Hubbell, B., Jobling, A., Kan, H., Knibbs, L., Liu, Y., Martin, R., Morawska, L., Pope, C. A., Shin, H., Straif, K., Shaddick, G., Thomas, M., van Dingenen, R., van Donkelaar, A., Vos, T., Murray, C. J. L., and Forouzanfar, M. H.: Estimates and 25 year trends of the global burden of disease attributable to ambient air pollution: an analysis of data from the Global Burden of Diseases Study 2015, Lancet, 389, 1907–1918, https://doi.org/10.1016/S0140-6736(17)30505-6, 2017.
Dawson, J. P., Adams, P. J., and Pandis, S. N.: Sensitivity of PM2.5 to climate in the Eastern US: a modeling case study, Atmos. Chem. Phys., 7, 4295–4309, https://doi.org/10.5194/acp-7-4295-2007, 2007a.
Dawson, J. P., Adams, P. J., and Pandis, S. N.: Sensitivity of ozone to summertime climate in the eastern USA: A modeling case study, Atmos. Environ., 41, 1494–1511, 2007b.
Dawson, J. P., Racherla, P. N., Lynn, B. H., Adams, P. J., and Pandis, S. N.: Impacts of climate change on regional and urban air quality in the eastern United States: Role of meteorology, J. Geophys. Res.-Atmos., 114, D05308, https://doi.org/10.1029/2008JD009849, 2009.
Gen, M. S., Zhang, R. F., Huang, D. D., Li, Y. J., and Chan, C. K.: Heterogeneous SO2 Oxidation in Sulfate Formation by Photolysis of Particulate Nitrate, Environ. Sci. Tech. Let., 6, 86–91, 2019.
Horne, J. R. and Dabdub, D.: Impact of global climate change on ozone, particulate matter, and secondary organic aerosol concentrations in California: A model perturbation analysis, Atmos. Environ., 153, 1–17, https://doi.org/10.1016/j.atmosenv.2016.12.049, 2017.
Hu, J., Wu, L., Zheng, B., Zhang, Q., He, K., Chang, Q., Li, X., Yang, F., Ying, Q., and Zhang, H.: Source contributions and regional transport of primary particulate matter in China, Environ. Pollut., 207, 31–42, https://doi.org/10.1016/j.envpol.2015.08.037, 2015.
Hu, J., Chen, J., Ying, Q., and Zhang, H.: One-year simulation of ozone and particulate matter in China using WRF/CMAQ modeling system, Atmos. Chem. Phys., 16, 10333–10350, https://doi.org/10.5194/acp-16-10333-2016, 2016.
Hu, J., Wang, P., Ying, Q., Zhang, H., Chen, J., Ge, X., Li, X., Jiang, J., Wang, S., Zhang, J., Zhao, Y., and Zhang, Y.: Modeling biogenic and anthropogenic secondary organic aerosol in China, Atmos. Chem. Phys., 17, 77–92, https://doi.org/10.5194/acp-17-77-2017, 2017a.
Hu, J. L., Huang, L., Chen, M. D., Liao, H., Zhang, H. L., Wang, S. X., Zhang, Q., and Ying, Q.: Premature Mortality Attributable to Particulate Matter in China: Source Contributions and Responses to Reductions, Environ. Sci. Technol., 51, 9950–9959, https://doi.org/10.1021/acs.est.7b03193, 2017b.
Huang, L., An, J., Koo, B., Yarwood, G., Yan, R., Wang, Y., Huang, C., and Li, L.: Sulfate formation during heavy winter haze events and the potential contribution from heterogeneous SO2 + NO2 reactions in the Yangtze River Delta region, China, Atmos. Chem. Phys., 19, 14311–14328, https://doi.org/10.5194/acp-19-14311-2019, 2019.
Li, M. M., Wang, T. J., Xie, M., Li, S., Zhuang, B. L., Huang, X., Chen, P. L., Zhao, M., and Liu, J. E.: Formation and Evolution Mechanisms for Two Extreme Haze Episodes in the Yangtze River Delta Region of China During Winter 2016, J. Geophys. Res.-Atmos., 124, 3607–3623, 2019a.
Li, X., Gao, Z., Li, Y., Gao, C. Y., Ren, J., and Zhang, X.: Meteorological conditions for severe foggy haze episodes over north China in 2016–2017 winter, Atmos. Environ., 199, 284–298, 2019b.
Lin, J., Nielsen, C. P., Zhao, Y., Lei, Y., Liu, Y., and McElroy, M. B.: Recent Changes in Particulate Air Pollution over China Observed from Space and the Ground: Effectiveness of Emission Control, Environ. Sci. Technol., 44, 7771–7776, https://doi.org/10.1021/es101094t, 2010.
Liu, T., Gong, S., He, J., Yu, M., Wang, Q., Li, H., Liu, W., Zhang, J., Li, L., Wang, X., Li, S., Lu, Y., Du, H., Wang, Y., Zhou, C., Liu, H., and Zhao, Q.: Attributions of meteorological and emission factors to the 2015 winter severe haze pollution episodes in China's Jing-Jin-Ji area, Atmos. Chem. Phys., 17, 2971–2980, https://doi.org/10.5194/acp-17-2971-2017, 2017.
Lu, H., Lyu, X., Cheng, H., Ling, Z., and Guo, H.: Overview on the spatial-temporal characteristics of the ozone formation regime in China, Environm. Sci.: Processes and Impacts, 21, 916–929, ,https://doi.org/10.1039/C9EM00098D, 2019.
Lu, X., Hong, J., Zhang, L., Cooper, O. R., Schultz, M. G., Xu, X., Wang, T., Gao, M., Zhao, Y., and Zhang, Y.: Severe Surface Ozone Pollution in China: A Global Perspective, Environ. Sci. Tech. Let., 5, 487–494, https://doi.org/10.1021/acs.estlett.8b00366, 2018.
Ma, T., Duan, F., He, K., Qin, Y., Tong, D., Geng, G., Liu, X., Li, H., Yang, S., Ye, S., Xu, B., Zhang, Q., and Ma, Y.: Air pollution characteristics and their relationship with emissions and meteorology in the Yangtze River Delta region during 2014–2016, J. Environ. Sci., 83, 8–20, https://doi.org/10.1016/j.jes.2019.02.031, 2019.
Ning, G., Wang, S., Yim, S. H. L., Li, J., Hu, Y., Shang, Z., Wang, J., and Wang, J.: Impact of low-pressure systems on winter heavy air pollution in the northwest Sichuan Basin, China, Atmos. Chem. Phys., 18, 13601–13615, https://doi.org/10.5194/acp-18-13601-2018, 2018.
Olvera Alvarez, H. A., Myers, O. B., Weigel, M., and Armijos, R. X.: The value of using seasonality and meteorological variables to model intra-urban PM2.5 variation, Atmos. Environ., 182, 1–8, https://doi.org/10.1016/j.atmosenv.2018.03.007, 2018.
Rasmussen, D., Fiore, A., Naik, V., Horowitz, L., McGinnis, S., and Schultz, M.: Surface ozone-temperature relationships in the eastern US: A monthly climatology for evaluating chemistry-climate models, Atmos. Environ., 47, 142–153, 2012.
Silver, B., Reddington, C. L., Arnold, S. R., and Spracklen, D. V.: Substantial changes in air pollution across China during 2015–2017, Environ. Res. Lett., 13, 114012, https://doi.org/10.1088/1748-9326/aae718, 2018.
Stanaway, J. D., Afshin, A., Gakidou, E., Lim, S. S., Abate, D., Abate, K. H., Abbafati, C., Abbasi, N., Abbastabar, H., and Abd-Allah, F. J. T. L.: Global, regional, and national comparative risk assessment of 84 behavioural, environmental and occupational, and metabolic risks or clusters of risks for 195 countries and territories, 1990–2017: a systematic analysis for the Global Burden of Disease Study 2017, The Lancet, 392, 1923–1994, 2018.
Tran, H. N. Q. and Mölders, N.: Investigations on meteorological conditions for elevated PM2.5 in Fairbanks, Alaska, Atmos. Res., 99, 39–49, https://doi.org/10.1016/j.atmosres.2010.08.028, 2011.
Wang, Y., Ying, Q., Hu, J., and Zhang, H.: Spatial and temporal variations of six criteria air pollutants in 31 provincial capital cities in China during 2013–2014, Environ. Int., 73, 413–422, https://doi.org/10.1016/j.envint.2014.08.016, 2014a.
Wang, Y. X., Zhang, Q. Q., Jiang, J. K., Zhou, W., Wang, B. Y., He, K. B., Duan, F. K., Zhang, Q., Philip, S., and Xie, Y. Y.: Enhanced sulfate formation during China's severe winter haze episode in January 2013 missing from current models, J. Geophys. Res.-Atmos., 119, 10425–10440, https://doi.org/10.1002/2013JD021426, 2014b.
Wu, C., Hu, W., Zhou, M., Li, S., and Jia, Y.: Data-driven regionalization for analyzing the spatiotemporal characteristics of air quality in China, Atmos. Environ., 203, 172–182, https://doi.org/10.1016/j.atmosenv.2019.01.048, 2019.
Xing, J., Zhang, Y., Wang, S., Liu, X., Cheng, S., Zhang, Q., Chen, Y., Streets, D. G., Jang, C., Hao, J., and Wang, W.: Modeling study on the air quality impacts from emission reductions and atypical meteorological conditions during the 2008 Beijing Olympics, Atmos. Environ., 45, 1786–1798, https://doi.org/10.1016/j.atmosenv.2011.01.025, 2011.
Xu, Y., Xue, W., Lei, Y., Zhao, Y., Cheng, S., Ren, Z., and Huang, Q.: Impact of Meteorological Conditions on PM2.5 Pollution in China during Winter, Atmosphere-Basel, 9, 429, https://doi.org/10.3390/atmos9110429, 2018.
Yang, Y., Zheng, X., Gao, Z., Wang, H., Wang, T., Li, Y., Lau, G. N., and Yim, S. H.: Long-term trends of persistent synoptic circulation events in planetary boundary layer and their relationships with haze pollution in winter half year over eastern China, J. Geophys. Res.-Atmos., 123, 10991–11007, https://doi.org/10.1029/2018JD028982, 2018.
Yin, Q., Wang, J., Hu, M., and Wong, H.: Estimation of daily PM2.5 concentration and its relationship with meteorological conditions in Beijing, J. Environ. Sci., 48, 161–168, https://doi.org/10.1016/j.jes.2016.03.024, 2016.
Ying, Q., Cureño, I. V., Chen, G., Ali, S., Zhang, H., Malloy, M., Bravo, H. A., and Sosa, R.: Impacts of Stabilized Criegee Intermediates, surface uptake processes and higher aromatic secondary organic aerosol yields on predicted PM2.5 concentrations in the Mexico City Metropolitan Zone, Atmos. Environ., 94, 438–447, https://doi.org/10.1016/j.atmosenv.2014.05.056, 2014.
Zhang, H., Wang, Y., Hu, J., Ying, Q., and Hu, X.-M.: Relationships between meteorological parameters and criteria air pollutants in three megacities in China, Environ. Res., 140, 242–254, https://doi.org/10.1016/j.envres.2015.04.004, 2015.
Zhang, J., Reid, J. S., Alfaro-Contreras, R., and Xian, P.: Has China been exporting less particulate air pollution over the past decade?, Geophys. Res. Lett., 44, 2941–2948, https://doi.org/10.1002/2017gl072617, 2017.
Zhang, L., Liao, H., and Li, J.: Impacts of Asian summer monsoon on seasonal and interannual variations of aerosols over eastern China, J. Geophys. Res.-Atmos., 115, D00K05, https://doi.org/10.1029/2009JD012299, 2010.
Zhao, B., Jiang, J. H., Gu, Y., Diner, D., Worden, J., Liou, K.-N., Su, H., Xing, J., Garay, M., and Huang, L.: Decadal-scale trends in regional aerosol particle properties and their linkage to emission changes, Environ. Res. Lett., 12, 054021, https://doi.org/10.1088/1748-9326/aa6cb2, 2017.
Zheng, B., Chevallier, F., Ciais, P., Yin, Y., Deeter, M. N., Worden, H. M., Wang, Y., Zhang, Q., and He, K.: Rapid decline in carbon monoxide emissions and export from East Asia between years 2005 and 2016, Environ. Res. Lett., 13, 044007, https://doi.org/10.1088/1748-9326/aab2b3, 2018.
Zheng, X. Y., Fu, Y. F., Yang, Y. J., and Liu, G. S.: Impact of atmospheric circulations on aerosol distributions in autumn over eastern China: observational evidence, Atmos. Chem. Phys., 15, 12115–12138, https://doi.org/10.5194/acp-15-12115-2015, 2015.
Zhu, K., Xie, M., Wang, T., Cai, J., Li, S., and Feng, W.: A modeling study on the effect of urban land surface forcing to regional meteorology and air quality over South China, Atmos. Enviro., 152, 389–404, https://doi.org/10.1016/j.atmosenv.2016.12.053, 2017.