the Creative Commons Attribution 4.0 License.
the Creative Commons Attribution 4.0 License.
 | 12 Nov 2020
Technical Note: Effect of varying the λ = 185 and 254 nm photon flux ratio on radical generation in oxidation flow reactors
Jake P. Rowe
William H. Brune
Oxidation flow reactors (OFRs) complement environmental smog chambers as a portable, low-cost technique for exposing atmospheric compounds to oxidants such as ozone (O3), nitrate (NO3) radicals, and hydroxyl (OH) radicals. OH is most commonly generated in OFRs via photolysis of externally added O3 at λ=254 nm (OFR254) or combined photolysis of O2 and H2O at λ=185 nm plus photolysis of O3 at λ=254 nm (OFR185) using low-pressure mercury (Hg) lamps. Whereas OFR254 radical generation is influenced by [O3], [H2O], and photon flux at λ=254 nm (I254), OFR185 radical generation is influenced by [O2], [H2O], I185, and I254. Because the ratio of photon fluxes, I185:I254, is OFR-specific, OFR185 performance varies between different systems even when constant [H2O] and I254 are maintained. Thus, calibrations and models developed for one OFR185 system may not be applicable to another. To investigate these issues, we conducted a series of experiments in which I185:I254 emitted by Hg lamps installed in an OFR was systematically varied by fusing multiple segments of lamp quartz together that either transmitted or blocked λ=185 nm radiation. Integrated OH exposure (OHexp) values achieved for each lamp type were obtained using the tracer decay method as a function of UV intensity, humidity, residence time, and external OH reactivity (OHRext). Following previous related studies, a photochemical box model was used to develop a generalized OHexp estimation equation as a function of [H2O], [O3], and OHRext that is applicable for to 0.1.
- Article
(2269 KB) - Full-text XML
-
Supplement
(633 KB) - BibTeX
- EndNote


Hydroxyl (OH) radicals govern the concentrations of most atmospheric organic compounds, including those that lead to secondary organic aerosol (SOA) formation. For decades, environmental chambers and oxidation flow reactors (OFRs) have been used to simulate atmospheric aging processes through the controlled exposure of trace gases and aerosols to OH radicals. Environmental chamber studies are typically conducted over experimental timescales and equivalent atmospheric exposure times of hours up to 1 or 2 d. OFRs with residence times on the order of minutes achieve multiple days of equivalent atmospheric OH exposure (OHexp), typically through the following reactions:
This method is referred to as OFR254 and relies on addition of externally generated O3 at the OFR inlet. In some cases, OFRs have additionally employed the secondary λ=185 nm emission line present in low-pressure mercury (Hg) lamps to generate radicals from the following reactions in addition to those listed above that are employed in OFR254:
This method is referred to as OFR185. Recent modeling studies suggest that OFR185 is less affected by experimental artifacts than OFR254 such as SOA photolysis and unwanted reactions with non-OH oxidants (Peng et al., 2016, 2018, 2019). Additionally, OFR185 is often more practical than OFR254 for application in field studies because O2 and H2O that are already present in ambient air are photolyzed to generate O3, OH, and HO2, whereas OFR254 requires addition of compressed air or O2 for external O3 generation and additional inlet plumbing to inject it at the OFR inlet. However, because the λ=185 nm photon flux (I185) is influenced by OFR-specific design considerations that are mainly related to the Hg lamps being used, concentrations of O3, HO, and generated using OFR185 are potentially variable between different systems even when constant [H2O], [N2O], and I254 are established. Thus, calibrations and models developed for one OFR185 system may not be applicable to another, making it more difficult to evaluate results or plan experiments. To investigate these issues, we designed a series of experiments in which I185:I254 was systematically varied over a wide range using multiple novel Hg lamp configurations. Integrated OHexp values were obtained as a function of OFR185 conditions, and a photochemical box model was used to develop a system of OHexp estimation equations that are applicable to OFR185 systems with to 0.1.
Experiments were conducted using an Aerodyne Potential Aerosol Mass (PAM) OFR, which is a horizontal aluminum cylindrical chamber (46 cm long × 22 cm ID) operated in continuous flow mode (Lambe et al., 2011). A simplified schematic is shown in Fig. S1 in the Supplement. The H2O mixing ratio in the OFR was controlled by passing the carrier gas through a Nafion humidifier (Perma Pure LLC) or heated recirculating water bath (Neslab Instruments, Inc.) and then diluting with different levels of dry carrier gas at the OFR inlet. A photodetector (TOCON-C6, sglux GmbH) and a relative humidity and temperature (RH/T) sensor (SHT21, Sensiron) were mounted in the exit flange of the OFR. Across all experiments, [H2O] ranged from 0.03 % (1 % RH at 25.3 ∘C) to 3.9 % (88 % RH at 30.9 ∘C). The O3 mixing ratio at the exit of the OFR was measured with a UV ozone analyzer (106-M, 2B Technologies).
2.1 HOx generation
HOx was produced via Reactions (R1)–(R2) and (R4)–(R7). Photolysis of H2O, O2, and O3 in the OFR was achieved using two low-pressure Hg fluorescent lamps (Light Sources, Inc.) that were isolated from the sample flow using type 214 quartz sleeves. Nitrogen purge gas was flowed over the lamps to prevent O3 buildup between the lamps and sleeves. A fluorescent dimming ballast was used to regulate current applied to the lamps. The dimming voltage applied to the ballast ranged from 0.8 to 10 V direct current (DC). Below ∼0.8 V DC, the lamp output was unstable due to flickering, and 10 V DC was the maximum control voltage permitted by the ballast.
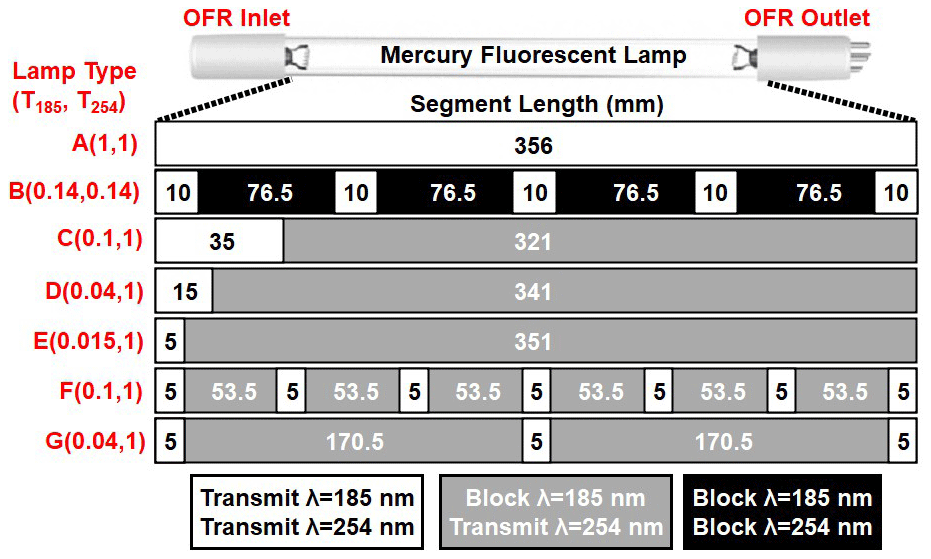
Figure 1Low-pressure Hg fluorescent lamp types used in this study. Each lamp type contains 356 mm of quartz material that either transmits both λ=185 and 254 nm radiation (white, T185=1), blocks λ=185 nm and transmits λ=254 nm radiation (grey, T185=0), or blocks both λ=185 and 254 nm radiation (black, T185=0).
Figure 1 shows the Hg fluorescent lamp configurations that were used in this study. Lamp type A is an ozone-producing low-pressure Hg germicidal fluorescent lamp (GPH436T5VH/4P, Light Sources Inc.) in which type 214 quartz that transmits λ=185 and 254 nm radiation is present along the entire 356 mm arc length. This lamp type is a standard component of the Aerodyne PAM OFR. The relative transmissivity of λ=185 nm radiation (T185) in lamp type A is thus equal to 1. Lamp type B is equivalent to lamp type A with added segments of opaque heat shrink tubing applied to approximately 86 % of the arc length (T185≈0.14; see also Fig. S2 in the Supplement) to reduce I185 and I254 to levels below what is achievable using the ballast dimming voltage. A different type of quartz is available (type 219) that blocks λ=185 nm and transmits λ=254 nm radiation (T185=0). To cover the largest possible range of I185:I254, lamp types C, D, and E (GPH436T5L/VH/4P 90/10, GPH436T5L/VH/4P 96/4, and GPH436T5L/VH/4P 98.5/1.5; Light Sources, Inc.) fused one segment each of quartz with T185=0 and T185=1 to provide reduced I185 relative to lamp type A while maintaining constant I254. Finally, to evaluate the effect of lamp design at fixed T185 and I254, lamp types F and G contain the same ratios of T185=0 and T185=1 quartz as types C and D, but with 5 and 13 total segments instead of 2 segments. These different designs isolate the effect of discretized λ=185 nm irradiation across the entire arc length of the lamp vs. having all λ=185 nm radiation near the entrance of the OFR.
2.2 OHexp characterization studies
OHexp, defined here as the product of the average OH concentration and the mean OFR residence time (τOFR), was characterized by measuring the decay of carbon monoxide (CO) and/or sulfur dioxide (SO2) tracers using Thermo 48i and 43i CO and SO2 analyzers (e.g., Lambe et al., 2011). Tracer mixing ratios entering the reactor were 6–9 ppmv for CO and 288–629 ppbv for SO2, each diluted from separate gas mixtures of 0.5 % CO or SO2 in N2 (Praxair). The corresponding total external OH reactivity (OHRext), which is the summed product of each tracer mixing ratio and its bimolecular OH rate coefficient, ranged from approximately 9 to 64 s−1. Tracer concentrations were allowed to stabilize before initiating OHexp measurements, during which steady-state levels of CO and/or SO2 were obtained with the lamps turned off. Then, the lamps were turned on, and tracer concentrations were allowed to equilibrate before being measured at illuminated steady-state conditions.
In most experiments, the calculated mean residence time was τOFR=124 s, which was obtained from the ratio of the internal OFR volume (≈13 L) and the total sample and makeup flow rate through the OFR (6.4 L min−1). This calculation implicitly assumes plug flow conditions, with associated uncertainty of approximately 10 % compared to an explicit residence time distribution measurement at a specific OFR condition (Li et al., 2015). Variability in OFR parameters (e.g., temperature, flow rate) may increase the uncertainty in this assumption across a continuum of conditions (Huang et al., 2017; Lambe et al., 2019). To characterize the uncertainty in our plug flow approximation across multiple sample flow conditions, we measured integrated OH exposure (OHexp) values of 3.3×10¹¹, 7.8×10¹¹, and 2.0×10¹² molec. cm−3 s at sample flow rates of 12.5, 6.4, and 3.1 L min−1, respectively, using the tracer decay method (Sect. 2.2) with the OFR operated at the same humidity and lamp intensity. Thus, perturbing the “plug flow” τOFR=124 s by a factor of 2 in either direction changed OHexp by factors of 2.36 and 2.56. Based on these results, an upper-limit estimated uncertainty in τOFR and corresponding OHexp is approximately 30 %.
2.3 Photochemical model
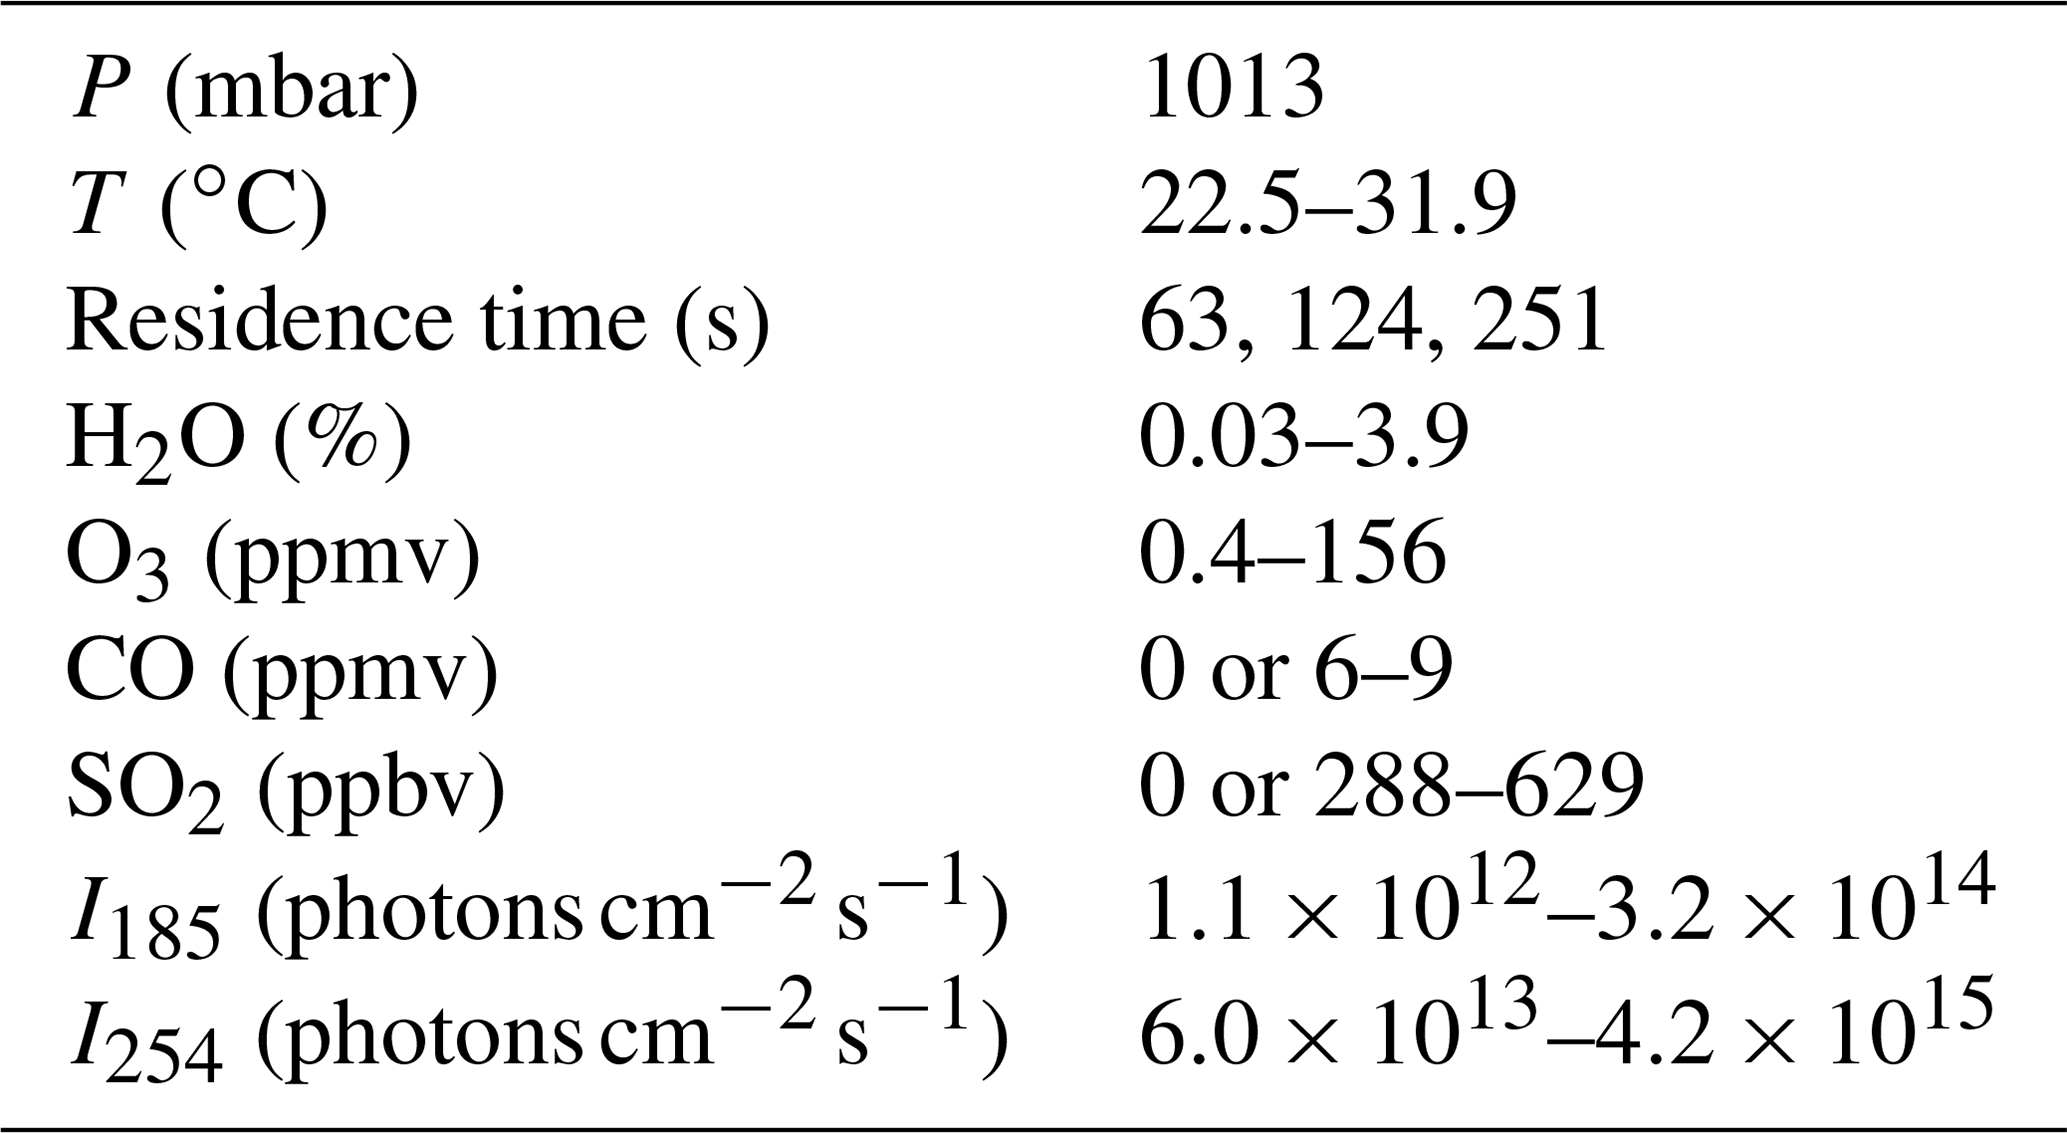
We used a photochemical model implemented in MATLAB and Igor Pro to calculate concentrations of radical/oxidant species produced in the reactor (Li et al., 2015). The KinSim chemical kinetic solver was used to compile the version of the model that was implemented in Igor Pro (Peng and Jimenez, 2019). Model input parameters are shown in Table 1, and reactions and associated kinetic rate coefficients that were included in the model are summarized in Table S1 in the Supplement (Peng and Jimenez, 2020a). For cases where [H2O]≤0.1 % and the RH sensor accuracy became a limiting factor, we systematically adjusted the [H2O] value that was input to the model to a value between 0.01 % and 0.1 % to achieve better agreement between measured and modeled OHexp. I254 and I185 values input to the model were adjusted to match the measured OHexp values as best as possible within the following constraints:
-
for two lamps operated at maximum output (Lambe et al., 2019).
-
At reduced lamp output, I254 was calculated by multiplying I254,max by the ratio of photodetector-measured irradiance values measured at maximum and reduced lamp output at λ=254 nm.
-
⪅ 0.01, 0.004, and 0.0015 for lamp types C and F, D and G, and E, respectively.
-
At reduced lamp output, I185 was calculated by multiplying I185,max by the ratio of O3 mixing ratios measured at maximum and reduced lamp output.
Within these constraints, the mean (±1σ) ratios of modeled to measured CO and SO2 concentrations remaining at the exit of the OFR were 1.02±0.06 and respectively.
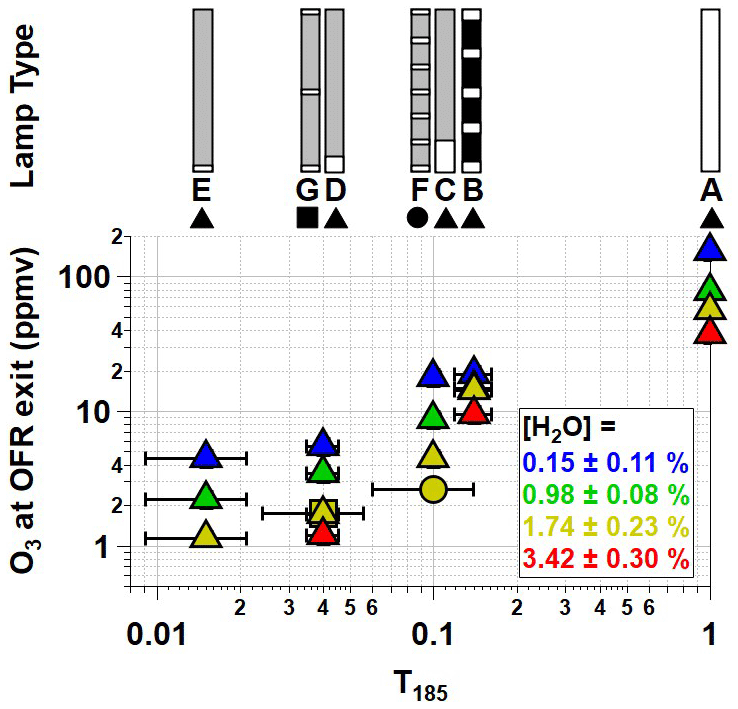
Figure 2O3 mixing ratio generated using OFR185 at (lamp types A and C–G) and (lamp type B) as a function of T185 and [H2O]. Error bars represent ±1σ of replicate O3 measurements and ±2 mm uncertainty in lengths of individual T185=0 and 1 segments.
3.1 Influence of I185 on [O3] and OHexp
Figure 2 shows [O3] measured at the exit of the OFR as a function of T185 with each lamp type operated at maximum UV output. Binned data are shown for conditions where %, 0.98 %±0.08 %, 1.74 %±0.23 %, and 3.42 %±0.30 %. At fixed [H2O], [O3] increased as a function of T185. For example, [O3] increased from 17.8 to 155 ppmv at [H2O]=0.15 % and from 4.5 to 56 ppmv at [H2O]=1.74 % as T185 increased from 0.1 to 1. At fixed T185 and I254, [O3] decreased with increasing [H2O] due to faster O(1D)+H2O reaction rate following O3 photolysis at λ=254 nm. Consequently, as [H2O] increased from 0.15 % to 3.42 %, [O3] decreased by a factor of 4–5 for lamp types A and C–G, whereas [O3] decreased by a factor of 2 for lamp type B because of its reduced I254 (Fig. 1). At [H2O]=1.74 % and T185=0.04 and 0.1, Fig. 2 shows that [O3] generated using lamp types D and G was approximately 1.7 and 1.8 ppmv; here, lamp type D had one 15 mm quartz segment with T185=1, whereas lamp type G had three 5 mm quartz segments with T185=1. At the same OFR conditions, [O3] generated using lamp types C and F was 4.5 and 2.7 ppmv; these lamps had one 35 mm and seven 5 mm quartz segments with T185=1. Despite the discrepancy in measured [O3], corresponding OHexp obtained with lamp types C and F were 2.5×10¹² and 2.8×10¹² , respectively. Thus, the worse agreement in [O3] measured between lamp types C and F may be associated specifically with O3 measurements from these experiments. We hypothesize that the OFR-volume-averaged I185 is sufficient to describe associated HOx production for these cases.
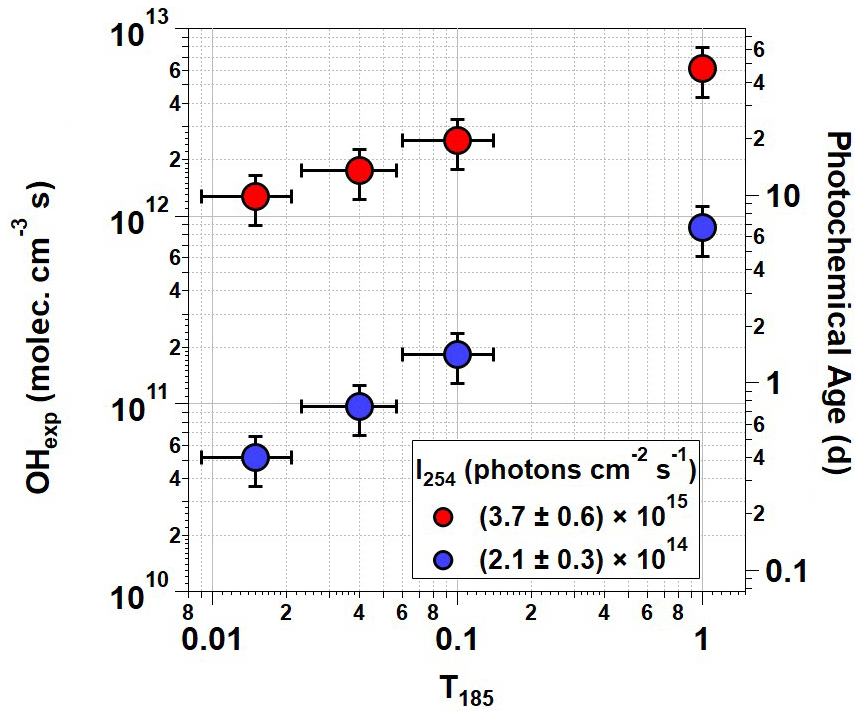
Figure 3OHexp generated using OFR185 ( %) at minimum and maximum I254 for each T185 value. Corresponding photochemical age is shown on the right y axis assuming mean molec cm−3 (Mao et al., 2009). Error bars assume ±30 % uncertainty in OHexp and ±2 mm uncertainty in lengths of individual T185=0 and 1 segments.
Figure 3 plots OHexp as a function of T185 at %. The corresponding equivalent photochemical age shown on the right y axis assumes a 24 h average OH concentration of 1.5×10⁶ molec cm−3 (Mao et al., 2009). Results obtained with lamp types D and G, and C and F were averaged together at T185=0.04 and 0.1, respectively, due to their similar OHexp values. Over the range of T185 shown in Fig. 3, excluding lamp type B, OHexp increased by approximately a factor of 5 at ) and a factor of 17 at . Maximum OHexp also decreased by about a factor of 5 between lamp types A and B due to reduction in both I254 and I185 (not shown in Fig. 3). Similar trends were observed for OHexp measurements at % and 3.42 %±0.30 %, but at %, the sensitivity of OHexp to T185 was weaker due to suppressed OH production at lower humidity.
3.2 I185:I254 determination and derivation of OHexp estimation equations
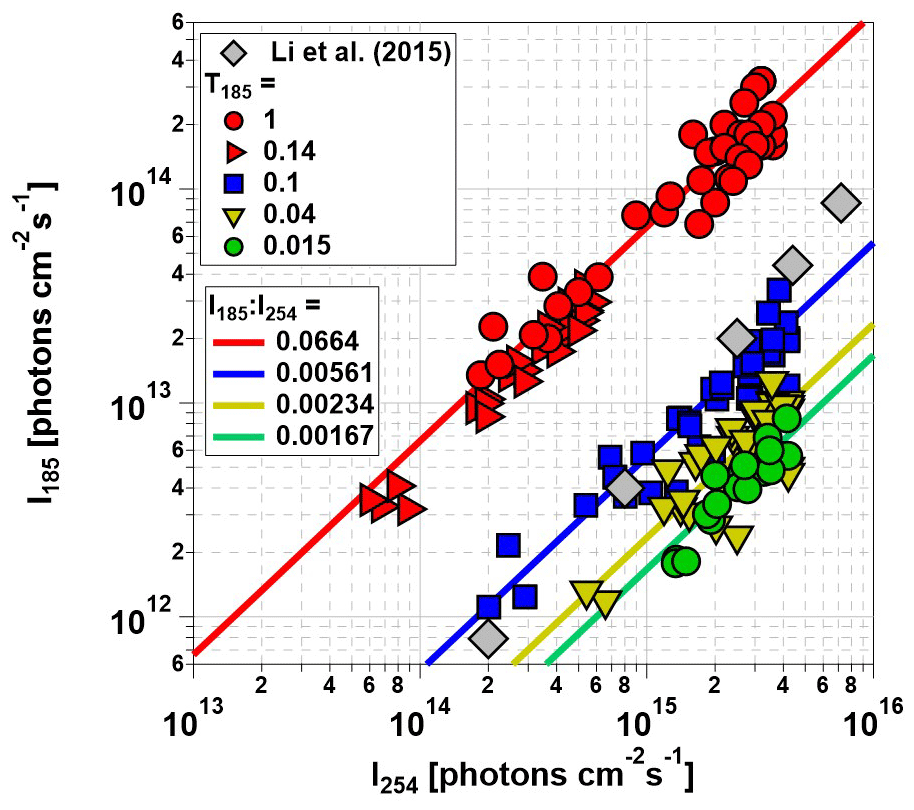
Figure 4 plots I185 as a function of I254 for the Hg lamps used in this study and a different model of Hg lamps used in an earlier-generation PAM OFR (Li et al., 2015). As with OHexp values shown in Fig. 3, I185 and I254 values obtained with lamp types D and G, and C and F were combined together into T185=0.04 and 0.1 symbols following our hypothesis that the OFR-volume-averaged I185 was sufficient to describe HOx production. Linear fits applied to the data shown in Fig. 4 were used to calculate average I185:I254 values for lamp types A and B, C and F, D and G, and E. Lamp types A and B (red symbols) had the highest , whereas lamp type E had the lowest . for lamp types C and F (blue symbols) fell within the envelope of to 0.012 characterized by Li et al. (2015), with a lower apparent sensitivity of I185:I254 to lamp power. This is presumably due to differences in the specific Hg lamp types, potential variability in lamp output within the same lamp type, and/or the method of dimming used in the two studies.
Previous studies reported empirical OH exposure algebraic estimation equations for use with OFRs (Li et al., 2015; Peng et al., 2015, 2018; Lambe et al., 2019). These equations parameterize OHexp as a function of readily measured experimental parameters, therefore providing a simpler alternative than detailed photochemical models for experimental planning and analysis. Here, we expand on those studies by deriving OHexp estimation equations for the lamp types that were used in this study. We adapted the estimation equation format introduced by Li et al. (2015):
This equation incorporates the following relationships between OHexp and O3, H2O, τ, and OHRext identified by Li et al. (2015): (1) a power-law dependence of OHexp on UV intensity and, accordingly, [O3]; (2) a linear dependence of OHexp on [H2O] and τ; (3) OH suppression as a function of increasing OHRext. The fit coefficients a–f are lamp-specific.
Equation (1) was fit to data obtained from the base case of the model, with CO reacting with OH as a surrogate of OHRext, over the following OFR185 phase space: T=25 ∘C, τ=124 s, OHRext=0.77 to 232 s−1, [H2O]=0.1 % to 3 %, I254=1013 to 1016 , and , 0.00242, 0.00595, and 0.0664. For each I185:I254 value, we explored 10, 15, and 20 logarithmically evenly distributed values in the ranges of OHRext, [H2O], and I254, respectively. Figure 5 compares OHexp estimated from Eq. (1) and calculated from the model for the case. Almost all of the equation-estimated and model OHexp values agreed within a factor or 2 or better. The absolute value of the relative deviations increased above [H2O]≈0.5 % and was largest at [H2O]=3 %; the mean absolute value of the relative deviations was 28 %. Analogous plots for , 0.00242, and 0.00595 cases are shown in Fig. S3 in the Supplement. For these other cases, the mean absolute values of the relative deviations were 20 %, 17 %, and 16 %, respectively. Equation (1) coefficients for lamps with the I185:I254 values reported here are presented in Table 2.
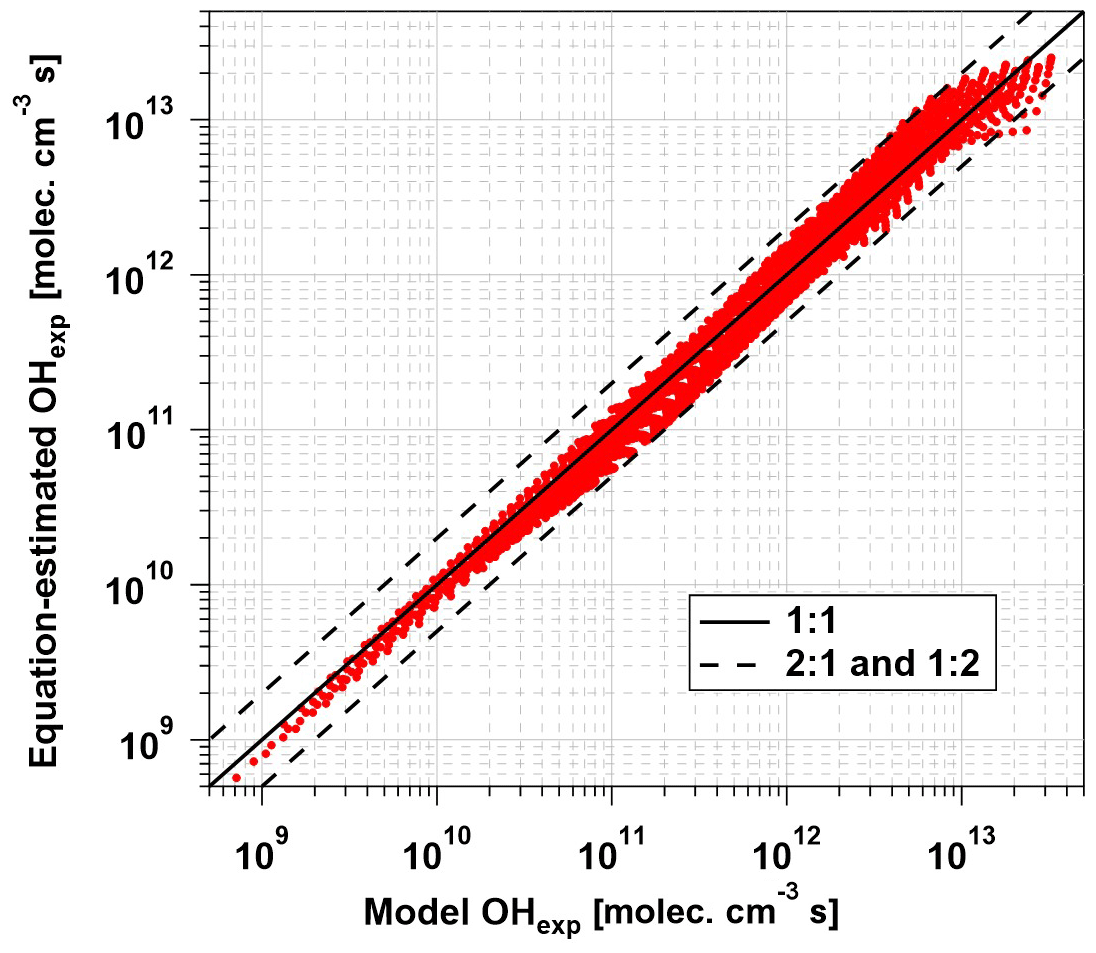
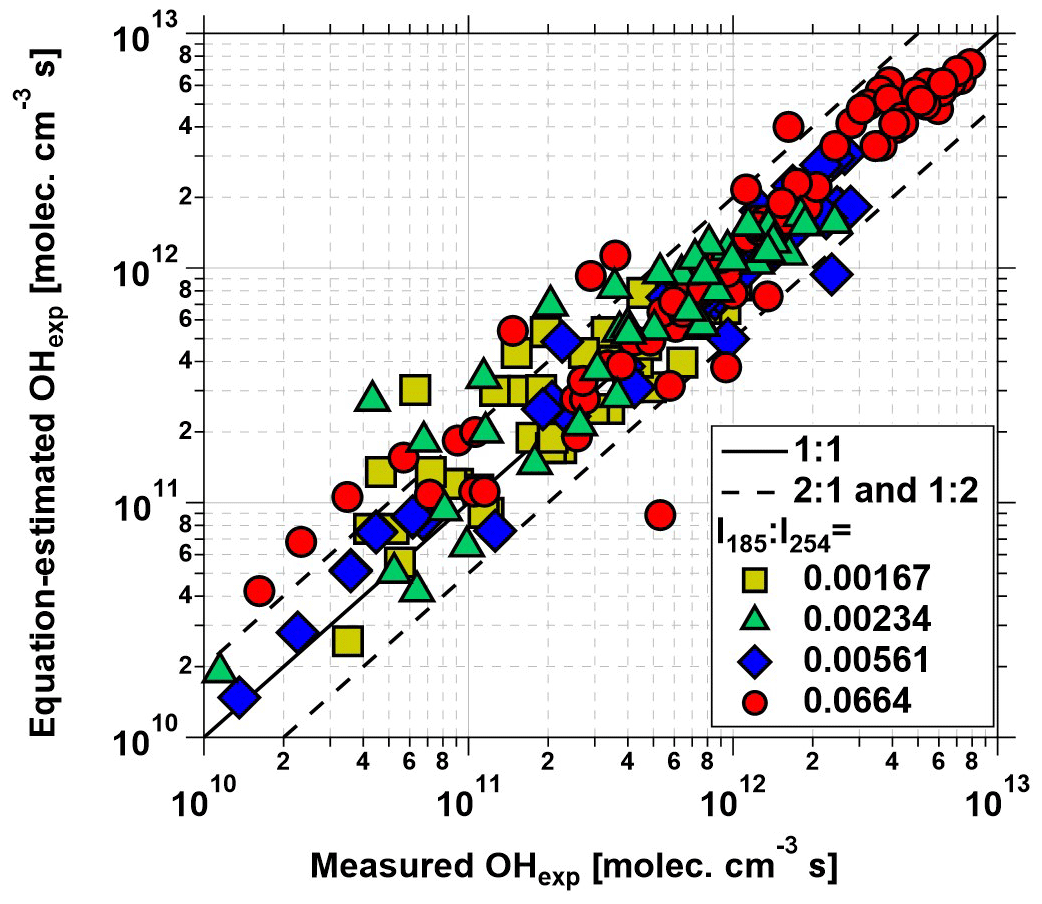
Figure 5OHexp calculated from the estimation equation (Eq. 1) as a function of OHexp calculated from the full OFR185 KinSim mechanism (Table S1) for lamp types A and B. Solid and dashed lines correspond to the 1:1 and the 1:2 and 2:1 lines, respectively. Estimation equation fit coefficients are shown in Table 2.
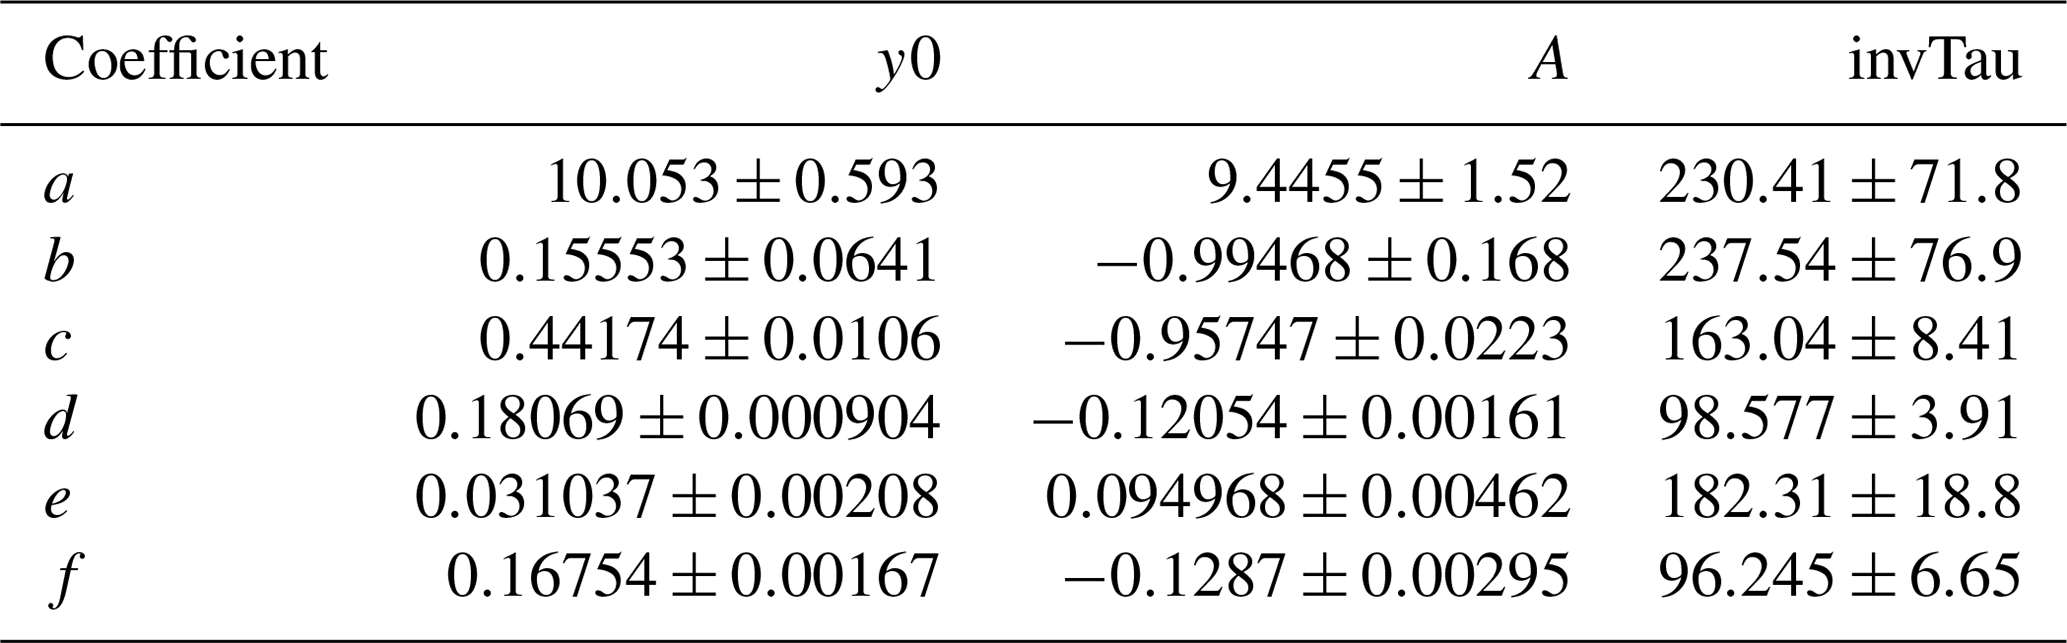
Table 2OHexp estimation equation coefficients (±1σ) as defined in Eq. (1).
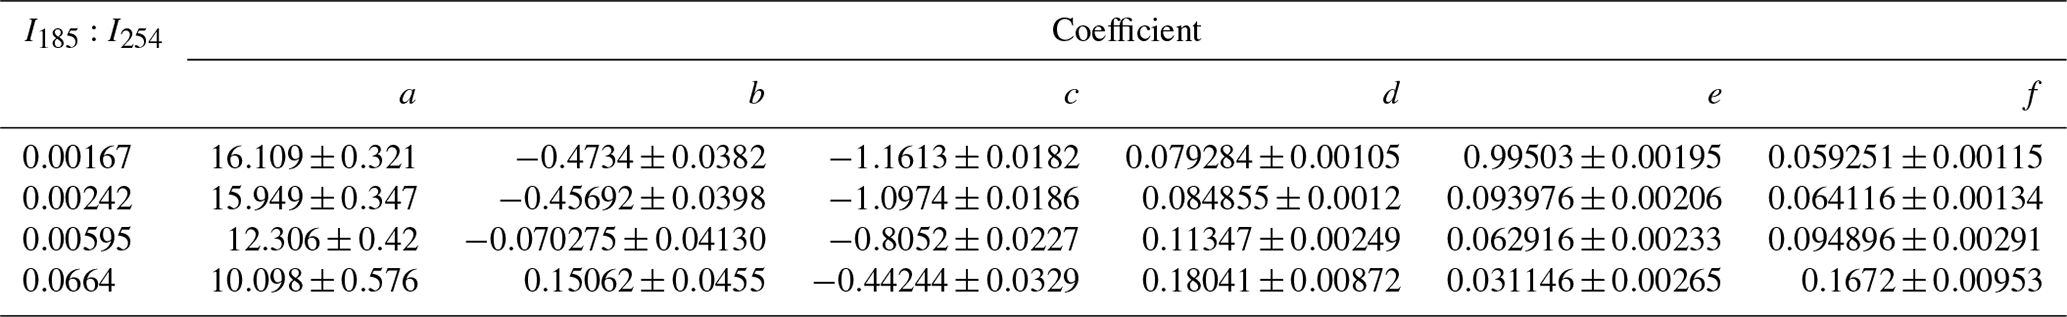
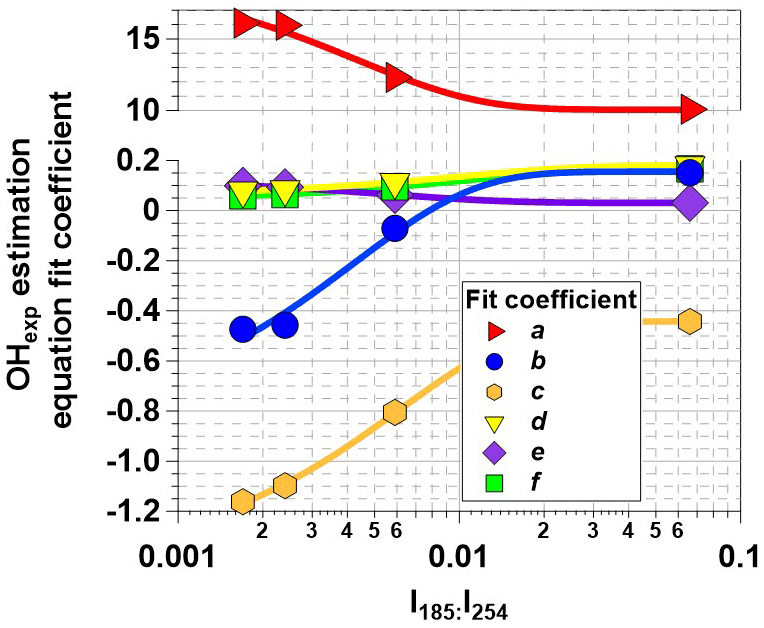
Figure 6OHexp estimation equation fit coefficients plotted as a function I254:I254. Trend lines were calculated from exponential regression functions with fit parameters that are presented in Table 3.
To generalize the results shown in Figs. 5 and S3 to OFR185 systems with other I185:I254 values, Fig. 6 plots fit coefficients a–f as a function of I185:I254. Each of these coefficients changes monotonically as a function of I185:I254, enabling the usage of simple exponential regression functions to parameterize the a–f values as a continuous function of I185:I254. Exponential function coefficients for the regression curves shown in Fig. 6 are presented in Table 3. Figure 7 compares the equation-estimated OHexp (obtained using Eq. 1 with Table 3 fit coefficients) and the measured OHexp obtained using the tracer decay method. The mean (±1σ) ratios of equation-estimated and measured OHexp values were 0.94±0.55, and 1.32±0.71 for , 0.00242, 0.00595, and 0.0664.
3.3 Influence of I185 on HO2, NOx, and UV photolysis of aromatic volatile organic compounds
[HO2] and [NOx] (with N2O present) increase along with [OH] as a function of I185 (Fig. S4 in the Supplement). To isolate the effect of I185 on related OFR photochemistry at fixed OHexp, we investigated two OFR185 cases using (, 1.96×10¹⁵) and (6.65×10¹², 1.01×10¹⁴) that each generate a model-calculated OH at base-case conditions of [H2O]=2 %, τ=124 s, and OHRext=30 s−1. These cases were designated as “low” and “high” I185:I254 cases. Thus, increasing I185 by a factor of 2 enabled lowering I254 by a factor of 20 to achieve equivalent OHexp.
First, we investigated the resilience of each OFR185 case to OH suppression via OHRext. As OHRext was increased from 30 to 300 s−1, OHexp decreased from 5.0×10¹¹ to 7.9×10¹⁰ (low I185:I254) and 9.0×10¹⁰ (high I185:I254) . Thus, increasing I185 decreased OH suppression by 15 %, primarily due to 30 % higher [HO2] in the high I185:I254 case that increased the OH+HO2 reaction rate and partially buffered the system against increasing OHRext. Second, we compared the ability of each OFR185 case to generate high-NO conditions in the presence of added [N2O]. For example, at [N2O]=2.7 %, and 0.4 at low and high I185:I254. While increasing [N2O] from 2.7 % to 4.0 % achieved at high I185:I254, [NO2] also increased from 50 to 100 ppbv. At higher UV intensity, a similar increase in [N2O] could generate [NO2]>1 ppm and promote artificially fast RO2+NO2 reactions compared to atmospheric conditions (Peng and Jimenez, 2017). Third, we compared relative timescales for OH oxidation and photolysis of representative aromatic volatile organic compounds (VOCs) that absorb λ=185 and 254 nm radiation. The fractional VOC loss due to photolysis, Fphotolysis, was calculated using Eq. (2):
where σ185 and σ254 are the VOC absorption cross sections at λ=185 and 254 nm, ϕ185 and ϕ254 are the VOC photolysis quantum yields, and kOH is the bimolecular reaction rate coefficient with OH. Assuming upper limit ϕ185=1 and ϕ254=1 values, cm2, cm2 (Dawes et al., 2017), and (Atkinson, 1986), Fphotolysis, benzene≤0.26 and 0.07 at low and high I185:I254. Similarly, Fphotolysis, toluene≤0.07 and 0.04 at low and high I185:I254 (Atkinson, 1986; Serralheiro et al., 2015).
OFR185 is emerging as one of the most commonly used OFR methods by enabling efficient HOx and NOx generation over a range of oxidative aging timescales that are relevant to atmospheric processes. Important OFR185 parameters are I185, I254, [H2O], [N2O] (if NOx generation is required), OHRext, and τOFR. However, I185:I254 is specific to the Hg lamp and/or OFR, as are associated calibration and estimation equations. To develop a general framework within which to evaluate and compare different OFR185 systems, we characterized OHexp as a function of I185, I254, OHRext, and [H2O] values, in the process using several novel low-pressure Hg lamp configurations to extend the range of achievable I185:I254. OHexp estimation equations were developed for the Hg lamp types that were used, and corresponding estimation equation fit coefficients were parameterized as a function of I185:I254 to enable interpolation to other OFR185 systems that can employ the same Hg lamp type(s) over the range of [O3], [H2O], OHRext, and τ values parameterized here. Because low-pressure Hg germicidal fluorescent lamps are used in many industries (e.g., medical, HVAC, wastewater remediation), they are less expensive and more easily acquired than other Hg lamps. OHRint, HO2:OH, and Fphotolysis were improved at higher I185:I254, whereas NO:HO2 and NO:NO2 were improved at lower I185:I254. Overall, our results suggest that optimal OFR185 performance is achieved by (1) maximizing I185:I254, (2) reducing OHexp (if needed) through simultaneous reduction in I185 and I254 via electronically or mechanically dimming the lamp output (Fig. S2), and (3) increasing [N2O] to offset higher [HO2] if high-NO conditions are required, provided that [NO2] does not exceed ≈1 ppm, in which case lower I185:I254 should be used. Future work will investigate the sensitivity of NOx-dependent, OH-initiated oxygenated volatile organic compound and SOA formation processes to I185:I254.
Data presented in this paper are available upon request. The KinSim mechanism can be downloaded from the Supplement. The kinetic solver is freely available at https://tinyurl.com/kinsim-cases#bookmark=kix.6zu8zdwq2lce. (Peng and Jimenez, 2020b).
The supplement related to this article is available online at: https://doi.org/10.5194/acp-20-13417-2020-supplement.
AL conceived and planned the experiments. JR performed the experiments. JR and AL performed the data analysis. JR, AL, and WB conceived and planned the model simulations, and JR and AL carried out the model simulations. JR, AL, and WB contributed to the interpretation of the results. AL took the lead in writing the paper. All authors provided feedback on the paper.
The authors declare that they have no conflict of interest.
We thank Chris Rockett (Light Sources Inc.), Dan Spicer (Light Sources Inc.), Leah Williams (Aerodyne), and John Jayne (Aerodyne) for helpful discussions.
This paper was edited by Eliza Harris and reviewed by two anonymous referees.
Atkinson, R.: Kinetics and mechanisms of the gas-phase reactions of the hydroxyl radical with organic compounds under atmospheric conditions, Chem. Rev., 86, 69–201, 1986. a, b
Dawes, A., Pascual, N., Hoffmann, S. V., Jones, N. C., and Mason, N. J.: Vacuum ultraviolet photoabsorption spectroscopy of crystalline and amorphous benzene, Phys. Chem. Chem. Phys., 19, 27544–27555, https://doi.org/10.1039/C7CP05319C, 2017. a
Huang, Y., Coggon, M. M., Zhao, R., Lignell, H., Bauer, M. U., Flagan, R. C., and Seinfeld, J. H.: The Caltech Photooxidation Flow Tube reactor: design, fluid dynamics and characterization, Atmos. Meas. Tech., 10, 839–867, https://doi.org/10.5194/amt-10-839-2017, 2017. a
Lambe, A. T., Ahern, A. T., Williams, L. R., Slowik, J. G., Wong, J. P. S., Abbatt, J. P. D., Brune, W. H., Ng, N. L., Wright, J. P., Croasdale, D. R., Worsnop, D. R., Davidovits, P., and Onasch, T. B.: Characterization of aerosol photooxidation flow reactors: heterogeneous oxidation, secondary organic aerosol formation and cloud condensation nuclei activity measurements, Atmos. Meas. Tech., 4, 445–461, https://doi.org/10.5194/amt-4-445-2011, 2011. a, b
Lambe, A. T., Krechmer, J. E., Peng, Z., Casar, J. R., Carrasquillo, A. J., Raff, J. D., Jimenez, J. L., and Worsnop, D. R.: HOx and NOx production in oxidation flow reactors via photolysis of isopropyl nitrite, isopropyl nitrite-d7, and 1,3-propyl dinitrite at λ=254, 350, and 369 nm, Atmos. Meas. Tech., 12, 299–311, https://doi.org/10.5194/amt-12-299-2019, 2019. a, b, c
Li, R., Palm, B. B., Ortega, A. M., Hlywiak, J., Hu, W., Peng, Z., Day, D. A., Knote, C., Brune, W. H., De Gouw, J. A., and Jimenez, J. L.: Modeling the Radical Chemistry in an Oxidation Flow Reactor: Radical Formation and Recycling, Sensitivities, and the OH Exposure Estimation Equation, J. Phys. Chem. A, 119, 4418–4432, 2015. a, b, c, d, e, f, g, h
Mao, J., Ren, X., Brune, W. H., Olson, J. R., Crawford, J. H., Fried, A., Huey, L. G., Cohen, R. C., Heikes, B., Singh, H. B., Blake, D. R., Sachse, G. W., Diskin, G. S., Hall, S. R., and Shetter, R. E.: Airborne measurement of OH reactivity during INTEX-B, Atmos. Chem. Phys., 9, 163–173, https://doi.org/10.5194/acp-9-163-2009, 2009. a, b
Peng, Z. and Jimenez, J. L.: Modeling of the chemistry in oxidation flow reactors with high initial NO, Atmos. Chem. Phys., 17, 11991–12010, https://doi.org/10.5194/acp-17-11991-2017, 2017. a
Peng, Z. and Jimenez, J. L.: KinSim: A Research-Grade, User-Friendly, Visual Kinetics Simulator for Chemical-Kinetics and Environmental-Chemistry Teaching, J. Chem. Educ., 96, 806–811, https://doi.org/10.1021/acs.jchemed.9b00033, 2019. a
Peng, Z. and Jimenez, J. L.: Radical chemistry in oxidation flow reactors for atmospheric chemistry research, Chem. Soc. Rev., 49, 2570–2616, https://doi.org/10.1039/C9CS00766K, 2020a. a
Peng, Z. and Jimenez, J.: Downloadable KinSim cases and mechanisms, available at: https://tinyurl.com/kinsim-cases#bookmark=kix.6zu8zdwq2lce, last access: 15 May 2020b. a
Peng, Z., Day, D. A., Stark, H., Li, R., Lee-Taylor, J., Palm, B. B., Brune, W. H., and Jimenez, J. L.: HOx radical chemistry in oxidation flow reactors with low-pressure mercury lamps systematically examined by modeling, Atmos. Meas. Tech., 8, 4863–4890, https://doi.org/10.5194/amt-8-4863-2015, 2015. a
Peng, Z., Day, D. A., Ortega, A. M., Palm, B. B., Hu, W., Stark, H., Li, R., Tsigaridis, K., Brune, W. H., and Jimenez, J. L.: Non-OH chemistry in oxidation flow reactors for the study of atmospheric chemistry systematically examined by modeling, Atmos. Chem. Phys., 16, 4283–4305, https://doi.org/10.5194/acp-16-4283-2016, 2016. a
Peng, Z., Palm, B. B., Day, D. A., Talukdar, R. K., Hu, W., Lambe, A. T., Brune, W. H., and Jimenez, J. L.: Model Evaluation of New Techniques for Maintaining High-NO Conditions in Oxidation Flow Reactors for the Study of OH-Initiated Atmospheric Chemistry, ACS Earth Space Chem., 2, 72–86, https://doi.org/10.1021/acsearthspacechem.7b00070, 2018. a, b
Peng, Z., Lee-Taylor, J., Orlando, J. J., Tyndall, G. S., and Jimenez, J. L.: Organic peroxy radical chemistry in oxidation flow reactors and environmental chambers and their atmospheric relevance, Atmos. Chem. Phys., 19, 813–834, https://doi.org/10.5194/acp-19-813-2019, 2019. a
Serralheiro, C., Duflot, D., da Silva, F. F., Hoffmann, S. V., Jones, N. C., Mason, N. J., Mendes, B., and Limão-Vieira, P.: Toluene Valence and Rydberg Excitations as Studied by ab initio Calculations and Vacuum Ultraviolet (VUV) Synchrotron Radiation, J. Phys. Chem. A, 119, 9059–9069, https://doi.org/10.1021/acs.jpca.5b05080, 2015. a
Spicer, D.: Germicidal Lamp Basics, available at: https://www.light-sources.com/wp-content/uploads/2015/05/Germicidal_Lamp_Basics_-_2013.pdf (last access: 23 April 2020), 2013. a