the Creative Commons Attribution 4.0 License.
the Creative Commons Attribution 4.0 License.
 | 07 Nov 2020
The promotion effect of nitrous acid on aerosol formation in wintertime in Beijing: the possible contribution of traffic-related emissions
Yusheng Zhang
Chaofan Lian
Zeming Feng
Feixue Zheng
Xiaolong Fan
Yan Chen
Yonghong Wang
Jing Cai
Kaspar R. Daellenbach
Juha Kangasluoma
Federico Bianchi
Joni Kujansuu
Tuukka Petäjä
Xuefei Wang
Bo Hu
Yuesi Wang
Markku Kulmala
Secondary aerosols are a major component of PM2.5, yet their formation mechanisms in the ambient atmosphere are still unclear. Based on field measurements in downtown Beijing, we show that the photolysis of nitrous acid (HONO) may promote the formation of organic and nitrate aerosols in winter in Beijing, which is supported by the fact that the mass concentrations of organic and nitrate aerosols linearly increase as a function of HONO consumed from early morning to noon. The increased nitrate content also leads to the formation of ammonium particulate matter through enhancing the neutralization of nitrate and sulfate by ammonia. We further illustrate that during pollution events in winter in Beijing, over 50 % of the ambient HONO may be related to traffic-related emissions, including direct emissions and formation via the reaction between OH and vehicle-emitted NO. Overall, our results indicate that traffic-related HONO may play an important role in the oxidative capacity and in turn contribute to haze formation in winter in Beijing. The mitigation of HONO and NOx emissions from vehicles may be an effective way to reduce the formation of secondary aerosols and severe haze events in winter in Beijing.
- Article
(1294 KB) - Full-text XML
-
Supplement
(1287 KB) - BibTeX
- EndNote


China is one of several countries suffering from severe pollution of fine particulate matter with diameters of less than or equal to 2.5 µm (PM2.5) (Lelieveld et al., 2015). Although the regional air quality has been continuously improving since the central government of China issued the Clean Air Act in 2013 (Vu et al., 2019), the PM2.5 concentration is still significantly higher than that in developed countries (Fu et al., 2014; An et al., 2019). A consensus has been reached that haze events are driven by local emissions (An et al., 2019), regional transport (G. J. Zheng et al., 2015), and secondary formation (Huang et al., 2014; He et al., 2018) of pollutants under unfavorable meteorological conditions (e.g., stagnant atmosphere and high relative humidity) (Zhu et al., 2018; T. Liu et al., 2017). The feedback loop between the meteorological parameters and haze formation also plays an important role in the evolution of haze events (X. Zhang et al., 2018).
Secondary aerosols can contribute ∼70 % of the aerosol mass concentration on polluted days (Huang et al., 2014). Several reaction pathways have been proposed, such as sulfate formation via the heterogeneous oxidation of SO2 promoted by H2O2 and/or NO2 on mineral dust (Huang et al., 2015; He et al., 2014), the aqueous oxidation of SO2 promoted by NO2 in the presence or absence of NH3 in the particle-bound water film (He et al., 2014; Wang et al., 2016), the catalytic conversion of SO2 to sulfate by black carbon (Zhang et al., 2020), nitrate formation via the efficient hydrolysis of N2O5 on aerosol surfaces (Z. Wang et al., 2017; Wang et al., 2019; Kulmala, 2018; Li et al., 2017), and haze formation initiated by new particle formation and growth (Guo et al., 2014, 2020). In recent years, the strict control of coal combustion has successfully reduced the SO2 concentration, resulting in a reduction of the sulfate (SO) component of the PM2.5. In stark contrast, the contributions from organic and nitrate have become increasingly more significant in China (Lang et al., 2017).
The formation of secondary organic aerosol (SOA) begins with the gas-phase oxidation of volatile organic compounds (VOCs), which produces various low-volatility and semi-volatile products (Bianchi et al., 2019), followed by partitioning into the particle phase (Hallquist et al., 2009). Similarly, the formation of nitrate aerosols in the daytime is largely due to the partitioning of gaseous nitric acid, which is formed via the oxidation of NO2 by OH (Seinfeld and Pandis, 2006; Wang et al., 2019). It is traditionally believed that atmospheric oxidation capacity is weaker in the winter due to the weaker solar radiation, which limits the formation of SOA and nitrate (Sun et al., 2013). However, it has very recently been shown that the peak OH concentration on polluted days in winter in Beijing varies from 2×10⁶ to 6×10⁶ molec. cm−3, which is 6–10 times higher than the concentration predicted by the global model (Tan et al., 2018). This discrepancy is largely reduced when the other OH production processes in the model simulations are accounted for, which shows that the photolysis of nitrous acid (HONO) dominates the initiation of the HOx (OH and HO2) and ROx (RO and RO2) radical chains in winter in Beijing (Tan et al., 2018) and in several other cities (Ren et al., 2006; Stutz et al., 2013).
More recently, modeling studies have suggested that HONO can enhance secondary aerosol formation in the Beijing–Tianjin–Hebei (BTH) region (J. W. Zhang et al., 2019) and the Pearl River Delta (PRD) regions of China (J. Zhang et al., 2019; Xing et al., 2019) and in Houston, United States (Czader et al., 2015). These results suggest that the role of HONO in haze chemistry may be crucial in winter in Beijing; however, direct evidence from observations has not yet been reported yet. The HONO budget has been investigated via modeling studies (Y. H. Liu et al., 2019; J. W. Zhang et al., 2019) and photostationary state calculations (J. Wang et al., 2017; Li et al., 2018; R.-J. Huang et al., 2017; Lee et al., 2016; Oswald et al., 2015) at different locations. At present, the study of the HONO budget is still far from over and requires a significant effort involving both the accurate measurement of HONO and the determination of the kinetic parameters related to its production pathways (Y. H. Liu et al., 2019). For example, the photo-enhanced conversion of NO2 (Su et al., 2008) and the photolysis of particulate nitrate were found to be two major mechanisms with a large potential for HONO formation at midday, but the associated uncertainty may reduce their importance (Y. H. Liu et al., 2019). Other studies have proposed that heterogeneous reactions on ground and aerosol surfaces are important during nighttime (J. Wang et al., 2017; J. W. Zhang et al., 2019) and daytime in the BTH region (J. W. Zhang et al., 2019). However, this heterogeneous reaction was unimportant in Ji'nan compared with the unknown sources and the homogeneous reaction between NO and OH (Li et al., 2018). In addition, traffic emissions have been reported to be an important HONO source during nighttime in the BTH, but they are not a significant source during the daytime (J. W. Zhang et al., 2019). However, it was proposed that the direct emission of HONO from vehicles should contribute about 51.1 % (Meng et al., 2020) or 52 % (W. Zhang et al., 2018) of nighttime HONO in Beijing. These results reveal that more studies of the HONO budget are required. In particular, it is necessary to analyze the HONO budget during pollution events in order to understand the possible influence of HONO sources on secondary pollutants' formation.
In this study, we carried out comprehensive measurements at a newly constructed observation station (Aerosol and Haze Laboratory, Beijing University of Chemical Technology, AHL/BUCT Station) located on the western campus of the Beijing University of Chemical Technology in downtown Beijing. We report observational evidence that HONO may have a prominent promotion effect on the formation of secondary aerosols in winter. Traffic-related emissions are a vital contributor to the ambient HONO concentration during pollution events in winter in Beijing.
2.1 Field measurements
The field measurements were performed at AHL/BUCT Station (lat. 39∘56′31′′ and long. 116∘17′52′′) from 1 February to 30 June 2018. The observation station was located on the roof of the main building, which is 550 m west of the 3rd Ring Road, 130 m south of Zizhuyuan Road and 565 m east of Nandianchang Road (Fig. S1 in the Supplement). The station is surrounded by both traffic and residential emissions, and thus, it is a typical urban observation site.
The ambient air was sampled from the roof of the five-story building (∼18 m above the ground). A PM2.5 inlet (URG) was used to prevent particles with diameters of larger than 2.5 µm from entering, and the remaining particles entered a Nafion dryer (MD-700-24, Perma Pure). Then a time-of-flight aerosol chemical speciation monitor equipped with a PM2.5 aerodynamic lens (ToF-ACSM, Aerodyne) and an aethalometer (AE33, Magee Scientific) was connected to the manifold of the aerosol sampling tube. The Reynolds number in the aerosol sampling tube was 800, with a total flow rate of 16.7 L min−1 and a residence time of 6.5 s. The details of the ToF-ACSM measurements are described in the Supplement. The ambient air was drawn from the roof using a Teflon sampling tube (BMET-S, Beijing Saak-Mar Environmental Instrument Ltd.), with a residence time of <10 s for the gas-phase pollutant measurements. Trace gases, including NOx, SO2, CO, and O3, were measured using the corresponding analyzer (Thermo Scientific, 42i, 43i, 48i, and 49i, respectively). The volatile organic compounds (VOCs) were measured using an online single photon ionization time-of-flight mass spectrometer (SPI-ToF-MS 3000R, Hexin Mass Spectrometry) with a unit mass resolution (UMR). The principle and the configuration of the instrument have been described in detail elsewhere (Gao et al., 2013) and are also in the Supplement. The HONO concentration was measured using a homemade long path absorption photometer (LOPAP) (Tong et al., 2016). The details are described in the Supplement. The particle sizes and number concentrations of the 1 nm to 10 µm were measured using a scanning mobility particle sizer (SMPS 3936, TSI), a particle size magnifier (PSM, Airmodus), and a neutral cluster and air ion spectrometer (NIAS, Airel Ltd.). The meteorological parameters, including temperature, pressure, relative humidity (RH), wind speed, and wind direction, were measured using a weather station (AWS310, Vaisala). The visibility and planetary boundary layer (PBL) height were measured using a visibility sensor (PWD22, Vaisala) and a ceilometer (CL51, Vaisala), respectively.
2.2 HONO budget calculation
Several sources of ambient HONO have been identified, such as emissions from soil (Esoil) (Oswald et al., 2015; Meusel et al., 2018) and vehicle exhaust (Evehicle) (Trinh et al., 2017), production through the homogeneous reaction between NO and OH (PNO-OH) in the atmosphere, the photolysis of nitrate (Pnitrate) (Bao et al., 2018), nitrous acid (), and nitrophenol (Pnitrophenol) (Sangwan and Zhu, 2018), and the heterogeneous reaction of NO2 on aerosol (Paerosol) (Liu et al., 2015) and ground surfaces (Pground) (Y. H. Liu et al., 2019; Li et al., 2018; J. Wang et al., 2017). However, the photolysis of HNO3 and nitrophenol was excluded in this study because they were believed to be minor sources (Lee et al., 2016), and their concentrations were unavailable during our observations. The removal pathways of HONO including photolysis (Lphotolysis), the homogeneous reaction with OH radicals (LHONO-OH), and dry deposition (Ldeposition) (Y. H. Liu et al., 2019) were considered.
The HONO budget was calculated using the following equation:
where is the observed rate of change of the HONO mixing ratio (ppbv h−1); EHONO is the emission rate of HONO from the different sources (ppbv h−1); PHONO is the in situ production rate of HONO in the troposphere (ppbv h−1); LHONO is the loss rate of HONO (ppbv h−1) (Li et al., 2018); and Tvertical and Thorizontal are the vertical and horizontal transport, respectively (Sörgel et al., 2011), which can mimic the source or sink terms depending on the HONO mixing ratios of the advected air relative to those of the measurement site and height (Sörgel et al., 2011).
The emission rate (EHONO, ppbv h−1) was calculated based on the emission flux (, g m−2 s−1) and the PBL height (H, m) using the following equation:
where EIHONO is the emission inventory of HONO (g s−1); A is the core urban area of Beijing (in m2, with a 20 km diameter); α is the conversion factor (); M is the molecular weight (g mol−1); T is the temperature (K); and P is the atmospheric pressure (Pa).
The production rates of HONO (PHONO, ppbv h−1) in the troposphere were calculated using the following equation:
where k1 is the quasi first-order reaction rate constant (s−1); and cprecursor is the concentration of the precursor (ppbv). For the homogeneous reaction between NO and OH,
where k2 is the second-order reaction rate constant ( cm3 molec.−1 s−1) (Li et al., 2012); and cOH is the OH concentration (molec. cm−3). For the heterogeneous reaction,
where As is the surface area concentration of the reactive surface (m2 m−3); ω is the molecular mean speed (m s−1); γ is the uptake coefficient of the precursor; and YHONO is the yield of HONO. At ground level, the surface area concentration is
where δ is the surface roughness, which is calculated according to the mean project area, perimeter, and height of the buildings in Beijing.
where fbuilding (0.31) and fblank (0.69) are the fractions of the projected area (Aprojected) of the buildings and blank space, respectively; and Pbuilding and h are the perimeter and the height of the building, respectively. fbuilding and Pbuilding were calculated using measurements for ∼1000 buildings that were randomly selected on a Google Map using the ImageJ software. The mean height (44.5 m) of the buildings in Beijing was linearly extrapolated from published lidar (light detection and ranging) data collected from 2004 to 2008 (Cheng et al., 2011). The δ in Beijing was calculated to be 3.85, which is slightly higher than the value (2.2) used by Li et al. (2018).
For the photolysis reaction, the first-order reaction rate was
where J is the photolysis rate of the production of HONO (s−1).
The loss rates of HONO through photolysis (Lphotolysis), the homogeneous reaction with OH radicals (LHONO-OH), and dry deposition (Ldeposition) (Y. H. Liu et al., 2019) were calculated using the following equations, respectively:
where JHONO is the photolysis rate of HONO (s−1); kHONO-OH is the second-order reaction rate constant between HONO and OH ( cm3 molec.−1 s−1) (Atkinson et al., 2004); and vd is the dry deposition rate of HONO (0.001 m s−1) (Han et al., 2017).
The vertical transport by advection (Tvertical), which is an important sink of HONO at night (Gall et al., 2016; Meng et al., 2020), was calculated using Eq. (12).
where Kh(z,t) is the eddy diffusivity of heat (m2 s−1) at height z (m) and time t; and h is the height of the second layer (18 m) (Gall et al., 2016). At the same time, both the vertical and horizontal transport can be estimated using Eq. (13):
where kdilution is the dilution rate (0.23 h−1, including both vertical and horizontal transport) (Dillon et al., 2002); and cHONO and cHONO,background are the HONO concentration at the observation site and the background site, respectively (Dillon et al., 2002).
In addition, even though all of the current known sources have been considered in models, the modeled daytime HONO concentrations were still lower than the observed concentrations (Tang et al., 2015; Michoud et al., 2014). Therefore, the HONO concentration can be described by Eq. (14):
3.1 Overview of the air pollution
The mass concentrations of the non-refractory PM2.5 (NR-PM2.5) and HONO and the metrological parameters are shown in Fig. 1. The time series of the other pollutants (SO2, CO, O3, benzene, toluene, and black carbon) are shown in Fig. S2.
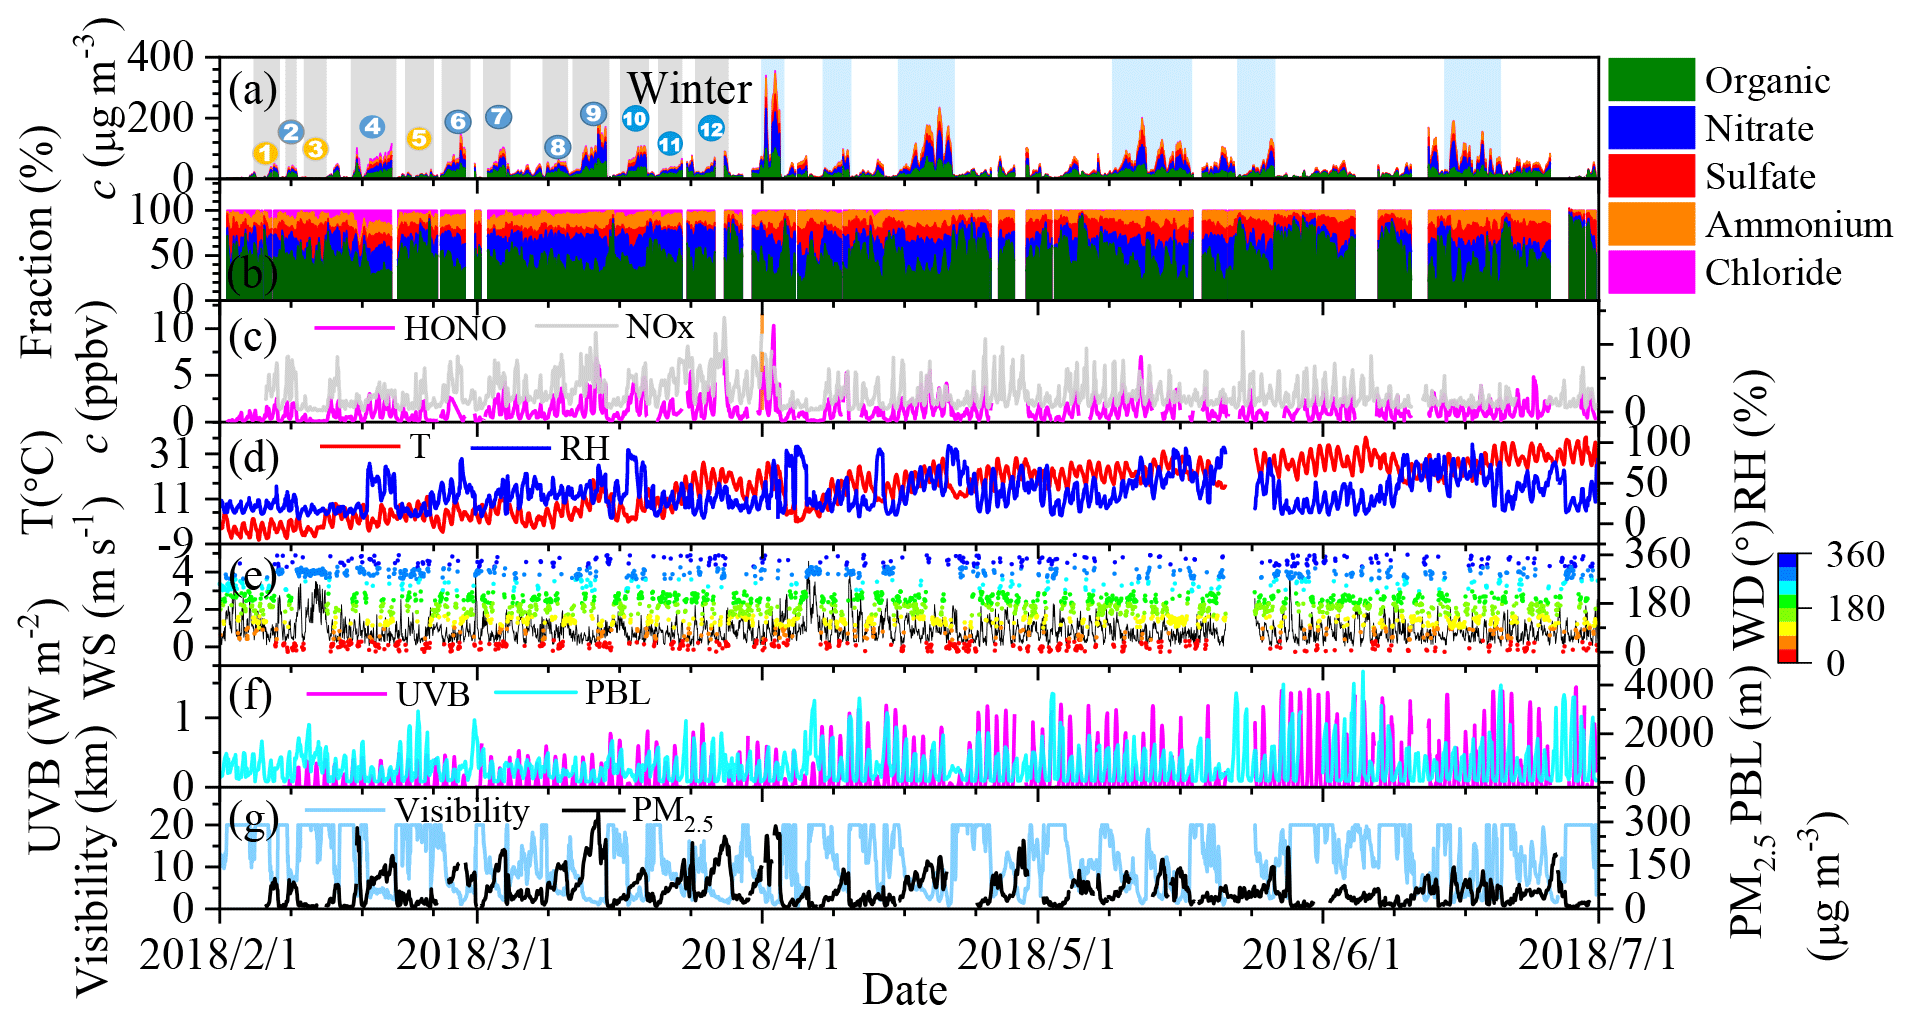
Figure 1An overview of the measurement of the non-refractory-PM2.5 (NR-PM2.5), HONO, NOx, and PM2.5 and meteorological parameters from 1 February to 1 July 2018. (a) The mass concentrations of the different components of PM2.5; (b) the mass fraction of the individual components; (c) HONO and NOx concentrations; (d) temperature and RH; (e) wind speed and wind direction; (f) UVB and PBL heights; and (g) visibility and PM2.5 concentration during the observations. We consider the period before 1 April to be winter. During the winter period, 12 cases were selected and numbered, including three clean cases (1, 3, and 5; in yellow) and nine pollution episodes (blue).
Similar to previous measurements (Guo et al., 2014; Wang et al., 2016), the air pollution events exhibited a periodic cycle of 3–5 d during the observations, as indicated by the concentrations of the NR-PM2.5 (Fig. 1a) and the gaseous pollutants and by the visibility. During the observation period, 20 %–60 % of the hourly PM2.5 concentrations were higher than 75 µg m−3 (the criterion for pollution according to the national air quality standards) during each month (Fig. S3a). Both the frequency of severe polluted episodes and the mean mass concentrations of PM2.5 and NR-PM2.5 were significantly higher in March than in the other months (Figs. 1 and S3). This can be explained by both the intense emissions during the heating season, which is supported by the high concentration of primary pollutants including CO, SO2, and black carbon (BC) (Table S1 in the Supplement), and the stagnant meteorological conditions resulting from the low wind speed (<2 m s−1) and planetary boundary layer (PBL) height in March (Fig. S4a).
Organic aerosol (OA) and nitrate dominated the NR-PM2.5, while their relative contributions varied significantly during the observations (Fig. 1b and Table S1). This is similar to previously reported NR-PM1.0 compositions (Sun et al., 2015). The monthly mean fraction of OA varied from 45.9 ± 10.2 % to 52.6 ± 18.7 %, which was accompanied by a slight increase in sulfate from 16.0 ± 9.1 % to 18.2 ± 8.0 % (Fig. S4d). At the same time, the monthly mean fractions of nitrate and chloride decreased from 26.7 ± 8.8 % to 16.7 ± 12.8 % and from 7.7 ± 6.1 % to 0.3 ± 0.2 %, respectively. The peak ammonium concentration (14.2 ± 2.8 %) occurred in March, and then it decreased slightly to 12.2 ± 5.2 %. The intense emission of chloride from coal combustion during the heating season (Cho et al., 2008) and firework use (Zhang et al., 2017), which was transported from Tangshan during the Chinese New Year (Fig. S5a and b), led to a high chloride fraction in February and March. The decreases in nitrate and ammonium fractions from February to June are most likely related to the increase in temperature (Fig. S2), which favors NH4NO3 decomposition (Wang et al., 2015). Furthermore, the decrease in the contributions of the other components and the increase in the secondary formation due to the increased amount of UV light (Fig. S4c) may also increase the OA fraction (Huang et al., 2014). This means that the chemical transformation in March should still be vigorous even though the UV light intensity in March is lower than in summer (Fig. S4c). It also implies that the other factors may compensate for the weaker UV light intensity in March.
HONO, which has been recognized as an important precursor of primary OH radicals (Ren et al., 2006; Alicke et al., 2003), ranged from 0.05 to 10.32 ppbv from 1 February to 30 June 2018 (Fig. 1c), with a mean value of 1.26 ± 1.06 ppbv. In winter (February and March), the HONO concentration was 1.15 ± 1.10 ppbv, which is comparable to previous (1.05 ± 0.89 ppbv) measurements collected in the winter in Beijing (J. Wang et al., 2017; Hou et al., 2016) but is slightly lower than the values measured from April to June (1.35 ± 1.11 ppbv) in this study and those previously measured in the summer in Shanghai (2.31 ppbv, in May) (Cui et al., 2018) and Guangzhou (2.8 ppbv, in July) (Qin et al., 2009). The mean HONO concentration in March (1.53 ± 1.25 ppbv) was higher than that measured in February and April (Fig. S3d), but it was slightly higher or close to that measured in May and June. Chamber studies have found that HONO is responsible for the initiation of photosmog reactions (Rohrer et al., 2005). It is reasonable to postulate that HONO plays an important role in the secondary chemistry responsible for particle formation in March.
3.2 Possible promotion effect of HONO photolysis on aerosol formation in winter
The oxidation of precursors by OH radicals is the main mechanism of secondary aerosol formation in the troposphere. After partially ruling out the possible influence of PBL variations by normalizing the concentrations of all of the pollutants to CO (Cheng et al., 2016) and BC (Liggio et al., 2016), we found all of the secondary species, including sulfate, nitrate, and ammonium, exhibit obvious daytime peaks from 07:00 to 18:00 (UTC+8:00) (Fig. S5c) (Cheng et al., 2016). Similar trends were observed after the concentrations of the pollutants were normalized to BC (not shown). This suggests that they may be related to the photochemistry.
Photolysis of H2O2, HCHO, O3, and HONO and the reaction between NO and HO2 are known sources of OH radicals in the atmosphere (Alicke et al., 2003; Volkamer et al., 2010; Tan et al., 2018; Tang et al., 2015). In this study, the concentrations of H2O2, HCHO, and HO2 were unavailable. Thus, their contributions to OH production are not discussed here. However, it is commonly believed that the photolysis of HONO is the dominant source of OH in the dawn and dusk periods (Holland et al., 2003), contributing up to 60 % of the daytime OH source in winter (Spataro et al., 2013; Rohrer et al., 2005). In addition, it has been confirmed that HONO is the dominant OH source at various locations (Tan et al., 2018; Y. H. Liu et al., 2019; Tan et al., 2017; Aumont et al., 2003). Therefore, it is meaningful to discuss the possible contribution of HONO to secondary aerosol formation through OH production. We simply compared the OH production via photolysis of HONO () with the O1D production rate from O3 () (Fig. 2) when the PM2.5 concentration was larger than 50 µg m−3 and the RH was less than 90 % to understand the chemistry occurring during pollution events. Under these conditions, the local chemistry should be more important since 75 % of the time, the wind speed was less than 1.0 m s−1 (Fig. S6). The details of the JHONO and calculations are described in the Supplement, and their time series are shown in Fig. S7. On polluted days in winter, the daytime POH-HONO was always significantly higher than the in winter, and the maximum POH-HONO and were 1.73 ± 0.86 × 10⁷ molec. cm−3 s−1 (2.43 ± 1.21 ppb h−1) and molec. cm−3 s−1 (1.45 ± 1.49 ppb h−1), respectively (Fig. 2a). Due to the high HONO concentration accumulated throughout the night, the maximum POH-HONO in winter was about 2–6 times that observed in the winter in Colorado, United States (∼0.59 ppb h−1) (Kim et al., 2014), New York, United States (∼0.40 ppb h−1) (Kanaya et al., 2007), and Nanjing, China (0.90 ± 0.27 ppb h−1) (Y. Liu et al., 2019). In the period from April to June, the daily maxima of POH-HONO and were 2.48 ± 1.42 × 10⁷ molec. cm−3 s−1 (3.48 ± 1.99 ppb h−1) and molec. cm−3 s−1 (9.15 ± 5.86 ppb h−1), respectively. These results imply that the relative importance of the photolysis of HONO compared with that of O3 for initiating the daytime HOx and ROx chemistry on polluted days is more important in winter than from April to June because the production of OH from the photolysis of O3 should be directly proportional to . This is consistent with the previous findings that HONO photolysis dominates the primary OH source in winter in the BTH (Xing et al., 2019; Tan et al., 2018), Colorado, and New York City (Ren et al., 2006; Kim et al., 2014), while the photolysis of O3 and HCHO-related reactions usually dominates OH production in summer (Alicke et al., 2003).
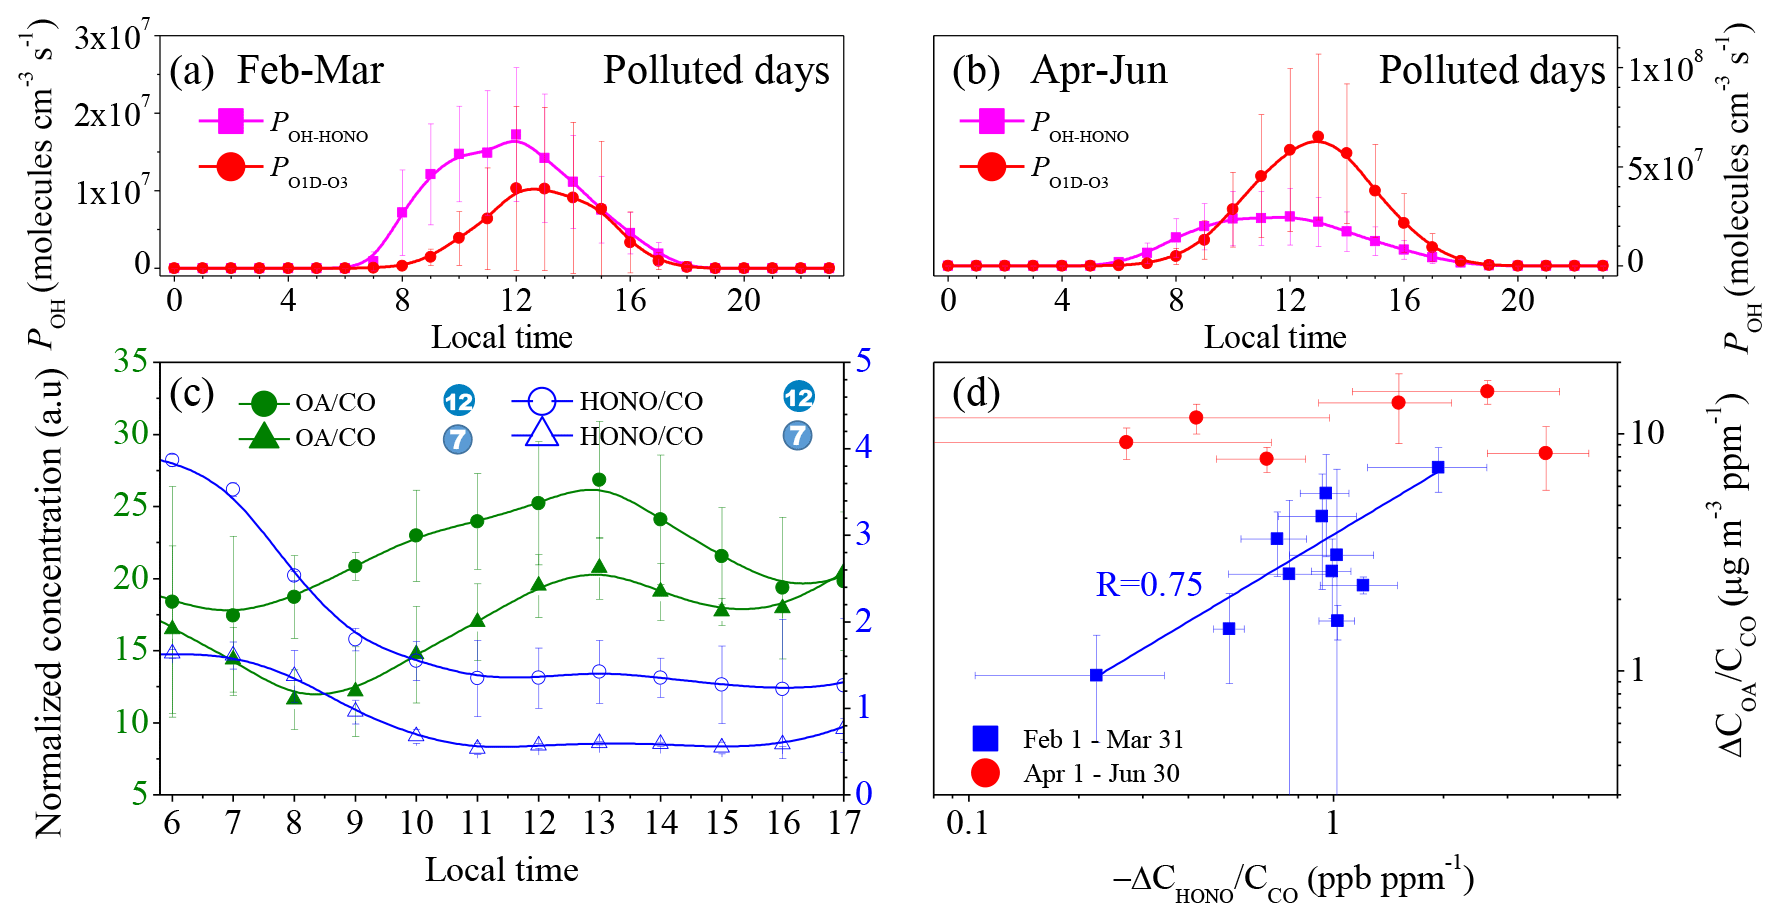
Figure 2Contribution of HONO to OH production and the correlation between the OA and HONO concentrations. Diurnal production rates of OH from the photolysis of HONO and O3 on polluted days, with PM2.5 concentrations of greater than 50 µg m−3 and RH values of less than 90 %. (a) From 1 February to 31 March; (b) from 1 April to 30 June; (c) daytime variation in the OA∕CO and HONO∕CO concentrations for the 7th and 12th episodes; and (d) correlation between the daytime increase in OA∕CO and the HONO∕CO consumed.
The oxidation of trace gas pollutants, in particular VOCs, by OH is their main removal pathway in the troposphere (Atkinson and Arey, 2003), subsequently contributing to secondary aerosol formation (Kroll and Seinfeld, 2008). A very recent study has found that the oxidation of VOCs from local traffic emissions is still efficient, even under pollution conditions (Guo et al., 2020). This means that high HONO concentrations may promote SOA formation after sunrise because HONO is an important primary OH source in the early morning. To confirm this assumption, 12 episodes in winter were further analyzed (Fig. 1). The dataset for stagnant meteorological conditions, which is characterized by low wind speeds (<1.0 m s−1, Fig. S5d), was analyzed to decrease the contribution of transport to the observed HONO and OA. The 1st, 3rd, and 5th episodes were clean days, and the other nine episodes were typical haze events with durations of more than 2 d. The features of these episodes are summarized in Table S2. Figure 2c shows the CO-normalized daytime profiles of OA and HONO in the 7th and 12th episodes as two examples. In all of the selected cases, HONO exhibited a quick reduction due to photolysis after sunrise, and, simultaneously, the OA concentration began to increase. This is similar to the evolution of the concentration of pollutants in a typical smog chamber experiment. Figure 2d shows the formation of OA (ΔCOA∕CCO) as a function of the consumed HONO (). Except for the fourth episode, which was highly affected by the firework emissions during the Spring Festival, ΔCOA∕CCO exhibits a linear dependence on in the winter (R=0.75). This type of correlation was not observed for the pollution events from April to June because the relative importance of HONO photolysis to the primary OH production decreased (Fig. 2d). It should be noted that the oxidation of biogenic alkenes by O3 may also contribute to OA formation. However, anthropogenic VOCs rather than biogenic VOCs dominated the wintertime VOCs in Beijing (C. Liu et al., 2017). Although vehicles can emit isoprene (Zou et al., 2019), the contribution of isoprene to the observed increase in the OA concentration should be unimportant due to the low concentration of isoprene in winter (Zou et al., 2019). Therefore, it is reasonable to conclude that the increase in the OA concentration in the daytime may be primarily resultant of the oxidation of VOCs by OH.
Similar to OA, in winter, ΔCnitrate∕CCO also exhibited a good linear correlation with (R=0.67, Fig. S5e), suggesting that the increase in the particle-phase nitrate in the daytime was also promoted by the OH radicals. Interestingly, ΔCammonium∕CO also exhibited a good correlation with (R=0.61, Fig. S5e), although particle-phase ammonium should not be directly related to the oxidation of NH3 by OH. We attribute the increase in ammonium to the enhanced neutralization of sulfate and nitrate by NH3 (Wang et al., 2018; Wen et al., 2018; Sun et al., 2018) because the amount of NH3 was adequate to neutralize both the sulfate and nitrate (Fig. S8). This is consistent with the results of a recent study, which reported that the role of photochemical reactions is important in daytime nitrate formation, while the hydrolysis of N2O5 mainly contributes to nighttime nitrate (Tian et al., 2019). Although a recent study found that the daytime hydrolysis of N2O5 on hygroscopic aerosols is also an important source of daytime nitrate in the winter in Beijing (H. Wang et al., 2017), the linear correlation between ΔCnitrate∕CCO and ΔCHONO∕CCO implies that at least the promotion effect of HONO on nitrate formation cannot be excluded. However, the correlation between ΔCsulfate∕CCO and was much weaker (R=0.26), suggesting a weak connection between particle-phase sulfate and gas-phase H2SO4. This is also consistent with the previous understanding that heterogeneous reactions of SO2 are the dominant pathway for sulfate formation (B. Zheng et al., 2015; He et al., 2018; Zhang et al., 2020). Overall, the results of this study qualitatively support the recent modeling results that show that HONO may promote aerosol production in winter (J. Zhang et al., 2019; J. W. Zhang et al., 2019; Xing et al., 2019; An et al., 2013) based on observations.
3.3 HONO budget during pollution events
To understand the possible sources of HONO during pollution events in winter, the HONO budget was calculated for the events for which the PM2.5 concentrations were greater than 50 µg m−3 and the RH values were less than 90 % according to the method described in Sect. 2.2.
3.3.1 Vehicle emissions
The Evehicle was calculated using Eq. (2), the relative emission rate of HONO to NOx, and the emission inventory of NOx from vehicles. First, the HONO∕NOx ratio was calculated according to the method reported by Xu et al. (2015) and Li et al. (2018) for the fresh nighttime plumes, which strictly satisfy the following criteria: (1) NOx>45 ppb (highest 25 % of NOx data); (2) , with a good correlation between NO and NOx (R>0.9, P<0.05); (3) a good correlation between HONO and NOx (R2>0.65, P<0.05); and (4) dataset from 05:00 to 08:00. The mean emission ratio of HONO to NOx was 1.8 ± 0.5 % based on five fresh vehicle exhaust plumes during our observations (Table S3). This value is higher than values in Hong Kong (1.2 ± 0.4 %) (Xu et al., 2015), Beijing (1.3 %) (W. Zhang et al., 2018), and Ji'nan (0.53 ± 0.20 %) (Li et al., 2018) obtained using the same method, while it is comparable with the results of tunnel experiments (2.1 %) carried out in Beijing (Yang et al., 2014). Second, the low HONO concentration should be companied by a high NOx concentration and a high ΔNO∕ΔNOx ratio if direct emissions from vehicles are the major source of HONO and the source of the secondary formation was negligible in the urban atmosphere. Therefore, we further estimated the HONO∕NOx ratio using the lower limit correlation method (Li et al., 2012). In the 2-D space of HONO vs. NOx (Fig. S8), the data below the 2nd percentile of HONO∕NOx and with ΔNO∕ΔNOx values of greater than 0.8 were chosen for the linear correlation. The ratio of ΔHONO∕ΔNOx was 1.17 ± 0.05 %. It should be noted that an interference from the sampling inlet caused a 6.7 % overestimation of the HONO concentration based on control experiments with 100 ppb of NO2 at 50 % RH. Thus, the ratio of ΔHONO∕ΔNOx should be 1.09 ± 0.05 % when the interference from the sampling inlet is taken into consideration. This value is lower than that estimated using the empirical method discussed above, but it is very close to the values measured in Hong Kong (1.2 ± 0.4 %) (Xu et al., 2015) and (1.23 ± 0.35 %) (Liang et al., 2017), Guangzhou (1.0 %) (Li et al., 2012), and Beijing (1.3 % and 1.41 %) (W. Zhang et al., 2018; Meng et al., 2020). Finally, several studies have measured the direct emission of HONO from vehicle exhaust. The HONO∕NOx was determined to be 0.18 % for gasoline cars based on chassis dynamometer tests in China (Y. Liu et al., 2017), while it was measured to be 0 %–0.95 % for gasoline vehicles and 0.16 %–1.0 % for diesel vehicles measured during real-world driving test cycles in Japan (Trinh et al., 2017). Thus, three levels of the vehicle emissions factor were considered. The middle value was 1.09 ± 0.05 %, which is very close to the mean (1.21) of the emission ratios reported in China (Li et al., 2018; Xu et al., 2015; Yang et al., 2014; Y. Liu et al., 2017; Gall et al., 2016; Meng et al., 2020), while 0.18 % (Y. Liu et al., 2017) and 1.8 % were the lower limit and the upper limit, respectively.
The Evehicle was calculated using the hourly NOx emission inventory from vehicles in Beijing (Yang et al., 2019) after converting the data to the emission flux of HONO () and the PBL height as described in Sect. 2.2. Thus, the calculated emission rate reflected the diurnal variations in both the emission inventory and the PBL height. The calculated hourly middle value of Evehicle obtained using an HONO∕NOx ratio of 1.09 % was from 0.079 ± 0.038 to 0.32 ± 0.15 ppbv h−1, which was slightly higher than the daytime emission rate of HONO in Xi'an (R.-J. Huang et al., 2017). This is reasonable when the vehicle population in Beijing is taken into consideration. The lower limit of Evehicle was 0.013 ± 0.006–0.053 ± 0.023 ppbv h−1, which was close to the estimated emission rate of HONO in Ji'nan (Li et al., 2018). The upper limit was 0.13 ± 0.06–0.53 ± 0.23 ppbv h−1.
3.3.2 Soil emissions
The emission flux of HONO from soils depends on the water content, nitrogen nutrient content, and temperature of the soil (Oswald et al., 2013). Oswald et al. (2013) measured the emission flux of HONO from 17 soil samples, including eucalyptus forest, tropical rain forest, coniferous forest, pasture, woody savannah, grassland, stony desert, maize field, wheat field, jujube field, and cotton field. Tropical rain forest, coniferous forest and grassland are the typical plants in downtown Beijing (H. Huang et al., 2017), and their emission fluxes of HONO are comparable (Oswald et al., 2013). Thus, we used the emission flux from grassland to calculate the emission rate of HONO from the soil in Beijing because the temperature-dependent and water-holding-content-dependent emission flux of HONO from grassland soil was available. Three levels of water content including 25 %–35 %, 35 %–45 %, and 45 %–55 % were considered. The temperature dependence of FHONO was calculated using the mean value of the FHONO for the different water contents, and the lower limit and upper limit of FHONO were calculated using the emission flux for water contents of 45 %–55 % and 25 %–35 %, respectively. The lower limit, the middle value, and the upper limit of the Esoil calculated using Eq. (2) are 0.0032 ± 0.0027–0.013 ± 0.014, 0.0046 ± 0.0039–0.020 ± 0.20, and 0.0057 ± 0.0047–0.025 ± 0.024 ppbv h−1, respectively.
3.3.3 Homogeneous reaction between NO and OH
Direct measurements of the OH concentration were unavailable in this study, so several methods were used to estimate the ambient OH concentration. In winter in Beijing, it has been found that the OH concentration is linearly correlated with ; that is, molec. cm−3 (Tan et al., 2019). However, Tan et al. (2018) reported a larger conversion factor (4.33×10¹¹ molec. cm−3). Li et al. (2018) estimated the OH radical concentration considering both the photolysis rate and NO2 concentration; i.e.,
Overall, the OH concentrations estimated using Eq. (15) were comparable with those estimated by Tan et al. (2019) (Fig. S10c). The method of calculating the photolysis rates is described in the Supplement, and the time series of the photolysis rates are shown in Fig. S7. On polluted days, the high concentrations of NO2 resulted in the OH concentrations estimated using Eq. (15) being lower. Therefore, the corresponding PNO-OH was taken as the lower limit for the homogeneous reaction between NO and HONO because pollution events are discussed in this study, while the PNO-OH calculated using the OH concentration ( molec. cm−3) (Tan et al., 2018) was taken as the upper limit, and the PNO-OH calculated using the OH concentration ( molec. cm−3) (Tan et al., 2019) was the middle value. At night, the OH concentration generally varied from 1.0×10⁵ molec. cm−3 (Li et al., 2012; Tan et al., 2018) in winter to 5×10⁵ molec. cm−3 in summer (Tan et al., 2017). The nighttime OH concentration was estimated to be linearly correlated with the product of the nighttime O3 concentration and the alkenes' concentration; i.e.,
The time series of the OH concentration calculated using the different methods are shown in Fig. S11. Thus, the lower limit, the middle value, and the upper limit of PNO-OH calculated using Eqs. (3) and (4) are 0.007 ± 0.019–0.43 ± 0.26, 0.026 ± 0.053–0.99 ± 0.79, and 0.028 ± 0.053–2.14 ± 1.71 ppbv h−1, respectively. The calculated middle value of PNO-OH (mean daytime value of 0.49 ± 0.35 ppb h−1) is comparable with the values estimated by Li et al. (2018) (0.4 ppb h−1) and R.-J. Huang et al. (2017) (0.28 ppb h−1). It should be noted that the measured NO concentration was used to calculate the PNO-OH. In addition to vehicle emissions, power plants and industries also contribute to the NO emissions. A total of 40 % of the NOx was from vehicle emissions according to the NOx emission inventory for Beijing (He et al., 2002).
It should be noted that the OH concentration was estimated based on (Tan et al., 2019, 2018) or and (Li et al., 2018). As was discussed in Sect. 3.2, HONO was an important primary OH source in the daytime. Unfortunately, it could not be parameterized to calculate the OH concentration because the measured and modeled OH concentrations were unavailable in this study. This may lead to an underestimation of the early daytime OH concentration and, subsequently, to the underestimation of the contribution of the homogeneous reaction of NO with OH to the HONO source. This needs to be further investigated in the future.
3.3.4 Photolysis of nitrate
A recent study reported the photolysis rate of nitrate (Jnitrate) in ambient PM2.5 at a solar zenith angle of 0∘ (Bao et al., 2018). The Jnitrate varied from to s−1, with a mean value of s−1. These values were further normalized according to the zenith angle and UV light at our observation station to calculate the lower limit, the upper limit, and the middle Jnitrate. The time series of the measured nitrate concentration and the middle value of Jnitrate are shown in Figs. 1 and S7, respectively. Therefore, the corresponding daytime lower limit, middle value, and upper limit of HONO from the photolysis of nitrate were calculated to be 0.0011 ± 0.0021–0.096 ± 0.092, 0.0072 ± 0.0021–0.66 ± 0.092, and 0.042 ± 0.082–3.86 ± 0.008 ppbv h−1, respectively, using Eqs. (3) and (8).
3.3.5 Heterogeneous reactions of NO2 on aerosol and ground surfaces
The production of HONO from heterogeneous reactions of NO2 on aerosol surfaces was calculated using Eqs. (3) and (5). The aerosol surface concentration was measured using an SMPS. The NO2 uptake coefficient (γ) on the different particles varies from to (Ndour et al., 2009; Underwood et al., 2001, 1999), but the recommended value is (Crowley et al., 2010), which was used to calculate the Paerosol as the base case. It has been found that the γ value highly depends on the relative humidity (RH). The lower limit bound of Paerosol was calculated based on the RH-dependent NO2 uptake coefficient on kaolinite (), while the upper limit of Paerosol was calculated according to the RH-dependent γ on hematite ( (Liu et al., 2015). The heterogeneous reaction of NO2 on BC was also considered at night. The surface area concentration of BC was calculated based on its specific area (87 m2 g−1) (Su et al., 2018) and the measured mass concentration. The on BC is , and the HONO yield is 0.8 (Han et al., 2013). The light-enhanced γ of NO2 () on mineral dust was further parameterized (Ndour et al., 2008) after normalizing it to the solar radiation intensity in Beijing.
The contribution of the heterogeneous reaction of NO2 on ground surfaces was calculated in a way similar to that used for mineral dust. The same kinetics as those for the heterogeneous reaction of NO2 on aerosol surfaces were used to calculate the nighttime contribution of the reactions on the ground surface (Zhang et al., 2016; Aumont et al., 2003). A recent study observed that UV light causes a significant enhancement of NO2 and HONO formation on real urban grime (J. Liu et al., 2019). Thus, the RH-dependent kinetic data measured on urban grime ( RH) were used to calculate the daytime upper limit for the heterogeneous uptake of NO2 on the ground surfaces. The As of aerosols varied from to m−1, with a mean value of 1.4 ± 0.5 × 10⁻³ m−1, during pollution events. This value is comparable with that used in modeling studies (Zhang et al., 2016; Aumont et al., 2003). The As of the ground surfaces, which was calculated using Eqs. (6) and (7), varied from to m−1, with a mean value of 1.3 ± 0.9 × 10⁻² m−1, during pollution events. The surface roughness was calculated to be 3.85 using Eq. (7). The YHONO was set to 0.5 because of the hydrolysis reaction of NO2 (Liu et al., 2015), while it was set to 0.8 for the light-enhanced reaction (J. Liu et al., 2019; Ndour et al., 2008) and that on BC (Han et al., 2013).
The lower limit, the middle value, and the upper limit of Paerosol were 0.00012 ± 0.00009–0.0025 ± 0.0021, 0.00043 ± 0.00020–0.0028 ± 0.0038, and 0.0022 ± 0.0012–0.0050 ± 0.0038 ppbv h−1, respectively. The corresponding Pground values were 0.00027 ± 0.00017–0.0020 ± 0.0012, 0.0014 ± 0.00095–0.0089 ± 0.006, and 0.0025 ± 0.0023–0.060 ± 0.032 ppbv h−1, respectively. The Paerosol calculated in this study was much lower than that estimated by R.-J. Huang et al. (2017) because different calculation methods were used. In their study, the production rate of HONO was estimated based on the conversion rate (R.-J. Huang et al., 2017), while in this study, it was calculated based on the measured aerosol surface area concentration and NO2 uptake coefficient on different particles. In addition, the calculated Paerosol was 2–4 orders of magnitude lower than that of other sources due to the very small value on particle surfaces.
It should be pointed out that the HONO production from heterogeneous reactions of NO2 on both aerosol and ground surfaces greatly depends on the and As values. The As of aerosols is comparable with the modeling input. However, the nighttime (10−8–10−7) values used in this study are smaller than the () values used in the modeling studies (Zhang et al., 2016; Aumont et al., 2003; Gall et al., 2016). This leads to a lower production rate of HONO from the heterogeneous reaction of NO2 on aerosols. As for the heterogeneous reaction of NO2 on ground surfaces, in addition to the small values used in this study, the As of the ground surfaces (0.0015 to 0.0385 m−1), which was calculated using the surface roughness and the PBL height, was also significantly lower than the fixed value of 0.3 m−1 used in the modeling studies, which may have led to the overestimation of the contribution of the HONO production of the heterogeneous reaction of NO2 on the ground surfaces. It should be noted that the initial uptake coefficient (γini) was parameterized in this study. This led to the overestimation of the contribution of the heterogeneous reaction of NO2 to the HONO source because the steady-state uptake coefficient is usually 1 order of magnitude lower than γini (Han et al., 2013; Liu et al., 2015). These results reveal that the heterogeneous reaction should be unimportant for the HONO source in Beijing.
3.3.6 Sinks of HONO
The loss rates of HONO by photolysis (Lphotolysis), the homogeneous reaction with OH radicals (LHONO-OH), and dry deposition were calculated using Eqs. (9)–(11). The daytime JHONO varied from to s−1 on polluted days in winter, and it ranged from to s−1 from April to June. These values are comparable to the modeling results (– s−1) (Gall et al., 2016). The daytime Lphotolysis values were 0.03–5.23 and 0.25–7.10 ppb h−1 in the winter and in the other months, respectively. It was the primary HONO sink in the daytime. It was determined that the value varied from 0.0049 to 0.069 ppbv h−1 in winter using a kHONO-OH value of cm3 molec.−1 s−1 (Atkinson et al., 2004) and the middle value of the OH concentrations. It varied from 0.0050 to 0.085 ppbv h−1 from April to June. The Ldeposition value calculated using Eq. (11) was 0.004–0.056 ppbv h−1 in winter and 0.004–0.030 ppbv h−1 from April to June.
As was noted in Sect. 2.2, the vertical transport by advection is an important nocturnal sink of HONO (Gall et al., 2016). In this study, the vertical distribution of HONO concentration was unavailable. Recently, Meng et al. (2020) measured the vertical distribution of HONO in Beijing in December 2016. The concentration of HONO exhibited a nearly flat profile from ground level to 240 m during pollution events after sunset, while negative profiles of HONO were observed during pollution events at night (Meng et al., 2020). The nighttime concentration gradient derived from the nighttime dataset was 0.0047 ± 0.0025 ppb m−1 (Meng et al., 2020). Because the daytime vertical gradient of the HONO concentration is unavailable in Beijing, we did not calculate the daytime vertical transport. However, the eddy diffusivity of the heat in an urban environment was measured in New Delhi, India (Yadav et al., 2003). Using their dataset for wind speeds of less than 2.0 m s−1, we derived the relationship between Kh and the wind speed (WS) ( m2 s−1). According to Eq. (12), the nighttime Tvertical ranged from 0.15 to 0.37 ppbv h−1 in winter, while it ranged from 0.12 to 0.68 ppbv h−1 from April to June. Because the wind speed was usually lower than 1.0 m s−1 during pollution events (Fig. S6), the contribution of the horizontal transport to the daytime HONO sources and sinks decreased because of the short lifetime of HONO. At night, in the winter, 79 % of the surface wind speeds were lower than 1.0 m s−1 on pollution days when the PM2.5 concentration was greater than 50 µg m−3 and the RH was less than 90 %; thus the air masses from suburban areas should influence the sources and sinks of HONO in Beijing. If the background HONO concentration is zero, the vertical and horizontal transport rate of HONO calculated using Eq. (13) varied from 0.17 to 0.61 ppbv h−1 on haze days in winter and from 0.15 to 0.74 ppbv h−1 during pollution events from April to June. These values are higher than those calculated using Eq. (12). Because the background HONO concentration was unavailable, in the following section, we only considered the nighttime transport calculated using Eq. (12).
3.3.7 Comparison among the different HONO sources
Figure 3 summarizes the diurnal patterns of each source with different parameterizations during the pollution events from February to March. The black dots and lines indicate the middle values, while the shaded area indicates the corresponding lower bound and upper bound. In the nighttime, vehicle and soil emissions and the homogeneous reaction between NO and OH were the important sources of HONO. In the daytime, however, the photolysis of nitrate and the homogeneous reaction between NO and OH were the predominant sources of HONO. Heterogeneous reactions of NO2 on the aerosol and ground surfaces were unimportant compared with the other sources because of the very low uptake coefficient compared with those used in the modeling studies (Zhang et al., 2016; Aumont et al., 2003).
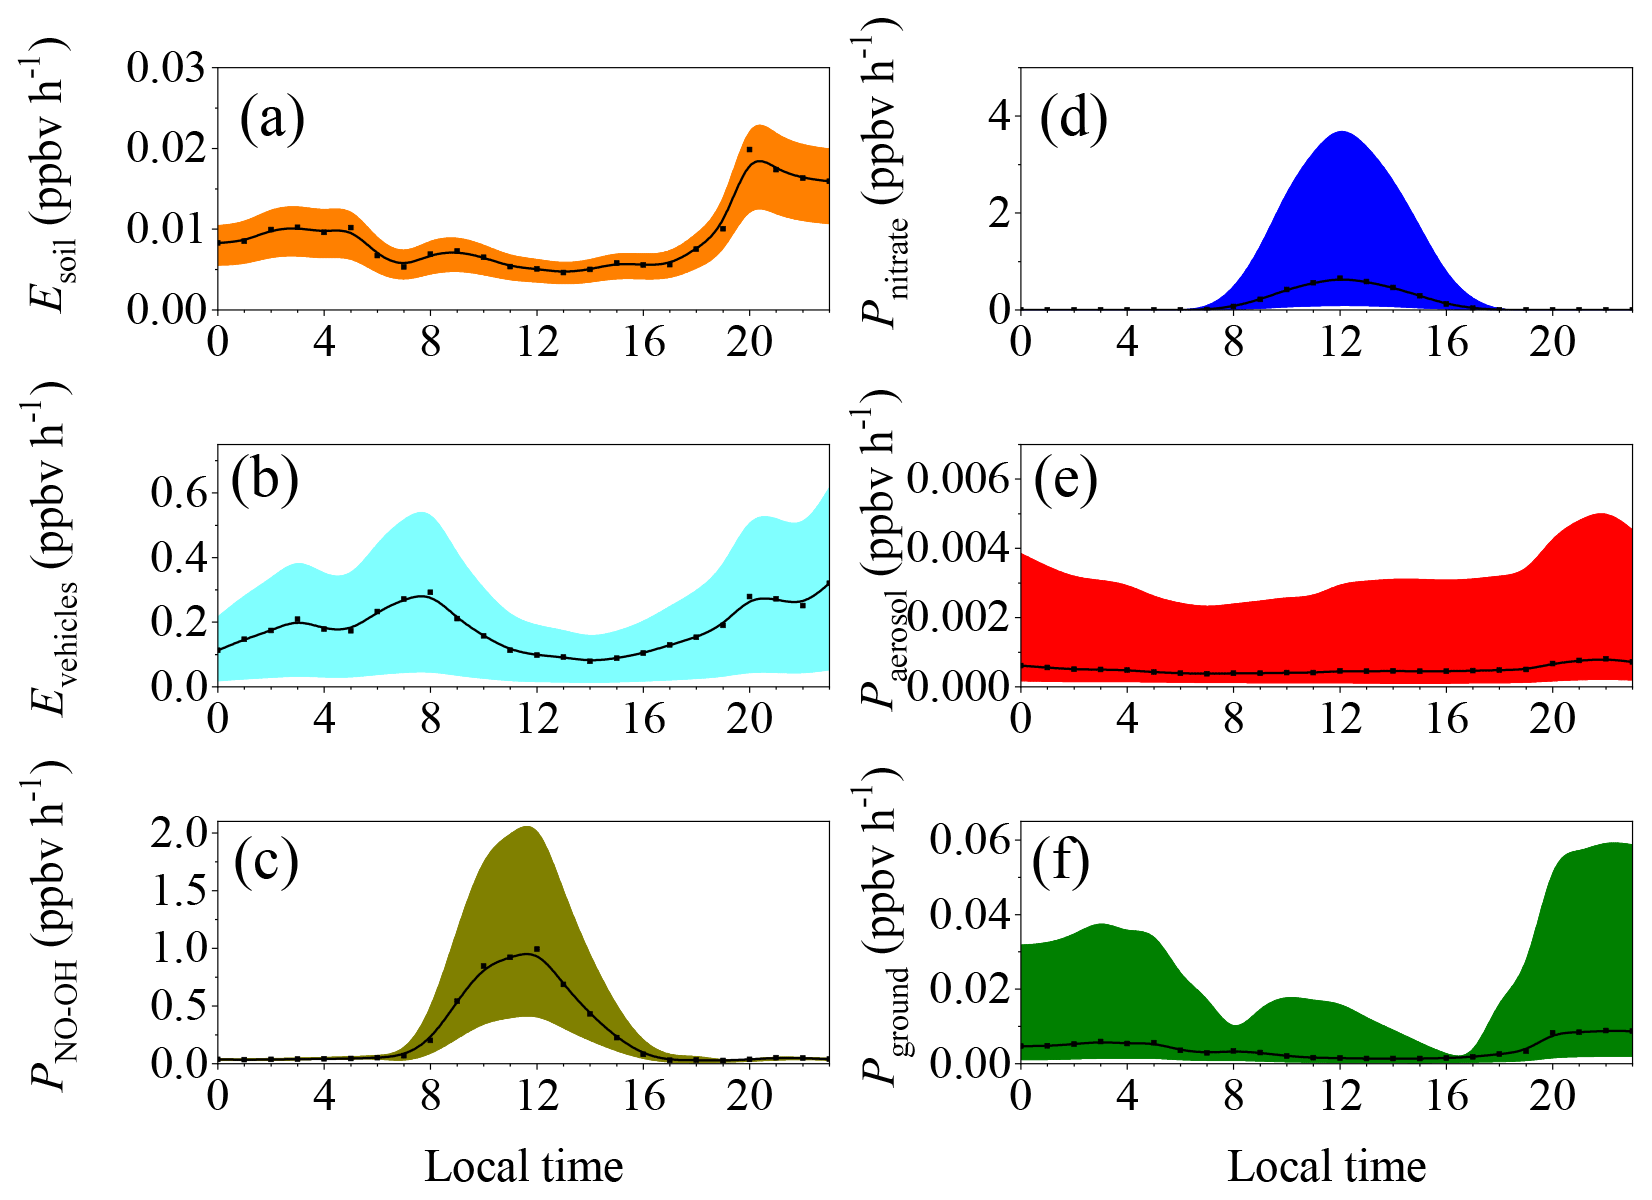
Figure 3Diurnal pattern of the HONO sources calculated using different parameterizations. The lower bound, the middle value, and the upper bound of (a) the soil emissions calculated based on water contents of 45 %–55 %, 35 %–45 %, and 25 %–35 %; (b) vehicle emissions with emission factors relative to NOx of 0.18 %, 1.17 ± 0.05 %, and 1.8 %; and (c) the production from the reaction between NO and OH, the concentrations of which were estimated using the methods of Xu et al. (2015) and Tan et al. (2019).
Figure 4a–f show the HONO budget estimated using the middle values of the parameters during the pollution events. The mean production rate of HONO of these identified sources was 0.16–1.76 ppbv h−1, while the corresponding loss rate was from 0.21–2.34 ppbv h−1 during the pollution events in winter. The main loss of HONO was through photolysis during the daytime (1.74 ± 0.44 ppbv h−1), while it was through vertical transport in the nighttime (0.28 ± 0.08 ppbv h−1). Direct emissions from vehicle exhaust were the largest nighttime source of HONO (0.22 ± 0.06 ppbv h−1), followed by the homogeneous reaction between NO and OH (0.04 ± 0.01 ppbv h−1), emissions from soils (0.014 ± 0.005 ppbv h−1), the heterogeneous reaction of NO2 on the ground surfaces (0.006 ± 0.002 ppbv h−1), and the heterogeneous reaction of NO2 on the aerosol surfaces (0.0005 ± 0.0001 ppbv h−1). PNO-OH and Pnitrate dominated the daytime HONO production, with daytime mean values of 0.49 ± 0.35 ppbv h−1 and 0.34 ± 0.23 ppbv h−1, respectively. As is shown in Fig. 4, these six sources still underestimate the daytime sources of HONO. The Punknown was 0.25 ± 0.24 ppbv h−1 in February and March, while it was 0.50 ± 0.38 ppbv h−1 from April to June.
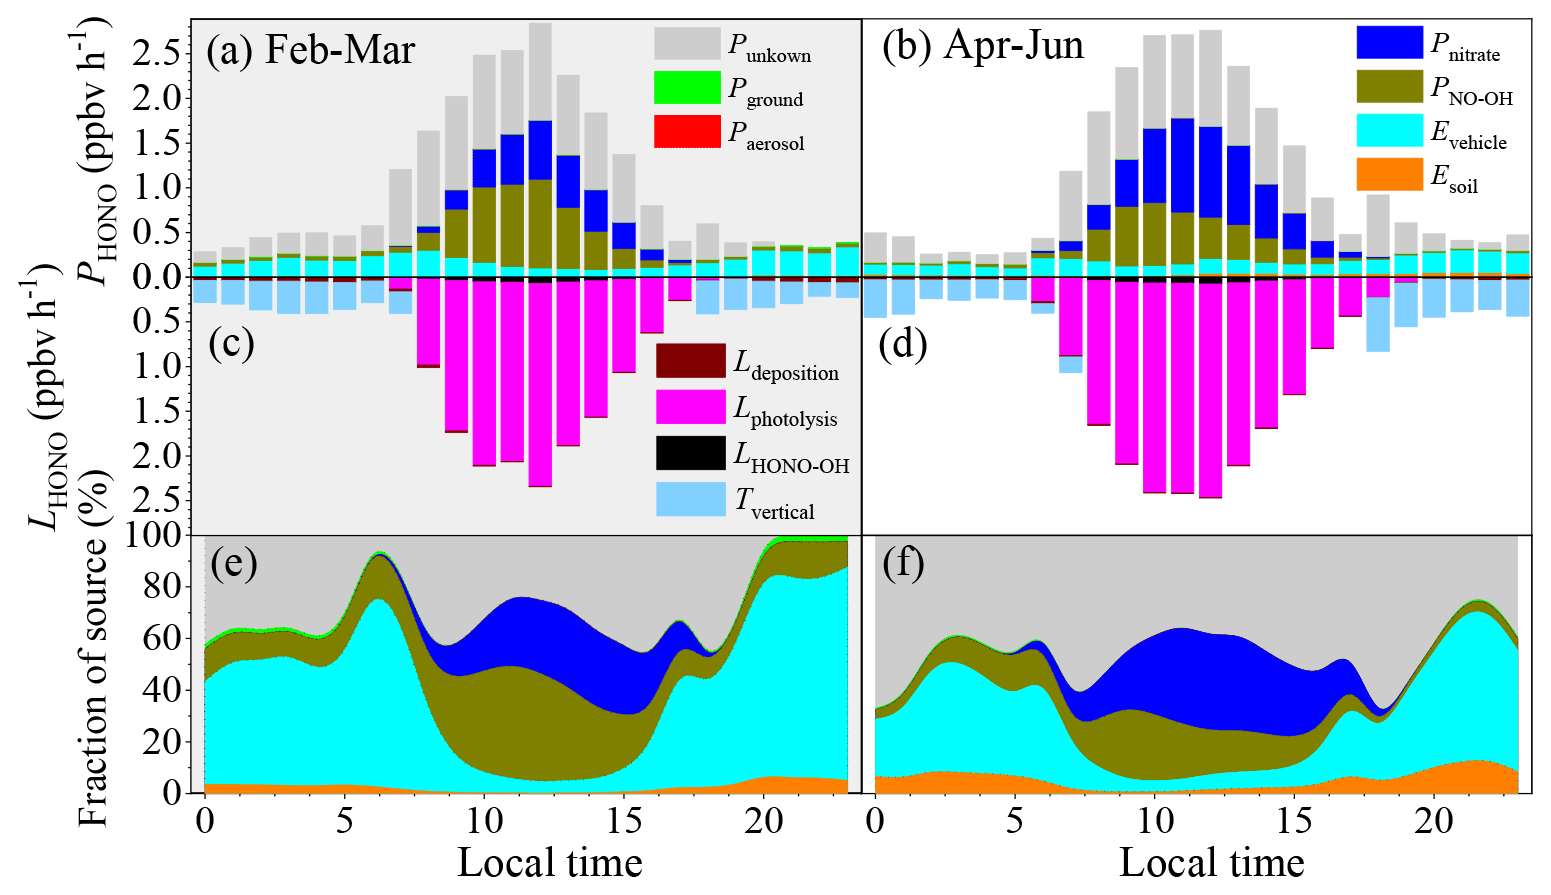
Figure 4The HONO budget. (a, b) Diurnal production rates of HONO; (c, d) loss rates of HONO; (e, f) relative contributions of each source on polluted days with PM2.5 concentrations of greater than 50 µg m−3 and RH values of less than 90 %. Panels (a), (c), and (e) show the data from 1 February to 31 March, and panels (b), (d), and (f) show the data from 1 April to 30 June.
The Evehicle contributed 57.3 ± 17.9 % and 33.9 ± 15.2 % to the nighttime HONO sources from February to March and during the other months, respectively, even when the Punknown value was taken into consideration. The relative contribution of the daytime Evehicle decreased to 12.6 ± 14.3 % in winter and was 9.3 ± 8.4 % from April to June. Thus, the daily mean Evehicle fractions were 40.5 ± 27.5 % and 24.3 ± 17.7 % from February to March and from April to June, respectively. This means that Evehicle dominated the nighttime HONO source during the pollution events in Beijing, which is consistent with the results of previous studies, i.e., that vehicle emissions were the major nighttime HONO source (51.1 %–52 %) in Beijing (J. W. Zhang et al., 2019; Meng et al., 2020). As was pointed out in Sect. 3.3, Evehicle was calculated based on the NOx inventory from the vehicle sector. However, NO is prone to be quickly converted to NO2 and NOz in the atmosphere (e.g., HONO, HNO3, N2O5, peroxyacetyl nitrate (PAN), and organonitrate) by O3, HO2, RO2, and OH. It is reasonable to assume that local traffic emissions dominate the ambient NO source in an urban environment. Thus, the homogeneous reaction between NO and OH in the atmosphere could also be related to vehicle exhaust. As is shown in Fig. 3, the diurnal curve of PNO-OH coincides well with that of the OH concentration (Fig. S10). This means that the PNO-OH value should be primarily determined by the OH concentration. However, the PNO-OH value should still reflect the indirect contribution of traffic-related emissions to the HONO source because the ambient NO concentration was used to calculate the PNO-OH value. Traffic-related HONO sources (Evehicles+PNO-OH) may contribute 59.3 ± 20.7 % and 36.2 ± 14.4 % to the daily HONO source in winter and in the other months, respectively. Even if 40 % of the NOx was from vehicle exhaust in Beijing (He et al., 2002), traffic-related sources (Evehicles+0.4PNO-OH) may still contribute 48.1 ± 24.3 % in winter and 29.6 ± 16.2 % from April to June due to the corresponding daily HONO source. The contribution of the traffic-related sources was still an important daytime source of HONO (42.3 ± 10.3 % for Evehicles+PNO-OH and 24.4 ± 11.3 % for Evehicles+0.4PNO-OH) on the polluted days in winter.
As is shown in Fig. 3, uncertainties existed when calculating each HONO source. To further understand the role of traffic emissions, we also estimated the lower limit of the traffic-related contribution as follows. (1) The lower limit of Evehicle was obtained by using the lowest reported HONO∕NOx emission ratio from vehicles (0.18 %) (Y. Liu et al., 2017) rather than the value of 1.09 %, which was the empirical value calculated based on the field measurements (Fig. S7). (2) The lower limit for the homogeneous reaction between NO and OH radical was calculated using the method of Li et al. (2018). (3) The upper limit of the emission rate from the soil was estimated using the emission flux of HONO at a low water content (Oswald et al., 2013). (4) The upper limit of the HONO production rate of the heterogeneous reaction of NO2 on the aerosol surfaces was calculated using the large RH-dependent NO2 uptake coefficient on hematite (Liu et al., 2015) rather than the value recommended by Crowley et al. (2010). (5) The upper limit for the heterogeneous reaction on the ground surfaces was calculated using the RH-dependent kinetic data measured on urban grime (J. Liu et al., 2019). As is shown in Fig. 5, the traffic-related source (Evehicles+PNO-OH) contributed 38.0 ± 15.6 % to the daily HONO sources in winter when all of the NO was assumed to be dominated by local traffic emissions, whereas it contributed 31.5 ± 17.5 % when only 40 % of the NO was considered to be from local traffic emissions (He et al., 2002). Under these circumstances, the daytime Punknown of the HONO winter increased to 1.06 ± 0.36 ppbv h−1, which corresponded to 63.2 ± 10.1 % of the HONO source. This means that these assumptions may underestimate the contribution of the HONO sources. In addition, the Pground, Paerosol, and Pnitrate values could also be partially related to NOx traffic emissions (Lee et al., 2016; Tan et al., 2017). These results indicate that the contribution of traffic-related emissions may be larger than that estimated in this study. Therefore, our results at least suggest that traffic-related emissions should be a very important HONO source in winter in Beijing, but comprehensive modeling studies are required to attain more precise results.
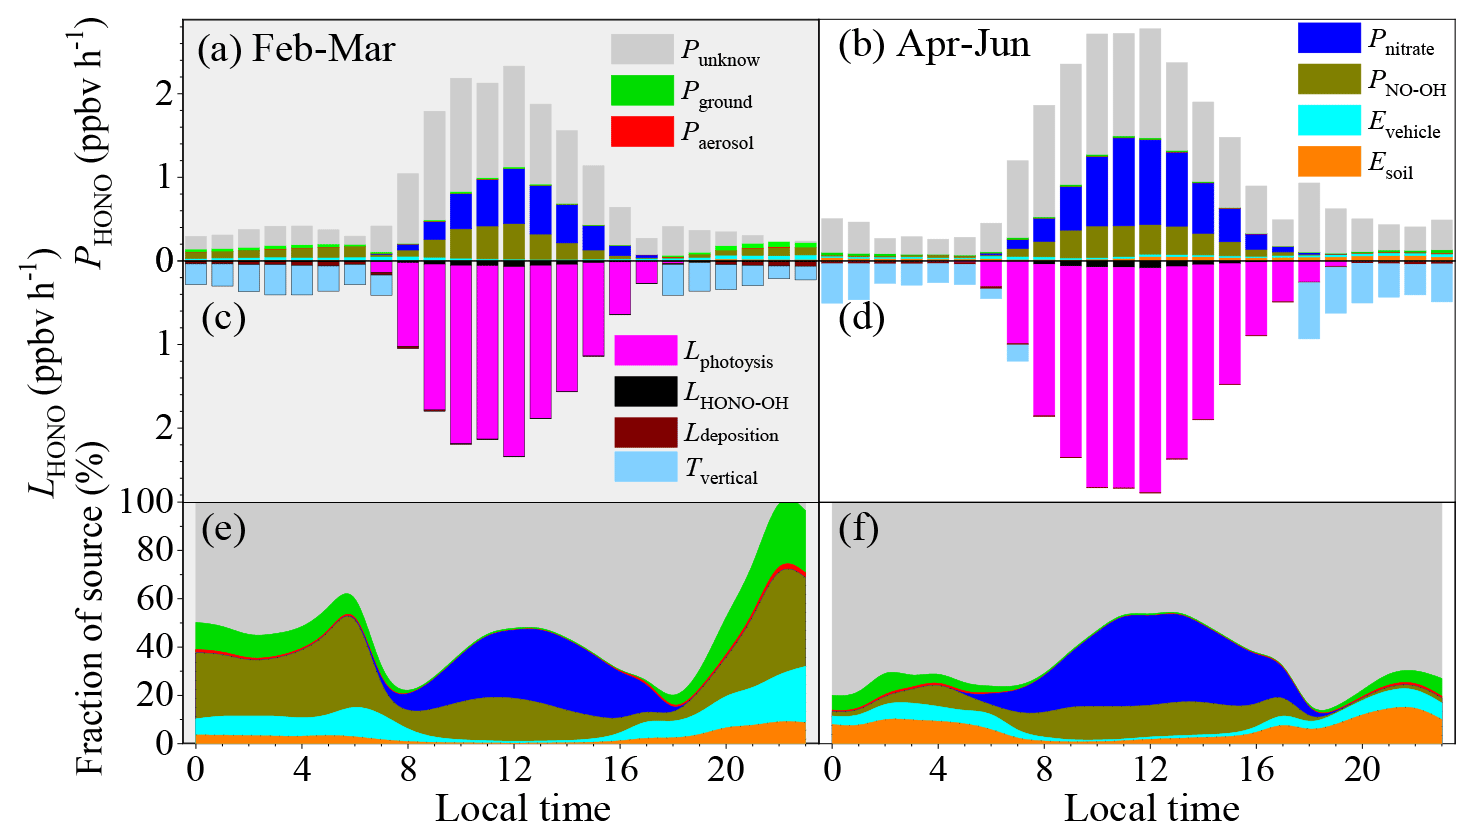
Figure 5(a–b) Diurnal production rates and (c–d) diurnal loss rates of HONO; (e–f) relative contributions of the HONO sources on polluted days with PM2.5 concentrations of greater than 50 µg m−3 and RH values of less than 90 %. The Evehicle value was calculated using the lower limit of the HONO∕NOx from vehicles (0.18 %; Liu et al., 2017d), and the PNO-OH was calculated using the lower limit of the OH concentration, while the upper limits of the Esoil, Paerosol, and Pground were used as described in the text.
In this study, we found a good correlation between the increase in the OA and nitrate mass concentrations and the consumed HONO from early morning to noon during the polluted days in winter. This suggests that HONO may promote aerosol formation during pollution events in Beijing. This promotion effect on aerosol formation could be related to OH production by the photolysis of HONO followed by the oxidation of the corresponding precursors. Our observations support the results of recent modeling studies that have shown that HONO may significantly promote secondary aerosol mass formation (J. Zhang et al., 2019; J. W. Zhang et al., 2019; Xing et al., 2019; An et al., 2013). Based on budget analysis calculations, traffic-related sources (direct emissions and conversion of NO from vehicle emissions) were an important contributor to the HONO sources during the polluted days in winter in Beijing. This means that HONO from the traffic-related sources may play an important role in aerosol mass formation in the atmosphere.
The number of vehicles in China is increasing very quickly (F. Liu et al., 2017; Wang et al., 2011). Thus, the negative influences of vehicle emissions on air quality will become more serious, especially in populous metropolitan areas (Yang et al., 2019; Guo et al., 2020), such as Beijing and Shanghai, if targeted pollution control technologies are not applied. It has been estimated that vehicles emissions account for over 40 % of the total urban NOx emissions in Beijing (He et al., 2002). In the atmosphere, NOx undergoes a very complicated reaction network, which finally leads to aerosol mass formation and the production of ozone in VOC-limited environments. Moreover, reactions with NOx also lead to the production of several reactive NOz species (Seinfeld and Pandis, 2006). In particular, HONO is an important precursor of OH, which governs the conversion of primary pollutants into secondary pollutants in the atmosphere. In addition to the indirect production of HONO from NO, vehicles also directly emit HONO. Even when the lower limit of the emission factor is used to calculate the HONO source from vehicles, the traffic-related emissions are still an important source of HONO in winter in Beijing. Therefore, this study indicates that the mitigation of HONO and NOx emissions from vehicles may be an effective way of reducing secondary aerosol mass formation and can have a positive effect on severe haze events in winter in Beijing.
It should be noted that we only considered O3 and HONO when discussing the sources of OH. Other sources such as the reaction between HO2 (and RO2) and NO, the ozonolysis of alkenes, and the photolysis of oxygenated VOCs may also contribute to the amount of OH radicals in the atmosphere (Tan et al., 2018). In the future it will be vital to comprehensively analyze the OH sources and to quantify the role of HONO in secondary aerosol mass formation, although the photolysis of HONO is the primary OH source in winter. However, as was discussed in Sect. 3.3, the uncertainties in the HONO budget may originate from the emission factors, OH concentration, and reaction kinetics. The source of HONO from vehicles was calculated based on the emission inventories, which likely have a significant bias (Squires et al., 2020). For example, the emission flux of NOx calculated using the emission inventory of Yang et al. (2019) is 2.4 ± 0.5 greater than the emission flux reported by Squires et al. (2020). In addition, the exact height of the vertical mixing of HONO was assumed to be the same as the PBL height; this may lead to an underestimation of the contributions of vehicle and soil emissions and the heterogeneous reaction on the ground surfaces. To take the next step, the emission factors from vehicle exhaust under real road conditions must be measured. When calculating the OH concentration, the correlation between the OH concentration and may vary with location and season due to their different NOx∕VOCs ratios (Holland et al., 2003). Direct measurements of the OH concentration would decrease the uncertainties in both the OH sources and the HONO budget analysis. The importance of vehicle emissions to the HONO sources also needs to be further confirmed during special periods, such as the Chinese New Year, when vehicle emissions are significantly reduced in the future. Finally, in the future, it is necessary to quantify the contribution of traffic-related sources of HONO to OH production and secondary aerosol formation based on modeling studies.
The experimental data are available upon request to the corresponding authors.
The supplement related to this article is available online at: https://doi.org/10.5194/acp-20-13023-2020-supplement.
YL, WW, and MK designed the experiments. YL wrote the paper and performed HONO budget analysis. YZ, CL, WW, YC, MG, and XW carried out HONO measurement. ZF, FZ, JC, WD, and KRD did aerosol composition measurements. BC and JK did particle size measurements. YoW, BH, and YuW analyzed meteorological data. CY, FB, JK, TP, HH, MG, and MK revised the manuscript.
The authors declare that they have no conflict of interest.
This research was financially supported by the National Natural Science Foundation of China (41877306), the Ministry of Science and Technology of the People's Republic of China (2019YFC0214701), the Academy of Finland via the Center of Excellence in Atmospheric Sciences (272041, 316114, and 315203), the European Research Council Shandong University via ATM-GTP 266 (742206), and the Strategic Priority Research Program of the Chinese Academy of Sciences and Beijing University of Chemical Technology. We thank LetPub (https://www.letpub.com, last access: 30 September 2020) for its linguistic assistance during the preparation of this manuscript.
This research has been supported by the National Natural Science Foundation of China (grant no. 41877306), the Ministry of Science and Technology of the People's Republic of China (grant no. 2019YFC0214701), the Academy of Finland via the Center of Excellence in Atmospheric Sciences (grant nos. 272041, 316114, and 315203), and the European Research Council via ATM-GTP 266 (grant no. 742206).
Open access funding provided by Helsinki University Library.
This paper was edited by John Liggio and reviewed by three anonymous referees.
Alicke, B., Geyer, A., Hofzumahaus, A., Holland, F., Konrad, S., Patz, H. W., Schafer, J., Stutz, J., Volz-Thomas, A., and Platt, U.: OH formation by HONO photolysis during the BERLIOZ experiment, J. Geophys. Res.-Atmos., 108, PHO 3-1–PHO 3-17, https://doi.org/10.1029/2001jd000579, 2003.
An, J., Li, Y., Chen, Y., Li, J., Qu, Y., and Tang, Y.: Enhancements of major aerosol components due to additional HONO sources in the North China Plain and implications for visibility and haze, Adv. Atmos. Sci., 30, 57–66, https://doi.org/10.1007/s00376-012-2016-9, 2013.
An, Z., Huang, R.-J., Zhang, R., Tie, X., Li, G., Cao, J., Zhou, W., Shi, Z., Han, Y., Gu, Z., and Ji, Y.: Severe haze in northern China: A synergy of anthropogenic emissions and atmospheric processes, P. Natl. Acad. Sci. USA, 116, 8657–8666, https://doi.org/10.1073/pnas.1900125116, 2019.
Atkinson, R. and Arey, J.: Atmospheric Degradation of Volatile Organic Compounds, Chem. Rev., 103, 4605–4638, https://doi.org/10.1021/cr0206420, 2003.
Atkinson, R., Baulch, D. L., Cox, R. A., Crowley, J. N., Hampson, R. F., Hynes, R. G., Jenkin, M. E., Rossi, M. J., and Troe, J.: Evaluated kinetic and photochemical data for atmospheric chemistry: Volume I – gas phase reactions of Ox, HOx, NOx and SOx species, Atmos. Chem. Phys., 4, 1461–1738, https://doi.org/10.5194/acp-4-1461-2004, 2004.
Aumont, B., Chervier, F., and Laval, S.: Contribution of HONO sources to the NOx/HOx/O3 chemistry in the polluted boundary layer, Atmos. Environ., 37, 487–498, https://doi.org/10.1016/S1352-2310(02)00920-2, 2003.
Bao, F., Li, M., Zhang, Y., Chen, C., and Zhao, J.: Photochemical Aging of Beijing Urban PM2.5: HONO Production, Environ. Sci. Technol., 52, 6309–6316, https://doi.org/10.1021/acs.est.8b00538, 2018.
Bianchi, F., Kurtén, T., Riva, M., Mohr, C., Rissanen, M. P., Roldin, P., Berndt, T., Crounse, J. D., Wennberg, P. O., Mentel, T. F., Wildt, J., Junninen, H., Jokinen, T., Kulmala, M., Worsnop, D. R., Thornton, J. A., Donahue, N., Kjaergaard, H. G., and Ehn, M.: Highly Oxygenated Organic Molecules (HOM) from Gas-Phase Autoxidation Involving Peroxy Radicals: A Key Contributor to Atmospheric Aerosol, Chem. Rev., 119, 3472–3509, 10.1021/acs.chemrev.8b00395, 2019.
Cheng, F., Wang, C., Wang, J., Tang, F., and Xi, X.: Trend analysis of building height and total floor space in Beijing, China using ICESat/GLAS data, Int. J. Remote Sens., 32, 8823–8835, 2011.
Cheng, Y., Zheng, G., Wei, C., Mu, Q., Zheng, B., Wang, Z., Gao, M., Zhang, Q., He, K., Carmichael, G., Pöschl, U., and Su, H.: Reactive nitrogen chemistry in aerosol water as a source of sulfate during haze events in China, Sci. Adv., 2, e1601530, https://doi.org/10.1126/sciadv.1601530, 2016.
Cho, M.-H., Niles, A., uili Huang, Inglese, J., Austin, C. P., Riss, T., and Xia, M.: A bioluminescent cytotoxicity assay for assessment of membrane integrity using a proteolytic biomarker, Toxicol. In Vitro., 22, 1099–1106, 2008.
Crowley, J. N., Ammann, M., Cox, R. A., Hynes, R. G., Jenkin, M. E., Mellouki, A., Rossi, M. J., Troe, J., and Wallington, T. J.: Evaluated kinetic and photochemical data for atmospheric chemistry: Volume V – heterogeneous reactions on solid substrates, Atmos. Chem. Phys., 10, 9059–9223, https://doi.org/10.5194/acp-10-9059-2010, 2010.
Cui, L., Li, R., Zhang, Y., Meng, Y., Fu, H., and Chen, J.: An observational study of nitrous acid (HONO) in Shanghai, China: The aerosol impact on HONO formation during the haze episodes, Sci. Total Environ., 630, 1057–1070, https://doi.org/10.1016/j.scitotenv.2018.02.063, 2018.
Czader, B. H., Choi, Y., Li, X., Alvarez, S., and Lefer, B.: Impact of updated traffic emissions on HONO mixing ratios simulated for urban site in Houston, Texas, Atmos. Chem. Phys., 15, 1253–1263, https://doi.org/10.5194/acp-15-1253-2015, 2015.
Dillon, M. B., Lamanna, M. S., Schade, G. W., Goldstein, A. H., and Cohen, R. C.: Chemical evolution of the Sacramento urban plume: Transport and oxidation, J. Geophys. Res.-Atmos., 107, ACH 3-1–ACH 3-15, https://doi.org/10.1029/2001jd000969, 2002.
Fu, G. Q., Xu, W. Y., Yang, R. F., Li, J. B., and Zhao, C. S.: The distribution and trends of fog and haze in the North China Plain over the past 30 years, Atmos. Chem. Phys., 14, 11949–11958, https://doi.org/10.5194/acp-14-11949-2014, 2014.
Gall, E. T., Griffin, R. J., Steiner, A. L., Dibb, J., Scheuer, E., Gong, L., Rutter, A. P., Cevik, B. K., Kim, S., Lefer, B., and Flynn, J.: Evaluation of nitrous acid sources and sinks in urban outflow, Atmos. Environ., 127, 272–282, https://doi.org/10.1016/j.atmosenv.2015.12.044, 2016.
Gao, W., Tan, G., Hong, Y., Li, M., Nian, H., Guo, C., Huang, Z., Fu, Z., Dong, J., Xu, X., Cheng, P., and Zhou, Z.: Development of portable single photon ionization time-of-flight mass spectrometer combined with membrane inlet, Int. J. Mass Spectrom., 334, 8–12, https://doi.org/10.1016/j.ijms.2012.09.003, 2013.
Guo, S., Hu, M., Zamora, M. L., Peng, J., Shang, D., Zheng, J., Du, Z., Wu, Z., Shao, M., Zeng, L., Molina, M. J., and Zhang, R.: Elucidating severe urban haze formation in China, P. Natl. Acad. Sci. USA, 111, 17373–17378, https://doi.org/10.1073/pnas.1419604111, 2014.
Guo, S., Hu, M., Peng, J., Wu, Z., Zamora, M. L., Shang, D., Du, Z., Zheng, J., Fang, X., Tang, R., Wu, Y., Zeng, L., Shuai, S., Zhang, W., Wang, Y., Ji, Y., Li, Y., Zhang, A. L., Wang, W., Zhang, F., Zhao, J., Gong, X., Wang, C., Molina, M. J., and Zhang, R.: Remarkable nucleation and growth of ultrafine particles from vehicular exhaust, P. Natl. Acad. Sci. USA, 117, 3427–3432, https://doi.org/10.1073/pnas.1916366117, 2020.
Hallquist, M., Wenger, J. C., Baltensperger, U., Rudich, Y., Simpson, D., Claeys, M., Dommen, J., Donahue, N. M., George, C., Goldstein, A. H., Hamilton, J. F., Herrmann, H., Hoffmann, T., Iinuma, Y., Jang, M., Jenkin, M. E., Jimenez, J. L., Kiendler-Scharr, A., Maenhaut, W., McFiggans, G., Mentel, Th. F., Monod, A., Prévôt, A. S. H., Seinfeld, J. H., Surratt, J. D., Szmigielski, R., and Wildt, J.: The formation, properties and impact of secondary organic aerosol: current and emerging issues, Atmos. Chem. Phys., 9, 5155–5236, https://doi.org/10.5194/acp-9-5155-2009, 2009.
Han, C., Liu, Y., and He, H.: Role of Organic Carbon in Heterogeneous Reaction of NO2 with Soot, Environ. Sci Technol., 47, 3174–3181, https://doi.org/10.1021/es304468n, 2013.
Han, X., Zhang, M. G., Skorokhod, A., and Kou, X. X.: Modeling dry deposition of reactive nitrogen in China with RAMS-CMAQ, Atmos. Environ., 166, 47–61, https://doi.org/10.1016/j.atmosenv.2017.07.015, 2017.
He, H., Wang, Y., Ma, Q., Ma, J., Chu, B., Ji, D., Tang, G., Liu, C., Zhang, H., and Hao, J.: Mineral dust and NOx promote the conversion of SO2 to sulfate in heavy pollution days, Sci. Rep.-UK, 4, https://doi.org/10.1038/srep04172, 2014.
He, K., Huo, H., and Zhang, Q.: Urban air pollution in China: current status, characteristics, and progress, Annu. Rev. Energ. Environ. , 27, 397–431, 2002.
He, P., Alexander, B., Geng, L., Chi, X., Fan, S., Zhan, H., Kang, H., Zheng, G., Cheng, Y., Su, H., Liu, C., and Xie, Z.: Isotopic constraints on heterogeneous sulfate production in Beijing haze, Atmos. Chem. Phys., 18, 5515–5528, https://doi.org/10.5194/acp-18-5515-2018, 2018.
Holland, F., Hofzumahaus, A., Schafer, R., Kraus, A., and Patz, H. W.: Measurements of OH and HO2 radical concentrations and photolysis frequencies during BERLIOZ, J. Geophys. Res.-Atmos., 108, PHO 2-1–PHO 2-23, https://doi.org/10.1029/2001jd001393, 2003.
Hou, S., Tong, S., Ge, M., and An, J.: Comparison of atmospheric nitrous acid during severe haze and clean periods in Beijing, China, Atmos. Environ., 124, 199–206, https://doi.org/10.1016/j.atmosenv.2015.06.023, 2016.
Huang, H., Chen, Y., Clinton, N., Wang, J., Wang, X., Liu, C., Gong, P., Yang, J., Bai, Y., Zheng, Y., and Zhu, Z.: Mapping major land cover dynamics in Beijing using all Landsat images in Google Earth Engine, Remote Sens. Environ., 202, 166–176, https://doi.org/10.1016/j.rse.2017.02.021, 2017.
Huang, L., Zhao, Y., Li, H., and Chen, Z.: Kinetics of Heterogeneous Reaction of Sulfur Dioxide on Authentic Mineral Dust: Effects of Relative Humidity and Hydrogen Peroxide, Environ. Sci. Technol., 49, 10797–10805, https://doi.org/10.1021/acs.est.5b03930, 2015.
Huang, R.-J., Zhang, Y., Bozzetti, C., Ho, K.-F., Cao, J.-J., Han, Y., Daellenbach, K. R., Slowik, J. G., Platt, S. M., Canonaco, F., Zotter, P., Wolf, R., Pieber, S. M., Bruns, E. A., Crippa, M., Ciarelli, G., Piazzalunga, A., Schwikowski, M., Abbaszade, G., Schnelle-Kreis, J., Zimmermann, R., An, Z., Szidat, S., Baltensperger, U., Haddad, I. E., and Prevot, A. S. H.: High secondary aerosol contribution to particulate pollution during haze events in China, Nature, 514, 218–222, https://doi.org/10.1038/nature13774, 2014.
Huang, R.-J., Yang, L., Cao, J., Wang, Q., Tie, X., Ho, K.-F., Shen, Z., Zhang, R., Li, G., Zhu, C., Zhang, N., Dai, W., Zhou, J., Liu, S., Chen, Y., Chen, J., and O'Dowd, C. D.: Concentration and sources of atmospheric nitrous acid (HONO) at an urban site in Western China, Sci. Total Environ., 593, 165–172, https://doi.org/10.1016/j.scitotenv.2017.02.166, 2017.
Kanaya, Y., Cao, R., Akimoto, H., Fukuda, M., Komazaki, Y., Yokouchi, Y., Koike, M., Tanimoto, H., Takegawa, N., and Kondo, A. Y.: Urban photochemistry in central Tokyo: 1. Observed and modeled OH and HO2 radical concentrations during the winter and summer of 2004, J. Geophy. Res.-Atmos., 112, D21312, https://doi.org/10.1029/2007JD008670, 2007.
Kim, S., VandenBoer, T. C., Young, C. J., Riedel, T. P., Thornton, J. A., Swarthout, B., Sive, B., Lerner, B., Gilman, J. B., Warneke, C., Roberts, J. M., Guenther, A., Wagner, N. L., Dubé, W. P., Williams, E., and Brown, S. S.: The primary and recycling sources of OH during the NACHTT-2011 campaign: HONO as an important OH primary source in the wintertime, J. Geophys. Res.-Atmos., 119, 6886–6896, https://doi.org/10.1002/2013JD019784, 2014.
Kroll, J. H. and Seinfeld, J. H.: Chemistry of secondary organic aerosol: Formation and evolution of low-volatility organics in the atmosphere, Atmos. Environ., 42, 3593–3624, 2008.
Kulmala, M.: Build a global Earth observatory, Nature, 553, 21–23, https://doi.org/10.1038/d41586-017-08967-y, 2018.
Lang, J., Zhang, Y., Zhou, Y., Cheng, S., Chen, D., Guo, X., Chen, S., Li, X., Xing, X., and Wang, H.: Trends of PM2.5 and Chemical Composition in Beijing, 2000–2015, Aerosol Air Qual. Res., 17, 412–425, https://doi.org/10.4209/aaqr.2016.07.0307, 2017.
Lee, J. D., Whalley, L. K., Heard, D. E., Stone, D., Dunmore, R. E., Hamilton, J. F., Young, D. E., Allan, J. D., Laufs, S., and Kleffmann, J.: Detailed budget analysis of HONO in central London reveals a missing daytime source, Atmos. Chem. Phys., 16, 2747–2764, https://doi.org/10.5194/acp-16-2747-2016, 2016.
Lelieveld, J., Evans, J. S., Fnais, M., Giannadaki, D., and Pozzer, A.: The contribution of outdoor air pollution sources to premature mortality on a global scale, Nature, 525, 367–371, https://doi.org/10.1038/nature15371, 2015.
Li, D., Xue, L., Wen, L., Wang, X., Chen, T., Mellouki, A., Chen, J., and Wang, W.: Characteristics and sources of nitrous acid in an urban atmosphere of northern China: Results from 1-yr continuous observations, Atmos. Environ., 182, 296–306, https://doi.org/10.1016/j.atmosenv.2018.03.033, 2018.
Li, X., Brauers, T., Häseler, R., Bohn, B., Fuchs, H., Hofzumahaus, A., Holland, F., Lou, S., Lu, K. D., Rohrer, F., Hu, M., Zeng, L. M., Zhang, Y. H., Garland, R. M., Su, H., Nowak, A., Wiedensohler, A., Takegawa, N., Shao, M., and Wahner, A.: Exploring the atmospheric chemistry of nitrous acid (HONO) at a rural site in Southern China, Atmos. Chem. Phys., 12, 1497–1513, https://doi.org/10.5194/acp-12-1497-2012, 2012.
Li, Z. Q., Guo, J. P., Ding, A. J., Liao, H., Liu, J. J., Sun, Y. L., Wang, T. J., Xue, H. W., Zhang, H. S., and Zhu, B.: Aerosol and boundary-layer interactions and impact on air quality, Natl. Sci. Rev., 4, 810–833, https://doi.org/10.1093/nsr/nwx117, 2017.
Liang, Y., Zha, Q., Wang, W., Cui, L., Lui, K. H., Ho, K. F., Wang, Z., Lee, S.-C., and Wang, T.: Revisiting nitrous acid (HONO) emission from on-road vehicles: A tunnel study with a mixed fleet, J. Air Waste Manage. Assoc., 67, 797–805, https://doi.org/10.1080/10962247.2017.1293573, 2017.
Liggio, J., Li, S.-M., Hayden, K., Taha, Y. M., Stroud, C., Darlington, A., Drollette, B. D., Gordon, M., Lee, P., Liu, P., Leithead, A., Moussa, S. G., Wang, D., O'Brien, J., Mittermeier, R. L., Brook, J. R., Lu, G., Staebler, R. M., Han, Y., Tokarek, T. W., Osthoff, H. D., Makar, P. A., Zhang, J., L. Plata, D., and Gentner, D. R.: Oil sands operations as a large source of secondary organic aerosols, Nature, 534, 91–94, https://doi.org/10.1038/nature17646, 2016.
Liu, C., Ma, Z., Mu, Y., Liu, J., Zhang, C., Zhang, Y., Liu, P., and Zhang, H.: The levels, variation characteristics, and sources of atmospheric non-methane hydrocarbon compounds during wintertime in Beijing, China, Atmos. Chem. Phys., 17, 10633–10649, https://doi.org/10.5194/acp-17-10633-2017, 2017.
Liu, F., Beirle, S., Zhang, Q., van der A, R. J., Zheng, B., Tong, D., and He, K.: NOx emission trends over Chinese cities estimated from OMI observations during 2005 to 2015, Atmos. Chem. Phys., 17, 9261–9275, https://doi.org/10.5194/acp-17-9261-2017, 2017.
Liu, J., Li, S., Mekic, M., Jiang, H., Zhou, W., Loisel, G., Song, W., Wang, X., and Gligorovski, S.: Photoenhanced Uptake of NO2 and HONO Formation on Real Urban Grime, Environ. Sci. Tech. Let., 6, 413–417, https://doi.org/10.1021/acs.estlett.9b00308, 2019.
Liu, T., Gong, S., He, J., Yu, M., Wang, Q., Li, H., Liu, W., Zhang, J., Li, L., Wang, X., Li, S., Lu, Y., Du, H., Wang, Y., Zhou, C., Liu, H., and Zhao, Q.: Attributions of meteorological and emission factors to the 2015 winter severe haze pollution episodes in China's Jing-Jin-Ji area, Atmos. Chem. Phys., 17, 2971–2980, https://doi.org/10.5194/acp-17-2971-2017, 2017.
Liu, Y., Han, C., Ma, J., Bao, X., and He, H.: Influence of relative humidity on heterogeneous kinetics of NO2 on kaolin and hematite, Phys. Chem. Chem. Phys., 17, 19424–19431, https://doi.org/10.1039/C5CP02223A, 2015.
Liu, Y., Lu, K., Ma, Y., Yang, X., Zhang, W., Wu, Y., Peng, J., Shuai, S., Hu, M., and Zhang, Y.: Direct emission of nitrous acid (HONO) from gasoline cars in China determined by vehicle chassis dynamometer experiments, Atmos. Environ., 169, 89–96, https://doi.org/10.1016/j.atmosenv.2017.07.019, 2017.
Liu, Y., Nie, W., Xu, Z., Wang, T., Wang, R., Li, Y., Wang, L., Chi, X., and Ding, A.: Semi-quantitative understanding of source contribution to nitrous acid (HONO) based on 1 year of continuous observation at the SORPES station in eastern China, Atmos. Chem. Phys., 19, 13289–13308, https://doi.org/10.5194/acp-19-13289-2019, 2019.
Liu, Y. H., Lu, K. D., Li, X., Dong, H. B., Tan, Z. F., Wang, H. C., Zou, Q., Wu, Y. S., Zeng, L. M., Hu, M., Min, K. E., Kecorius, S., Wiedensohler, A., and Zhang, Y. H.: A Comprehensive Model Test of the HONO Sources Constrained to Field Measurements at Rural North China Plain, Environ. Sci. Technol., 53, 3517–3525, https://doi.org/10.1021/acs.est.8b06367, 2019.
Meng, F., Qin, M., Tang, K., Duan, J., Fang, W., Liang, S., Ye, K., Xie, P., Sun, Y., Xie, C., Ye, C., Fu, P., Liu, J., and Liu, W.: High-resolution vertical distribution and sources of HONO and NO2 in the nocturnal boundary layer in urban Beijing, China, Atmos. Chem. Phys., 20, 5071–5092, https://doi.org/10.5194/acp-20-5071-2020, 2020.
Meusel, H., Tamm, A., Kuhn, U., Wu, D., Leifke, A. L., Fiedler, S., Ruckteschler, N., Yordanova, P., Lang-Yona, N., Pöhlker, M., Lelieveld, J., Hoffmann, T., Pöschl, U., Su, H., Weber, B., and Cheng, Y.: Emission of nitrous acid from soil and biological soil crusts represents an important source of HONO in the remote atmosphere in Cyprus, Atmos. Chem. Phys., 18, 799–813, https://doi.org/10.5194/acp-18-799-2018, 2018.
Michoud, V., Colomb, A., Borbon, A., Miet, K., Beekmann, M., Camredon, M., Aumont, B., Perrier, S., Zapf, P., Siour, G., Ait-Helal, W., Afif, C., Kukui, A., Furger, M., Dupont, J. C., Haeffelin, M., and Doussin, J. F.: Study of the unknown HONO daytime source at a European suburban site during the MEGAPOLI summer and winter field campaigns, Atmos. Chem. Phys., 14, 2805–2822, https://doi.org/10.5194/acp-14-2805-2014, 2014.
Ndour, M., D'Anna, B., George, C., Ka, O., Balkanski, Y., Jelffmann, J., Stemmler, K., and Ammann M.: Photoenhanced uptake of NO2 on mineral dust: Laboratory experiments and model simulations, Geophys. Res. Lett., 35, L05812, https://doi.org/10.1029/2007GL032006, 2008.
Ndour, M., Nicolas, M., D'Anna, B., Ka, O., and George, C.: Photoreactivity of NO2 on mineral dusts originating from different locations of the Sahara desert, Phys. Chem. Chem. Phys., 11, 1312–1319, 2009.
Oswald, R., Behrendt, T., Ermel, M., Wu, D., Su, H., Cheng, Y., Breuninger, C., Moravek, A., Mougin, E., Delon, C., Loubet, B., Pommerening-Röser, A., Sörgel, M., Pöschl, U., Hoffmann, T., Andreae, M. O., Meixner, F. X., and Trebs, I.: HONO Emissions from Soil Bacteria as a Major Source of Atmospheric Reactive Nitrogen, Science, 341, 1233–1235, https://doi.org/10.1126/science.1242266, 2013.
Oswald, R., Ermel, M., Hens, K., Novelli, A., Ouwersloot, H. G., Paasonen, P., Petäjä, T., Sipilä, M., Keronen, P., Bäck, J., Königstedt, R., Hosaynali Beygi, Z., Fischer, H., Bohn, B., Kubistin, D., Harder, H., Martinez, M., Williams, J., Hoffmann, T., Trebs, I., and Sörgel, M.: A comparison of HONO budgets for two measurement heights at a field station within the boreal forest in Finland, Atmos. Chem. Phys., 15, 799–813, https://doi.org/10.5194/acp-15-799-2015, 2015.
Qin, M., Xie, P., Su, H., Gu, J., Peng, F., Li, S., Zeng, L., Liu, J., Liu, W., and Zhang, Y.: An observational study of the HONO-NO2 coupling at an urban site in Guangzhou City, South China, Atmos. Environ., 43, 5731–5742, https://doi.org/10.1016/j.atmosenv.2009.08.017, 2009.
Ren, X., Brune, W. H., Mao, J., Mitchell, M. J., Lesher, R. L., Simpas, J. B., Metcalf, A. R., Schwab, J. J., Cai, C., Li, Y., Demerjian, K. L., Felton, H. D., Boynton, G., Adams, A., Perry, J., He, Y., Zhou, X., and Hou, J.: Behavior of OH and HO2 in the winter atmosphere in New York City, Atmos. Environ., 40, 252–263, https://doi.org/10.1016/j.atmosenv.2005.11.073, 2006.
Rohrer, F., Bohn, B., Brauers, T., Brüning, D., Johnen, F.-J., Wahner, A., and Kleffmann, J.: Characterisation of the photolytic HONO-source in the atmosphere simulation chamber SAPHIR, Atmos. Chem. Phys., 5, 2189–2201, https://doi.org/10.5194/acp-5-2189-2005, 2005.
Sangwan, M. and Zhu, L.: Role of Methyl-2-nitrophenol Photolysis as a Potential Source of OH Radicals in the Polluted Atmosphere: Implications from Laboratory Investigation, J. Phys. Chem. A, 122, 1861–1872, https://doi.org/10.1021/acs.jpca.7b11235, 2018.
Seinfeld, J. H. and Pandis, S. N.: Atmospheric chemistry and physics: From air pollution to climate change, 2nd Edn., John Wiley and Sons, New Jersey, 2006.
Sörgel, M., Regelin, E., Bozem, H., Diesch, J.-M., Drewnick, F., Fischer, H., Harder, H., Held, A., Hosaynali-Beygi, Z., Martinez, M., and Zetzsch, C.: Quantification of the unknown HONO daytime source and its relation to NO2, Atmos. Chem. Phys., 11, 10433–10447, https://doi.org/10.5194/acp-11-10433-2011, 2011.
Spataro, F., Ianniello, A., Esposito, G., Allegrini, I., Zhu, T., and Hu, M.: Occurrence of atmospheric nitrous acid in the urban area of Beijing (China), Sci. Total Environ., 447, 210–224, https://doi.org/10.1016/j.scitotenv.2012.12.065, 2013.
Squires, F. A., Nemitz, E., Langford, B., Wild, O., Drysdale, W. S., Acton, W. J. F., Fu, P., Grimmond, C. S. B., Hamilton, J. F., Hewitt, C. N., Hollaway, M., Kotthaus, S., Lee, J., Metzger, S., Pingintha-Durden, N., Shaw, M., Vaughan, A. R., Wang, X., Wu, R., Zhang, Q., and Zhang, Y.: Measurements of traffic-dominated pollutant emissions in a Chinese megacity, Atmos. Chem. Phys., 20, 8737–8761, https://doi.org/10.5194/acp-20-8737-2020, 2020.
Stutz, J., Wong, K. W., and Tsai, C.: Field Observations of Daytime HONO Chemistry and Its Impact on the OH Radical Budget, in: Disposal of Dangerous Chemicals in Urban Areas and Mega Cities, Springer, Dordrecht, 1–14, 2013.
Su, H., Cheng, Y. F., Shao, M., Gao, D. F., Yu, Z. Y., Zeng, L. M., Slanina, J., Zhang, Y. H., and Wiedensohler, A.: Nitrous acid (HONO) and its daytime sources at a rural site during the 2004 PRIDE-PRD experiment in China, J. Geophys. Res.-Atmos., 113, D14312, https://doi.org/10.1029/2007jd009060, 2008.
Su, P. H., Kuo, D. T. F., Shih, Y. H., and Chen, C. Y.: Sorption of organic compounds to two diesel soot black carbons in water evaluated by liquid chromatography and polyparameter linear solvation energy relationship, Water Res., 144, 709–718, https://doi.org/10.1016/j.watres.2018.07.064, 2018.
Sun, P., Nie, W., Chi, X., Xie, Y., Huang, X., Xu, Z., Qi, X., Xu, Z., Wang, L., Wang, T., Zhang, Q., and Ding, A.: Two years of online measurement of fine particulate nitrate in the western Yangtze River Delta: influences of thermodynamics and N2O5 hydrolysis, Atmos. Chem. Phys., 18, 17177–17190, https://doi.org/10.5194/acp-18-17177-2018, 2018.
Sun, Y. L., Wang, Z. F., Fu, P. Q., Yang, T., Jiang, Q., Dong, H. B., Li, J., and Jia, J. J.: Aerosol composition, sources and processes during wintertime in Beijing, China, Atmos. Chem. Phys., 13, 4577–4592, https://doi.org/10.5194/acp-13-4577-2013, 2013.
Sun, Y. L., Wang, Z. F., Du, W., Zhang, Q., Wang, Q. Q., Fu, P. Q., Pan, X. L., Li, J., Jayne, J., and Worsnop, D. R.: Long-term real-time measurements of aerosol particle composition in Beijing, China: seasonal variations, meteorological effects, and source analysis, Atmos. Chem. Phys., 15, 10149–10165, https://doi.org/10.5194/acp-15-10149-2015, 2015.
Tan, Z., Fuchs, H., Lu, K., Hofzumahaus, A., Bohn, B., Broch, S., Dong, H., Gomm, S., Häseler, R., He, L., Holland, F., Li, X., Liu, Y., Lu, S., Rohrer, F., Shao, M., Wang, B., Wang, M., Wu, Y., Zeng, L., Zhang, Y., Wahner, A., and Zhang, Y.: Radical chemistry at a rural site (Wangdu) in the North China Plain: observation and model calculations of OH, HO2 and RO2 radicals, Atmos. Chem. Phys., 17, 663–690, https://doi.org/10.5194/acp-17-663-2017, 2017.
Tan, Z., Rohrer, F., Lu, K., Ma, X., Bohn, B., Broch, S., Dong, H., Fuchs, H., Gkatzelis, G. I., Hofzumahaus, A., Holland, F., Li, X., Liu, Y., Liu, Y., Novelli, A., Shao, M., Wang, H., Wu, Y., Zeng, L., Hu, M., Kiendler-Scharr, A., Wahner, A., and Zhang, Y.: Wintertime photochemistry in Beijing: observations of ROx radical concentrations in the North China Plain during the BEST-ONE campaign, Atmos. Chem. Phys., 18, 12391–12411, https://doi.org/10.5194/acp-18-12391-2018, 2018.
Tan, Z., Lu, K., Jiang, M., Su, R., Wang, H., Lou, S., Fu, Q., Zhai, C., Tan, Q., Yue, D., Chen, D., Wang, Z., Xie, S., Zeng, L., and Zhang, Y.: Daytime atmospheric oxidation capacity in four Chinese megacities during the photochemically polluted season: a case study based on box model simulation, Atmos. Chem. Phys., 19, 3493–3513, https://doi.org/10.5194/acp-19-3493-2019, 2019.
Tang, Y., An, J., Wang, F., Li, Y., Qu, Y., Chen, Y., and Lin, J.: Impacts of an unknown daytime HONO source on the mixing ratio and budget of HONO, and hydroxyl, hydroperoxyl, and organic peroxy radicals, in the coastal regions of China, Atmos. Chem. Phys., 15, 9381–9398, https://doi.org/10.5194/acp-15-9381-2015, 2015.
Tian, M., Liu, Y., Yang, F. M., Zhang, L. M., Peng, C., Chen, Y., Shi, G. M., Wang, H. B., Luo, B., Jiang, C. T., Li, B., Takeda, N., and Koizumi, K.: Increasing importance of nitrate formation for heavy aerosol pollution in two megacities in Sichuan Basin, southwest China, Environ. Pollut., 250, 898–905, 10.1016/j.envpol.2019.04.098, 2019.
Tong, S., Hou, S., Zhang, Y., Chu, B., Liu, Y., He, H., Zhao, P., and Ge, M.: Exploring the nitrous acid (HONO) formation mechanism in winter Beijing: direct emissions and heterogeneous production in urban and suburban areas, Faraday Discuss., 189, 213–230, https://doi.org/10.1039/c5fd00163c, 2016.
Trinh, H. T., Imanishi, K., Morikawa, T., Hagino, H., and Takenaka, N.: Gaseous nitrous acid (HONO) and nitrogen oxides (NOx) emission from gasoline and diesel vehicles under real-world driving test cycles, J. Air Waste Manage., 67, 412–420, https://doi.org/10.1080/10962247.2016.1240726, 2017.
Underwood, G. M., Miller, T. M., and Grassian, V. H.: Transmission FT-IR and Knudsen Cell Study of the Heterogeneous Reactivity of Gaseous Nitrogen Dioxide on Mineral Oxide Particles, J. Phys. Chem. A, 103 6184–6190, 1999.
Underwood, G. M., Song, C. H., Phadnis, M., Carmichael, G. R., and Grassian, V. H.: Heterogeneous reactions of NO2 and HNO3 on oxides and mineral dust: A combined laboratory and modeling study, J. Geophy. Res.-Atmos., 106, 18055–18066, https://doi.org/10.1029/2000jd900552, 2001.
Volkamer, R., Sheehy, P., Molina, L. T., and Molina, M. J.: Oxidative capacity of the Mexico City atmosphere – Part 1: A radical source perspective, Atmos. Chem. Phys., 10, 6969–6991, https://doi.org/10.5194/acp-10-6969-2010, 2010.
Vu, T. V., Shi, Z., Cheng, J., Zhang, Q., He, K., Wang, S., and Harrison, R. M.: Assessing the impact of clean air action on air quality trends in Beijing using a machine learning technique, Atmos. Chem. Phys., 19, 11303–11314, https://doi.org/10.5194/acp-19-11303-2019, 2019.
Wang, G., Zhang, R., Gomez, M. E., Yang, L., Zamora, M. L., Hu, M., Lin, Y., Peng, J., Guoc, S., Meng, J., Li, J., Cheng, C., Hu, T., Ren, Y., Wang, Y., Gao, J., Cao, J., An, Z., Zhou, W., Li, G., Wang, J., Tian, P., Marrero-Ortiz, W., Secrest, J., Du, Z., Zheng, J., Shang, D., Zeng, L., Shao, M., Wang, W., Huang, Y., Wang, Y., Zhu, Y., Li, Y., Hu, J., Pan, B., Cai, L., Cheng, Y., Ji, Y., Zhang, F., Rosenfeld, D., Liss, P. S., Duce, R. A., Kolb, C. E., and Molina, M. J.: Persistent sulfate formation from London Fog to Chinese haze, P. Natl. Acad. Sci. USA, 113, 13630–13635, 2016.
Wang, H., Lu, K., Chen, X., Zhu, Q., Chen, Q., Guo, S., Jiang, M., Li, X., Shang, D., Tan, Z., Wu, Y., Wu, Z., Zou, Q., Zheng, Y., Zeng, L., Zhu, T., Hu, M., and Zhang, Y.: High N2O5 Concentrations Observed in Urban Beijing: Implications of a Large Nitrate Formation Pathway, Environ. Sci. Tech. Let., 4, 416–420, https://doi.org/10.1021/acs.estlett.7b00341, 2017.
Wang, H., Lu, K., Chen, X., Zhu, Q., Wu, Z., Wu, Y., and Sun, K.: Fast particulate nitrate formation via N2O5 uptake aloft in winter in Beijing, Atmos. Chem. Phys., 18, 10483–10495, https://doi.org/10.5194/acp-18-10483-2018, 2018.
Wang, J., Zhang, X., Guo, J., Wang, Z., and Zhang, M.: Observation of nitrous acid (HONO) in Beijing, China: Seasonal variation, nocturnal formation and daytime budget, Sci. Total Environ., 587, 350–359, https://doi.org/10.1016/j.scitotenv.2017.02.159, 2017.
Wang, S., Nan, J., Shi, C., Fu, Q., Gao, S., Wang, D., Cui, H., Saiz-Lopez, A., and Zhou, B.: Atmospheric ammonia and its impacts on regional air quality over the megacity of Shanghai, China, Sci. Rep.-UK, 5, 15842–15842, https://doi.org/10.1038/srep15842, 2015.
Wang, Y. L., Song, W., Yang, W., Sun, X. C., Tong, Y. D., Wang, X. M., Liu, C. Q., Bai, Z. P., and Liu, X. Y.: Influences of Atmospheric Pollution on the Contributions of Major Oxidation Pathways to PM2.5 Nitrate Formation in Beijing, J. Geophys. Res.-Atmos., 124, 4174–4185, https://doi.org/10.1029/2019jd030284, 2019.
Wang, Y. S., Teter, J., and Sperling, D.: China's soaring vehicle population: Even greater than forecasted?, Energ. Policy, 39, 3296–3306, https://doi.org/10.1016/j.enpol.2011.03.020, 2011.
Wang, Z., Wang, W., Tham, Y. J., Li, Q., Wang, H., Wen, L., Wang, X., and Wang, T.: Fast heterogeneous N2O5 uptake and ClNO2 production in power plant and industrial plumes observed in the nocturnal residual layer over the North China Plain, Atmos. Chem. Phys., 17, 12361–12378, https://doi.org/10.5194/acp-17-12361-2017, 2017.
Wen, L., Xue, L., Wang, X., Xu, C., Chen, T., Yang, L., Wang, T., Zhang, Q., and Wang, W.: Summertime fine particulate nitrate pollution in the North China Plain: increasing trends, formation mechanisms and implications for control policy, Atmos. Chem. Phys., 18, 11261–11275, https://doi.org/10.5194/acp-18-11261-2018, 2018.
Xing, L., Wu, J., Elser, M., Tong, S., Liu, S., Li, X., Liu, L., Cao, J., Zhou, J., El-Haddad, I., Huang, R., Ge, M., Tie, X., Prévôt, A. S. H., and Li, G.: Wintertime secondary organic aerosol formation in Beijing–Tianjin–Hebei (BTH): contributions of HONO sources and heterogeneous reactions, Atmos. Chem. Phys., 19, 2343–2359, https://doi.org/10.5194/acp-19-2343-2019, 2019.
Xu, Z., Wang, T., Wu, J., Xue, L., Chan, J., Zha, Q., Zhou, S., Louie, P. K. K., and Luk, C. W. Y.: Nitrous acid (HONO) in a polluted subtropical atmosphere: Seasonal variability, direct vehicle emissions and heterogeneous production at ground surface, Atmos. Environ., 106, 100–109, https://doi.org/10.1016/j.atmosenv.2015.01.061, 2015.
Yadav, A. K., Raman, S., and Niyogi, D. D. S.: A note on the estimation of eddy diffusivity and dissipation length in low winds over a tropical urban terrain, Pure Appl. Geophys., 160, 395–404, https://doi.org/10.1007/s00024-003-8785-4, 2003.
Yang, D., Zhang, S., Niu, T., Wang, Y., Xu, H., Zhang, K. M., and Wu, Y.: High-resolution mapping of vehicle emissions of atmospheric pollutants based on large-scale, real-world traffic datasets, Atmos. Chem. Phys., 19, 8831–8843, https://doi.org/10.5194/acp-19-8831-2019, 2019.
Yang, Q., Su, H., Li, X., Cheng, Y., Lu, K., Cheng, P., Gu, J., Guo, S., Hu, M., Zeng, L., Zhu, T., and Zhang, Y.: Daytime HONO formation in the suburban area of the megacity Beijing, China, Sci. China Chem., 57, 1032–1042, https://doi.org/10.1007/s11426-013-5044-0, 2014.
Zhang, F., Wang, Y., Peng, J., Chen, L., Sun, Y., Duan, L., Ge, X., Li, Y., Zhao, J., Liu, C., Zhang, X., Zhang, G., Pan, Y., Wang, Y., Zhang, A. L., Ji, Y., Wang, G., Hu, M., Molina, M. J., and Zhang, R.: An unexpected catalyst dominates formation and radiative forcing of regional haze, P. Natl. Acad. Sci. USA, 117, 3960–3966, https://doi.org/10.1073/pnas.1919343117, 2020.
Zhang, J., An, J., Qu, Y., Liu, X., and Chen, Y.: Impacts of potential HONO sources on the concentrations of oxidants and secondary organic aerosols in the Beijing-Tianjin-Hebei region of China, Sci. Total Environ., 647, 836–852, https://doi.org/10.1016/j.scitotenv.2018.08.030, 2019.
Zhang, J. M., Yang, L. X., Chen, J. M., Mellouki, A., Jiang, P., Gao, Y., Li, Y. Y., Yang, Y. M., and Wang, W. X.: Influence of fireworks displays on the chemical characteristics of PM2.5 in rural and suburban areas in Central and East China, Sci. Total Environ., 578, 476–484, https://doi.org/10.1016/j.scitotenv.2016.10.212, 2017.
Zhang, J. W., Chen, J. M., Xue, C. Y., Chen, H., Zhang, Q., Liu, X. G., Mu, Y. J., Guo, Y. T., Wang, D. Y., Chen, Y., Li, J. L., Qu, Y., and An, J. L.: Impacts of six potential HONO sources on HOx budgets and SOA formation during a wintertime heavy haze period in the North China Plain, Sci. Total Environ., 681, 110–123, https://doi.org/10.1016/j.scitotenv.2019.05.100, 2019.
Zhang, L., Wang, T., Zhang, Q., Zheng, J., Xu, Z., and Lv, M.: Potential sources of nitrous acid (HONO) and their impacts on ozone: A WRF-Chem study in a polluted subtropical region, J. Geophys. Res.-Atmos., 121, 3645–3662, https://doi.org/10.1002/2015jd024468, 2016.
Zhang, W., Tong, S., Ge, M., An, J., Shi, Z., Hou, S., Xia, K., Qu, Y., Zhang, H., Chu, B., Sun, Y., and He, H.: Variations and sources of nitrous acid (HONO) during a severe pollution episode in Beijing in winter 2016, Sci. Total Environ., 648, 253–262, https://doi.org/10.1016/j.scitotenv.2018.08.133, 2018.
Zhang, X., Zhong, J., Wang, J., Wang, Y., and Liu, Y.: The interdecadal worsening of weather conditions affecting aerosol pollution in the Beijing area in relation to climate warming, Atmos. Chem. Phys., 18, 5991–5999, https://doi.org/10.5194/acp-18-5991-2018, 2018.
Zheng, B., Zhang, Q., Zhang, Y., He, K. B., Wang, K., Zheng, G. J., Duan, F. K., Ma, Y. L., and Kimoto, T.: Heterogeneous chemistry: a mechanism missing in current models to explain secondary inorganic aerosol formation during the January 2013 haze episode in North China, Atmos. Chem. Phys., 15, 2031–2049, https://doi.org/10.5194/acp-15-2031-2015, 2015.
Zheng, G. J., Duan, F. K., Su, H., Ma, Y. L., Cheng, Y., Zheng, B., Zhang, Q., Huang, T., Kimoto, T., Chang, D., Pöschl, U., Cheng, Y. F., and He, K. B.: Exploring the severe winter haze in Beijing: the impact of synoptic weather, regional transport and heterogeneous reactions, Atmos. Chem. Phys., 15, 2969–2983, https://doi.org/10.5194/acp-15-2969-2015, 2015.
Zhu, W. H., Xu, X. D., Zheng, J., Yan, P., Wang, Y. J., and Cai, W. Y.: The characteristics of abnormal wintertime pollution events in the Jing-Jin-Ji region and its relationships with meteorological factors, Sci. Total Environ., 626, 887–898, https://doi.org/10.1016/j.scitotenv.2018.01.083, 2018.
Zou, Y., Deng, X. J., Deng, T., Yin, C. Q., and Li, F.: One-Year Characterization and Reactivity of Isoprene and Its Impact on Surface Ozone Formation at A Suburban Site in Guangzhou, China, Atmosphere, 10, 201, https://doi.org/10.3390/atmos10040201, 2019.