the Creative Commons Attribution 4.0 License.
the Creative Commons Attribution 4.0 License.
 | 05 Nov 2020
Dependency of particle size distribution at dust emission on friction velocity and atmospheric boundary-layer stability
Yaping Shao
Masahide Ishizuka
Masao Mikami
John Leys
Ning Huang
Particle size distribution of dust at emission (dust PSD) is an essential quantity to estimate in dust studies. It has been recognized in earlier research that dust PSD is dependent on soil properties (e.g. whether soil is sand or clay) and friction velocity, u∗, which is a surrogate for surface shear stress and a descriptor for saltation-bombardment intensity. This recognition has been challenged in some recent papers, causing a debate on whether dust PSD is “invariant” and the search for its justification. In this paper, we analyse the dust PSD measured in the Japan Australian Dust Experiment and show that dust PSD is dependent on u∗ and on atmospheric boundary-layer (ABL) stability. By simple theoretical and numerical analysis, we explain the two reasons for the latter dependency, which are both related to enhanced saltation bombardment in convective turbulent flows. First, u∗ is stochastic and its probability distribution profoundly influences the magnitude of the mean saltation flux due to the non-linear relationship between saltation flux and u∗. Second, in unstable conditions, turbulence is usually stronger, which leads to higher saltation-bombardment intensity. This study confirms that dust PSD depends on u∗ and, more precisely, on the probability distribution of u∗, which in turn is dependent on ABL stability; consequently, dust PSD is also dependent on ABL. We also show that the dependency of dust PSD on u∗ and ABL stability is made complicated by soil surface conditions. In general, our analysis reinforces the basic conceptual understanding that dust PSD depends on saltation bombardment and inter-particle cohesion.
- Article
(4315 KB) - Full-text XML
-
Supplement
(217 KB) - BibTeX
- EndNote


Gillette (1981) explained that dust emission can be produced by aerodynamic lift and saltation bombardment, but under realistic wind conditions, aerodynamic-lift emission is much weaker than saltation-bombardment emission. This hypothesis was confirmed by Shao et al. (1993). It is recognized that saltation bombardment is the most important mechanism for dust emission, and the dust emission rate, F, is proportional to streamwise saltation flux, Q.1
Rice et al. (1995, 1996) visualized the process of saltation bombardment using wind-tunnel photos: a saltation particle at impact onto the surface ejects a tiny amount of soil into the air, leaving behind a crater. Models for estimating crater size have been developed by, for example, Lu and Shao (1999). The fraction of dust that gets emitted from the ejection is difficult to estimate, because it depends on both inter-particle cohesion and bombardment intensity. Since inter-particle cohesion depends on particle size, d, the fraction of dust emitted must also depend on d. Thus, for a given soil, the particle size distribution of dust at emission (emission-dust PSD), ps(d), must depend on saltation bombardment or on friction velocity, u∗ ( with τ being surface shear stress and ρ being air density; see Sect. 4.1 for discussion). Alfaro et al. (1997) confirmed that ps(d) depends on u∗: as u∗ increases, ps(d) shows a higher fraction of dust of smaller d. Based on this result and the observation that different laboratory techniques for PSD analysis yield profoundly different outcomes, depending on the disturbances applied to the samples (Fig. 1), Shao (2001) suggested to use a minimally disturbed PSD, pm(d), as the limit of ps(d) for weak saltation and a fully disturbed PSD, pf(d), as the limit of ps(d) for strong saltation. In this way, ps(d) is expressed as a weighted average of pm(d) and pf(d)
where is an empirical function of u∗t(d), which is the threshold friction velocity for particles of size d.
What is emission-dust PSD? We distinguish three closely related yet subtly different dust PSDs, namely, emission-dust PSD airborne-dust PSD, and emission-flux PSD. PSD of dust suspended in air (airborne-dust PSD) has been collected from different places under different conditions. Emission-dust PSD and airborne-dust PSD are identical if the latter is measured at dust source at height zero. Airborne-dust PSD can be used to approximate emission-dust PSD if it is measured close to the source and the dependency of particle motion in air on particle size can be neglected. For modelling size-resolved dust concentration in air (i.e. solving the dust concentration equation for different particle sizes), emission-dust PSD offers the Dirichlet-type boundary condition. If size-resolved dust-emission fluxes can be calculated, then we can specify the Neumann-type boundary condition for solving the dust concentration equation. From size-resolved dust-emission fluxes, an emission-flux PSD can be calculated (Sects. 2, 4.2). Emission-flux PSD is neither emission-dust nor airborne-dust PSD but describes how vertical dust-concentration gradient depends on particle size. In some earlier publications, unfortunately, the differences between the three dust PSDs are not clearly explained.
To our knowledge, emission-dust PSD has never been directly measured, but approximated using airborne-dust PSD measured at some, often different, heights (e.g. Kok, 2011b, Table S1). Available data of airborne-dust PSDs give the impression that they do not differ much. It has thus been suggested that airborne-dust PSDs may be “not so different” and hence emission-dust PSDs may also be not so different. Reid et al. (2008) stated that “on regional scales, common mode dust is not functionally impacted by production wind speed, but rather influenced by soil properties such as geomorphology”. Kok (2011a, b) proposed a dust emission model by treating dust emission as a process of aggregate fragmentation by saltation bombardment. Since aggregate fragmentation is similar to brittle fragmentation, the size distribution produced in the process is scale invariant (Astrom, 2006). Kok (2011a, b) then proposed an emission-dust PSD and estimated its parameters from the data listed in Table S1 of Kok (2011b). The proposed emission-dust PSD is frequently used in dust models (Giorgi et al., 2012; Albani et al., 2014; Pisso et al., 2019). However, whether the not-so-different airborne-dust PSDs justify “brittle fragmentation” as the underlying process for dust emission requires scrutiny.
Studies on dust PSD are yet to deliver definitive answers. The airborne-dust PSD measurements of Rosenberg et al. (2014) pointed to a larger fraction of fine particles than in earlier published data. Ishizuka et al. (2008) found that airborne-dust PSD measured close to surface depends on u∗ for a weakly crusted soil. Sow et al. (2009) examined the dependency of emission-flux PSD on u∗ for three dust events and reported that the PSD appeared to be independent of u∗ but differed significantly between weak and strong events. In line with Sow et al. (2009), Khalfallah et al. (2020) reported that emission-flux PSD depends on atmospheric boundary-layer (ABL) stability and attributed this to the dependency of particle diffusivity on particle size. They stated that the dependency of emission-dust PSD on u∗, as observed by Alfaro et al. (1997), may be of secondary importance in natural conditions compared to its dependency on ABL stability.
The argument of Khalfallah et al. (2020) rests on the preferential particle diffusion in turbulent flows. Csanady (1963) suggested that particle eddy diffusivity, Kp, is related to eddy diffusivity, K,by
where β is a coefficient, wt particle terminal velocity and σ the standard deviation of (vertical) turbulent velocity. The analyses of Walklate (1987) and Wang and Stock (1993), among many others, reached similar conclusions. For dust particles smaller than 10 µm, Kp∕K is close to one for σ=0.5 m s−1 and still larger than 0.95 for σ=0.1 m s−1 (Shao, 2008; Fig. 8.12). Thus, preferential particle diffusion does not seem to fully explain the dependency of dust PSD on ABL stability.
The confusion with ground-emission-dust PSD prompted us to re-examine the data of Ishizuka et al. (2008) from the Japan Australian Dust Experiment (JADE). In JADE, airborne-dust PSDs were measured at small heights directly above the dust source and can be assumed to well approximate the emission-dust PSD. By composite analysis for different u∗ and ABL stabilities, we show that dust PSD depends on u∗, supporting the findings of Alfaro et al. (1997) and depends on ABL stability, which is consistent with the findings of Khalfallah et al. (2020). But in contrast to Khalfallah et al. (2020), we argue that these dependencies are not mutually exclusive but collectively point to the simple physics that emission-dust PSD is dependent on saltation-bombardment intensity and efficiency.
JADE was carried out during 23 February–14 March 2006 on an Australian farm at (33∘50′42.4′′ S, 142∘44′9.0′′ E) (Ishizuka et al., 2008, 2014). The 4 km2 farmland was flat and homogeneous such that the JADE data are not affected by fetch. In JADE, atmospheric variables, land surface properties, soil PSD, size-resolved sand fluxes and dust concentrations were measured. Size-resolved dust-emission fluxes were estimated from the dust concentration measurements. Three sand particle counters (SPCs) (Mikami et al., 2005) were used to measure the sand fluxes in the size range of 39–654 µm in 32 bins at 0.05, 0.1 and 0.3 m above ground at a sampling rate of 1 Hz. Using the sand fluxes, qj (), the PSD of saltation particles (saltation-flux PSD) is estimated for a particle size bin at dj with bin size Δdj as
Dust concentration was measured using optical particle counters (OPCs) for eight size groups: 0.3–0.6, 0.6–0.9, 0.9–1.4, 1.4–2.0, 2.0–3.5, 3.5–5.9, 5.9–8.4 and 8.4–12.0 µm at 1, 2 and 3.5 m above ground. The upper size limit for the last bin is not well defined but set empirically to 12.0 µm such that this bin can still be included in the analysis. Airborne-dust PSD is estimated as
where cj denotes the dust concentration for size bin j. Similarly, the emission-flux PSD can be defined as
where Fj denotes the dust flux for size bin j. It should be noted that the emission-flux PSD describes how the covariance of particle velocity and particle concentration depends on particle size not the concentration itself. In this study, we use the airborne-dust PSD observed at 1 m to approximate emission-dust PSD and use the airborne-dust PSD observed at 3.5 m and the emission-flux PSD derived from the 3.5 m and 1 m OPC measurements for additional discussions (Sect. 4.2). Hereafter, emission-dust PSD approximated using the 1 m OPC airborne-dust PSD is simply referred to as dust PSD unless otherwise stated.
Atmospheric variables, including wind speed, air temperature and humidity at various levels, radiation, and precipitation were measured using an automatic weather station. These quantities were sampled at 5 s intervals and their 1 min averages were recorded (see Sect. 4.2 for discussions). Two anemometers mounted at 0.53 and 2.16 m measured wind speed. From the atmospheric data, the Obukhov length, L; sensible heat flux, H; and friction velocity, u∗, were derived.2 Also measured were soil temperature and moisture.

Figure 1Soil particle-size distribution obtained using Method A and Method B, together with the respective approximations (Model A and Model B).
Surface soil samples were taken and soil PSD was analysed in the laboratory using Method A and Method B with a particle size analyser (Microtrac MT3300EX, Nikkiso). In Method A, water was used for sample dispersion with no ultrasonic action. In Method B, sodium hexametaphosphate (HMP) 0.2 % solution was used for sample dispersion and 1 min ultrasonic action of 40 W was applied. Following the convention of sedimentology, the soil is a sandy loam based on the analysis using Method B. Figure 1 shows pA(d) (soil PSD from Method A) and pB(d) (soil PSD from Method B) and the corresponding approximations: pA shows a larger fraction of particles in the range of 30–300 µm, while pB a larger fraction of particles in the range of 0.1–30 µm.
An overview of the JADE data is shown in Fig. 2. During the experiment, 12 significant aeolian events were recorded, as marked in the figure. Most of the events occurred under unstable ABL conditions. Several quantities can be used as a measure of ABL stability, but the one used here is the convective scaling velocity, w∗, defined as
where is the buoyancy parameter with g being the acceleration due to gravity and the mean potential temperature; H0 is surface kinematic heat flux (K m s−1) and zl a scaling length (set to the capping inversion height for convective ABL and 100 m for stable ABL). For unstable conditions, w∗ is positive, while for stable conditions w∗ is negative. The reason for choosing w∗ is that it is a scaling parameter for the strength of turbulence. Usually, w∗ is not used for stable ABLs but used here as an indicator for the suppression of turbulence by negative buoyancy.
In addition to the 12 events, a number of weak and intermittent events occurred. In this study, we first use the whole dataset for the dust-PSD analysis, and then we use the data for Event-10, Event-11 and Event-12 for case studies. These three events are chosen so that Event-10 is the strongest event during JADE, Event-11 is one that occurred at night under stable conditions, and Event-12 occurred with a weakly crusted soil surface (Ishizuka et al., 2008).
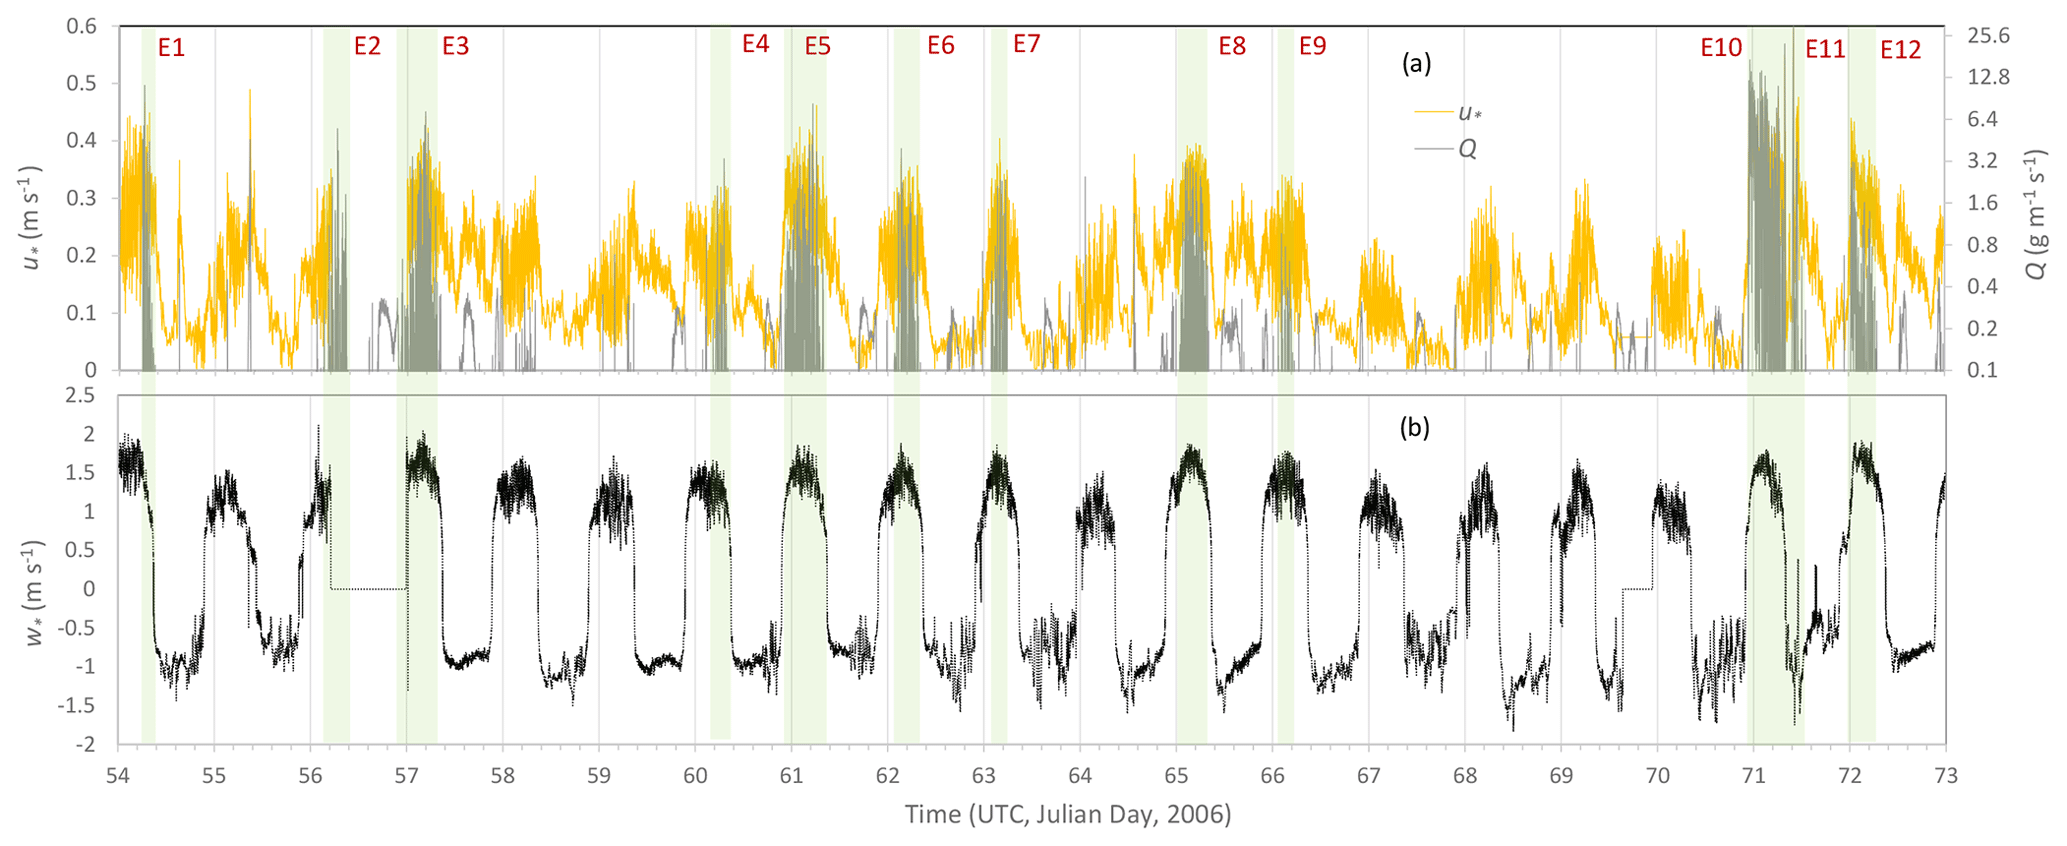
Figure 2(a) One-minute averaged friction velocity, u∗, and streamwise saltation flux, Q, for the JADE observation time period; (b) 1 min averaged convective scaling velocity, w∗. In addition to the 12 aeolian events marked, a number of weaker and intermittent aeolian events occurred.

Figure 3Dust PSD measured at 1 m using OPC for the entire JADE observation period plotted in two sections: (a) for section Julian day 54–70.8 and (b) for section Julian day 70.8–73.0.
3.1 Overall results
Plotted in Fig. 3 are the time series of dust PSD for the entire JADE period, which show rich temporal variations apart from, probably, Event-10. To examine dust-PSD dependency on friction velocity, we use u∗ to denote the 1 min values of friction velocity, p(u∗) its probability density function (PDF), its mean and σu∗ its standard deviation. The u∗ values are divided into the categories of 0–0.25, 0.25–0.35, 0.35–0.45 and 0.45–0.55 m s−1, and the corresponding dust PSDs and saltation PSDs are sorted accordingly. These u∗ categories correspond roughly to intermittent, weak, moderate and strong saltation, respectively. The threshold friction velocity, u∗t, for the JADE site is around 0.2 m s−1, but intermittent saltation has been observed often at u∗ below this u∗t. The dust PSDs are then composite averaged for the u∗ categories. Figure 4a shows the dust PSDs for the different u∗ categories and the mean dust PSD averaged over all u∗ categories (including a total of 15 634 1 min points). We have repeated the same averaging procedure using a subset of the JADE data, conditioned with Q>0.1 g m−1 s−1, and found that the results are very similar to those presented in Fig. 4. The mean dust PSD shows an interesting local minimum at ∼4 µm. This is attributed to the lack of particles of this size in the m s−1 category. Figure 4a shows that dust PSD clearly depends on u∗, particularly in the size range 2–10 µm. In general, as u∗ increases, the fraction of fine dust particles increases. For the submicron size range, the dependency of dust PSD on u∗ is less definitive. The dust PSD for the m s−1 category shows a higher fraction of submicron dust particles, especially in stable conditions (Fig. 4b). Apart from this, the results shown in Fig. 4a are consistent with the findings of Alfaro et al. (1997) that dust PSD is u∗ dependent.
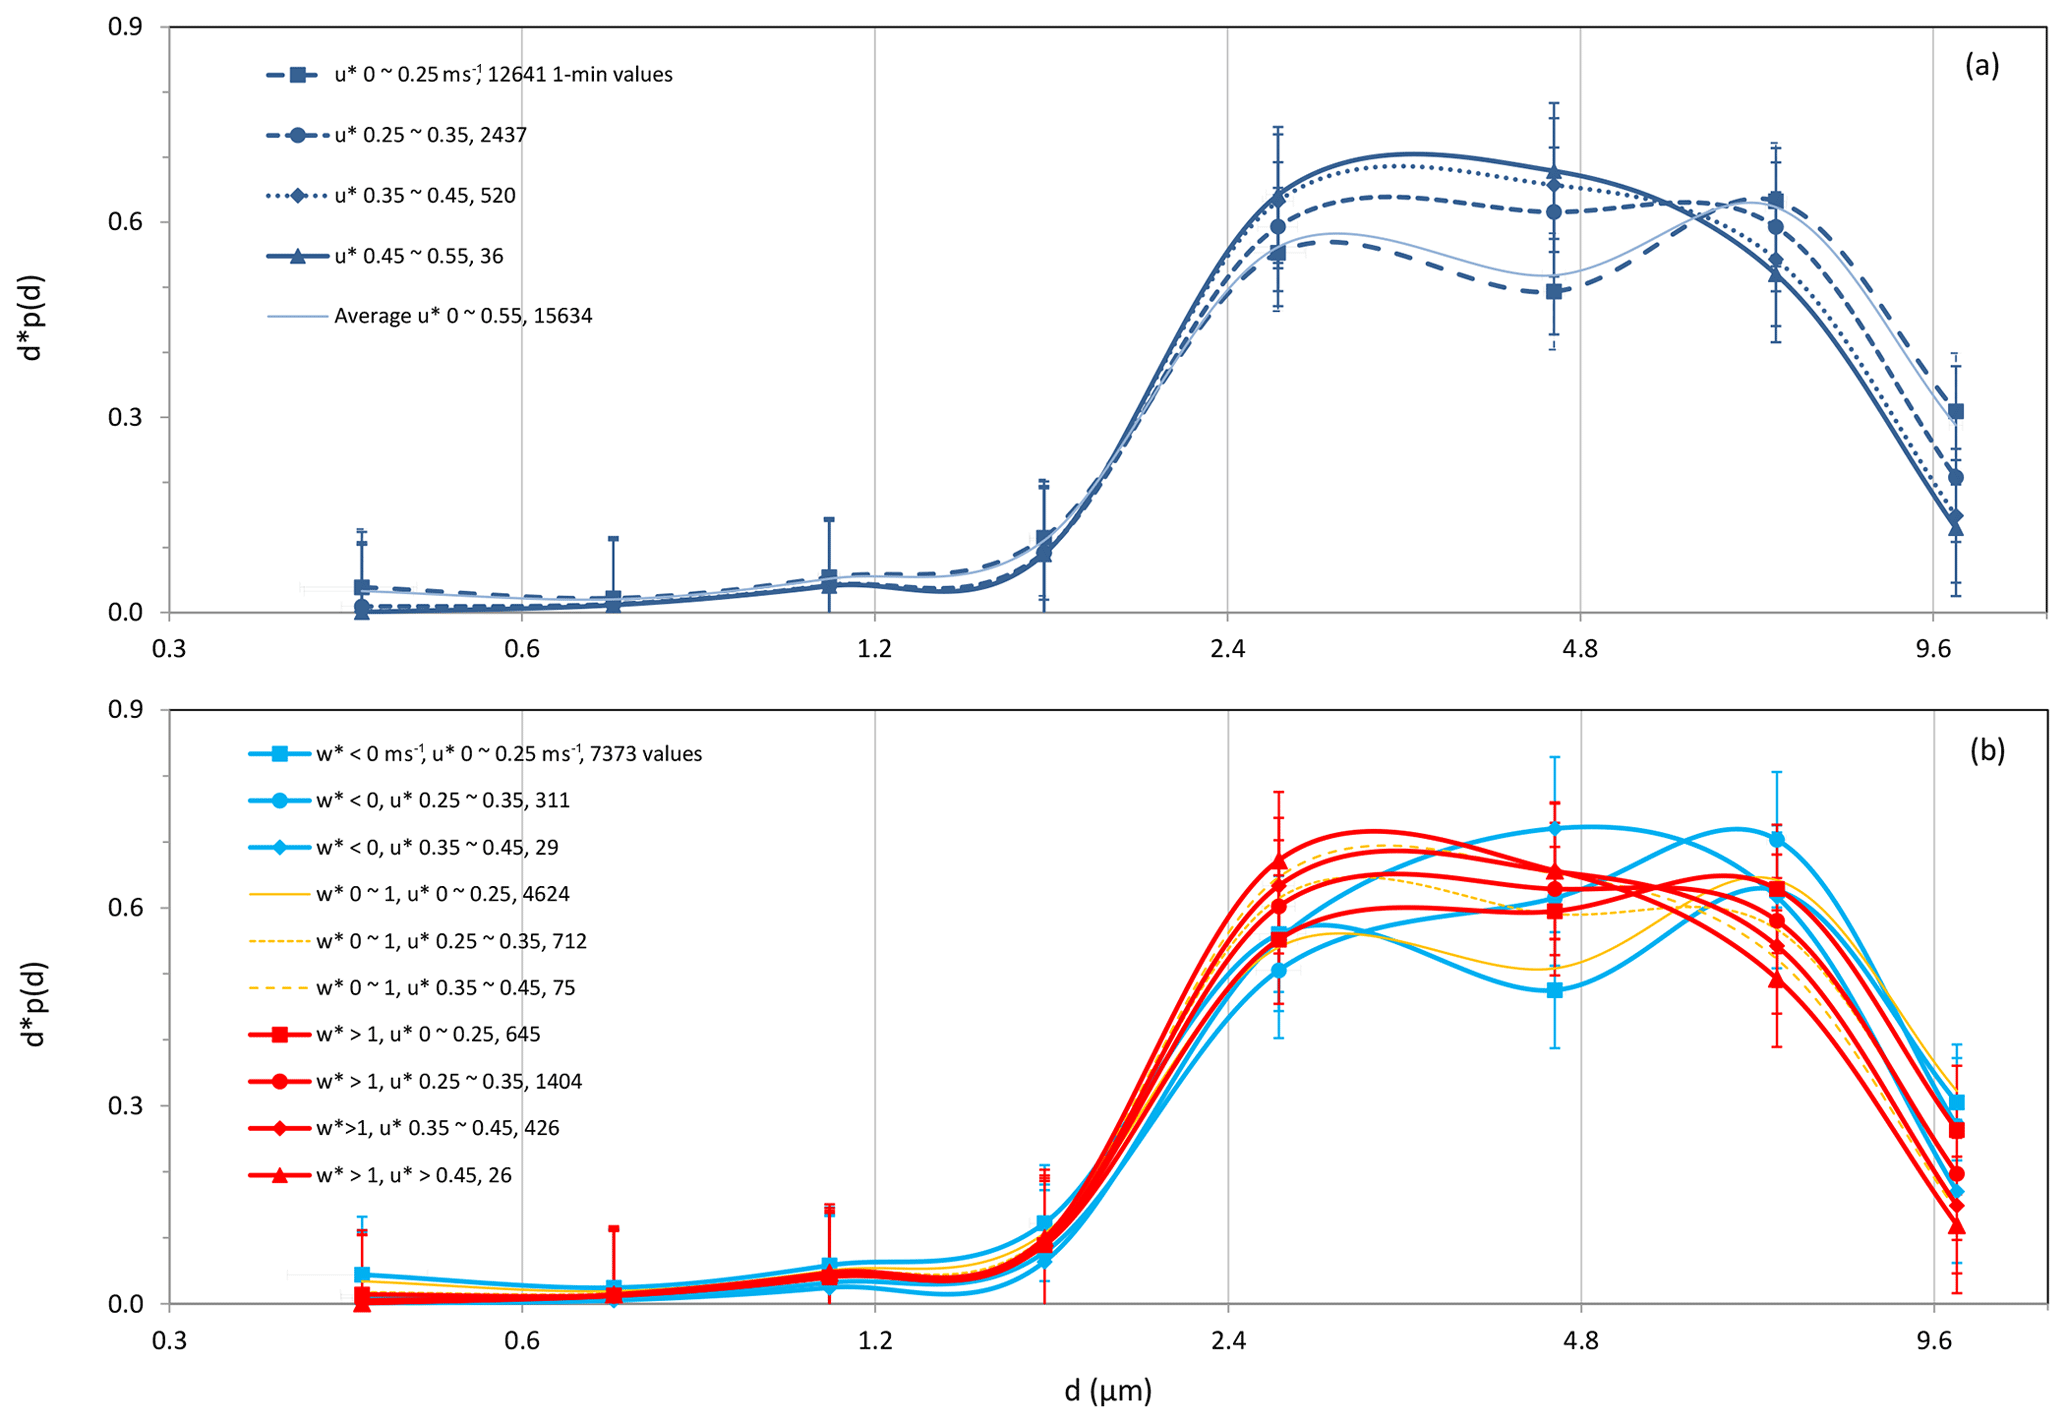
Figure 4(a) Dust PSD for different u∗ categories derived from the whole JADE dataset; (b) same as (a) but for the different u∗ categories under stable (), moderately unstable ( m s−1) and unstable ( m s−1) conditions.
To examine the dust PSD dependency on ABL stability, we divide the dataset into stable (), moderately unstable ( m s−1) and unstable ( m s−1) stability classes. For each stability class, the dust PSD data are regrouped according to the u∗ categories. Figure 4b shows the dust PSDs averaged for different u∗ categories and stability classes. For given stability class, dust PSD shows dependency on u∗, and for a given u∗ category, dust PSD shows dependency on w∗. For given u∗, the mode of dust PSD shifts systematically to finer particles as the ABL becomes more unstable.
3.2 Case study results
We now study the cases of Event-10 (09:49–19:13 LT 12 March 2006; Julian day 70.9506940–71.3423611) (note that all times are given in UTC unless explicitly stated as LT), Event-11 (21:12 LT 12 March–02:08 13 March 2006, Julian day 71.42500–71.63056) and Event-12 (09:54–18:58 LT 13 March 2006, Julian day 71.95417–72.33194). Figure 5 shows the 1 min averages of wind speed at 0.53 m, U, air temperature at 0.66 m, T, saltation flux at 0.05 m, q5 cm and dust concentration (summed over all particle size bins) at 1 m, C1 m. Event-10 occurred under daytime unstable conditions. It was a very hot day prior to a cool change (cold front causing temperature drop but no rainfall), with near-surface air temperature reaching 52 ∘C and wind speed ∼8 m s−1. The event lasted ∼10 h. The cool change occurred at ∼19:00–21:00 LT 13 March 2006. While precipitation was not recorded by the rain gauge (with resolution of 0.2 mm), the rain sensor (PPS-01(C-PD1), Prede Co. Ltd.), as marked in Fig. 5b, sensed an event of raindrops shortly before the cool change, lasting about 2 min, and shortly after, lasting about 1 min (Ishizuka et al., 2008). The strong winds (probably also strong sand drift and dust emission) accompanying the cool change caused the shutdown of the instruments and thus, unfortunately, this period was not fully recorded. Event-11 occurred under stable conditions after the cool change in the night time of 12/13 March 2006, during which T was dropping from ∼40 to ∼33 ∘C and U from ∼8 to ∼5 m s−1. Event-11, which can also arguably be considered to be part of Event-10, was much weaker than Event-10.
As the OPC measurements were taken close to the surface and directly above the dust source, the dust-concentration values were generally high. The mean, standard deviation, maximum and minimum of C1 m are respectively 7.56, 8.56, 65.96 and 0.02 mg m−3 for Event-10 and are 3.05, 10.57, 100.17 and 0.04 mg m−3 for Event-11. The extremely high dust concentrations measured shortly before and after the cool change could be affected by dust advection and are excluded from the analysis (although their inclusion made no difference to the event averages of the dust PSDs). For other times, it can be safely assumed that the dust observed was locally emitted.
Event-12 is developed shortly after the weak rainfall event (R4). Again, while precipitation was not recorded by the rain gauge (i.e. the total rainfall was less than 0.2 mm), the rain sensor reported rain drops during 71.70625–71.95278. Ishizuka et al. (2008) reported that Event-12 is unique for JADE, because it is the only case when the soil surface was weakly crusted. We will show later how dust PSD can substantially evolve even within one dust event, as soil surface conditions change (Fig. 10).
Figure 6 shows the dust PSDs for the different u∗ categories for Event-10, Event-11 and Event-12. For Event-11 and Event-12, the dependency of dust PSD on u∗ is obvious, in agreement with the overall results shown in Fig. 4a. The dust PSD for Event-10 shows no clear dependency on u∗, which was reported in Shao et al. (2011). Our basic argument for dust PSD dependency on u∗ rests upon the assumption that saltation-impact speed is u∗ dependent. It has been suggested that impact-particle speed may not strongly depend on u∗ for transport-limited saltation (Ungar and Haff, 1987), because particle-flow feedbacks force an approximately constant saltation-impact speed. While this argument is supported by some experimental evidence (Martin and Kok, 2017) and numerical simulations (Duran et al., 2012; Kok et al., 2012), its general validity and the conditions for its validity need further examination. JADE Event-10 is probably a case which comes closest to meet the requirements of strong particle-flow feedback and sustained equilibrium of saltation for the Ungar and Haff (1987) hypothesis to apply. In addition, Event-10 occurred on an extremely hot and dry day, with the 0.66 m air temperature reaching ∼52 ∘C and relative humidity below 3 %. It is likely that under such extreme conditions, inter-particle cohesion is destroyed. These factors combined may be responsible for the lack of dust PSD dependency on u∗ for Event-10 (Fig. 6). But for all other JADE events, the dependency of dust PSD on u∗ is significant.
The event-averaged dust PSDs for Event-10, Event-11 and Event-12 clearly differ. The mean and standard deviation of u∗ and w∗ were respectively 0.36 and 0.057 m s−1 and 1.03 and 0.29 m s−1 for Event-10; they were respectively 0.28 and 0.077 m s−1 and −0.41 and 0.159 m s−1 for Event-11. From Event-10 to Event-11, the dust PSD mode shifted from about 3 to 6 µm. During Event-10, a substantially higher fraction of particles in the size range of 0.4–4 µm existed. To further examine how dust PSD depends on saltation intensity, we have averaged the dust PSDs for different Q categories (not shown). It is found that weak saltation corresponded to coarser dust particles and strong saltation to finer dust particles. Figure 6 confirms the dependency of dust PSD on ABL stability, consistent with the overall results shown in Fig. 4.
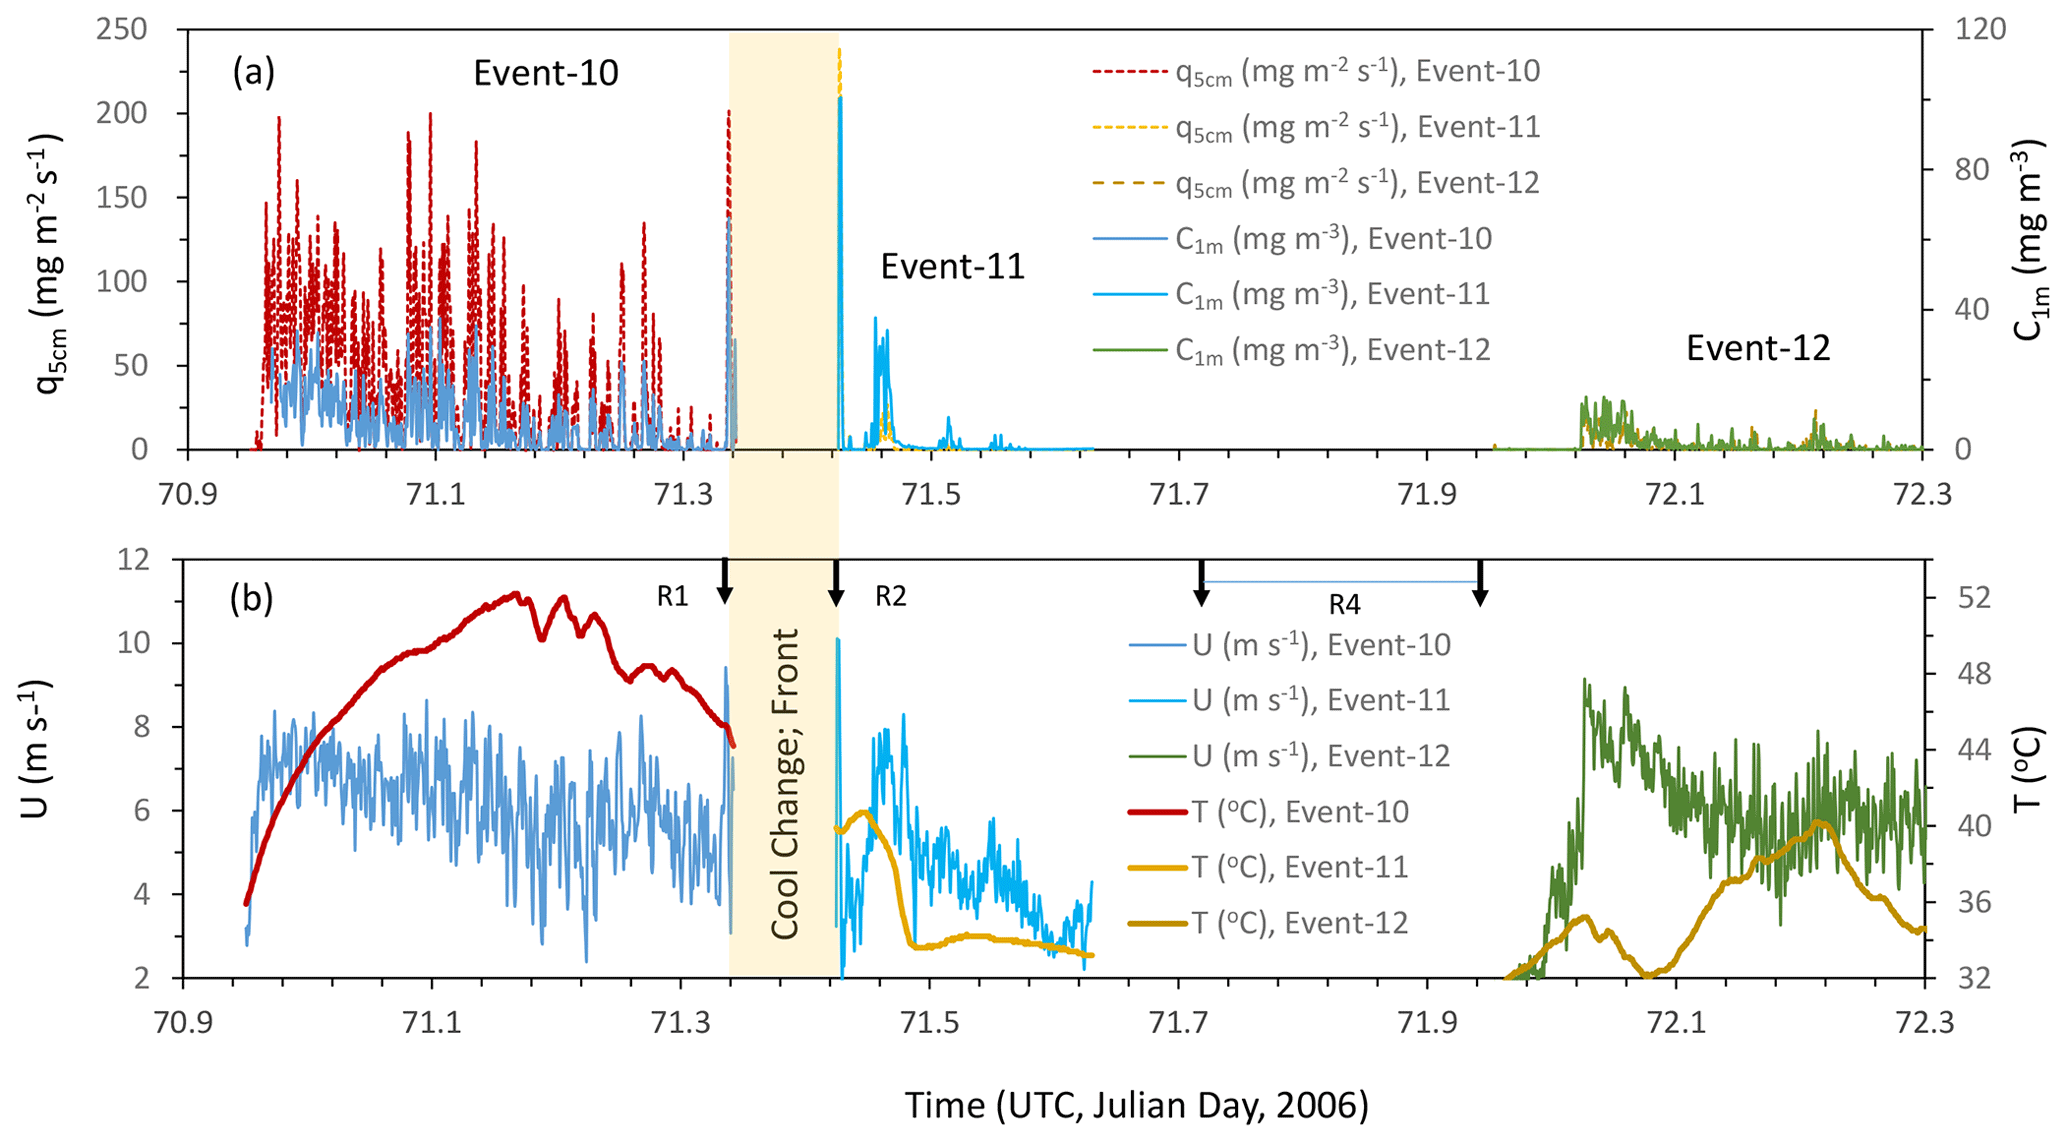
Figure 5(a) One-minute averaged saltation flux at 0.05 m, q5 cm, and dust concentration at 1 m, C1 m, for Event-10, Event-11 and Event-12; (b) same as (a) but for wind speed at 0.53 m above ground, U, and air temperature at 0.66 m, T. The cool change is marked and the three rain events sensed by the rain sensor are marked as R1, R2 and R4 using the black arrows.
Figure 5b shows that the wind conditions for Event-10 and Event-12 were not too different, but Event-12 was much weaker. Figure 6 shows that also the dust PSDs for the two events considerably differ, with Event-10 being the one with richer finer dust particles. Event-12 will be further discussed in Sect. 4.2.
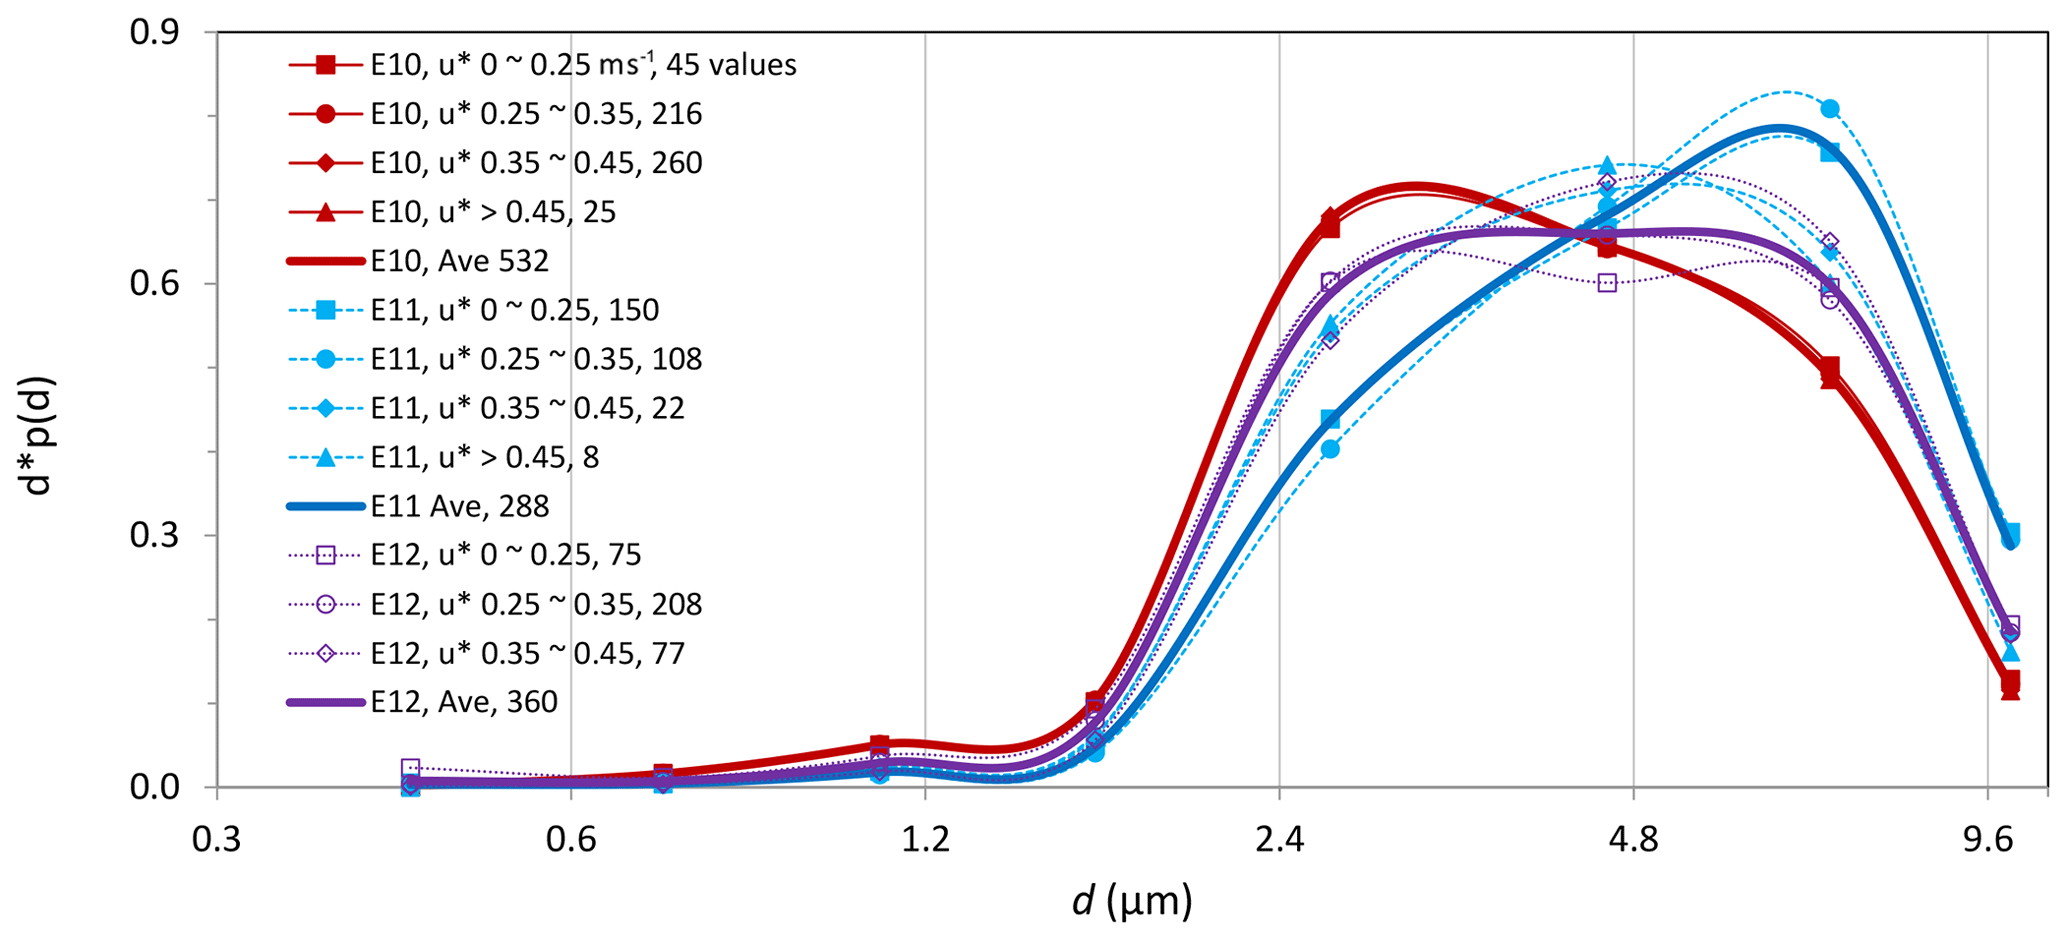
Figure 6Dust PSD for different u∗ categories for Event-10, Event-11 and Event-12. Also shown are the PSDs averaged over all u∗ categories for the individual events.
We make the following observations based on the JADE data: (1) dust PSD has rich temporal variations and is not “universal”; (2) dust PSD depends on u∗ and ABL stability; and (3) dust PSD is influenced by soil surface conditions. These observations support the conceptual understanding that dust PSD is determined both by saltation bombardment and by soil binding strength (Shao, 2001, 2004).
4.1 Influence of turbulence on dust PSD
The reason for the dependency of dust PSD on u∗ has been explained in Gillette et al. (1974), Gillette (1981), Shao et al. (1993), Alfaro et al. (1997) and Shao (2001, 2004), because u∗ is a descriptor of saltation-bombardment intensity. In the earlier explanations, only mean friction velocity and mean saltation are considered, while the turbulent nature of saltation bombardment is implicitly neglected. But how is the dependency of dust PSD on ABL stability, here w∗, explained? The most conspicuous reason is the enhanced saltation bombardment by turbulence in unstable conditions.

Figure 7(a) Saltation PSD averaged for four different u∗ categories for Event-11; (a) same as (a) but for Event-10.
It is interesting to examine how dust PSD is related to saltation PSD. The saltation PSD for Event-10 and Event-11 are shown in Fig. 7. First, for m s−1 in Event-11, saltation PSD was confined to a narrow size range centred at 70–80 µm where u∗t is minimum. This indicates that saltation splash or bombardment was weak to mobilize particles in other size ranges. In contrast, for m s−1 in Event-10, saltation PSD covered a broader size range, implying that saltation splash was strong to entrain particles of other sizes. Second, for both Event-10 and Event-11, the peak values of saltation PSD were shifted to larger particles for larger u∗: for Event-10 the peak for m s−1 was at 203.3 µm, while for m s−1 it was at 257.8 µm. Clearly, since u∗t is particle size dependent, saltation PSD is a selective sample of the soil PSD by wind. Third, the saltation PSDs for given u∗ categories (e.g. m s−1, Fig. 8a and b) differed significantly between Event-10 and Event-11 as a consequence of ABL stability. In Event-11 (Fig. 8a), saltation was not fully developed, as the saltation PSD plateau in the size range 100–300 µm suggests, implying that saltation splash or bombardment was not efficient. In Event-10 (Fig. 7b), saltation was more fully developed.
The stronger saltation of Event-10 is partially attributed to the stronger wind and instability, which result in a larger than in Event-11. It is known from the ABL similarity theory that
where κ is the von Karman constant, z height and ϕm a similarity function (Stull, 1988):
where (L is Obukhov length), βm=5 and γm=16 are empirical coefficients (Businger et al., 1971). For stable conditions ϕm>1 and for unstable conditions ϕm<1. Figure 8 shows the PDFs of u∗ and w∗ for Event-10 and Event-11 together with the approximations for the PDFs of u∗. For Event-10, m s−1, while for Event-11 m s−1.
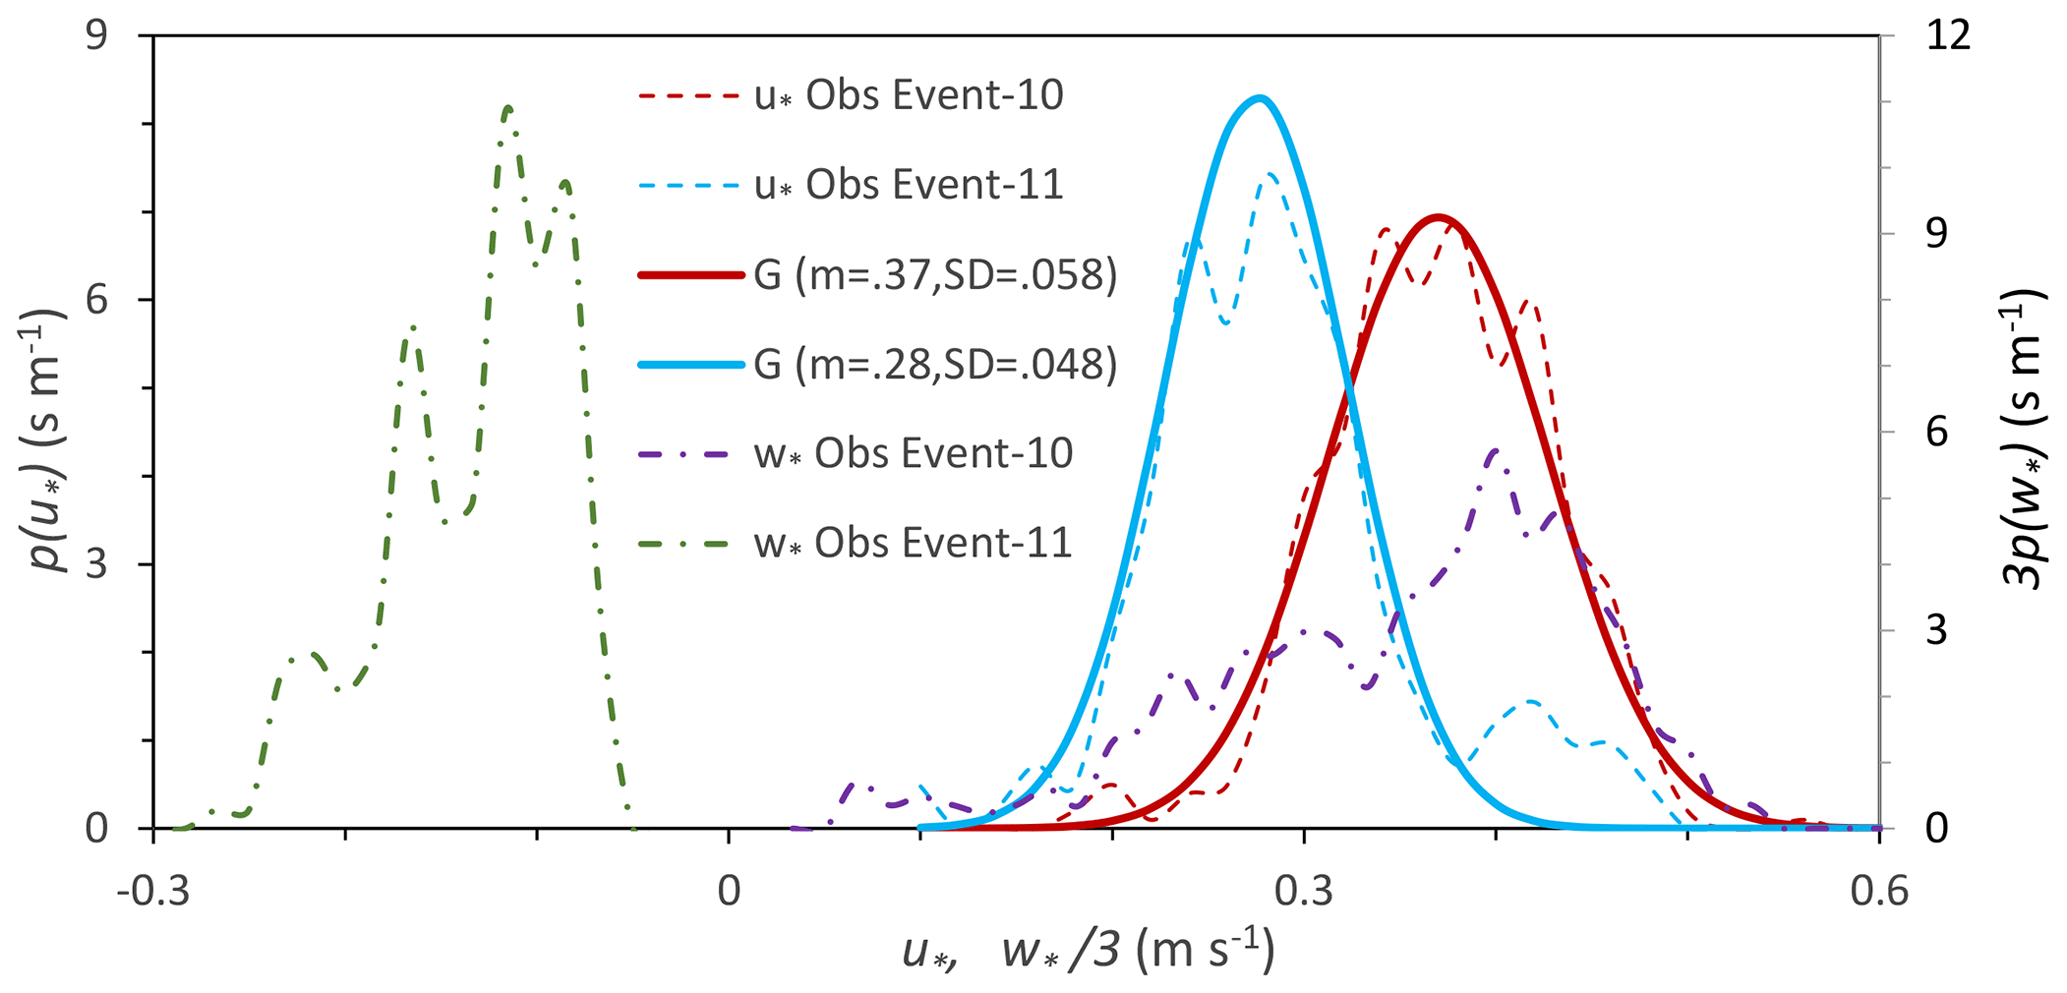
Figure 8The probability density functions of u∗ and w∗, p(u∗) and p(w∗) for Event-10 and Event-11, together with the Gaussian approximations for the p(u∗) functions. The mean values (m) and standard deviations (SD) for the Gaussian (G) distributions are given. Note that for p(w∗), 3p(w∗) against is plotted to conveniently present the information in the same graph.
We suggest that the dependency of dust PSD on w∗ for given u∗ is attributed to saltation-bombardment intensity from two perspectives. First, as Fig. 8 shows, u∗ is a stochastic variable. Li et al. (2020) suggested that in neutral conditions is Gauss distributed. Klose et al. (2014) reported that τ in unstable conditions is Weibull distributed. The exact form of p(τ) requires further investigation, but the JADE data of u∗ show that p(u∗) is reasonably Gaussian. Hence
is skewed to smaller τ, suggesting that the large-eddy model results of Klose et al. (2014) are qualitatively reasonable. Figure 8 shows that u∗ in Event-10 not only had a larger mean value but also a larger variance than in Event-11. We emphasize that the variance of u∗ strongly affects saltation, because saltation flux depends non-linearly on u∗. To illustrate this, we consider u∗1 and u∗2 and assume that
-
u∗1 and u∗2 are Gaussian distributed and have the same mean that equals u∗t (say 0.2 m s−1);
-
u∗1 and u∗2 have respectively standard deviations, σ1 and σ2, with σ2=η σ1 and η>1; and
-
Q satisfies the Owen's model (Owen, 1964),
where c is a dimensional constant. It follows that the ratio of the mean values of Q2 and Q1 is
Equation (9) can be evaluated numerically for different η (Table 1) and is approximately
This shows that p(u∗) profoundly influences the magnitude of Q. For fixed , a larger u∗ variance corresponds to a larger .
Table 1Streamwise saltation flux ratios, ηQ, for different u∗ SD ratios, η (see text for details).
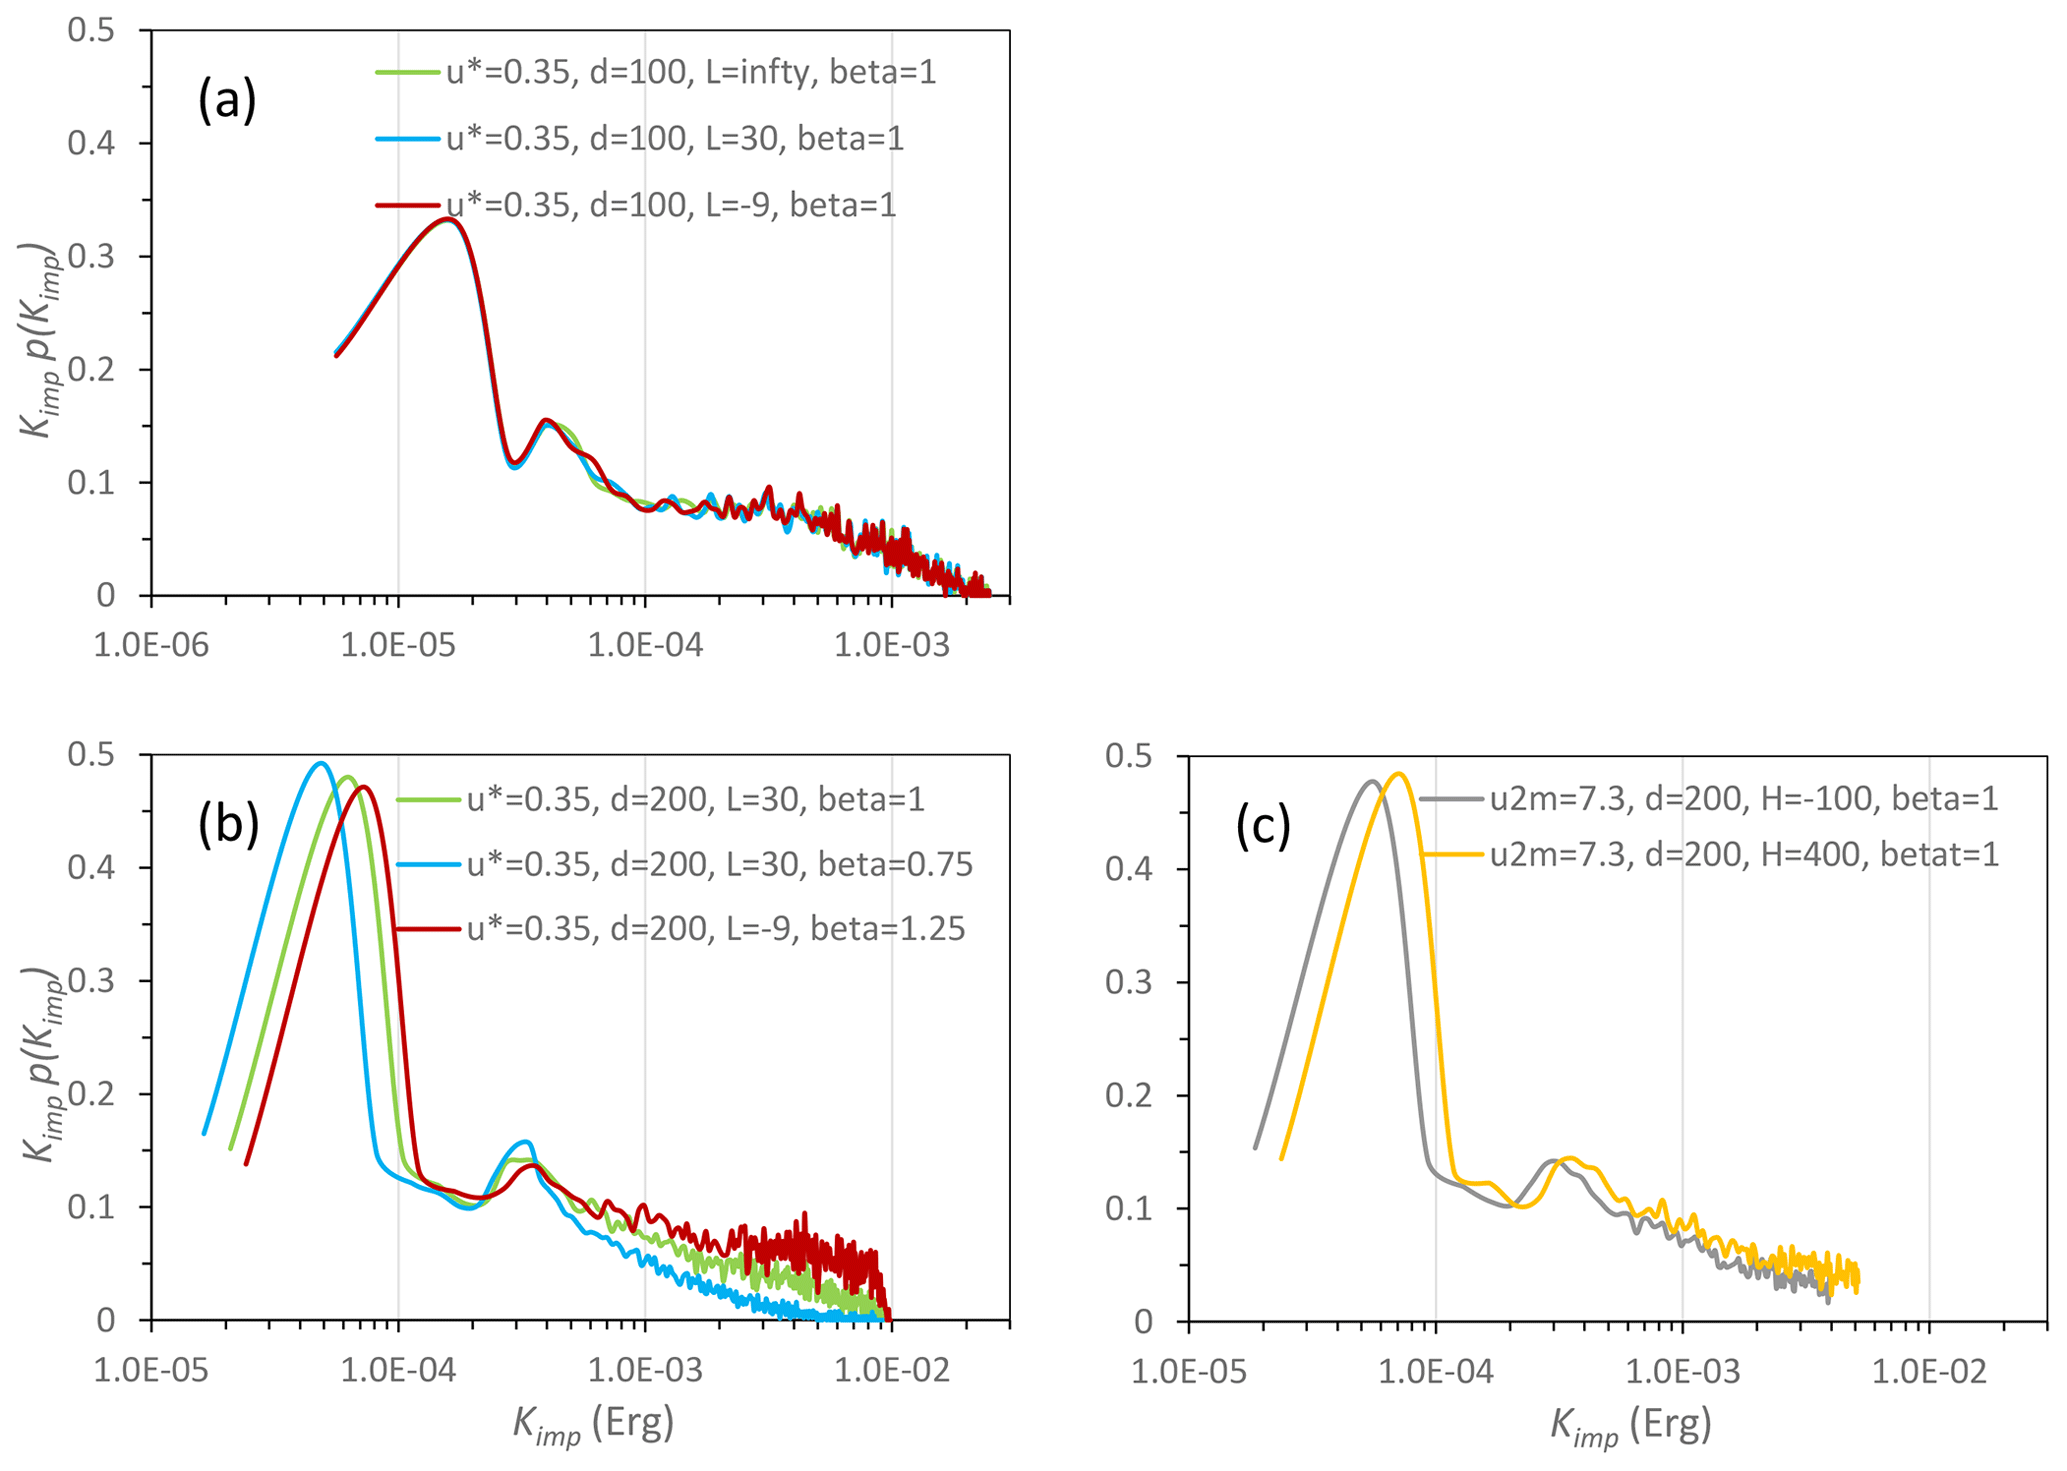
Figure 9Probability density function p(Kimp) (plotted in Kimpp(Kimp) against Kimp in logarithmic scale) for the numerical experiments. In (a), p(Kimp) is shown for m s−1, d=100 µm and β=1 but for three different Obukhov lengths L=∞, 30 m and −9 m. In (b), the effect of β on p(Kimp) is examined; in (c), the effect of stability on p(Kimp) with given mean wind speed at z=2 m is examined.
Second, in unstable conditions, turbulence is stronger due to buoyancy production, which leads to increased saltation-bombardment intensity. We do not have independent evidence to verify this, but to illustrate the point, we use a two-dimensional (2D, x1 in mean wind direction and x3≡z in vertical direction) saltation model (Supplement A) to simulate the impact kinetic energy of saltation sand grains. For given u∗ and roughness length, z0, a 2D turbulent flow is generated with the mean wind assumed to be logarithmic ; the velocity standard deviations satisfy
and the dissipation rate for turbulent kinetic energy, ε, satisfies
The similarity relationships fu3(ζ) and fε(ζ) follow Kaimal and Finnigan (p 16, 1995). As saltation takes place in the layer close to the surface, the vertical profiles of σu1 and σu3 are considered following Yahaya et al. (2003). The coefficient a (where a=1.16β) is varied by setting β to 0.75, 1.00 or 1.25 for weak, normal or strong turbulence, respectively.
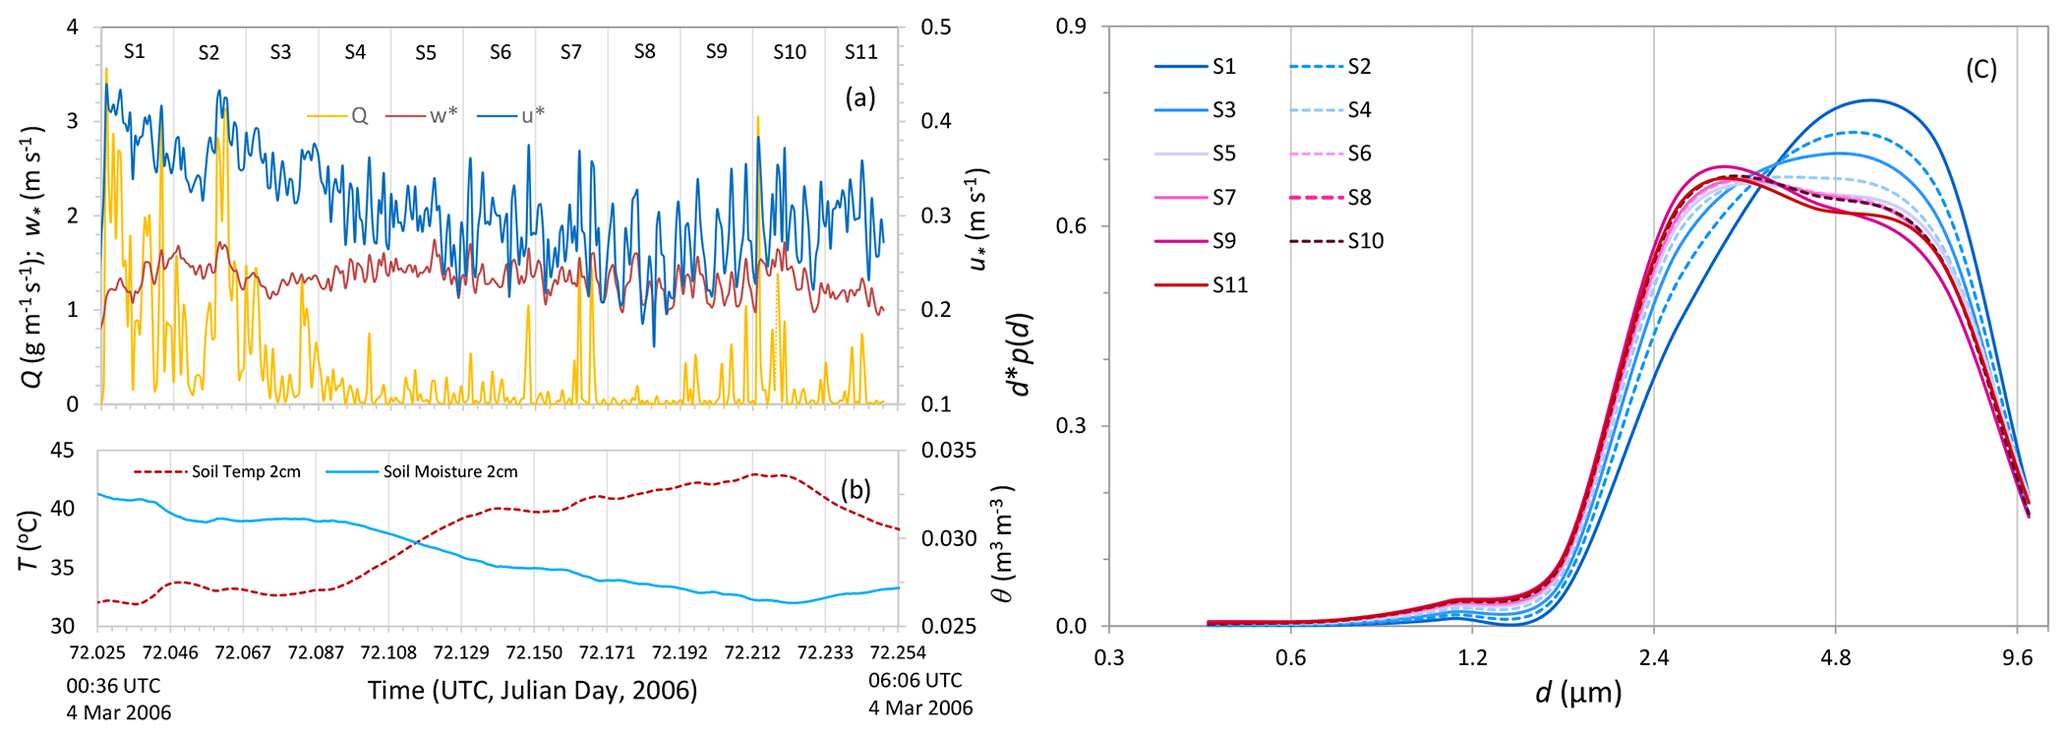
Figure 10(a) Time series of streamwise saltation flux, Q (g m−1 s−1); convective scaling velocity, w∗ (m s−1); and friction velocity, u∗ (m s−1), for Event-12. The time span of Event-12 is divided into 11 half-hourly sections, labelled as S1, S2, etc. (b) Same as (a) but for soil temperature, T (∘C), and soil moisture, θ (m3 m−3), both at 0.02 m depth. (c) Dust PSDs averaged over Sects. S1, S2, etc.
In each numerical experiment, 20 000 sand grains of identical size are released from the surface and their trajectories are computed. At impact on the surface, the particles rebound with a probability of 0.95 and a rebounding kinetic energy, Kreb, 0.5 times the impact kinetic energy, Kimp. The rebound angle is Gauss distributed with a mean of 40∘ and standard deviation 5∘. Splash entrainment is neglected. The PDF of Kimp, p(Kimp), is used as a measure for bombardment intensity.

Figure 11JADE Event-10 averaged airborne-dust PSD measured at 1 m (532 one-minute samples) and 3.5 m (563 one-minute samples) using OPCs. Also shown are standard-error bars. For comparison, the Event-10 averaged (over 532 one-minute samples) emission-flux PSD calculated using Eq. (5) is also plotted.
Many numerical experiments were carried out, but for our purpose, we show only the results of the ones listed in Table 2. The initial velocity components of sand grains (V1o,V3o) are generated stochastically. V1ois Gauss distributed with a mean and standard deviation, ; V3o is Weibull distributed with a shape parameter A= 2 and a scale parameter , where Γ is a gamma function. To account for the influence of stability on V3o, is modified such that the adjustment to σV3o is the same as that to σu3(10z0); that is, the modified scale parameter, B, is given by
Figure 9a compares p(Kimp) for Exp1a, 1b and 1c and shows that p(Kimp) for these cases is very similar. The small differences in p(Kimp) between the cases suggest that the differences in particle trajectory arising from the stability modification to turbulence profile, with u∗ fixed, are negligible. However, a small change in β, as Fig. 9b shows for Exp2a, 2b and 2c, can lead to significant changes in p(Kimp) with larger β corresponding to higher probability of larger Kimp, namely, high saltation-bombardment intensity. In Exp3a and 3b, u2 m (mean wind 2 m height) is set to 7.3 m s−1 and the surface sensible heat flux, H, to −100 and 400 W m−2. Figure 9c shows that p(Kimp) differs with larger Kimp in unstable conditions.
Table 2Numerical experiments for saltation-bombardment intensity. For all experiments, z0=0.48 mm, C0=5, C1=2 and ρp=2650 kg m−3.
To summarize, the numerical experiments suggest that the PDF of the particle initial velocity significantly influences the saltation-bombardment intensity, and saltating particles in unstable ABL impact the surface with larger kinetic energy than in stable ABL. This is the result seen in Figs. 7 and 8; i.e. saltation in Event-10 was more fully developed than in Event-11. The more fully developed saltation in unstable ABL increases saltation-bombardment intensity and hence the release of finer dust particles, as seen in Fig. 6.
4.2 Influence of surface condition on dust PSD
A detailed analysis of Event-12 (Fig. 10) reveals that the dependency of dust PSD on friction velocity and ABL stability is made complicated by soil surface conditions. To analyse how dust PSD evolved during the event, we divide Event-12, which lasted ∼5.5 h, into 11 half-hourly time sections labelled as S1, S2, etc. For each section, the dust PSD is averaged over time and plotted in Fig. 10c. Figure 10a shows the time series of and u∗, and Fig. 11b those of 2 cm soil temperature and soil moisture. For the whole event, the ABL was unstable, with w∗ fluctuating around 1.64±0.12 m s−1. Initially (e.g. S1 and S2), u∗ was relatively large, exceeding 0.4 m s−1 at times, but then eased to around 0.3 m s−1. Q generally followed the variations of u∗. Yet, the dust PSD showed a systematic shift from coarser to finer particles, as the event progressed. The dust PSD dependency on u∗ of Event-12 does not conform with the results for Event-11 (Fig. 6) or the overall results (Fig. 4a). Ishizuka et al. (2008) noticed that prior to Event-12, weak rainfall occurred (R4, Fig. 5b) and, consequently, weak crusts formed on the soil surface. Apparently, the lightly crusted surface prevented the emission of fine dust particles in the early stages of Event-12. As the event progressed, soil temperature increased, soil moisture decreased (Fig. 10b) and the saltation during the early stages caused the destruction of the crusts and the amount of fine dust particles available for emission increased. These are the most likely reasons for why, in the later stages of Event-12, an increased fraction of fine dust was released, although the atmospheric stability did not significantly change and u∗ actually decreased.
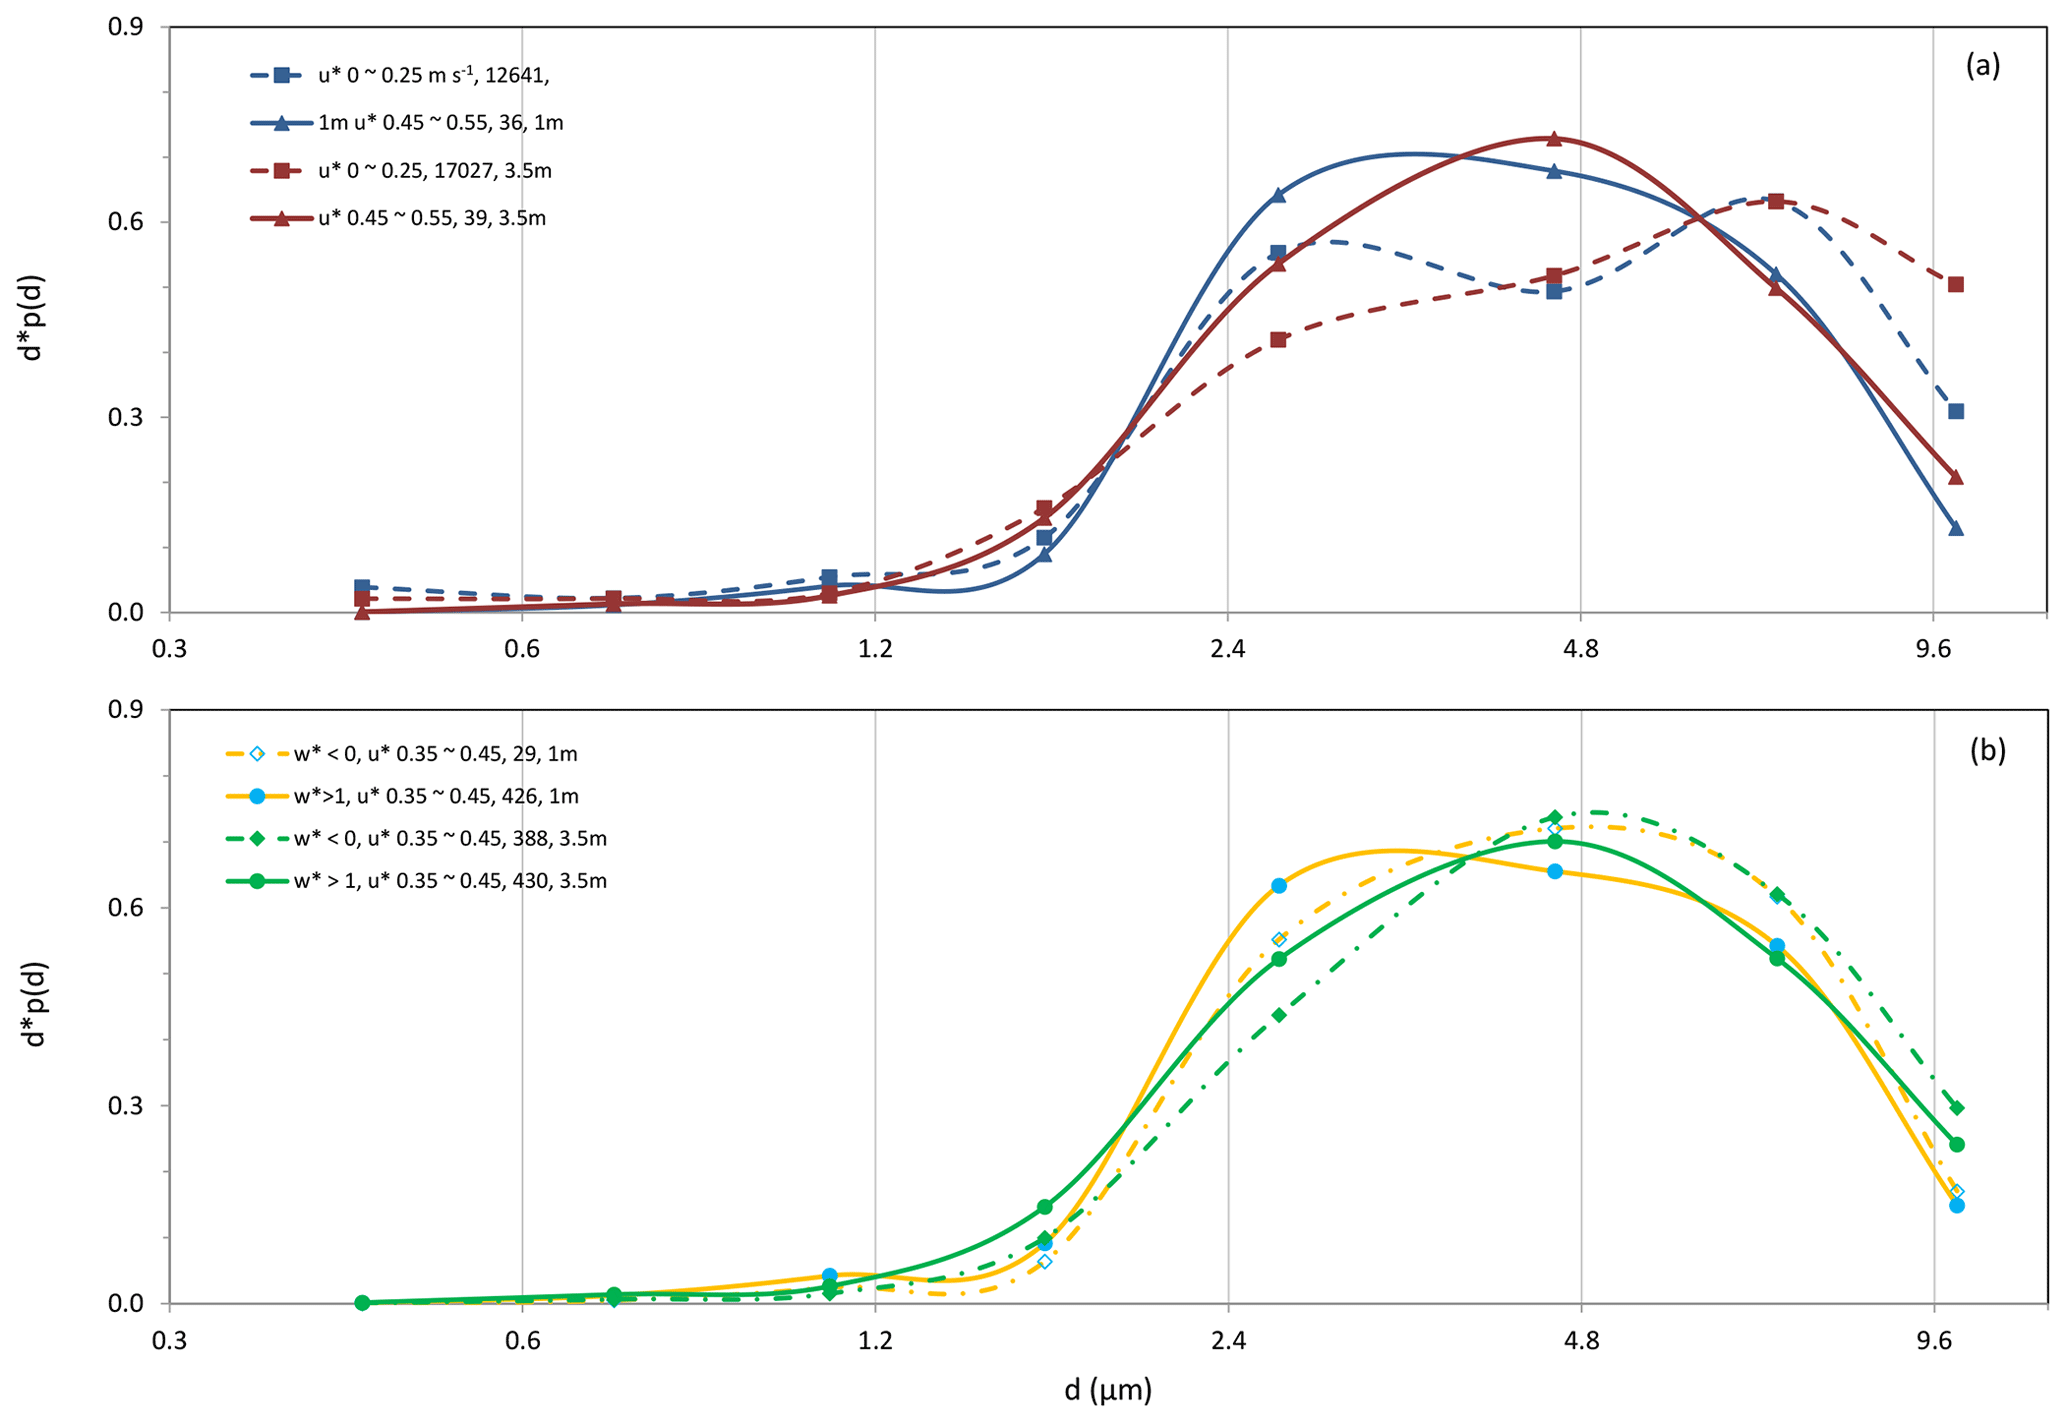
Figure 12(a) JADE averaged airborne-dust PSD measured at 1 and 3.5 m for two u∗ categories. (b) Same as (a) but for one u∗ category and two different stabilities.
4.3 Uncertainties
Several issues are related to the uncertainties of the analysis. First, the approximation of emission-dust PSD with airborne-dust PSD measured at some height above ground causes uncertainties, because airborne-dust PSD is height dependent as a consequence of the dust-transport processes (e.g. diffusion and deposition) in the atmosphere, which are both particle-size and turbulence-property dependent. As our understanding of these processes is not complete and dust measurements have inaccuracies, a careful selection of the data for the analysis is necessary. Figure 11 shows a comparison of Event-10 averaged airborne-dust PSDs at 1 and 3.5 m. Ishizuka et al. (2014) suggested to exclude the 2 m OPC data, because they do not correlate well with the 1 m and 3.5 m OPC data. The PSDs derived from the 2 m OPC data do show unexpected differences in comparison to those from the 1 m and 3.5 m OPC data. We thus have excluded the 2 m OPC data from our analysis. The PSDs derived from the 1 m and 3.5 m OPC data somewhat differ, with the peak particle size shifted by about two micrometres, i.e. airborne-dust PSD has a noticeable change with height. This also implies that it would be very difficult to compare airborne-dust PSD measured at different locations and under different conditions without a well-established framework equivalent to the Monin–Obukhov similarity theory.
Also shown in Fig. 11 is the Event-10 averaged emission-flux PSD calculated using Eq. (5). Dust fluxes for different particle size bins are calculated using the 3.5 m and 1 m OPC data with the gradient method (Gillette et al., 1972) and corrections (Shao et al., 2011). As dust flux is proportional to the negative gradient of dust concentration, emission-flux PSD basically describes how dust-concentration gradient (in our case – (c3.5 m−c1 m)) depends on particle size.
Although dust PSDs derived from 1 m OPC and 3.5 m OPC data differ, qualitatively they show similar dependencies of dust PSD on u∗ and w∗. Figure 12a compares the averaged dust PSDs for two u∗ categories using the 1 m OPC and 3.5 m OPC data. For both cases, the dust PSD dependency on u∗ is visible. Figure 12b compares the averaged dust PSD for a given u∗ category (0.35–0.45 m s−1) under stable and unstable conditions. Again, both the 1 m OPC and 3.5 m OPC dust PSDs show dependency on w∗.
It needs to be clarified whether using 1 min averages of shear stress, saltation flux and dust flux are appropriate for the study. Related to this question are two intertwined yet somewhat different scaling issues, namely, (1) the scaling of turbulent flux and the corresponding mean variable of boundary-layer turbulent flows (i.e. the flux–gradient relationship); and (2) the scaling of aeolian fluxes and atmospheric forcing (i.e. saltation/dust-emission intermittency). It is usual in boundary-layer meteorology to compute a turbulent flux from the profile of the corresponding mean quantity, e.g. mean shear stress from mean wind profile, and the time interval for the mean is typically 15 to 30 min such that the assumptions of horizontal homogeneity and stationarity commonly made in boundary-layer studies are met. This issue is not yet fully resolved even in boundary-layer studies. For example, large-eddy models (with spatial resolution of several metres and temporal resolution of seconds) frequently use the Monin–Obukhov similarity functions to estimate subgrid surface stress from the grid-resolved speed. In this study, we distinguish the 1 min averages of u∗ from the mean shear stress of the boundary-layer flow to emphasize the importance of shear stress fluctuations. The problem of how to scale aeolian fluxes is not new (e.g. Shao and Mikami, 2005). Dupont (2020) has a dedicated paper on this problem and stated that u∗ is a suitable scaling parameter for dust flux over usual 15–30 min time intervals, but at smaller time resolution, wind becomes more relevant to scale dust fluxes, which is a conclusion similar to that reached in Sterk et al. (1998). The studies of Stout and Zobeck (1997) and Sterk et al. (1998), as well as more recently Klose and Shao (2012) and Klose et al. (2014), all pointed to the importance of taking instantaneous shear stress into consideration for aeolian dynamics. As Shao (2008) explains, τinst is proportional to , where τinst is instantaneous shear stress and U′instantaneous wind speed. The argument of Shao (2008) reasonably well explains the conclusions of Sterk et al. (1998) and Dupont (2020). Liu et al. (2018, Fig. 7) analysed co-spectrum of saltation flux and shear stress and showed that they have a correlation peak at Hz, corresponding to gusts or large eddies of around 10 min in turbulent flows. These considerations suggest that to average shear stress and aeolian fluxes over 1 min is appropriate and has the advantage of showing how dust emission is related to turbulence. We have emphasized throughout this paper that turbulence is key to understanding the dependency of dust PSD on ABL stability, because the most essential difference among ABLs of different stability are the intensity and structure of turbulence.
As far as averaged dust PSDs are concerned, we have compared the dust PSDs averaged for different u∗ categories using 1 min averaged data and 10 min averaged data. The results are almost the same.
Using JADE data, we showed that dust PSD is dependent on friction velocity u∗. This finding is consistent with the wind-tunnel study of Alfaro et al. (1997). The JADE data support the claim that dust PSD is saltation-bombardment dependent and does not support the hypothesis that dust PSD is invariant.
The JADE data show that dust PSD, as well as saltation PSD, also depends on ABL stability. This finding is consistent with the results of Khalfallah et al. (2020). Dust PSD is dependent on ABL stability for two reasons. First, u∗ is a stochastic variable and the PDF of u∗ profoundly influences the magnitude of saltation flux, Q, because of the non-linear relationship between Q and u∗. With fixed u∗ mean, a larger u∗ variance corresponds to a larger Q. Unstable ABL has in general larger u∗ variances which generate stronger saltation bombardment and produce the emission of finer dust particles. Second, in unstable ABL turbulence is generally stronger, and in strong turbulent flows the proportion of saltation particles with large impacting kinetic energy is larger than in weak turbulent flows. Consequently, saltation in unstable ABLs is more fully developed and saltation bombardment has higher intensity.
The dependencies of dust PSD on u∗ and ABL stability are ultimately attributed to the statistic behaviour of u∗, i.e. its PDF p(u∗) or more simply its mean and variance. These dependencies point to the same fact that, for a given soil, saltation bombardment plays a determining role for the dust PSD. Stronger saltation causes in general the emission of finer dust.
The dependency of dust PSD on u∗ and ABL stability is made complicated by soil surface condition. In the case of strong saltation and very weak surface and particle binding, the dust PSD dependency on u∗ may become less obvious. In the case of strong surface and particle binding, dust emission in certain size ranges may be prohibited.
Data can be accessed by contacting the corresponding authors.
The supplement related to this article is available online at: https://doi.org/10.5194/acp-20-12939-2020-supplement.
YS performed the data analyses and drafted the article. JZ and NH contributed to the conception of the study, the data analysis and the writing of the article. MI, MM and JL conceived, designed and performed the experiments and helped finalize the paper.
The authors declare that they have no conflict of interest.
We thank the projects that financially support this work. We are grateful to the editor, the three referees, Sylvain Dupont and Jasper Kok, for their constructive comments and helpful discussions.
This research has been supported by the National Key Research and Development Program of China (grant no. 2016YFC0500901), the National Natural Foundation of China (grant nos. 11602100 and 11172118), the Fundamental Research Funds for the Central Universities (grant no. lzujbky-2020-cd06), and the Grants-in-Aid for Scientific Researches (A) from the Japan Society for the Promotion of Science (grant nos. 17201008 and 20244078).
This paper was edited by Hang Su and reviewed by three anonymous referees.
Albani, S., Mahowald, N. M., Perry, A. T., Scanza, R. A., Zender, C. S., Heavens, N. G., Maggi, V., Kok, J. F., and Otto-Bliesner, B. L.: Improved dust representation in the Community Atmosphere Model. J. Adv. Model. Earth Sy., 6, 541–570, https://doi.org/10.1002/2013MS000279, 2014.
Alfaro, S. C., Gaudichet, A., Gomes, L., and Maille, M.: Modeling the size distribution of a soil aerosol produced by sandblasting. J. Geophys. Res.-Atmos., 102, 11239–11249, https://doi.org/10.1029/97JD00403, 1997.
Astrom, J. A.: Statistical models of brittle fragmentation. Adv. Phys., 55, 247–278, https://doi.org/10.1080 /00018730600731907, 2006.
Businger, J. A., Wyngaard, J. C., Izumi, J., and Bradley, E. F.: Flux-Profile Relationships in the Atmospheric Surface Layer, J. Atmos. Sci., 28, 181–189, https://doi.org/10.1175/1520-0469(1971)028<0181:FPRITA>2.0.CO;2, 1971.
Csanady, G. T.: Turbulent Diffusion of Heavy Particles in the Atmosphere, J. Atmos. Sci., 20, 201–208, https://doi.org/10.1175/1520-0469(1963)020<0201:TDOHPI>2.0.CO;2, 1963.
Dupont, S., Scaling of dust flux with friction velocity: time resolution effects, J. Geophys. Res.-Atmos., 125, e2019JD031192, https://doi.org/10.1029/2019JD031192, 2020.
Durána, O., Andreotti, B., and Claudin, P.: Numerical simulation of turbulent sediment transport, from bed load to saltation, Physics of Fluids, 24, 709–737, https://doi.org/10.1063/1.4757662, 2012.
Gillette, D. A., Blifford, I. H., and Fenster, C. R.: Measurements of aerosol size distributions and vertical fluxes of aerosols on land subject to wind erosion. J. Appl. Meteor., 11, 977–987, https://doi.org/10.1175/1520-0450(1972)011<0977:MOASDA>2.0.CO;2, 1972.
Gillette, D. A., Blifford, I. H., and Fryrear, D. W.: Influence of wind velocity on size distributions of aerosols generated by wind erosion of soils. J. Geophys. Res., 79, 4068–4075, https://doi.org/10.1029/JC079i027p04068, 1974.
Gillette, D. A.: Production of dust that may be carried great distances, Geol. Soc. Am., 186, 11–26, https://doi.org/10.1130/SPE186-p11, 1981.
Giorgi, F., Coppola, E., Solmon, F., Mariotti, L., Sylla, M. B., Bi, X., Elguindi, N., Diro, G. T., Nair, V., Giuliani, G., Turuncoglu, U. U., Cozzini, S., Güttler, I., O'Brien, T. A., Tawfik, A. B., Shalaby, A., Zakey, A. S., Steiner, A. L., Stordal, F., Sloan, L. C., and Brankovic, C.: RegCM4: model description and preliminary tests over multiple CORDEX domains, Clim. Res., 52, 7–29, https://doi.org/10.3354/cr01018, 2012.
Ishizuka, M., Mikami, M., Leys, J. F., Yamada, Y., Heidenreich, S., Shao, Y., and McTainsh, G. H.: Effects of soil moisture and dried raindroplet crust on saltation and dust emission. J. Geophys. Res.-Atmos., 113, D24212, https://doi.org/10.1029/2008JD009955, 2008.
Ishizuka, M., Mikami, M., Leys, J., Yamada, Y., Heidenreich, S., Shao, Y., and McTainsh, G. H.: Effects of soil moisture and dried raindroplet crust on saltation and dust emission, J. Geophys. Res.-Atmos., 113, D24212, https://doi.org/10.1029/2008JD009955, 2008.
Ishizuka, M., Mikami, M., Leys, J. F., Shao, Y., Yamada, Y., and Heidenreich, S.: Power law relation between size-resolved vertical dust flux and friction velocity measured in a fallow wheat field, Aeolian Res., 12, 87–99, https://doi.org/10.1016/j.aeolia.2013.11.002, 2014.
Kaimal, J. C. and Finnigan J. J.: Atmospheric Boundary Layer Flows: Their Structure and Measurements, Bound.-Lay. Meteorol., 72, 213–214, https://doi.org/10.1007/BF00712396, 1995.
Khalfallah, B., Bouet, C., Labiadh, M., Alfaro, S., Bergametti, G., Marticorena, B., Lafon, S., Chevaillier, S., Féron, A., Hease, P., Henry-des-Tureaux, T., Sekrafi, S., Zapf, P., and Rajot, J. L.: Influence of atmospheric stability on the size-distribution of the vertical dust flux measured in eroding conditions over a flat bare sandy field, J. Geophys. Res.-Atmos., 125, e2019JD031185, https://doi.org/10.1029/2019JD031185, 2020.
Klose, M. and Shao, Y.: Stochastic parameterization of dust emission and application to convective atmospheric conditions, Atmos. Chem. Phys., 12, 7309–7320, https://doi.org/10.5194/acp-12-7309-2012, 2012.
Klose, M., Shao, Y., Li, X., Zhang, H., Ishizuka, M., Mikami, M., and Leys, J. F.: Further development of a parameterization for convective turbulent dust emission and evaluation based on field observations, J. Geophys. Res.-Atmos., 119, 10441–10457, https://doi.org/10.1002/2014JD021688, 2014.
Kok, J. F.: Does the size distribution of mineral dust aerosols depend on the wind speed at emission?, Atmos. Chem. Phys., 11, 10149–10156, https://doi.org/10.5194/acp-11-10149-2011, 2011a.
Kok, J. F.: A scaling theory for the size distribution of emitted dust aerosols suggests climate models underestimate the size of the global dust cycle, P. Natl. Acad. Sci. USA, 108, 1016–1021, https://doi.org/10.1073/pnas.1014798108, 2011b.
Kok, J. F., Parteli, E. J., Michaels, T. I., and Karam, D. B.: The physics of wind-blown sand and dust, Reports on Progress, Physics Physical Society, 75, 106901, https://doi.org/10.1088/0034-4885/75/10/106901, 2012.
Laurent, B., Marticorena, B., Bergametti, G., and Mei, F.: Modeling mineral dust emissions from Chinese and Mongolian deserts, Glob. Planet Change, 52, 121–141, https://doi.org/10.1016/j.gloplacha.2006.02.012, 2006.
Li, G., Zhang, J., Herrmann, H. J., Shao, Y., and Huang, N.: Study of aerodynamic grain entrainment in aeolian transport. Geophys. Res. Lett., 47, e2019GL086574, https://doi.org/10.1029/2019GL086574, 2020.
Liu, D., Ishizuka, M., Mikami, M., and Shao, Y.: Turbulent characteristics of saltation and uncertainty of saltation model parameters, Atmos. Chem. Phys., 18, 7595–7606, https://doi.org/10.5194/acp-18-7595-2018, 2018. .
Lu, H. and Shao, Y.: A new model for dust emission by saltation bombardment. J. Geophys. Res.-Atmos., 104, 16827–16842, https://doi.org/10.1029/1999JD900169, 1999.
Marticorena, B., Bergametti, G., Aumont, B., Callot, Y., N'Doume, C., and Legrand, M.: Modeling the atmospheric dust cycle: 2. Simulation of Saharan dust sources, J. Geophys. Res., 102, 4387–4404, https://doi.org/10.1029/96JD02964,1997.
Martin, R. L. and Kok, J. F.: Wind-invariant saltation heights imply linear scaling of aeolian saltation flux with shear stress, Sci. Adv., 3, e1602569, https://doi.org/10.1126/sciadv.1602569, 2017.
Mikami, M., Yamada, Y., Ishizuka, M., Ishimaru, T., Gao, W., and Zeng, F.: Measurement of saltation process over gobi and sand dunes in the Taklimakan desert, China, with newly developed sand particle counter, J. Geophys. Res.-Atmos., 110, D18S02, https://doi.org/10.1029/2004JD004688, 2005.
Owen, R. P.: Saltation of uniform grains in air, J. Fluid. Mech., 20, 225–242, https://doi.org/10.1017/S0022112064001173, 1964.
Pisso, I., Sollum, E., Grythe, H., Kristiansen, N. I., Cassiani, M., Eckhardt, S., Arnold, D., Morton, D., Thompson, R. L., Groot Zwaaftink, C. D., Evangeliou, N., Sodemann, H., Haimberger, L., Henne, S., Brunner, D., Burkhart, J. F., Fouilloux, A., Brioude, J., Philipp, A., Seibert, P., and Stohl, A.: The Lagrangian particle dispersion model FLEXPART version 10.4, Geosci. Model Dev., 12, 4955–4997, https://doi.org/10.5194/gmd-12-4955-2019, 2019.
Raupach, M. R.: Drag and drag partition on rough surfaces, Bound.-Lay. Meteorol., 60, 375–395, https://doi.org/10.1007/BF00155203, 1992.
Reid, J. S., Reid, E. A., Walker, A., Piketh, S., Cliff, S., Al Mandoos, A., Tsay, S.-C., and Eck, T. F.: Dynamics of southwest Asian dust particle size characteristics with implications for global dust research, J. Geophys. Res.-Atmos., 113, D14212, https://doi.org/10.1029/2007JD009752, 2008.
Rice, M. A., Willetts, B. B., and McEwan, I. K., An experimental study of multiple grain-size ejecta produced by collisions of saltating grains with a flat bed, Sedimentology, 42, 695–706, https://doi.org/10.1111/j.1365-3091.1995.tb00401.x, 1995.
Rice, M. A., Willetts, B. B., and McEwan, I. K., Observations of collisions of saltating grains with a granular bed from high-speed cine-film, Sedimentology, 43, 21–31, https://doi.org/10.1111/j.1365-3091.1996.tb01456.x, 1996.
Rosenberg, P. D., Parker, D. J., Ryder, C. L., Marsham, J. H., Garcia-Carreras, L., Dorsey, J. R., Briiks, I. M., Dean A. R., Crosier, J., McQuaid, J. B., and Washington, R.: Quantifying particle size and turbulent scale dependence of dust flux in the Sahara using aircraft measurements, J. Geophys. Res.-Atmos., 119, 7577–7598, https://doi.org/10.1002/2013JD021255, 2014.
Shao, Y.: A model for mineral dust emission. J. Geophys. Res.-Atmos., 106, 20239–20254, https://doi.org/10.1029/ 2001JD900171, 2001.
Shao, Y.: Simplification of a dust emission scheme and comparison with data, J. Geophys. Res., 109, https://doi.org/10.1029/2003JD004372, 2004.
Shao, Y.: Physics and Modelling of Wind Erosion, Springer, Chapter 6 and Chapter 8, https://doi.org/10.1007/978-1-4020-8895-7, 2008.
Shao, Y., Ishizuka, M., Mikami, M., and Leys, J. F.: Parameterization of size-resolved dust emission and validation with measurements, J. Geophys. Res.-Atmos., 116, D08203, https://doi.org/10.1029/2010JD014527, 2011.
Shao, Y. and Mikami, M.: Heterogeneous Saltation: Theory, Observation and Comparison, Bound.-Lay. Meteorol., 115, 359–379, https://doi.org/10.1007/s10546-004-7089-2, 2005.
Shao, Y., Raupach, M. R., and Findlater, P. A.: Effect of saltation bombardment on the entrainment of dust by wind, J. Geophys. Res.-Atmos., 98, 12719–12726, https://doi.org/10.1029/93JD00396, 1993.
Sow, M., Alfaro, S. C., Rajot, J. L., and Marticorena, B.: Size resolved dust emission fluxes measured in Niger during 3 dust storms of the AMMA experiment, Atmos. Chem. Phys., 9, 3881–3891, https://doi.org/10.5194/acp-9-3881-2009, 2009.
Sterk, G., Jacobs, A. F. G., and van Boxel, J. H.: The effect of turbulent flow structures on saltation sand transport in the atmospheric boundary layer, Earth Surf. Proc. Land., 23, 877–887, https://doi.org/10.1002/(SICI)1096-9837(199810)23:10<877::AID-ESP905>3.0.CO;2-, 1998.
Stout, J. E. and Zobeck, T. M.: Intermittent saltation. Sedimentology, 44, 959–970, https://doi.org/10.1046/j.1365-3091.1997.d01-55.x, 1997.
Stull, R. B.: An Introduction to Boundary Layer Meteorology, Kluwer Academic Publishers, Boston, https://doi.org/10.1007/978-94-009-3027-8, 1988.
Ungar, J. E. and Haff, P. K.: Steady state saltation in air, Sedimentology, 34, 289–299, https://doi.org/10.1111/j.1365-3091.1987.tb00778.x, 1987.
Walklate, P. J.: A random-walk model for dispersion of heavy particles in turbulent air flow, Bound.-Lay. Meteorol., 39, 175–190, https://doi.org/10.1007/BF00121873, 1987.
Wang, L. and Stock, D. E.: Dispersion of Heavy Particles by Turbulent Motion, J. Atmos. Sci., 50, 1897–1913, https://doi.org/10.1175/1520-0469(1993)050<1897:DOHPBT>2.0.CO;2, 1993.
Webb, N. P., Chappell, A., LeGrand, S. L., Ziegler, N. P., and Edwards, B. L.: A note on the use of drag partition in aeolian transport models, Aeolian Res., 42, https://doi.org/10.1016/j.aeolia.2019.100560, 2019.
Yahaya, S., Frangi, J. P., and Richard, D. C.: Turbulent characteristics of a semiarid atmospheric surface layer from cup anemometers – effects of soil tillage treatment (Northern Spain), Ann. Geophys., 21, 2119–2131, https://doi.org/10.5194/angeo-21-2119-2003, 2003.
Zender, C. S., Bian, H., and Newman, D.: Mineral Dust Entrainment and Deposition (DEAD) model: Description and 1990s dust climatology, J. Geophys. Res., 108, 4416, https://doi.org/10.1029/2002JD002775, 2003.
The ratio is a main issue in dust emission studies (Zender et al., 2003; Laurent et al., 2006). Marticorena et al. (1997) showed that γb depends on soil clay content. Shao (2004) suggested that γb depends on friction velocity, soil type and soil particle size distribution.
Drag-partition theory (Raupach, 1992; Webb et al., 2019) tells us that shear stress, , is not the same as the shear stress, τs, experienced by soil particles, due to roughness sheltering. For JADE, the surface is bare and thus the effect of roughness sheltering is neglected. The saltation fluxes used in this study are measured and do not involve the assumption τ=τs or otherwise.