the Creative Commons Attribution 4.0 License.
the Creative Commons Attribution 4.0 License.
 | 29 Sep 2020
Modulation of springtime surface sensible heating over the Tibetan Plateau on the interannual variability of East Asian dust cycle
Anmin Duan
Zhengguo Shi
Xinzhou Li
Xiaodong Liu
Xugeng Cheng
Tianliang Zhao
Huizheng Che
Yangang Liu
Previous observational evidence and numerical simulations have revealed that the surface sensible heating in spring (March–April–May, MAM) over the Tibetan Plateau (TPSH) can affect the Asian regional hydrological cycle, surface energy balance, and climate through altering atmospheric heat source of the Tibetan Plateau (TP). This study aims to investigate the impacts of MAM TPSH on the interannual variability of East Asian dust cycle by using CAM4-BAM (version 4 of the Community Atmosphere Model coupled to a bulk aerosol model), MERRA-2 (version 2 of the Modern-Era Retrospective analysis for Research and Applications) surface dust concentration, and TPSH measurements. Our simulations show that the surface dust concentrations over the East Asian (EA) dust source region and over the northwestern Pacific (NP) in MAM are significantly positively correlated with TPSH, with regionally averaged correlation coefficients of 0.49 for EA and 0.44 for NP. Similar positive correlations are also shown between the MAM TPSH measurements averaged over the 73 observation sites and the surface dust concentration from MERRA-2. Simulation-based comparisons between strongest and weakest TPSH years reveal that, the MAM surface dust concentration in the strongest TPSH years increases with relative differences of 13.1 % over EA and 36.9 % over NP. These corresponding differences are found in MERRA-2 with 22.9 % and 13.3 % over EA and NP, respectively. Further simulated results show that the processes of whole dust cycles (e.g., dust loading, emission, and transport, as well as dust deposition) are also significantly enhanced during the strongest TPSH years over EA and NP. Through enhancing the TP heat source, stronger TPSH in MAM generates an anticyclonic anomaly in middle and upper troposphere over the TP and over the downstream Pacific region, respectively. These atmospheric circulation anomalies induced by the increased TPSH result in increasing the westerly winds over both EA and NP, which in turn increases dust emissions over the dust source, and dust transport over these two regions, as well as the regional dust cycles. These results suggest that addressing the East Asian dust changes in the future climates requires considering not only increasing greenhouse gas emissions but also the variations of the TP's heat source under global warming.
- Article
(10661 KB) - Full-text XML
- BibTeX
- EndNote


East Asia is a major source of global dust aerosols originating from the Taklamakan Desert and the Gobi Desert. Over this region, an estimated several hundred Tg per year of dust are emitted directly into the air and partly transported to downstream land and ocean regions through westerly winds, e.g., eastern China and northern Pacific (Duce et al., 1980; Zhang et al., 1997; Sun et al., 2001; Gong et al., 2006; Zhao et al., 2006). Due to high atmospheric dust concentrations (Zhang et al., 2012) and dust aerosol optical depth (AOD) over East Asia (Che et al., 2015), the interactions between dust aerosols and climate changes are of fundamental importance for observational and numerical studies (e.g., Liu et al., 2004; Gong et al., 2006; Shao et al., 2011; Huang et al., 2014; Mahowald et al., 2014).
Dust aerosols can affect the solar and infrared radiation budgets at the top of atmosphere (TOA) and at the surface, which in turn influences the regional climate through the dust direct (DRF) and dust-in-snow radiative forcings. Previous studies have revealed an importance of dust DRF on global energy balance in general circulation models (GCMs) in recent decades (Tegen and Lacis, 1996; Miller and Tegen, 1998; Yue et al., 2009; Zhang et al., 2010; Mahowald et al., 2014). As summarized by Kok et al. (2017), it was shown that the global average dust DRF was almost −0.4 W m−2 in the current GCMs of Huneeus et al. (2011). Furthermore, they also claimed that the global average dust DRF was significantly underestimated as a result of less coarse dust aerosols in these current GCMs, which shows a much larger dust DRF of almost −0.2 W m−2 based on a new size distribution of dust aerosols derived from Kok (2011) (Kok et al., 2017). Due to larger dust loading (Zhang et al., 2012) and dust AOD over East Asia (Che et al., 2015), the average dust DRF over this region is much larger than that for the global mean (Zhang et al., 2009; Sun et al., 2012; Han et al., 2012; Xin et al., 2016), which could further influence the East Asian climate significantly (Lau et al., 2006; Sun et al., 2012, 2017; Gu et al., 2016; Tang et al., 2018). A mechanism of elevated heat pump (EHP) from absorbing aerosols affects the monsoon atmospheric circulation and the summer monsoon precipitation over South and East Asia in late spring and early summer (Lau et al., 2006). Based on sensitivity tests of the WRF-Chem model with a detailed dust emission scheme, Tang et al. (2018) also showed the existence of an EHP mechanism over the northwestern China, which directly causes regional anomalous circulations. Zhang et al. (2009) have shown that the total radiative forcings at the TOA and at the surface are significantly decreased by the dust DRF, resulting in a surface cooling over East Asia (up to −1 ∘C) and increasing the regional local atmospheric stability. The dust DRF changes the summer monsoon precipitation and atmospheric circulations over East Asia through altering atmospheric thermal structures (Sun et al., 2012, 2017; Tang et al., 2018). Furthermore, a comparison between north Africa and South/East Asia, shows that change in the monsoon precipitation induced by the dust DRF is absolutely distinct over these monsoon regions, relying on the relative location of dust aerosols to the precipitation band. Additionally, the surface albedo perturbation due to dust and black carbon in snow causes a strong and positive radiative forcing at the surface from 5 to 25 W m−2 in March–April–May (MAM) over the Tibetan Plateau (TP) region (Flanner et al., 2009; Qian et al., 2011, 2015; He et al., 2018; Xie et al., 2018b). These absorbing aerosols deposited on snow warm the TP's surface and alter the East and South Asian summer precipitation and monsoon atmospheric circulation (Qian et al., 2011; Shi et al., 2019) and the arid climate over northwestern China through enhancing the TP's elevated heat source (Xie et al., 2018b).
Changes in dust-cycle-related processes, including dust emission, dust transport, and dust deposition, are affected by meteorological and climatic parameters (Littmann, 1991; Qian et al., 2004; Liu et al., 2004; Gong et al., 2006; Zhao et al., 2006; Yumimoto and Takemura, 2015; Lou et al., 2016), as well as the dust radiative forcing including dust DRF (Miller et al., 2004; Heinold et al., 2007; Xie et al., 2018a; Cheng et al., 2019) and dust-in-snow radiative forcing (Xie et al., 2018b). According to the meteorological data, large quantities of the Asian dust storms are generated from high wind speeds associated with cyclonic activities and cold surges (Littmann, 1991; Sun et al., 2001; Liu et al., 2004). Littmann (1991) examined relationships of the Asian dust storm frequency with meteorological parameters and found positive correlations with wind speed and negative correlation with surface precipitation. Qian et al. (2004) have shown that, over northern China, the regional dust storms show a negative correlation with the prior winter temperature. Furthermore, the spring dust storm frequency is strongly negatively positive with the antecedent annual and seasonal soil moisture and surface precipitation, as shown in Liu et al. (2004). Interannual variability in the intensity of the East Asian winter monsoon could not directly affect the dust emissions but affected the dust transport in observations and models (Gong et al., 2006; Zhao et al., 2006; Yumimoto and Takemura, 2015; Lou et al., 2016). Additionally, the dust DRF reduces the dust emissions through interactions with the planetary boundary layer (PBL) over Saharan and East Asian dust sources at the current climate condition (Miller et al., 2004; Heinold et al., 2007; Xie et al., 2018a), whereby the net negative DRF at the surface decreases surface sensible heat fluxes into the atmosphere, weakens turbulent mixing within the PBL, and in turn reduces surface wind speeds. The dust-DRF-induced reduction in dust emissions is much more significant with the mechanism of the PBL during the Last Glacial Maximum period, in comparison with the current climate condition (Cheng et al., 2019).
As we know, the TP region is the largest and highest plateau in the world, with an average elevation of around 4.5 km, and is often called the “third pole” of the Earth in view of its importance in shaping the Earth's climate (Yao et al., 2012). In MAM, the air column over the TP shows a significant change from a heat sink to a heat source mainly due to the rapidly enhanced surface sensible heating over the TP (labeled as TPSH). The TPSH in MAM reaches its annual maximum flux, which could dominate the sum of latent and sensible heat fluxes, as well as longwave and shortwave radiative forcings over the TP (Duan et al., 2017). Therefore, the TPSH can basically determine the overall thermal forcing over the TP in MAM. Previous observational and modeling studies haven shown that the MAM TPSH can affect the South and East Asian hydrological cycle (Wu and Zhang, 1998; Duan et al., 2011; Wu et al., 2012; An et al., 2015) and the regional large-scale circulation in middle and upper layers (Ye and Wu, 1998; Liu and Dong, 2013; An et al., 2015; Duan et al., 2017) through altering the atmospheric heat source of the TP. It is likely that the changes in the large-scale circulation induced by the MAM TPSH then influence the East Asian dust cycle by altering dust emissions and dust transport. More recently, based on sensitivity of GCM simulations, Xie et al. (2018b) revealed that the dust-in-snow radiative forcing over the TP significantly increases the eastern Asian dust emissions and the regional dust cycle through enhancing the TPSH, indicating a positive feedback loop. However, the detailed relationships between TPSH and the East Asian dust cycle remain elusive, especially for interannual variability. Therefore, we should check the relationship between springtime TPSH and the Asian dust cycle to further confirm this mechanism, based on the interannual variability of observations and models.
Here, we aim this study to explore the relationships between the MAM TPSH and the regional dust processes, by combining CAM4-BAM (version 4 of the Community Atmosphere Model coupled to a bulk aerosol model) simulations, reanalysis, and measurements. The remainder of this paper is organized as follows: Sect. 2 first describes observational and reanalysis datasets, the updated CAM4-BAM, and the experimental design. The modeling and observational results are discussed in Sect. 3. Potential mechanisms of effects of the MAM TPSH on the East Asian dust cycle are shown in Sect. 4. Further discussion remarks and concluding remarks are shown in Sects. 5 and 6, respectively.
2.1 Observational datasets
The data employed in this study are obtained from the regular surface meteorological observations from 73 meteorological stations of the China Meteorological Administration over the TP (Wang et al., 2014; Duan et al., 2017). It includes historical 4 times daily observations of ground surface temperature (Ts), surface air temperature (Ta), and wind speeds at 10 m above the surface (V10 m) from 1980 to 2008, mainly over the central and eastern TP. The surface sensible heat (SH) flux is obtained from the above three meteorological parameters by the bulk aerodynamic method (Duan et al., 2011, 2017), which is expressed as follows:
where Cp is the specific heat of dry air at constant pressure (), ρ is air density, and the parameter CDH is the drag coefficient for heat. The observed TPSH index used here is directly derived from Fig. 1b (Duan et al., 2017), defined as the time series of the standard anomalies of the MAM mean sensible heat flux averaged from these 73 meteorological stations during 1980–2008 with the linear trend excluded.
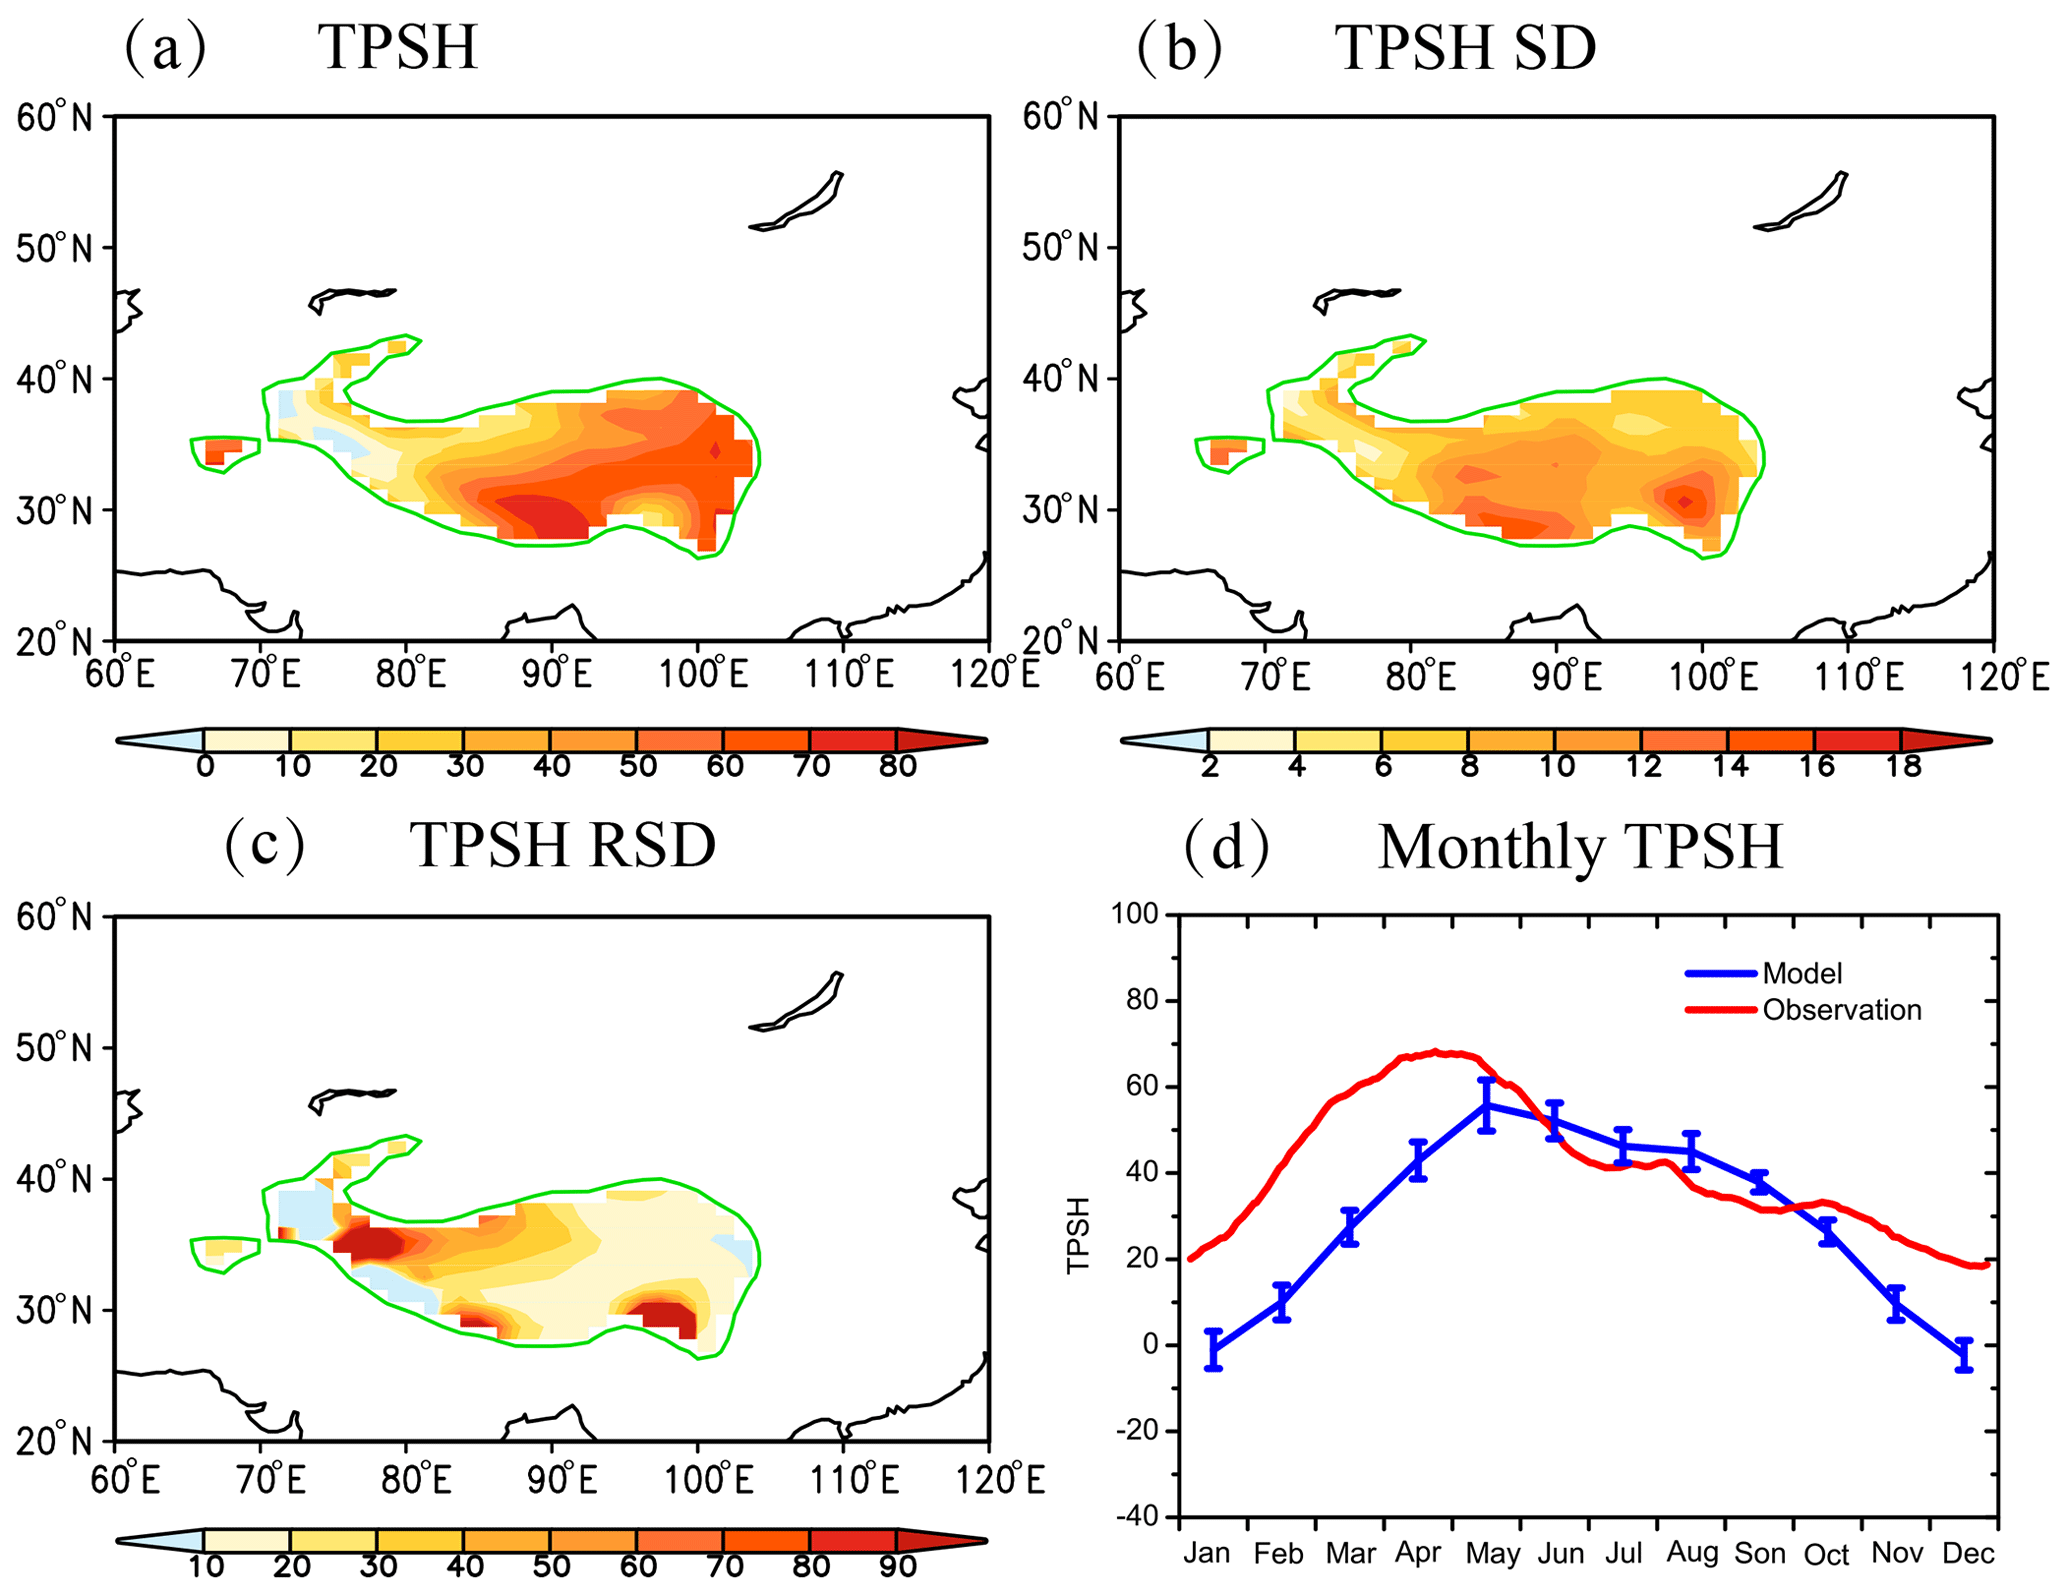
Figure 1Spatial distribution of (a) the MAM mean sensible heat over the TP (TPSH, W m−2), (b) the standard deviation of TPSH (SD, W m−2), and (c) the relative SD of TPSH (RSD, %) in MAM calculated for 30 model years. (d) Annual cycle of TPSH from the model averaged over the TP region above 2500 m and the observations averaged over the 73 stations over the TP (Duan et al., 2017). Note that the error bars (d) represent the SD of the simulated TPSH for 30 model years. The green-contour area indicates the plateau above 2500 m.
2.2 Reanalysis data
Note that the Modern-Era Retrospective analysis for Research and Applications version 2 (MERRA-2) is the first long-term global reanalysis for the satellite era after the year 1980, which is based on the Goddard Earth Observing System version 5 (GEOS-5) model, described by Randles et al. (2016). MERRA-2 makes some improvements in online aerosol fields interacting with the model radiative fields (Randles et al., 2016; Gelaro et al., 2017), compared to its predecessor MERRA-1 (Rienecker et al., 2011). It is shown that MERRA-2 aerosol vertical structure and surface particulate matter compare well with available satellite, aircraft, and ground-based observations including dust aerosols (Buchard et al., 2016, 2018; Randles et al., 2018; Song et al., 2018). Here, we used MERRA-2 surface dust concentration of the years from 1980 to 2008 to examine the relationship with the observed TPSH index.
2.3 Model and numerical experiments
CAM4 was released as an atmospheric component of the Community Climate System Model version 4 coupled with a bulk aerosol model parameterization (BAM), which is labeled as CAM4-BAM (Neale et al., 2010). The model adopted externally mixed parameterizations and fixed size distribution of aerosols including sulfate, dust, organic carbon (OC), black carbon (BC), and sea salt, detailedly described by Tie et al. (2005). The parameterized scheme of dust physical processes including emission, transport, and dry and wet deposition in CAM4-BAM is derived from the Dust Entrainment And Deposition model (DEAD) from CAM3 with four dust size bins (Mahowald et al., 2006, 2014). CAM4-BAM has been updated mainly form three aspects including a improved size distribution for dust emissions, updated dust optical properties of shortwave radiative forcing, and optimized soil erodibility maps to perform better in the simulation of global-scale dust aerosols and its radiative properties (Albani et al., 2014). The snow-darkening processes induced by mineral dust and black carbon were parameterized by the Snow, Ice, and Aerosol Radiative component (SNICAR) in CAM4-BAM, described by Flanner et al. (2007, 2009). Recently, the updated CAM4-BAM has been utilized to successfully study the dust cycle and its radiative feedbacks on the East Asian climate including dust direct effect and dust-in-snow effect (Xie et al., 2018a, 2018b; Shi et al., 2019).
The updated CAM4-BAM utilizes the finite-volume dynamical core (fvcore) with 0.9∘ × 1.25∘ in the horizontal resolution and 26 levels in the vertical resolution in this work. The numerical experiment was conducted with fixed present-day climatological mean sea-ice concentrations, and sea surface temperature (SST), as well as fixed present-day greenhouse gases during the whole simulated period. The present-day sea-ice concentration and SST were merged from the Hadley Centre Sea Ice and SST dataset and the optimum interpolation SST dataset (Rayner et al., 2003; Hurrell et al., 2008). A numerical experiment was integrated over 37 years with 7 years for spin-up, including the aerosol direct effect and snow-darkening effect of absorbing aerosols. Note that the simulated year does not represent the real-time year; hence, we can only check the relationship between TPSH and dust concentration and do not compare the simulated results with year-by-year observations. It is noted that anthropogenic aerosols affect the monsoon atmospheric circulation and the summer surface precipitation over East Asia by aerosol direct and indirect effects (Liu et al., 2011; Wang et al., 2015; Xie et al., 2016), which may affect the regional emissions over East Asia. In order to reduce the anthropogenic aerosols' influence, the anthropogenic aerosol and precursor gas emissions were fixed at the pre-industrial (PI) day in the model simulation (Lamarque et al., 2010), using emissions of the year 1850. The simulated results from the last 30 years are used to investigate the modulation of the MAM TPSH on the interannual variability of East Asian dust cycle, also compared with the observed results.
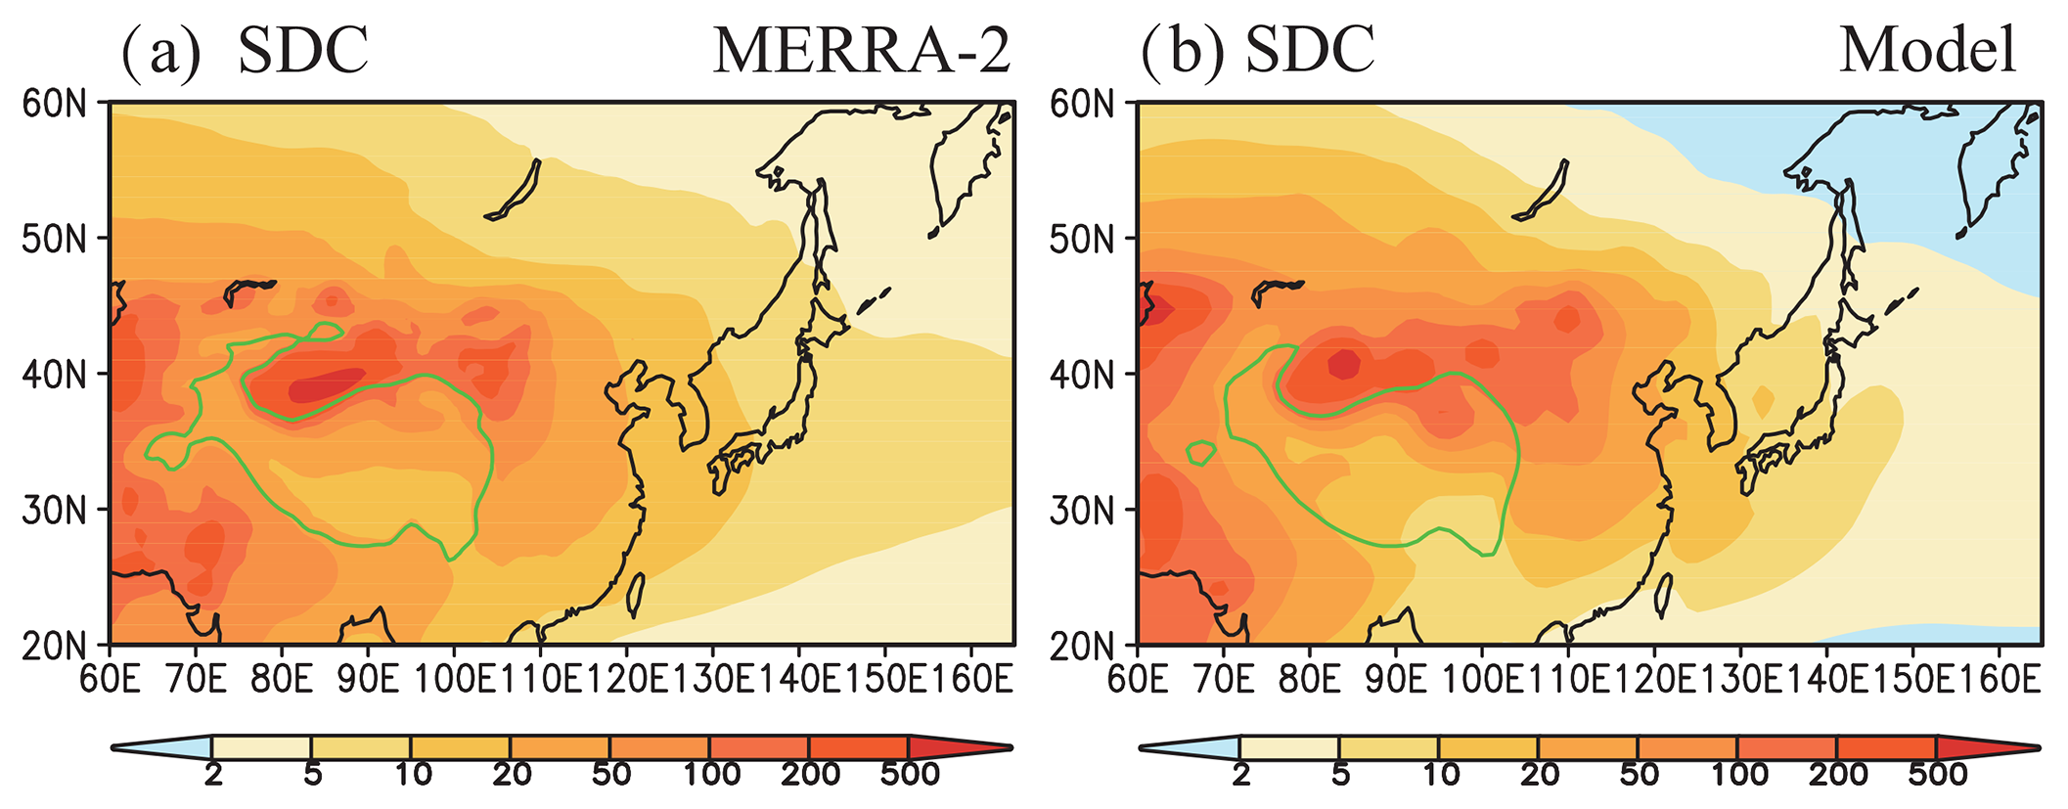
Figure 2(a) Spatial distribution of the MAM mean surface dust concentration (SDC, µg m−3) for the 30 model years and (b) for the years 1980–2008 derived from MERRA-2. The green-contour area indicates the plateau above 2500 m.
3.1 Model evaluation against measurements
To evaluate the performance of CAM4-BAM, the simulated TPSH and dust concentration are compared with observed results of the 73 meteorological stations and the MERRA-2 reanalysis data, especially in MAM. Figure 1 presents the spatial distribution of the climatological mean TPSH (a), standard deviation of TPSH (b), and the relative SD of TPSH in MAM (c) calculated for 30 model years. It is noted that the simulated TPSH index is defined as the time series of the standard anomalies of the MAM surface sensible heat flux averaged over the TP region with height above 2500 for the 30 model years. Figure 1a shows the simulated TPSH has high values over the central and eastern TP, ranging from 20 up to 70 W m−2, and low values over the western TP. The spatial patterns of the MAM TPSH are basically consistent with the ground measurements, reanalysis, and satellite data (Shi and Liang, 2014). There is persistent snow cover over the western TP and several mountains (Pu et al., 2007; Xie et al., 2018b), which increases surface albedo and modulates the radiative energy balance, and then leads to lower sensible heat fluxes (Xie et al., 2005; Wang et al., 2014). The standard deviation (SD) in Fig. 1b and relative SD (RSD) of the MAM TPSH are presented in Fig. 1c, respectively. The spatial pattern of SD is similar to its climatological mean pattern, with higher values of SD associated with larger TPSH over the central and eastern TP. The largest values of SD exceed 14 W m−2 (Fig. 1b) over these regions, which leads to the largest values of RSD exceeding 90 % (Fig. 1c). The result indicates a significant interannual variation of the MAM TPSH, which mainly accounts for that of surface wind speed, ground–air temperature, and snow cover/depth in winter–spring (Duan et al., 2011; Shi and Liang, 2014; Wang et al., 2014).
Figure 1d shows the annual cycle of the simulated mean TPSH over the TP region with height above 2500 and the observed averaged TPSH over the 73 stations of the central and eastern TP (Duan et al., 2017). The observational result shows significant seasonal variations of the TPSH, reaching the highest value in spring and the lowest value in winter. This phenomenon of seasonal TPSH variation manifests itself in CAM4-BAM simulations, suggesting that CAM4-BAM can capture the observed TPSH seasonal cycle reasonably well. However, there exists a large discrepancy between the simulated and observational TPSH values, probably due to the lack of measurement sites over the western TP and the model's coarse horizonal resolution.
Here, we also compare the spatial distribution of the simulated surface dust concentration with that of the MERRA-2 data in MAM in Fig. 2. It is shown that the centers of high surface dust concentrations are located mainly in the Taklamakan and Gobi deserts in MERRA-2, where the dust concentrations are larger than 200 µg m−3. High surface dust concentrations over western China and northern China are absolutely consistent with the numerical and observational results (e.g., Sun et al., 2001, 2012; Liu et al., 2004; Gong et al., 2006; Zhao et al., 2006; Zhang et al., 2012; Lou et al., 2016). Large amounts of mineral dust emitted from these two dust source regions are transported to downstream land and ocean regions through the westerly winds, e.g., eastern China and northwestern Pacific. This is confirmed by the significant reduction of dust concentration from western China to the northwestern Pacific (Fig. 2a). The simulated result exhibits similar spatial patterns of surface dust concentration compared to MERRA-2, showing that surface dust concentration is significantly reduced from the dust source regions (∼ 102 µg m−3) to the northwestern Pacific (∼ 100 µg m−3) in Fig. 2b. Overall, the comparison shows that the model can successfully derive the spatial distributions of the MAM surface dust concentration compared with MERRA-2. For the dust AOD, CAM4-BAM has been evaluated against ground-based measurements based on a global scale (Albani et al., 2014) and the eastern Asian region (Xie et al., 2018a), showing strong and positive correlations with observational sites on seasonal and annual means.
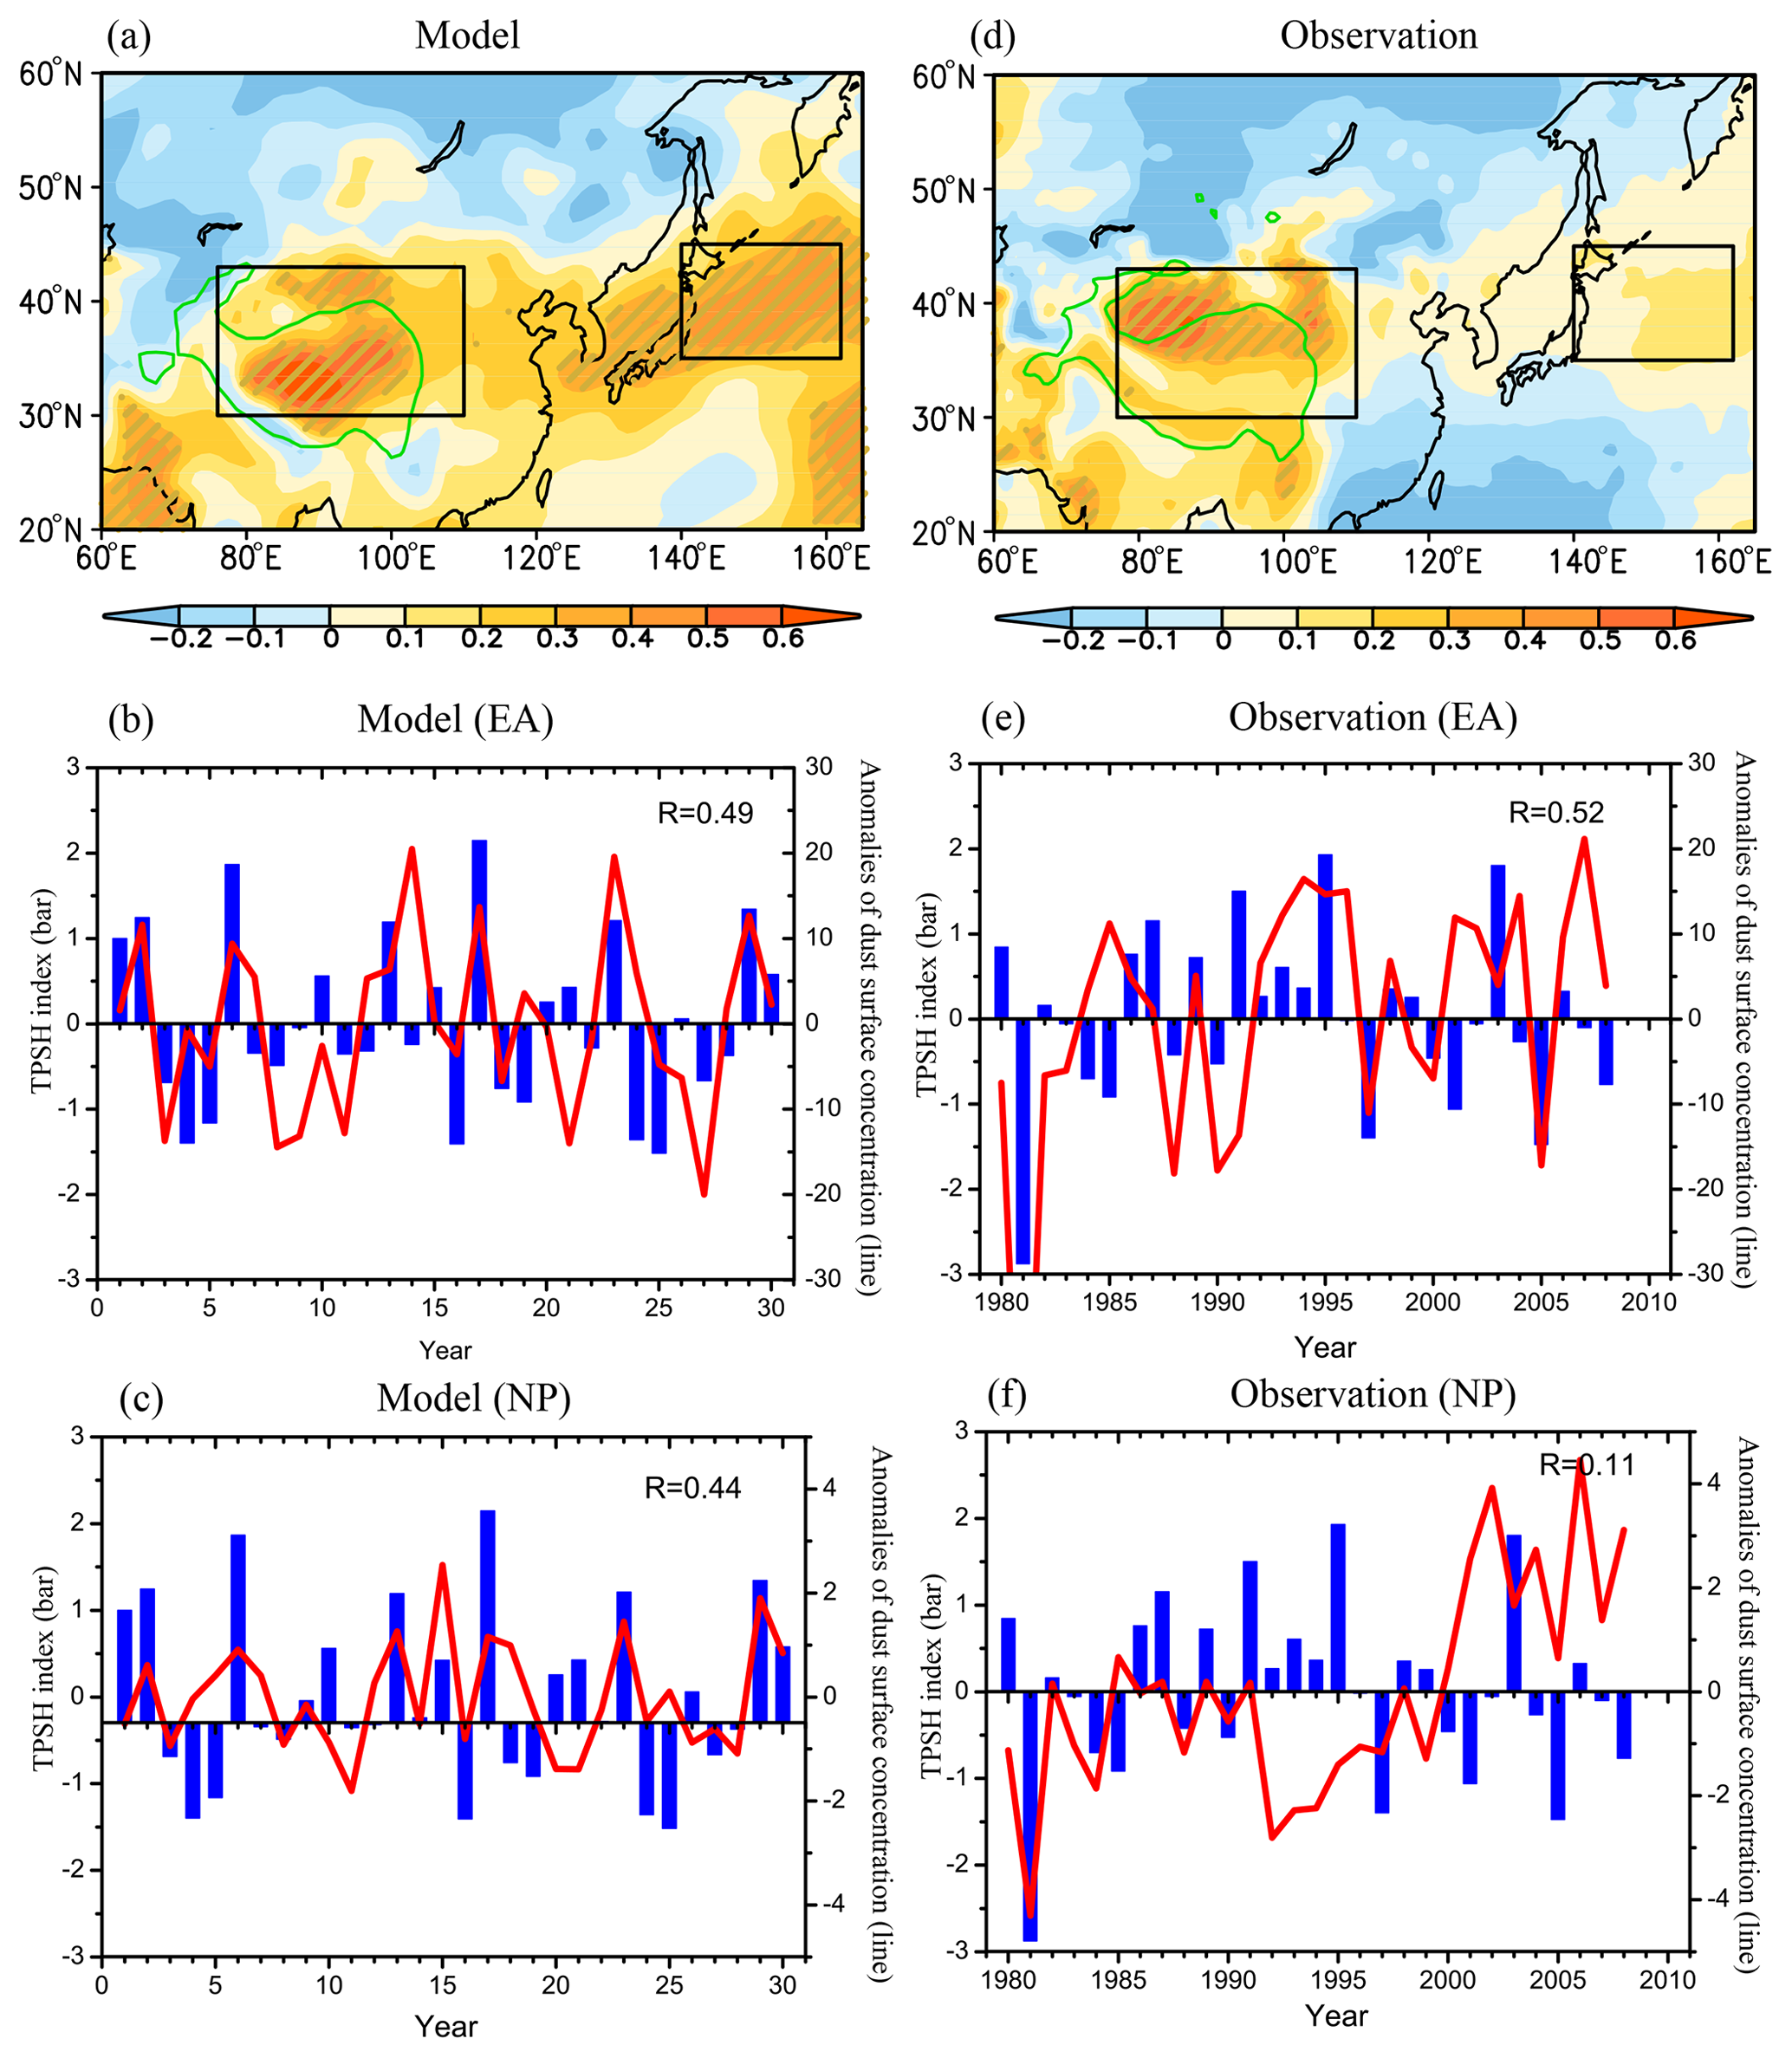
Figure 3(a) Spatial distribution of the correlation coefficients between the index of sensible heat over the TP (TPSH index) and the anomalies of surface dust concentration in MAM for the 30-year CAM4-BAM simulation. (b) The observed TPSH index (Duan et al., 2017) and the anomalies of MERRA-2 surface dust concentration for the years 1980–2008, and the corresponding time series of regionally averaged surface dust concentration (red line) over the East Asian dust source area (b for the model and e for observations) and over northwestern Pacific (c for model and f for observations) and the TPSH index (blue bars). Here, the slanted grey lines (a, d) represent the grid points where the changes pass the two-tailed t test at the 5 % significance level, and the green-contour area indicates the plateau above 2500 m.
3.2 Relationships between TPSH and surface dust concentration
In order to study the interannual variability of the MAM TPSH and its impacts on the dust aerosols over East Asia and over the downstream Pacific regions, Fig. 3 shows the correlation coefficients between the MAM TPSH and surface dust concentration for the CAM4-BAM simulation and observations. As shown in Fig. 3a, the anomalies of simulated surface dust concentration correlate positively with the simulated TPSH index over East Asia and the corresponding downwind regions. The correlation coefficients are larger over the East Asian dust source region (EA; 30–43∘ N, 76–110∘ E) and over the northwestern Pacific (NP; 35–45∘ N, 140–162∘ E), statistically significant with 95 % confidence. The regionally averaged correlation coefficients in EA and NP are 0.49 and 0.44, respectively (Fig. 3b and c). A similar spatial pattern of correlation coefficients is shown between the observed TPSH index (Duan et al., 2017) and the anomalies of MERRA-2 surface dust concentration in Fig. 3d. Furthermore, Fig. 3e and f show the positive correlation coefficients of 0.52 over EA and 0.11 over NP, respectively. In general, both the model and the observations display significant positive correlations between the TPSH index and surface dust concentration, showing that the variation of MAM TPSH plays a significant role in spatial distribution of the surface dust concentration over EA and NP.
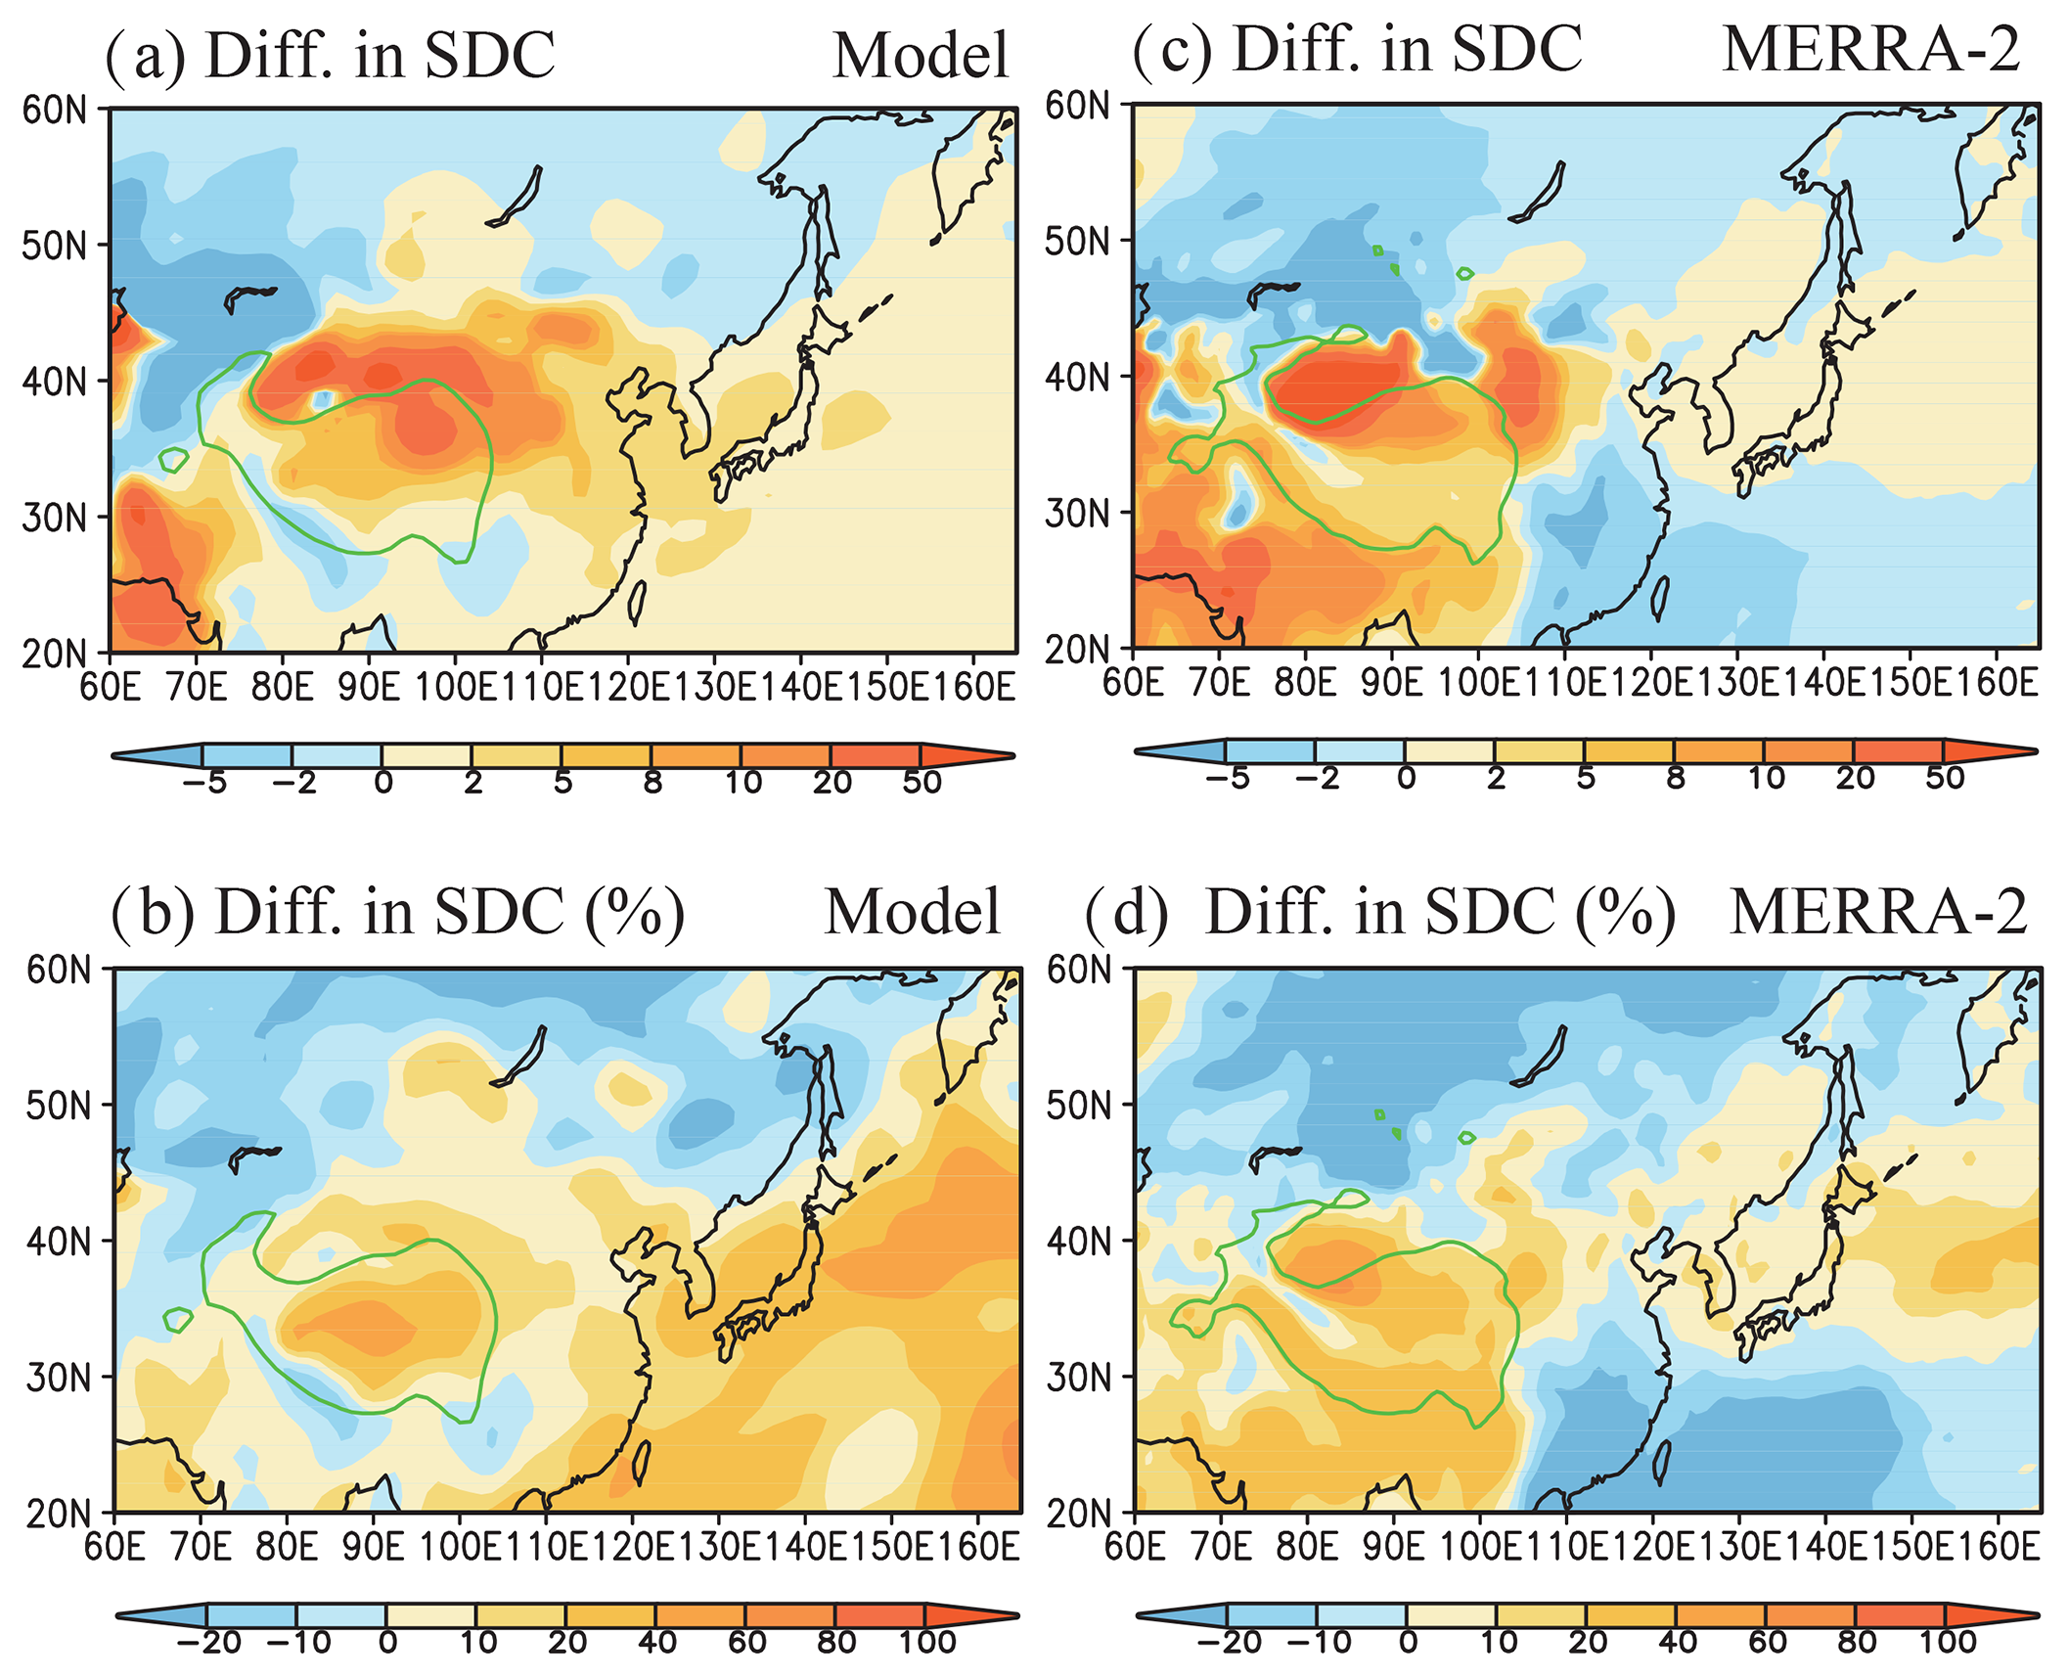
Figure 4(a, c) Composite absolute difference of the MAM mean surface dust concentration (SDC, µg m−3) and (b, d) the corresponding composite relative differences between the strongest and weakest TPSH years (strongest–weakest) for the model and MERRA-2, respectively. The green-contour area indicates the plateau above 2500 m.
Table 1The MAM-averaged surface dust concentration (µg m−3) over the East Asian dust source area (EA; 30–43∘ N, 76–110∘ E) and over the northwestern Pacific (NP; 35–45∘ N, 140–162∘ E) from the model and MERRA-2 reanalysis in the mean, strongest, and weakest years, as well as the absolute difference (strongest–weakest) and the relative difference ((strongest–weakest)∕weakest ⋅ 100 %).
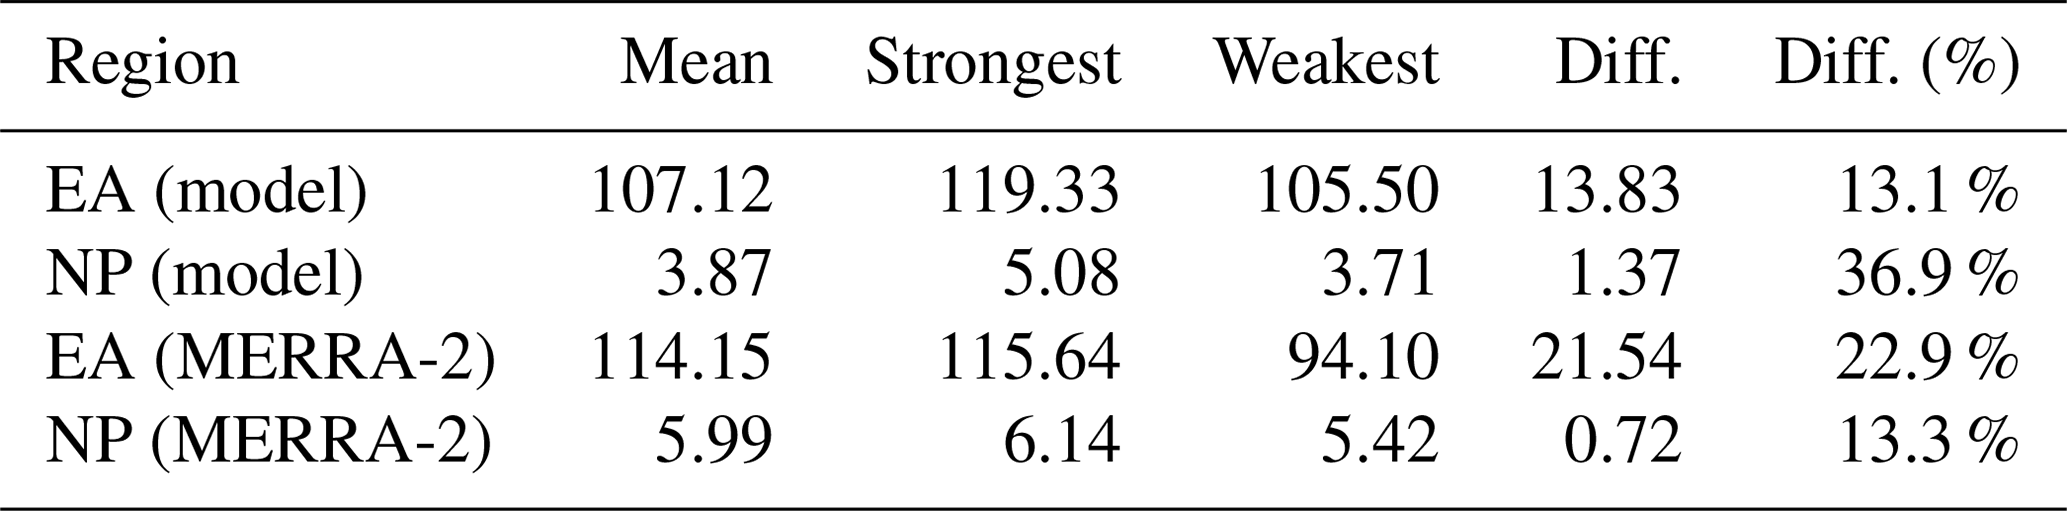
To further quantify the impacts of the MAM TPSH on dust concentration over EA and NP, Fig. 4 shows the composite absolute and relative differences of surface dust concentrations between the strongest and weakest TPSH years for the model and MERRA-2, respectively. The strongest (weakest) years of the TPSH are defined as the indices larger (smaller) than 1 SD. The six strongest and five weakest TPSH years in the model (Fig. 3b) and four strongest and four weakest TPSH years in the measurements (Fig. 3e) are identified. The simulated results show that the surface dust concentrations during the strongest TPSH years are higher over East Asia and the downwind regions in Fig. 4a, with a maximum exceeding 50 µg m−3 over the Taklamakan and Gobi deserts, compared with the weakest TPSH years. The larger percentage changes over the EA and NP study regions during the strongest TPSH years are shown in Fig. 4b. Furthermore, the averaged surface dust concentrations during the strongest TPSH years in Table 1 are increased with 13.83 µg m−3 (13.1 %) over EA and 1.37 µg m−3 (36.9 %) over NP, respectively. MERRA-2 also presents the similar spatial distributions of the increase in surface dust concentration during the strongest TPSH years over East Asia and the downwind regions in Fig. 4c and d, with an increase of 21.54 µg m−3 (22.9 %) over EA and 0.72 µg m−3 (13.3 %) over NP from Table 1. Therefore, compared to the weakest TPSH years, the MAM surface dust concentrations in the strongest TPSH years are much higher over EA and NP in both the model and MERRA-2 data (Fig. 4).
Additionally, Fig. 5 shows the simulated vertical profiles of the MAM dust concentration for the mean, strongest, and weakest TPSH years over EA and NP. It shows that mean vertical dust concentrations over EA are much larger than that over NP similarly to the surface dust concentration (Fig. 2). The vertical dust concentrations in the strongest TPSH years are also higher than those in the weakest TPSH years over EA (Fig. 5a) and NP (Fig. 5b), respectively.

Figure 5Simulated vertical profile of the MAM dust concentration (µg kg−1) from the model for the mean, strongest, and weakest years (a) over the East Asian dust source area and (b) over the northwestern Pacific.
3.3 Differences in dust cycle between strongest and weakest TPSH years
In this subsection, we compare differences in the dust cycle including dust loading, emissions, transport, dry and wet deposition between the strongest and weakest TPSH years in Fig. 6, also shown in Table 2 for the corresponding averaged values over EA and NP. Figure 6a presents spatial distributions of the MAM mean dust loading from the model with higher dust loading over EA and lower loading over NP, which is very similar to that of the dust surface concentration from the model and the MERRA-2 data in Fig. 2. Figure 6b and c show absolute and relative differences in dust loading between the strongest and weakest TPSH years over EA and NP. They show that, compared to the weakest TPSH years, the dust loading can be significantly increased in the strongest TPSH years, with an increase of 33.72 mg m−2 (16.9 %) over EA and 11.72 mg m−2 (28.5 %) over NP as shown in Table 2.
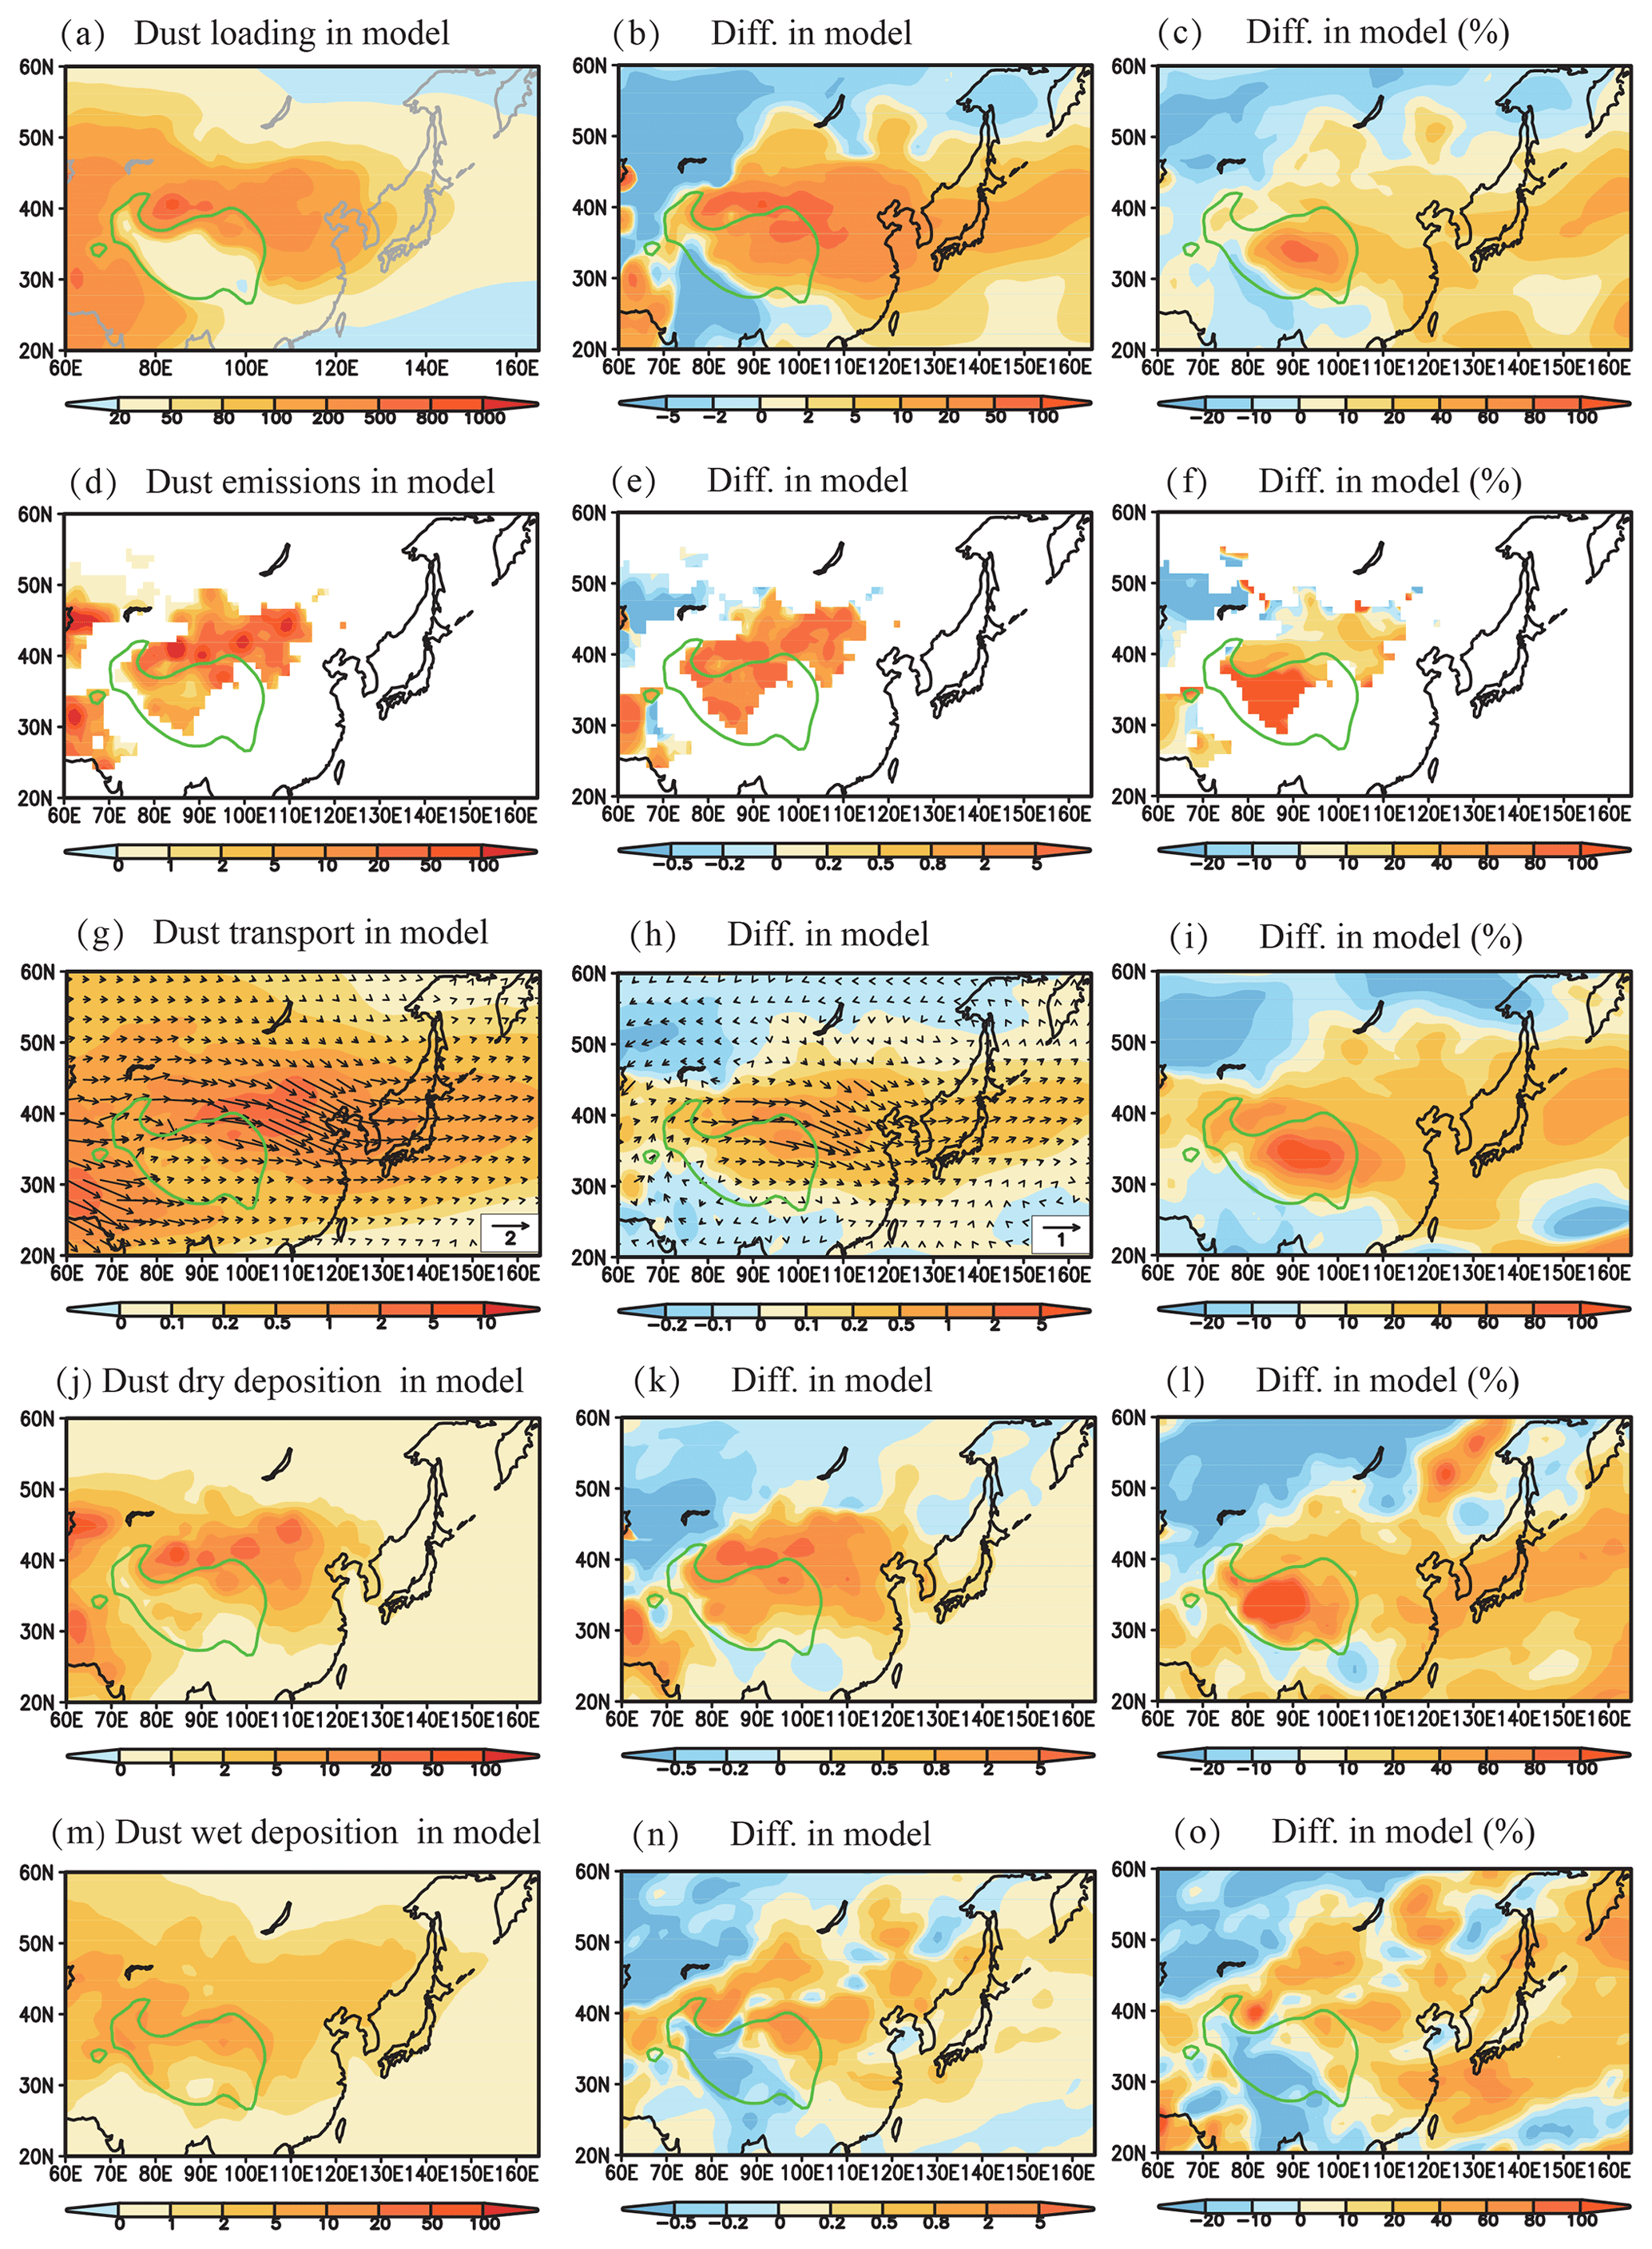
Figure 6Spatial distribution of the MAM mean values for 30 model years (left column), absolute differences between the strongest and weakest TPSH years (strongest–weakest) (middle column), and the corresponding relative differences (right column) in (a, b, c) dust loading (mg m−2), (d, e, f) dust emissions (g m−2 per season), (g, h, i) dust transport (), (j, k, l) dust dry deposition (g m−2 per season), and (m, n, o) dust wet deposition (g m−2 per season). The green-contour area indicates the plateau above 2500 m.
Table 2The MAM dust cycle including dust loading (mg m−2), dust emission (g m−2 per season), dust transport (), dust dry deposition (g m−2 per season), and dust wet deposition (g m−2 per season) over the East Asian dust source region (EA; 30–43∘ N, 76–110∘ E) and over the northwestern Pacific (NP; 35–45∘ N, 140–162∘ E) from the model in the mean, strongest, and weakest years, as well as the absolute difference (strongest–weakest) and the relative difference ((strongest–weakest)∕weakest ⋅ 100 %).
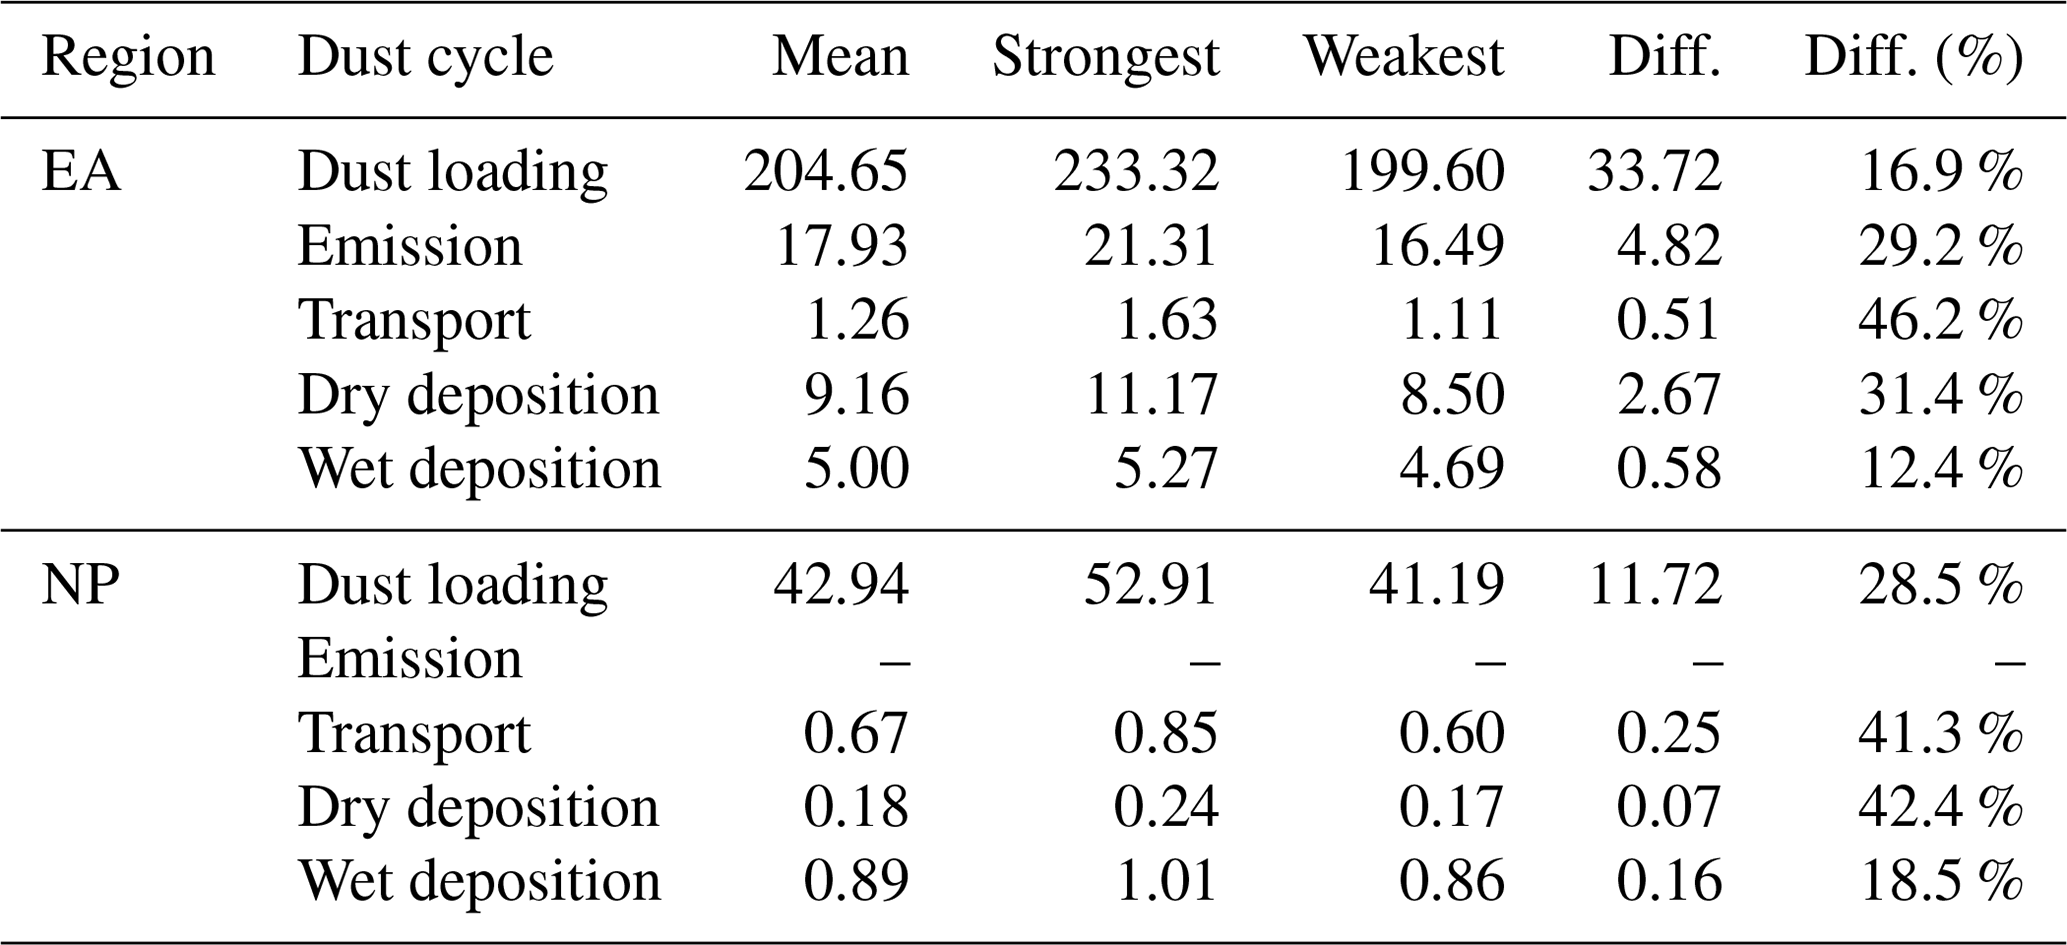
Figure 6d presents the spatial distributions of the MAM mean dust emissions over East Asia, exhibiting a maximum dust emission up to 100 g m−2 per season over the Taklamakan Desert and Gobi Desert. It shows that dust emissions are markedly increased over the dust source region in the strongest TPSH years, compared to the weakest TPSH years in Fig. 6e and f. For the averaged value over EA, the MAM dust emissions in the strongest TPSH years are increased by 4.82 g m−2 per season with the percentage of 29.2 % in Table 2. The enhanced dust emissions over EA in the strongest TPSH years are mainly due to the increased surface wind speeds over this region (discussed in Sect. 4). Figure 6g presents the spatial distribution of the MAM mean vertically integrated horizontal dust fluxes (defined as dust transport), showing that the emitted dust from EA is transported to the downwind NP region through the westerly winds. The absolute and relative differences in dust transport between the strongest and weakest TPSH years show that the dust transport is enhanced by the increased TPSH over EA and NP in Fig. 6h and i. The averaged increases of dust transport in the strongest TPSH years are 0.51 with 46.2 % over EA and 0.25 with 41.3 % over NP, respectively. The enhanced dust transport results mainly from the increased dust emissions over the dust source and the increased westerly winds induced by the higher TPSH. Compared to the weakest TPSH years, dust dry and wet deposition in the strongest TPSH years are also increased over EA and NP in Fig. 6k, l, n, and o, also as shown in Table 2. Hence, the dust-cycle-related processes (e.g., dust loading, dust emissions, dust transport, and dust dry and wet deposition) are all enhanced by the increased TPSH.
The TPSH in MAM directly affects the large-scale circulation through altering atmospheric heat source of the TP (Ye and Wu, 1998; Liu and Dong, 2013; An et al., 2015; Duan et al., 2017) and further influences the regional dust cycle over East Asia. In this section, we compare the differences in the regional climate between the strongest and weakest TPSH years to interpret the changes in the dust cycle by the increased TPSH as mentioned in Sect. 3.

Figure 7Spatial distribution of the MAM composite difference between the strongest and weakest TPSH years (strongest–weakest) for the model in (a) the surface air temperature (∘C), (b) the surface sensible heat (W m−2), (c) the surface latent heat (W m−2), and (d) the surface radiative forcing (W m−2). The green-contour area indicates the plateau above 2500 m.
To illustrate the effect of TPSH on the regional climate, we first show the changes in the surface air temperature and the corresponding energy balance at the surface in MAM. Figure 7 presents the spatial distribution of the MAM composite differences between the strongest and weakest TPSH years for the model in surface temperature, surface sensible and latent fluxes, as well as surface radiation forcing. Figure 7a shows that the surface air temperature in the strongest TPSH years is markedly increased over the TP, whereas the surface air temperature is reduced over the northern regions of the TP. We also show differences in surface energy balance including surface sensible and latent fluxes, and surface radiation forcing in Fig. 7b–d. It indicates a significant enhancement in the surface sensible flux over the TP in Fig. 7b. The surface latent flux over the TP is slightly negative in Fig. 7c, whereas the surface radiative forcing over the TP is positive but much smaller than the surface sensible flux. Hence, it shows that the increased surface temperature over the TP resulted mainly from the surface sensible heat flux. Additionally, the reduced surface air temperature over the northern regions of the TP is more likely due to the horizontal temperature advection, which is similar to the atmospheric temperature at 500 hPa in following paragraph.
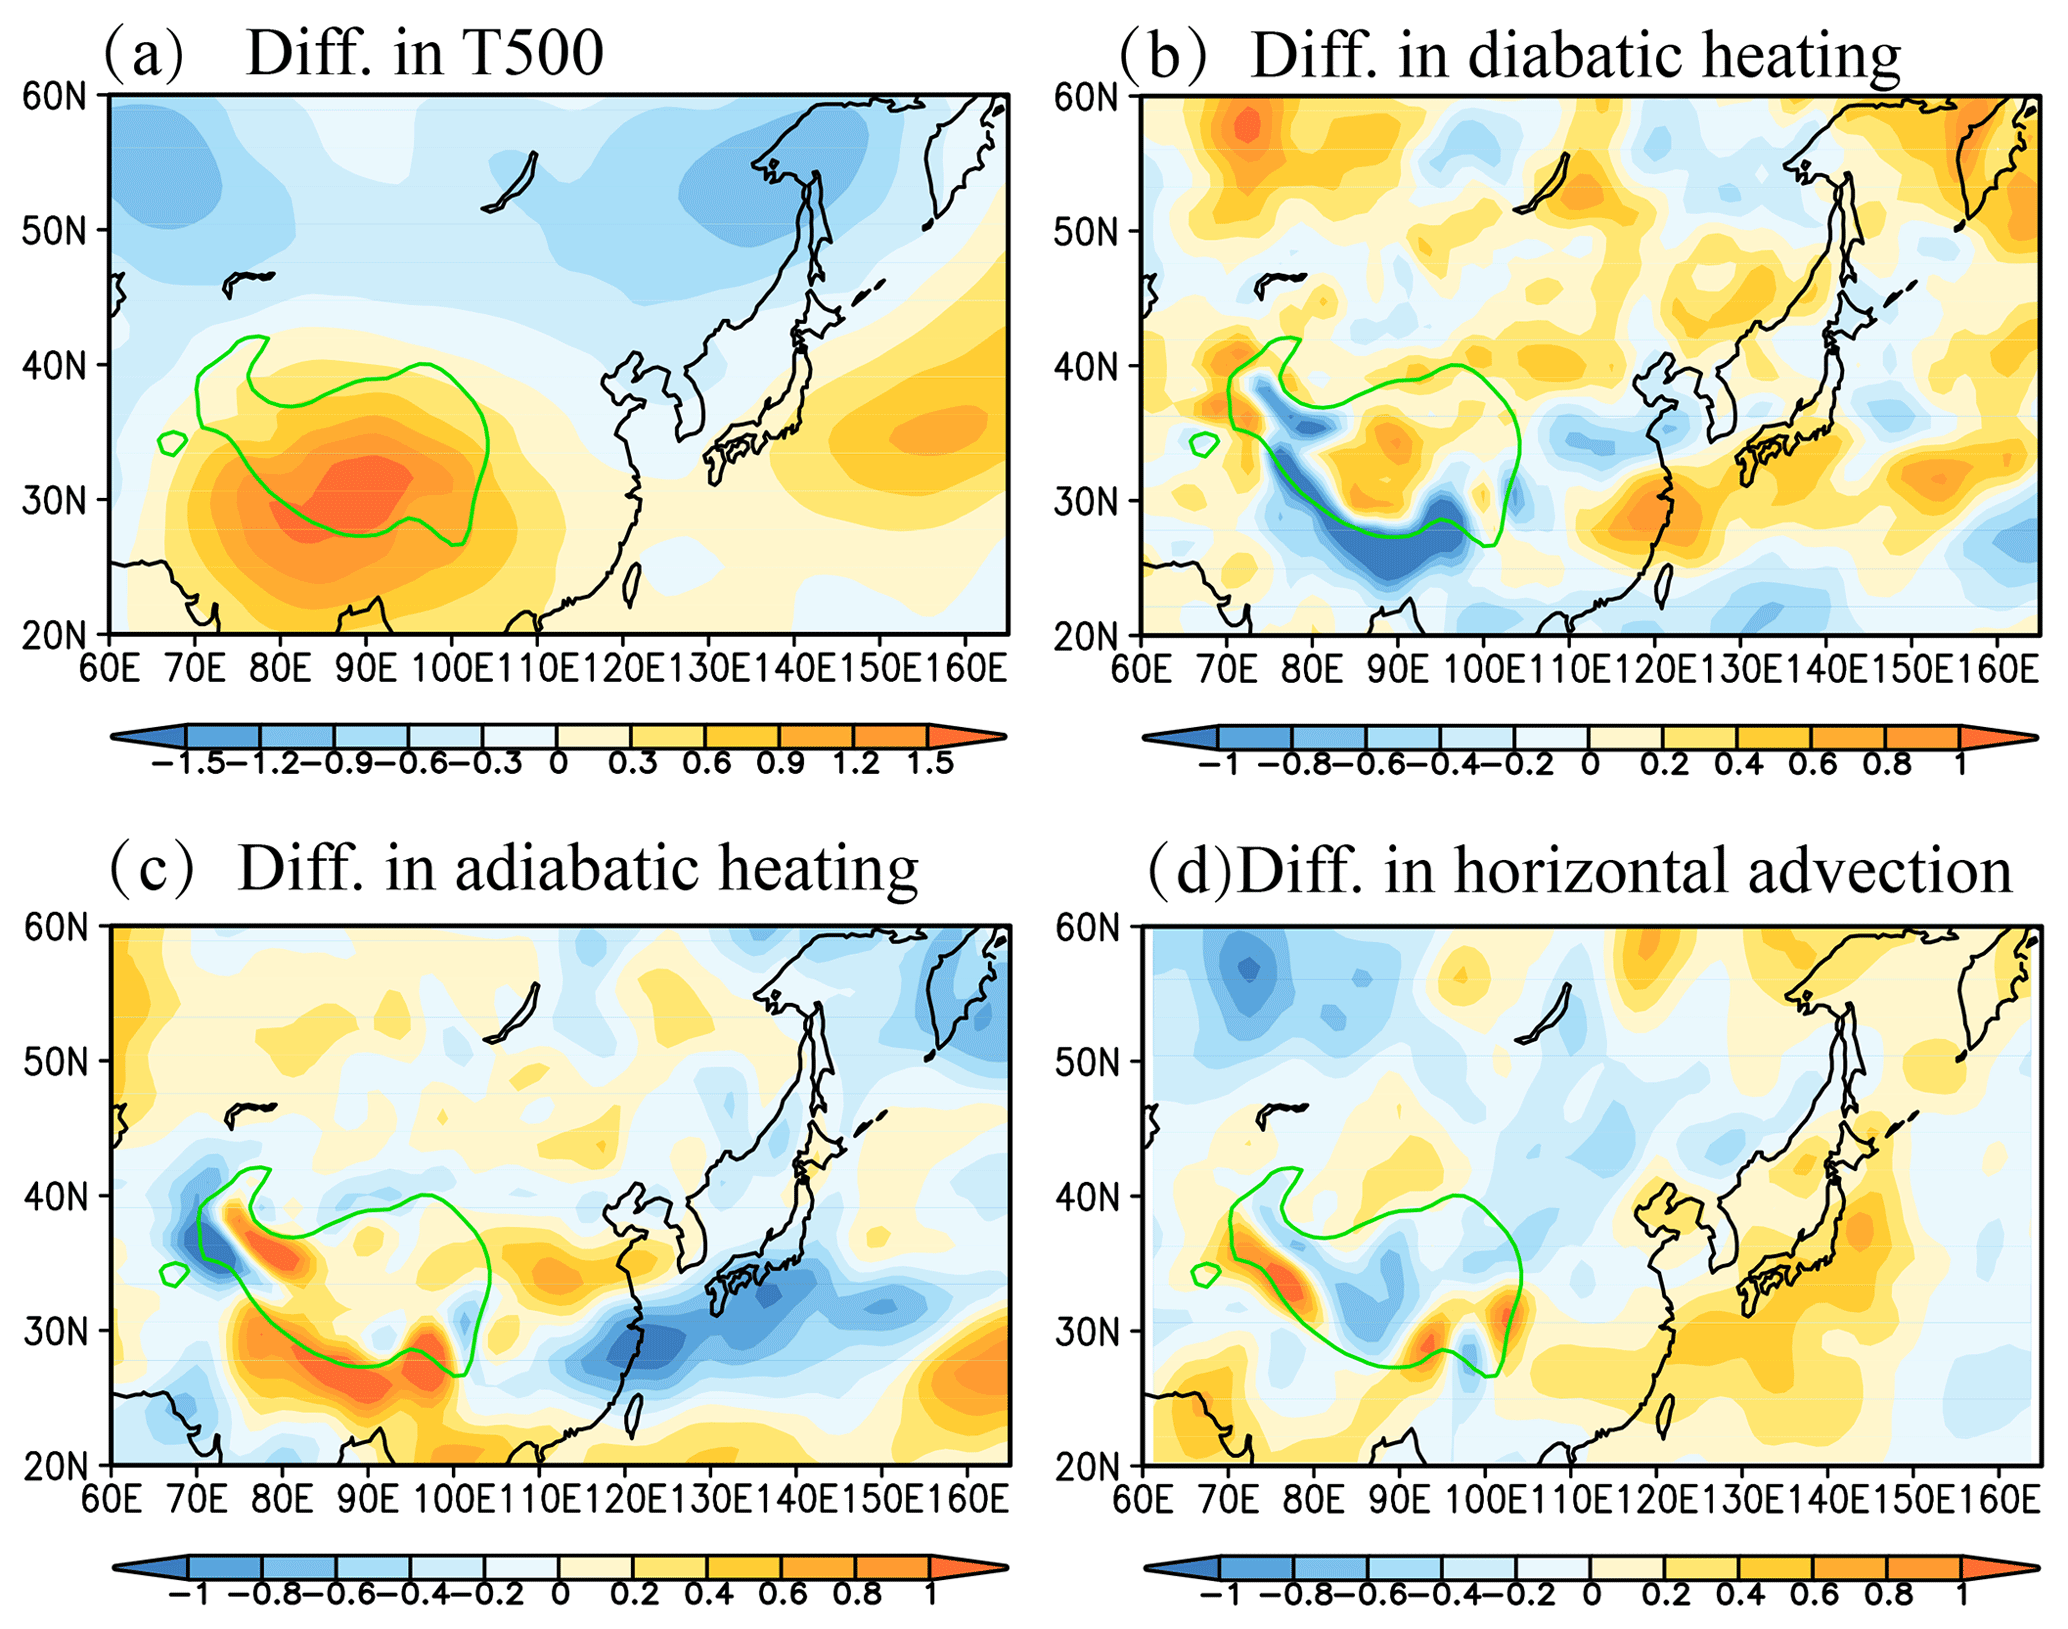
Figure 8Spatial distribution of the MAM composite difference between the strongest and weakest TPSH years (strongest–weakest) for the model in (a) the atmospheric temperature at 500 hPa (∘C), (b) the diabatic heating at 500 hPa (K d−1), (c) the adiabatic heating at 500 hPa (K d−1), and (d) the horizontal temperature advection at 500 hPa (K d−1). The green-contour area indicates the plateau above 2500 m.

Figure 9Spatial distribution of the MAM composite difference between the strongest and weakest TPSH years (strongest–weakest) for the model in geopotential height (GPH, gpm) and wind vectors (m s−1) at the (a) 500 hPa level and (b) 200 hPa level. The green-contour area indicates the plateau above 2500 m.
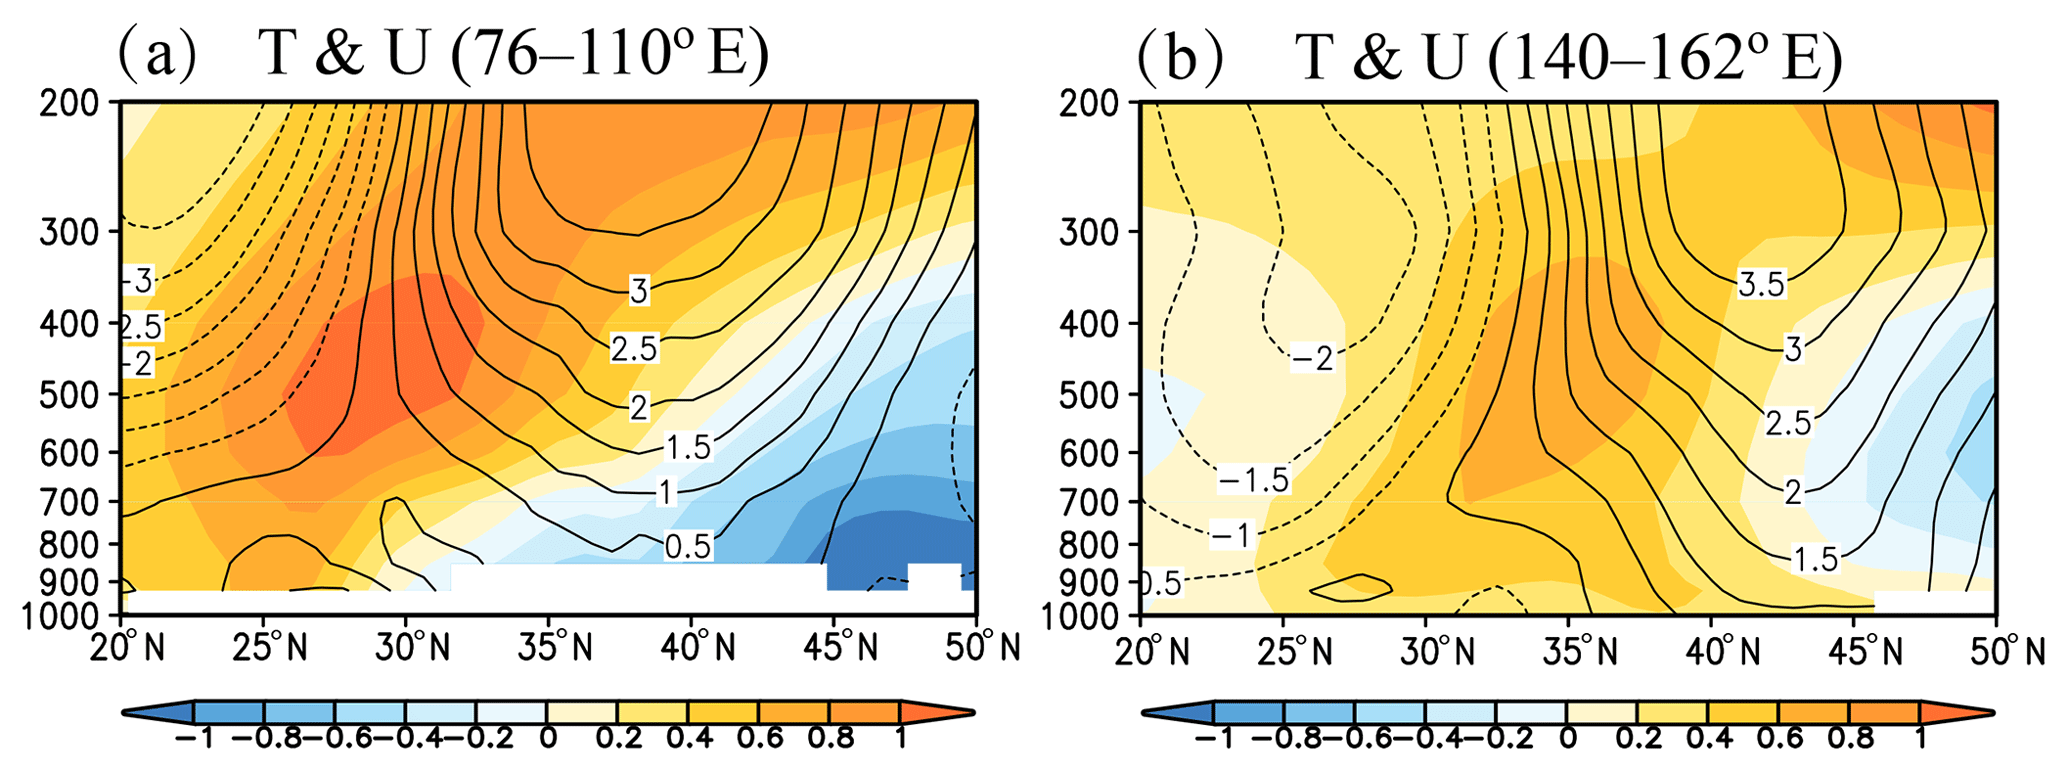
Figure 10Height–latitude cross-section of the MAM composite difference between the strongest and weakest TPSH years (strongest–weakest) for the model in atmospheric temperature (shaded, ∘C) and zonal winds (contoured, m s−1) along (a) 76–110∘ E and (b) 140–162∘ E.
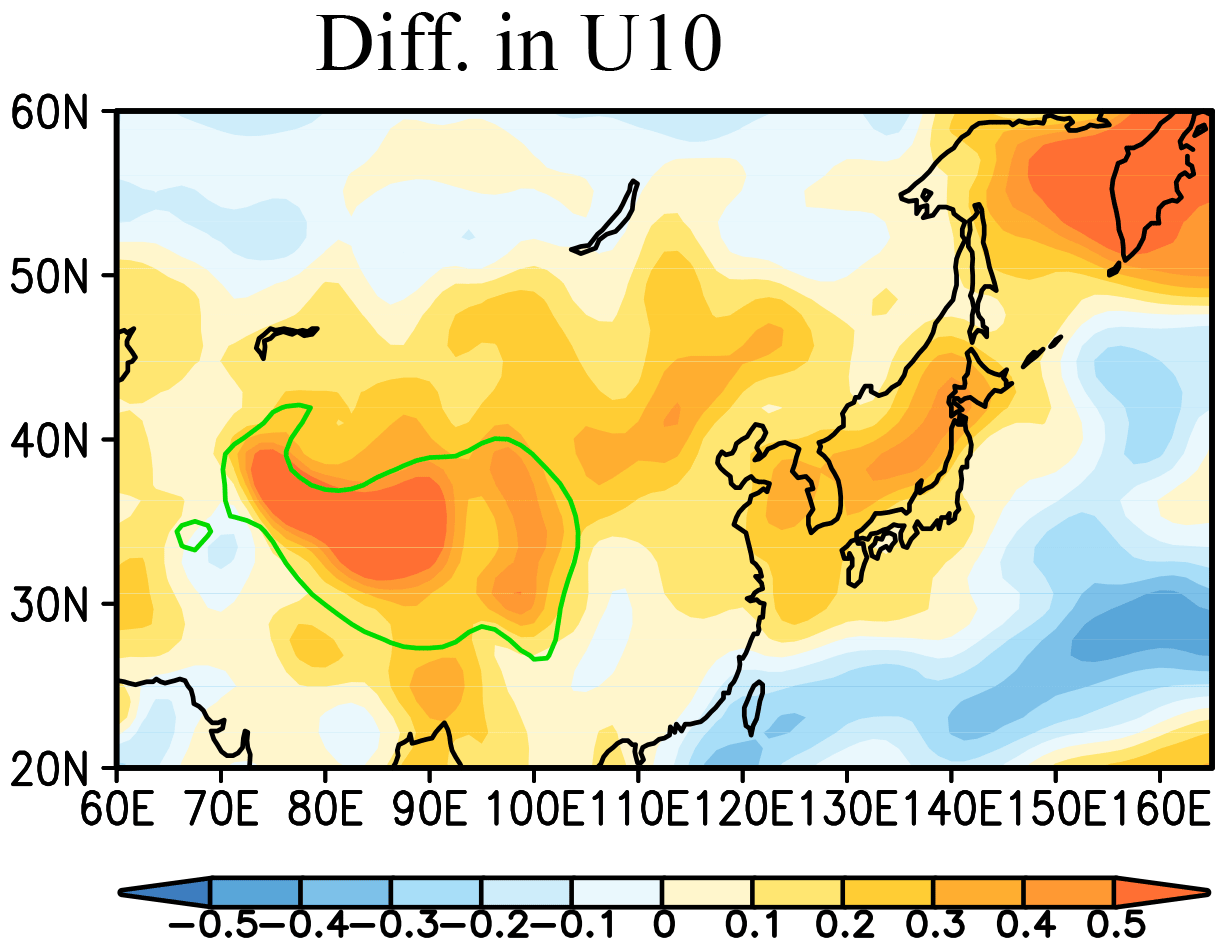
Figure 11Spatial distribution of the MAM composite difference between the strongest and weakest TPSH years (strongest–weakest) for the model in 10 m wind speed (U10, m s−1). The green-contour area indicates the plateau above 2500 m.
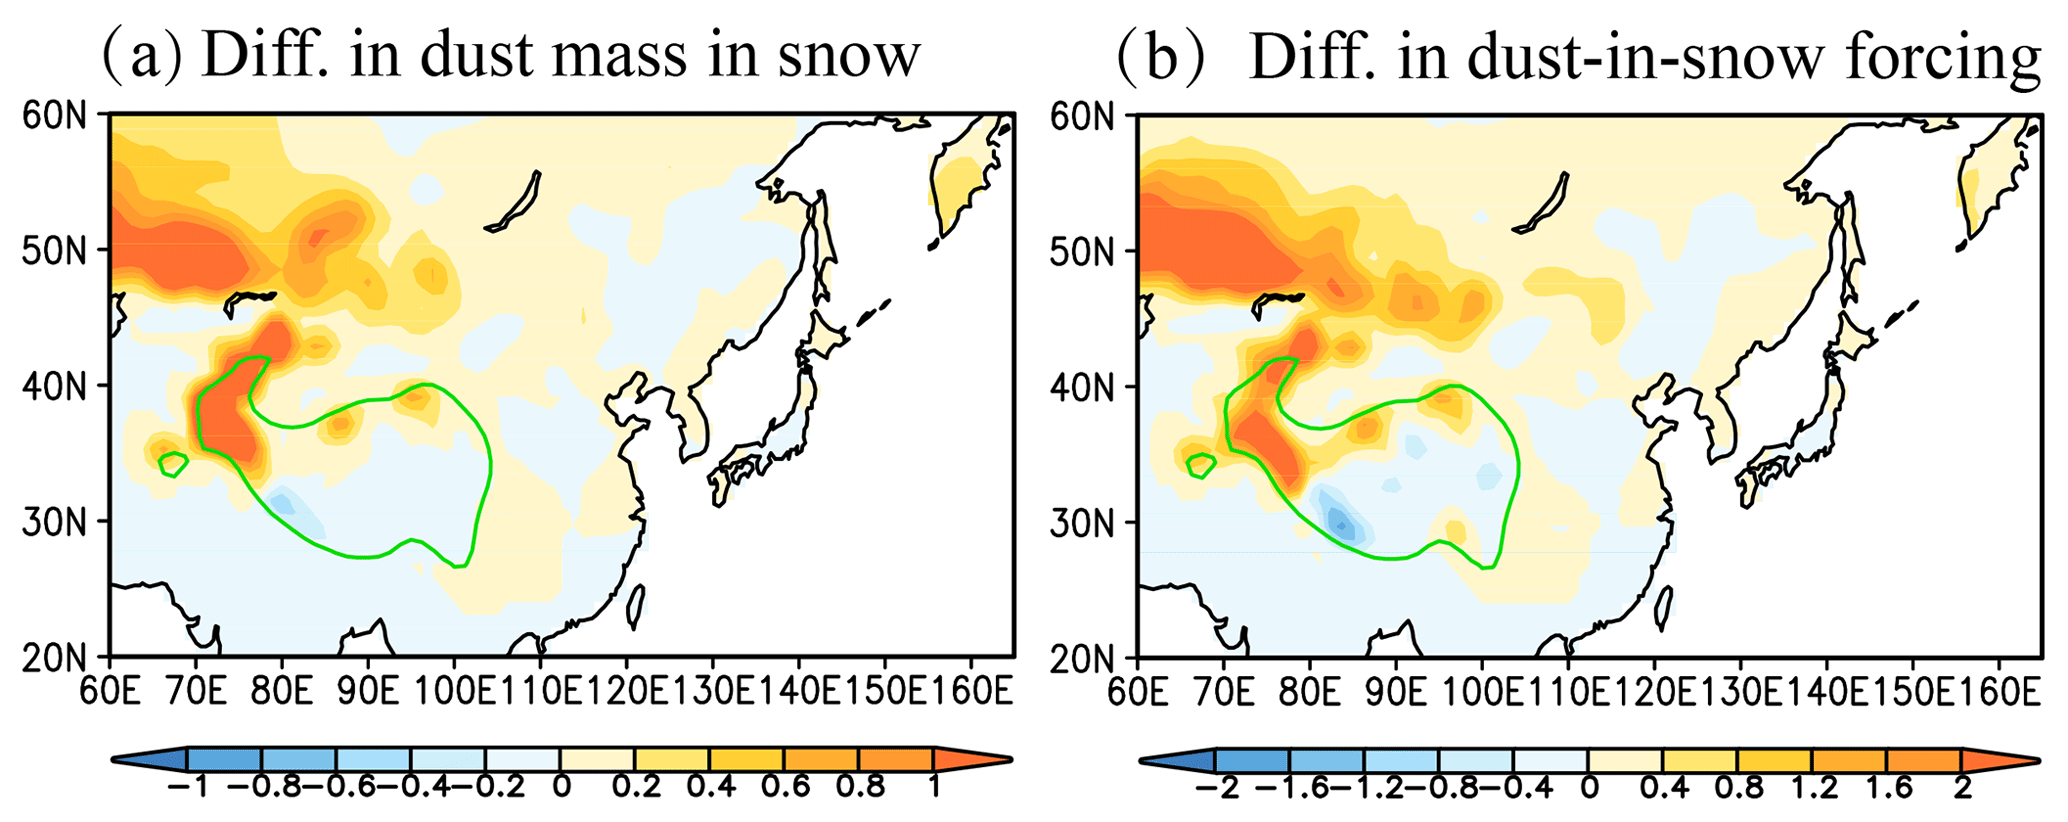
Figure 12Spatial distribution of the MAM composite difference between the strongest and weakest TPSH years (strongest–weakest) for the model in (a) dust mass in snow column (g m−2) and (b) dust-in-snow forcing (W m−2). The green-contour area indicates the plateau above 2500 m.
The spatial distribution of atmospheric temperature anomaly at 500 hPa between the strongest and weakest TPSH years is shown in Fig. 8a. It shows significant increases in atmospheric temperature at 500 hPa in the strongest TPSH years over the TP and the downstream Pacific region, where the maximum temperature anomalies exceed 1.5 and 0.9 ∘C over these two regions, respectively. The temperature anomaly at 500 hPa over the TP is mainly resulted from the increased diabatic heating over the TP in Fig. 8b induced by the surface sensible flux (Fig. 7b). The atmospheric temperature anomaly at 500 hPa over the Pacific region is mainly due to the diabatic heating in Fig. 8b and the horizonal temperature advection in Fig. 8d. It is noted that the decrease in atmospheric temperature at 500 hPa over the northern regions of the TP (Fig. 8a) is resulted from the horizonal temperature advection in Fig. 8d. The increases in atmospheric temperature in the strongest TPSH years over the TP and the downstream Pacific region enhance the geopotential height and produce two anticyclonic anomalies at 500 hPa over these two regions (Fig. 9a). In the high-level atmosphere of 200 hPa, the increased geopotential height and the two anticyclonic anomalies induced by the stronger TPSH are also shown over the two regions in Fig. 9b, similarly to those at 500 hPa (Fig. 9a). The atmospheric circulation anomalies induced by TPSH are absolutely the same as the results from the sensitivity of TPSH in GCM in the previous investigation (Duan et al., 2017). These two anticyclonic anomalies over the TP and the downstream Pacific region at middle and high levels significantly enhance the westerly winds over EA and NP, as shown in Fig. 9. Furthermore, we show the height–latitude cross-section of the MAM composite difference between the strongest and weakest TPSH years in atmospheric temperature and zonal winds over EA and NP in Fig. 10. The higher TPSH in the strongest TPSH years heats the surface, extending to the middle- and high-level atmosphere over the TP and increasing the westerly winds from low to high levels over EA (30–43∘ N) in Fig. 10a. The atmospheric temperature over NP are significantly increased at the middle level and the westerly winds from low to high levels are enhanced over this region (35–45∘ N) in Fig. 10b. Hence, the higher TPSH induces the two anticyclonic anomalies at middle and high levels over the TP and the Pacific region (Fig. 9), significantly enhancing the westerly winds over EA and NP (Figs. 9 and 10). These increased westerly winds in the strongest TPSH years over EA and NP can enhance the dust transport from the dust source regions. Additionally, the increased westerly winds over the EA induced by the higher TPSH also increase the surface 10 m wind speeds in Fig. 11, which further enhance the dust emissions over EA (Fig. 6e and f).
On one hand, an increase in dust aerosols would result in a decrease of solar heating at surface, and thus a decrease in temperature, turbulence, and sensible heat flux through dust direct effect (Miller et al., 2004; Heinold et al., 2007; Xie et al., 2018a). On the other hand, previous studies indicate that dust deposited on the snow over the TP region reduces the visible surface albedo and warms the surface of the TP through the snow-darkening effect (Flanner et al., 2009; Qian et al., 2011, 2015; He et al., 2018; Xie et al., 2018b; Shi et al., 2019). The dust-in-snow effect over the TP increases the TP's thermal effects through enhancing the heat fluxes at the surface and then enhances the westerly winds and dust cycle over East Asia (Xie et al., 2018b). Over the TP, the dust-in-snow forcing is dominated compared with dust direct forcing, which determines the TP warming and regional dust cycle (Qian et al., 2011; Xie et al., 2018b). A significant feature of the dust-in-snow effect over the TP creates a positive feedback loop enhancing the East Asian dust cycle. Our results show that, compared to the weakest TPSH years, the MAM dust cycle in the strongest TPSH years is much more vigorous over East Asia. In the strongest TPSH years, much more dust deposited on snow over the TP (Fig. 12a) shows larger dust-in-snow forcing (Fig. 12b) and then further enhances the regional dust cycle through the above positive feedback loop of dust in snow. Hence, we believe that the positive feedback of dust in snow over the TP plays a non-negligible role in modulation of surface sensible heating over the TP on the interannual variability of East Asian dust cycle.
Note that surface fluxes including sensible heat, latent heat, and surface momentum are parameterized by resolved meteorological quantities (e.g., ground temperature, surface air temperature, wind speed) in CAM4-BAM (Neale et al., 2010), and the performance of the parameterizations strongly depends on these input variables (Liu et al., 2013). The coarse horizonal resolution cannot resolve more details of the TP's complex topography, which results in inadequate meteorological quantities over this region (Li et al., 2015; Ramu et al., 2016) and the discrepancy between the simulated and observational TPSH values (Fig. 1d). Hence, the simulation with higher horizonal resolution makes some significant improvements in the simulated meteorological quantities over the TP (Li et al., 2015; Ramu et al., 2016) and in turn TPSH, which can evaluate exactly the impact of TPSH on the East Asian dust aerosols.
The CAM4-BAM model assumed a sub-bin fixed size distribution of externally mixed aerosols and spherical particle structure/morphology of dust (Neale et al., 2010). This simplified assumption of aerosols led to uncertainty or bias in evaluating dust direct radiative forcing (Yang et al., 2007; He et al., 2015; Scarnato et al., 2015). In microphysical processes of the model, the cloud droplet number concentration and ice number concentration are fixed as constant, ignoring aerosol–cloud interactions (Neale et al., 2010). The model cannot evaluate dust effects on warm, mixed, or ice-phase clouds. Additionally, the assumed dust–snow external mixing underestimates the dust-in-snow feedbacks in CAM4-BAM, and the new parameterization in dust–snow internal mixing enhances the radiative feedbacks (He et al., 2019). Hence, exact parameterizations with dust optical properties, dust–cloud processes, and dust-in-snow interactions will reduce the model uncertainty and effectively evaluate dust–climate interactions in the future.
It is well known that the surface sensible heating in MAM (March–April–May) over the Tibetan Plateau (TPSH) can affect the Asian hydrological cycle and the regional large-scale circulation through altering the atmospheric heat source of the TP (Wu and Zhang, 1998; Ye and Wu, 1998; Duan et al., 2011, 2017; Wu et al., 2012; An et al., 2015). It is likely that the changes in the large-scale atmospheric circulation induced by the MAM TPSH influence the East Asian dust cycle by altering the dust emissions and dust transport. In this study, we firstly investigated the impact of the MAM TPSH on the interannual variability of East Asian dust cycle based on CAM4-BAM, MERRA-2 surface dust concentration, and TPSH measurements.
The results of CAM4-BAM show the dust surface concentrations in MAM are significantly positively correlated with the TPSH over the East Asian (EA) dust source and over the northwestern Pacific (NP), with regionally averaged correlation coefficients of 0.49 for EA and 0.44 for NP. Similar positive correlations are also shown to exist between the MAM TPSH measurements averaged over the 73 observation sites and MERRA-2 surface dust concentration with 0.52 for EA and 0.11 for NP. Further comparisons between the strongest and weakest TPSH years reveal that, the MAM dust surface concentration in the strongest TPSH years increases with relative differences of 13.1 % in the model (22.9 % in MERRA-2) over EA and 36.9 % in the model (13.3 % in MERRA-2) over NP, respectively. The simulated results show that the processes of whole dust cycles including dust loading, emission, and transport, as well as dust deposition are also significantly enhanced during the strongest TPSH years over EA and NP. Through enhancing the atmospheric heat source of the TP, stronger TPSH in MAM generates an anticyclonic anomaly in the middle and upper levels over the TP and over the downstream Pacific region, respectively. These two anticyclonic anomalies induced by the increased TPSH result in increasing westerly winds over both EA and NP, which then enhances dust emissions over the dust source regions and dust transport over these two regions, as well as the regional dust cycles.
Increasing greenhouse gas can significantly influence the global and regional dust cycle through affecting the climate, vegetation, and dust–climate feedbacks, although there is a large uncertainty in the response of the global dust loading to future climate change (Harrison et al., 2001; Tegen et al., 2004; Mahowald et al., 2006; Kok et al., 2018). Additionally, the surface sensible flux over the TP exhibits a remarkable weakening trend under global warming, induced primarily by weakened surface wind speeds (Duan et al., 2011; Wang et al., 2012; Yang et al., 2014). Our study shows the importance of the TPSH on the change in East Asian dust cycle through affecting the westerly winds. Therefore, these results suggest that addressing the East Asian dust changes in the future climates requires considering not only increasing greenhouse gas emissions but also the variations of the TP's heat source under global warming.
The surface sensible heat flux of 73 meteorological stations of the China Meteorological Administration over the TP is available on the personal homepage of Anmin Duan at http://staff.lasg.ac.cn/amduan/index/article/index/arid/11.html (Duan et al., 2017, last access: 12 February 2019). MERRA-2 reanalyses are developed by the Global Modeling and Assimilation Office (GMAO) with support from the NASA Modeling, Analysis and Prediction program, acquired from https://goldsmr5.gesdisc.eosdis.nasa.gov/data/ (Randles, et al., 2016, last access: 14 September 2018). Simulated data of CAM4-BAM can be made accessible upon request to the corresponding author (xnxie@ieecas.cn).
XX, XL, and ZS designed the numerical experiments, and XX performed all the simulations. XX prepared the paper with substantial contribution from all co-authors.
The authors declare that they have no conflict of interest.
The authors would like to thank the editor, Kari Lehtinen, and two anonymous reviewers for their constructive suggestions to improve the paper.
This research has been supported by the Strategic Priority Research Program of Chinese Academy of Sciences (grant nos. XDB40030100 and XDA20070103), the National Natural Science Foundation of China (grant no. 41991254), the National Key Research and Development Program of China (grant no. 2016YFA0601904), and the CAS “Light of West China” Program (grant no. XAB2019A02). Zhengguo Shi was supported by the Youth Innovation Promotion Association (CAS). Yangang Liu is supported by the US Department of Energy's Atmospheric System Research (ASR) program.
This paper was edited by Kari Lehtinen and reviewed by two anonymous referees.
Albani, S., Mahowald, N. M., Perry, A. T., Scanza, R. A., Zender, C. S., Heavens, N. G., Maggi, V., Kok, J. F., and Otto-Bliesner, B. L.: Improved dust representation in the Community Atmosphere Model, J. Adv. Model. Earth Sy., 6, 541–570, https://doi.org/10.1002/2013MS000279, 2014.
An, Z., Wu, G., Li, J., Sun, Y., Liu, Y., Zhou, W., Cai, Y., Duan, A., Li, L., Mao, J., Cheng, H., Shi, Z., Tan, L., Yan, H., Ao, H., Chang, H., and Juan, F.: Global monsoon dynamics and climate change, Annu. Rev. Earth Pl. Sc., 43, 29–77, https://doi.org/10.1146/annurev-earth-060313-054623, 2015.
Buchard, V., da Silva, A. M., Randles, C. A., Colarco, P., Ferrare, R., Hair, J., Hostetler, C., Tackett, J., and Winker, D.: Evaluation of the surface PM2.5 in version 1 of the NASA MERRA aerosol reanalysis over the United States, Atmos. Environ., 125, 100–111, 2016.
Buchard, V., Randles, C. A., da Silva, A. M., Darmenov, A., Colarco, P. R., Govindaraju, R., Ferrare, R., Hair, J., Beyersdorf, A. J., Ziemba, L. D., and Yu, H.: The MERRA-2 aerosol reanalysis, 1980 onward. Part II: evaluation and case studies, J. Climate, 30, 6851–6872, 2018.
Che, H., Zhang, X.-Y., Xia, X., Goloub, P., Holben, B., Zhao, H., Wang, Y., Zhang, X.-C., Wang, H., Blarel, L., Damiri, B., Zhang, R., Deng, X., Ma, Y., Wang, T., Geng, F., Qi, B., Zhu, J., Yu, J., Chen, Q., and Shi, G.: Ground-based aerosol climatology of China: aerosol optical depths from the China Aerosol Remote Sensing Network (CARSNET) 2002–2013, Atmos. Chem. Phys., 15, 7619–7652, https://doi.org/10.5194/acp-15-7619-2015, 2015.
Cheng, X. G., Xie, X. N., Shi, Z. G., Li, X. Z., Zhao, T. L., and Liu, X. D.: Modeling dust direct radiative feedbacks in East Asia during the Last Glacial Maximum, Atmosphere, 10, 146, https://doi.org/10.3390/atmos10030146, 2019.
Duan, A., Li, F., Wang, M., and Wu, G.: Persistent weakening trend in the spring sensible heat source over the Tibetan Plateau and its impact on the Asian summer monsoon, J. Climate, 24, 5671–5682, 2011.
Duan, A. M., Sun, R. Z., and He, J. H.: Impact of surface sensible heating over the Tibetan Plateau on the western Pacific subtropical high: A land-air-sea interaction perspective, Adv. Atmos. Sci., 34, 157–168, https://doi.org/10.1007/s00376-016-6008-z, 2017.
Duce, R. A., Unni, C. K., Ray, B. J., Prospero, J. M., and Merrill, J. T.: Long-range atmospheric transport of soil dust from Asia to the tropical North Pacific: Temporal variability, Science, 209, 1522–1524, 1980.
Flanner, M. G., Zender, C. S., Randerson, J. T., and Rasch, P. J.: Present day climate forcing and response from black carbon in snow, J. Geophys. Res., 112, D11202, https://doi.org/10.1029/2006JD008003, 2007.
Flanner, M. G., Zender, C. S., Hess, P. G., Mahowald, N. M., Painter, T. H., Ramanathan, V., and Rasch, P. J.: Springtime warming and reduced snow cover from carbonaceous particles, Atmos. Chem. Phys., 9, 2481–2497, https://doi.org/10.5194/acp-9-2481-2009, 2009.
Gelaro, R., McCarty, W., Suárez, M. J., Todling, R., Molod, A., Takacs, L., Randles, C. A., Darmenov, A., Bosilovich, M. G., Reichle, R., Wargan, K., Coy, L., Cullather, R., Draper, C., Akella, S., Buchard, V., Conaty, A., da Silva, A. M., Gu, W., Kim, G.-K., Koster, R., Lucchesi, R., Merkova, D., Nielsen, J. E., Partyka, G., Pawson, S., Putman, W., Rienecker, M., Schubert, S. D., Sienkiewicz, M., and Zhao, B.: The Modern-Era Retrospective Analysis for Research and Applications, Version 2 (MERRA-2), J. Climate, 30, 5419–5454, https://doi.org/10.1175/JCLI-D-16-0758.1, 2017.
Gong, S. L., Zhang, X. Y., Zhao, T. L., Zhang, X. B., Barrie, L. A., McKendry, I. G., and Zhao, C. S.: A simulated climatology of Asian dust aerosol and its trans-Pacific transport. Part II: Interannual variability and climate connections, J. Climate, 19, 104–122, 2006.
Gu, Y., Xue, Y., De Sales, F., Liou, K. N.: A GCM investigation of dust aerosol impact on the regional climate of North Africa and South/East Asia, Clim. Dynam., 46, 2353–2370, 2016.
Han, Z. W., Li, J. W., Xia, X. G., and Zhang, R. J.: Investigation of direct radiative effects of aerosols in dust storm season over East Asia with an online coupled regional climate-chemistry-aerosol model, Atmos. Environ., 54, 688–699, https://doi.org/10.1016/j.atmosenv.2012.01.041, 2012.
Harrison, S. P., Kohfeld, K. E., Roelandt, C., and Claquin, T.: The role of dust in climate changes today, at the last glacial maximum and in the future, Earth-Sci. Rev., 54, 43–80, 2001.
He, C., Liou, K.-N., Takano, Y., Zhang, R., Levy Zamora, M., Yang, P., Li, Q., and Leung, L. R.: Variation of the radiative properties during black carbon aging: theoretical and experimental intercomparison, Atmos. Chem. Phys., 15, 11967–11980, https://doi.org/10.5194/acp-15-11967-2015, 2015.
He, C., Flanner, M. G., Chen, F., Barlage, M., Liou, K.-N., Kang, S., Ming, J., and Qian, Y.: Black carbon-induced snow albedo reduction over the Tibetan Plateau: Uncertainties from snow grain shape and aerosol-snow mixing state based on an updated SNICAR model, Atmos. Chem. Phys., 18, 11507–11527, https://doi.org/10.5194/acp-2018-476, 2018.
He, C., Liou, K.-N., Takano, Y., Chen, F., and Barlage, M.: Enhanced snow absorption and albedo reduction by dust-snow internal mixing: modeling and parameterization, J. Adv. Model. Earth Sy., 11, 3755–3776, https://doi.org/10.1029/2019MS001737, 2019.
Heinold, B., Helmert, J., Hellmuth, O., Wolke, R., Ansmann, A., Marticorena, B., Laurent, B., and Tegen, I.: Regional modeling of Saharan dust events using LM-MUSCAT: Model description and case studies, J. Geophys. Res., 112, D11204, https://doi.org/10.1029/2006JD007443, 2007.
Huang, J., Wang, T., Wang, W., Li, Z., and Yan, H.: Climate effects of dust aerosols over East Asian arid and semiarid regions, J. Geophys. Res.-Atmos., 119, 11398–11416, https://doi.org/10.1002/2014JD021796, 2014.
Huneeus, N., Schulz, M., Balkanski, Y., Griesfeller, J., Prospero, J., Kinne, S., Bauer, S., Boucher, O., Chin, M., Dentener, F., Diehl, T., Easter, R., Fillmore, D., Ghan, S., Ginoux, P., Grini, A., Horowitz, L., Koch, D., Krol, M. C., Landing, W., Liu, X., Mahowald, N., Miller, R., Morcrette, J.-J., Myhre, G., Penner, J., Perlwitz, J., Stier, P., Takemura, T., and Zender, C. S.: Global dust model intercomparison in AeroCom phase I, Atmos. Chem. Phys., 11, 7781–7816, https://doi.org/10.5194/acp-11-7781-2011, 2011.
Hurrell, J., Hack, J., Shea, D., Caron, J., and Rosinski, J.: A new sea surface temperature and sea ice boundary data set for the Community Atmosphere Model, J. Climate, 21, 5145–5153, https://doi.org/10.1175/2008JCLI2292.1, 2008.
Kok, J. F.: A scaling theory for the size distribution of emitted dust aerosols suggests climate models underestimate the size of the global dust cycle, P. Natl. Acad. Sci. USA, 108, 1016–1021, https://doi.org/10.1073/pnas.1014798108, 2011.
Kok, J. F., Ridley, D. A., Zhou, Q., Miller, R. L., Zhao, C., Heald, C. L., Ward, D. S., Albani, S., and Haustein, K.: Smaller desert dust cooling effect estimated from analysis of dust size and abundance, Nat. Geosci., 10, 274–278, https://doi.org/10.1038/ngeo2912, 2017.
Kok, J. F., Ward, D. S., Mahowald, N. M., and Evan, A. T.: Global and regional importance of the direct dust-climate feedback, Nat. Commun., 9, 241, https://doi.org/10.1038/s41467-017-02620-y, 2018.
Lamarque, J.-F., Bond, T. C., Eyring, V., Granier, C., Heil, A., Klimont, Z., Lee, D., Liousse, C., Mieville, A., Owen, B., Schultz, M. G., Shindell, D., Smith, S. J., Stehfest, E., Van Aardenne, J., Cooper, O. R., Kainuma, M., Mahowald, N., McConnell, J. R., Naik, V., Riahi, K., and van Vuuren, D. P.: Historical (1850–2000) gridded anthropogenic and biomass burning emissions of reactive gases and aerosols: methodology and application, Atmos. Chem. Phys., 10, 7017–7039, https://doi.org/10.5194/acp-10-7017-2010, 2010.
Lau, K. M., Kim, M. K., and Kim, K. M.:. Asian monsoon anomalies induced by aerosol direct forcing: the role of the Tibetan Plateau, Clim. Dynam., 26, 855–664, 2006.
Li, J., Yu, R., Yuan, W., Chen, H., Sun, W., and Zhang Y.: Precipitation over East Asia simulated by NCAR CAM5 at different horizontal resolutions, J. Adv. Model. Earth Sy., 7, 774–790, https://doi.org/10.1002/2014MS000414, 2015.
Littmann, T.: Dust storm frequency in Asia: climatic control and variability, Int. J. Climatol., 11, 393–412, 1991.
Liu, G., Liu, Y. G., and Endo, S.: Evaluation of surface flux parameterizations with long-term ARM observations, Mon. Weather Rev., 141, 773–797, https://doi.org/10.1175/MWR-D-12-00095.1, 2013.
Liu, X. and Dong, B.: Influence of the Tibetan Plateau uplift on the Asian monsoon-arid environment evolution, Chinese Sci. Bull., 58, 4277–4291, https://doi.org/10.1007/s11434-013-5987-8, 2013.
Liu, X. D., Yin, Z.-Y., Zhang, X. Y., and Yang, X. C.: Analyses of the spring dust storm frequency of northern China in relation to antecedent and concurrent wind, precipitation, vegetation, and soil moisture conditions, J. Geophys. Res., 109, D16210, https://doi.org/10.1029/2004JD004615, 2004.
Liu, X. D., Xie, X. N., Yin, Z.-Y., Liu, C. H., and Gettelman, A.: A modeling study of the effects of aerosols on clouds and precipitation over East Asia, Theor. Appl. Climatol., 106, 343–354, https://doi.org/10.1007/s00704-011-0436-6, 2011.
Lou, S., Russell, L. M., Yang, Y., Xu, L., Lamjiri, M. A., DeFlorio, M. J., Miller A. J., Ghan, S. J., Liu, Y., and Singh, B.: Impacts of the East Asian Monsoon on springtime dust concentrations over China, J. Geophys. Res.-Atmos., 121, 8137–8152, https://doi.org/10.1002/2016JD024758, 2016.
Mahowald, N. M., Muhs, D. R., Levis, S., Rasch, P. J., Yoshioka, M., Zender, C. S., and Luo, C.: Change in atmospheric mineral aerosols in response to climate: Last glacial period, preindustrial, modern, and doubled carbon dioxide climates, J. Geophys. Res., 111, D10202, https://doi.org/10.1029/2005JD006653, 2006.
Mahowald, N. M., Albani, S., Kok, J. F., Engelstaedter, S., Scanza, R., Ward, D. S., and Flanner, M. G.: The size distribution of desert dust aerosols and its impact on the Earth system, Aeolian Res., 15, 53–71, https://doi.org/10.1016/j.aeolia.2013.09.002, 2014.
Miller, R. L. and Tegen, I.: Climate response to soil dust aerosols, J. Climate, 11, 3247–3267, 1998.
Miller, R. L., Perlwitz, J., and Tegen, I.: Feedback upon dust emission by dust radiative forcing through the planetary boundary layer, J. Geophys. Res., 109, D24209, https://doi.org/10.1029/2004JD004912, 2004.
Neale, R. B., Richter, J. H., Conley, A. J., Park, S., Lauritzen, P. H., Gettelman, A., Williamson, D. L., Rasch, P. J., Vavrus, S. J., Taylor, M. A., Collins, W. D., Zhang, M., and Lin, S.-J.: Description of the NCAR Community Atmosphere Model (CAM 4.0), NCAR Tech. Note, TN-485, 212 pp., Natl. Cent. for Atmos. Res., Boulder, Colorado, 2010.
Pu, Z., Xu, L., and Salomonson, V. V.: MODIS/Terra observed seasonal variationsof snow cover over the Tibetan Plateau, Geophys. Res. Lett., 34, L06706, https://doi.org/10.1029/2007GL029262, 2007.
Qian, W., Tang, X., and Quan, L.: Regional characteristics of dust storms in China, Atmos. Environ., 38, 4895–4907, https://doi.org/10.1016/j.atmosenv.2004.05.038, 2004.
Qian, Y., Flanner, M. G., Leung, L. R., and Wang, W.: Sensitivity studies on the impacts of Tibetan Plateau snowpack pollution on the Asian hydrological cycle and monsoon climate, Atmos. Chem. Phys., 11, 1929–1948, https://doi.org/10.5194/acp-11-1929-2011, 2011.
Qian, Y., Yasunari, T. J., Doherty, S. J., Flanner, M. G., Lau, W. K. M., Jing, M., Wang, H., Wang, M., Warren, S. G., and Zhang, R.: Light-absorbing Particles in Snow and Ice: Measurement and Modeling of Climatic and Hydrological impact, Adv. Atmos. Sci., 32, 64–91, https://doi.org/10.1007/s00376-014-0010-0, 2015.
Ramu, D. A., Sabeerali, C. T., Chattopadhyay, R., Rao, D. N., George, G., Dhakate, A. R., Salunke, K., Srivastava, A., and Rao, S. A.: Indian summer monsoon rainfall simulation and prediction skill in the CFSv2 coupled model: Impact of atmospheric horizontal resolution, J. Geophys. Res.-Atmos., 121, 2205–2221, https://doi.org/10.1002/2015JD024629, 2016.
Randles, C. A., da Silva, A. M., Buchard, V., Darmenov, A., Colarco, P. R., Aquila, V., Bian, H., Nowottnick, E. P., Pan, X., Smirnov, A., Yu, H., and Govindaraju, R.: The MERRA-2 aerosol assimilation, Tech. Rep. Ser. Glob. Model. Data Assim., 45, 2016.
Randles, C. A., da Silva, A. M., Buchard, V., Colarco, P. R., Darmenov, A., Govindaraju, R., Smirnov, A., Holben, B., Ferrare, R., Hair, J., Shinozuka, Y., and Flynn, C. J.: The merra-2 aerosol reanalysis, 1980 onward. part I: system description and data assimilation evaluation, J. Climate, 30, 6823–6850, 2018.
Rayner, N. A., Parker, D. E., Horton, E. B., Folland, C. K., Alexander, L. V., Rowell, D. P., Kent, E. C., and Kaplan, A.: Global analyses of sea surface temperature, sea ice, and night marine air temperature since the late nineteenth century, J. Geophys. Res., 108, 4407, https://doi.org/10.1029/2002JD002670, 2003.
Rienecker, M. M., Suarez, M. J., Gelaro, R., Todling, R., Bacmeister, J., Liu, E., Bosilovich, M. G., Schubert, S. D., Takacs, L., Kim, G. K., Bloom, S., Chen, J., Collins, D., Conaty, A., da Silva, A., Gu, W., Joiner, J., Koster, R. D., Lucchesi, R., Molod, A., Owens, T., Pawson, S., Pegion, P., Redder, C. R., Reichle, R., Robertson, F. R., Ruddick, A. G., Sienkiewick, M., and Woollen, J.: MERRA: NASA's Modern-Era retrospective analysis for research and application, J. Climate, 24, 3624–3648, 2011.
Scarnato, B. V., China, S., Nielsen, K., and Mazzoleni, C.: Perturbations of the optical properties of mineral dust particles by mixing with black carbon: a numerical simulation study, Atmos. Chem. Phys., 15, 6913–6928, https://doi.org/10.5194/acp-15-6913-2015, 2015.
Shao, Y., Wyrwoll, K. H., Chappell, A., Huang, J., Lin, Z., McTainsh, G. H., Mikami, M., Tanaka, T. Y., Wang, X., and Yoon, S.: Dust cycle: an emerging core theme in Earth System Science, Aeolian Res., 2, 181–204, 2011.
Shi, Q. and Liang, S.: Surface-sensible and latent heat fluxes over the Tibetan Plateau from ground measurements, reanalysis, and satellite data, Atmos. Chem. Phys., 14, 5659–5677, https://doi.org/10.5194/acp-14-5659-2014, 2014.
Shi, Z., Xie, X., Li, X., Yang, L., Xie, X., Lei, J., Sha, Y., and Liu, X.: Snow-darkening versus direct radiative effects of mineral dust aerosol on the Indian summer monsoon onset: role of temperature change over dust sources, Atmos. Chem. Phys., 19, 1605–1622, https://doi.org/10.5194/acp-19-1605-2019, 2019.
Song, Z., Fu, D., Zhang, X., Wu, Y., Xia, X., He, J., Han, X., Zhang, R., and Che, H.: Diurnal and seasonal variability of PM2.5 and AOD in North China plain: Comparison of MERRA-2 products and ground measurements, Atmos. Environ., 191, 70–78, https://doi.org/10.1016/j.atmosenv.2018.08.012, 2018.
Sun, J., Zhang, M., and Liu, T.: Spatial and temporal characteristics of dust storms in China and its surrounding regions, 1960–1999: Relations to source area and climate, J. Geophys. Res., 106, 10325–10333, https://doi.org/10.1029/2000JD900665, 2001.
Sun, H., Pan, Z., and Liu, X.: Numerical simulation of spatialtemporal distribution of dust aerosol and its direct radiative effects on East Asian climate, J. Geophys. Res., 117, D13206, https://doi.org/10.1029/2011JD017219, 2012.
Sun, H., Liu, X., and Pan, Z.: Direct radiative effects of dust aerosols emitted from the Tibetan Plateau on the East Asian summer monsoon – a regional climate model simulation, Atmos. Chem. Phys., 17, 13731–13745, https://doi.org/10.5194/acp-17-13731-2017, 2017.
Tang, Y. G., Han, Y. X., Ma, X. Y., and Liu, Z. H.: Elevated heat pump effects of dust aerosol over Northwestern China during summer, Atmos. Res., 203, 95–104, https://doi.org/10.1016/j.atmosres.2017.12.004, 2018.
Tegen, I. and Lacis A. A.: Modeling of particle size distribution and its influence on the radiative properties of mineral dust aerosol, J. Geophys. Res., 101, 19237–19244, 1996.
Tegen, I., Werner, M., Harrison, S. P., and Kohfeld, K. E.: Relative importance of climate and land use in determining present and future global soil dust emission, Geophys. Res. Lett., 31, L05105, https://doi.org/10.1029/2003GL019216, 2004.
Tie, X., Madronich, S., Walters, S., Edwards, D. P., Ginoux, P., Mahowald, N., Zhang, R., Lou, C., and Brasseur, G.: Assessment of the global impact of aerosols on tropospheric oxidants, J. Geophys. Res.-Atmos., 110, D03204, https://doi.org/10.1029/2004JD005359, 2005.
Wang, H. L., Xie, X. N., and Liu, X. D.: On the robustness of the weakening effect of anthropogenic aerosols on the East Asian summer monsoon with multimodel results, Adv. Meteorol., 2015, 397395, https://doi.org/10.1155/2015/397395, 2015.
Wang, M. R., Zhou, S. W, and Duan, A. M.: Trend in the atmospheric heat source over the central and eastern Tibetan Plateau during recent decades: Comparison of observations and reanalysis data, Chinese Sci. Bull., 57, 548–557, https://doi.org/10.1007/s11434-011-4838-8, 2012.
Wang, Z. Q., Duan, A. M., and Wu, G. X.: Time-lagged impact of spring sensible heat over the Tibetan Plateau on the summer rainfall anomaly in East China: case studies using the WRF model, Clim. Dynam., 42, 2885–2898, 2014.
Wu, G. X. and Zhang, Y. S.: Tibetan Plateau forcing and the timing of the monsoon onset over South Asia and the South China Sea, Mon. Weather Rev., 126, 913–927, 1998.
Wu, G. X., Liu, Y. M., He, B., Bao, Q., Duan, A. M., and Jin, F. F.: Thermal controls on the Asian summer monsoon, Sci. Rep.-UK, 2, 404, https://doi.org/10.1038/srep00404, 2012.
Xie, L., Yan, T., Pietrafesa, L. J., Karl, T., and Xu, X.: Relationship between western North Pacific typhoon activity and Tibetan Plateau winter and spring snow cover, Geophys. Res. Lett., 32, L16703, https://doi.org/10.1029/2005GL023237, 2005.
Xie, X. N., Wang, H. L., Liu, X. D., Li, J. D., Wang, Z. S., and Liu, Y.: Distinct effects of anthropogenic aerosols on the East Asian summer monsoon between multidecadal strong and weak monsoon stages, J. Geophys. Res.-Atmos., 121, 7026–7040, https://doi.org/10.1002/2015JD024228, 2016.
Xie, X. N., Liu, X. D., Che, H. Z., Xie, X. X., Wang, H. L., Li, J. D., Shi, Z. G., and Liu,Y.: Modeling East Asian dust and its radiative feedbacks in CAM4-BAM, J. Geophys. Res.-Atmos., 123, 1079–1096, https://doi.org/10.1002/2017JD027343, 2018a.
Xie, X., Liu, X., Che, H., Xie, X., Li, X., Shi, Z., Wang, H., Zhao, T., and Liu, Y.: Radiative feedbacks of dust in snow over eastern Asia in CAM4-BAM, Atmos. Chem. Phys., 18, 12683–12698, https://doi.org/10.5194/acp-18-12683-2018, 2018b.
Xin, J. Y., Gong, C. S., Wang, S. G., and Wang, Y. S: Aerosol direct radiative forcing in desert and semi-desert regions of northwestern China, Atmos. Res., 171, 56–65, https://doi.org/10.1016/j.atmosres.2015.12.004, 2016.
Yang, K., Wu, H., Qin, J., Lin, C., Tang, W., and Chen, Y.: Recent climate changes over the Tibetan Plateau and their impacts on energy and water cycle: A review, Global Planet. Change, 112, 79–91, 2014.
Yang, P., Feng, Q., Hong, G., Kattawar, G. W., Wiscombe, W. J., Mishchenko, M. I., Dubovik, O., Laszlo, I., and Sokolik, I. N.: Modeling of the scattering and radiative properties of nonspherical dust-like aerosols, J. Aerosol Sci., 38, 995–1014, 2007.
Yao, T., Thompson, L., Yang, W., Yu, W., Gao, Y., Guo, X., Yang, X., Duan, K., Zhao, H., and Xu, B.: Different glacier status with atmospheric circulations in Tibetan Plateau and surroundings, Nat. Clim. Change, 2, 663–667, https://doi.org/10.1038/nclimate1580, 2012.
Ye, D. Z. and Wu, G. X.: The role of the heat source of the Tibetan Plateau in the general circulation, Meteorol. Atmos. Phys., 67, 181–198, 1998.
Yue, X., Wang, H., Wang, Z., and Fan, K.: Simulation of dust aerosol radiative feedback using the Global Transport Model of Dust: 1. Dust cycle and validation, J. Geophys. Res., 114, D10202, https://doi.org/10.1029/2008JD010995, 2009.
Yumimoto, K. and Takemura, T.: Long-term inverse modeling of Asian dust: Interannual variations of its emission, transport, deposition, and radiative forcing, J. Geophys. Res.-Atmos., 120, 1582–1607, https://doi.org/10.1002/2014JD022390, 2015.
Zhang, D. F., Zakey, A. S., Gao, X. J., Giorgi, F., and Solmon, F.: Simulation of dust aerosol and its regional feedbacks over East Asia using a regional climate model, Atmos. Chem. Phys., 9, 1095–1110, https://doi.org/10.5194/acp-9-1095-2009, 2009.
Zhang, H., Ma J., and Zheng Y.: Modeling study of the global distribution of radiative forcing by dust aerosol, J. Meteorol. Res.-PRC, 24, 558–570, 2010.
Zhang, X. Y., Arimoto, R., and An, Z. S.: Dust emission from Chinese desert sources linked to variations in atmospheric circulation, J. Geophys. Res., 102, 28041–28047, 1997.
Zhang, X. Y., Wang, Y. Q., Niu, T., Zhang, X. C., Gong, S. L., Zhang, Y. M., and Sun, J. Y.: Atmospheric aerosol compositions in China: spatial/temporal variability, chemical signature, regional haze distribution and comparisons with global aerosols, Atmos. Chem. Phys., 12, 779–799, https://doi.org/10.5194/acp-12-779-2012, 2012.
Zhao, T. L., Gong, S. L., Zhang, X. Y., Blanchet, J. P., McKendry, I. G., and Zhou, Z. J.: A simulated climatology of Asian dust aerosol and its trans-Pacific transport, Part I: Mean climate and validation, J. Climate, 19, 88–103, 2006.