the Creative Commons Attribution 4.0 License.
the Creative Commons Attribution 4.0 License.
 | 18 Sep 2020
Determination of the absorption cross sections of higher-order iodine oxides at 355 and 532 nm
Thomas R. Lewis
Juan Carlos Gómez Martín
Mark A. Blitz
Carlos A. Cuevas
Alfonso Saiz-Lopez
Iodine oxides (IxOy) play an important role in the atmospheric chemistry of iodine. They are initiators of new particle formation events in the coastal and polar boundary layers and act as iodine reservoirs in tropospheric ozone-depleting chemical cycles. Despite the importance of the aforementioned processes, the photochemistry of these molecules has not been studied in detail previously. Here, we report the first determination of the absorption cross sections of IxOy, x=2, 3, 5, y=1–12 at λ=355 nm by combining pulsed laser photolysis of I2∕O3 gas mixtures in air with time-resolved photo-ionization time-of-flight mass spectrometry, using NO2 actinometry for signal calibration. The oxides selected for absorption cross-section determinations are those presenting the strongest signals in the mass spectra, where signals containing four iodine atoms are absent. The method is validated by measuring the absorption cross section of IO at 355 nm, (1.2±0.1) cm2, which is found to be in good agreement with the most recent literature. The results obtained are cm2 molec.−1, ( cm2 molec.−1, ( cm2 molec.−1, ( cm2 molec.−1, and ( cm2 molec.−1. Photodepletion at λ=532 nm was only observed for OIO, which enabled determination of upper limits for the absorption cross sections of IxOy at 532 nm using OIO as an actinometer. These measurements are supplemented with ab initio calculations of electronic spectra in order to estimate atmospheric photolysis rates J(IxOy). Our results confirm a high J(IxOy) scenario where IxOy is efficiently removed during daytime, implying enhanced iodine-driven ozone depletion and hindering iodine particle formation. Possible I2O3 and I2O4 photolysis products are discussed, including IO3, which may be a precursor to iodic acid (HIO3) in the presence of HO2.
- Article
(8703 KB) - Full-text XML
- BibTeX
- EndNote


Photolabile iodine-containing molecules are emitted into the lower atmosphere from the sea surface and from marine biota. The atmospheric processing of iodine leads to its accumulation in aerosol and subsequent transport and deposition on land, where it enters the continental ecosystems (Saiz-Lopez et al., 2012b). In the course of this process, gas-phase reactive iodine is involved in two important chemical processes of the background troposphere: ozone depletion and new particle formation. Iodine is thought to be responsible for 9 to 16 % of the contemporary ozone removal in the tropical troposphere (Saiz-Lopez et al., 2014; Sherwen et al., 2016), and there is evidence that anthropogenic ozone pollution enhances iodine release from the sea surface (Carpenter et al., 2013; Chance et al., 2014; MacDonald et al., 2014; Prados-Roman et al., 2015; Cuevas et al., 2018), which in turn has accelerated ozone loss in the last decades (Cuevas et al., 2018). The atmospheric chemistry of iodine is in principle fairly simple, since the main atmospheric fate of the iodine atoms is reaction with ozone to form iodine monoxide (IO). This radical photolyses readily (Gómez Martín et al., 2005), creating an ozone-neutral cycle and establishing a steady-state concentration of I and IO, which are then termed collectively active iodine or IOx. Any other chemical cycle involving IO which recycles atomic iodine without concomitant generation of atomic oxygen leads to ozone depletion, e.g. (Gómez Martín et al., 2009):
Further steps in this scheme lead to the formation of higher iodine oxides (Gómez Martín et al., 2013).
Previous laboratory experiments on iodine photochemistry have reported kinetic growth of broadband absorptions following the decay of IO and OIO as well as significant deposition of particulates on the walls of the reactors (Cox and Coker, 1983; Laszlo et al., 1995; Harwood et al., 1997; Gómez Martín et al., 2005). These broadband absorbers have been tentatively identified as some of the higher iodine oxides produced in Reactions (R4), (R5), and (R6) (Bloss et al., 2001; Gómez Martín et al., 2007), which are believed to be precursors to the particles that eventually deposit on the walls. Furthermore, iodine-oxide-containing particles have been observed in multiple aerosol flow tube and steady-state chamber experiments starting from the photooxidation of iodine precursors directly injected into the chamber (Hoffmann et al., 2001; Jimenez et al., 2003; Saunders et al., 2010; Wei et al., 2017) or emitted from cultures of algae under oxidative stress (McFiggans et al., 2004; Pirjola et al., 2005). Emissions of I2 and alkyl iodides from coastal macroalgae and polar phytoplankton and concurrent observation of IO and OIO (Saiz-Lopez and Plane, 2004) have been unambiguously linked to intense new particle formation events (Jimenez et al., 2003; McFiggans et al., 2004). Thus, there is a strong indication that iodine oxide clustering also happens in the coastal boundary layer and is responsible for particle formation events.
Recent nitrate ion chemical ionization–atmospheric pressure interface–time-of-flight mass spectrometry ( CI-API-ToF-MS) observations of - and IO3-containing ion clusters in coastal and polar environments, as well as complementary laboratory experiments in the absence of HOx, have been interpreted as direct measurements of gas-phase iodic acid (HOIO2, hereafter denoted as HIO3) and HIO3 clusters (Sipilä et al., 2016) by ionization of the ambient species by in the instrument inlet. Since all possible reaction paths for I, IO, and OIO with H2O are very endothermic (Canneaux et al., 2010; Hammaecher et al., 2011; Khanniche et al., 2017a) and IOx−H2O complexes are very weakly bound (Galvez et al., 2013), the formation of oxyacids may rather proceed via hydrolysis of higher iodine oxides (Kumar et al., 2018):
Ozone depletion and particle formation are to some extent competing processes. Significant IxOy photolysis rates may result in regeneration of IOx:
These photochemical reactions would enhance ozone depletion while slowing down the incorporation of iodine into aerosol via oxides and/or oxyacids and represent an important source of uncertainty in the iodine chemical mechanism incorporated into global chemistry transport models (Saiz-Lopez et al., 2014; Sherwen et al., 2016). In order to reduce this uncertainty, we report here a set of IxOy photodepletion experiments with mass spectrometric detection, which enables unambiguous observation of all the species of interest (Gómez Martín et al., 2013). Experiments devoted to understanding the interaction between IxOy and water, potentially leading to the formation of HIO3, are reported elsewhere (Gómez Martín et al., 2020).
2.1 Experimental set-up
A pulsed laser photolysis (PLP) system has been employed to generate iodine oxides from the photolysis of O3 in the presence of I2 in a tubular reaction cell (Fig. 1). A flow of typically 1.5 slm of He carrier gas (99.999 %, BOC Gases) was introduced in the reactor. I2 molecules were entrained in the carrier flow by passing a smaller flow of He (∼100 sccm) through a 12 mm diameter temperature-stabilized Teflon tube containing I2 crystals (>99.5 %, Sigma-Aldrich). An electrical discharge ozone generator converted ∼2 % of a ∼100 sccm O2 flow (99.999 %, BOC Gases) to O3, which was introduced to the main flow via an inlet on the flow tube.
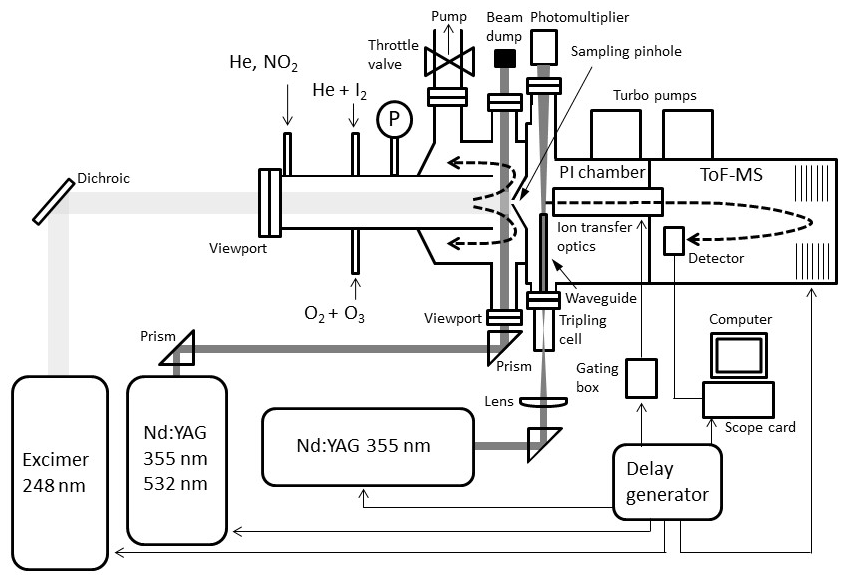
Figure 1Schematic diagram of the experimental set-up for studying the photolysis of iodine oxides.
Ozone was photolysed at 248 nm by an excimer laser beam (Lambda Physik Compex 102), which was passed unfocussed through a quartz view port along the tube main axis. This generated the well-known sequence of reactions:
This is followed by Reactions (R1), (R2), (R4), (R5), and (R6) as well as further IxOy clustering reactions. The precursor concentrations ([I2]∼2–4×10¹⁴ molec. cm−3, [O3]∼3–5×10¹⁴ molec. cm−3) and excimer laser energy (120–190 mJ pulse−1, ∼50–80 mJ pulse−1 cm−2) were tuned to ensure that I2 was in excess over O(3P). Iodine and ozone concentrations were measured using a 532 nm solid-state laser in a single-pass and multipass Herriott cell (Lewis et al., 2018), respectively (Fig. 2). A reflection (∼5 %) of the main 532 nm diode laser (Thorlabs CPS532, 532 nm, 4.5 mW) beam was directed along the length of the cell (length =40 cm) and detected using a photodiode detector (Thorlabs SM05PD3A). Ozone was detected by passing the main beam through a hole in the rear of a silver-coated concave mirror (Thorlabs CM508-200-P01, f=20 cm) onto an identical mirror (without a hole) positioned 40 cm from the first mirror. The light was passed 40 times through the cell and exits through the same entrance hole (some passes are omitted from the diagram for simplicity), giving a path length of 12 m.

The concentrations C of O3 and I2 were then determined using the Beer–Lambert law (Eq. 1), where I and I0 are the intensities of the 532 nm laser light recorded with and without the reagent present, respectively, OD is the optical density, σ the absorption cross section, and l the optical path length:
O3 has an absorption cross section at 532 nm of cm2 molec.−1 (Burrows et al., 1999). A typical concentration of 5×10¹⁴ molec. cm−3 in the reaction mixture (total flow ∼1700 sccm) requires a concentration in the O3∕O2 flow (100 sccm) of around 8.5×10¹⁵ molec. cm−3. An ozone concentration of 8.5×10¹⁵ molec. cm−3 results in OD =0.024. I2 has an absorption cross section at 532 nm of cm2 molec.−1 (Saiz-Lopez et al., 2004). A typical I2 concentration of 4×10¹⁴ molec. cm−3 in the reaction mixture (total flow ∼1700 sccm) requires a concentration in the I2∕He flow (100 sccm) of around 6.8×10¹⁵ molec. cm−3. An I2 concentration of 6.8×10¹⁵ molec. cm−3 gives OD =0.82. The ODs observed for both species are easily detectable by the instrument, which has a typical signal-to-noise ratio of ∼400, which corresponds to a minimum detectable OD of . As there is no reference photodiode in this set-up, drift in laser intensity must be accounted for. To negate the effect of laser drift as much as possible, the probe intensity is measured over a period of 15 s for both I and I0, with ∼10 s between the measurements. To ensure that laser drift does not significantly affect the measured concentrations, measurements are taken until three concordant results are obtained (typically the first three results).
In order to measure the photodepletion of the IxOy molecules at 532 and 355 nm, a frequency-doubled or frequency-tripled Nd:YAG laser beam (Continuum Surelite 10-II, 1 cm−1 linewidth, 20 ns pulse width, ∼80 mJ pulse−1 cm−2 at 532 nm, and ∼50 mJ pulse−1 cm−2 at 355 nm) was passed across the flow tube, perpendicular to the main axis and near the sampling point. Experiments were carried out at 4–7 Torr. The pressure in the reactor was set by a throttle valve placed upstream of an Edwards 80 roots blower–oil rotary pump combination. The flows were set using calibrated MKS mass flow controllers and pressure was measured using a set of 10 and 1000 Torr MKS Baratron pressure transducers.
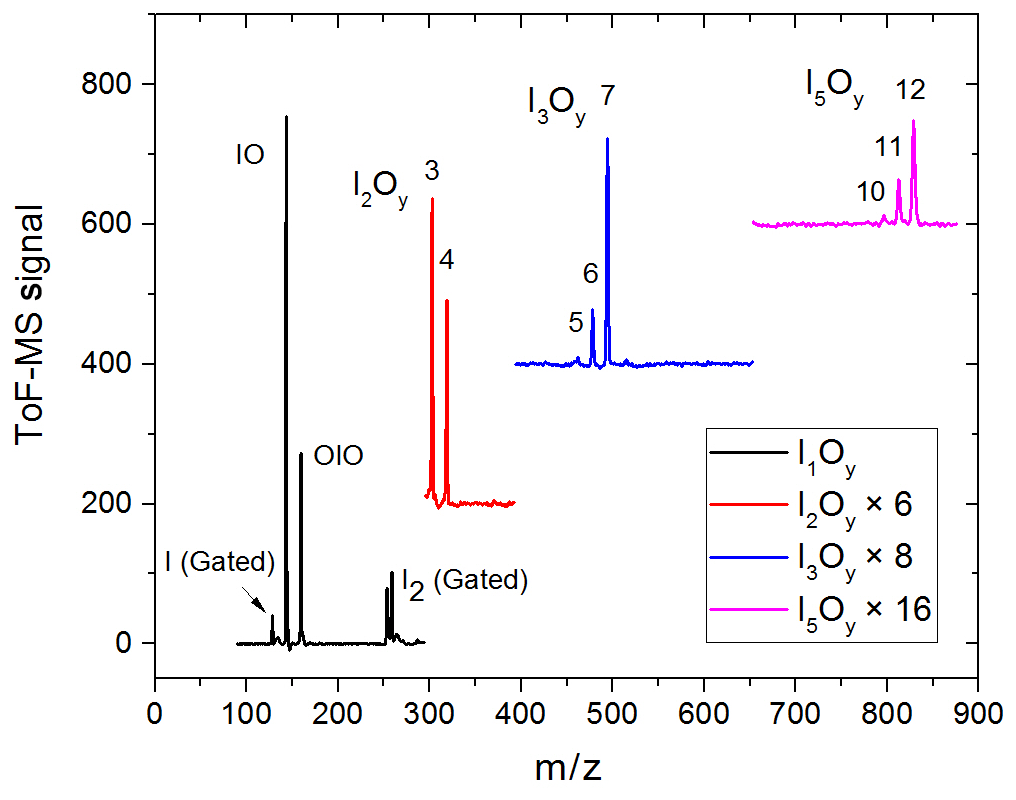
Figure 3Mass spectra in four different m∕z ranges encompassing peaks of species with one, two, three, and five iodine atoms. Some of the spectra are scaled and shifted for clarity. The mass spectra are generated by averaging the mass spectra at each time point over a 20 ms experiment comprising 20 individual time points.
The iodine oxides generated were sampled in situ from the irradiated volume through a pinhole (200 µm diameter) situated on axis into a Kore Technology photo-ionization time-of-flight mass spectrometer (PI-ToF-MS) described in detail elsewhere (Gómez Martín et al., 2016). Successful detection of IxOy by this method has been demonstrated elsewhere (Gómez Martín et al., 2013; Wei et al., 2017; Gómez Martín et al., 2020). The PI chamber of this instrument ( Torr) is fitted with view ports, allowing a pulsed laser beam to be directed through the high-density region of the sampled gas jet. Iodine oxides have ionization potentials in the range of 9–11 eV (Gómez Martín et al., 2013; Wei et al., 2017), which requires generation of a vacuum ultraviolet (VUV) laser ionization beam. This is achieved by tightly focusing the 355 nm output of a frequency-tripled Nd:YAG laser (Continuum Surelite 10-II pulse width 3–5 ns) in a cell filled with xenon, which produces VUV radiation by frequency tripling (118 nm, or equivalently 10.5 eV) (Kung et al., 1973; Mahon et al., 1979). The resulting positive ions are accelerated towards the ToF-MS by means of a continuous negative voltage. An electron photomultiplier detector coupled to a pre-amplifier outputs an analogue signal, which is registered by the digital oscilloscope (Picoscope 6000). A limitation of this method is that large signals (e.g. and I+) cause detector overload during a significant time span after the large peak has been registered. An analogue gating box is used to lessen these effects by sending a (∼400 ns wide) gating pulse to the ion extraction optics. Gating in this way removed > 90 % of the overloaded signal from and I+, significantly improving the signal-to-overload ratio.
Synchronization between the chemistry-initiating excimer laser pulse, the photolysis laser, the probing PI laser pulse, and the detection devices is provided by a computer-controlled delay generator (Quantum Composers, 9518). In this manner, the delay between PLP and PI can be varied in order to observe the kinetics of reactants and products and the photodepletion of the species of interest. The experiment repetition rate was set at 10 Hz, the optimal repetition rate for operation of both the VUV-generating PI YAG laser and the YAG laser used for photolysis of the iodine oxides. A LabView program built in-house provides a sequence of delays between the PLP and PI lasers which can be modified by the user via a graphical interface. Desired experimental parameters are input into the LabView program, including the number of pre-photolysis points, the number of experimental data, the duration of the experiment, and the number of repetitions. Each experiment results in a 3D dataset of signal intensity (proportional to concentration) vs. 248 nm photolysis–VUV photoionization delay time (kinetic profile or time trace) and time of flight (mass spectrum). Figure 3 shows mass spectra with the most prominent peaks obtained at different delay times. Mass-to-charge (m∕z) calibration of time of flight was performed by selecting a number of well-known prominent mass peaks (e.g. IO at , OIO at , I2O3 at , I2O4 at , and I3O7 at – Gómez Martín et al., 2013).
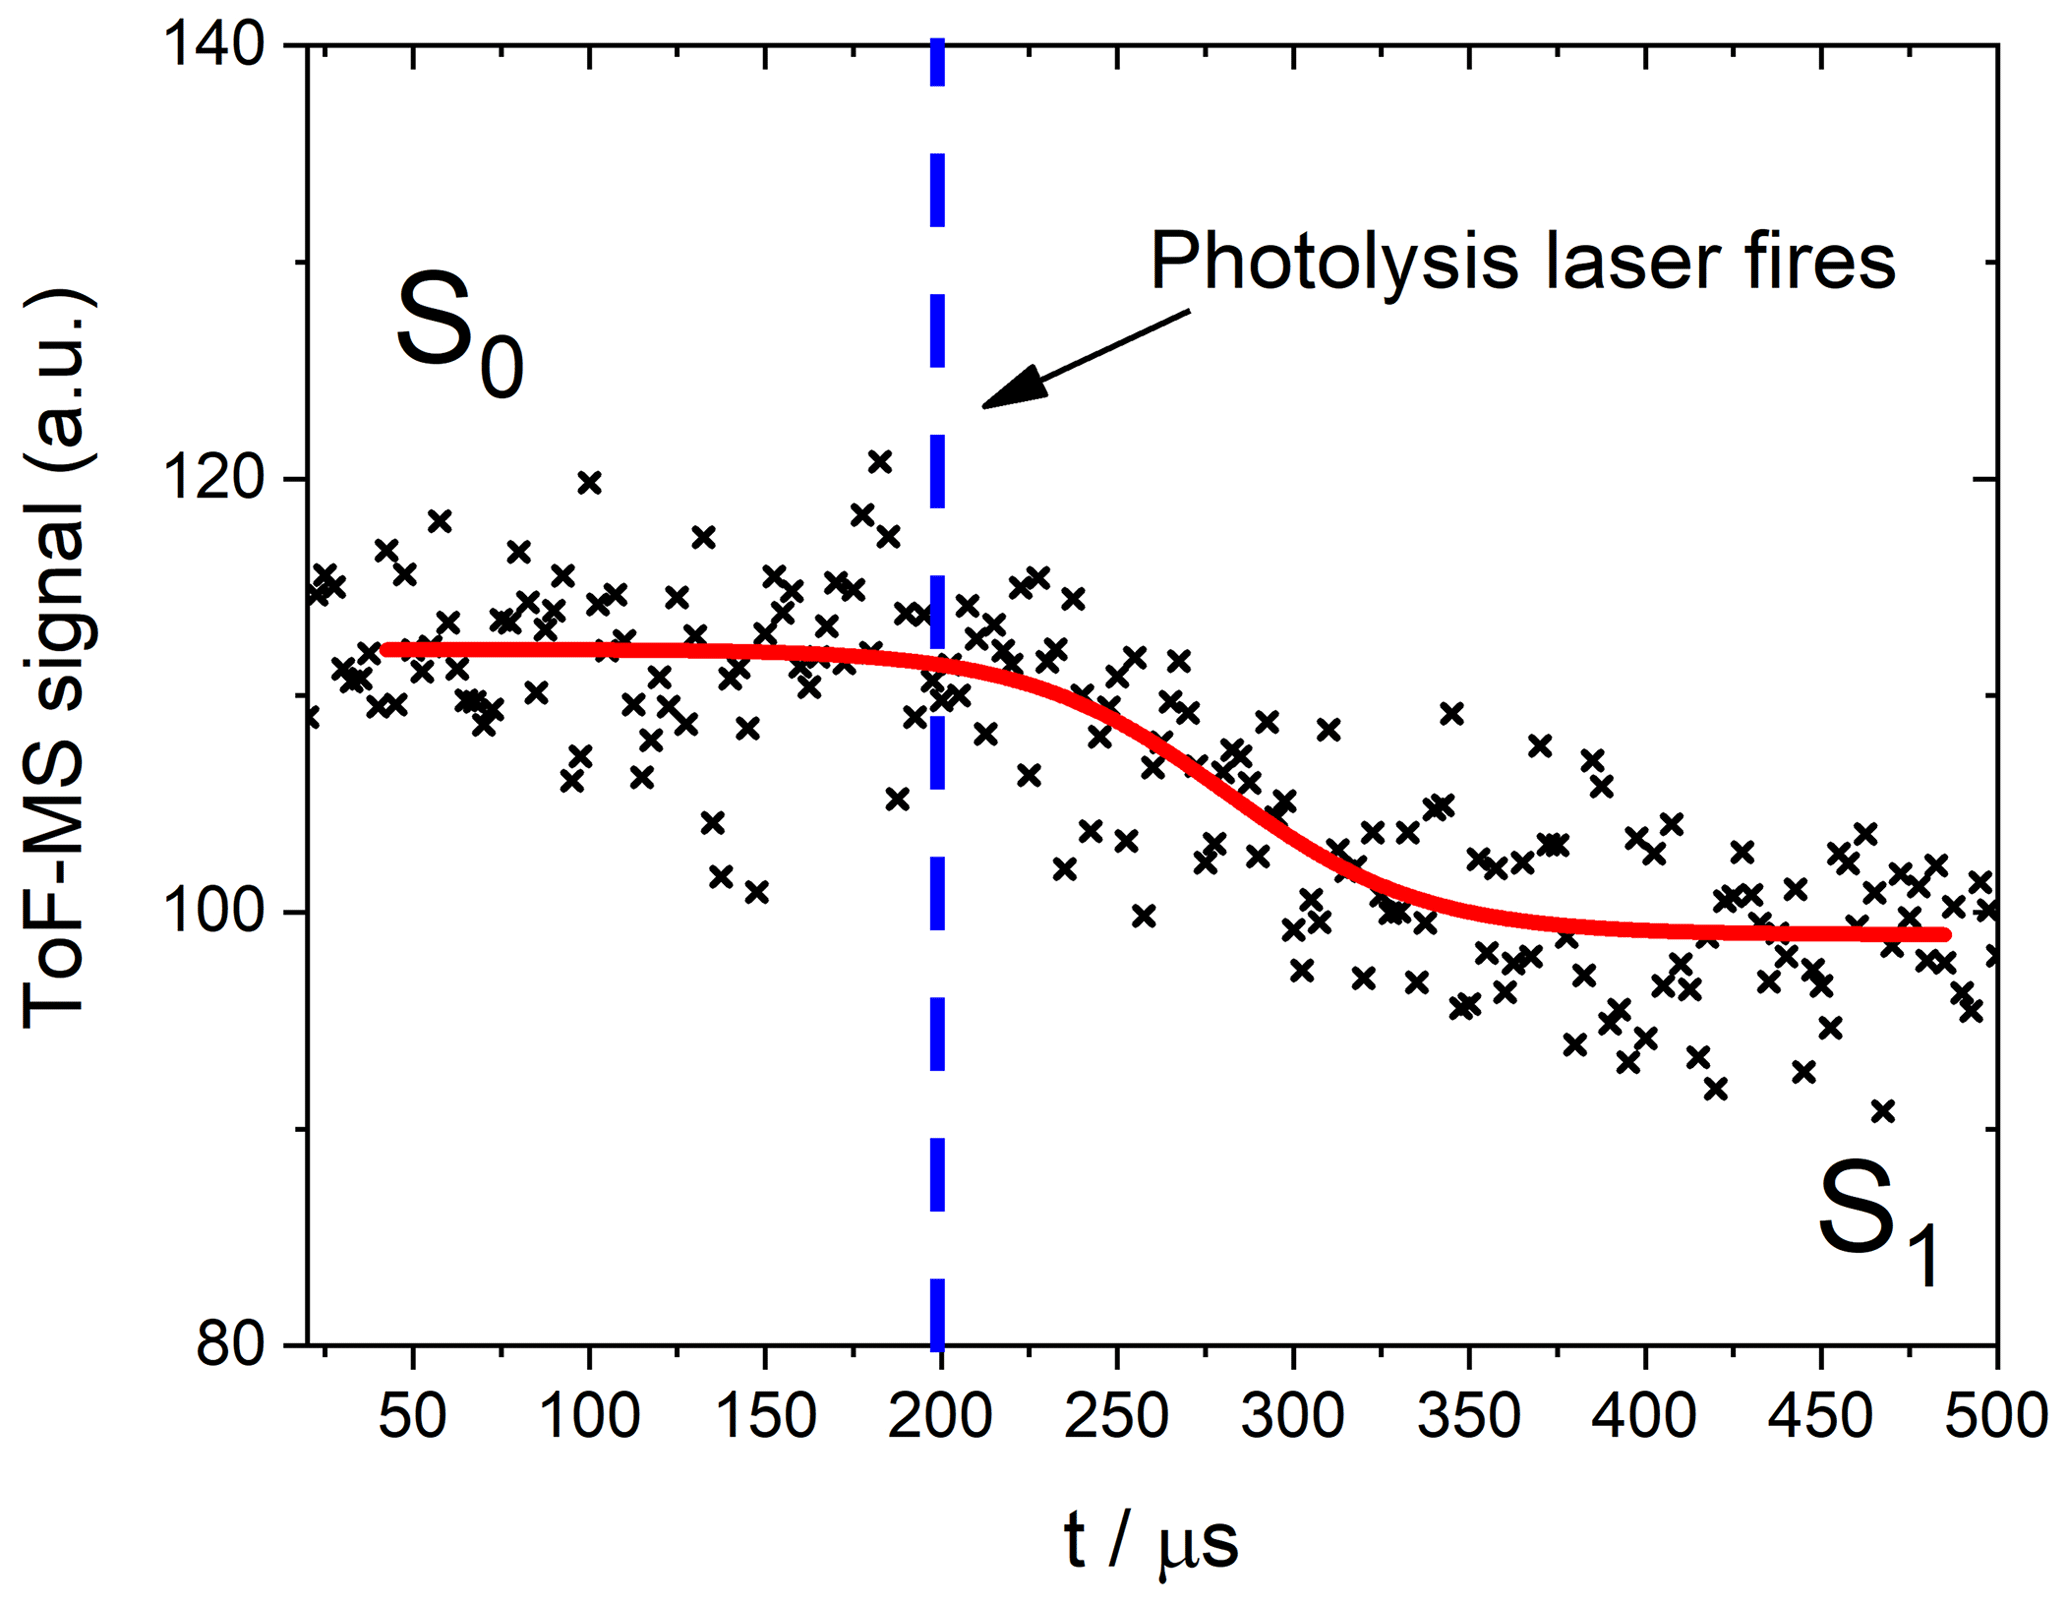
Figure 4Schematic of a photodepletion measurement of NO2. The red curve is an empirical fit through the data performed to obtain the values of S0 and S1.
To investigate the photodepletion of IxOy, it is desirable to keep the signal of the species of interest relatively constant over the delay window used to probe the photolysis. The timing of the Nd:YAG photolysis laser pulse was programmed to a fixed delay with respect to the 248 nm excimer pulse. To find the optimal window in which to conduct photolysis experiments, the reaction kinetics were first explored between 0 and ∼10 ms for different sets of conditions. It was important to generate a sufficiently high concentration of IxOy to obtain a good signal-to-noise ratio, but not so high that the growth/removal timescale was comparable to the observed photodepletion (∼400 µs).
The trace shown in Fig. 4, which is similar to all the traces obtained in this experiment, exhibits a delay between the pre- and post-photodepleted signals. This delay corresponds to an instrumental sampling time depending on the alignment of the lasers and the molecular masses of the bath gas and the sample species (Baeza-Romero et al., 2012). In the present experiments, it was necessary to leave a small gap (∼2 mm) between the photolysis volume and the sampling pinhole, so as to avoid hitting the skimmer cone with the laser. The diffusional exchange of molecules between the photodepleted volume and the un-photodepleted volume immediately before the pinhole blurs the onset of the photodepletion as it is measured by the ToF-MS. The values of S0 and S1 were obtained by empirically fitting the photodepletion trace to a sigmoidal function:
Fitting to this function ensures that the flat sections corresponding to the pre- and post-photodepletion concentrations (S0 and S1, respectively) are characterized in the precise regions outside of the aforementioned “blurred” zone. The parameters x and p are not of scientific importance for this study and are simply instrumental factors.
The photolysis laser depletes any analyte within the photolysis volume which exhibits a bound–unbound transition at the energy of the photolysis wavelength used for each experiment. The signals for a certain m∕z ratio before and after the photolysis laser is fired are, respectively, noted as S0 and S1 (Fig. 4). Absorption cross sections were then calculated by comparing the relative signal change (ζIxOy) for the analyte of interest to the relative signal change (ζREF) for a molecule with a well-studied spectrum in an analogous actinometric experiment using the same configuration and laser fluence. In this way, systematic errors arising from the beam energy and area are eliminated in the determination of the actinic flux F:
Similarly, for the target IxOy molecule we have the following:
Inserting Eq. (4) into Eq. (6), we have the following:
NO2 (99.5 %, BDH, 10 % in He) was the best reference molecule to perform actinometry at 355 nm. In this case, cm2 molec.−1 (Vandaele et al., 1998) and (Burkholder et al., 2015). Typically, NO2 depletion was around 8 % in the actinometric experiments. For the 532 nm photolysis experiments, OIO was chosen as the reference owing to the low sensitivity of its broad absorption bands to photolysis laser resolution, as opposed, for example, to I2. The use of I2 as an actinometer is also precluded by the overload issue mentioned above. The OIO absorption cross section at 532 nm is relatively well known, within 25 % of the average value of the four independent determinations reported in the literature (Bloss et al., 2001; Joseph et al., 2005; Spietz et al., 2005; Tucceri et al., 2006). On the other hand, conflicting results have been reported for the OIO photolysis quantum yield (Tucceri et al., 2006; Gómez Martín et al., 2009). Here we use the unit quantum yield reported by Gómez Martín et al. (2009), which was determined in a system free of interferences from ozone where a long-lived I atom photofragment and no reformation of OIO were observed over a timescale of several milliseconds. This result is also supported by the short lifetime (200 fs) of the excited state responsible for the observed absorption bands (Ashworth et al., 2002) and the existence of a feasible photolysis path revealed by high-level ab initio calculations (Peterson, 2010). Thus cm2 molec.−1 (Bloss et al., 2001; Spietz et al., 2005) and (Gómez Martín et al., 2009). In principle, Eq. (7) yields the photolysis cross section, i.e. the product , which is equal to the absorption cross section if . This is a reasonable assumption for broadband absorption spectra, indicating excitation to an unbound upper state. The photolysis processes in this study therefore do not depend on the nature and pressure of the carrier gas matrix, and the results can be applied directly in atmospheric models.
2.2 Ab initio calculations
The geometry of the ground electronic state of IO3, I2O3, I2O4, I3O6, and I3O7 was optimized by using the B3LYP functional combined with the standard 6-311+G(2d,p) triple-ζ basis set for O and H and an all-electron (AE) basis set for I (Glukhovtsev et al., 1995). The AE basis set is a contracted (15s12p6d)/[10s9p4d] 6-311G basis, the [5211111111, 411111111, 3111] contraction scheme supplemented by diffuse s and p functions, together with d and f polarization functions. See Glukhovtsev et al. (1995) for further details. Figure A1 illustrates the geometries of the various iodine oxides and hydroxy species that are discussed in Sect. 4. The corresponding molecular parameters (Cartesian coordinates, rotational constants, and vibrational frequencies) are listed in Appendix Table A1. Note that the ground states of some of these oxides have been studied at a higher level of theory elsewhere (Kaltsoyannis and Plane, 2008; Galvez et al., 2013).
The absorption cross sections of the aforementioned molecules were calculated using the time-dependent density functional (TD-DFT) excited states method (Stratmann et al., 1998) within the Gaussian 16 suite of programs (Frisch et al., 2016). The vertical excitation frequencies () and oscillator strengths (fi) were obtained for the first 30 excited states (Table A2–A4). The cross section at frequency was then computed using the GaussView program (Dennington et al., 2016):
The summation is over the 30 electronic excited states and is in units of cm2 molec.−1. Each peak is assumed to have a Gaussian band shape with a width Δ, set here to the default value (Dennington et al., 2016) of 0.4 eV. Although there are more advanced methods for the calculation of electronic spectra, TD-DFT offers a reasonable compromise between low computational cost and accuracy of the predicted transitions. Figure A2 shows a comparison between the experimental and TD-DFT absorption spectra of IO, OIO, and HOI. Note that although the TD-DFT method is not designed to predict ro-vibrational structure, the spectral positions of the electronic bands and the average absorption cross sections are in reasonable agreement with the experiment, even in the case of open-shell species like IO and OIO. Higher iodine oxides are closed-shell molecules and the accuracy of the transitions is expected to be similar to the result for HOI.
2.3 Photolysis rate calculations
In this study we employ the CAM-Chem (Community Atmospheric Model with Chemistry, version 4.0) global 3D model, included in the CESM framework (Community Earth System Model) (Lamarque et al., 2012), to estimate the photolysis rate (J) of the different IxOy species according to their computed absorption cross section, constrained by the experimental data at 532 and 355 nm. CAM-Chem has been configured with a 2.5∘ longitude by 1.9∘ latitude spatial resolution and 26 vertical levels (from the surface to up to 40 km). The model was run in the specified dynamics mode (Lamarque et al., 2012), using offline meteorological fields from a previous free-running climatic simulation (Fernandez et al., 2014; Saiz-Lopez et al., 2015).
CAM-Chem implements a state-of-the-art halogen chemistry scheme (Fernandez et al., 2014; Saiz-Lopez et al., 2014; Saiz-Lopez et al., 2015). This chemical scheme is fed by both organic and inorganic halogen emission sources (Ordóñez et al., 2012; MacDonald et al., 2014). Saiz-Lopez and co-workers (Saiz-Lopez et al., 2014, hereafter SL2014) conducted two sets of simulations without and with the photolysis of IxOy oxides in CAM-Chem to evaluate the range of inorganic iodine loading, partitioning, and impact in the troposphere. The photolysis of IxOy was based on the best available knowledge at that time on the major IxOy species (I2O2, I2O3, and I2O4) and their absorption cross sections (Gómez Martín et al., 2005; Gómez Martín et al., 2013). In this study we run photolysis simulations and compare the J values with the new cross sections to those in SL2014.
3.1 Photolysis at 355 nm
As described in the experimental section, kinetic profiles of the growth and removal of the target iodine oxide species shown in Fig. 3 were carried out in order to define the time periods with the most suitable kinetic profiles for photolysis measurements (Fig. 5). Fragmentation of iodine oxides was a significant problem in these experiments, as predicted from ionization energy calculations of larger iodine oxides to possible photofragments at 10.5 eV (Gómez Martín et al., 2020). High amounts of active iodine (IOx=I, IO) released from Reaction (R12) lead to fast formation of IxOy and particles. Under these conditions, at long times after the peak IO and OIO (∼3–5 ms), the observed signal of IO, OIO, and IxOy is contaminated by photofragmentation of higher-order iodine oxides. For this reason, great care needed to be taken to establish a time window for each species wherein higher oxides are not present, to ensure that any depletion in the mass spectrometric signal for each species is exclusively due to the removal of the species via photolysis (Fig. B1). Evidence of fragmentation comes in the form of a secondary growth in the signal seen for IO and OIO (Fig. 5). The delay between the excimer and the Nd:YAG photolysis laser was therefore carefully selected to coincide with a period of relatively constant signal of the desired analyte, typically a maximum for short-lived species, or a slow rise for larger reaction products of interest.
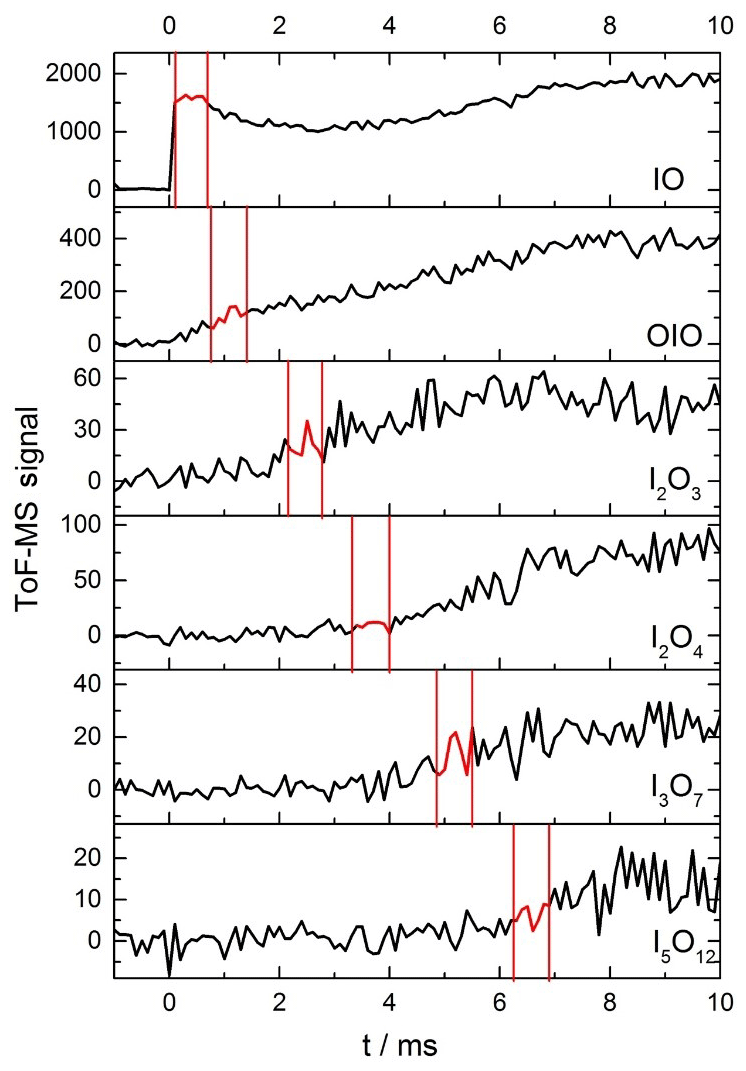
Figure 5Time traces of IO, OIO, I2O3, I2O4, I3O7, and I5O12 from −1 to 10 ms, at 1 ms intervals for a mixture of He (10 torr), O3, and I2 molec. cm−2 [I2] molec. cm−2) flash photolysed by an excimer pulse at t=0 (130 mJ pulse−1). The red sections highlighted for each species correspond to the optimal delay windows for photolysis of the corresponding species for this set of conditions.
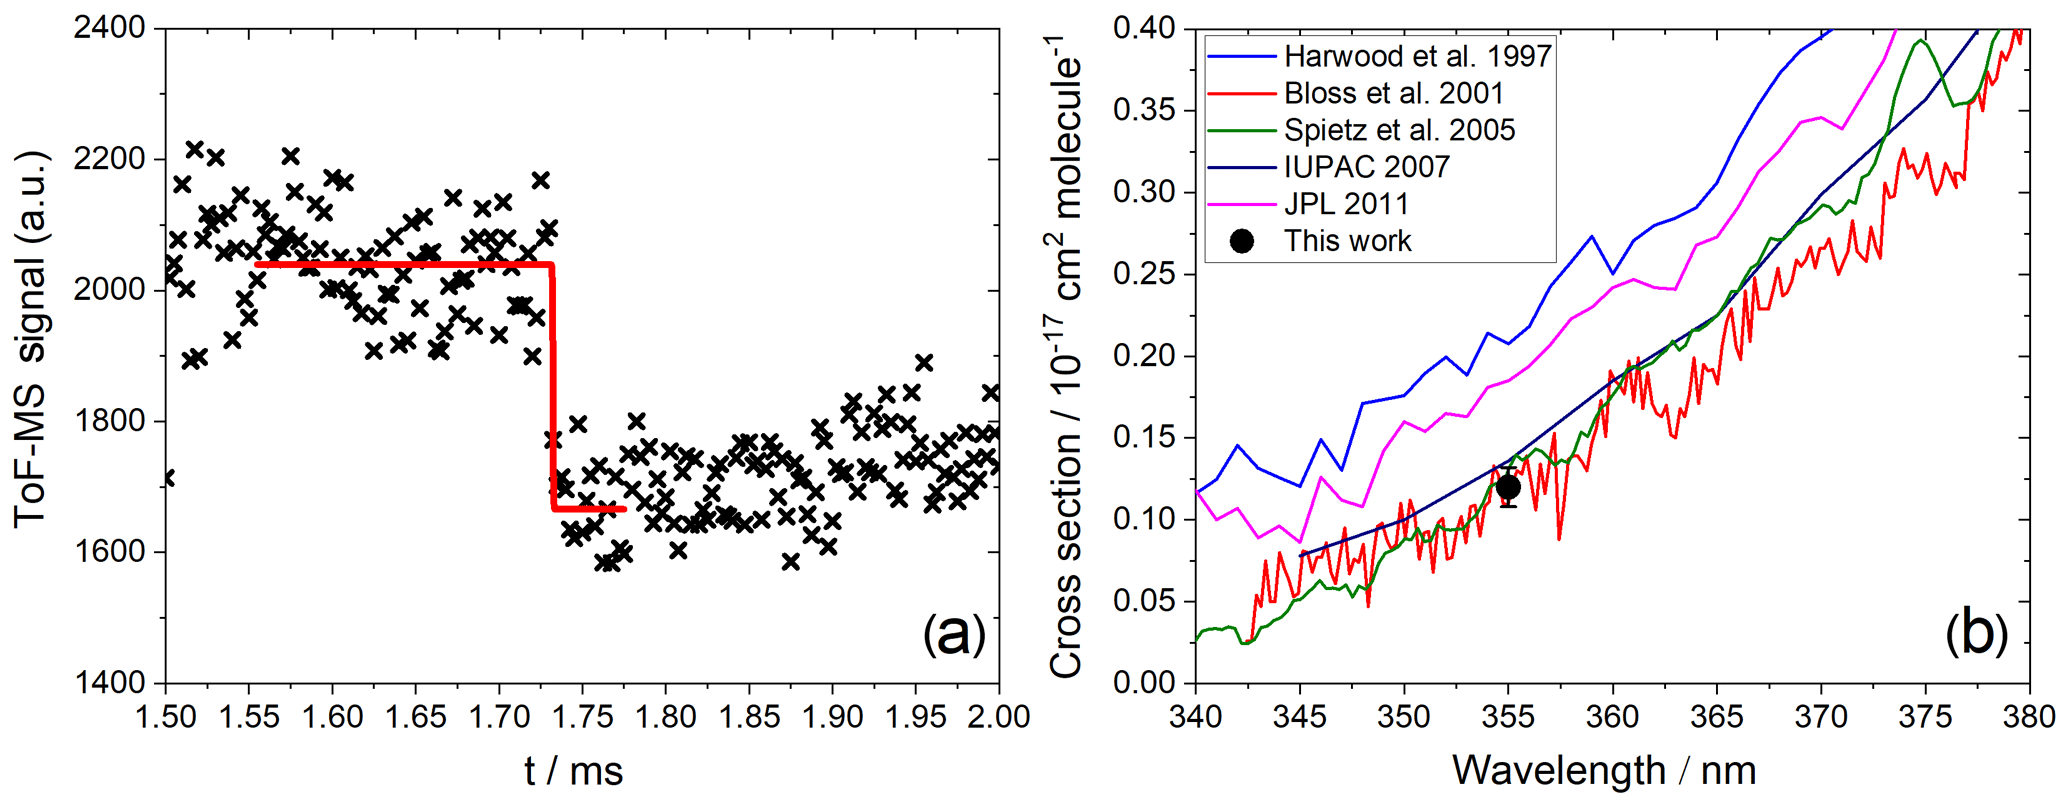
Figure 6(a) Measured photodepletion of IO (). (b) Comparison of a published absorption cross section with the absorption cross section at 355 nm determined in this work.
In the case of IO and OIO, the photolysis delay was selected based on the location of the maxima of their kinetic profiles. Typically, this was around 1 and 2 ms for IO and OIO, respectively. IO showed a clear depletion of ∼20 % at 355 nm (Fig. 6a) corresponding to a cross section of cm2 molec.−1 (based on an average of three measurements), in excellent agreement with the most recent determinations based on absorption spectroscopy (Bloss et al., 2001; Spietz et al., 2005), where the presence of an underlying absorption corresponding to a product of Reactions (R2), (R4), (R5), or (R6) was accounted for (Atkinson et al., 2007) (Fig. 6b). We consider the mutual consistency between our measurement and the most reliable determinations of the IO cross section at 355 nm to be a validation of our method for determining the absorption cross sections of IxOy species.
As expected, no significant depletion was observed for OIO, with an upper limit of cm2 molec.−1 based on the noise of the mass spectrometric signal at m∕z 159. No significant depletion was observed for I2O3 () at 355 nm (Fig. 7, top left), and an upper limit for the absorption cross section of cm2 molec.−1 was determined based on the average noise of the I2O3 signal. By contrast, I2O4 was depleted by 355 nm photolysis by ∼40 % (Fig. 7, top right), corresponding to a photolysis cross section of cm2 molec.−1 (based on an average of two measurements). The determined cross sections and upper limits at 355 nm are listed in Table 1.
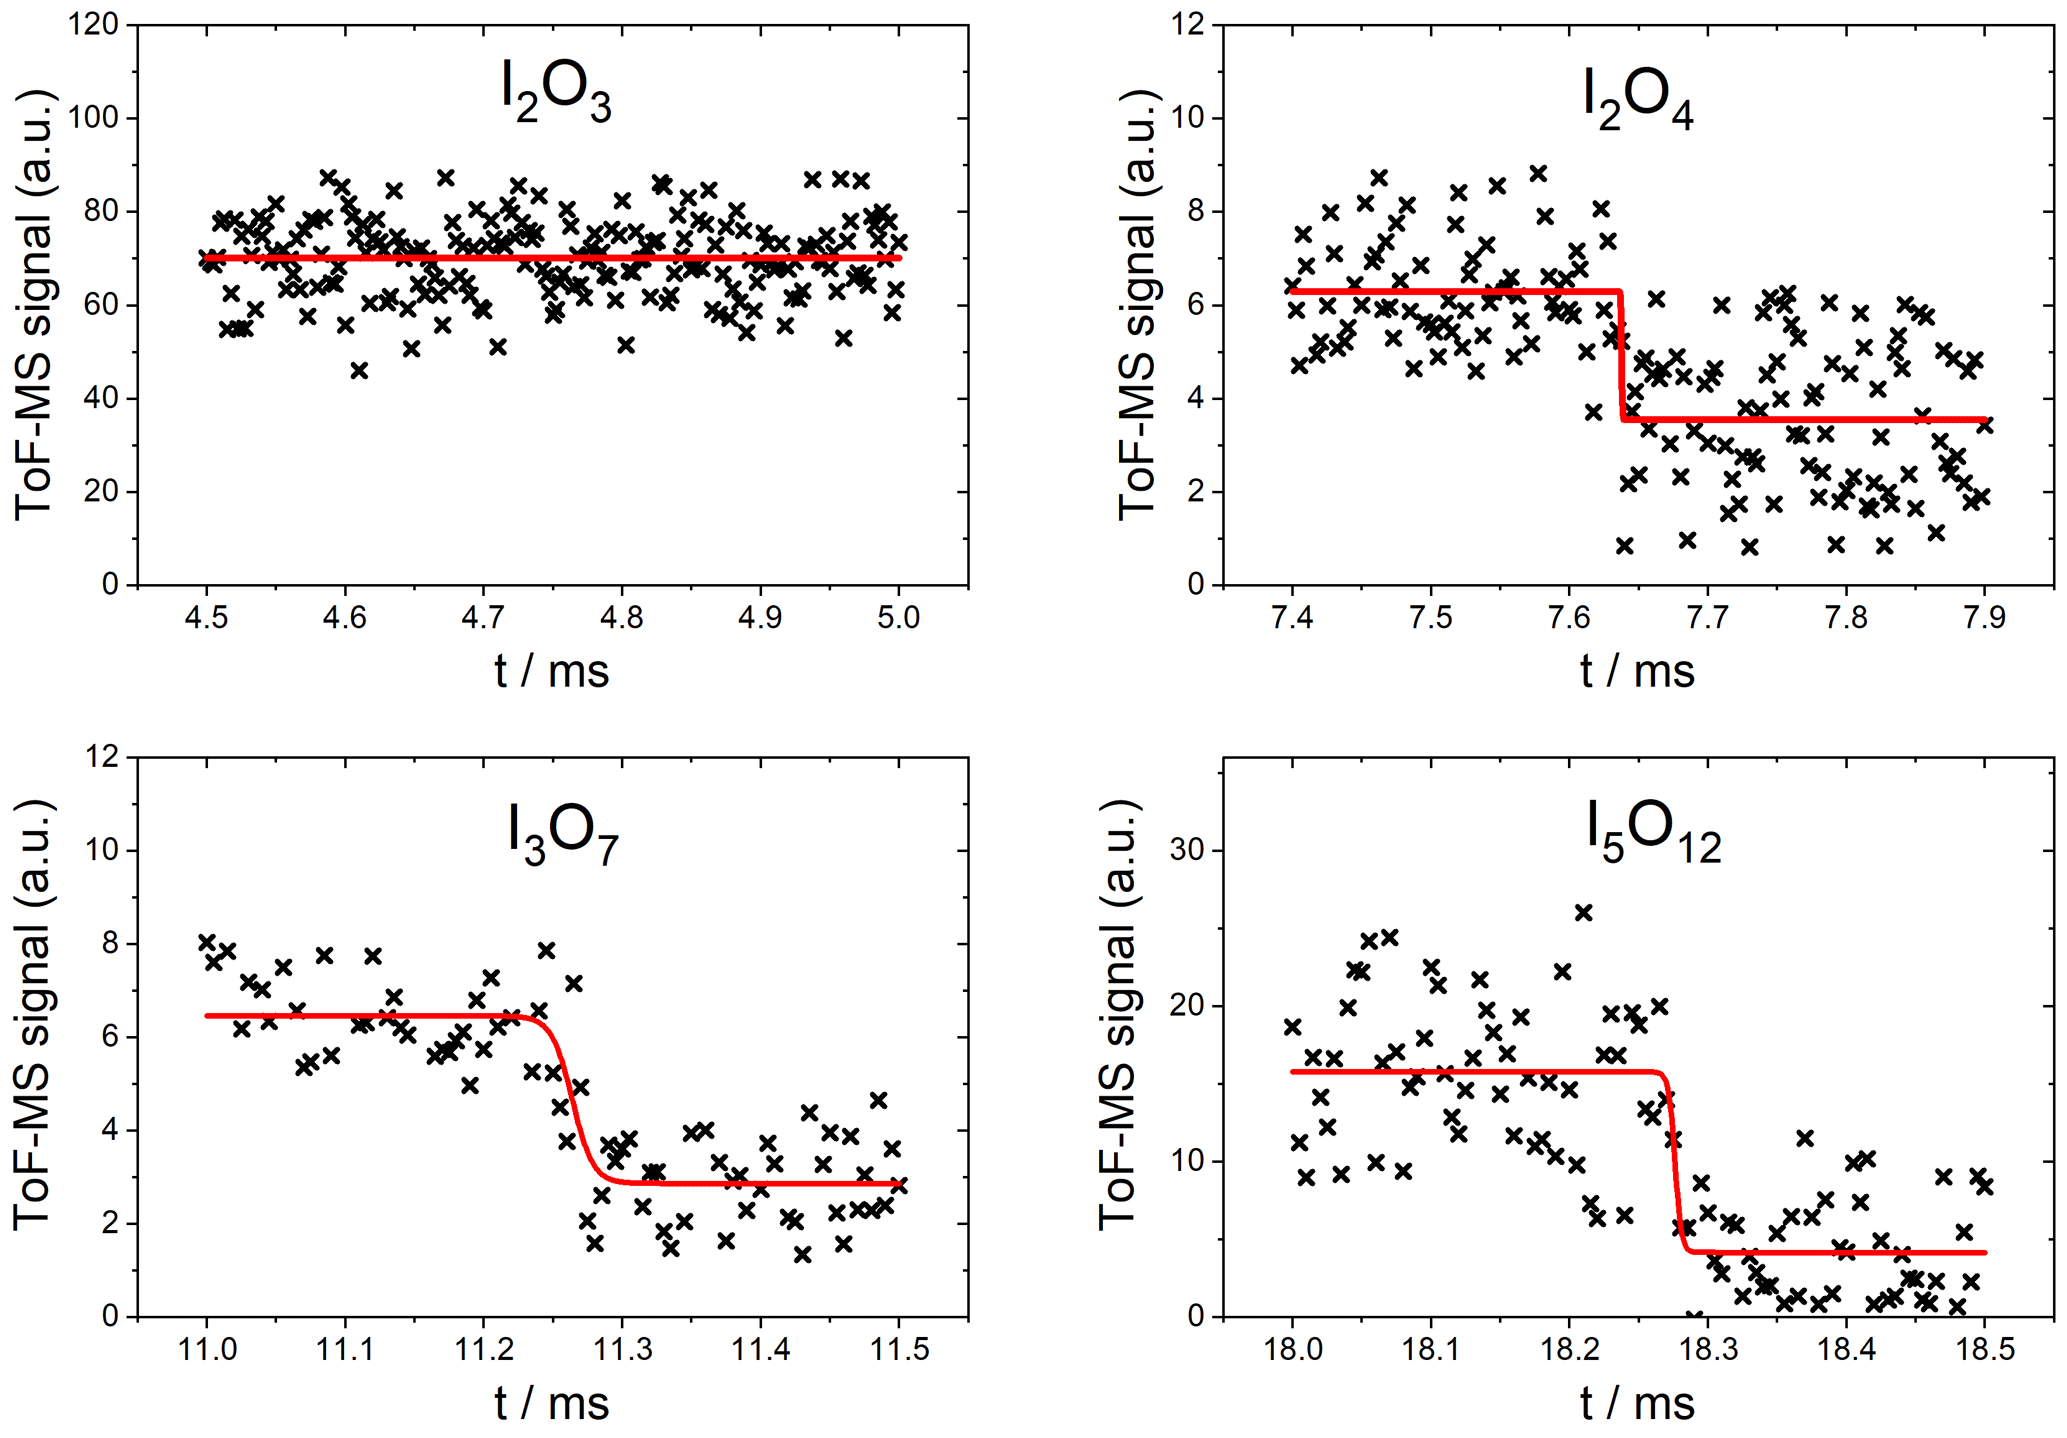
Figure 7Measured photodepletion at 355 nm of I2O3, I2O4, I3O7, and I5O12. The laser was triggered at 4.75 ms in the I2O3 experiment. The red line indicates the fit to Eq. (2).
Fragmentation precludes determination of photolysis products at 355 nm (channels of photochemical Reactions R9–R11) due to the fact that the signal arising from precursor ions (which may be 355 nm photolysis products) is indistinguishable from product ions resulting from fragmentation of higher oxides due to the 118 nm photoionization. For any given species, possible increases in signals corresponding to products of photolysis at 355 nm are offset by the decrease in the precursor ion concentration and therefore the product ion signal. As an example, consider I3O7 photolysis at 355 nm. The peaks of the possible photolysis products I2O3, I2O4, OIO, and IO (referred to here as photofragments) prior to photolysis will have contributions from the precursor ion signals of these species as well as product ion signals of I3Oy. Upon photolysis of I3O7, the concentration of I3O7 will decrease, causing a decrease in the precursor ion signal and therefore the product ion signals, resulting in turn in a net negative impact on the amplitude of all product ion signals. In addition to the decrease in product ion signals resulting from possible photofragment species, the precursor ion signal for the photolabile species (IO, I2O4 in this example) will decrease due to direct photolysis of these species. Concurrently with the decrease in the I3O7 precursor ion signal, there will be a positive contribution to some or all of the concentrations of possible photofragment precursor ion signals. It is impossible to separate these contributions to the net change in signal magnitude, and therefore the products of these photolysis processes cannot be determined.

Figure 8Measured photodepletion at 532 nm of OIO and I2O3. The laser was triggered at 4.5 ms in the I2O3 experiment.
As indicated by Reactions (R10b) and (R11b), IO3 () is a potential product of I2O3 and I2O4 photolysis. However, this species has never been observed in the gas phase. According to our ab initio calculations, the ionization potential of IO3 is 12.1 eV, which is higher than the photoionization energy employed in the present work (10.5 eV).
3.2 Photolysis at 532 nm
As expected (Gómez Martín et al., 2009), OIO shows strong depletion in the 532 nm photolysis experiments (Fig. 8), and it is therefore used as the actinometer at this wavelength. None of the higher-order iodine oxides showed measurable depletion above the noise (as an example the I2O3 trace is shown in Fig. 8). Table 2 lists the upper limits to the absorption cross sections of each species at 532 nm, determined from the signal-to-noise ratio of the recorded traces.
3.3 Ab initio spectra
The calculated spectra are displayed in Fig. 9 (I2O2, I2O3, and I2O4), Fig. 10 (I3O6 and I3O7), and Fig. 11 (IO3). Oscillator strengths of the electronic transitions that are responsible for the visible and UV absorptions are provided in Appendix A. The TD-DFT spectra were wavelength-shifted by applying a constant energy shift to get agreement with the experiment at 355 nm. The shifts are quite modest, within the expected error at this level of theory (Foresman and Frisch, 2015): I2O3 (30 kJ mol−1), I2O4 (−12 kJ mol−1), I3O6 (9.2 kJ mol−1), and I3O7 (−21 kJ mol−1). Applying a constant energy shift means assuming that all the excited state energies are offset by a constant amount with respect to the ground state.
Table 1Absorption cross sections of iodine oxides at 532 and 355 nm.
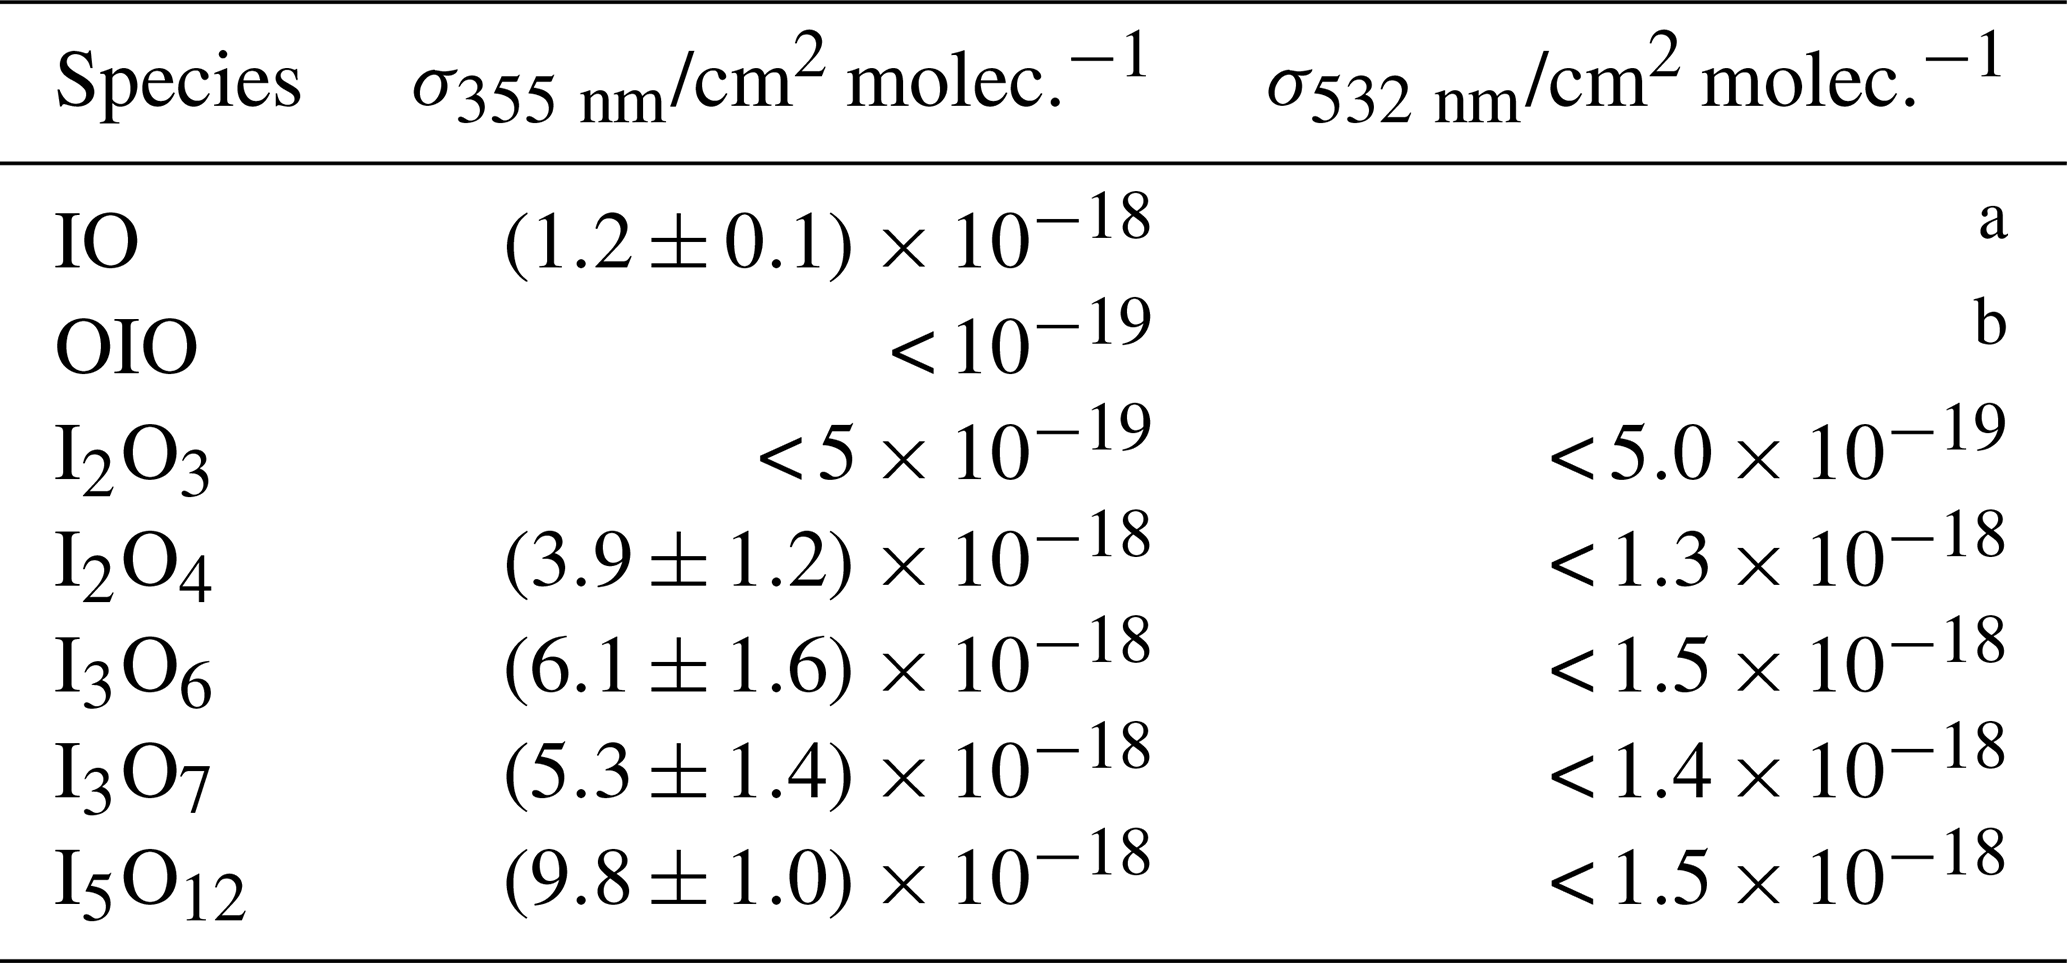
a The 0←0 band of IO is placed at 465.5 nm (Spietz et al., 2005), and therefore, there cannot be any band of ground state IO () at a longer wavelength. There is a hot band at ∼530 nm (0←4), but the state is not populated at room temperature in equilibrium. b Actinometer.
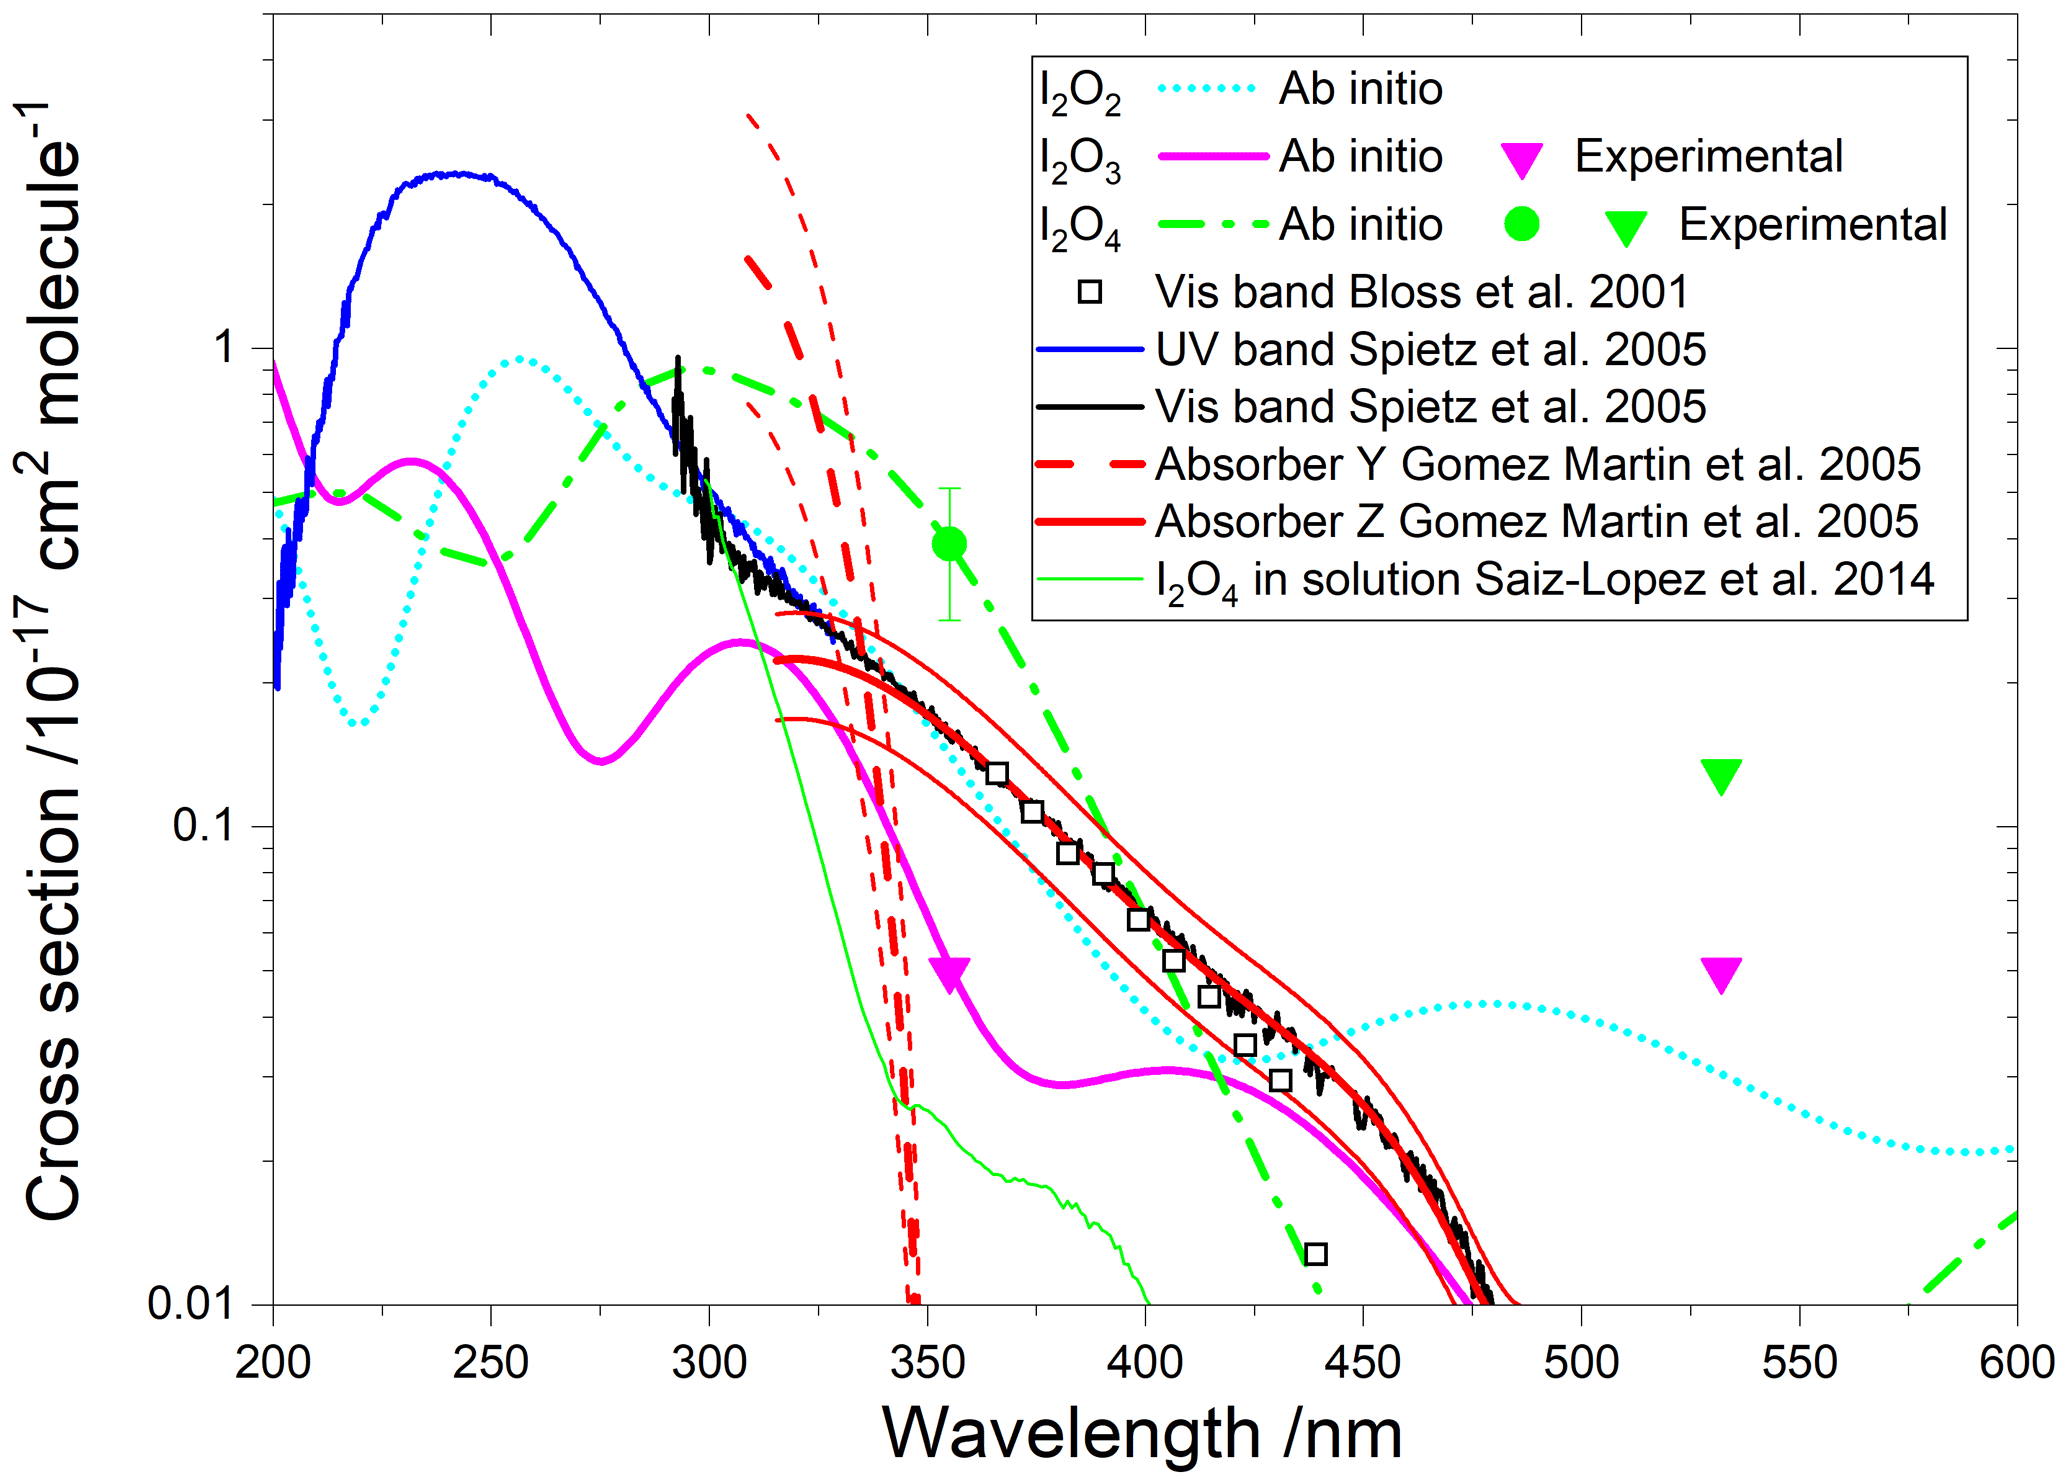
Figure 9Absorption cross sections of I2O2, I2O3, and I2O4. The cyan, pink, and green lines correspond to the respective ab initio spectra. The pink and green symbols indicate, respectively, the measured absorption cross sections of I2O3 and I2O4 (triangles indicate upper limits). The empty squares correspond to an absorption band reported by Bloss et al. (2001) in 8 nm interval averages for λ>362 nm. The blue and black lines correspond to absorption bands reported by Spietz et al. (2005). The latter was found to be a superposition of two absorptions with different kinetic behaviour, denoted Y (dashed red line) and Z (solid red line) (Gómez Martín et al., 2005). The thin red lines represent the uncertainties of these spectra, which mainly originate from the absolute absorption cross sections of Y and Z at 322 and 356 nm, respectively. A spectrum of I2O4 in solution is indicated in green (Saiz-Lopez et al., 2014).
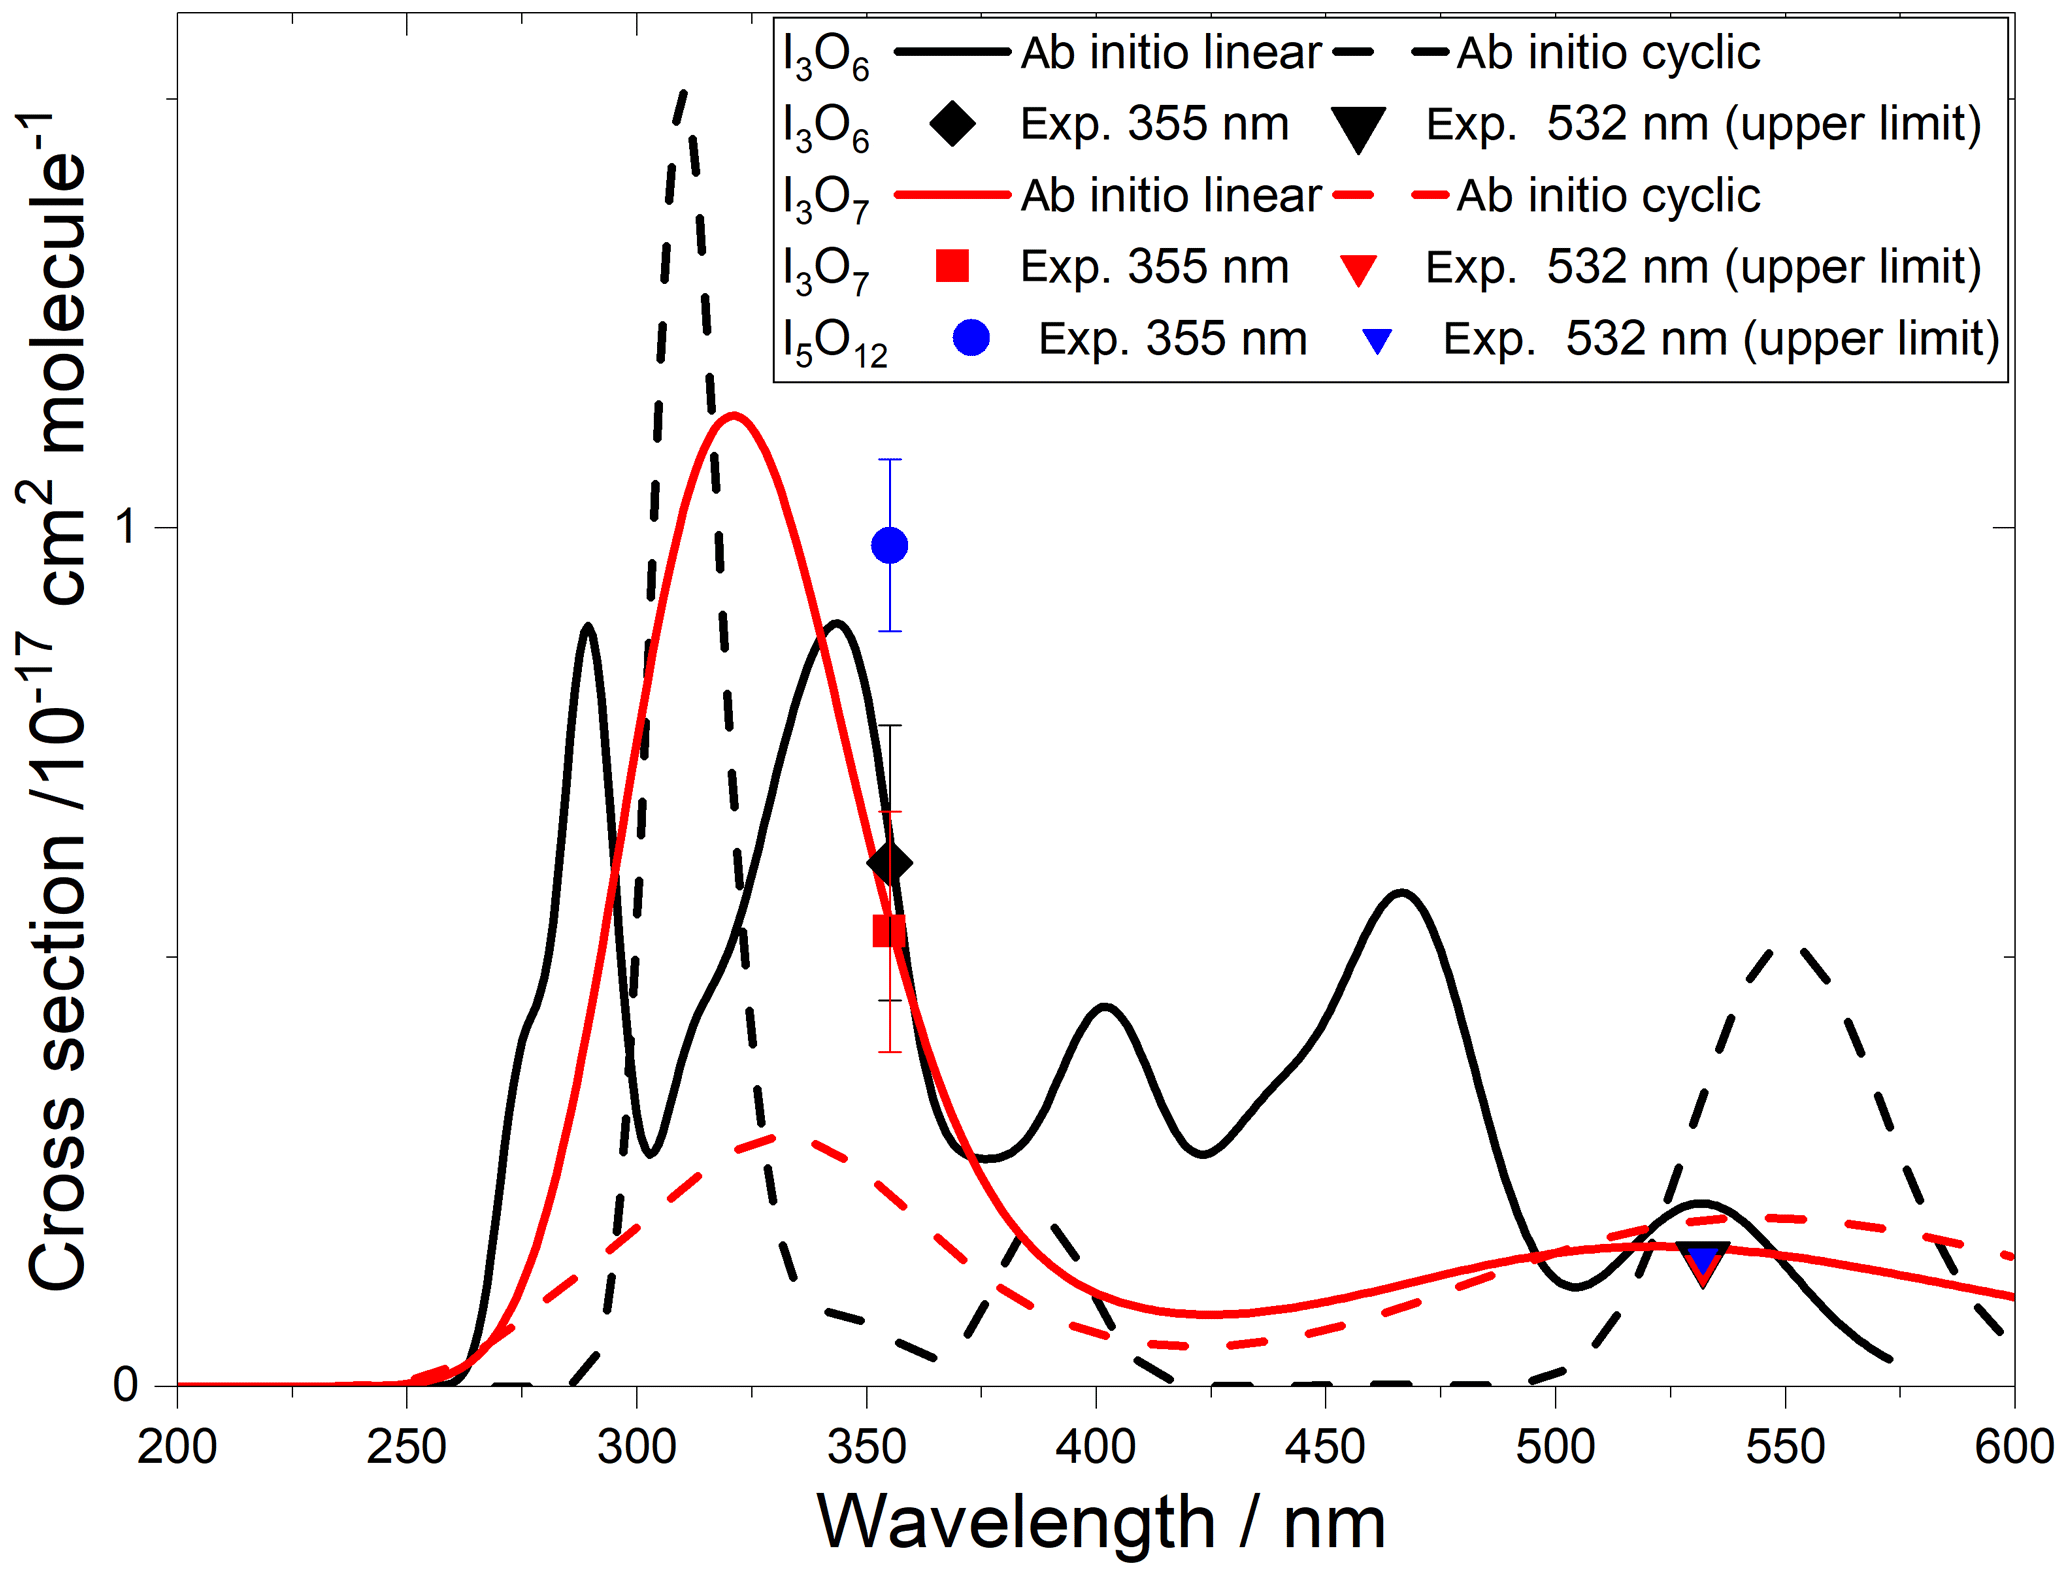
Figure 10Absorption cross-section spectra of I3O6 (black lines and symbols), I3O7 (red lines and symbols), and I5O12 (blue symbols). Ab initio spectra of linear and cyclic isomers are shown by solid and dashed lines, respectively.
4.1 Absorption spectra
A time-dependent broadband absorption was observed by Bloss et al. (2001) concurrently with the IO self-reaction decay, which was assigned to I2O2. The shape of the band was observed to be different for λ < 360 nm depending on the chemical scheme employed to generate iodine oxides. Later, a broadband absorption with a similar spectral slope was reported (Fig. 9) together with targeted UV measurements showing that the band peaks around 250 nm (Gómez Martín et al., 2005; Spietz et al., 2005). The kinetics of the absorption spectrum for λ> 310 nm were found to result from the overlap of at least two different species, one dominating the absorption below 340 nm (labelled Y) and another one dominating from 340 nm towards the visible (labelled Z). It was found that the kinetics of species Y was compatible with a product of the IO self-reaction, i.e. I2O2. By contrast, Z, which would be similar to the spectrum measured by Bloss et al. for λ>360 nm, was not compatible with a product of the IO self-reaction, and it was tentatively assigned to I2O3.
Gómez Martín et al. (2005) derived the cross section of the species Y and Z at 322 and 356 nm, respectively, using an iodine mass conservation approach where the depletion of the I2 precursor was balanced by the sum of atomic iodine contained in the oxides formed after the photolysis pulse. The cross sections were determined on a per iodine atom basis. Assuming absorbers with two iodine atoms, the spectra of Y and Z were scaled as shown in Fig. 9 (Saiz-Lopez et al., 2014). Since the spectra are featureless, they can be assumed to result from bound to free transitions, justifying a unit photolysis quantum yield of the molecules generating them.
The absorption cross sections determined in this work from photodepletion of I2O3 and I2O4 at 355 nm do not confirm the previous tentative assignment of absorber Z to I2O3. The cross section of I2O4 obtained from our photodepletion experiments is in better agreement with the absorber Z. Also, it appears that the spectrum of I2O4 in solution largely underestimates the gas-phase spectrum. The absorption of Z at 355 nm in Fig. 9 lies slightly below the I2O4 cross section determined in the present work, which is consistent with a contribution to Z of other IxOy species with x>2 (i.e. the scaling of the spectrum should be effectively higher than the factor of 2 used by Gómez Martín et al., 2005). In fact, the theoretical spectra of I2O4, I3O6, and I3O7 (Figs. 9 and 10) show similar shapes between 300 and 500 nm. It is very likely that the absorption band extending from 200 nm to nearly 500 nm (blue and black lines in Fig. 9) results from the overlap of absorptions corresponding to several IxOy species. Therefore, these experimental absorption spectra are not useful for photolysis rate calculations unless further deconvolution enables separation of the different contributions.
The calculated spectra shown in Figs. 9 and 10 agree generally well with the experimentally determined values at 355 and 532 nm after small wavelength shifts indicated above. As shown in Fig. 10, the upper limits from experiment are within 20 % of the theoretical calculations for linear I3O6 and I3O7. Note that theoretical absorption cross-section spectra for both the linear and cyclic forms (Fig. 5) of I3O6 and I3O7 are shown in Fig. 10. The linear forms of both species fit significantly better to the experimental values, suggesting the linear form is the one which is formed preferentially in these reactions.
4.2 Photolysis products
The likely photodissociation pathways of I2O3 and I2O4 can be elucidated by seeing how the geometry of each excited state relaxes after vertical excitation from the ground-state geometry using the TD-DFT method (see Sect. 2.2). In the case of I2O3, excitation in both the bands at 334 and 453 nm (Fig. 9) produces a pronounced extension of the I–IO3 bond, indicating photolysis leading to I+IO3 (Reaction R10b). For I2O4, excitation at 667 nm and in its strong band at 324 nm produces IO+IO3, whereas absorption in the weak band at 366 nm produces OIO+OIO.
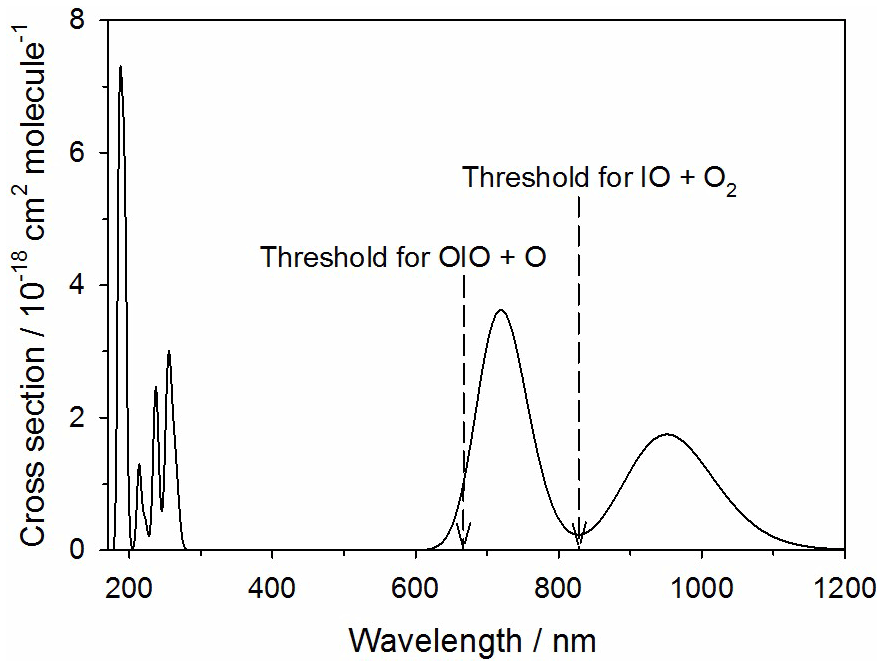
Figure 11Absorption spectrum of IO3 calculated at the TD/B3LYP/gen level of theory (see text for further details). The arrows indicate the energy thresholds for the two photodissociation pathways.
The theoretical absorption spectrum of IO3 is shown in Fig. 11, calculated at the same level of theory as described in Sect. 2.2. IO3 absorbs in the tropospheric solar actinic range in two near-IR bands centered at 710 and 950 nm. There are two possible photolysis pathways:
The first channel requires 180 kJ mol−1 to break the O2I–O bond (not including spin-orbit coupling), corresponding to a photolytic threshold of 665 nm. Reaction (R15b) is closely analogous to the photolysis of OIO in its band between 500 and 600 nm, where the I atom is squeezed out from between the two O atoms in a process that overall is actually exothermic because of the strength of the newly formed O2 bond (Gómez Martín et al., 2009). In the same way, Reaction (R15b) is exothermic by 78 kJ mol−1. However, there is a barrier of 145 kJ mol−1 involved in squeezing the IO out from between the two oxygen atoms. This corresponds to a photolytic threshold of 827 nm. Both of these thresholds are indicated in Fig. 11. This shows that absorption across the entire 710 nm band is sufficient for photolysis via Reaction (R15b) to occur. If that were the case, then J() could be as large as 0.15 s−1. Photolysis via Reaction (R15a) is just possible in the short wavelength tail of the 710 nm band, so J() could be as large as 0.007 s−1. It therefore seems likely that photolysis of IO3 is fast and mainly produces IO.

Figure 12Potential energy surface for the reaction between IO3 and HO2 to produce HIO3, calculated at the B3LYP/gen level of theory (see text for further details).
If, however, photolysis of IO3 is significantly slower than this upper limit, the molecule could persist in the atmosphere long enough to undergo reaction with other molecules. An intriguing possibility is that IO3 may be a source of HIO3. The reaction
is endothermic by 25 kJ mol−1 (14 kJ mol−1 according to previous work at a higher level of theory; Khanniche et al., 2017b) and so most likely does not occur. However, the reaction
is very exothermic, with a deep submerged barrier (Fig. 12). A Rice–Ramsperger–Kassel–Markus (RRKM) calculation using the MESMER program (Glowacki et al., 2012) with the molecular parameters in Table 1 indicates that the rate constant of Reaction (R17) is k (290 K) cm3 molec.−1 s−1. Given that [HO2] is typically 3×10⁸ molec. cm−3 at midday (Stone et al., 2012), IO3 could be converted to HIO3 with a reaction rate of ∼0.01 s−1, i.e. about 15 times slower than the upper limit to the photolysis rate discussed above. Reaction (R17) could therefore provide a route to HIO3 formation, and this should be the subject of future investigation.
4.3 Atmospheric implications
The theoretical spectra constrained with the measurements at 355 and 532 nm have been implemented in CAM-Chem in order to calculate photolysis rates for I2Oy () and I3O7. Having anchored the theoretical absorption spectra at 355 nm, we then assume that photolysis is possible up to the dissociation limit (which is the case for all the transitions of the IxOy (x>1) molecules). A conservative estimate is a factor of 2 uncertainty in the J values for these molecules. The main changes with respect to SL2014 are the following:
- i.
The new I2O2 cross sections are lower in the UV than those of the absorber Y used in SL2014 (Fig. 9) and extend over a wider range of the actinic range.
- ii.
I2O3 and I2O4 have, respectively, lower and higher absorption cross sections than in SL2014 as a result of replacing the absorption Z and the I2O4 spectrum in solution in favour of theoretical spectra constrained with experimental values. The cross section of I2O3 is lower, but only by a factor of ∼2 in the important region between 350 and 450 nm. The cross sections of I2O4 increase by 1 order of magnitude with respect to the spectrum in solution.
- iii.
Higher iodine oxides like I3O7 and I5O12 not included in SL2014 also photolyse. They show bands in the green part of the spectrum (Fig. 10) and therefore have higher photolysis rates than I2O4.
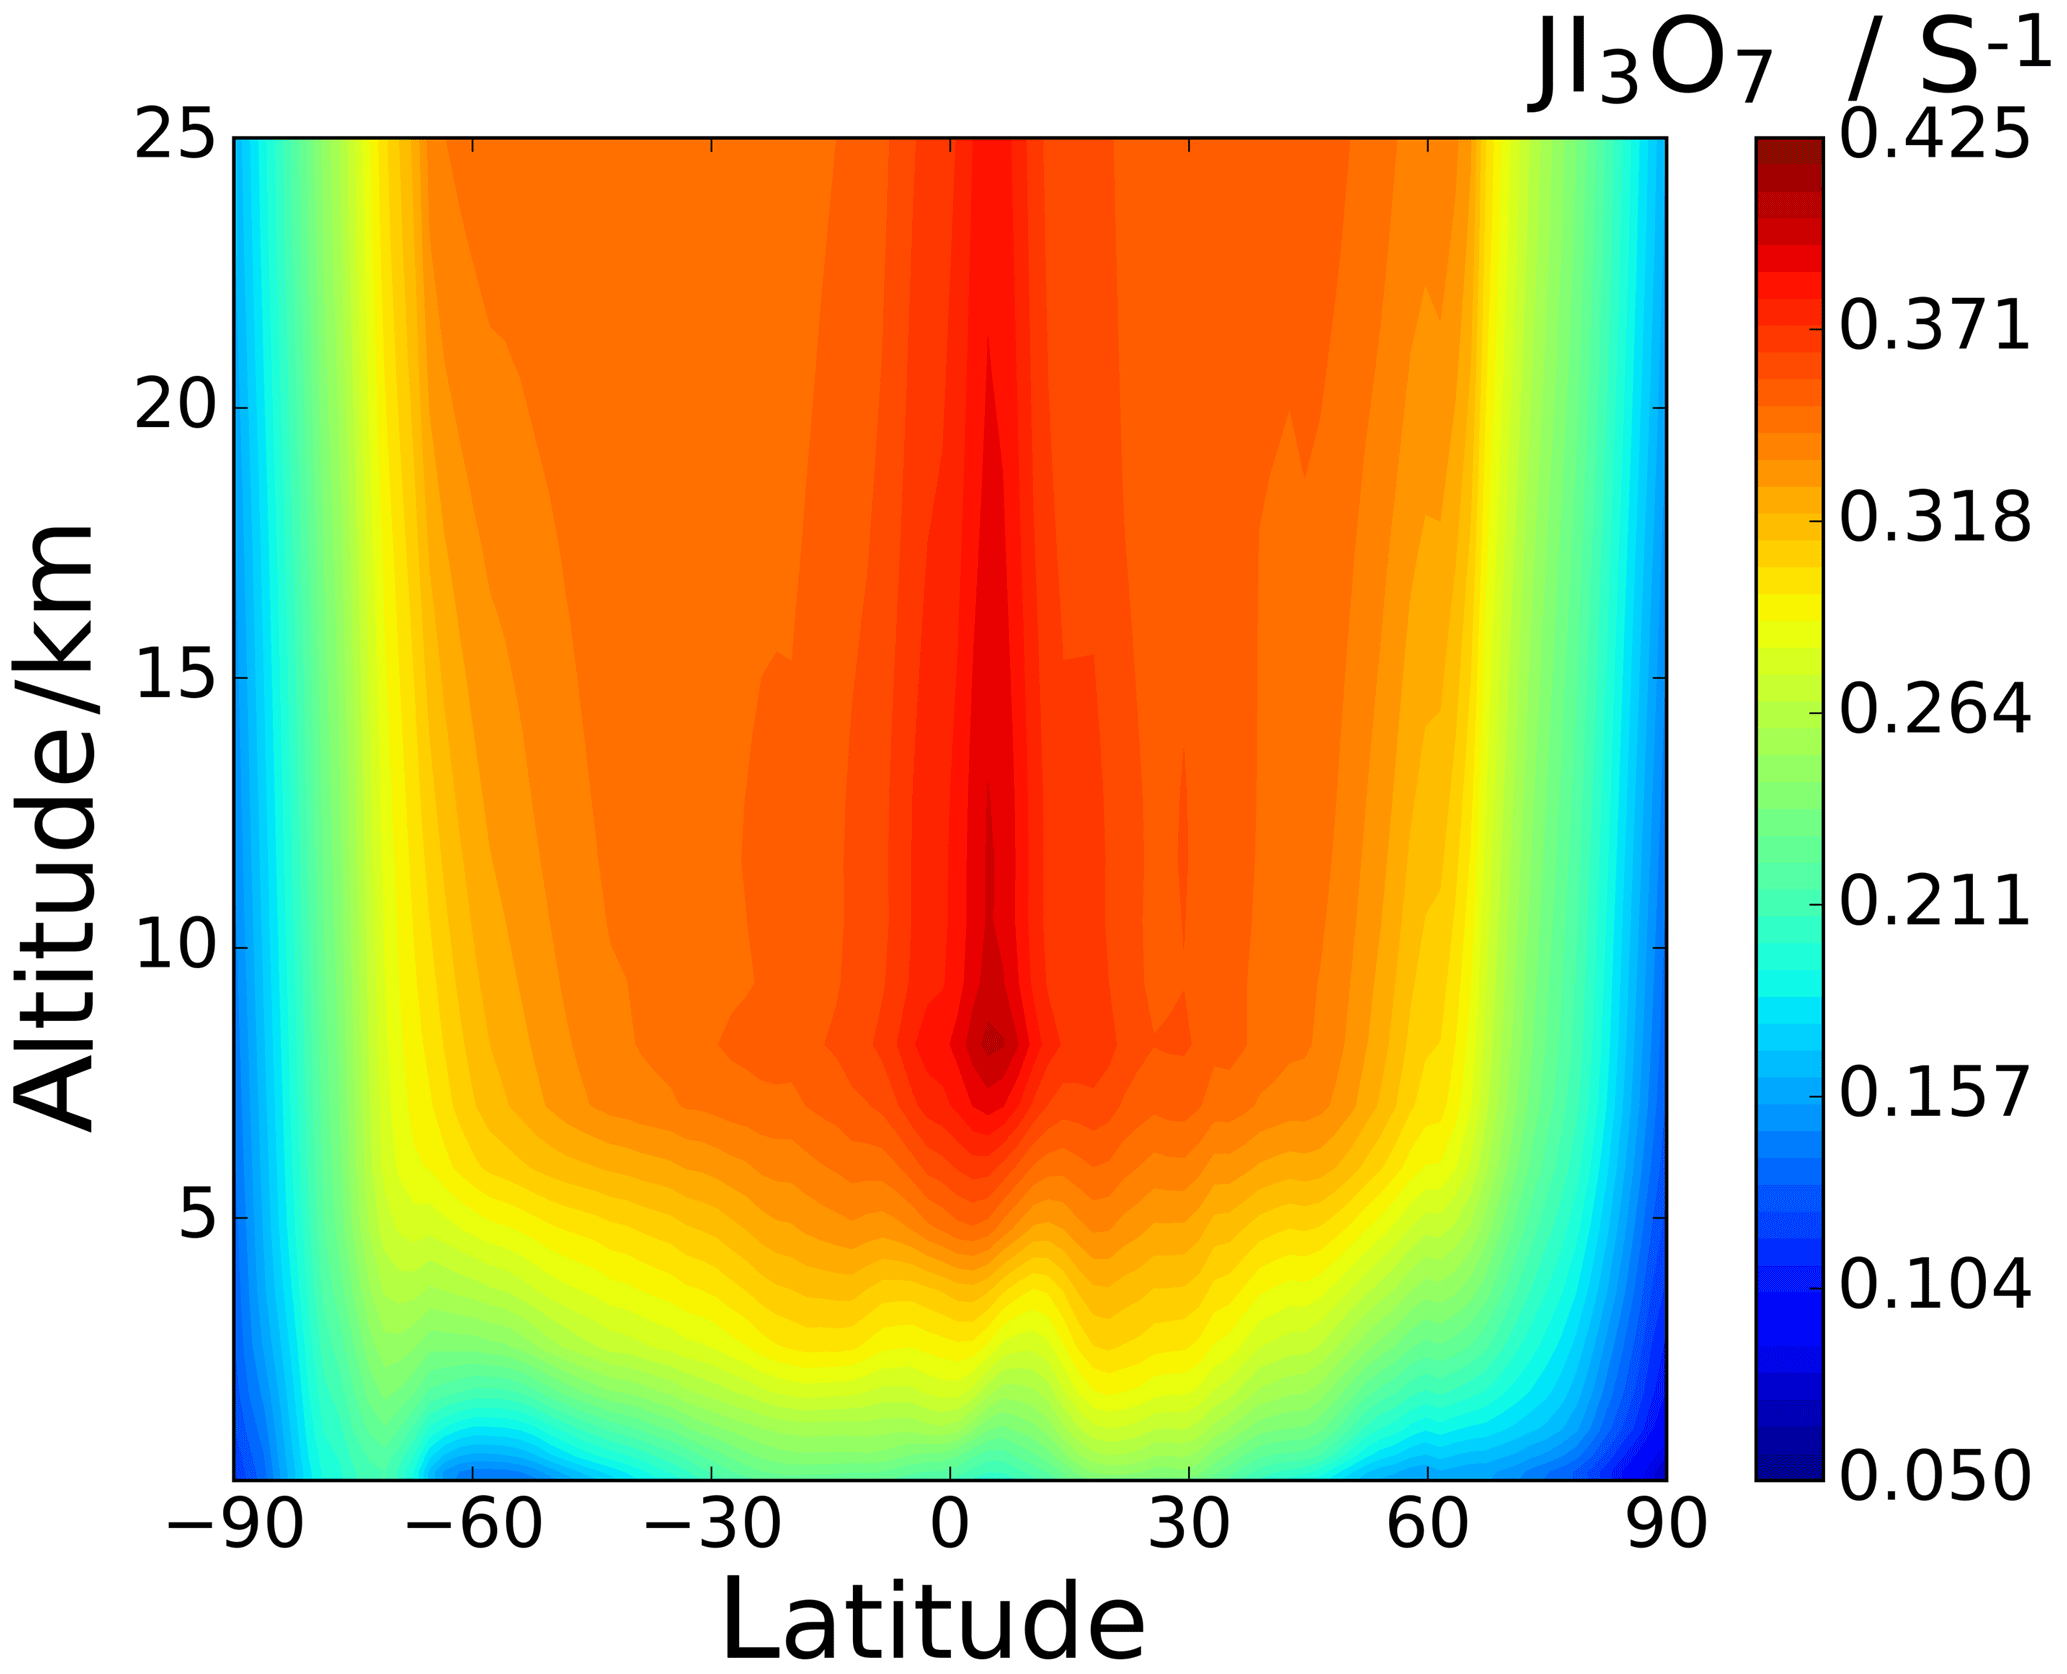
Annual zonal-average photolysis rate plots are shown in Figs. 13 and 14. Surface atmospheric photolysis of all the IxOy species is generally fastest between 30 and −30∘ latitude, displaying slight minima at 5 and −5∘ latitude due to attenuation of actinic flux by cloud cover at the intertropical convergence zone. Average IxOy global J values in the upper troposphere exhibit a maximum around 5∘ latitude, where solar flux is highest. At 5∘ latitude, I2O2 and I2O4 J values are largest at an altitude of 8 km. Similarly, the J values for I2O3 and I3O7 at 5∘ latitude are highest at 8 km and then remain relatively constant above 20 km. In contrast with J values for IxOy at 5∘ latitude, values at mid latitudes increase with altitude, showing no maxima at 8 km. The observed increase in J values at 8 km is explained by the albedo effect of cloud cover in certain regions, particularly the intertropical convergence zone, contributing to the total (incident + reflected) solar flux in these regions.
Figure 13d–f show the percentage difference between the SL2014 J values and those calculated in this study. As a result of the new I2O2 cross sections extending across the actinic window, this species shows an increase in J values at all latitudes, with the largest increases seen at the poles (∼300 % increase) and lower increases of around 100 % near the Equator. I2O3 shows a uniform decrease of around 46 % across all latitudes and altitudes, as expected from the approximately uniform decrease in the new spectrum with respect to absorber Z, which was taken as I2O3 in SL2014. I2O4 exhibits the largest increase in J values across all latitudes, ranging from 750 % at 40 km between −30 and 30∘ latitude up to increases above 1000 % at the poles. Photolytic lifetimes of IxOy species in the troposphere vary from a few seconds for the most photolabile species, i.e. I3O7, to several minutes for I2O3, which has the smallest absorption cross sections in the actinic region and the smallest J values of the species in this study. Mid and high latitudes exhibit particularly low J surface values and encompass many coastal regions where active iodine concentrations are high and iodine-driven particle formation has been reported (Saiz-Lopez et al., 2012b).
Photolysis of higher iodine oxides (Reactions R9–R11) competes with gas-to-particle formation (R7) and recycles IOx, which participates in ozone-depleting cycles (e.g. R1–R3). Therefore, higher J values at the surface tend to hinder particle formation and enhance ozone depletion. The new spectra result in decreased photolysis lifetimes of I2O2 (factor of ∼3) and I2O4 (factor of ∼10) and indicate that photolysis of nascent iodine clusters such as I3O7 and I5O12 may further slow down particle formation. On the other hand, the lifetime of I2O3 is approximately doubled, which increases the chances of participating in other reactions, including clustering with other IxOy. Whether this may balance the decrease in the photolysis lifetimes of other species or not remains to be studied in future work. I2O3 is believed to be an important iodine reservoir and key intermediate in the formation of new particles (Gómez Martín et al., 2013; Saiz-Lopez et al., 2014), but there is a substantial lack of mechanistic information about iodine oxides and how they may convert (or not) into HIO3.
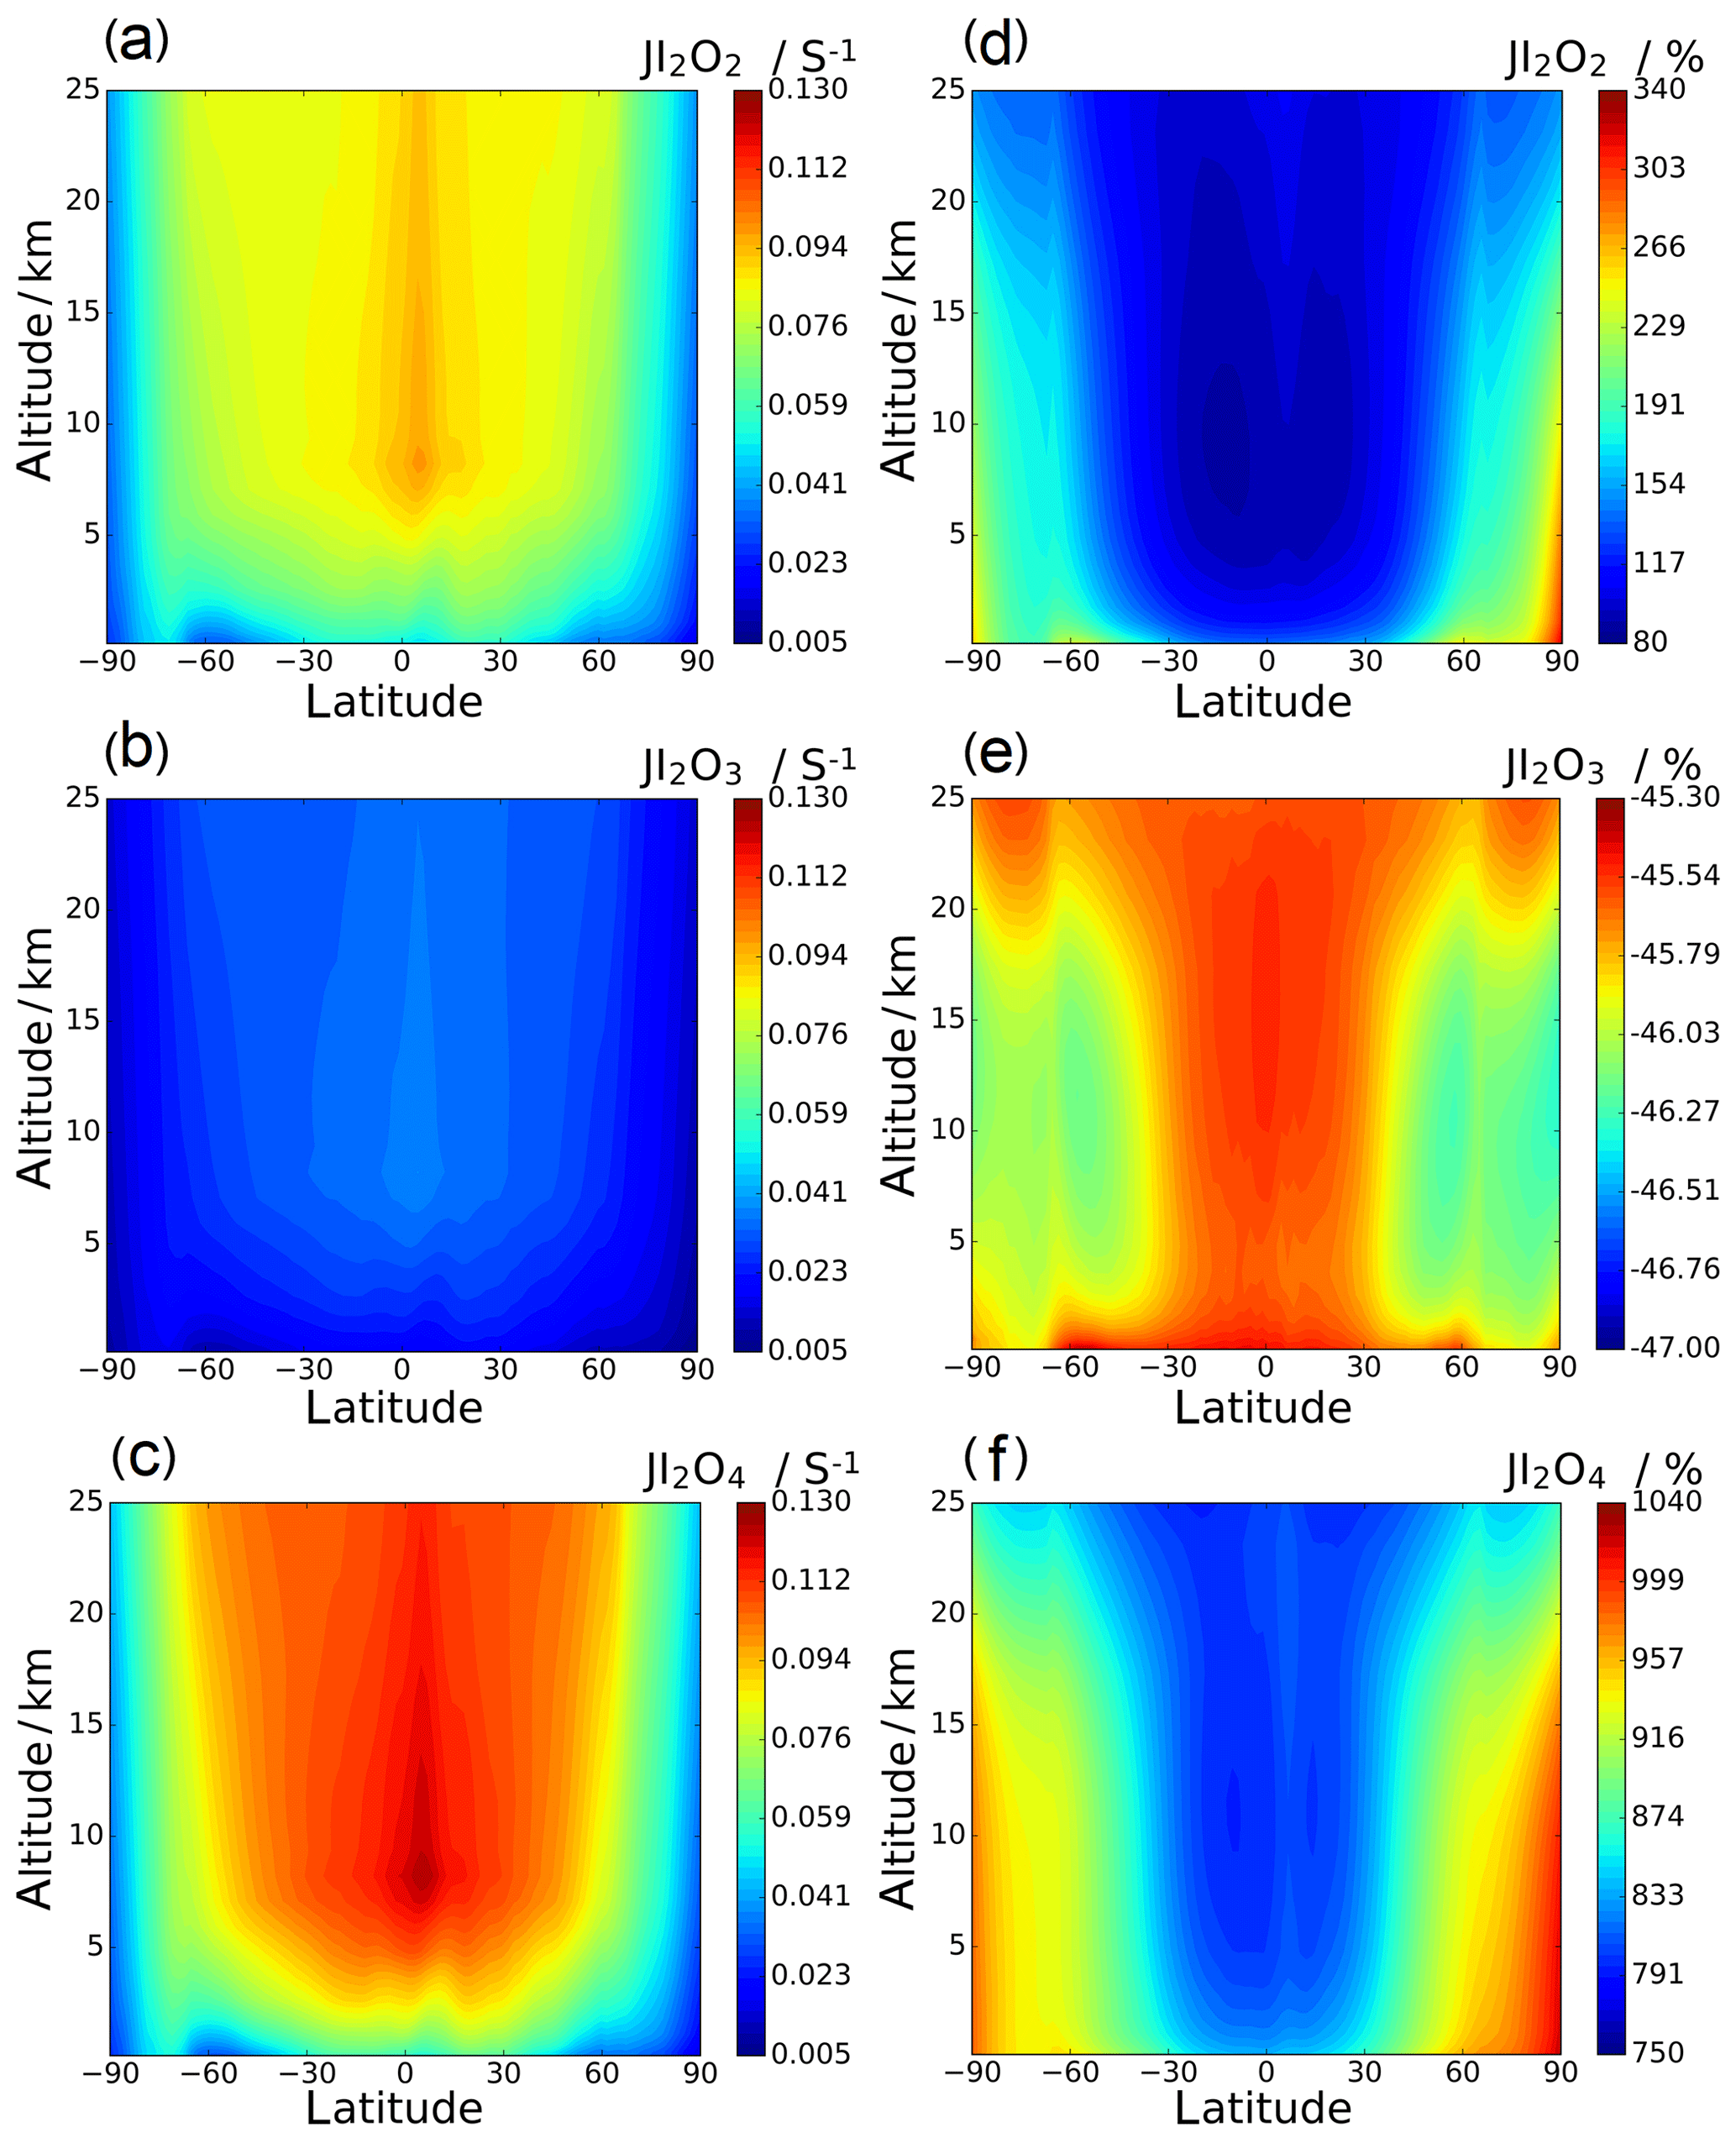
Figure 13Annual zonal-average J value vertical profiles for I2O2, I2O3, and I2O4 (a, b, and c, respectively; note that the colour scale is the same for these three panels) and the percentage change between the SL2014 annual zonal-average J value vertical profiles and the profiles in this study (d, e, and f, respectively).
Another active iodine chemistry region is the tropical upper troposphere–lower stratosphere region (UTLS), where significant concentrations of iodine exist (Koenig et al., 2020) as a result of strong convection carrying iodine precursors emitted at the ocean surface (mainly CH3I). The effect of the new spectra on the J values in this region is similar to the effect at the surface, although the changes are less pronounced. In the UTLS, IxOy molecules play the role of iodine reservoirs and, as a result of the enhanced actinic flux (see J maxima between 8 and 17 km around the Equator in Figs. 12 and 13), their photolysis has a significant impact on ozone depletion in this climatically sensitive region (Saiz-Lopez et al., 2012a). Iodine recycling in aerosol is believed to play an important role in explaining observed concentrations of gas-phase IOx (Koenig et al., 2020). The form in which gas-phase iodine (oxides, oxyacids, or nitrate) is taken up in sulfate aerosol may also determine the extent to which iodine can return to the gas phase.
To investigate with more detail the effect of the new spectra on particle formation, iodine speciation in aerosol, and ozone depletion, the iodine chemistry scheme in CAM-Chem needs to be expanded to include the photolysis products and yields of IxOy photolysis reactions as well as the reactions of the possible photoproducts, which are poorly known. New laboratory and theoretical work is required to solve these uncertainties. The mechanism of iodine oxide particle (IOP) formation remains controversial, with two possible pathways proposed via IxOy and HIO3. Work on the IOP formation mechanism conducted in the course of this research has been published elsewhere (Gómez Martín et al., 2020). Future laboratory measurements of IxOy spectra and kinetics may benefit from a multiplexed approach where tuneable photoionization mass spectrometry, absorption spectroscopy, and multi-wavelength laser photodepletion are used concurrently. A follow-up modelling study will be conducted with an updated mechanism for atmospheric iodine chemistry, including the photochemistry outlined in this paper, as well as a chemical scheme for IOP formation.
The photodepletion laboratory experiments reported in this work confirm that IxOy species are photolabile, and therefore this work supports the J(IxOy) scenario in ASL2014, with important consequences for ozone depletion. The values of the absorption cross sections obtained at 355 and 532 nm have been employed to revisit the assignment of absorption bands in previous work. Also, comparison between theoretical spectra and measurements gives some clues about the geometry of the molecules. I2O3 has a smaller absorption cross section in the actinic region than previously thought, which may facilitate other reactions, including clustering to form new particles. Other IxOy species have larger absorption cross sections in the actinic region, resulting in rapid photolysis to smaller iodine-containing molecules. Possible photolysis products include IO3, which could be a precursor of HIO3 in the marine boundary layer. These new findings highlight the need for new experimental and theoretical studies, particularly investigating the products of these photochemical processes, as well as the effect on IOP (and therefore cloud condensation nuclei) formation.
Table A1Molecular properties of I2O3, I2O4, I3O6 (cyclic), I3O6 (linear), I3O7 (cyclic), I3O7 (linear), IO3, and the transition state for dissociation of IO3 to IO+O2 (illustrated in Fig. A1), and the stationary points on the IO3+HO2 surface (Fig. 12).

* Calculated at the B3LYP/gen level of theory (see text).
Table A2Peak wavelengths and oscillator strengths (f) for the first 30 excited states of HOI, IO, OIO, and IO3 at the TD/B3LYP/G2 level of theory.
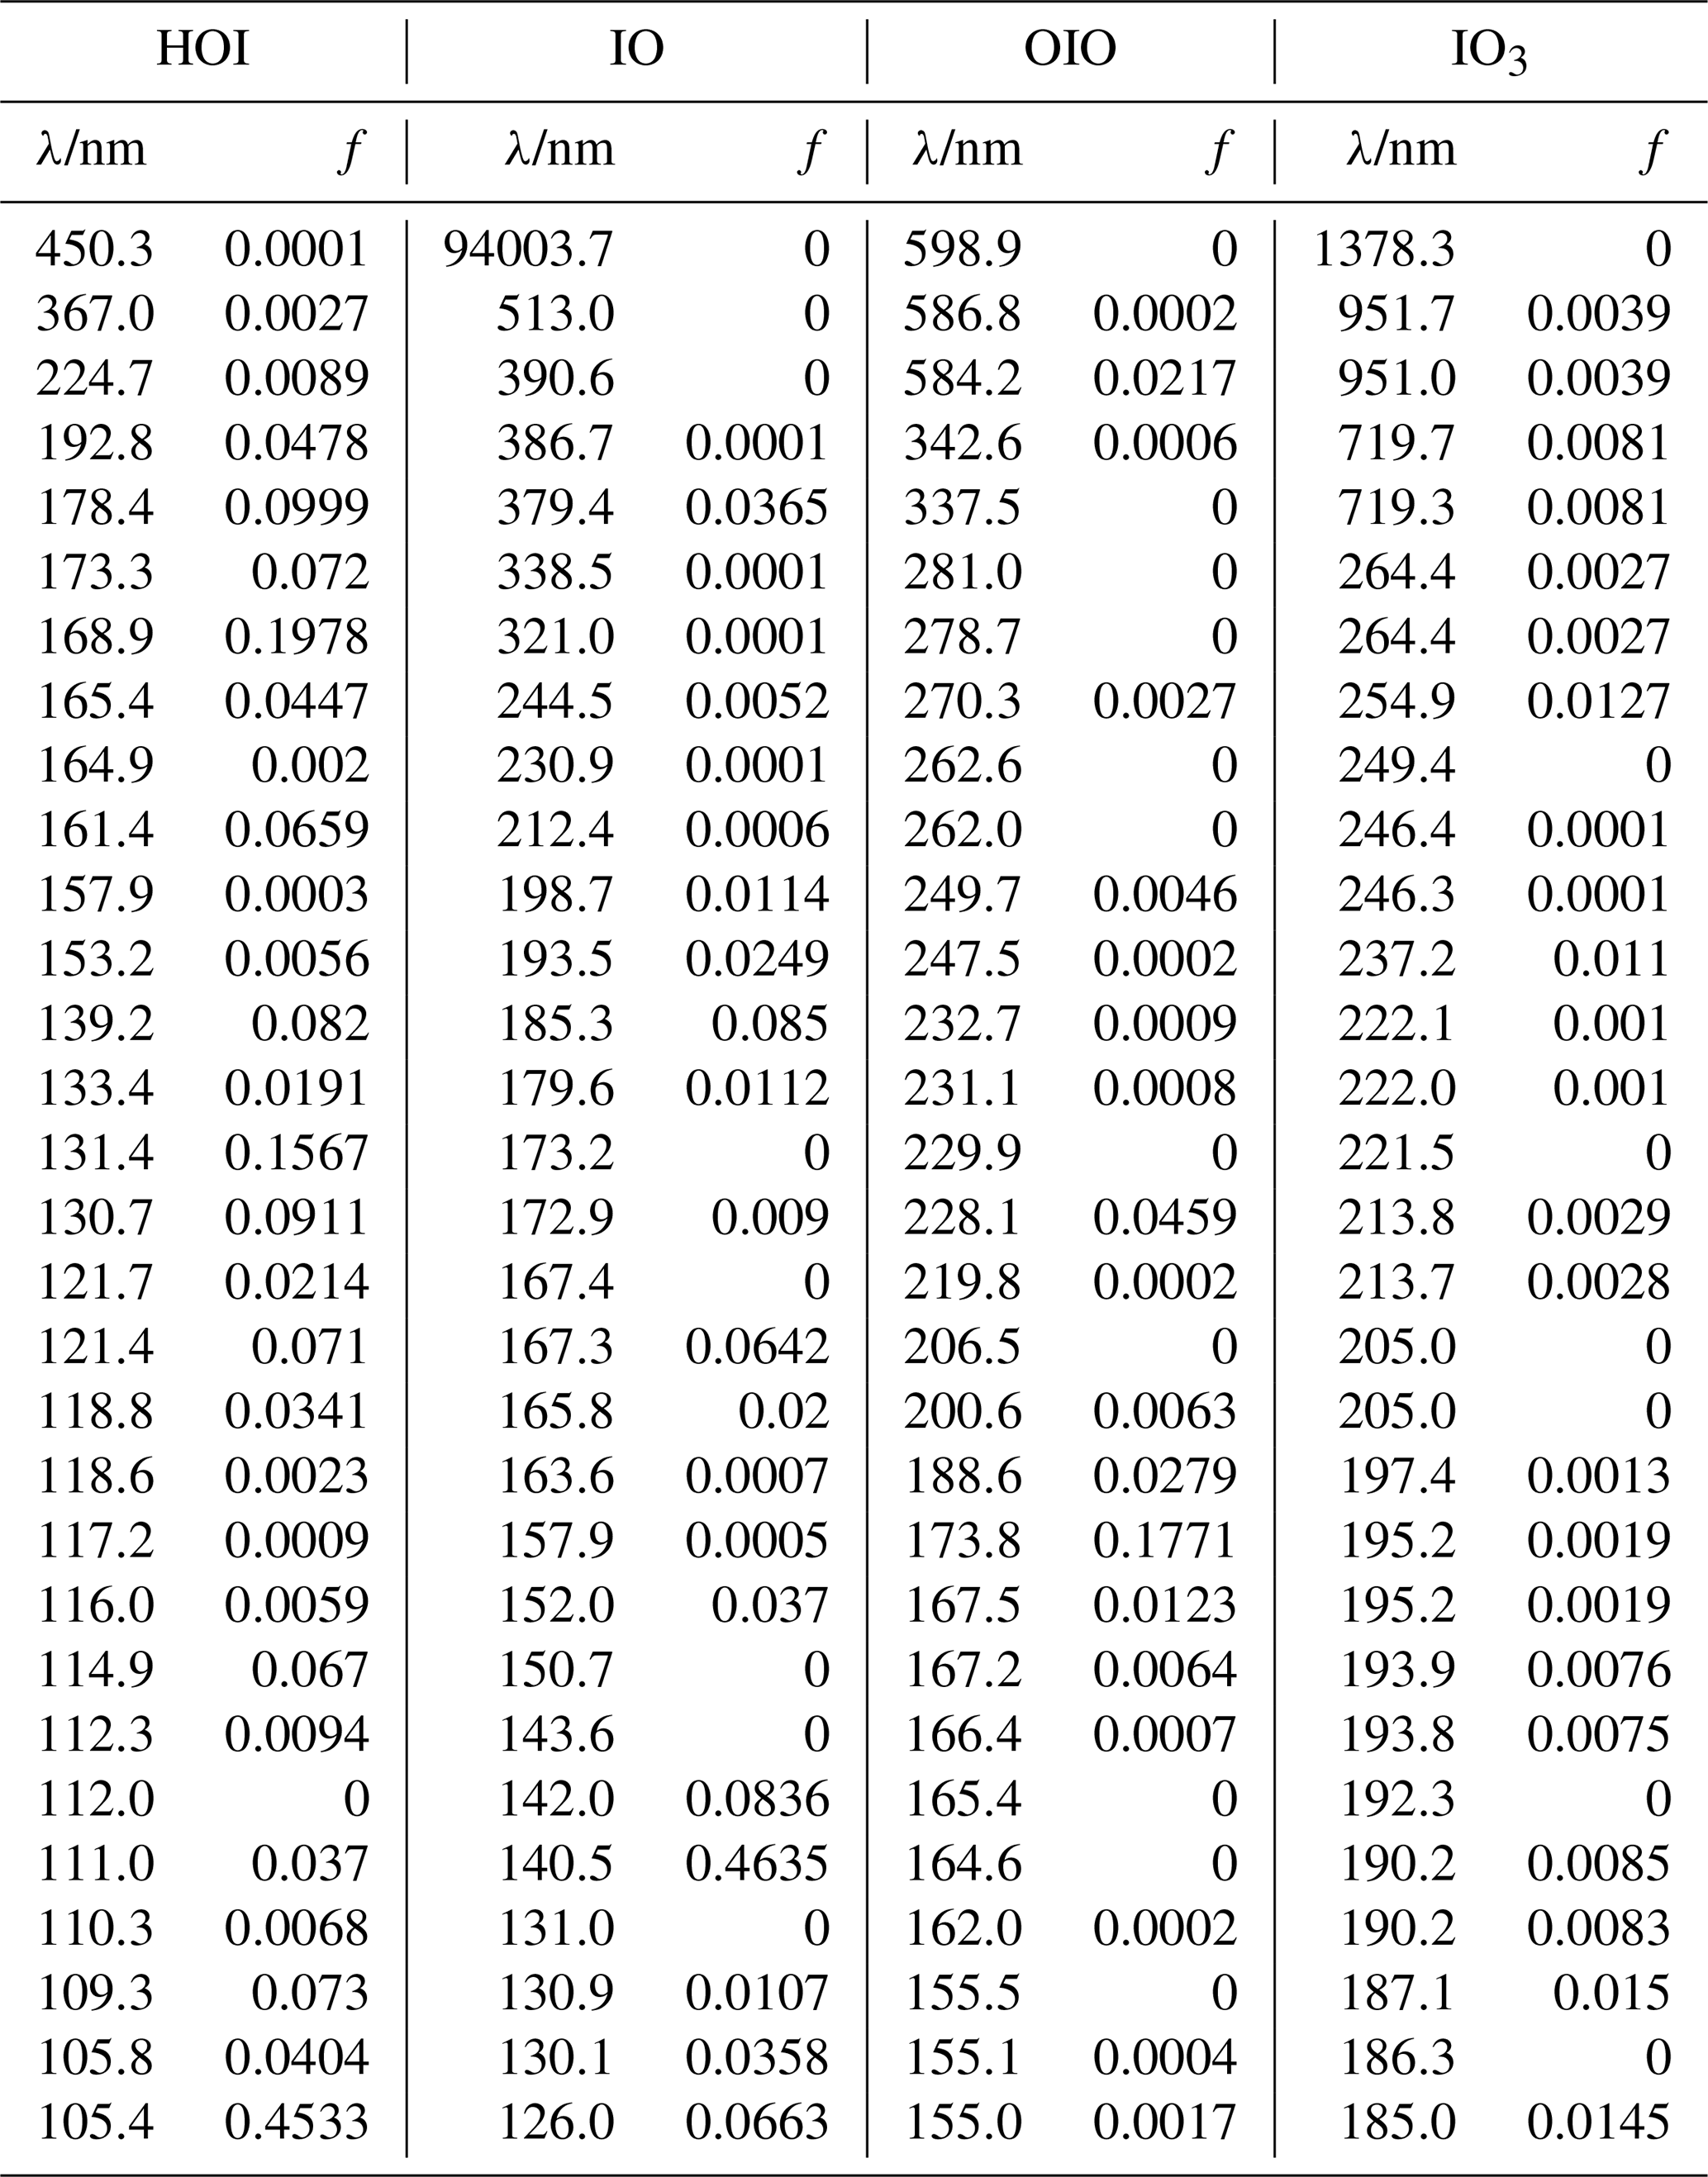
Table A3Peak wavelengths and oscillator strengths (f) for the first 30 excited states of I2O2, I2O3, and I2O4 at the TD/B3LYP/G2 level of theory.

Table A4Peak wavelengths and oscillator strengths (f) for the first 30 excited states of I3O6 linear, I3O6 cyclic, I3O7 linear, and I3O7 cyclic at the TD/B3LYP/G2 level of theory.
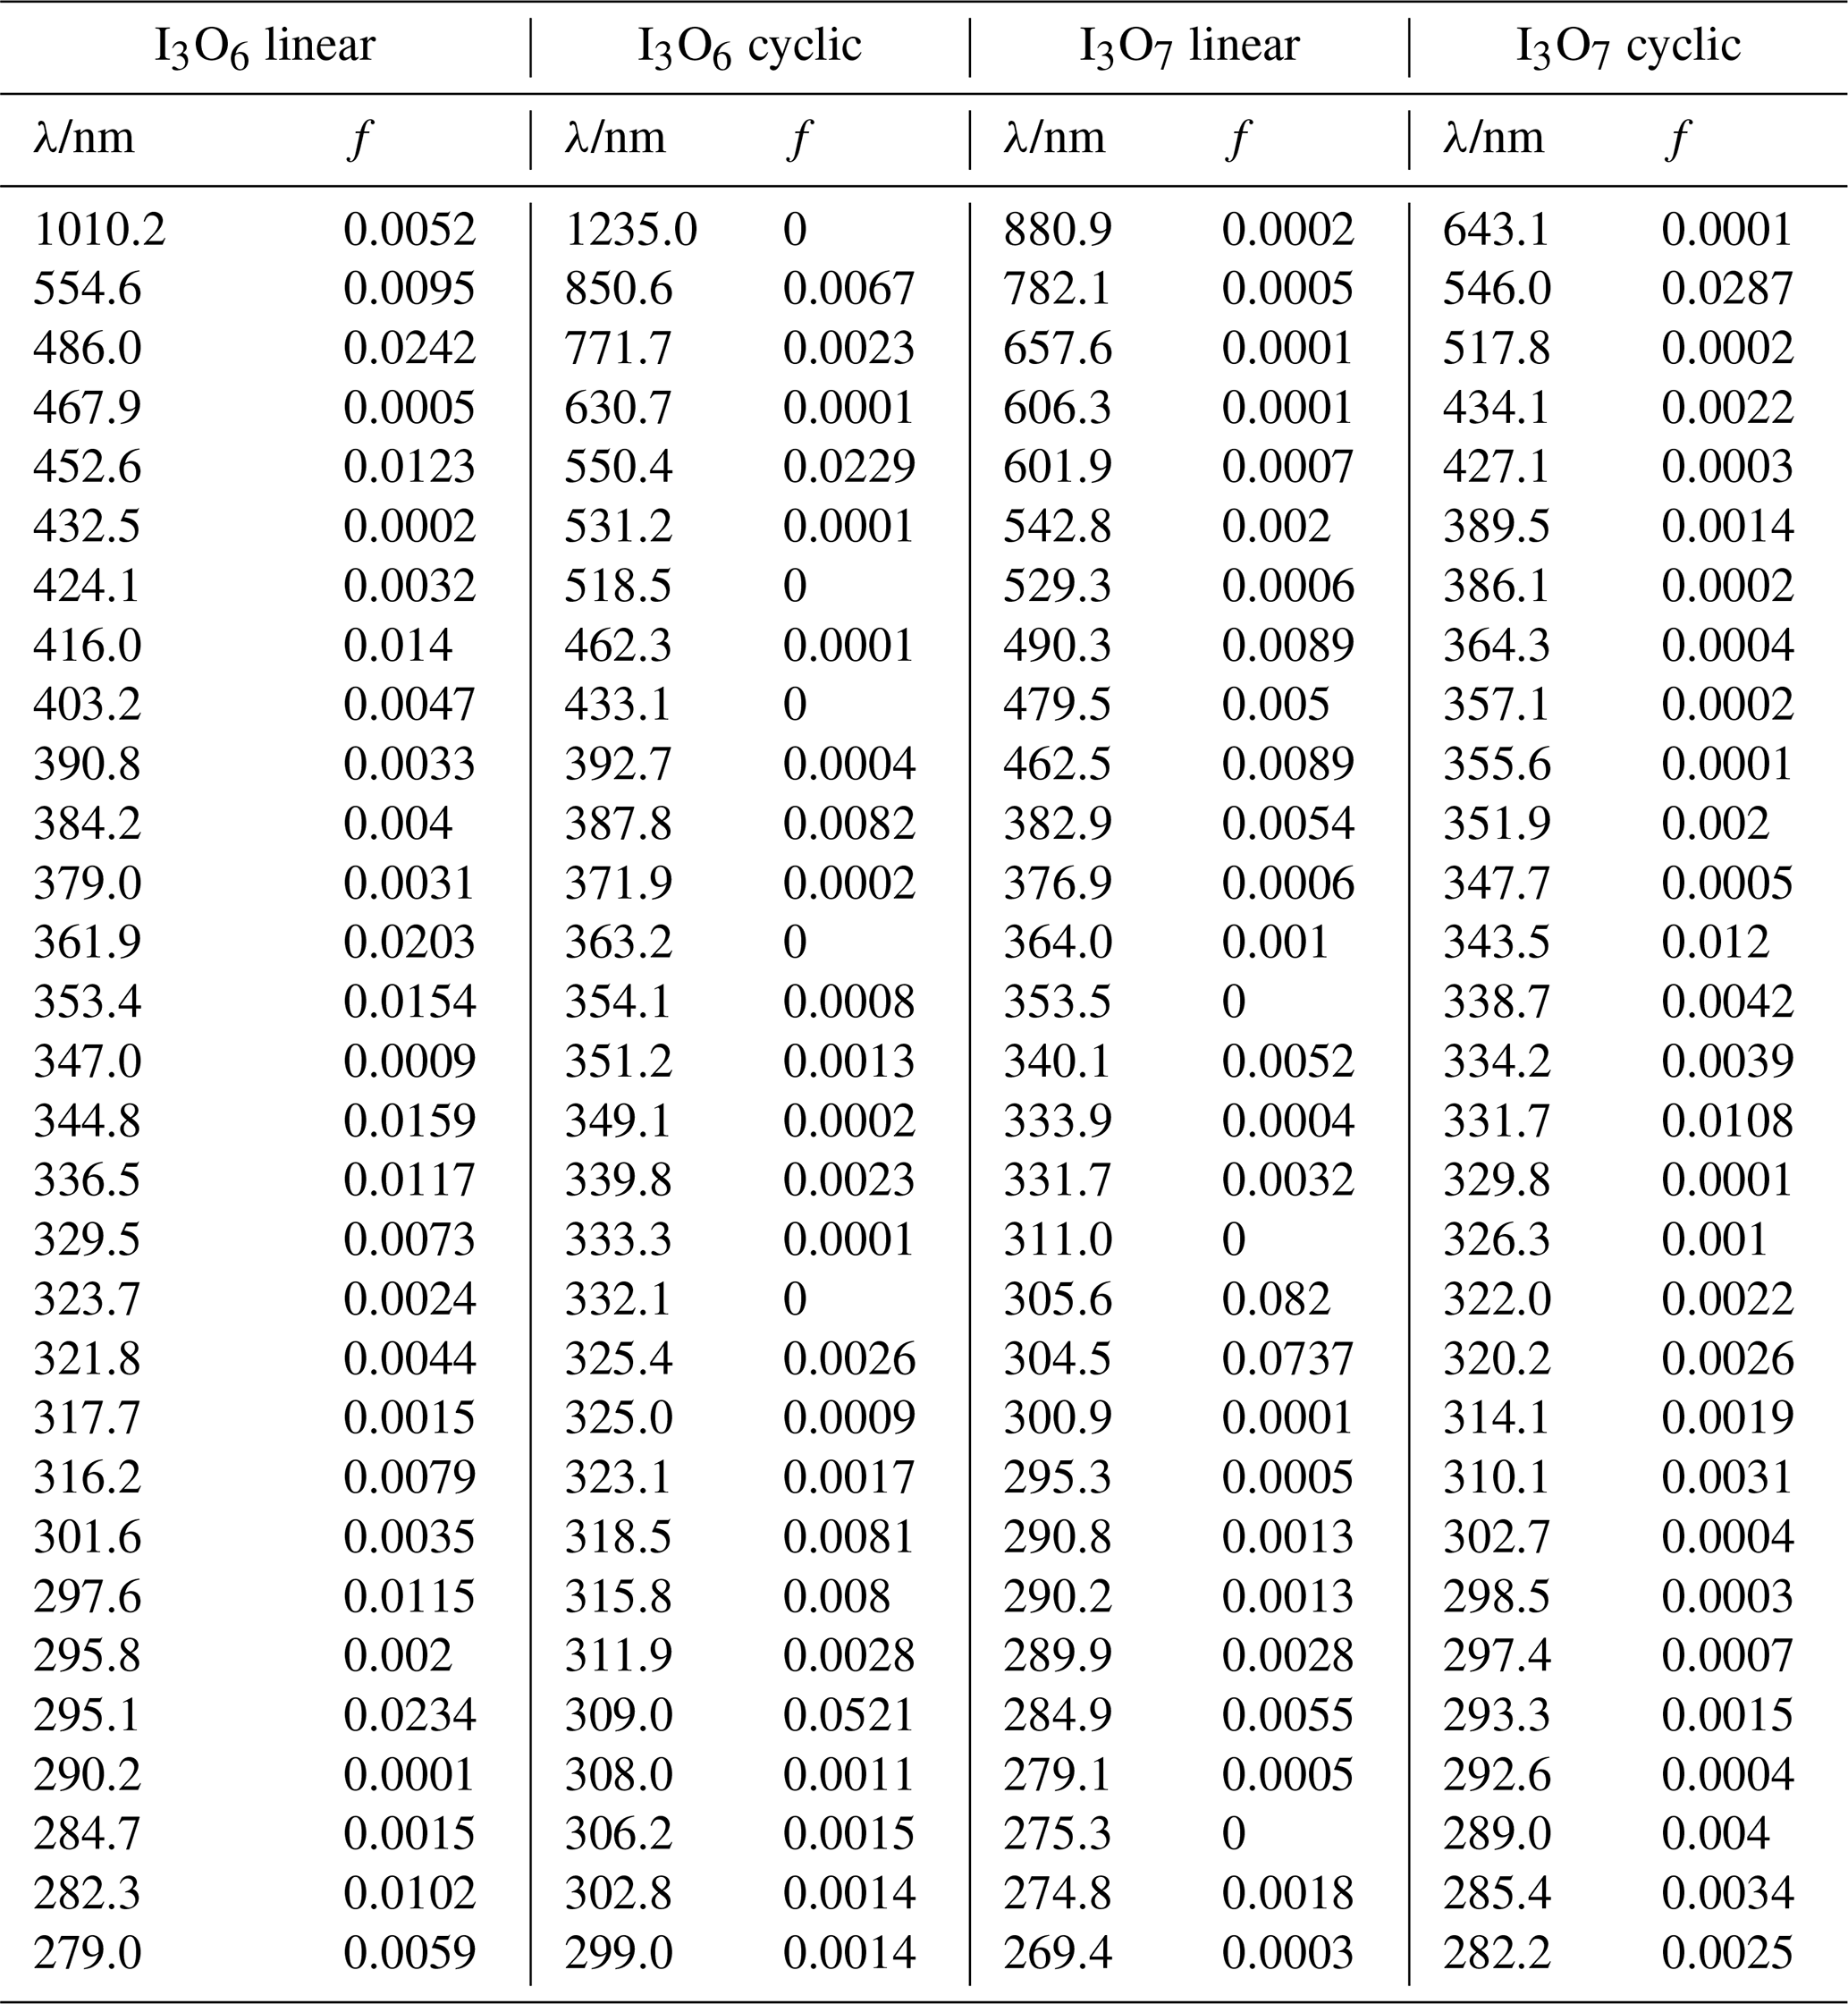
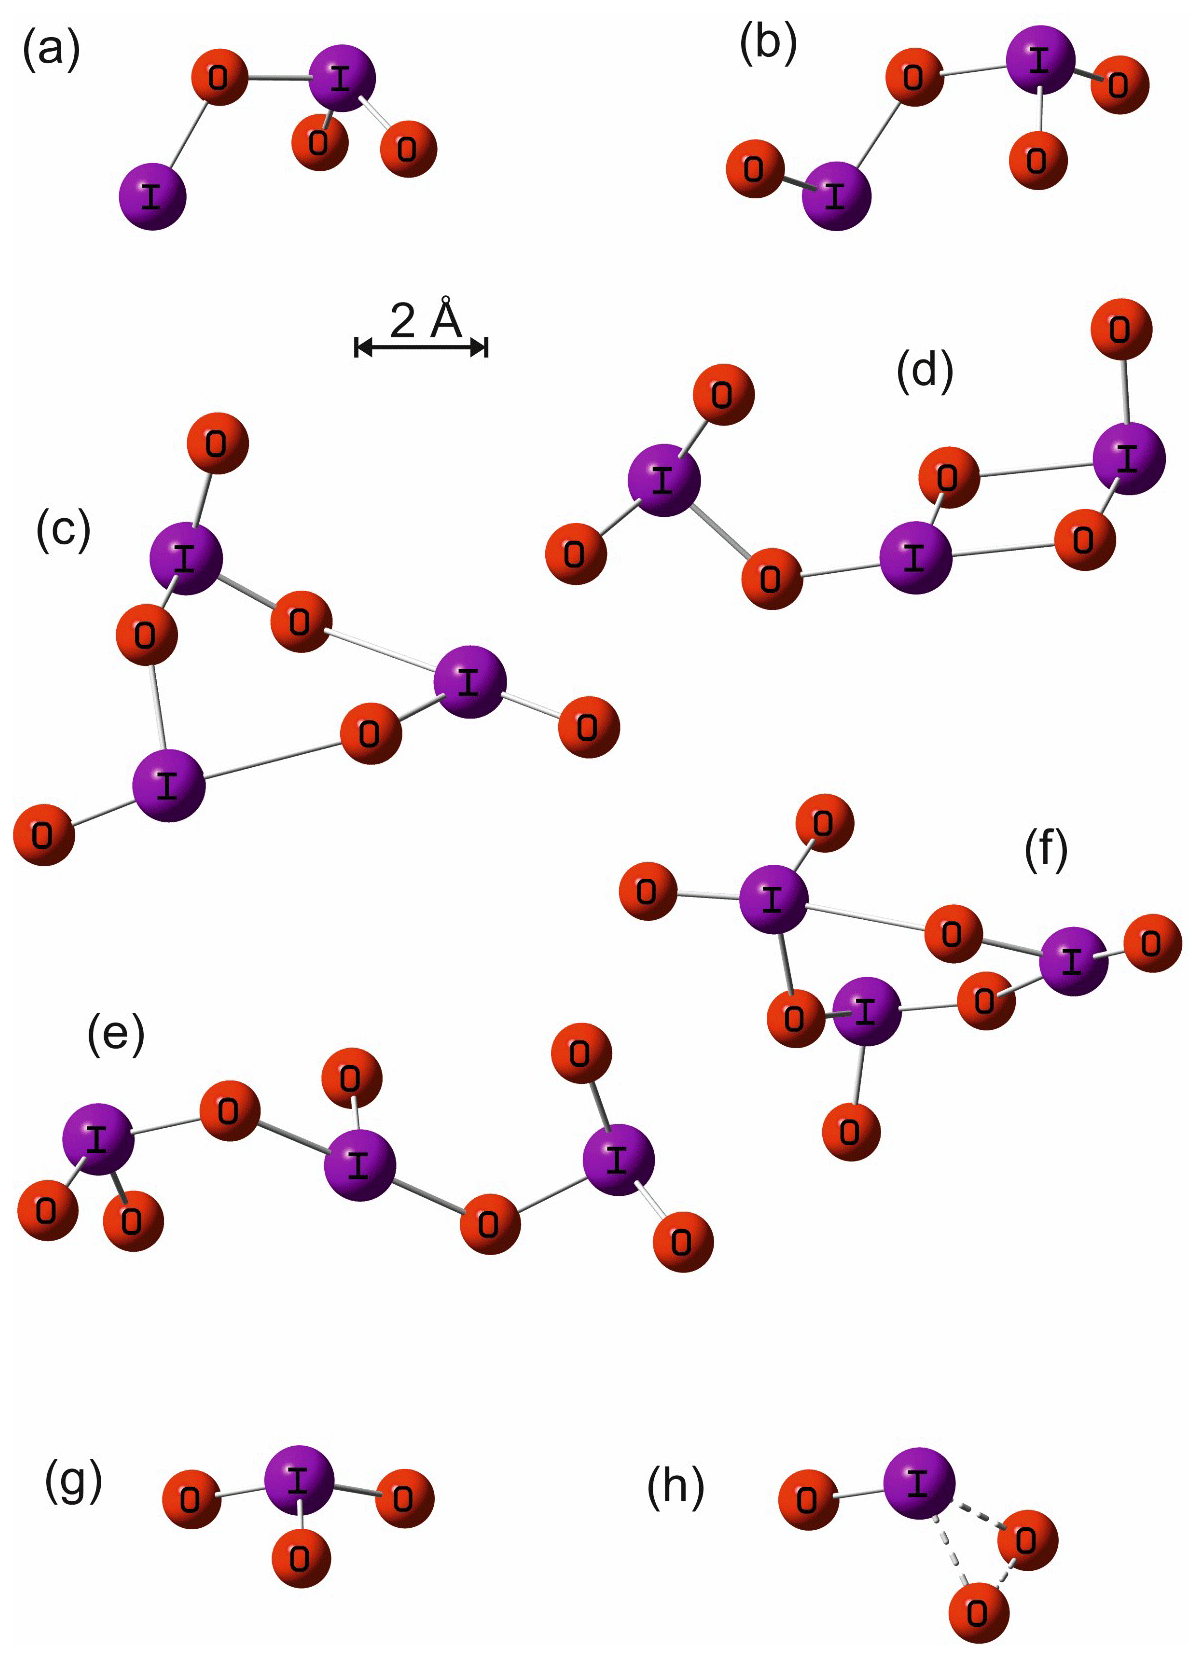
Figure A1Molecular geometries of I2O3, I2O4, I3O6 (cyclic), I3O6 (linear), I3O7 (cyclic), I3O7 (linear), IO3, and the transition state for dissociation of IO3 to IO+O2, calculated at the B3LYP/gen level of theory (see main text for details).

Figure A2Experimental absorption cross sections of IO (Sander et al., 2011), OIO (Spietz et al., 2005), and HOI (Sander et al., 2011) and absorption spectra calculated with the TD-DFT method (this work).
The photofragmentation of IxOy species to product ions in the photoionization chamber of the detection apparatus necessitates careful experimentation in order to ensure that any photodepletion of a species of interest is solely due to its 355 or 532 nm photolysis in the flow tube and not obscured by the product ions of larger IxOy species. To elucidate the optimal window for investigating photodepletion of each species, time-resolved mass spectra were recorded for each set of experimental conditions (Fig. 5). From the kinetic information, it is then possible to inspect the averages of the mass spectra within these windows to ensure that the species of interest is present, but larger IxOy species are not, as shown in Fig. B1. By ensuring no larger IxOy species are present, it follows that for a species of interest, only precursor ions of the species are contributing to the signal intensity within that time window, and that no contribution to the recorded signal is coming from product ions. Note that the signals shown in Figs. 5 and B1 are not accumulated for extended periods of time and as such are relatively noisy. Long accumulation times and corresponding large signal-to-noise ratios are unnecessary for these experiments, since the objective is simply to elucidate optimal time delays within which photodepletion experiments are carried out (photodepletion experiments are typically carried out for as many accumulations) and are carried out prior to an experimental session. It should be noted also that the optimal timescales such as those shown in Fig. 5 and Figure B1 vary depending on the concentration of IO formed at the beginning of the reaction sequence, and since the reactions which facilitate the stepwise formation of the higher oxides are second order, even modest changes in [IO] at early times can result in significant changes to the appearance times of the different species of interest.
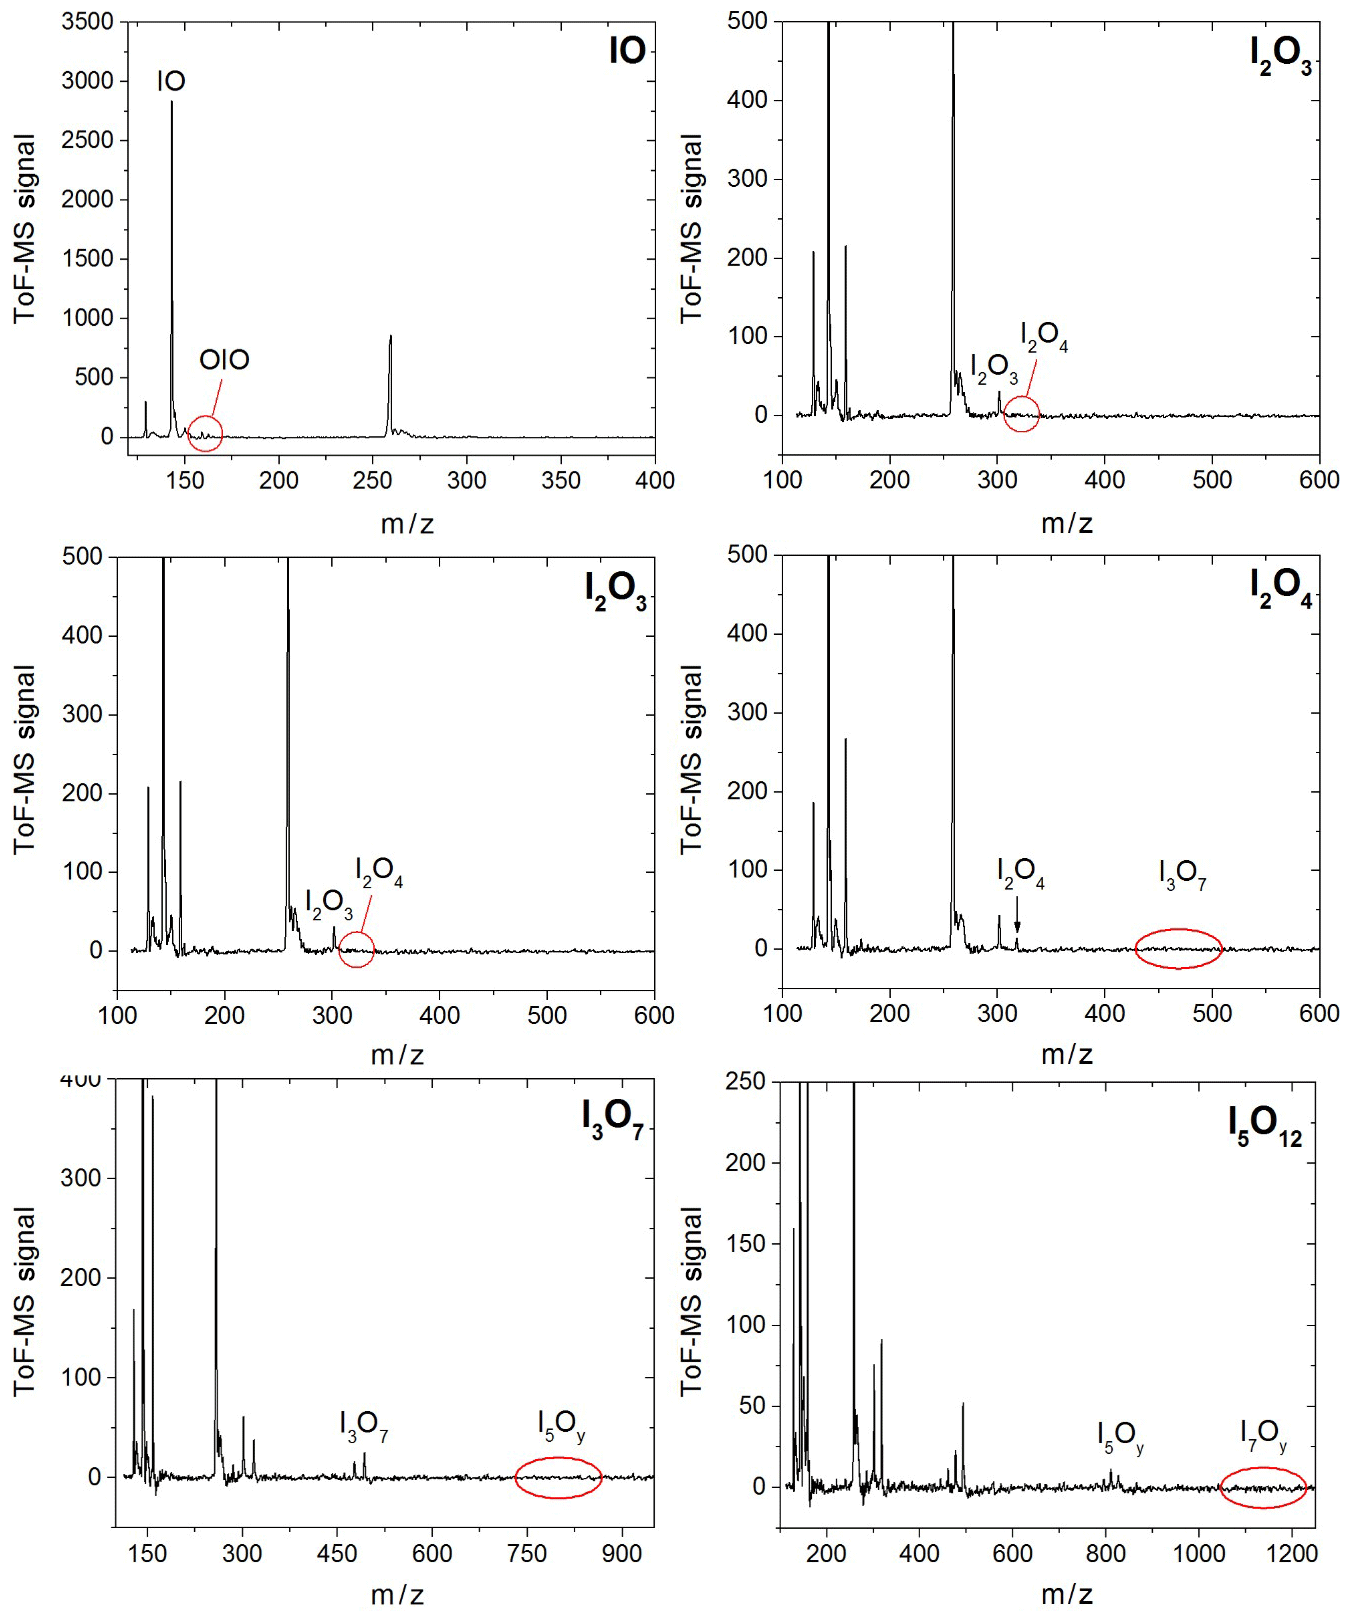
Figure B1Mass spectra corresponding to the optimized time delays shown in Fig. 5. The plots are generated by averaging the signal obtained for each mass over the 5 ms window. The species of interest is given in the top right corner of each spectrum.
The data that support the findings of this study are available from the corresponding authors on reasonable request.
ASL devised the research. JCGM, MAB, and JMCP designed the experimental set-up, and TRL carried out the experiments and analysed the data; JMCP and JCGM carried out electronic structure and master equation calculations; CAC carried out radiative transfer calculations; TRL and JCGM wrote the manuscript with contributions from all the co-authors.
The authors declare that they have no conflict of interest.
Alfonso Saiz-Lopez acknowledges funding from the European Research Council. Juan Carlos Gómez Martín is grateful for financial support from the State Agency for Research of the Spanish MCIU through the Center of Excellence Severo Ochoa award to the Instituto de Astrofísica de Andalucía (SEV-2017-0709) and the Ramon y Cajal programme (RYC-2016-19570).
This research has been supported by the European Research Council (CLIMAHAL (grant no. 726349)).
We acknowledge support of the publication fee by the CSIC Open Access Publication Support Initiative through its Unit of Information Resources for Research (URICI).
This paper was edited by Sergey A. Nizkorodov and reviewed by four anonymous referees.
Ashworth, S. H., Allan, B. J., and Plane, J. M. C.: High resolution spectroscopy of the OIO radical: Implications for the ozone-depleting potential of iodine, Geophys. Res. Lett., 29, 1456, https://doi.org/10.1029/2001gl013851, 2002.
Atkinson, R., Baulch, D. L., Cox, R. A., Crowley, J. N., Hampson, R. F., Hynes, R. G., Jenkin, M. E., Rossi, M. J., and Troe, J.: Evaluated kinetic and photochemical data for atmospheric chemistry: Volume III – gas phase reactions of inorganic halogens, Atmos. Chem. Phys., 7, 981–1191, https://doi.org/10.5194/acp-7-981-2007, 2007.
Baeza-Romero, M. T., Blitz, M. A., Goddard, A., and Seakins, P. W.: Time-of-flight mass spectrometry for time-resolved measurements: Some developments and applications, Int. J. Chem. Kinet., 44, 532–545, https://doi.org/10.1002/kin.20620, 2012.
Bloss, W. J., Rowley, D. M., Cox, R. A., and Jones, R. L.: Kinetics and Products of the IO Self-Reaction, J. Phys. Chem. A, 105, 7840–7854, https://doi.org/10.1021/jp0044936, 2001.
Burkholder, J. B., Sander, S. P., Abbat, J., Barker, J. R., Huie, R. E., Kolb, C. E., Kurylo, M. J., Orkin, V. L., Wilmouth, D. M., and Wine, P. H.: Chemical Kinetics and Photochemical Data for Use in Atmospheric Studies, Evaluation No. 18 JPL-NASA, Pasadena, 2015.
Burrows, J., Richter, A., Dehn, A., Deters, B., Himmelmann, S., Voigt, S., and Orphal, J.: Atmospheric remote-sensing reference data from GOME – 2. Temperature-dependent absorption cross sections of O3 in the 231–794 nm range, J. Quant. Spectrosc. Ra., 61, 509–517, https://doi.org/10.1016/S0022-4073(98)00037-5, 1999.
Canneaux, S., Xerri, B., Louis, F., and Cantrel, L.: Theoretical Study of the Gas-Phase Reactions of Iodine Atoms (2P3∕2) with H2, H2O, HI, and OH, J. Phys. Chem. A, 114, 9270–9288, https://doi.org/10.1021/jp104163t, 2010.
Carpenter, L. J., MacDonald, S. M., Shaw, M. D., Kumar, R., Saunders, R. W., Parthipan, R., Wilson, J., and Plane, J. M. C.: Atmospheric iodine levels influenced by sea surface emissions of inorganic iodine, Nat. Geosci., 6, 108–111, https://doi.org/10.1038/ngeo1687, 2013.
Chance, R., Baker, A. R., Carpenter, L., and Jickells, T. D.: The distribution of iodide at the sea surface, Environ. Sci. Process Impacts, 16, 1841–1859, https://doi.org/10.1039/c4em00139g, 2014.
Cox, R. A. and Coker, G. B.: Absorption Cross section and Kinetics of IO in the Photolysis of CH3I in the presence of Ozone, J. Phys. Chem., 87, 4478–4484, https://doi.org/10.1021/j100245a030, 1983.
Cuevas, C. A., Maffezzoli, N., Corella, J. P., Spolaor, A., Vallelonga, P., Kjær, H. A., Simonsen, M., Winstrup, M., Vinther, B., Horvat, C., Fernandez, R. P., Kinnison, D., Lamarque, J.-F., Barbante, C., and Saiz-Lopez, A.: Rapid increase in atmospheric iodine levels in the North Atlantic since the mid-20th century, Nat. Commun., 9, 1452, https://doi.org/10.1038/s41467-018-03756-1, 2018.
Dennington, R., Keith, T. A., and Millam, J. M.: GaussView, Version 6.1, Semichem Inc., Shawnee Mission, KS, 2016.
Fernandez, R. P., Salawitch, R. J., Kinnison, D. E., Lamarque, J.-F., and Saiz-Lopez, A.: Bromine partitioning in the tropical tropopause layer: implications for stratospheric injection, Atmos. Chem. Phys., 14, 13391–13410, https://doi.org/10.5194/acp-14-13391-2014, 2014.
Foresman, J. B. and Frisch, Æ.: Exploring Chemistry with Electronic Structure Methods 3rd. Ed., Gaussian, Inc., Wallingford, CT, USA, 2015.
Frisch, M. J., Trucks, G. W., Schlegel, H. B., Scuseria, G. E., Robb, M. A., Cheeseman, J. R., Scalmani, G., Barone, V., Petersson, G. A., Nakatsuji, H., Li, X., Caricato, M., Marenich, A. V., Bloino, J., Janesko, B. G., Gomperts, R., Mennucci, B., Hratchian, H. P., Ortiz, J. V., Izmaylov, A. F., Sonnenberg, J. L., Williams-Young, D., Ding, F., Lipparini, F., Egidi, F., Goings, J., Peng, B., Petrone, A., Henderson, T., Ranasinghe, D., Zakrzewski, V. G., J. Gao, N. R., Zheng, G., Liang, W., Hada, M., Ehara, M., Toyota, K., Fukuda, R., Hasegawa, J., Ishida, M., Nakajima, T., Honda, Y., Kitao, O., Nakai, H., Vreven, T., Throssell, K., J. A. Montgomery, J., Peralta, J. E., Ogliaro, F., Bearpark, M. J., Heyd, J. J., Brothers, E. N., Kudin, K. N., Staroverov, V. N., Keith, T. A., Kobayashi, R., Normand, J., Raghavachari, K., Rendell, A. P., Burant, J. C., Iyengar, S. S., Tomasi, J., Cossi, M., Millam, J. M., Klene, M., Adamo, C., Cammi, R., Ochterski, J. W., Martin, R. L., Morokuma, K., Farkas, O., Foresman, J. B., and Fox, D. J.: Gaussian 16, Revision B.01, Gaussian, Inc., Wallingford, CT, USA, 2016.
Galvez, O., Gómez Martín, J. C., Gomez, P. C., Saiz-Lopez, A., and Pacios, L. F.: A theoretical study on the formation of iodine oxide aggregates and monohydrates, Phys. Chem. Chem. Phys., 15, 15572–15583, https://doi.org/10.1039/c3cp51219c, 2013.
Glowacki, D. R., Liang, C.-H., Morley, C., Pilling, M. J., and Robertson, S. H.: MESMER: An Open-Source Master Equation Solver for Multi-Energy Well Reactions, J. Phys. Chem. A, 116, 9545–9560, https://doi.org/10.1021/jp3051033, 2012.
Glukhovtsev, M. N., Pross, A., McGrath, M. P., and Radom, L.: Extension of Gaussian-2 (G2) theory to bromine- and iodine-containing molecules: Use of effective core potentials, J. Chem. Phys., 103, 1878–1885, https://doi.org/10.1063/1.469712, 1995.
Gómez Martín, J. C., Spietz, P., and Burrows, J. P.: Spectroscopic studies of the I2∕O3 photochemistry: Part 1: Determination of the absolute absorption cross sections of iodine oxides of atmospheric relevance, J. Photoch. Photobio., A, 176, 15–38, https://doi.org/10.1016/j.jphotochem.2005.09.024, 2005.
Gómez Martín, J. C., Spietz, P., and Burrows, J. P.: Kinetic and Mechanistic Studies of the I2∕O3 Photochemistry, J. Phys. Chem. A, 111, 306–320, https://doi.org/10.1021/jp061186c, 2007.
Gómez Martín, J. C., Ashworth, S. H., Mahajan, A. S., and Plane, J. M. C.: Photochemistry of OIO: Laboratory study and atmospheric implications, Geophys. Res. Lett., 36, L09802, https://doi.org/10.1029/2009GL037642, 2009.
Gómez Martín, J. C., Galvez, O., Baeza-Romero, M. T., Ingham, T., Plane, J. M. C., and Blitz, M. A.: On the mechanism of iodine oxide particle formation, Phys. Chem. Chem. Phys., 15, 15612–15622, https://doi.org/10.1039/c3cp51217g, 2013.
Gómez Martín, J. C., Garraway, S. A., and Plane, J. M. C.: Reaction Kinetics of Meteoric Sodium Reservoirs in the Upper Atmosphere, J. Phys. Chem. A, 120, 1330–1346, https://doi.org/10.1021/acs.jpca.5b00622, 2016.
Gómez Martín, J. C., Lewis, T., Blitz, M. A., Plane, J. M., Kumar, M., Francisco, J. S., and Saiz-Lopez, A.: A gas-to-particle conversion mechanism helps to explain atmospheric particle formation through clustering of iodine oxides, Nat. Commun., 11, 4521, https://doi.org/10.1038/s41467-020-18252-8, 2020.
Hammaecher, C., Canneaux, S., Louis, F., and Cantrel, L.: A Theoretical Study of the H-Abstraction Reactions from HOI by Moist Air Radiolytic Products (H, OH, and O(3P)) and Iodine Atoms (2P3∕2), J. Phys. Chem. A, 115, 6664–6674, https://doi.org/10.1021/jp202760u, 2011.
Harwood, M. H., Burkholder, J. B., Hunter, M., Fox, R. W., and Ravishankara, A. R.: Absorption Cross Sections and Self-Reaction Kinetics of the IO Radical, J. Phys. Chem. A, 101, 853–863, https://doi.org/10.1021/jp962429b, 1997.
Hoffmann, T., O'Dowd, C. D., and Seinfeld, J. H.: Iodine oxide homogeneous nucleation: An explanation for coastal new particle production, Geophys. Res. Lett., 28, 1949–1952, https://doi.org/10.1029/2000GL012399, 2001.
Jimenez, J. L., Bahreini, R., Cocker, D. R., III, Zhuang, H., Varutbangkul, V., Flagan, R. C., Seinfeld, J. H., O'Dowd, C. D., and Hoffmann, T.: New particle formation from photooxidation of diiodomethane (CH2I2), J. Geophys. Res.-Atmos., 108, 4318, https://doi.org/10.1029/2002JD002452, 2003.
Joseph, D. M., Ashworth, S. H., and Plane, J. M. C.: The absorption cross-section and photochemistry of OIO, J. Photoch. Photobio. A, 176, 68–77, https://doi.org/10.1016/j.jphotochem.2005.09.003, 2005.
Kaltsoyannis, N. and Plane, J. M. C.: Quantum chemical calculations on a selection of iodine-containing species (IO, OIO, INO3, (IO)2, I2O3, I2O4 and I2O5) of importance in the atmosphere, Phys. Chem. Chem. Phys., 10, 1723–1733, https://doi.org/10.1039/b715687c, 2008.
Khanniche, S., Louis, F., Cantrel, L., and Černušák, I.: Thermochemistry of HIO2 Species and Reactivity of Iodous Acid with OH Radical: A Computational Study, ACS Earth Space Chem., 1, 39–49, https://doi.org/10.1021/acsearthspacechem.6b00010, 2017a.
Khanniche, S., Louis, F., Cantrel, L., and Černušák, I.: Investigation of the Reaction Mechanism and Kinetics of Iodic Acid with OH Radical Using Quantum Chemistry, ACS Earth Space Chem., 1, 227–235, https://doi.org/10.1021/acsearthspacechem.7b00038, 2017b.
Koenig, T. K., Baidar, S., Campuzano-Jost, P., Cuevas, C. A., Dix, B., Fernandez, R. P., Guo, H., Hall, S. R., Kinnison, D., Nault, B. A., Ullmann, K., Jimenez, J. L., Saiz-Lopez, A., and Volkamer, R.: Quantitative detection of iodine in the stratosphere, P. Natl. Acad. Sci. USA, 117, 1860–1866, https://doi.org/10.1073/pnas.1916828117, 2020.
Kumar, M., Saiz-Lopez, A., and Francisco, J. S.: Single-Molecule Catalysis Revealed: Elucidating the Mechanistic Framework for the Formation and Growth of Atmospheric Iodine Oxide Aerosols in Gas-Phase and Aqueous Surface Environments, J. Am. Chem. Soc., 140, 14704–14716, https://doi.org/10.1021/jacs.8b07441, 2018.
Kung, A. H., Young, J. F., and Harris, S. E.: Generation of 1182-Å radiation in phase-matched mixtures of inert gases, Appl. Phys. Lett., 22, 301–302, https://doi.org/10.1063/1.1654647, 1973.
Lamarque, J.-F., Emmons, L. K., Hess, P. G., Kinnison, D. E., Tilmes, S., Vitt, F., Heald, C. L., Holland, E. A., Lauritzen, P. H., Neu, J., Orlando, J. J., Rasch, P. J., and Tyndall, G. K.: CAM-chem: description and evaluation of interactive atmospheric chemistry in the Community Earth System Model, Geosci. Model Dev., 5, 369–411, https://doi.org/10.5194/gmd-5-369-2012, 2012.
Laszlo, B., Kurylo, M. J., and Huie, R. E.: Absorption cross sections, kinetics of formation, and self-reaction of the IO radical produced via the laser photolysis of mixtures, J. Phys. Chem., 99, 11701–11707, https://doi.org/10.1021/j100030a013, 1995.
Lewis, T., Heard, D. E., and Blitz, M. A.: A novel multiplex absorption spectrometer for time-resolved studies, Rev. Sci. Instrum., 89, 024101, https://doi.org/10.1063/1.5006539, 2018.
MacDonald, S. M., Gómez Martín, J. C., Chance, R., Warriner, S., Saiz-Lopez, A., Carpenter, L. J., and Plane, J. M. C.: A laboratory characterisation of inorganic iodine emissions from the sea surface: dependence on oceanic variables and parameterisation for global modelling, Atmos. Chem. Phys., 14, 5841-5852, https://doi.org/10.5194/acp-14-5841-2014, 2014.
Mahon, R., McIlrath, T., Myerscough, V., and Koopman, D.: Third-harmonic generation in argon, krypton, and xenon: Bandwidth limitations in the vicinity of Lyman-α, IEEE J. Quantum Elect., 15, 444–451, https://doi.org/10.1109/jqe.1979.1070036, 1979.
McFiggans, G., Coe, H., Burgess, R., Allan, J., Cubison, M., Alfarra, M. R., Saunders, R., Saiz-Lopez, A., Plane, J. M. C., Wevill, D., Carpenter, L., Rickard, A. R., and Monks, P. S.: Direct evidence for coastal iodine particles from Laminaria macroalgae – linkage to emissions of molecular iodine, Atmos. Chem. Phys., 4, 701–713, https://doi.org/10.5194/acp-4-701-2004, 2004.
Ordóñez, C., Lamarque, J.-F., Tilmes, S., Kinnison, D. E., Atlas, E. L., Blake, D. R., Sousa Santos, G., Brasseur, G., and Saiz-Lopez, A.: Bromine and iodine chemistry in a global chemistry-climate model: description and evaluation of very short-lived oceanic sources, Atmos. Chem. Phys., 12, 1423–1447, https://doi.org/10.5194/acp-12-1423-2012, 2012.
Peterson, K. A.: A theoretical study of the low-lying electronic states of OIO and the ground states of IOO and OIO-, Mol. Phys., 108, 393–408, https://doi.org/10.1080/00268970903508548, 2010.
Pirjola, L., O'Dowd, C., Yoon, Y. J., and Sellegri, K.: Modelling Iodine Particle Formation and Growth from Seaweed in a Chamber, Environ. Chem., 2, 271–281, https://doi.org/10.1071/EN05075, 2005.
Prados-Roman, C., Cuevas, C. A., Fernandez, R. P., Kinnison, D. E., Lamarque, J.-F., and Saiz-Lopez, A.: A negative feedback between anthropogenic ozone pollution and enhanced ocean emissions of iodine, Atmos. Chem. Phys., 15, 2215–2224, https://doi.org/10.5194/acp-15-2215-2015, 2015.
Saiz-Lopez, A. and Plane, J. M. C.: Novel iodine chemistry in the marine boundary layer, Geophys. Res. Lett., 31, L04112, https://doi.org/10.1029/2003GL019215, 2004.
Saiz-Lopez, A., Saunders, R. W., Joseph, D. M., Ashworth, S. H., and Plane, J. M. C.: Absolute absorption cross-section and photolysis rate of I2, Atmos. Chem. Phys., 4, 1443–1450, https://doi.org/10.5194/acp-4-1443-2004, 2004.
Saiz-Lopez, A., Lamarque, J.-F., Kinnison, D. E., Tilmes, S., Ordóñez, C., Orlando, J. J., Conley, A. J., Plane, J. M. C., Mahajan, A. S., Sousa Santos, G., Atlas, E. L., Blake, D. R., Sander, S. P., Schauffler, S., Thompson, A. M., and Brasseur, G.: Estimating the climate significance of halogen-driven ozone loss in the tropical marine troposphere, Atmos. Chem. Phys., 12, 3939–3949, https://doi.org/10.5194/acp-12-3939-2012, 2012a.
Saiz-Lopez, A., Plane, J. M., Baker, A. R., Carpenter, L. J., von Glasow, R., Martin, J. C., McFiggans, G., and Saunders, R. W.: Atmospheric chemistry of iodine, Chem. Rev., 112, 1773–1804, https://doi.org/10.1021/cr200029u, 2012b.
Saiz-Lopez, A., Fernandez, R. P., Ordóñez, C., Kinnison, D. E., Gómez Martín, J. C., Lamarque, J.-F., and Tilmes, S.: Iodine chemistry in the troposphere and its effect on ozone, Atmos. Chem. Phys., 14, 13119–13143, https://doi.org/10.5194/acp-14-13119-2014, 2014.
Saiz-Lopez, A., Baidar, S., Cuevas, C. A., Koenig, T., Fernandez, R. P., Dix, B., Kinnison, D. E., Lamarque, J.-F., Rodriguez-Lloveras, X., and Campos, T. L.: Injection of iodine to the stratosphere, Geophys. Res. Lett., 42, 6852–6859, https://doi.org/10.1002/2015GL064796, 2015.
Sander, S. P., Abbatt, J., Barker, J. R., Burkholder, J. B., Friedl, R. R., Golden, D. M., Huie, R. E., Kolb, C. E., Kurylo, M. J., Moortga, G. K., Orkin, V. L., and Wine, P. H.: Chemical Kinetics and Photochemical Data for Use in Atmospheric Studies, Evaluation Number 17, Jet Propulsion Laboratory, Pasadena, USA, 2011.
Saunders, R. W., Mahajan, A. S., Gómez Martín, J. C., Kumar, R., and Plane, J. M. C.: Studies of the Formation and Growth of Aerosol from Molecular Iodine Precursor, Z. Phys. Chem., 224, 1095–1117, https://doi.org/10.1524/zpch.2010.6143, 2010.
Sherwen, T., Evans, M. J., Carpenter, L. J., Andrews, S. J., Lidster, R. T., Dix, B., Koenig, T. K., Sinreich, R., Ortega, I., Volkamer, R., Saiz-Lopez, A., Prados-Roman, C., Mahajan, A. S., and Ordóñez, C.: Iodine's impact on tropospheric oxidants: a global model study in GEOS-Chem, Atmos. Chem. Phys., 16, 1161–1186, https://doi.org/10.5194/acp-16-1161-2016, 2016.
Sipilä, M., Sarnela, N., Jokinen, T., Henschel, H., Junninen, H., Kontkanen, J., Richters, S., Kangasluoma, J., Franchin, A., Peräkylä, O., Rissanen, M. P., Ehn, M., Vehkamäki, H., Kurten, T., Berndt, T., Petäjä, T., Worsnop, D., Ceburnis, D., Kerminen, V.-M., Kulmala, M., and O'Dowd, C.: Molecular-scale evidence of aerosol particle formation via sequential addition of HIO3, Nature, 537, 532–534, https://doi.org/10.1038/nature19314, 2016.
Spietz, P., Gómez Martín, J. C., and Burrows, J. P.: Spectroscopic studies of the I2∕O3 photochemistry: Part 2. Improved spectra of iodine oxides and analysis of the IO absorption spectrum, J. Photoch. Photobio. A, 176, 50–67, https://doi.org/10.1016/j.jphotochem.2005.08.023, 2005.
Stone, D., Whalley, L. K., and Heard, D. E.: Tropospheric OH and HO2 radicals: field measurements and model comparisons, Chem. Soc. Rev., 41, 6348–6404, https://doi.org/10.1039/c2cs35140d, 2012.
Stratmann, R. E., Scuseria, G. E., and Frisch, M. J.: An efficient implementation of time-dependent density-functional theory for the calculation of excitation energies of large molecules, J. Chem. Phys., 109, 8218–8224, https://doi.org/10.1063/1.477483, 1998.
Tucceri, M. E., Hölscher, D., Rodriguez, A., Dillon, T. J., and Crowley, J. N.: Absorption cross section and photolysis of OIO, Phys. Chem. Chem. Phys., 8, 834–846, https://doi.org/10.1039/b512702e, 2006.
Vandaele, A. C., Hermans, C., Simon, P. C., Carleer, M., Colin, R., Fally, S., Mérienne, M. F., Jenouvrier, A., and Coquart, B.: Measurements of the NO2 absorption cross-section from 42 000 cm−1 to 10 000 cm−1 (238–1000 nm) at 220 K and 294 K, J. Quant. Spectrosc. Ra., 59, 171–184, https://doi.org/10.1016/S0022-4073(97)00168-4, 1998.
Wei, N., Hu, C., Zhou, S., Ma, Q., Mikuška, P., Večeřa, Z., Gai, Y., Lin, X., Gu, X., Zhao, W., Fang, B., Zhang, W., Chen, J., Liu, F., Shan, X., and Sheng, L.: VUV photoionization aerosol mass spectrometric study on the iodine oxide particles formed from O3-initiated photooxidation of diiodomethane (CH2I2), RSC Adv., 7, 56779–56787, https://doi.org/10.1039/c7ra11413c, 2017.
- Abstract
- Introduction
- Methods
- Results
- Discussion
- Conclusion
- Appendix A: Molecular geometries and parameters of iodine oxides at the B3LYP/6-311+G(2d,p) (+AE) level of theory and benchmarking of the TD-DFT method for iodine oxides
- Appendix B: Photofragmentation of IxOy species
- Code and data availability
- Author contributions
- Competing interests
- Acknowledgements
- Financial support
- Review statement
- References