the Creative Commons Attribution 4.0 License.
the Creative Commons Attribution 4.0 License.
 | 24 Jun 2019
Emission inventory of semi-volatile and intermediate-volatility organic compounds and their effects on secondary organic aerosol over the Pearl River Delta region
Liqing Wu
Xuemei Wang
Sihua Lu
Min Shao
Zhenhao Ling
Semi-volatile and intermediate-volatility organic compounds (S–IVOCs) are considered critical precursors of secondary organic aerosol (SOA), which is an important component of fine particulate matter (PM2.5). However, knowledge of the contributions of S–IVOCs to SOA is still lacking in the Pearl River Delta (PRD) region, southern China. Therefore, in this study, an emission inventory of S–IVOCs in the PRD region was developed for the first time for the year 2010. The S–IVOC emissions were calculated based on a parameterization method involving the emission factors of POA (primary organic aerosol), emission ratios of S–IVOCs to POA, and domestic activity data. The total emissions of S–IVOCs were estimated to be 323.4 Gg, with major emissions from central cities in the PRD, i.e., Guangzhou, Foshan, and Shenzhen. On-road mobile sources and industries were the two major contributors of S–IVOC emissions, with contributions of ∼42 % and ∼35 %, respectively. Furthermore, uncertainties of the emission inventory were evaluated through Monte Carlo simulation. The uncertainties ranged from −79 % to 229 %, which could be mainly attributed to mass fractions of OC (organic carbon) to PM2.5 from on-road mobile emissions and emission ratios of IVOCs ∕ POA. The developed S–IVOC emission inventory was further incorporated into the Weather Research and Forecasting with Chemistry (WRF-Chem) model with a volatility basis-set (VBS) approach to improve the performance of SOA simulation and to evaluate the influence of S–IVOCs on SOA formation at a receptor site (Wan Qing Sha (WQS) site) in the PRD. The following results could be obtained. (1) The model could resolve about 34 % on average of observed SOA concentrations at WQS after considering the emissions of S–IVOCs, and 18 %–77 % with the uncertainties of the S–IVOC emission inventory considered. (2) The simulated SOA over the PRD region was increased by 161 % with the input of S–IVOC emissions, and it could be decreased to 126 % after the reaction coefficient of S–IVOCs with OH radical was improved. (3) Among all anthropogenic sources of S–IVOCs, industrial emission was the most significant contributor of S–IVOCs for SOA formation, followed by on-road mobile, dust, biomass burning, residential, and off-road mobile emissions. Overall, this study firstly quantified emissions of S–IVOCs and evaluated their roles in SOA formation over the PRD, which contributes towards significantly improving SOA simulation and better understanding of SOA formation mechanisms in the PRD and other regions in China.
- Article
(5831 KB) - Full-text XML
-
Supplement
(1432 KB) - BibTeX
- EndNote


As the key component, secondary organic aerosol (SOA) accounts for 20 %–80 % of organic aerosol (OA), while OA accounts for 20 %–90 % of fine particulate matter (PM2.5) (Kanakidou et al., 2005; Carlton et al., 2009; Zhang et al., 2007, 2013). They not only affect atmospheric chemistry, climate change, radiation balance, visibility, and air quality (Kanakidou et al., 2005; Pope et al., 2002), but also endanger human and vegetation health (Gehring et al., 2013; Zhou et al., 2014). In recent years, although PM2.5 concentrations in major city clusters including the Pearl River Delta (PRD) region have shown a declining trend, the annual PM2.5 concentrations are still higher than the World Health Organization (WHO) air quality standards and Air Quality Guideline (Li et al., 2015; Lin et al., 2018). Moreover, the contribution of SOA to PM2.5 is increasing (Huang et al., 2015; Zheng et al., 2014), and it dominates the composition of PM2.5 during episodes of photochemical smog. Therefore, investigating the formation mechanism of SOA is a prerequisite for better control over its precursors and PM2.5, which is becoming increasingly more prominent as the concentrations of SOA precursors continue to increase over the years (Guo et al., 2017).
Three-dimensional chemical transport models (CTMs) have been widely used to investigate the formation and sources of SOA. Initially, organic compounds with similar properties or sources were clustered together in OA (organic aerosol) modules within gridded models due to the high complexity of OA and large varieties of compounds incorporated in the detailed chemical schemes (Johnson et al., 2006), where large uncertainties occurred in simulations of SOA formation. Then a two-product model (Odum et al., 1996) based on the absorptive partitioning theory of Pankow (1994) and fitting methods developed from chamber study data was widely used in the simulation of SOA formation. However, this empirical two-product model was reported to largely underpredict SOA yield because it could not account for the wide range of volatility of organic compounds. Recently, another scheme, i.e., the volatility basis-set approach (VBS, typically one-dimensional VBS; 1-D VBS), was used to overcome the limitation of the two-product model (Donahue et al., 2006). In VBS, organic compounds are classified by their volatility, and it was developed on the basis of the absorptive partitioning theory. The VBS approach improves the modeling of further multigenerational oxidation processes and incorporates low-volatility precursors of SOA, which consequently reduces the discrepancy between observation and simulation results. Furthermore, to capture the fragmentation process and oxidation of OA more accurately, the two-dimensional VBS (2-D VBS) was proposed; 2-D VBS features a more detailed classification of organic compounds in different ranges of volatility and oxidation state. However, despite its potential for accurately simulating the evolution of SOA, it has rarely been used in CTMs because it involves much more complexity and computational expense compared to the widely used 1-D VBS (Donahue et al., 2011, 2012; Zhao et al., 2016a).
Although the scheme for SOA formation has been advanced significantly in recent years, large discrepancies have still been found between the observed and predicted abundance of SOA due to uncertainties in the formation mechanisms of SOA as well as the related parameterization (i.e., SOA yields of precursors of SOA) and the omittance of key precursors. For example, through recent chamber experiments, SOA yields of aromatics have been updated to be much higher than previous ones (Ng et al., 2007), while suggestions have also been made to consider wall losses of SOA in the SOA yields of each VOC precursor extracted from chamber experiments (Hildebrandt et al., 2009; Li et al., 2017a). In addition to the SOA yields, recent studies indicated that in-cloud aqueous-phase formation (Lim, Carlton and Turpin, 2005; Ervens et al., 2011) and oxidation of VOCs (volatile organic compounds) that were previously not considered in models (i.e., isoprene, benzene, and acetylene) could be important pathways for SOA formation (Claeys et al., 2004; Martín-Reviejo and Wirtz, 2005; Volkamer et al., 2009).
In addition to the traditional precursors (i.e., VOCs), recent laboratory and modeling studies have suggested that semi-volatile and intermediate-volatility organic compounds (S–IVOCs), which have effective saturation concentrations in the ranges of 10−2–103 and 104–106 µg m−3 at 298 K and 1 atm, respectively, are key factors affecting the underestimation of SOA in numerical simulations (Donahue et al., 2006; Robinson et al., 2007; Jiang et al., 2012). To date, S–IVOCs are found to mainly include straight-chain and branched alkanes with carbon numbers >12, alkylcyclohexanes, unsubstituted and substituted polycyclic aromatic hydrocarbons (PAHs), alkylbenzenes, and cyclic and polycyclic aliphatic material (Zhao et al., 2015; Li et al., 2018; Drozd et al., 2019). However, a vast majority of S–IVOC mass still has not been speciated at the molecular level, which is defined as an unresolved complex mixture (UCM) (Jathar et al., 2012; Zhao et al., 2015; Drozd et al., 2019). Incomplete combustion, such as the combustion of fossil fuel, especially vehicle exhaust, has been reported to be a large contributor to S–IVOC emissions in developed regions (May et al., 2013a, b; Ots et al., 2016; Khare and Gentner, 2018). Recent studies have also shown that consumer products and commercial or industrial products, processes, and materials are significant sources of unspeciated S–IVOCs (Czech et al., 2016; Khare and Gentner, 2018). Conversely, biogenic S–IVOCs have recently been demonstrated to have a non-negligible impact on SOA formation, but very few measurements have been reported on their emissions (Palm et al., 2016, 2017). Therefore, to improve the performance of models simulating SOA formation, anthropogenic emissions and the chemical mechanisms of S–IVOCs have been incorporated into different models, including box, regional, and global models (Robinson et al., 2007; Shrivastava et al., 2008, 2011, 2015; Grieshop et al., 2009; Pye and Seinfeld, 2010; Tsimpidi et al., 2010; Ahmadov et al., 2012; Woody et al., 2015). In terms of chemical mechanisms, although 1-D VBS is still widely used in current models, one of the most important improvements is the adoption of the 2-D VBS scheme as mentioned above (Woody et al., 2015; Zhao et al., 2016a). For emission inventories, which is a prerequisite condition for improving model simulation of SOA formation and evaluating the roles of S–IVOCs in SOA production, previous studies typically estimated S–IVOC emissions from various sources based on the relationship of S–IVOCs with POA, NMHCs (non-methane hydrocarbons), or naphthalene as well as emission profiles and source-specific volatility distribution factors for S–IVOC emissions extracted from various studies (Robinson et al., 2007; Pye et al., 2010; Shrivastava et al., 2011; May et al., 2013a, b, c; Woody et al., 2015; Zhao et al., 2016a). However, very few studies have directly developed an emission inventory of S–IVOCs appropriate for CTMs. For example, only Liu et al. (2017) reported an emission inventory of vehicular IVOCs for China, estimating total emissions of IVOCs from vehicles in different provinces based on emission factors obtained from measurements of vehicle exhaust in the United States. However, this emission inventory was flawed as it could not be applied to CTMs because the total IVOC emissions had not been spatially allocated into grid cells, and it was not sufficiently localized as the emission factors of IVOCs from vehicle exhaust were completely based on measurements in the United States (Zhao et al., 2015, 2016b). As such, most modeling studies used the same parameterizations and volatility distributions of all emissions independent of source types to simulate SOA formation. However, S–IVOC emissions and characteristics of SOA and particles widely vary among different countries and regions.
The significance of S–IVOCs has been demonstrated through lab and modeling studies in different environments, but the emissions of S–IVOCs and their roles in the formation of SOA in China are still poorly understood, especially in the PRD region, where photochemical smog and high oxidative capacity are frequently observed (Hofzumahaus et al., 2009; Xue et al., 2016). Therefore, in the present study, a gridded emission inventory of S–IVOCs for the PRD region was first developed and then incorporated into the WRF-Chem model (Weather Research and Forecasting model with Chemistry) with the 1-D VBS approach. The objectives of this study are as follows: (i) to examine the potential of considering S–IVOCs for improving the simulation of SOA formation and (ii) to evaluate the contributions of S–IVOC to SOA over the PRD region. This study is the first report focusing on the emissions of S–IVOCs and their contributions to SOA formation in the PRD region, which could advance the understanding of SOA formation mechanisms in the PRD and could be extended to other regions in China. It should be noted that this study mainly focused on anthropogenic S–IVOCs and their roles in SOA formation in the PRD region as anthropogenic S–IVOCs were found to have much greater contributions to SOA formation than biogenic S–IVOCs in developed regions (Palm et al., 2016, 2017; Khare and Gentner, 2018).
Table 1Datasets of all input parameters used in the emission inventory model. Ellipses indicate that not all data were present in the table as the number of data was large (∼400).

a Li et al. (2017b). b Zhao et al. (2011). c He et al. (2011). d Huang et al. (2011). e Hu et al. (2016). f Xu et al. (2015). g Ye et al. (2017). h May et al. (2013a). i Louvaris et al. (2017). j Zhao et al. (2016a). k Zhao et al. (2015). l Shrivastava et al. (2008), etc. m Data of ratios of S–IVOCs to POA for industry are the same as those for on-road mobile sources. n Data of ratios of S–IVOCs to POA for residential sources are the same as those for on-road mobile sources. o Data of ratios of S–IVOCs to POA, O∕C, H∕C, N∕C, and OM∕OC for off-road mobile sources are the same as those for on-road mobile sources. p Data of ratios of S–IVOCs to POA for dust are the same as those for on-road mobile sources; data of ratios of O∕C, H∕C, N∕C, and OM∕OC for dust are the same as those for industry.
2.1 Establishment of the S–IVOC emission inventory
In this study, a gridded emission inventory of S–IVOCs was determined using Eq. (1).
where j and k denote the specific sector and city, respectively; ES∕IVOCs denotes the annual emissions of S–IVOCs; and A, EF, and μ represent the activity level, mean emission factor, and removal efficiency, respectively. Emission factors of S–IVOCs were calculated on the basis of existing traditional POA emission factors using source-specific linear scaling factors because available emission factors of S–IVOCs are limited. Moreover, the traditional POA emission factors for different source categories (e.g., industry, on-road and off-road mobile sources, residential sources, dust, and biomass burning) were obtained from POC (primary organic carbon) emission factors using source-specific ratios of OM∕OC (mass ratios of organic matter to organic carbon), while the POC emission factors were obtained from PM2.5 emission factors by applying the source-specific mass fractions of OC to PM2.5. Therefore, Eq. (1) was extended to Eq. (2). The related parameters of S–IVOCs, including the activity levels, removal efficiency, and spatiotemporal allocations, were assumed to be the same as those of POA and POC for all source categories. S–IVOC emissions in the PRD region for the year 2010 were calculated using Eq. (3), among which the activity levels, removal efficiency, and emission factors were combined and expressed as PM2.5 emissions ( in Eq. 3). Note that the PM2.5 emissions in this study were obtained from a highly resolved spatial anthropogenic PRD regional emission inventory for the year 2010 with a horizontal resolution of 3 km (Zheng et al., 2010b).
The above parameters used in the development of the emission inventories of S–IVOCs of each source category were extracted from recent studies (Table 1). In order to calculate the oxygen fraction and ratios of the non-oxygen component to the carbon component of each species in all anthropogenic sources, which would be required in modeling (Sect. 2.2.2), elemental ratios of O∕C, H∕C, and N∕C were also estimated.
Furthermore, uncertainties of the emission inventory of S–IVOCs, which can be attributed to uncertainties in all parameters, were evaluated and quantified using statistical methods and Monte Carlo simulation, as suggested by Zheng et al. (2010a). Sample correlation coefficients between total S–IVOC emissions and model input parameters or S–IVOC emissions of each specific source category have been calculated to identify the key sources of uncertainties in the estimation of S–IVOC emissions (NARSTO, 2005). Based on the different values of model input parameters from previous studies (Table 1), probabilistic distributions representing uncertainty ranges of different parameters, including FOC, , , OM∕OC, O∕C, H∕C, and N∕C, from different source categories are summarized in Table 2. Additionally, uniform distribution based on the results of uncertainty assessment in Zhong et al. (2018) was applied to all source categories of PM2.5 emission in the present study.
Table 2Probabilistic distributions with uncertainty range at the 95 % confidence interval in model input parameters.
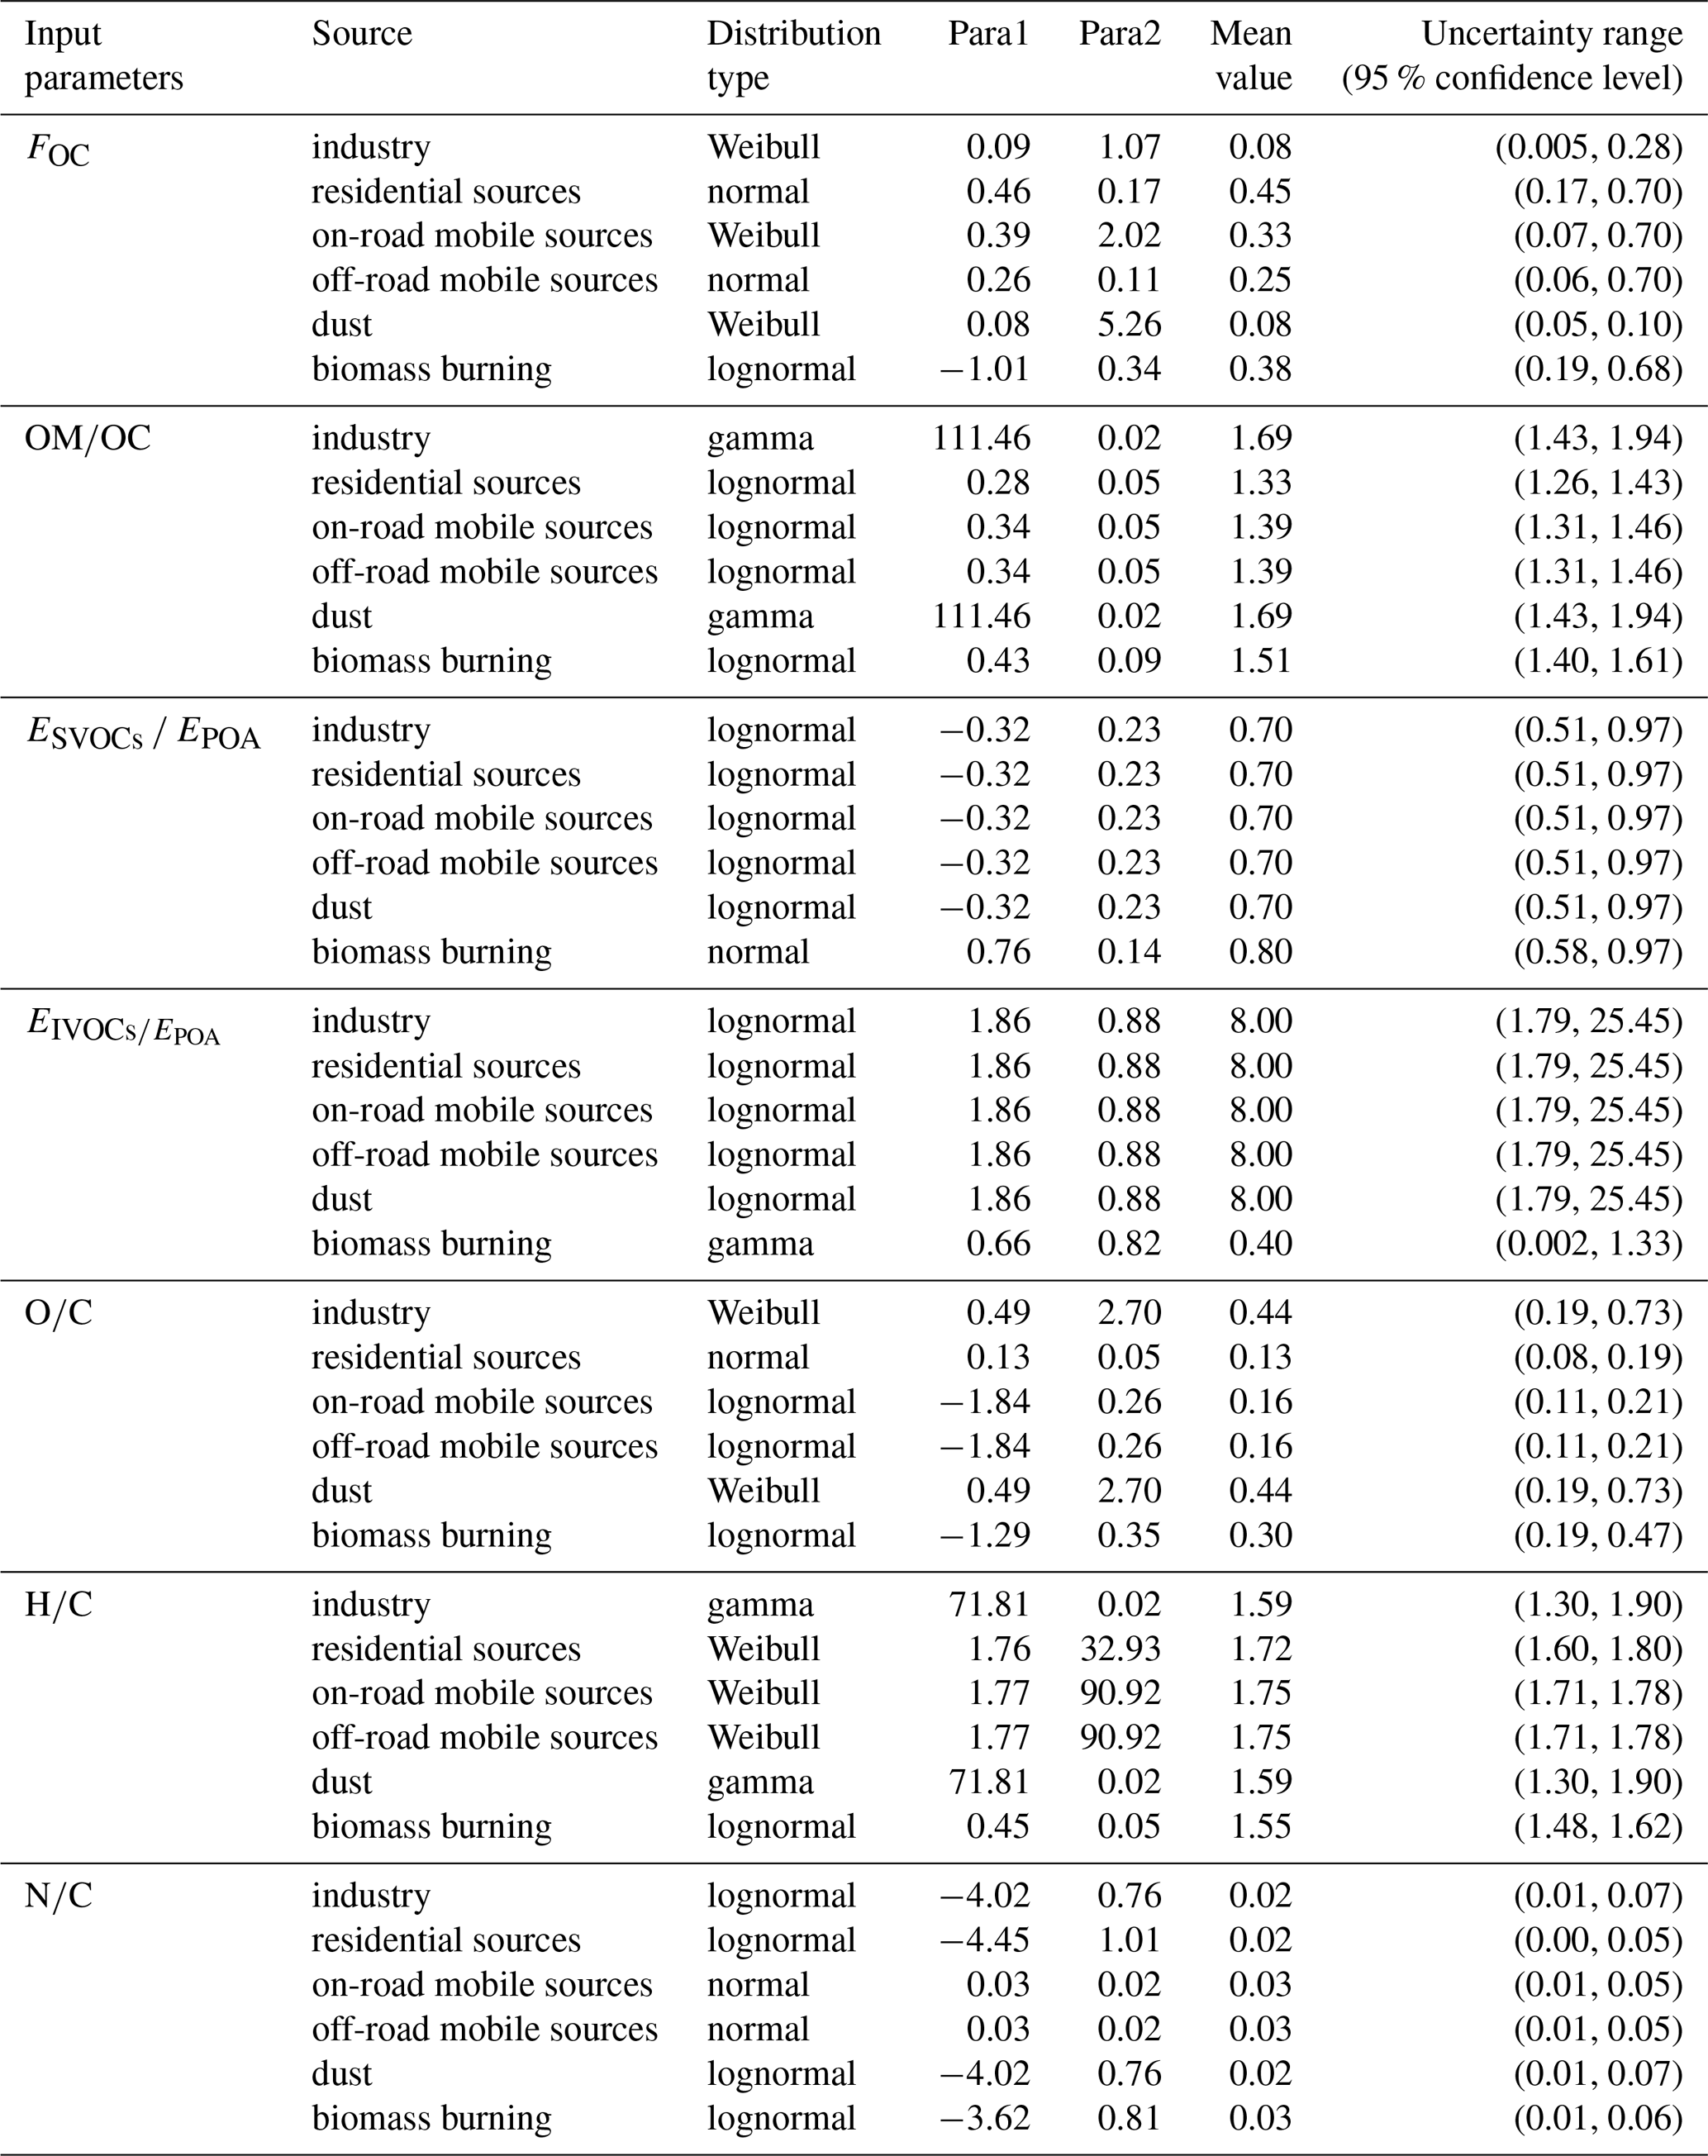
para1: the mean for normal, the mean of lnx for lognormal, and the scale parameter for gamma and Weibull distributions. para2: the standard deviation for normal, the standard deviation of lnx for lognormal, and the shape parameter for gamma and Weibull distributions.
2.2 Model description and settings
2.2.1 Model settings
To further evaluate the roles of S–IVOCs in SOA formation, the newly developed S–IVOC emission inventory was incorporated into the WRF-Chem model to simulate the formation of SOA and investigate its impact factors in the PRD region. The WRF-Chem model (https://ruc.noaa.gov/wrf/wrf-chem/, last access: 8 May 2019) is a fully coupled online meteorology–chemistry model that can be used to simulate physical and chemical processes simultaneously (Grell et al., 2005). This model has been widely used to simulate the formation of secondary products (i.e., SOA and O3), including their relationship with precursors, the influence of meteorological conditions, and contributions from anthropogenic and biogenic emissions from regional to cloud resolving scales (Fast et al., 2009, 2006; He et al., 2015; Jiang et al., 2012; Li et al., 2011; Liu, 2014; Sharma et al., 2017; Tie et al., 2013).
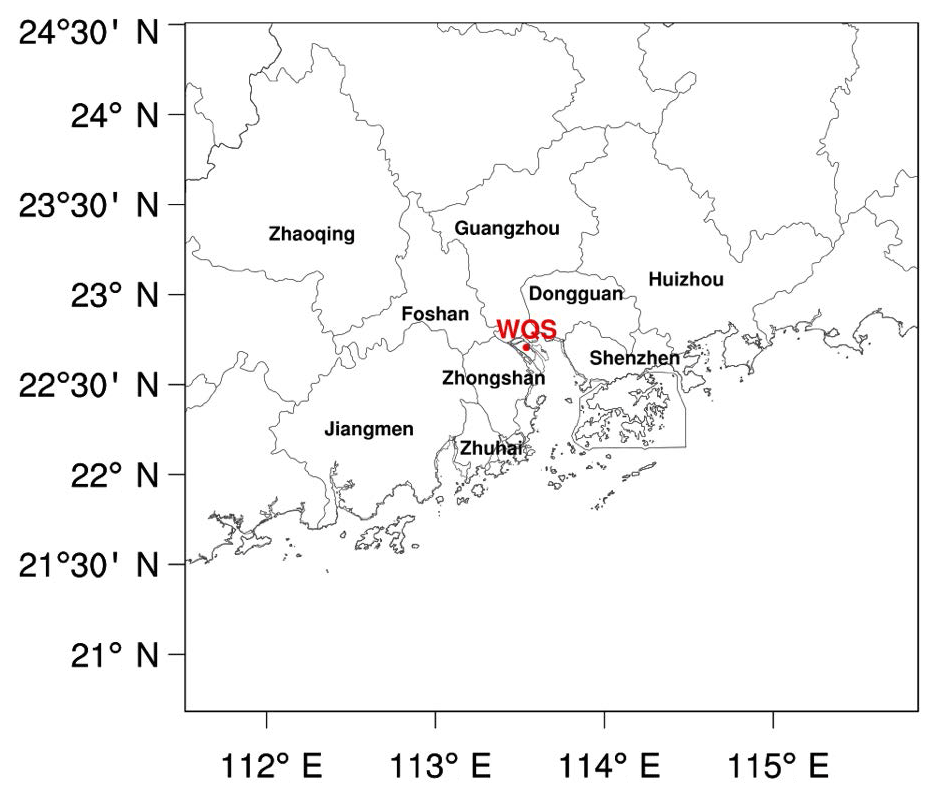
The model configuration is presented in Table S1 in the Supplement, and the model domain is presented in Fig. 1. The simulation was conducted from 12:00 UTC on 17 November 2008 to 00:00 UTC on 26 November 2008 because measured data of SOA were available from 19 to 25 November 2008 at the receptor site of the PRD region, i.e., the Wan Qing Sha (WQS) site. During the simulation period, the first 24 h was consumed as the spin-up time for the simulation. The initial meteorological field and boundary meteorological conditions were provided by the ERA-Interim reanalysis dataset from the European Centre for Medium-Range Weather Forecasts (ECMWF) with the resolution of , while the chemical boundary condition was obtained from the Model for Ozone and Related chemical Tracers (MOZART) global simulation of trace gases and aerosols (Emmons et al., 2010). The above initial field and boundary meteorological conditions have been confirmed to be appropriate for the reproduction of observed meteorological parameters in the PRD (Situ et al., 2013).
The gas-phase chemistry mechanism used in the simulation was SAPRC-99 (Statewide Air Pollution Research Center), including 235 reactions of 80 gases (Carter, 2000). It should be noted that the gas-phase photochemical oxidation of gas-phase organic species for the formation of SOA, e.g., the gas-phase chemistry of BVOCs (biogenic VOCs) such as isoprene, monoterpenes, and sesquiterpenes, has been recently updated and incorporated in the mechanism (Situ et al., 2013). In addition, the Model for Simulating Aerosol Interactions and Chemistry (MOSAIC) aerosol chemistry mechanism coupled with two-species VBS treatment was used to represent aerosol processes (Zaveri et al., 2008). The MOSAIC scheme includes aerosol species, such as sulfates, nitrates, ammonium salts, sodium salts, chlorine salts, calcium salts and other inorganics (OIN), organic carbon (OC), elemental carbon (EC), and water, but does not consider the formation of SOA from organic vapors (Fast et al., 2009). Therefore, this mechanism was coupled with a simplified two-species 1-D VBS (Sect. 2.2.2) developed by Shrivastava et al. (2011) to simulate the formation of OA.
Anthropogenic emissions of PM10, PM2.5, VOCs, NOx, SO2, and CO in the PRD region were derived from a highly resolved spatial anthropogenic PRD regional emission inventory for the year 2010 with a horizontal resolution of 3 km, whereas emissions outside the PRD region were based on the Guangdong provincial emission inventory (Zheng et al., 2010b). This emission inventory was developed using the best available domestic emission factors and activity data, including the sectors of industry, on-road and off-road mobile sources, residential sources, dust, and biomass burning (Zheng et al., 2009). In our emission inventory, dust mainly includes road fugitive dust and building construction dust. Particles containing many toxic metals and organic contaminants such as PAHs and long-chain alkanes from various sources (e.g., weathered materials of street surfaces, automobile exhaust, lubricating oils, gasoline, diesel fuel, tire particles, construction materials, and atmospherically deposited materials) can be deposited on roads and construction sites, which are known as road fugitive dust and building construction dust (Takada et al., 1990; Rogge et al., 1993; Chen et al., 2012). Furthermore, dust is a large source of POA at urban locations, and S–IVOCs are frequently co-emitted with POA (Zheng et al., 2012; Shrivastava et al., 2013; van Drooge and Grimalt, 2015). Indeed, S–IVOCs, such as n-alkanes (C19-C39) and PAHs, have been identified in dust samples, confirming that dust could be a source of S–IVOCs (Takada et al., 1990; Rogge et al., 1993; Schefuß et al., 2003; Dong and Lee, 2009). In addition, BVOC emissions were derived from the Model of Emissions of Gases and Aerosols from Nature (MEGAN, https://sites.google.com/uci.edu/bai, last access: 8 May 2019) developed by Guenther et al. (2012).
2.2.2 VBS approach
With the configuration mentioned above, the WRF-Chem model used in this study provides a simplified and computationally efficient two-species 1-D VBS scheme coupled with MOSAIC that includes V-SOA (SOA formed by the oxidation of VOC-traditional SOA precursors emitted from varied anthropogenic and biogenic sources) and SI-SOA (SOA formed by the oxidation of S–IVOC-untraditional SOA precursors emitted from anthropogenic sources). This scheme was simplified from the detailed nine-species VBS, a scheme with more surrogate organic compounds categorized by different ranges of volatility (Shrivastava et al., 2011). The simplified two-species scheme categorized S–IVOCs into two volatility species with effective saturation concentration C∗ equal to 0.01 and 105 µg m−3 at 298 K and 1 atm. C∗ is the inverse of the Pankow-type equilibrium partitioning coefficient, which describes the fraction of gas and particle components in SOA formation. Note that gas-phase SVOCs and all IVOCs in this mechanism are represented by species with C∗ equal to 105 µg m−3, and IVOCs were considered to remain in the gas phase before photochemical oxidation in the atmosphere. POA and SI-SOA were assumed to be non-volatile in the model. POA is the remaining aerosol component after the evaporation of gas-phase SVOCs. In this mechanism, POA with SI-SOA are represented by species with C∗ equal to 0.01 µg m−3. This simplified two-species VBS has been confirmed to be more suitable for computationally extensive models (i.e., WRF-Chem) for running complex coupled cloud–aerosol–meteorology because of its similar predictions of total OA mass, individual OA components, and evolution of organic aerosols in addition to its reduction in computational cost by a factor of 2, compared to the detailed nine-species VBS (Shrivastava et al., 2011).
In terms of the formation of SI-SOA in the two-species VBS, the primary oxidation of S–IVOCs transformed the gas-phase high-volatility S–IVOCs ( µg m−3) into the extremely low-volatility SI-SOAs ( µg m−3) with the OH reaction rate constant (kOH) of cm3 molecule−1 s−1 and oxygen yield of 50 %. In order to align the SOA predictions between two-species and nine-species VBS schemes, kOH in the two-species VBS had been reduced by a factor of 7 (i.e., cm3 molecule−1 s−1) from that of the nine-species VBS ( cm3 molecule−1 s−1) because the order of magnitude reduction in volatility through one generation of oxidation in the two-species VBS was 7 times that in the nine-species VBS. Note that the kOH of cm3 molecule−1 s−1 in the nine-species VBS was assumed to be ∼50 % higher than that of a typical large saturated n-alkane as suggested by previous studies (Atkinson and Arey, 2003; Robinson et al., 2007). The specific oxidation reaction equations are as follows (the detailed description of the parameters in the equations are provided in the Supplement):
where (g) denotes gas phase; the subscript “1” denotes the low-volatility species ( µg m−3 at 298 K and 1 atm) and “2” denotes the high-volatility species ( µg m−3 at 298 K and 1 atm); e denotes the emission categories, including biomass burning and other anthropogenic emissions; c denotes the non-oxygen (C, H, N) component of the species; and o represents the oxygen component.
In addition, V-SOA formed by the oxidation of anthropogenic and biogenic VOCs in this mechanism was considered using one-species treatment with the configuration of the saturation concentration C∗ of V-SOA as 1 µg m−3 at 298 K and 1 atm. NOx-dependent fixed one-product yields for all VOC precursors were proposed by Shrivastava et al. (2011).
Gas-particle partitioning between the gas and aerosol phases of both SI-SOA and V-SOA was calculated using the absorptive partitioning theory as described by Donahue et al. (2006):
where Ci,a denotes aerosol-phase SOA mass concentration at a given volatility bin i (here, its bin boundaries are C∗ values of 0.01 and/or 105 µg m−3); Ci,tot denotes the total mass concentrations of gas- and aerosol-phase SOA for bin i; denotes the saturation concentration for bin i; and M denotes total mass concentrations of OA, which includes POA and SOA.
To calculate the influence of temperature on C∗, the Clausius–Clapeyron equation was used:
where and denote saturation concentration at T and T0 (reference temperature 298 K), respectively, for bin i; R is the universal gas constant; and ΔHi denotes the enthalpy of vaporization for bin i.
2.2.3 Model scenarios
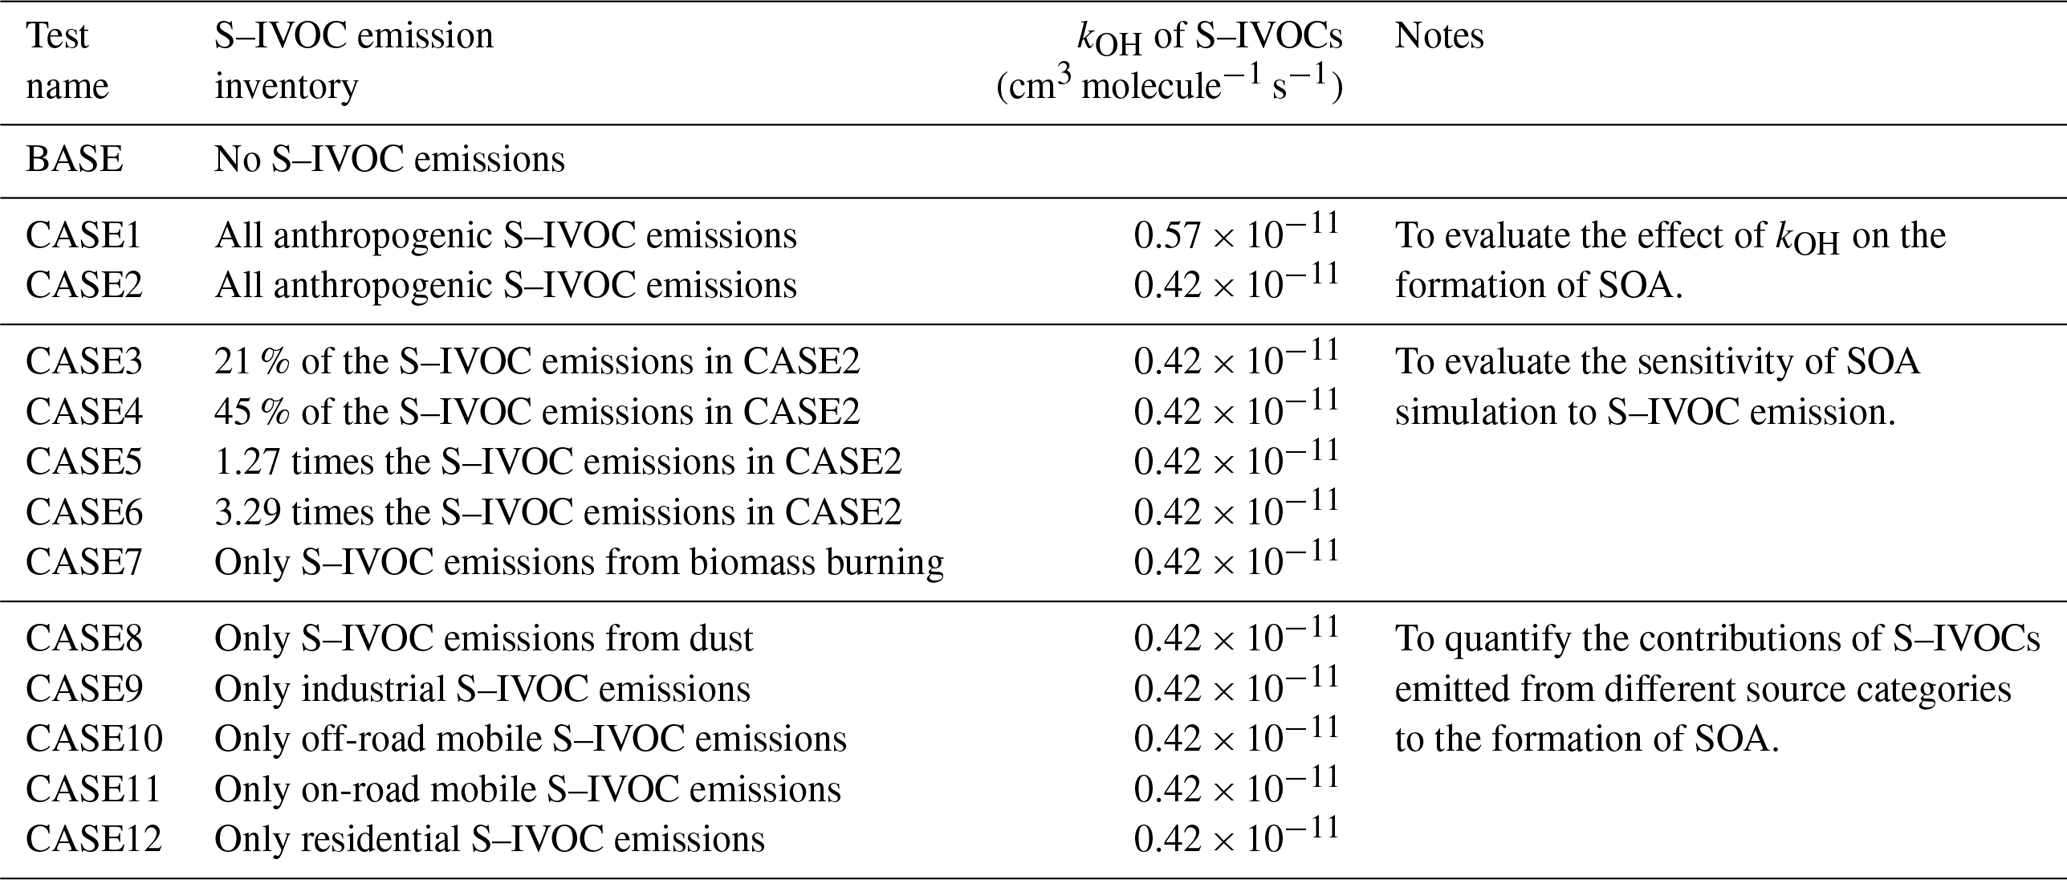
In order to evaluate the roles of S–IVOCs in the formation of SOA over the PRD region, 13 simulations were performed from 19 to 25 November 2008, including one control BASE simulation and 12 sensitivity CASE simulations. Table 5 provides detailed descriptions on the base and sensitivity scenarios. For the base scenario, the simulation was conducted without the input of S–IVOC emissions. For CASE1, this simulation was conducted with the input of S–IVOCs from all anthropogenic emissions (Sect. 3) in order to estimate the contributions of S–IVOCs to the formation of SOA.
A large uncertainty of cm3 molecule−1 s−1 was found for the kOH of S–IVOC species in the two-species VBS used in the current WRF-Chem model, which was calculated on the basis of the kOH of the nine-species VBS that was assumed to be about 50 % higher than that of a typical large saturated n-alkane (Atkinson and Arey, 2003; Robinson et al., 2007). In this study, the kOH of S–IVOC species was updated according to the emission factors and kOH of 57 speciated IVOCs from the vehicular emission measurements (Zhao et al., 2015, 2016b) using the molar weighting method by the following equation (Carter, 2000):
where i denotes the specific S–IVOC species; tot denotes all S–IVOC species; EF denotes the emission factor; and kOH denotes the OH reaction rate constant. The kOH of S–IVOCs was calculated to be cm3 molecule−1 s−1, which is smaller than the original kOH of cm3 molecule−1 s−1 in the model. Then, the reaction rate with OH radicals was reduced to cm3 molecule−1 s−1 by a factor of 7 in order to ensure its applicability to the two-species VBS scheme, as suggested in Sect. 2.2.2. To evaluate the effect of the OH reactivity of S–IVOCs on the formation of SOA, CASE2 was conducted using the new updated kOH with the input of the same S–IVOC emission as in CASE1.
For CASE3–6, the simulations were designed with varied amounts of S–IVOC emissions at the 50 % and 95 % confidence intervals (Sect. 3.2) using the new updated kOH of S–IVOCs in order to evaluate the sensitivity of the SOA simulation to the magnitude of S–IVOC emissions and quantify the uncertainty ranges in SOA prediction attributable to uncertainties of S–IVOC emissions. Note that CASE3 and CASE6 were conducted with the lower and upper limits of the uncertainty ranges of S–IVOC emissions estimated at the 95 % confidence interval (which was 21 % and 329 % of the amounts in the inventory as suggested in Sect. 3.2) as presented in Table 4, whereas CASE4 and CASE5 were conducted with the edges of the uncertainty ranges of S–IVOC emissions estimated at the 50 % confidence interval (45 % and 127 % of the amounts in the inventory as suggested in Sect. 3.2). Furthermore, CASES7–12 were simulated using the new updated kOH of S–IVOCs with only the input of individual S–IVOC emissions, i.e., biomass burning, dust, industry, off-road mobile, on-road mobile, and residential sources, to quantify the contributions of each S–IVOC emission to the formation of SOA.
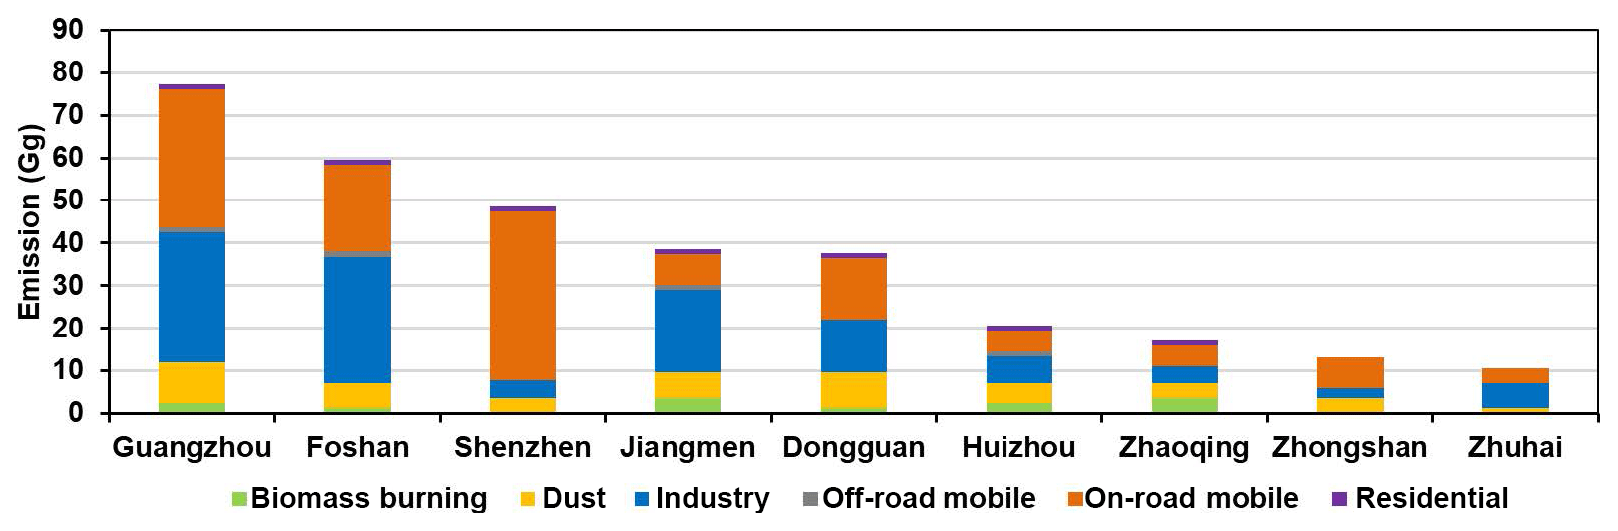
Table 3S–IVOC emission inventory in the PRD region for the year 2010.
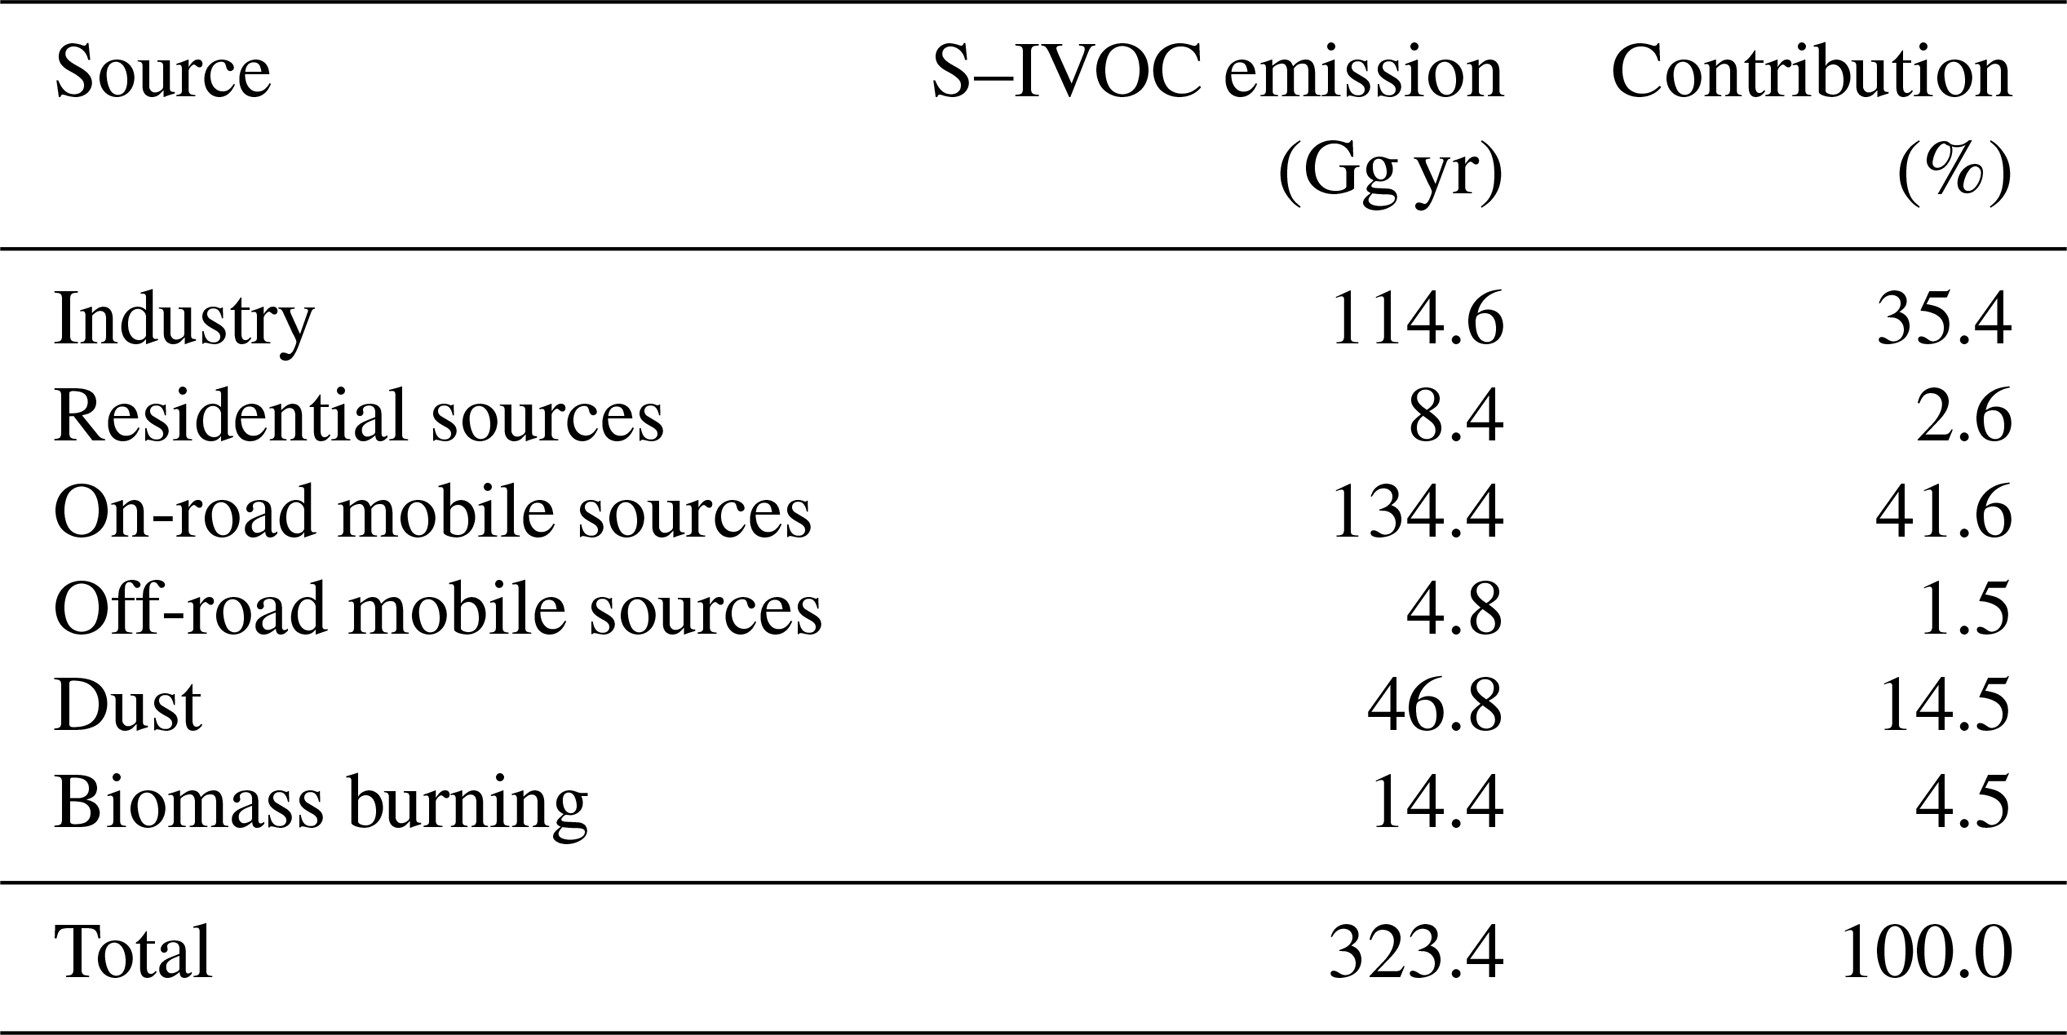
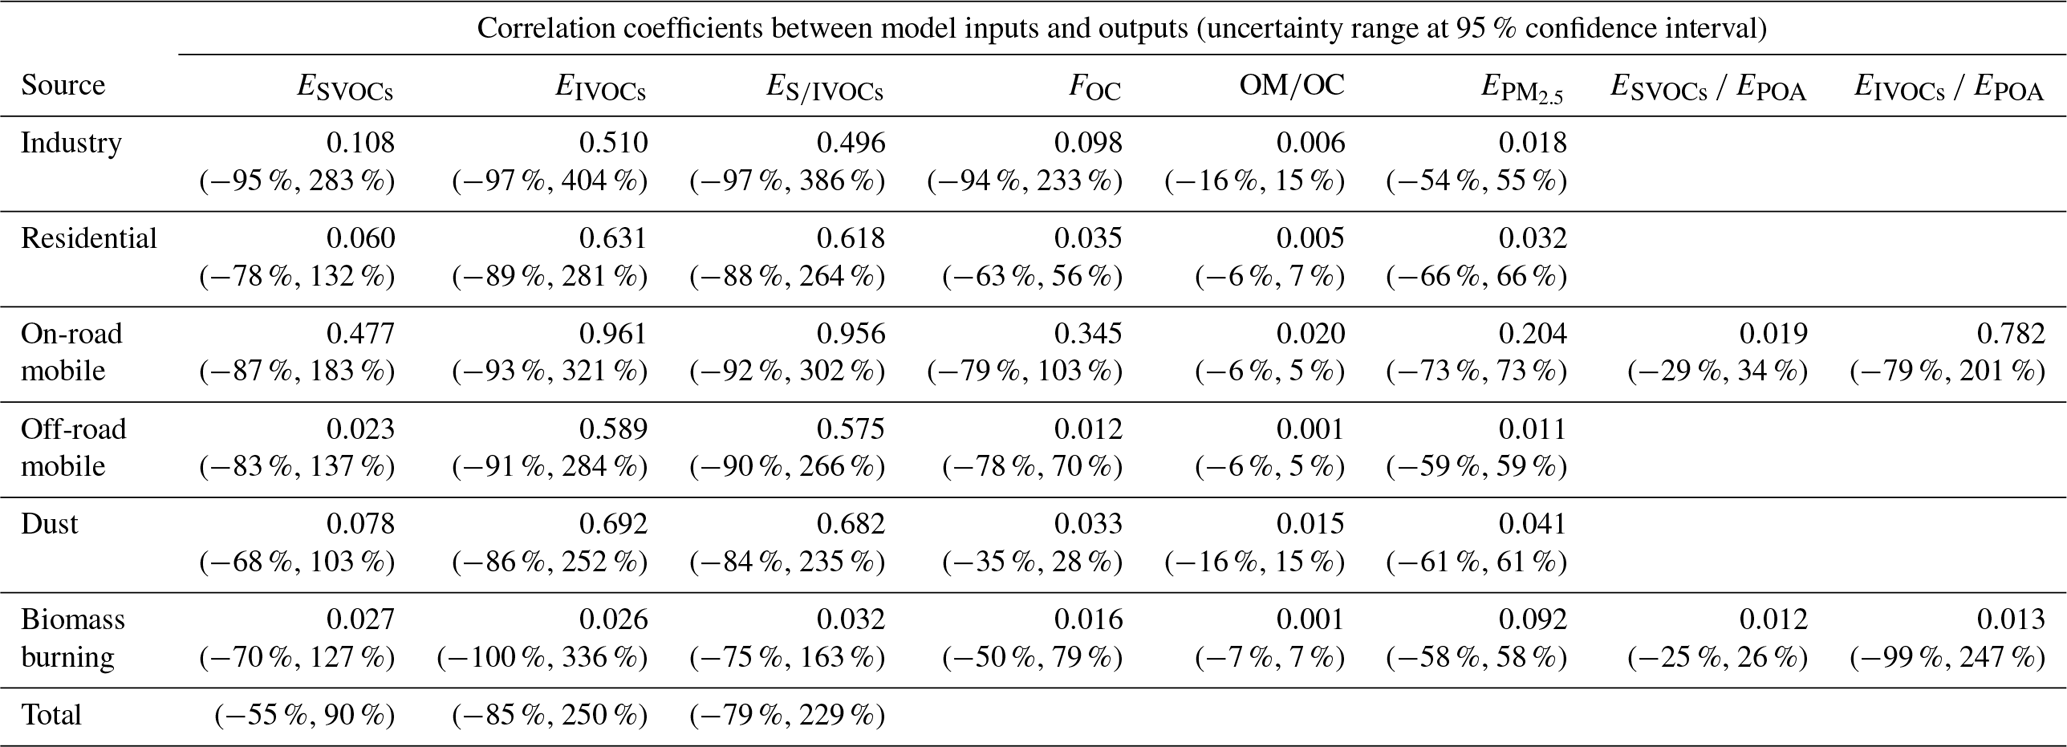
Table 4Uncertainty assessment of the S–IVOC emission inventory for the year 2010.
3.1 S–IVOC emissions
Using the parameterization method described in Eq. (3), hourly gridded S–IVOC emissions in the PRD region for the year 2010 with a resolution of 3 km × 3 km were estimated with parameters given in Table 2 and the high-resolution PM2.5 emission inventory (Zheng et al., 2010b). As shown in Table 3, the total S–IVOC emissions in the PRD region are 323.4 Gg in 2010, of which on-road mobile sources contribute about 41.6 % (134.4 Gg), industry about 35.4 % (114.6 Gg), dust about 14.5 % (46.8 Gg), biomass burning about 4.5 % (14.4 Gg), residential sources about 2.6 % (8.4 Gg), and off-road mobile sources about 1.5 % (4.8 Gg). Regarding city-level contributions, Guangzhou was the largest contributor to S–IVOC emissions with a contribution of 23.9 %, followed by Foshan (18.4 %), Shenzhen (15.1 %), Jiangmen (11.9 %), and Dongguan (11.7 %) as shown in Fig. 2. Notably, as expected, on-road mobile sources and industry, which involve large amounts of vehicles and industrial plants, were the top two contributors in all cities, except for Zhongshan, where the contribution of dust to total S–IVOC emissions was higher than industry because of the accelerating urbanization with frequent urban constructions but much fewer industrial plants than in Guangzhou, Foshan, Dongguan, and Shenzhen (Pan et al., 2015; Yin et al., 2015; GSY, 2010). It was also of interest to find that the magnitudes of S–IVOC emissions from dust and industry in Zhaoqing and Shenzhen were similar, but the contributions were different. Dust contributed about 21.1 % (3.6 Gg) and 7.4 % (3.6 Gg) to the S–IVOC emissions in Zhaoqing and Shenzhen, and industry contributed about 22.8 % (3.9 Gg) and 8.8 % (4.3 Gg), respectively. The contributions of dust and industry to S–IVOC emissions in Shenzhen were smaller than those in Zhaoqing, attributable to the dominance of on-road mobile S–IVOC emissions in Shenzhen (81.3 %, 39.6 Gg) because of the dense traffic (Pan et al., 2015). As Shenzhen and Zhaoqing have much fewer industrial point sources than cities located in the southeastern PRD such as southern Guangzhou and Foshan (Pan et al., 2015), their corresponding industrial S–IVOC emissions were also less. There were relatively higher S–IVOC emissions from road fugitive dust and lower emissions from building construction dust in Zhaoqing than in Shenzhen because of shorter road lengths and more developed construction industries in Shenzhen (GSY, 2011; Peng et al., 2013), resulting in similar magnitudes of S–IVOC emissions from dust in these two cities.

Figure 3Spatial distribution of S–IVOC emissions from different source categories for the year 2010: (a) biomass burning, (b) dust, (c) industry, (d) off-road mobile sources, (e) on-road mobile sources, (f) residential sources.
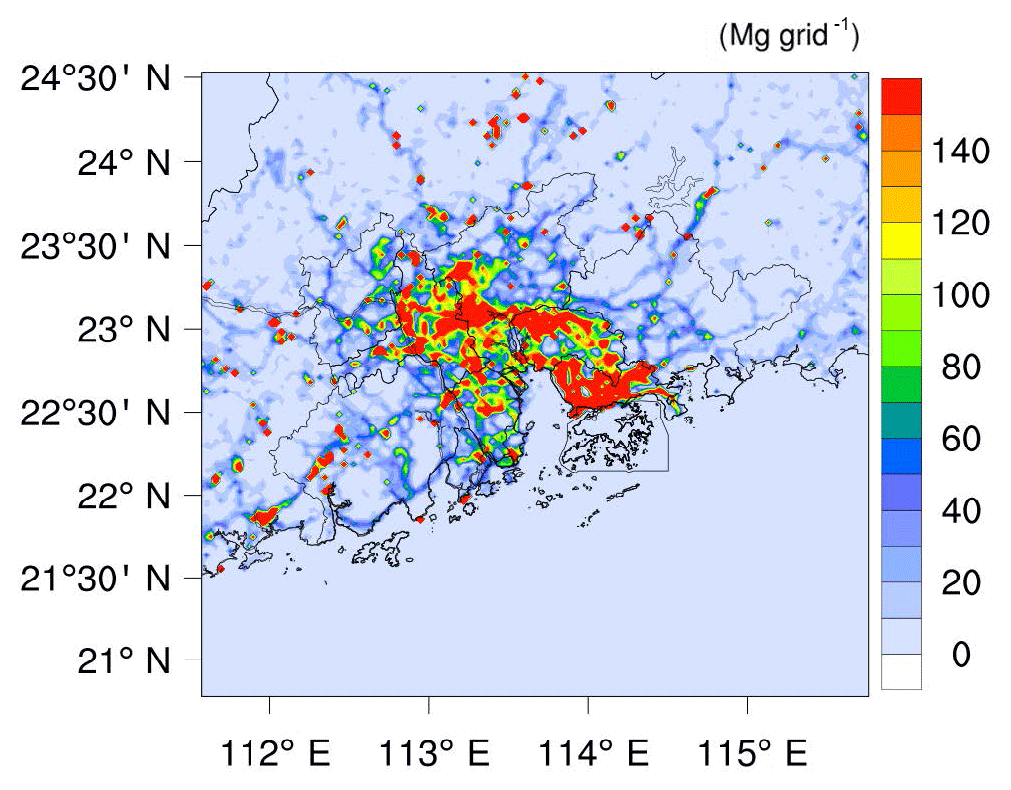
Figure 3a–f show the spatial distributions of S–IVOCs emitted from different sectors for the year 2010. In general, the spatial characteristics of S–IVOC emissions in 2010 (Fig. 4) were consistent with the distribution of on-road mobile and industrial emissions (Fig. 3), the top two S–IVOC contributors in this region. Furthermore, the spatial distributions of total S–IVOC emissions agreed well with the road network with the high S–IVOC emissions located in central cities including Guangzhou, Foshan, Dongguan, and Shenzhen. Large amounts of emissions from biomass burning were found in Zhaoqing, Jiangmen, and Huizhou, which are characterized by extensive combustion of household firewood and straw associated with the large rural populations (Fig. 3a), contributing nearly 43 % to total rural populations in the PRD region in 2010 (GSY, 2011; Yuan et al., 2010). In contrast, high S–IVOC emissions from dust were mainly concentrated in Guangzhou, Foshan, Dongguan, Shenzhen, and Zhongshan, associated with heavy traffic flows and frequent urban constructions because of preparation for the 2010 Asian Games and accelerating urbanization processes in recent years (Fig. 3b). The high industrial emissions of S–IVOCs were mainly concentrated in Foshan, Dongguan, Zhongshan, and Guangzhou, where numerous industrial point sources and power plants are located (Fig. 3c). The spatial distributions of S–IVOCs emitted from on-road mobile sources were very consistent with the patterns of road networks in the PRD region. The emissions were concentrated in central economically developed cities with large numbers of vehicles (Fig. 3e). Compared with the abovementioned sectors, S–IVOC emissions from residential and off-road mobile sources in the PRD region were lower (Fig. 3d and f). Nevertheless, the total S–IVOC emissions (323.4 Gg) were only a quarter of total VOC emission (1224.5 Gg) in the PRD region in 2010 (Fig. 5), but they were more than 6 times the total OC emission (52.9 Gg). Moreover, the contributions of different sectors varied in different emission inventories. For example, biogenic and solvent use sources contributed to the overall VOC emissions by 45 % in total but did not contribute to emissions of S–IVOCs, PM2.5, and OC. The contribution of biomass burning (4 %, 14.4 Gg) to S–IVOCs was much smaller than that to OC (24 %, 12.9 Gg) because the emission ratio of IVOCs to POA for biomass burning is much smaller than that of other sectors. Industrial sources contributed less to S–IVOC emissions than to PM2.5 with contributions of 35 % and 52 %, respectively, while on-road mobile sources contributed more to S–IVOC emissions (42 %, 134.4 Gg) as the fraction of OC in PM2.5 (FOC) in on-road mobile emissions was higher than that in industrial emissions, when other parameters in the emission model for these two sectors were similar (Table 2).

3.2 Uncertainties in S–IVOC emissions
An uncertainty assessment of the 2010 PRD regional S–IVOC emission inventory together with a sensitivity analysis based on the Monte Carlo simulation and sample correlation coefficient method (Zheng et al., 2010a) were performed to determine the ranges of uncertainties and identify the key sources of uncertainties in S–IVOC emission estimates. Table 4 lists estimated ranges of uncertainties and associated correlation coefficients with estimated total S–IVOC emissions for the different parameters used in calculating the total S–IVOC emissions in different source categories. As shown in Table 4, the uncertainty in the total S–IVOC emissions was very high with a relative error of −79 %–229 % at the 95 % confidence interval, which could be mainly attributed to uncertainties in the S–IVOC emissions of the on-road mobile sources because of the largest correlation coefficient of the on-road mobile S–IVOC emissions with total S–IVOC emissions among all the source categories. It is noteworthy that the uncertainty ranges of the emission inventories of S–IVOCs were wider than those of VOCs and PM2.5, which were only −6 %–99 % and −6 %–77 %, respectively (Zhong et al., 2018). For input parameters in the emission model, the correlation coefficients between total S–IVOC emissions and FOC for the on-road mobile sources or ratios of EIVOCs ∕ EPOA for all source categories, except biomass burning, were very large, indicating that these parameters were the key sources of high uncertainties in the S–IVOC emission estimates. It should be noted that the actual uncertainties in S–IVOC emission estimates should be larger because the same ratios of EIVOCs ∕ EPOA and ESVOCs ∕ EPOA were used for all source categories, except biomass burning, which was only based on measurements of vehicular emission. These results indicated that more measurement of FOC from on-road mobile emission and source-specific measurements of EIVOCs ∕ EPOA and ESVOCs ∕ EPOA is key to reducing uncertainties in S–IVOC emission estimates.
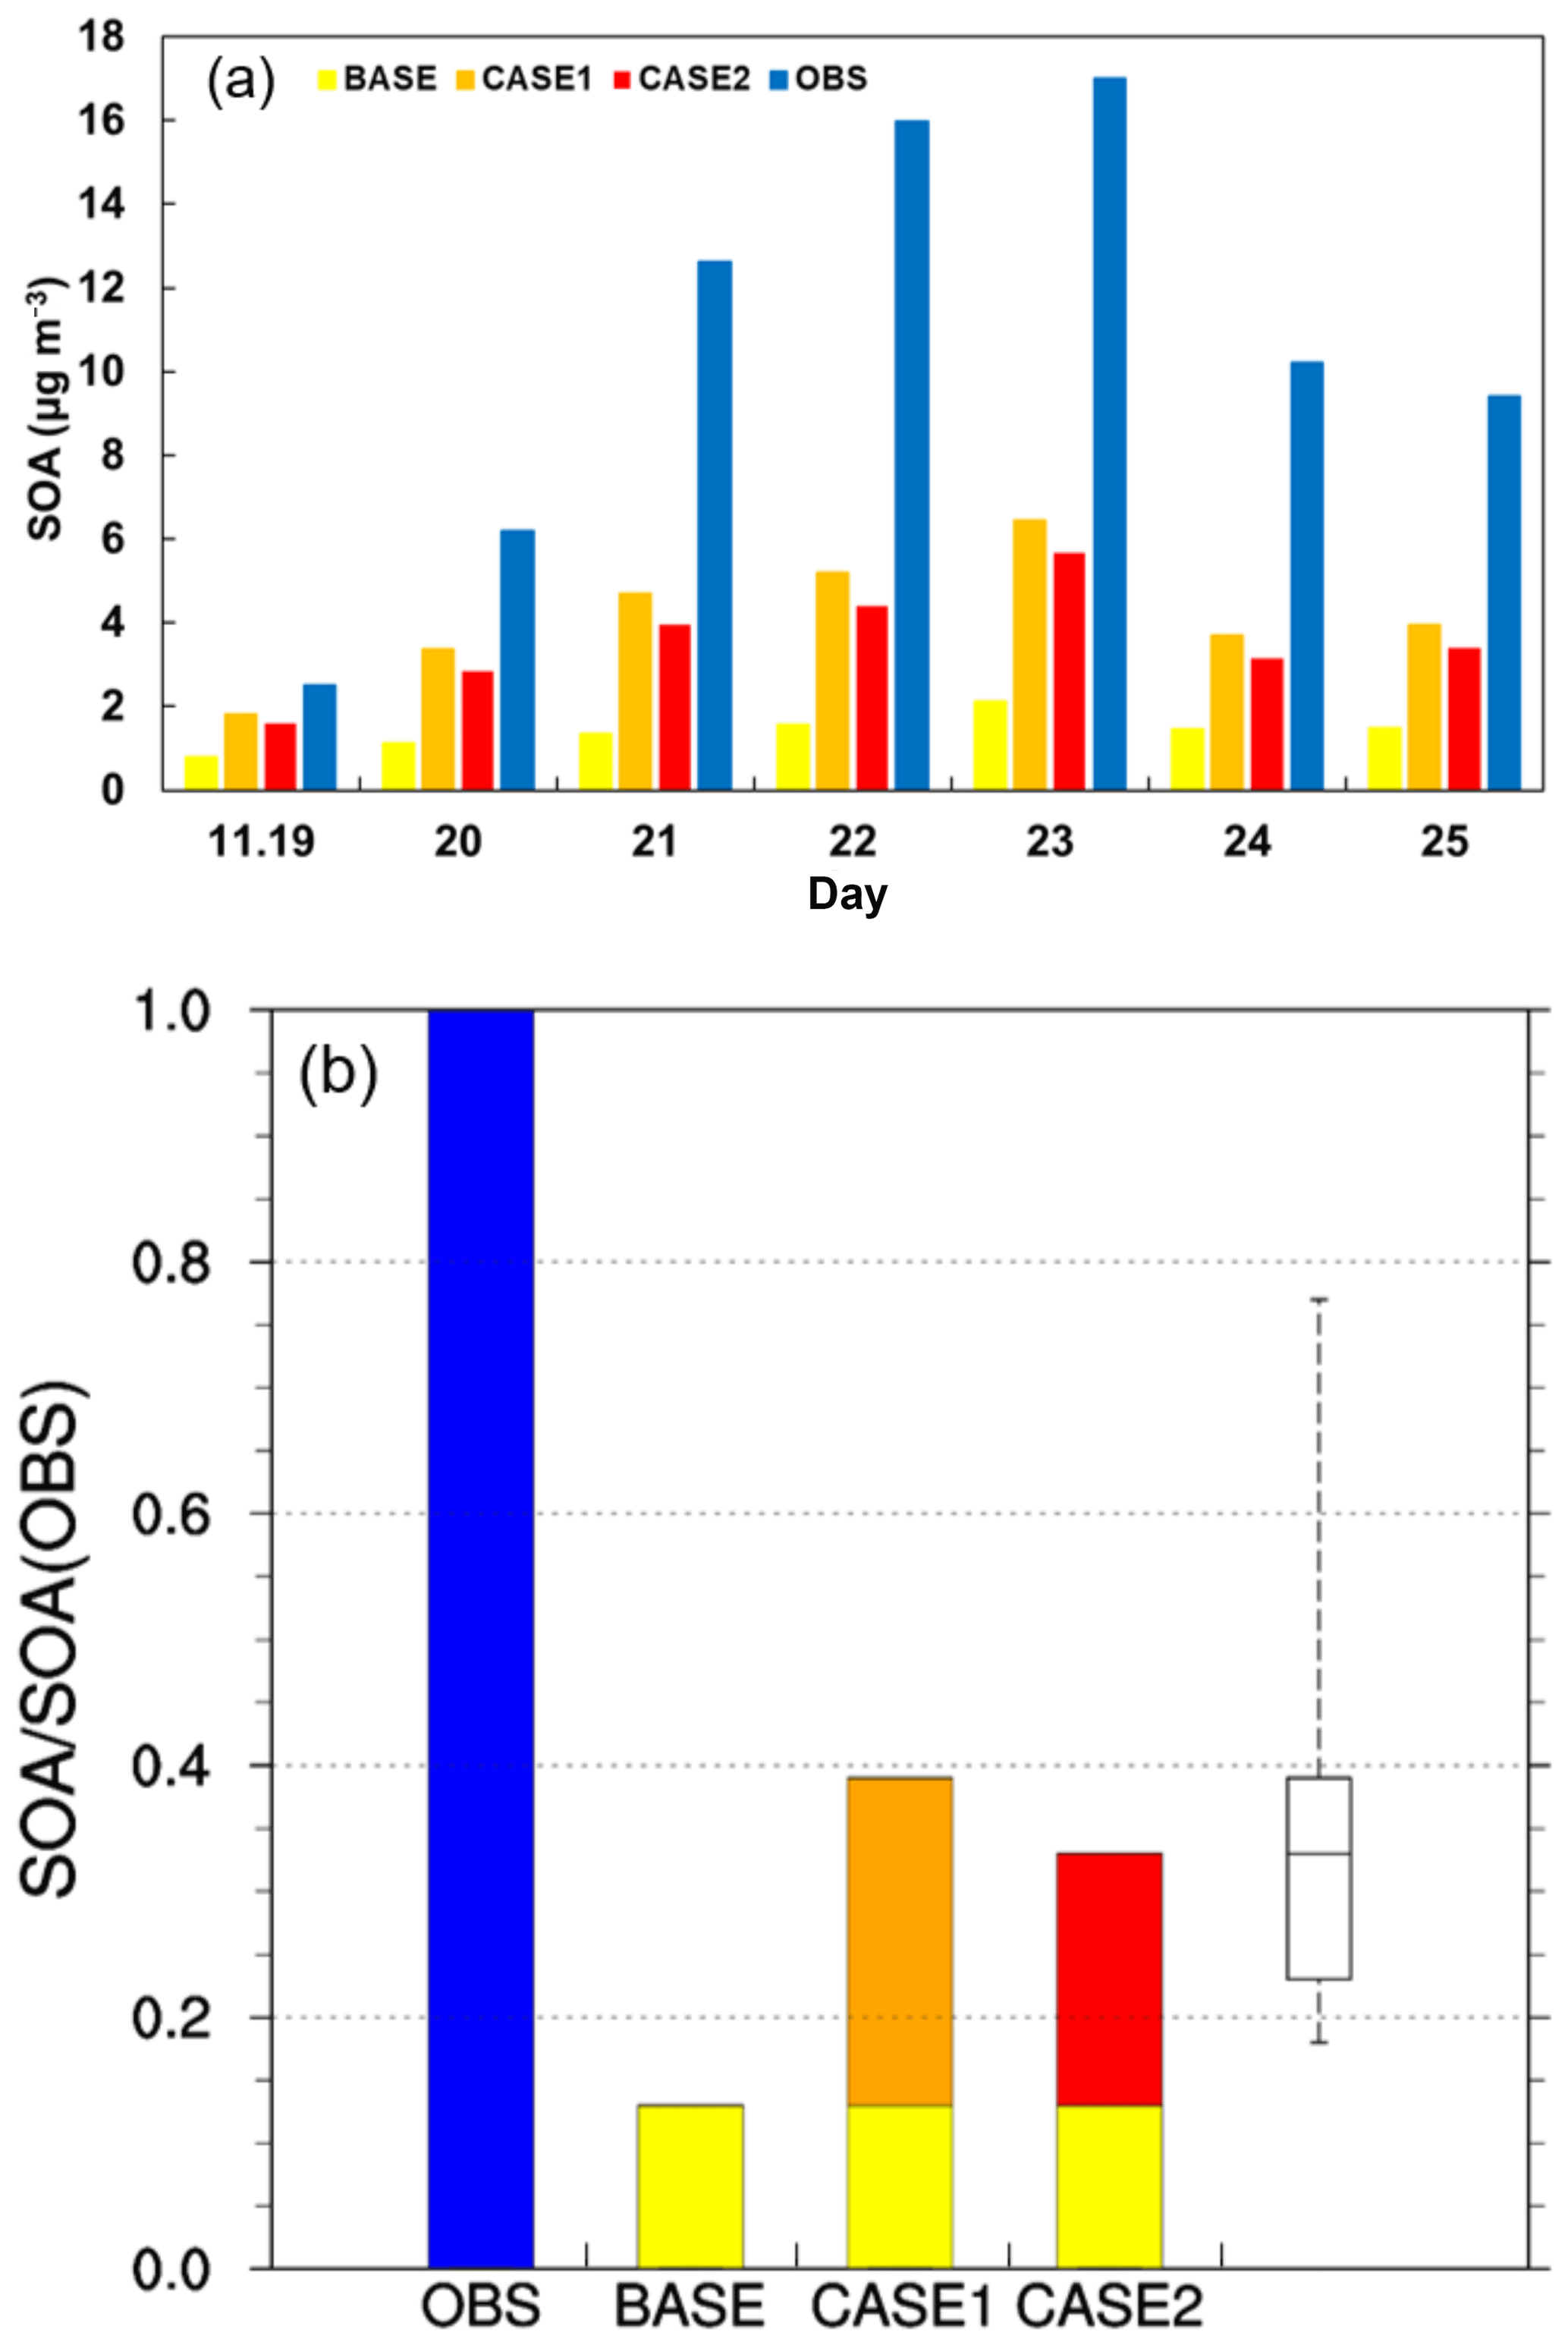
Figure 6Comparisons of SOA between simulations and observations at the WQS monitoring site: (a) time series; (b) ratios of temporal average SOA concentration to observed SOA concentration during the study period (the box represents the uncertainty range in SOA prediction, the central line is the ratio in CASE2, and the edges of the box are the ratios in CASE4 and CASE5, the edges of the whiskers are the ratios in CASE3 and CASE6).
3.3 Comparison with other emission inventories
To indicate the differences in S–IVOC emission inventories developed using different methods, the S–IVOC emission inventory developed in this study was further preliminarily compared to recently proposed global emissions of PAHs by Shen et al. (2013) (detailed data for the emission inventory are provided in Table S2 in the Supplement) because PAHs are important components of S–IVOCs. In this study, emissions of five PAHs including NAP (naphthalene), ACY (acenaphthylene), FLO (fluorene), PHE (phenanthrene), and PYR (pyrene) with high fractions in total PAH emissions were selected for comparison with corresponding PAH emissions of Shen et al. (2013) for the year 2010 in the PRD region. Note that the emission of individual PAHs in all source categories in this study was extracted from the total IVOC emission using the ratio of specific individual PAHs to total IVOCs from vehicular emission measurements (Zhao et al., 2015, 2016b). Large deviations were found for emissions of the abovementioned PAHs between the present and previous studies, especially for NAP (Fig. S1 in the Supplement). For example, NAP emissions were larger with more distinct spatial characteristics in this study than in Shen's inventory over most of the PRD region. The characteristics of road networks were also observed for the spatial distribution of NAP emission in the present study, which was not reflected in Shen's inventory. Furthermore, the total emissions of the five selected PAHs over the PRD in this study were about 3.4 times those in Shen's inventory, with multiples ranging from 1.2 to 13.4 in nine individual cities of the PRD (Table S2). The discrepancies in PAH emissions in different studies can be mainly attributed to the following factors: (1) differences in the resolution of emission inventories. For example, the spatial resolution of the emission inventory in this study was 3 km × 3 km, which is much higher than that of the previous study (). (2) The second factor is differences in the parameterization methods for developing different inventories. For example, emission factors of PAHs in the present study were calculated on the basis of those of IVOCs using the ratio of specific individual PAH to total IVOCs, wherein the emission factors of IVOCs were obtained from those of existing traditional POAs using source-specific linear scaling factors. However, emission factors of PAHs in Shen's study were directly obtained from actual measurements from various reports, which were further calculated to be time-specific based on the regression model and technology splitting approach. Nevertheless, by considering the uncertainties of different inventories (i.e., −55 %–27 % and −34 %–62 % at the 50 % confidence interval for emission inventories of the present and previous studies, respectively), it is reasonable to conclude that the emissions of selected PAHs between the two studies are comparable. Moreover, further investigation revealed that the spatial variations in PAH emissions in this study may be more reasonable than those in Shen's inventory. For example, high centers of PAH emissions in Shen's inventory were located only in Guangzhou and Shenzhen. Conversely, in this study, high PAH emissions were found in central cities including Guangzhou, Foshan, Shenzhen, and Dongguan, which have dense traffic and population. This result is consistent with the result that traffic was frequently found to be one of the most important sources of PAH emissions (Riva et al., 2017).
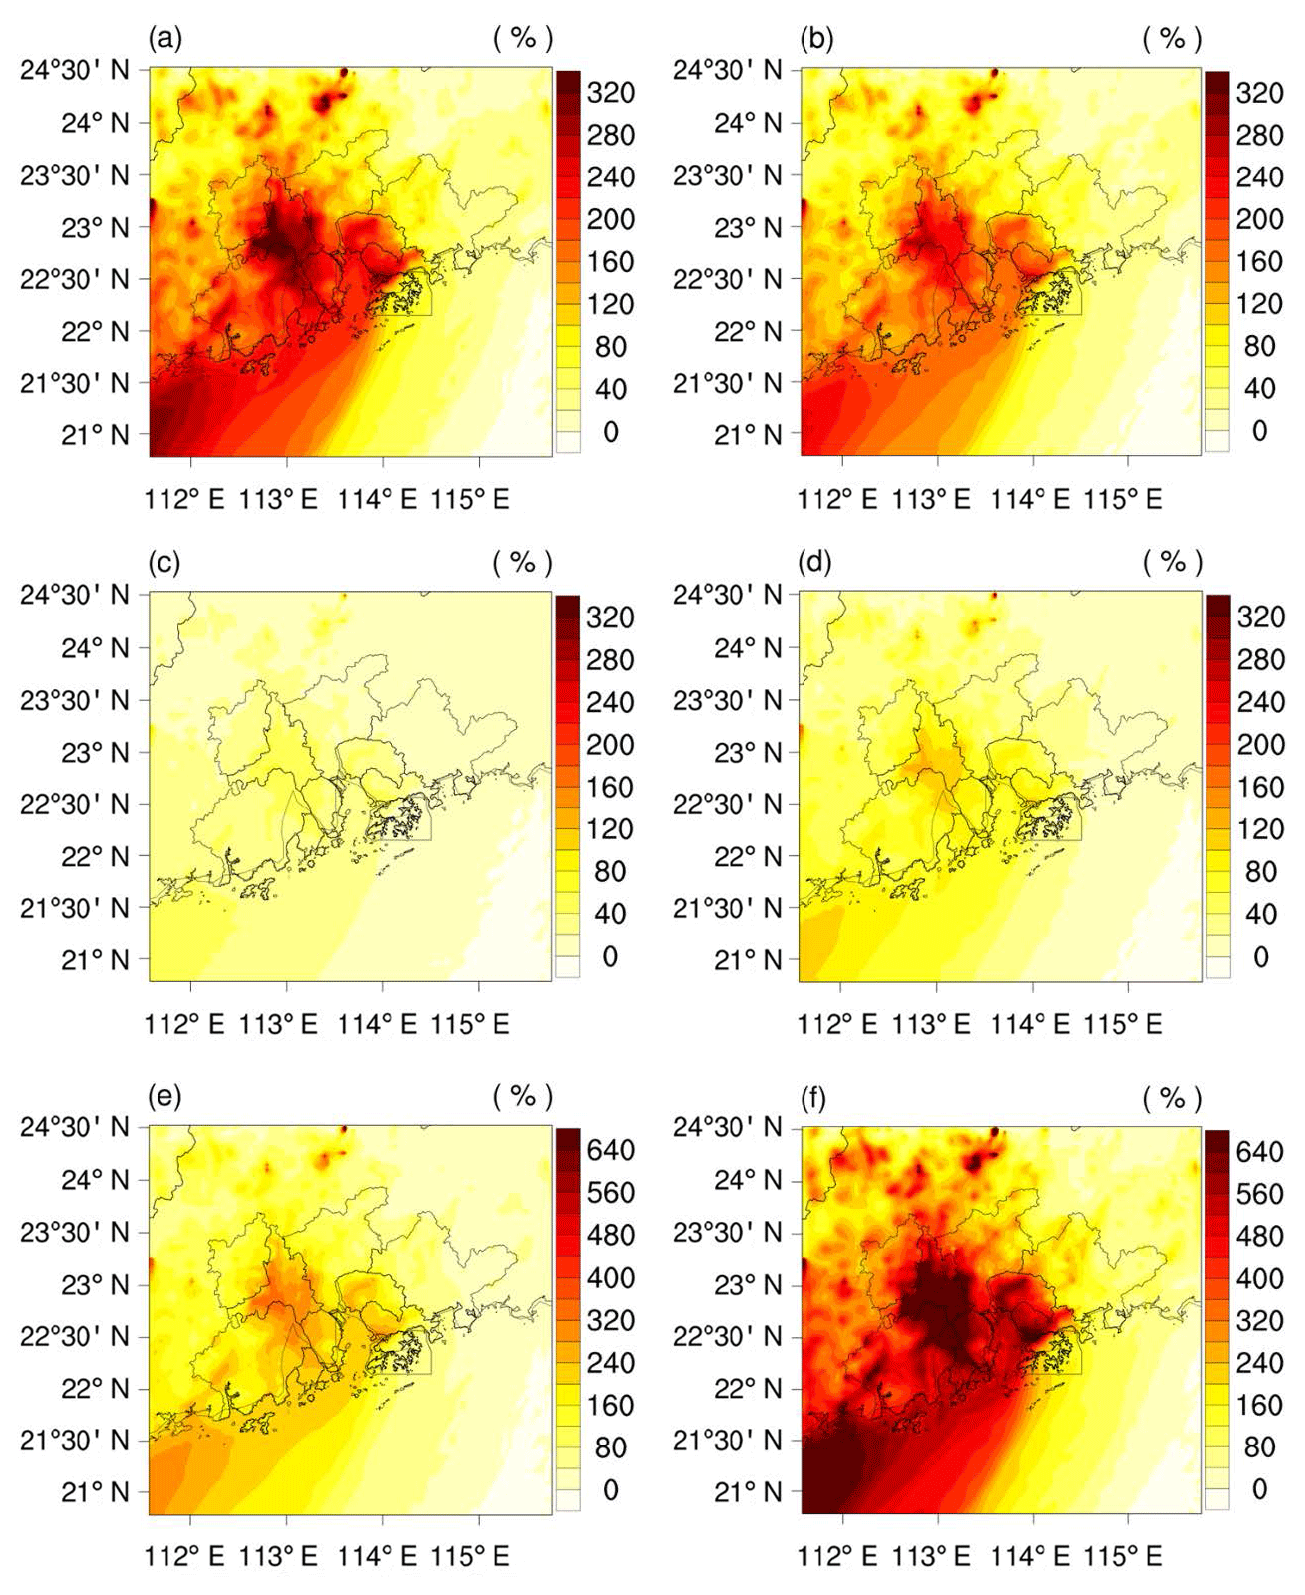
Figure 7Relative difference of SOA between CASE runs and BASE: (a) CASE1, (b) CASE2, (c) CASE3, (d) CASE4, (e) CASE5, (f) CASE6.
4.1 Effects of S–IVOCs on SOA concentration
In this study, daily measured concentrations of SOA at the WQS site in Guangzhou, a receptor site of the PRD region during autumn and winter, were used to evaluate the model performance for the simulation of SOA (Ding et al., 2012). The monitoring data of this site could represent the regional air pollution in the PRD because it is surrounded by farmland and not much traffic with flat terrain (Ding et al., 2012). The time series of SOA for BASE, CASE1, CASE2, and observations during the study period is plotted in Fig. 6a. Both BASE and CASE simulations reproduced the day-to-day variations in SOA well, although the model could not capture the observed high concentrations of SOA. Another remarkable feature in Fig. 6a is that the predicted concentrations of SOA became much closer to the observed values after the S–IVOC emissions were considered, with the discrepancy between simulations and observations decreasing from −9.15 to −6.39 µg m−3 for CASE1 (30 % decrease, p<0.01). Moreover, the performance of SOA simulation was improved by 196 % for CASE1 compared to BASE. The ratios of predicted SOA to observed SOA in CASE1–2 and BASE runs are presented in Fig. 6b. The model could resolve 39 % of the observed SOA with an increase of 26 % compared to BASE when the S–IVOC emissions were included and the original kOH of S–IVOCs was used. Figure 7a shows the relative variations in SOA between CASE1 and BASE in the whole modeling domain. An obvious increase of 40 %–375 % in SOA is found over the PRD region with an average regional increase of 161 % when S–IVOC emissions were incorporated into the model. The most remarkable increase patterns are found in the cities of Foshan, Shenzhen, Dongguan, and Jiangmen, with the increments ranging from 240 % to 375 %. This is consistent with the spatial SI-SOA in Fig. 8 and can probably be attributed to the high anthropogenic S–IVOC emissions in these cities (Fig. 4). Furthermore, a substantial increase in SOA was found in the southwest downwind area of the PRD region with increments of 240 %–325 % attributable to the influences of both local pollutants and pollutants transported from the upwind area because the dominant wind direction over the PRD region was northeasterly during the pollution period (Fig. 8). Notably, high increasing ratios of SOA concentrations in Guangzhou only appeared in a small southwestern part of Guangzhou, probably because high S–IVOC emissions in Guangzhou mainly resulted in considerable SOA growth in downwind areas, especially Foshan, which lies to the southwest of Guangzhou. Nevertheless, the above results demonstrated that S–IVOCs are significant precursors for forming SOA, and the model performance for SOA formation could be improved significantly if S–IVOC emissions were considered. Therefore, in addition to traditional VOCs, S–IVOC emissions should be included in CTMs to achieve accurate modeling of the formation of SOA and regional air quality.
In contrast, the predicted SOA in CASE2 decreased by 14 % compared to CASE1 after the kOH of S–IVOCs was improved. Moreover, the model could resolve 34 % of the observed SOA at the WQS site, which is smaller than the resolved fraction of 39 % in CASE1 (Fig. 6a–b). The average regional increase ratio of SOA decreased to 126 % in CASE2 with the newly updated decreased kOH of S–IVOCs and the same S–IVOC emissions as in CASE1 (Fig. 7b). This suggests that the decreased OH reactivity coefficient indeed decreased the formation rate of SOA, and a more precise OH reactivity is required for the model to better simulate SOA.
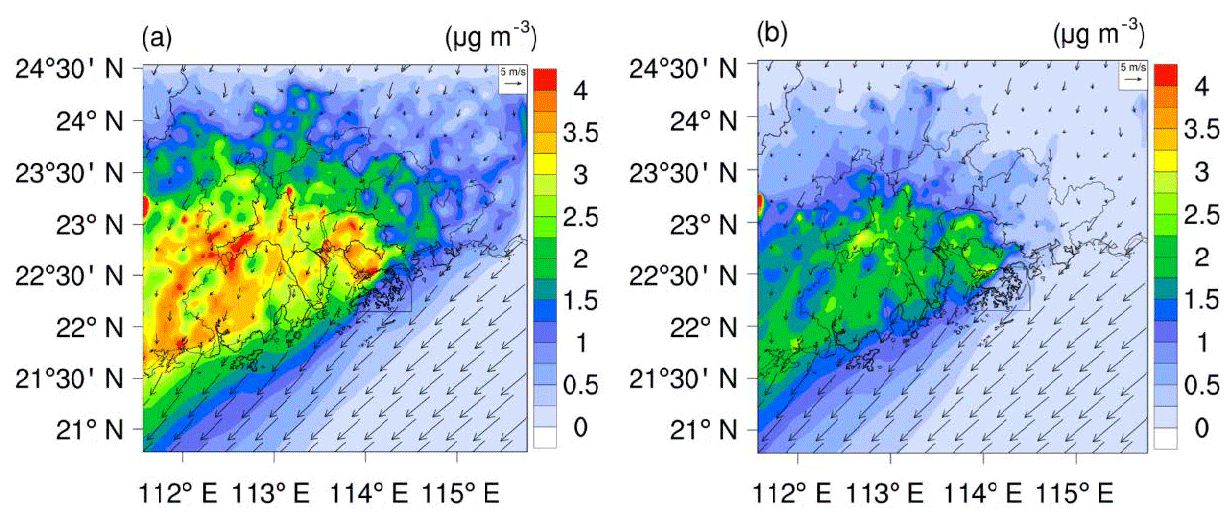
Figure 8Spatial distribution of temporal average (a) SOA and (b) SI-SOA during the study period over the modeling domain in the CASE2 run.
CASE3–6 were simulated with the input of varied amounts of S–IVOC emissions on the basis of the uncertainty ranges of the estimates of S–IVOC emissions (Table 5 and Sect. 2.2.3). The uncertainty ranges of the ratios of predicted SOA concentrations to observed ones, attributable to uncertainties in S–IVOC emissions, are presented as an error bar in Fig. 6b. As expected, the ratios of temporal average simulated SOA to observed SOA at the WQS site during the study period varied from 18 % to 77 % after taking the uncertainties of S–IVOC emissions into account. Figure 7c–d show minor increases in SOA with the input of lower S–IVOC emissions for CASE3 and CASE4, compared to CASE1, with average regional increases of 27 % and 57 %, respectively. Figure 7e–f show larger increases in SOA with the input of higher S–IVOC emissions for CASE5 and CASE6, with average regional increases of 158 % and 395 %, respectively. The results suggest that SOA is strongly sensitive to the amounts of S–IVOC emissions. Consequently, it is of great importance to reduce the uncertainties in the S–IVOC emission inventory to achieve accurate simulations of SOA.

Figure 9Relative difference of SOA between CASE runs and BASE: (a) CASE7, (b) CASE8, (c) CASE9, (d) CASE10, (e) CASE11, (f) CASE12.
4.2 Key anthropogenic S–IVOCs for SOA formation
Six simulations including CASE7–12 were conducted with only the input of S–IVOC emissions from individual source categories in order to identify the key anthropogenic source of S–IVOCs to form SOA, as described in Table 5. The spatial distributions of the relative differences of predicted SOA concentrations between CASE simulations and BASE are presented in Fig. 9. The increasing ratio of SOA in CASE9 was found to vary in the range of 5 %–190 % over the PRD region with an average increase of 52 % when the industrial S–IVOC emission was incorporated into the model. The center of increasing SOA was located in Foshan, which is an industrially developed city (Fig. 9c). After including on-road mobile S–IVOC emissions in the model, the predicted SOA was increased by 5 %–180 % with an average regional increase of 43 % (Fig. 9e), and high amounts were detected over central cities including Shenzhen, Guangzhou, Foshan, and Zhongshan, which feature a high rate of vehicle ownership, contributing to 71 % of total vehicle ownership in the PRD region (GSY, 2011). After considering S–IVOCs emitted from dust, the average regional increase ratio of SOA was 18 % (Fig. 9b), and the centers were located in Guangzhou, Foshan, Zhongshan, Dongguan, and Shenzhen. These cities have high traffic flows and frequent urban constructions, and their vehicle ownerships and floor space of buildings under construction contributed to ∼86 % and ∼81 % of those in the PRD region (Pan et al., 2015; GSY, 2011). With the input of S–IVOC emissions from biomass burning, the average regional increasing ratio of SOA was up to 8 % (Fig. 9a), and high values were mainly distributed in Zhaoqing. This city has expansive agricultural areas and large rural populations, accounting for ∼31 % and ∼15 %, respectively, of the total in the PRD (Yang et al., 2013; Pan et al., 2015; GSY, 2011). Nevertheless, the average regional SOA increased by only 2 % and 4 % with the input of S–IVOCs emitted from off-road mobile and residential sources, respectively (Fig. 9d and f). Notably, similar high centers of increasing SOA and S–IVOC emissions could be found in Figs. 9 and 3, respectively, for six specific sectors, indicating that the increment in SOA concentrations was highly correlated with the input of S–IVOC emissions. Overall, the industry and on-road mobile sources were the main anthropogenic sources of S–IVOCs contributing to the formation of SOA in the PRD region, followed by dust, biomass burning, residential, and off-road mobile sources. However, it was of interest to find that though the emission strength of on-road mobile S–IVOCs was stronger than that of industrial S–IVOCs in the PRD, the contribution of industry to SOA formation was higher than on-road mobile sources. This is related to different transport patterns in varied simulations with the input of S–IVOC emissions from different source categories. For example, high industrial S–IVOC emissions outside the PRD would induce considerable SOA growth downwind inside the PRD; however, high on-road mobile S–IVOC emissions in coastal cities such as Shenzhen would bring the SOA growth to the South China Sea, resulting in a loss of SOA inside the PRD.
In this study, a highly resolved gridded emission inventory of S–IVOCs for the PRD region in 2010 was developed. The estimates showed that total S–IVOC emission in the PRD region for the year 2010 was 323.4 Gg, 77 % of which could be attributed to on-road mobile and industrial sources. Large uncertainties were still observed in S–IVOC emission estimates, with a relative error ranging from −79 % to 229 %. These uncertainties could be attributed to the FOC of the on-road mobile source and EIVOCs ∕ EPOA ratio of all source categories, except biomass burning. Therefore, these parameters should be prioritized in further experimental studies in order to improve future S–IVOC emission inventories. Moreover, 13 simulations using the WRF-Chem model were conducted to investigate the effects of S–IVOCs on SOA and identify the key anthropogenic source of S–IVOCs contributing to SOA formation over the PRD region. The analysis of the simulation results indicated that the performance of SOA simulation was greatly improved after considering the reaction pathway producing SI-SOA from S–IVOCs. S–IVOCs could result in considerable SOA growth, and the kOH of S–IVOCs had a non-negligible effect on the production of SI-SOA. After considering the uncertainties of S–IVOC emissions, the model could resolve 18 %–77 % of observed SOA concentrations at the WQS site. These indicate the need for more experimental data of kOH for S–IVOCs to reduce the uncertainties of this parameter within the model, and reduction of uncertainties of S–IVOC emissions to achieve more accurate simulation of SOA formation. In addition, the industrial and on-road mobile sources were the top two important anthropogenic sources of S–IVOCs contributing to SOA formation, followed by dust, biomass burning, residential, and off-road mobile sources.
Although the performance of the model in simulating SOA could be significantly improved, many issues still remain to be resolved. The observed SOA concentrations could not be accurately reproduced in the present study, especially for high SOA concentrations (Fig. 6a). We inferred that the incomplete and inaccurate formation mechanism of SOA and large unresolved uncertainties in the S–IVOC emission inventory were the main reasons for the underestimation of SOA concentrations in the simulation. For example, large uncertainties still remained within source-specific and season-specific S–IVOC emissions, reaction rates of S–IVOCs, and SOA yields of VOCs and S–IVOCs. Furthermore, specific profiles of S–IVOCs were lacking. The approach including the distribution of S–IVOC emissions was based on inadequate data from domestic and foreign studies without sufficient localization in the PRD region, which further included large uncertainties. Furthermore, the assumption that SVOC emissions were included in POA emissions was not sufficiently constrained because of the limited observation data of hydrocarbon-like organic aerosol (HOA) and biomass burning organic aerosol (BBOA). Therefore, much more local experimental work is needed to quantify all the abovementioned parameters in the future. In addition, the introduction of complete and complex physical and chemical processes of SOA formation, e.g., gas- and aqueous-phase oxidation, heterogeneous and accretion reactions, acid catalysis reactions of SOA from glyoxal, and chemical aging of SOA, may be useful in estimating SOA concentrations more accurately, although it will increase experimentation costs and introduce larger uncertainties (Carlton et al., 2008; Denkenberger et al., 2007; George and Abbatt, 2010; Hallquist et al., 2009; Kroll and Seinfeld, 2008; Liggio et al., 2005; Pun and Seigneur, 2007; Washenfelder et al., 2011). For example, Dzepina et al. (2011) found that including chemical aging of V-SOA resulted in larger regional overprediction of SOA, whereas Ahmadov et al. (2012) reported a good agreement with observations after considering it. Shrivastava et al. (2011) pointed out that aging parameterization based on smog chamber measurements involves large uncertainties because the timescales of photochemical ages are longer than that accessible in chambers. Shrivastava et al. (2015) also pointed out that neglecting fragmentation reactions in aging parameterizations leads to large model overpredictions of SOA concentrations at all surface sites. Therefore, we plan to test more chemical processes that have not yet been considered in the WRF-Chem model and introduce the parameters required for establishing the S–IVOC emission inventory and model parameterization with fewer uncertainties based on more local experimental work in the future. Furthermore, we plan to build the S–IVOC emission inventory based on ample local directly measured S–IVOC emission factors and volatility distribution factors of POA in future work instead of scaling POA emission factors.
The underlying research data and the newly developed emission inventory of S–IVOCs in this study are available to the community and can be accessed by request to Xuemei Wang (eciwxm@jnu.edu.cn) of Jinan University.
The supplement related to this article is available online at: https://doi.org/10.5194/acp-19-8141-2019-supplement.
In this study, the analysis methods were developed and the whole structure for the paper was designed by ZL and XW. LW conducted the data processing and wrote the original version of the paper. SL and MS provided the related data and made revisions of the paper. Furthermore, the simulations using the WRF-Chem model were designed and conducted by LW. Finally, the paper was finalized by ZL and XW.
The authors declare that they have no conflict of interest.
This article is part of the special issue “Regional transport and transformation of air pollution in eastern China”. It is not associated with a conference.
The authors thank Junyu Zheng of Jinan University for providing the Guangdong emission inventory, and Xiang Ding of the Guangzhou Institute of Geochemistry, Chinese Academy of Sciences for providing measurement data of SOA at the WQS site.
This research has been supported by the State Key Program of the National Natural Science Foundation of China (grant no. 91644215), the National Key Research and Development Program of China (grant nos. 2017YFC0210106 and 2016YFC0202206), and the National Nature Science Fund for Distinguished Young Scholars (grant no. 41425020). This research has also been partly supported by the Pearl River Science & Technology Nova Program of Guangzhou (grant no. 201806010146).
This paper was edited by Jianmin Chen and reviewed by two anonymous referees.
Ahmadov, R., McKeen, S. A., Robinson, A. L., Bahreini, R., Middlebrook, A. M., de Gouw, J. A., Meagher, J., Hsie, E.-Y., Edgerton, E., Shaw, S., and Trainer, M.: A volatility basis set model for summertime secondary organic aerosols over the eastern United States in 2006, J. Geophys. Res.-Atmos., 117, D06301, https://doi.org/10.1029/2011JD016831, 2012.
Atkinson, R. and Arey, J.: Gas-phase tropospheric chemistry of biogenic volatile organic compounds: a review, Atmos. Environ., 37, 197–219, https://doi.org/10.1016/s1352-2310(03)00391-1, 2003.
Bureau of Statistics of Guangdong (GSY): Guangdong Statistical Yearbook 2010, China Statistics Press, Beijing, 2010 (in Chinese).
Bureau of Statistics of Guangdong (GSY): Guangdong Statistical Yearbook 2011, China Statistics Press, Beijing, 2011 (in Chinese).
Carlton, A. G., Turpin, B. J., Altieri, K. E., Seitzinger, S. P., Mathur, R., Roselle, S. J., and Weber, R. J.: CMAQ model performance enhanced when in-cloud secondary organic aerosol is included: Comparisons of organic carbon predictions with measurements, Environ. Sci. Technol., 42, 8798–8802, https://doi.org/10.1021/es801192n, 2008.
Carlton, A. G., Wiedinmyer, C., and Kroll, J. H.: A review of Secondary Organic Aerosol (SOA) formation from isoprene, Atmos. Chem. Phys., 9, 4987–5005, https://doi.org/10.5194/acp-9-4987-2009, 2009.
Carter, W. P. L.: Documentation of the SAPRC-99 Chemical Mechanism for VOC Reactivity Assessment, Final Report to California Air Resources Board, Contract No. 92–329 and (in part) 95–308, 8 May, 2000, available at: https://intra.engr.ucr.edu/~carter/pubs/ (last access: 1 June 2019), 2000.
Chen, J., Wang, W., Liu, H., and Ren, L.: Determination of road dust loadings and chemical characteristics using resuspension, Environ. Monit. Assess., 184, 1693–1709, https://doi.org/10.1007/s10661-011-2071-1, 2012.
Claeys, M., Graham, B., Vas, G., Wang, W., Vermeylen, R., Pashynska, V., Cafmeyer, J., Guyon, P., Andreae, M. O., Artaxo, P., and Maenhaut, W.: Formation of secondary organic aerosols through photooxidation of isoprene, Science, 303, 1173–1176, https://doi.org/10.1126/science.1092805, 2004.
Czech, H., Sippula, O., Kortelainen, M., Tissari, J., Radischat, C., Passig, J., Streibel, T., Jokiniemi, J., and Zimmermann, R.: On-line analysis of organic emissions from residential wood combustion with single-photon ionisation time-of-flight mass spectrometry (SPI-TOFMS), Fuel, 177, 334–342, https://doi.org/10.1016/j.fuel.2016.03.036, 2016.
Denkenberger, K. A., Moffet, R. C., Holecek, J. C., Rebotier, T. P., and Prather, K. A.: Real-time, single-particle measurements of oligomers in aged ambient aerosol particles, Environ. Sci. Technol., 41, 5439–5446, https://doi.org/10.1021/es070329l, 2007.
Ding, X., Wang, X.-M., Gao, B., Fu, X.-X., He, Q.-F., Zhao, X.-Y., Yu, J.-Z. and Zheng, M.: Tracer-based estimation of secondary organic carbon in the Pearl River Delta, south China, J. Geophys. Res., 117, D05313, https://doi.org/10.1029/2011JD016596, 2012.
Donahue, N. M., Robinson, A. L., Stanier, C. O., and Pandis, S. N.: Coupled partitioning, dilution, and chemical aging of semivolatile organics, Environ. Sci. Technol., 40, 2635–2643, https://doi.org/10.1021/es052297c, 2006.
Donahue, N. M., Epstein, S. A., Pandis, S. N., and Robinson, A. L.: A two-dimensional volatility basis set: 1. organic-aerosol mixing thermodynamics, Atmos. Chem. Phys., 11, 3303–3318, https://doi.org/10.5194/acp-11-3303-2011, 2011.
Donahue, N. M., Kroll, J. H., Pandis, S. N., and Robinson, A. L.: A two-dimensional volatility basis set – Part 2: Diagnostics of organic-aerosol evolution, Atmos. Chem. Phys., 12, 615–634, https://doi.org/10.5194/acp-12-615-2012, 2012.
Dong, T. T. T. and Lee, B. K.: Characteristics, toxicity, and source apportionment of polycylic aromatic hydrocarbons (PAHs) in road dust of Ulsan, Korea, Chemosphere, 74, 1245–1253, https://doi.org/10.1016/j.chemosphere.2008.11.035, 2009.
Drozd, G. T., Zhao, Y., Saliba, G., Frodin, B., Maddox, C., Oliver Chang, M. C., Maldonado, H., Sardar, S., Weber, R. J., Robinson, A. L., and Goldstein, A. H.: Detailed Speciation of Intermediate Volatility and Semivolatile Organic Compound Emissions from Gasoline Vehicles: Effects of Cold-Starts and Implications for Secondary Organic Aerosol Formation, Environ. Sci. Technol., 53, 1706–1714, https://doi.org/10.1021/acs.est.8b05600, 2019.
Dzepina, K., Cappa, C. D., Volkamer, R. M., Madronich, S., Decarlo, P. F., Zaveri, R. A., and Jimenez, J. L.: Modeling the multiday evolution and aging of secondary organic aerosol during MILAGRO 2006, Environ. Sci. Technol., 45, 3496–3503, https://doi.org/10.1021/es103186f, 2011.
Emmons, L. K., Walters, S., Hess, P. G., Lamarque, J.-F., Pfister, G. G., Fillmore, D., Granier, C., Guenther, A., Kinnison, D., Laepple, T., Orlando, J., Tie, X., Tyndall, G., Wiedinmyer, C., Baughcum, S. L., and Kloster, S.: Description and evaluation of the Model for Ozone and Related chemical Tracers, version 4 (MOZART-4), Geosci. Model Dev., 3, 43–67, https://doi.org/10.5194/gmd-3-43-2010, 2010.
Ervens, B., Turpin, B. J., and Weber, R. J.: Secondary organic aerosol formation in cloud droplets and aqueous particles (aqSOA): a review of laboratory, field and model studies, Atmos. Chem. Phys., 11, 11069–11102, https://doi.org/10.5194/acp-11-11069-2011, 2011.
Fast, J. D., Gustafson, W. I., Easter, R. C., Zaveri, R. A., Barnard, J. C., Chapman, E. G., Grell, G. A., and Peckham, S. E.: Evolution of ozone, particulates, and aerosol direct radiative forcing in the vicinity of Houston using a fully coupled meteorology-chemistry-aerosol model, J. Geophys. Res.-Atmos., 111, D21305, https://doi.org/10.1029/2005JD006721, 2006.
Fast, J. D., Aiken, A. C., Allan, J., Alexander, L., Campos, T., Canagaratna, M. R., Chapman, E., DeCarlo, P. F., de Foy, B., Gaffney, J., de Gouw, J., Doran, J. C., Emmons, L., Hodzic, A., Herndon, S. C., Huey, G., Jayne, J. T., Jimenez, J. L., Kleinman, L., Kuster, W., Marley, N., Russell, L., Ochoa, C., Onasch, T. B., Pekour, M., Song, C., Ulbrich, I. M., Warneke, C., Welsh-Bon, D., Wiedinmyer, C., Worsnop, D. R., Yu, X.-Y., and Zaveri, R.: Evaluating simulated primary anthropogenic and biomass burning organic aerosols during MILAGRO: implications for assessing treatments of secondary organic aerosols, Atmos. Chem. Phys., 9, 6191–6215, https://doi.org/10.5194/acp-9-6191-2009, 2009.
Gehring, U., Gruzieva, O., Agius, R. M., Beelen, R., Custovic, A., Cyrys, J., Eeftens, M., Flexeder, C., Fuertes, E., Heinrich, J., Hoffmann, B., de Jongste, J. C., Kerkhof, M., Klümper, C., Korek, M., Mölter, A., Schultz, E. S., Simpson, A., Sugiri, D., Svartengren, M., von Berg, A., Wijga, A. H., Pershagen, G., and Brunekreef, B.: Air pollution exposure and lung function in children: The ESCAPE project, Environ. Health Perspect., 121, 1357–1364, https://doi.org/10.1289/ehp.1306770, 2013.
George, I. J. and Abbatt, J. P. D.: Chemical evolution of secondary organic aerosol from OH-initiated heterogeneous oxidation, Atmos. Chem. Phys., 10, 5551–5563, https://doi.org/10.5194/acp-10-5551-2010, 2010.
Grell, G. A., Peckham, S. E., Schmitz, R., McKeen, S. A., Frost, G., Skamarock, W. C., and Eder, B.: Fully coupled “online” chemistry within the WRF model, Atmos. Environ., 39, 6957–6975, https://doi.org/10.1016/j.atmosenv.2005.04.027, 2005.
Grieshop, A. P., Donahue, N. M., and Robinson, A. L.: Laboratory investigation of photochemical oxidation of organic aerosol from wood fires 2: analysis of aerosol mass spectrometer data, Atmos. Chem. Phys., 9, 2227–2240, https://doi.org/10.5194/acp-9-2227-2009, 2009.
Guenther, A. B., Jiang, X., Heald, C. L., Sakulyanontvittaya, T., Duhl, T., Emmons, L. K., and Wang, X.: The Model of Emissions of Gases and Aerosols from Nature version 2.1 (MEGAN2.1): an extended and updated framework for modeling biogenic emissions, Geosci. Model Dev., 5, 1471–1492, https://doi.org/10.5194/gmd-5-1471-2012, 2012.
Guo, H., Ling, Z. H., Cheng, H. R., Simpson, I. J., Lyu, X. P., Wang, X. M., Shao, M., Lu, H. X., Ayoko, G., Zhang, Y. L., Saunders, S. M., Lam, S. H. M., Wang, J. L., and Blake, D. R.: Tropospheric volatile organic compounds in China, Sci. Total Environ., 574, 1021–1043, https://doi.org/10.1016/j.scitotenv.2016.09.116, 2017.
Hallquist, M., Wenger, J. C., Baltensperger, U., Rudich, Y., Simpson, D., Claeys, M., Dommen, J., Donahue, N. M., George, C., Goldstein, A. H., Hamilton, J. F., Herrmann, H., Hoffmann, T., Iinuma, Y., Jang, M., Jenkin, M. E., Jimenez, J. L., Kiendler-Scharr, A., Maenhaut, W., McFiggans, G., Mentel, Th. F., Monod, A., Prévôt, A. S. H., Seinfeld, J. H., Surratt, J. D., Szmigielski, R., and Wildt, J.: The formation, properties and impact of secondary organic aerosol: current and emerging issues, Atmos. Chem. Phys., 9, 5155–5236, https://doi.org/10.5194/acp-9-5155-2009, 2009.
He, H., Tie, X., Zhang, Q., Liu, X., Gao, Q., Li, X., and Gao, Y.: Analysis of the causes of heavy aerosol pollution in Beijing, China: A case study with the WRF-Chem model, Particuology, 20, 32–40, https://doi.org/10.1016/j.partic.2014.06.004, 2015.
He, L. Y., Huang, X. F., Xue, L., Hu, M., Lin, Y., Zheng, J., Zhang, R., and Zhang, Y. H.: Submicron aerosol analysis and organic source apportionment in an urban atmosphere in Pearl River Delta of China using high-resolution aerosol mass spectrometry, J. Geophys. Res.-Atmos., 116, D12304, https://doi.org/10.1029/2010JD014566, 2011.
Hildebrandt, L., Donahue, N. M., and Pandis, S. N.: High formation of secondary organic aerosol from the photo-oxidation of toluene, Atmos. Chem. Phys., 9, 2973–2986, https://doi.org/10.5194/acp-9-2973-2009, 2009.
Hofzumahaus, A., Rohrer, F., Lu, K., Bohn, B., Brauers, T., Chang, C. C., Fuchs, H., Holland, F., Kita, K., Kondo, Y., Li, X., Lou, S., Shao, M., Zeng, L., Wahner, A., and Zhang, Y.: Amplified trace gas removal in the troposphere, Science, 324, 1702–1704, https://doi.org/10.1126/science.1164566, 2009.
Hu, W., Hu, M., Hu, W., Jimenez, J. L., Yuan, B., Chen, W., Wang, M., Wu, Y., Chen, C., Wang, Z., Peng, J., Zeng, L., and Shao, M.: Chemical composition, sources, and aging process of submicron aerosols in Beijing: Contrast between summer and winter, J. Geophys. Res., 121, 1955–1977, https://doi.org/10.1002/2015JD024020, 2016.
Huang, X.-F., He, L.-Y., Hu, M., Canagaratna, M. R., Kroll, J. H., Ng, N. L., Zhang, Y.-H., Lin, Y., Xue, L., Sun, T.-L., Liu, X.-G., Shao, M., Jayne, J. T., and Worsnop, D. R.: Characterization of submicron aerosols at a rural site in Pearl River Delta of China using an Aerodyne High-Resolution Aerosol Mass Spectrometer, Atmos. Chem. Phys., 11, 1865–1877, https://doi.org/10.5194/acp-11-1865-2011, 2011.
Huang, R. J., Zhang, Y., Bozzetti, C., Ho, K. F., Cao, J. J., Han, Y., Daellenbach, K. R., Slowik, J. G., Platt, S. M., Canonaco, F., Zotter, P., Wolf, R., Pieber, S. M., Bruns, E. A., Crippa, M., Ciarelli, G., Piazzalunga, A., Schwikowski, M., Abbaszade, G., Schnelle-Kreis, J., Zimmermann, R., An, Z., Szidat, S., Baltensperger, U., El Haddad, I., and Prévôt, A. S. H.: High secondary aerosol contribution to particulate pollution during haze events in China, Nature, 514, 218–222, https://doi.org/10.1038/nature13774, 2015.
Jathar, S. H., Miracolo, M. A., Presto, A. A., Donahue, N. M., Adams, P. J., and Robinson, A. L.: Modeling the formation and properties of traditional and non-traditional secondary organic aerosol: problem formulation and application to aircraft exhaust, Atmos. Chem. Phys., 12, 9025–9040, https://doi.org/10.5194/acp-12-9025-2012, 2012.
Jiang, F., Liu, Q., Huang, X., Wang, T., Zhuang, B., and Xie, M.: Regional modeling of secondary organic aerosol over China using WRF/Chem, J. Aerosol Sci., 43, 57–73, https://doi.org/10.1016/j.jaerosci.2011.09.003, 2012.
Johnson, D., Utembe, S. R., Jenkin, M. E., Derwent, R. G., Hayman, G. D., Alfarra, M. R., Coe, H., and McFiggans, G.: Simulating regional scale secondary organic aerosol formation during the TORCH 2003 campaign in the southern UK, Atmos. Chem. Phys., 6, 403–418, https://doi.org/10.5194/acp-6-403-2006, 2006.
Kanakidou, M., Seinfeld, J. H., Pandis, S. N., Barnes, I., Dentener, F. J., Facchini, M. C., Van Dingenen, R., Ervens, B., Nenes, A., Nielsen, C. J., Swietlicki, E., Putaud, J. P., Balkanski, Y., Fuzzi, S., Horth, J., Moortgat, G. K., Winterhalter, R., Myhre, C. E. L., Tsigaridis, K., Vignati, E., Stephanou, E. G., and Wilson, J.: Organic aerosol and global climate modelling: a review, Atmos. Chem. Phys., 5, 1053–1123, https://doi.org/10.5194/acp-5-1053-2005, 2005.
Khare, P. and Gentner, D. R.: Considering the future of anthropogenic gas-phase organic compound emissions and the increasing influence of non-combustion sources on urban air quality, Atmos. Chem. Phys., 18, 5391–5413, https://doi.org/10.5194/acp-18-5391-2018, 2018.
Kroll, J. H. and Seinfeld, J. H.: Chemistry of secondary organic aerosol: Formation and evolution of low-volatility organics in the atmosphere, Atmos. Environ., 42, 3593–3624, https://doi.org/10.1016/j.atmosenv.2008.01.003, 2008.
Li, G., Zavala, M., Lei, W., Tsimpidi, A. P., Karydis, V. A., Pandis, S. N., Canagaratna, M. R., and Molina, L. T.: Simulations of organic aerosol concentrations in Mexico City using the WRF-CHEM model during the MCMA-2006/MILAGRO campaign, Atmos. Chem. Phys., 11, 3789–3809, https://doi.org/10.5194/acp-11-3789-2011, 2011.
Li, Y., Lin, C., Lau, A. K. H., Liao, C., Zhang, Y., Zeng, W., Li, C., Fung, J. C. H., and Tse, T. K. T.: Assessing Long-Term Trend of Particulate Matter Pollution in the Pearl River Delta Region Using Satellite Remote Sensing, Environ. Sci. Technol., 49, 11670–11678, https://doi.org/10.1021/acs.est.5b02776, 2015.
Li, J., Zhang, M., Wu, F., Sun, Y., and Tang, G.: Assessment of the impacts of aromatic VOC emissions and yields of SOA on SOA concentrations with the air quality model RAMS-CMAQ, Atmos. Environ., 158, 105–115, https://doi.org/10.1016/j.atmosenv.2017.03.035, 2017a.
Li, N., Bian, Y., Zhong, Z., Huang, Z., Fan, X., Li, C., Jia, G., and Zheng, J.: Development and verification of black carbon and organic carbon anthropogenic emission inventory in Guangdong Province, Huanjing Kexue Xuebao/Acta Sci. Circumstantiae, 37, 419–428, https://doi.org/10.13671/j.hjkxxb.2016.0413, 2017b (in Chinese).
Li, W., Li, L., Chen, C., Kacarab, M., Peng, W., Price, D., Xu, J., and Cocker, D. R.: Potential of select intermediate-volatility organic compounds and consumer products for secondary organic aerosol and ozone formation under relevant urban conditions, Atmos. Environ., 178, 109–117, https://doi.org/10.1016/j.atmosenv.2017.12.019, 2018.
Liggio, J., Li, S. M., and McLaren, R.: Reactive uptake of glyoxal by particulate matter, J. Geophys. Res.-Atmos., 110, 1–13, https://doi.org/10.1029/2004JD005113, 2005.
Lim, H. J., Carlton, A. G., and Turpin, B. J.: Isoprene forms secondary organic aerosol through cloud processing: Model simulations, Environ. Sci. Technol., 39, 4441–4446, https://doi.org/10.1021/es048039h, 2005.
Lin, C. Q., Liu, G., Lau, A. K. H., Li, Y., Li, C. C., Fung, J. C. H., and Lao, X. Q.: High-resolution satellite remote sensing of provincial PM2.5 trends in China from 2001 to 2015, Atmos. Environ., 180, 110–116, https://doi.org/10.1016/j.atmosenv.2018.02.045, 2018.
Liu, Q.: The impact of 2000–2050 climate change on ozone and secondary organic aerosol in China, Hong Kong Polytech. Univ., available at: http://hdl.handle.net/10397/6879, 2014.
Liu, H., Man, H., Cui, H., Wang, Y., Deng, F., Wang, Y., Yang, X., Xiao, Q., Zhang, Q., Ding, Y., and He, K.: An updated emission inventory of vehicular VOCs and IVOCs in China, Atmos. Chem. Phys., 17, 12709–12724, https://doi.org/10.5194/acp-17-12709-2017, 2017.
Louvaris, E. E., Florou, K., Karnezi, E., Papanastasiou, D. K., Gkatzelis, G. I., and Pandis, S. N.: Volatility of source apportioned wintertime organic aerosol in the city of Athens, Atmos. Environ., 158, 138–147, https://doi.org/10.1016/j.atmosenv.2017.03.042, 2017.
Martín-Reviejo, M. and Wirtz, K.: Is Benzene a Precursor for Secondary Organic Aerosolfi, Environ. Sci. Technol., 39, 1045–1054, https://doi.org/10.1021/es049802a, 2005.
May, A. A., Presto, A. A., Hennigan, C. J., Nguyen, N. T., Gordon, T. D., and Robinson, A. L.: Gas-particle partitioning of primary organic aerosol emissions: (1) Gasoline vehicle exhaust, Atmos. Environ., 77, 128–139, https://doi.org/10.1016/j.atmosenv.2013.04.060, 2013a.
May, A. A., Presto, A. A., Hennigan, C. J., Nguyen, N. T., Gordon, T. D., and Robinson, A. L.: Gas-particle partitioning of primary organic aerosol emissions: (2) diesel vehicles, Environ. Sci. Technol., 47, 8288–8296, https://doi.org/10.1021/es400782j, 2013b.
May, A. A., Levin, E. J. T., Hennigan, C. J., Riipinen, I., Lee, T., Collett, J. L., Jimenez, J. L., Kreidenweis, S. M., and Robinson, A. L.: Gas-particle partitioning of primary organic aerosol emissions: 3. Biomass burning, J. Geophys. Res.-Atmos., 118, 11327–11338, https://doi.org/10.1002/jgrd.50828, 2013c.
NARSTO.: Improving Emission Inventories for Effective Air Quality Manage ment across North America: A NARSTO Assessment, availabe at: https://www.narsto.org/ (last access: 8 May 2019), 2005.
Ng, N. L., Kroll, J. H., Chan, A. W. H., Chhabra, P. S., Flagan, R. C., and Seinfeld, J. H.: Secondary organic aerosol formation from m-xylene, toluene, and benzene, Atmos. Chem. Phys., 7, 3909–3922, https://doi.org/10.5194/acp-7-3909-2007, 2007.
Odum, J. R., Hoffmann, T., Bowman, F., Collins, D., Flagan, R. C., and Seinfeld, J. H.: Gas/particle partitioning and secondary organic aerosol yields, Environ. Sci. Technol., 30, 2580–2585, https://doi.org/10.1021/es950943+, 1996.
Ots, R., Young, D. E., Vieno, M., Xu, L., Dunmore, R. E., Allan, J. D., Coe, H., Williams, L. R., Herndon, S. C., Ng, N. L., Hamilton, J. F., Bergström, R., Di Marco, C., Nemitz, E., Mackenzie, I. A., Kuenen, J. J. P., Green, D. C., Reis, S., and Heal, M. R.: Simulating secondary organic aerosol from missing diesel-related intermediate-volatility organic compound emissions during the Clean Air for London (ClearfLo) campaign, Atmos. Chem. Phys., 16, 6453–6473, https://doi.org/10.5194/acp-16-6453-2016, 2016.
Palm, B. B., Campuzano-Jost, P., Ortega, A. M., Day, D. A., Kaser, L., Jud, W., Karl, T., Hansel, A., Hunter, J. F., Cross, E. S., Kroll, J. H., Peng, Z., Brune, W. H., and Jimenez, J. L.: In situ secondary organic aerosol formation from ambient pine forest air using an oxidation flow reactor, Atmos. Chem. Phys., 16, 2943–2970, https://doi.org/10.5194/acp-16-2943-2016, 2016.
Palm, B. B., Campuzano-Jost, P., Day, D. A., Ortega, A. M., Fry, J. L., Brown, S. S., Zarzana, K. J., Dube, W., Wagner, N. L., Draper, D. C., Kaser, L., Jud, W., Karl, T., Hansel, A., Gutiérrez-Montes, C., and Jimenez, J. L.: Secondary organic aerosol formation from in situ OH, O3, and NO3 oxidation of ambient forest air in an oxidation flow reactor, Atmos. Chem. Phys., 17, 5331–5354, https://doi.org/10.5194/acp-17-5331-2017, 2017.
Pan, Y., Nan, L. I., Zheng, J., Yin, S., Cheng, L. I., Jing, Y., Zhong, L., Chen, D., Deng, S., and Wang, S.: Emission inventory and characteristics of anthropogenic air pollutant sources in Guangdong Province, Acta Sci. Circumstantiae, 59, 133–135, https://doi.org/10.13671/j.hjkxxb.2014.1058, 2015 (in Chinese).
Pankow, J. F.: An absorption model of gas/particle partitioning of organic compounds in the atmosphere, Atmos. Environ., 28, 185–188, https://doi.org/10.1016/1352-2310(94)90093-0, 1994.
Peng, K., Yang, Y., Zheng, J. Y., Yin, S. S., Gao, Z. J., and Huang, X. B.: Emission factor and inventory of paved road fugitive dust sources in the Pearl River Delta region, Acta Sci. Circumstantiae, 33, 2657–2663, https://doi.org/10.13671/j.hjkxxb.2013.10.011, 2013 (in Chinese).
Pope, C. A., Burnett, R. T., Thun, M. J., Calle, E. E., Krewski, D., Ito, K., and Thurston, G. D.: Lung cancer, cardiopulmonary mortality, and long-term exposure to fine particulate air pollution, JAMA, 287, 1132–1141, https://doi.org/10.1001/jama.287.9.1132, 2002.
Pun, B. K. and Seigneur, C.: Investigative modeling of new pathways for secondary organic aerosol formation, Atmos. Chem. Phys., 7, 2199–2216, https://doi.org/10.5194/acp-7-2199-2007, 2007.
Pye, H. O. T. and Seinfeld, J. H.: A global perspective on aerosol from low-volatility organic compounds, Atmos. Chem. Phys., 10, 4377–4401, https://doi.org/10.5194/acp-10-4377-2010, 2010.
Pye, H. O. T., Chan, A. W. H., Barkley, M. P., and Seinfeld, J. H.: Global modeling of organic aerosol: the importance of reactive nitrogen (NOx and NO3), Atmos. Chem. Phys., 10, 11261–11276, https://doi.org/10.5194/acp-10-11261-2010, 2010.
Riva, M., Healy, R. M., Flaud, P. M., Perraudin, E., Wenger, J. C., and Villenave, E.: Gas- and particle-phase products from the photooxidation of acenaphthene and acenaphthylene by OH radicals, Atmos. Environ., 151, 34–44, https://doi.org/10.1016/j.atmosenv.2016.11.063, 2017.
Robinson, A. L., Donahue, N. M., Shrivastava, M. K., Weitkamp, E. A., Sage, A. M., Grieshop, A. P., Lane, T. E., Pierce, J. R., and Pandis, S. N.: Rethinking organic aerosols: Semivolatile emissions and photochemical aging, Science, 315, 1259–1262, https://doi.org/10.1126/science.1133061, 2007.
Rogge, W. F., Hildemann, L. M., Mazurek, M. A., Cass, G. R. and Simoneit, B. R. T.: Sources of Fine Organic Aerosol, 3. Road Dust, Tire Debris, and Organometallic Brake Lining Dust: Roads as Sources and Sinks, Environ. Sci. Technol., 27, 1892–1904, https://doi.org/10.1021/es00046a019, 1993.
Schefuß, E., Ratmeyer, V., Stuut, J. B. W., Jansen, J. H. F., and Sinninghe Damsté, J. S.: Carbon isotope analyses of n-alkanes in dust from the lower atmosphere over the central eastern Atlantic, Geochim. Cosmochim. Ac., 67, 1757–1767, https://doi.org/10.1016/S0016-7037(02)01414-X, 2003.
Sharma, A., Ojha, N., Pozzer, A., Mar, K. A., Beig, G., Lelieveld, J., and Gunthe, S. S.: WRF-Chem simulated surface ozone over south Asia during the pre-monsoon: effects of emission inventories and chemical mechanisms, Atmos. Chem. Phys., 17, 14393–14413, https://doi.org/10.5194/acp-17-14393-2017, 2017.
Shen, H., Huang, Y., Wang, R., Zhu, D., Li, W., Shen, G., Wang, B., Zhang, Y., Chen, Y., Lu, Y., Chen, H., Li, T., Sun, K., Li, B., Liu, W., Liu, J., and Tao, S.: Global atmospheric emissions of polycyclic aromatic hydrocarbons from 1960 to 2008 and future predictions, Environ. Sci. Technol., 47, 6415–6424, https://doi.org/10.1021/es400857z, 2013.
Shrivastava, M. K., Lane, T. E., Donahue, N. M., Pandis, S. N., and Robinson, A. L.: Effects of gas particle partitioning and aging of primary emissions on urban and regional organic aerosol concentrations, J. Geophys. Res.-Atmos., 113, 1–16, https://doi.org/10.1029/2007JD009735, 2008.
Shrivastava, M. K., Fast, J., Easter, R., Gustafson Jr., W. I., Zaveri, R. A., Jimenez, J. L., Saide, P., and Hodzic, A.: Modeling organic aerosols in a megacity: comparison of simple and complex representations of the volatility basis set approach, Atmos. Chem. Phys., 11, 6639–6662, https://doi.org/10.5194/acp-11-6639-2011, 2011.
Shrivastava, M. K., Berg, L. K., Fast, J. D., Easter, R. C., Laskin, A., Chapman, E. G., Gustafson, W. I., Liu, Y., and Berkowitz, C. M.: Modeling aerosols and their interactions with shallow cumuli during the 2007 CHAPS field study, J. Geophys. Res.-Atmos., 118, 1343–1360, https://doi.org/10.1029/2012JD018218, 2013.
Shrivastava, M. K., Easter, R. C., Liu, X., Zelenyuk, A., Singh, B., Zhang, K., Ma, P. L., Chand, D., Ghan, S., Jimenez, J. L., Zhang, Q., Fast, J., Rasch, P. J., and Tiitta, P.: Global transformation and fate of SOA: Implications of low-volatility SOA and gas-phase fragmentation reactions, J. Geophys. Res., 120, 4169–4195, https://doi.org/10.1002/2014JD022563, 2015.
Situ, S., Guenther, A., Wang, X., Jiang, X., Turnipseed, A., Wu, Z., Bai, J., and Wang, X.: Impacts of seasonal and regional variability in biogenic VOC emissions on surface ozone in the Pearl River delta region, China, Atmos. Chem. Phys., 13, 11803–11817, https://doi.org/10.5194/acp-13-11803-2013, 2013.
Takada, H., Onda, T., and Ogura, N.: Determination of Polycyciic Aromatic Hydrocarbons in Urban Street Dusts and Their Source Materials by Capillary Gas Chromatography, Environ. Sci. Technol., 24, 1179–1186, https://doi.org/10.1021/es00078a005, 1990.
Tie, X., Geng, F., Guenther, A., Cao, J., Greenberg, J., Zhang, R., Apel, E., Li, G., Weinheimer, A., Chen, J., and Cai, C.: Megacity impacts on regional ozone formation: observations and WRF-Chem modeling for the MIRAGE-Shanghai field campaign, Atmos. Chem. Phys., 13, 5655–5669, https://doi.org/10.5194/acp-13-5655-2013, 2013.
Tsimpidi, A. P., Karydis, V. A., Zavala, M., Lei, W., Molina, L., Ulbrich, I. M., Jimenez, J. L., and Pandis, S. N.: Evaluation of the volatility basis-set approach for the simulation of organic aerosol formation in the Mexico City metropolitan area, Atmos. Chem. Phys., 10, 525–546, https://doi.org/10.5194/acp-10-525-2010, 2010.
van Drooge, B. L. and Grimalt, J. O.: Particle size-resolved source apportionment of primary and secondary organic tracer compounds at urban and rural locations in Spain, Atmos. Chem. Phys., 15, 7735–7752, https://doi.org/10.5194/acp-15-7735-2015, 2015.
Volkamer, R., Ziemann, P. J., and Molina, M. J.: Secondary Organic Aerosol Formation from Acetylene (C2H2): seed effect on SOA yields due to organic photochemistry in the aerosol aqueous phase, Atmos. Chem. Phys., 9, 1907–1928, https://doi.org/10.5194/acp-9-1907-2009, 2009.
Washenfelder, R. A., Young, C. J., Brown, S. S., Angevine, W. M., Atlas, E. L., Blake, D. R., Bon, D. M., Cubison, M. J., De Gouw, J. A., Dusanter, S., Flynn, J., Gilman, J. B., Graus, M., Griffith, S., Grossberg, N., Hayes, P. L., Jimenez, J. L., Kuster, W. C., Lefer, B. L., Pollack, I. B., Ryerson, T. B., Stark, H., Stevens, P. S., and Trainer, M. K.: The glyoxal budget and its contribution to organic aerosol for Los Angeles, California, during CalNex 2010, J. Geophys. Res.-Atmos., 116, D00V02, https://doi.org/10.1029/2011JD016314, 2011.
Woody, M. C., West, J. J., Jathar, S. H., Robinson, A. L., and Arunachalam, S.: Estimates of non-traditional secondary organic aerosols from aircraft SVOC and IVOC emissions using CMAQ, Atmos. Chem. Phys., 15, 6929–6942, https://doi.org/10.5194/acp-15-6929-2015, 2015.
Xu, W. Q., Sun, Y. L., Chen, C., Du, W., Han, T. T., Wang, Q. Q., Fu, P. Q., Wang, Z. F., Zhao, X. J., Zhou, L. B., Ji, D. S., Wang, P. C., and Worsnop, D. R.: Aerosol composition, oxidation properties, and sources in Beijing: results from the 2014 Asia-Pacific Economic Cooperation summit study, Atmos. Chem. Phys., 15, 13681–13698, https://doi.org/10.5194/acp-15-13681-2015, 2015.
Xue, L., Gu, R., Wang, T., Wang, X., Saunders, S., Blake, D., Louie, P. K. K., Luk, C. W. Y., Simpson, I., Xu, Z., Wang, Z., Gao, Y., Lee, S., Mellouki, A., and Wang, W.: Oxidative capacity and radical chemistry in the polluted atmosphere of Hong Kong and Pearl River Delta region: analysis of a severe photochemical smog episode, Atmos. Chem. Phys., 16, 9891–9903, https://doi.org/10.5194/acp-16-9891-2016, 2016.
Yang, Y., Yang, J., Yin, S.-S., Yu, Y.-F., Zheng, J.-Y., and Mo, Z.-W.: Speciated VOCs emission inventory and key species from printing industry in the Pearl River Delta region, Res. Environ. Sci., 26, 326–333, https://doi.org/10.13198/j.res.2013.03.105.yangy.004, 2013 (in Chinese).
Ye, Z., Liu, J., Gu, A., Feng, F., Liu, Y., Bi, C., Xu, J., Li, L., Chen, H., Chen, Y., Dai, L., Zhou, Q., and Ge, X.: Chemical characterization of fine particulate matter in Changzhou, China, and source apportionment with offline aerosol mass spectrometry, Atmos. Chem. Phys., 17, 2573–2592, https://doi.org/10.5194/acp-17-2573-2017, 2017.
Yin, S., Zheng, J., Lu, Q., Yuan, Z., Huang, Z., Zhong, L., and Lin, H.: A refined 2010-based VOC emission inventory and its improvement on modeling regional ozone in the Pearl River Delta Region, China, Sci. Total Environ., 514, 426–438, https://doi.org/10.1016/j.scitotenv.2015.01.088, 2015.
Yuan, B., Liu, Y., Shao, M., Lu, S., and Streets, D. G.: Biomass burning contributions to ambient VOCs species at a receptor site in the Pearl River delta (PRD), China, Environ. Sci. Technol., 44, 4577–4582, https://doi.org/10.1021/es1003389, 2010.
Zaveri, R. A., Easter, R. C., Fast, J. D., and Peters, L. K.: Model for Simulating Aerosol Interactions and Chemistry (MOSAIC), J. Geophys. Res.-Atmos., 113, D13204, https://doi.org/10.1029/2007JD008782, 2008.
Zhao, Y., Nielsen, C. P., Lei, Y., McElroy, M. B., and Hao, J.: Quantifying the uncertainties of a bottom-up emission inventory of anthropogenic atmospheric pollutants in China, Atmos. Chem. Phys., 11, 2295–2308, https://doi.org/10.5194/acp-11-2295-2011, 2011.
Zhao, Y., Nguyen, N. T., Presto, A. A., Hennigan, C. J., May, A. A., and Robinson, A. L.: Intermediate Volatility Organic Compound Emissions from On-Road Diesel Vehicles: Chemical Composition, Emission Factors, and Estimated Secondary Organic Aerosol Production, Environ. Sci. Technol., 49, 11516–11526, https://doi.org/10.1021/acs.est.5b02841, 2015.
Zhao, B., Wang, S., Donahue, N. M., Jathar, S. H., Huang, X., Wu, W., Hao, J., and Robinson, A. L.: Quantifying the effect of organic aerosol aging and intermediate-volatility emissions on regional-scale aerosol pollution in China, Sci. Rep., 6, 28815, https://doi.org/10.1038/srep28815, 2016a.
Zhao, Y., Nguyen, N. T., Presto, A. A., Hennigan, C. J., May, A. A., and Robinson, A. L.: Intermediate Volatility Organic Compound Emissions from On-Road Gasoline Vehicles and Small Off-Road Gasoline Engines, Environ. Sci. Technol., 50, 4554–4563, https://doi.org/10.1021/acs.est.5b06247, 2016b.
Zhang, Q., Jimenez, J. L., Canagaratna, M. R., Allan, J. D., Coe, H., Ulbrich, I., Alfarra, M. R., Takami, A., Middlebrook, A. M., Sun, Y. L., Dzepina, K., Dunlea, E., Docherty, K., DeCarlo, P. F., Salcedo, D., Onasch, T., Jayne, J. T., Miyoshi, T., Shimono, A., Hatakeyama, S., Takegawa, N., Kondo, Y., Schneider, J., Drewnick, F., Borrmann, S., Weimer, S., Demerjian, K., Williams, P., Bower, K., Bahreini, R., Cottrell, L., Griffin, R. J., Rautiainen, J., Sun, J. Y., Zhang, Y. M., and Worsnop, D. R.: Ubiquity and dominance of oxygenated species in organic aerosols in anthropogenically-influenced Northern Hemisphere midlatitudes, Geophys. Res. Lett., 34, L13801, https://doi.org/10.1029/2007GL029979, 2007.
Zhang, X. and Seinfeld, J. H.: A functional group oxidation model (FGOM) for SOA formation and aging, Atmos. Chem. Phys., 13, 5907–5926, https://doi.org/10.5194/acp-13-5907-2013, 2013.
Zheng, J. Y., Zhang, L. J., Che, W. W., Zheng, Z. Y., and Yin, S. S.: A highly resolved temporal and spatial air pollutant emission inventory for the Pearl River Delta region, China and its uncertainty assessment, Atmos. Environ., 43, 5112–5122, https://doi.org/10.1016/j.atmosenv.2009.04.060, 2009.
Zheng, J. Y., Zheng, Z., Yu, Y., and Zhong, L.: Temporal, spatial characteristics and uncertainty of biogenic VOC emissions in the Pearl River Delta region, China, Atmos. Environ., 44, 1960–1969, https://doi.org/10.1016/j.atmosenv.2010.03.001, 2010a.
Zheng, J. Y., Zhong, L. J., Wang, T., Louie, P. K. K., and Li, Z. C.: Ground-level ozone in the Pearl River Delta region: Analysis of data from a recently established regional air quality monitoring network, Atmos. Environ., 44, 814–823, https://doi.org/10.1016/j.atmosenv.2009.11.032, 2010b.
Zheng, J., He, M., Shen, X., Yin, S., and Yuan, Z.: High resolution of black carbon and organic carbon emissions in the Pearl River Delta region, China, Sci. Total Environ., 438, 189–200, https://doi.org/10.1016/j.scitotenv.2012.08.068, 2012.
Zheng, M., Zhang, Y., Yan, C., Zhu, X., Schauer, J.-J., and Zhang, Y.: Review of PM2.5 source apportionment methods in China, Beijing Daxue Xuebao (Ziran Kexue Ban)/Acta Sci. Nat. Univ. Pekin., 50, 1141–1154, https://doi.org/10.13209/j.0479-8023.2014.068, 2014 (in Chinese).
Zhong, Z., Zheng, J., Zhu, M., Huang, Z., Zhang, Z., Jia, G., Wang, X., Bian, Y., Wang, Y., and Li, N.: Recent developments of anthropogenic air pollutant emission inventories in Guangdong province, China, Sci. Total Environ., 627, 1080–1092, https://doi.org/10.1016/j.scitotenv.2018.01.268, 2018.
Zhou, P., Guo, J., Zhou, X., Zhang, W., Liu, L., Liu, Y., and Lin, K.: PM2.5, PM10 and health risk assessment of heavy metals in a typical printed circuit noards manufacturing workshop, J. Environ. Sci., 26, 2018–2026, https://doi.org/10.1016/j.jes.2014.08.003, 2014.