the Creative Commons Attribution 4.0 License.
the Creative Commons Attribution 4.0 License.
 | 15 Mar 2019
Polyols and glucose particulate species as tracers of primary biogenic organic aerosols at 28 French sites
Abdoulaye Samaké
Jean-Luc Jaffrezo
Olivier Favez
Samuël Weber
Véronique Jacob
Alexandre Albinet
Véronique Riffault
Esperanza Perdrix
Antoine Waked
Benjamin Golly
Dalia Salameh
Florie Chevrier
Diogo Miguel Oliveira
Nicolas Bonnaire
Jean-Luc Besombes
Jean M. F. Martins
Sébastien Conil
Géraldine Guillaud
Boualem Mesbah
Benoit Rocq
Pierre-Yves Robic
Agnès Hulin
Sébastien Le Meur
Maxence Descheemaecker
Eve Chretien
Nicolas Marchand
Gaëlle Uzu
A growing number of studies are using specific primary sugar species, such as sugar alcohols or primary saccharides, as marker compounds to characterize and apportion primary biogenic organic aerosols (PBOAs) in the atmosphere. To better understand their annual cycles, as well as their spatiotemporal abundance in terms of concentrations and sources, we conducted a large study focusing on three major atmospheric primary sugar compounds (i.e., arabitol, mannitol, and glucose) measured in various environmental conditions for about 5300 filter samples collected at 28 sites in France. Our results show significant atmospheric concentrations of polyols (defined here as the sum of arabitol and mannitol) and glucose at each sampling location, highlighting their ubiquity. Results also confirm that polyols and glucose are mainly associated with the coarse rather than the fine aerosol mode. At nearly all sites, atmospheric concentrations of polyols and glucose display a well-marked seasonal pattern, with maximum concentrations from late spring to early autumn, followed by an abrupt decrease in late autumn, and a minimum concentration during wintertime. Such seasonal patterns support biogenic emissions associated with higher biological metabolic activities (sporulation, growth, etc.) during warmer periods. Results from a previous comprehensive study using positive matrix factorization (PMF) based on an extended aerosol chemical composition dataset of up to 130 species for 16 of the same sample series have also been used in the present work. The polyols-to-PMPBOA ratio is 0.024±0.010 on average for all sites, with no clear distinction between traffic, urban, or rural typology. Overall, even if the exact origin of the PBOA source is still under investigation, it appears to be an important source of particulate matter (PM), especially during summertime. Results also show that PBOAs are significant sources of total organic matter (OM) in PM10 (13±4 % on a yearly average, and up to 40 % in some environments in summer) at most of the investigated sites. The mean PBOA chemical profile is clearly dominated by contribution from OM (78±9 % of the mass of the PBOA PMF on average), and only a minor contribution from the dust class (3±4 %), suggesting that ambient polyols are most likely associated with biological particle emissions (e.g., active spore discharge) rather than soil dust resuspension.
- Article
(1940 KB) - Full-text XML
-
Supplement
(1268 KB) - BibTeX
- EndNote


Airborne particles (or particulate matter, PM) are of major concern due to their multiple effects on climate and adverse human health impacts (Boucher et al., 2013; Cho et al., 2005; Ntziachristos et al., 2007). The diversity of PM impacts is closely linked to their complex and highly variable nature, i.e., size distribution, concentration and chemical composition, or specific surface properties. PM consists of inorganic and elemental substances, and a large fraction made of carbonaceous matter (organic carbon, OC, and elemental carbon, EC) (Franke et al., 2017; Putaud et al., 2004a; Yttri et al., 2007a). Substantial amounts of atmospheric organic matter (OM) remain unidentified and uncharacterized at the molecular level. In most studies, a maximum of only 20 % of particulate OM mass can generally be speciated and quantified (Alfarra et al., 2007; Fortenberry et al., 2018; Liang et al., 2017; Nozière et al., 2015). This detailed composition of OM and its spatial and seasonal distribution can give important insights into the adverse effects of PM. So far, the majority of air pollution studies have focused on organic atmospheric particles associated with anthropogenic and secondary sources, whereas a significant fraction of OM can also be associated with primary emissions from biogenic sources (Bauer et al., 2008a; Jaenicke, 2005; Liang et al., 2016). Therefore, the characterization of primary OM biogenic sources at the molecular level is still limited (Fuzzi et al., 2006; Liang et al., 2017; Zhu et al., 2015), and should be further investigated for a better understanding of aerosol sources and formation processes.
Primary biogenic organic aerosols (PBOAs) are emitted directly from the biosphere to the atmosphere where they are ubiquitous and participate in many atmospheric processes (Elbert et al., 2007; Fröhlich-Nowoisky et al., 2016). Additionally, their inhalation has long been associated with human respiratory impairments (asthma, aspergillosis, etc.; Després et al., 2012; Morris et al., 2011). PBOAs comprise living and dead microorganisms, such as bacteria and fungi; viruses; bacterial and fungal spores; microbial fragments, such as endotoxins, mycotoxins; or plant materials, such as vegetative debris and pollens (Elbert et al., 2007; Jaenicke, 2005; Morris et al., 2011). In most semi-urban European sites, PBOA can account for up to 25 % of the atmospheric aerosol mass in the size range of 0.2 to 50 µm (Fröhlich-Nowoisky et al., 2016; Jaenicke, 2005; Huffman et al., 2012; Manninen et al., 2014; Morris et al., 2011). However, their sources and contribution to total airborne particles are still poorly documented, partly because of the difficulty to recognize them by conventional microbiological methods (cell culture, microscopic examination, etc.; Di Filippo et al., 2013; Heald and Spracklen, 2009; Jia et al., 2010a).
Several specific chemical components, such as primary sugar compounds (i.e., primary saccharides and sugar alcohols) emitted persistently from biogenic sources, have long been suggested as powerful and unique biomarkers in tracing sources, as well as abundances of PBOA (Bauer et al., 2008a; Medeiros et al., 2006; Simoneit et al., 2004b; Zhang et al., 2010; Zhu et al., 2016). For instance, ambient concentrations of glucose have been used as markers for plant materials (such as pollen, leaves, and their fragments) or soil emissions from several areas in the world (Fu et al., 2012; Jia et al., 2010a, b; Pietrogrande et al., 2014; Rathnayake et al., 2017). Many studies indicated that glucose is the most abundant monosaccharide in vascular plants, where it serves as the common energy material, and an important source of carbon for soil active microorganisms (such as bacteria or fungi) (Jia et al., 2010a; Medeiros et al., 2006; Pietrogrande et al., 2014; Zhu et al., 2015). Additionally, sugar alcohols (also called polyols) including arabitol and mannitol have been proposed as markers for airborne fungi, and are widely used to quantify their contributions to PBOA mass (Bauer et al., 2008a, b; Golly et al., 2018; Srivastava et al., 2018; Zhang et al., 2010). These sugar alcohols have also been found to correlate very well with fluorescent PBOA in the ultraviolet aerodynamic particle sizer (UV-APS) and wideband integrated bioaerosol sensor (WIBS-3) online studies, particularly in rainy periods (Gosselin et al., 2016), favoring microbial sporulation (such as fungi belonging to Ascomycota and Basidiomycota phyla) (China et al., 2016; Elbert et al., 2007; Jones and Harrison, 2004). Polyols are produced in large amounts by many fungi and bacteria, and several functions have been described for these compounds, such as common energy storage materials, intracellular protectants against stressful conditions (e.g., heat or drought), storage or transport of carbohydrates, quenchers of oxygenated reactive species, or regulators of intracellular pH by acting as a sink or source of protons (Jennings et al., 1998; Medeiros et al., 2006; Vélëz et al., 2007). Hence, polyols, especially arabitol and mannitol, may represent a significant fraction of the dry weight of fungi, and mannitol can contribute between 20 % and 50 % of the mycelium dry weight (Ruijter et al., 2003; Vélëz et al., 2007). However, polyols are also often identified in the lower plants (leaves, pollens) and green algal lichens (Medeiros et al., 2006; Vélëz et al., 2007; Yang et al., 2012). The primary sugar compounds (defined as polyols and primary saccharide species) are thought to be relatively stable in the atmosphere (Wang et al., 2018), although studies investigating their atmospheric lifetime are quite limited. One previous laboratory study has been conducted by the US Environmental Protection Agency (EPA) to evaluate the stability of these chemicals on filter material exposed to gaseous oxidants as well as in aqueous solutions (simulating clouds and fog droplet chemistry). Findings of that study have shown that primary sugar compounds remain quite stable up to 7 days (the extent of the testing period), pointing out their suitability for use as tracers of atmospheric transport (Fraser, 2010). With all of this information, the use of primary sugar compounds (such as mannitol, arabitol, glucose, etc.) as suitable tracers of PBOA is generally acknowledged (Jia and Fraser, 2011; Zhu et al., 2015, 2016).
Although atmospheric concentrations of polyols – including arabitol and mannitol as well as some primary monosaccharides (e.g., glucose) – have been previously quantified as part of several studies in various environments including urban/suburban, rural, rainforest, mountain, and marine areas (Fu et al., 2012; Graham et al., 2003; Jia et al., 2010a, b; Liang et al., 2016; Pietrogrande et al., 2014; Simoneit, 2004a, b; Verma et al., 2018; Yttri et al., 2007b; Zhu et al., 2015), large datasets investigating their annual cycles and spatial distributions are still limited. Such information could give important insights into environmental factors influencing their atmospheric levels such as climate and biotope, and therefore help to elucidate patterns regarding their major sources and atmospheric emission pathways. Even if numerous sources and emission mechanisms have been widely proposed – including, among others, metabolically active microbial wet emissions, entrainment of farmland or natural soils, and associated microbiota (Elbert et al., 2007; Fu et al., 2013; Gosselin et al., 2016; Jia et al., 2010a, b; Medeiros et al., 2006; Pietrogrande et al., 2014; Simoneit et al., 2004a, b; Verma et al., 2018; Yttri et al., 2007b) – the dominant atmospheric input processes have not yet been sufficiently elucidated.
In this context, the present study was designed to provide a broad overview of the spatial and seasonal variations in polyols and glucose mass concentrations, as well as their contribution to the aerosol organic mass fraction in France. To do so, data were collected at many sites in different environments (rural, traffic, urban) in order to represent various sampling conditions in terms of site typologies and meteorological conditions. Thanks to the availability of results from an extended positive matrix factorization (PMF) analysis performed for the corresponding datasets, the overall contributions of the main polyols and glucose emission sources could also be investigated in light of their spatial patterns. To the best of our knowledge, this is the first study providing such an extended phenomenology of these compounds over multiple sites with different typologies.
2.1 Aerosol sampling
Ambient aerosol samples considered in the present work come from different research and monitoring programs, conducted over the last 5 years in France (Fig. 1). Each program includes at least 1 year of field sampling, providing a total number of 5343 daily filter samples available for the sake of the present study. These sites offer diverse conditions in terms of typologies (rural, traffic, urban sites, Alpine valley environments, etc.), local climate, and vegetation types, and were selected in order to cover the complex and variable national environmental conditions. These sites are assumed to represent typical environmental conditions in France, and our observations and general tendency could therefore be extrapolated to neighboring western European countries presenting quite homogeneous environmental conditions.
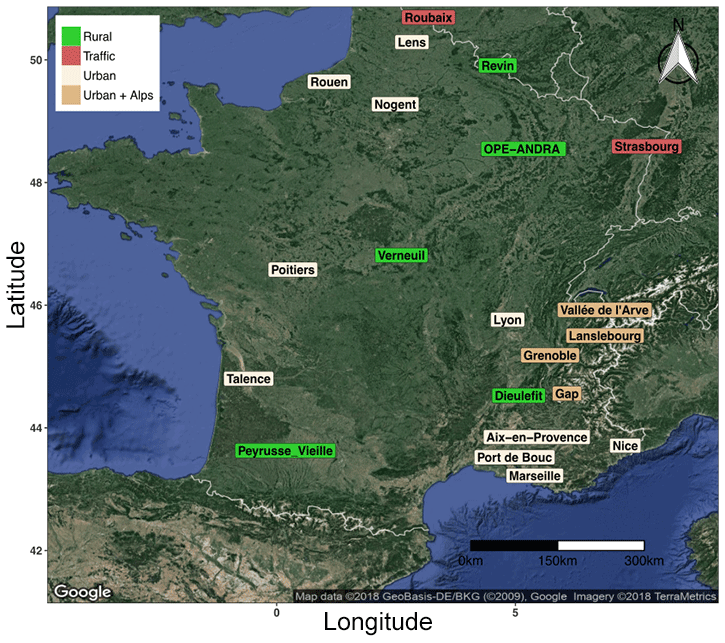
Figure 1Map of sampling site locations in France. Green: rural background, red: traffic, wheat color: urban background, and dark-wheat color: urban background in Alpine valley sites. The areas of Grenoble (Grenoble_LF, Grenoble_CB, and Grenoble_VIF) and Vallée de l'Arve (Marnaz, Passy, and Chamonix) include three sites each. The area of Marseille includes four sites: Marseille, Mallet, Meyreuil, and Gardanne.
The site of OPE-ANDRA is a specific monitoring observatory in a rural environment, without any village or industry within several kilometers (description available from http://www.andra.fr, last access: 12 February 2019). All other sites correspond to stations of regional air quality monitoring networks (AASQA). The availability of filter samples was variable from one site to the other one, depending on the sampling frequency (typically every third or sixth day). Filter collection was conducted within the PM10 or the PM2.5 aerosol size fractions, depending on the investigated site (Table S1 in the Supplement). Moreover, co-located and simultaneous PM10 and PM2.5 samplings were conducted at OPE-ANDRA and Revin, allowing us to investigate the distribution of primary sugar compounds between the fine and the coarse aerosol size fractions at these two sites.
Ambient aerosols were collected onto quartz fiber filters (Tissuquartz PALL QAT-UP 2500, 150 mm diameter) and preheated at 500 ∘C for 4 h minimum before use. After collection, all filter samples were wrapped in aluminum foils, sealed in zipper plastic bags, and stored at < 4 ∘C until further chemical analysis. Field blank filters were also collected, at least once a month, using the same handling procedure as for PM samples. More detailed information on the sampling periods, air sampler, number of filters, and nature of PM samples are provided in Table S1 and Fig. S1 in the Supplement.
2.2 Chemical analyses
PM samples were analyzed for various chemical species using subsampled fractions of the collection filters. In the frame of the present study, the carbonaceous matter (OC and EC) was analyzed using a thermo-optical method on a Sunset Lab analyzer (Birch and Cary, 1996) as described by Aymoz et al. (2007) using the EUSAAR2 temperature program (Cavalli et al., 2010), except for the five sites of northern France where the NIOSH870 protocol was employed (Birch and Cary, 1996). OM contents were then estimated by multiplying the organic carbon mass concentrations by a fixed factor, with . This OM-to-OC ratio value of 1.8 was chosen based on previous studies performed in France (Favez et al., 2010; Petit et al., 2015, and reference therein) and around the world. (e.g., Aiken et al., 2008; Li et al., 2018; Ruthenburg et al., 2014; Vlachou et al., 2018), with a typical range of 1.2–2.4 for these values.
For the analysis of anhydrosugars, sugar alcohols, and primary saccharides, filter punches (typically of about 10 cm2) were first extracted into ultrapure water, then filtered using a 0.22 µm Acrodisc filter. Depending on the site, analyses were conducted either by the IGE (Institut des Géosciences de l'Environnement) or by the LSCE (Laboratoire des Sciences du Climat et de l'Environnement) (Table S1). At IGE, extraction was performed during 20 min in a vortex shaker and analyses were achieved using high-performance liquid chromatography (HPLC) with pulsed amperometric detection. A first set of equipment was used until March 2016, consisting of a Dionex DX500 equipped with three columns (Metrosep Carb 1-Guard + A Supp 15–150 + Carb 1–150); the analytical run being isocratic with 70 mM sodium hydroxide eluent, followed by a gradient cleaning step with a 120 mM NaOH eluent. This analytical technique enables us to detect anhydrous saccharides (levoglucosan, mannosan, galactosan), polyols (arabitol, sorbitol, mannitol), and glucose (Waked et al., 2014). A second set of equipment was used after March 2016, with a Thermo Fisher ICS 5000+ HPLC equipped with 4 mm diameter Metrosep Carb 2×150 mm column and 50 mm pre-column. The analytical run is isocratic with 15 % of an eluent of sodium hydroxide (200 mM) and sodium acetate (4 mM) and 85 % water at 1 mL min−1. This method allows for additional separation and quantification of erythritol, xylitol, and trehalose. At LSCE, extraction was performed during 45 min by sonication and analyses were achieved using an ion chromatography (IC) instrument (DX600, Dionex) with pulsed amperometric detection (ICS3000, Dionex). A CarboPAC MA1 column was used (4×250 mm, Dionex), the analytical run being isocratic with 480 mM sodium hydroxide eluent. This analytical technique enables us to detect anhydrous saccharides (levoglucosan, mannosan, galactosan), polyols (arabitol, mannitol), and glucose.
Field blank filters were handled as real samples for quality assurance. The present data were corrected with field blanks. The reproducibility of the analysis of primary sugar species (polyols, glucose), estimated from the analysis of extracts of 10 punches from the same filters, is generally in the range of 10 %–15 %.
Additional chemical analyses were conducted for most of the sites, allowing us to quantify up to 130 different chemical species (Calas et al., 2018). Then 30–35 chemical species were selected in order to achieve PMF analyses as discussed hereafter.
2.3 Statistical analysis
Species concentration measurements were first analyzed for normality using Shapiro–Wilk's method with the statistical program R studio interface (version 3.4.1). Since data were generally not distributed normally, we used nonparametric statistical methods. The strength of the relationship between species concentrations was investigated using the nonparametric Spearman rank correlation method. Multiple mean comparison analyses were performed with the Kruskal–Wallis test method. Statistical significance was set at p < 0.05.
Positive matrix factorization for the source apportionment of the PM was previously performed at several sites of this study, as part of the SOURCES (Favez et al., 2016) and DECOMBIO (Chevrier, 2017) projects. We used the US EPA PMF 5.0 software (US EPA, 2015), following the general recommendation guidelines of the European Joint Research Centre (JRC; Belis et al., 2014). Briefly, the SOURCES program aimed at performing source apportionment at 15 sites using a harmonized methodology, i.e., using the same chemical species, uncertainties, constraints, and criteria for factor identification. The PMF conducted within the SOURCES project uses about 30 different species (Table S6), including carbonaceous fraction (OC, EC), ions (Cl−, , , , Mg2+, Ca2+), organic markers (polyols, i.e., sum of arabitol, mannitol, and sorbitol; levoglucosan; mannosan), and metals (Al, As, Ba, Cd, Co, Cs, Cu, Fe, La, Mn, Mo, Ni, Pb, Rb, Sb, Se, Sn, Sr, Ti, V, Zn). The PMF conducted within the DECOMBIO project, for the sites of Marnaz, Chamonix, and Passy, used aethalometer (AE 33) measurements instead of EC measurements (Chevrier, 2016). This complementary measure gives the total black carbon (BC), thus enabling the deconvolution of BC concentrations into its two main constituents: wood-burning BC (BCwb) and fossil-fuel BC (BCff) (Sandradewi et al., 2008). For graphical simplicity, BCwb and BCff were summed up and labeled as EC in the following figures. PMF modeling was performed separately for each site. Statistical significance was validated with bootstrapping higher than 80 % for each factor. Detailed methodology and results about these studies are given in their respective papers (Chevrier, 2017; Favez et al., 2016). It should be noted that glucose was not included in the final solution for any of these PMF, since it generally produced statistical instability of the solutions (this point is further discussed in Sect. 3.2).
The PMF analysis took advantage of the ME-2 algorithm to add constraints to different chemical profiles (see Tables S3 and S4 for details). Mainly soft constraints were applied in order to add some prior knowledge about the emission sources and “clean” the different profiles without forcing the model toward an explicit solution. In particular, the polyol concentrations were “pulled up maximally”, while levoglucosan and mannosan were set to zero, and EC was “pulled down maximally” in the PBOA factor. This was achieved to avoid mixing with the biomass burning factor as well as possible influences of unrealistic high contributions of EC to PBOA. Other constraints were added parsimoniously to other factors, targeting specific proxies of sources (Table S4).
As for the general results of this large PMF study, we identified some well-known sources for almost all the sites (biomass burning, road traffic, secondary inorganics, dust and sea salt). Two other less-common factors were identified for all sites: secondary biogenic aerosols (probably from marine origin), traced mainly by the presence of methanesulfonic acid (MSA), and PBOA, traced by the presence of more than 90 % of the polyols total mass in the factor. Table S5 and Fig. S4 present a more detailed description of the chemical tracers in each factor, together with their yearly average contribution for each site. Hereafter, only the PBOA chemical profile will be extensively investigated. The uncertainties in this PBOA factor are discussed below and its stability is presented in Fig. S5. Bootstrap analysis based on 100 resampling runs evidenced the very high stability of this PBOA factor since the PBOA initial constrained factor was mapped to the PBOA bootstrap factor more than 99 % of the time.

Figure 2Overview of relative mass distributions of individual primary sugar alcohols and saccharide compounds quantified in PM10 samples at two sites over summer and autumn periods (June to November) corresponding to maximal atmospheric concentrations of sugar alcohols/saccharide compounds.
3.1 Relative distribution between sugar alcohols and glucose
Figure 2 presents an overview of the relative mass concentration distributions of individual chemical species quantified at two sites with very different characteristics, an urban site in Grenoble and the rural site of OPE-ANDRA. Data are presented for the warmer season (e.g., during summer and fall), when concentrations were at their maximum (see Sect. 3.4). Glucose is the most abundant species measured (average 37.6±26.4 ng m−3), accounting on average for 25 % of primary sugar compounds (SC) total mass at both sites. Mannitol (37.3±24.6 ng m−3) and arabitol (32.0±22.2 ng m−3) are the second and third most abundant species, accounting for 25 % and 23 % of SC mass, respectively. Trehalose is relatively abundant in samples from these two sites (20.1±16.2 ng m−3), accounting for 14 % of SC mass, but in general its concentration is frequently below the limit of quantification for samples from other sites in France. The other identified polyols (i.e., erythritol, inositol, glycerol, sorbitol, and xylitol) present lower concentration levels (4.9±2.1 ng m−3), corresponding altogether to 13 % of SC total mass.
Such ambient mass concentration distribution patterns are similar (but with variable intensities) to those previously reported for aerosol samples collected at various locations around the world. For example, Verma et al. (2018) found that glucose, and arabitol together with mannitol, contributed to 16.7 % and 48.1 %, respectively, of total primary sugar compounds in aerosols from Chichijima island. Similarly, Yttri et al. (2007b) showed that glucose and the pair arabitol and mannitol were the main contributors of total primary monosaccharides and sugar alcohols in aerosols collected from four various background sites in Norway. In addition, Carvalho et al. (2003) reported that arabitol, mannitol, and glucose are the most dominant primary sugar compounds in aerosols from rural background and boreal forest sites in Germany and Finland, respectively.
Although various primary sugar alcohols and saccharides have been detected and quantified for most of the investigated sites, the following study focuses only on the three major and ubiquitous species, namely arabitol, mannitol, and glucose. Figure 3 presents their average relative contributions at all sites, for the warmer period, displaying very similar features at a first glance. However, discrepancies could be observed from site to site, as discussed in the following sections.
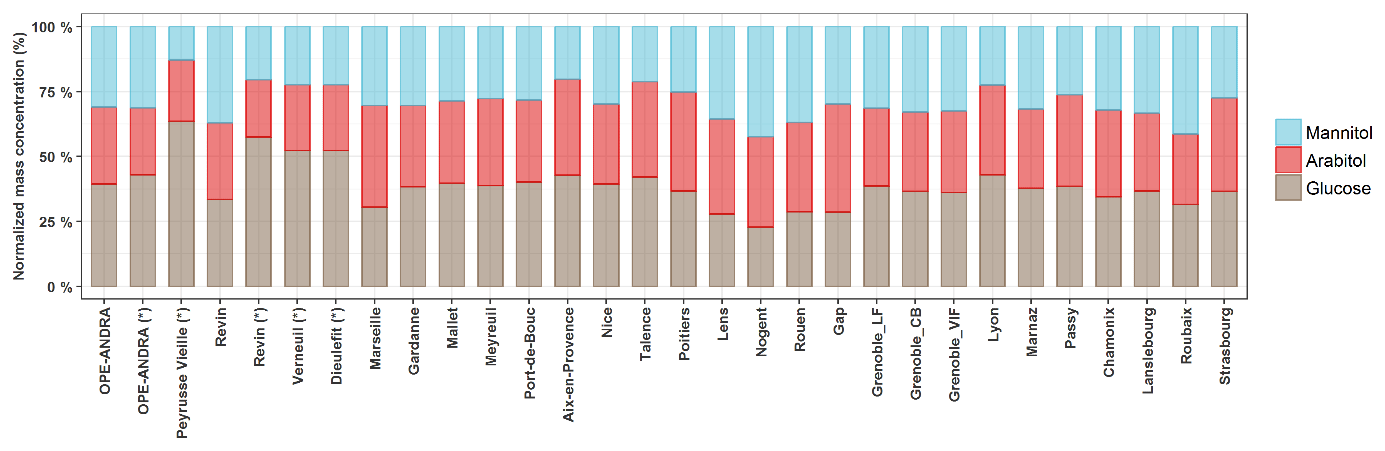
Figure 3Average mass concentration distributions of arabitol, mannitol, and glucose. Symbol (*) indicates PM2.5 aerosol samples. Only data for warmer season (June to November), corresponding to maximal atmospheric concentration of polyols and glucose, are shown.
3.2 Relationships between selected primary sugar compounds
Figure 4 summarizes linear correlations obtained between arabitol and mannitol concentrations at each site during the warmer period. Medium to very high coefficients of determination could be observed (; or for PM2.5 and PM10 series, respectively), with slopes in a rather narrow range (between 0.59 and 1.10), and quite low intercepts (always below 9 ng m−3). Such covariations indicate that both species are most probably co-emitted, by one or several type(s) of sources, at each site during the summer–autumn period. These observations are in agreement with previous studies also showing strong covariations between arabitol and mannitol (Kang et al., 2018; Verma et al., 2018; Zhu et al., 2015). Therefore, it seemed reasonable to consider both species together so that their concentrations are summed up and labeled as “polyols” in the following sections.

Figure 4Linear regression analysis between selected primary sugar compound mass concentrations (i.e., arabitol, mannitol, and glucose) during summer and autumn seasons (June to November) for all the sites considered in this study.
Conversely, linear correlations between glucose and polyol concentrations are generally weaker (0.10< R2≤0.78), with slopes varying over a much larger range (between 0.12 and 0.94), and variable intercepts (between −5.6 and 16.4 ng m−3). This suggests that glucose concentrations might follow a different pattern compared to that of polyols, either due to different emission sources, or different chemical stability in the atmosphere. It is therefore reasonable to keep glucose as a separate chemical species in the following discussion.
It should be emphasized that the variability in the slope of the regressions between the chemical concentrations is most probably related to the emissions and atmospheric processing. Particularly in the case of mannitol and arabitol, they may be influenced by biogenic or biotope characteristics. Nevertheless, no evident relationship between the slope values and the typology or the geographical location of the sites could be observed (Fig. 4).
3.3 Relative distributions between PM10 and PM2.5
Figure 5 shows the average PM10 and PM2.5 concentrations of polyols and glucose at OPE-ANDRA and Revin during the summer and autumn seasons. The polyol mass concentrations ranged from 7.5±10.9 to 27.8±33.3 ng m−3 in PM2.5, and from 48.9±38.2 to 73.5±61.8 ng m−3 in PM10, in Revin and OPE-ANDRA sites, respectively. PM10-to-PM2.5 ratios were then on average of about 3 to 5. Similar size distribution patterns, with variable intensity, were observed for glucose (Fig. 5). These results indicate that polyols and glucose are mainly associated with the coarse PM fraction. This observation is in good agreement with several previous investigations where polyols (especially arabitol and mannitol), together with glucose, were prevalent in the coarse fraction (Fu et al., 2012; Fuzzi et al., 2007; Pio et al., 2008; Yttri et al., 2007b). However, Carvalho et al. (2003) reported different size distributions for polyols and glucose, with variable fine or coarse mode maxima depending upon sampling location. For instance, maximum atmospheric concentrations of mannitol were associated to fine and coarse aerosols from boreal forest (Finland) and rural background sites (Germany), respectively. The authors hypothesized that these observations are due to different assemblages of dominant fungal biota (with variable aerodynamic characteristics) at different sites. Some other previous studies showed aerodynamic diameters typically ranging from 2 to 10 µm, even though a few airborne bacterial/fungal spores could exceed that size (Bauer et al., 2008a; Elbert et al., 2007; Huffman et al., 2012; Zhang et al., 2015).

Figure 5Box plots of mass concentrations of polyols (a) and glucose (b) in PM10 and PM2.5 (with symbol * samples). Black markers inside each box indicate the mean concentration value, while the top, middle, and bottom lines of the box represent the 75th, median, and 25th percentile, respectively. The whiskers at the top and bottom of the box extend from the 95th to the 5th percentile. The number of samples was N = 123 for OPE-ANDRA and N = 87 for Revin. Statistical differences between average mass concentrations were analyzed with the Kruskal–Wallis methods (p<0.05).
Hence, although the precise mechanisms of atmospheric emission of particulate polyols and glucose are not fully resolved, our observations are in good agreement with ambient mass concentrations of polyols and glucose being likely associated with biological particles, as already suggested elsewhere (Fu et al., 2012; Verma et al., 2018; Zhang et al., 2015). These species could enter into the atmosphere through either natural or anthropogenic resuspension of surface soils and associated bacterial/fungal spores (containing polyols and primary sugar compounds), or via a direct input resulting from microbial activities (e.g., sporulation). Another hypothesis would be the abrasion of leaves and the subsequent release of microbial organisms and plant debris (Fu et al., 2012; Medeiros et al., 2006; Simoneit et al., 2004b).
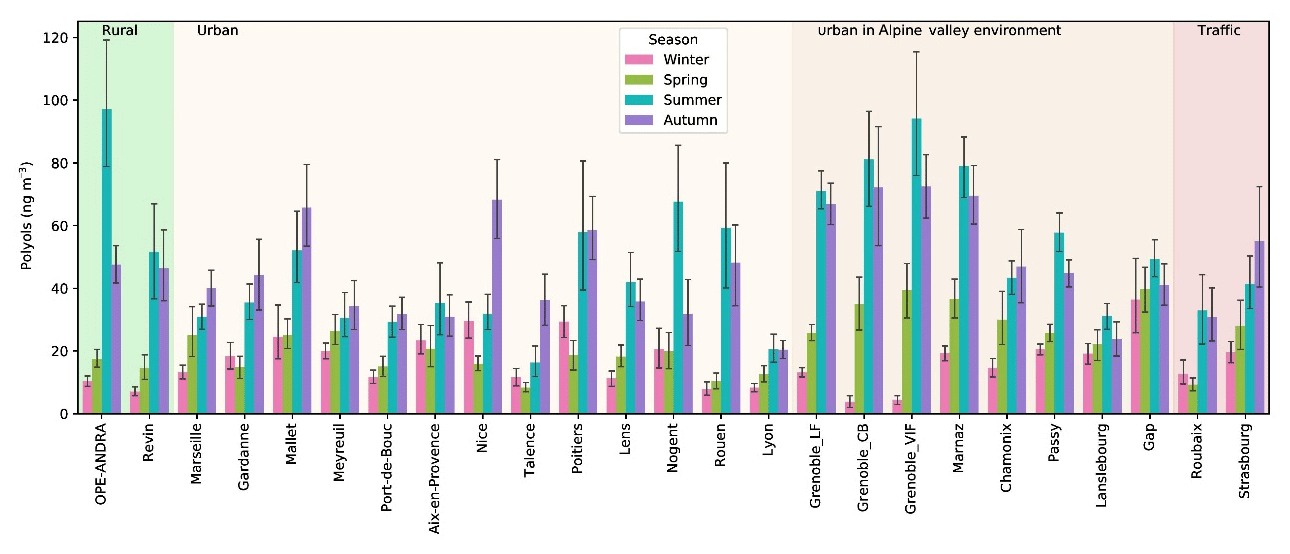
Figure 6Spatial and seasonal distributions of atmospheric polyol average concentrations (ng m−3) for various types of sites in France. Error bars correspond to standard deviations calculated with seasonal concentrations. Years of PM sampling campaigns are not concurrent at all sites (see Fig. S1). The seasons were defined as follows: Winter is December to February, Spring is March to May, Summer is June to August, and Autumn is September to November.
3.4 Spatial and seasonal distribution of atmospheric concentrations
3.4.1 Spatial and seasonal patterns of polyol concentrations
As illustrated in Fig. 6, significant concentrations of polyols were measured at each investigated site, evidencing the ubiquity of these organic compounds. The annual average concentration levels of polyols measured in PM10 aerosols at all sites (33.2±33.5 ng m−3; see Table S2) are within the range previously reported for urban and rural sites across Europe (Burshtein et al., 2011; Di Filippo et al., 2013; Pietrogrande et al., 2014; Yttri et al., 2007b, 2011). Additionally, polyol mass concentrations clearly exhibit seasonal trends, with variable intensity according to the sampling sites. On a seasonal average, polyols are more abundant in summer (46.8±43.6 ng m−3) and autumn (43.0±36.7 ng m−3), followed by spring (19.0±13.6 ng m−3) and winter (16.2±11.5 ng m−3). The average concentrations of polyols are at least 2 to 3 times higher during summer or autumn months than during the cold months, with a ratio that can be as high as 8 to 10.
Previous studies also reported a similar seasonal variation pattern for urban and rural aerosol samples collected at various locations. For example, Pashynska et al. (2002) measured higher atmospheric polyol (arabitol, mannitol) contents during late summer and autumn in Belgium. Several other studies reported higher concentrations of polyols in summer than in spring and winter time in aerosols collected from Texas, USA, and Jeju island, South Korea, respectively (Fu et al., 2012; Jia et al., 2010a, b). More recently, Liang et al. (2016) and Verma et al. (2018) also reported similar seasonal distributions for aerosols sampled in Beijing, China, and the northwestern Pacific, respectively.
The higher atmospheric polyol concentrations observed are likely due to the increased contribution from metabolically active microbial-derived sources (fungi, bacteria, green algal lichens) as a result of external stressors such as heat, drought, and relative moisture. Indeed, fungal and prokaryotic cell activities, including their growth and sporulation, are promoted by high temperature and humid conditions occurring in summer and autumn (China et al., 2016; Elbert et al., 2007b; Jones and Harrison, 2004; Rathnayake et al., 2017).
As also evidenced from Fig. 6 that atmospheric polyol concentrations do not present any significant seasonal differences related to the site typology (rural, traffic, urban sites with/without Alpine influences) or latitude. There is some tendency toward higher concentrations in summer in Alpine environments, but some other sites (like the rural site of OPE-ANDRA in the northeast of France) can reach the same levels of concentrations. We tested several types of hierarchical classifications, including variables like monthly or seasonal mean polyol concentrations, the arabitol-to-mannitol ratio, or linear regression parameters (slope, R square) but none of them led to a simple clustering of the sites that would explain the variability of the concentrations.
3.4.2 Spatial and seasonal patterns of glucose concentrations
The annual average concentrations of glucose measured in PM10 aerosols at all sites (20.4±15.6 ng m−3; see Table S2) are comparable to those previously reported for various sites across Europe (Alves et al., 2006; Theodosi et al., 2018; Yttri et al., 2007b, 2011). Like polyols, the atmospheric concentrations of glucose also display seasonal and site-to-site variations (Fig. 7). The ambient seasonal mean concentrations (with standard deviations) of glucose are maximum in summer (25.0±24.2 ng m−3) and autumn (24.6±19.8 ng m−3), followed by spring (15.8±12.4 ng m−3) and winter (12.6±10.2 ng m−3). The summer to winter ratio for glucose seems generally lower than that of polyols, with higher ratios in the Alpine areas than in other parts of France. However, as for polyols, it remains difficult to classify the sites according to any criteria linked to site typology or latitude.
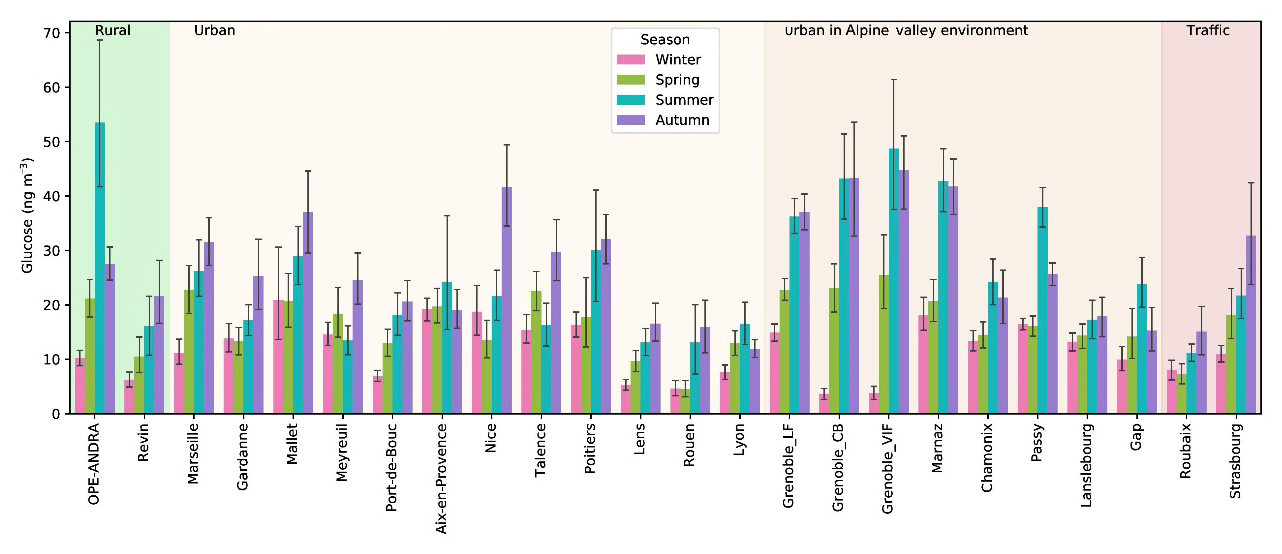
Figure 7Spatial and seasonal distributions of atmospheric glucose levels (ng m−3) for various types of sites in France (except the site of Nogent, which presented too many missing values). Error bars correspond to standard deviations calculated with seasonal concentrations.
The seasonal trend of glucose concentrations in the present work is similar to that recently observed for aerosols (PM10 or total suspended particles) collected at various environmental background (suburban, urban, and coastal) sites around the world (Liang et al., 2016; Srithawirat and Brimblecombe, 2015; Verma et al., 2018). On average, a wide range of daily glucose concentrations (expressed as min–max, mean) in PM10 (0.1–297.2 ng m−3, 20.4±15.6 ng m−3) were observed in the present study. These values are comparable to those in PM10 (8.4–93.0, 47.0 ng m−3) reported from an urban site in Norway (Yttri et al., 2007b). More recently, Liang et al. (2016) also reported similar concentrations in PM10 (3.1–343.6, 46.2±27.5 ng m−3) from Beijing (China).
The sources and formation processes of glucose in the atmosphere are not currently well known and are rarely discussed. Glucose is an important carbon source for metabolically active soil microbiota, and it is commonly present in vascular plants. Additionally, cellulose (a linear polymer made of glucose subunits linked by β-1,4 bonds) is one of the most important form of organic compounds in terrestrial ecosystems and a major plant structural polymer (Boex-Fontvieille et al., 2014). It can also be quite abundant in the atmosphere (Puxbaum and Tenze-Kunit, 2003). Hence, it is hypothesized that ambient glucose could be formed through active microbial (bacteria, fungi, etc.) enzymatic hydrolysis of cellulose in plant debris. Consistent with these observations, glucose could be released into the atmosphere from both vascular plant materials (leaves, fruits, pollens, etc.) growing in spring and decomposing in autumn/summer and soil microbiota, as already suggested elsewhere (Di Filippo et al., 2013; Jia et al., 2010a; Medeiros et al., 2006; Verma et al., 2018; Zhu et al., 2015).
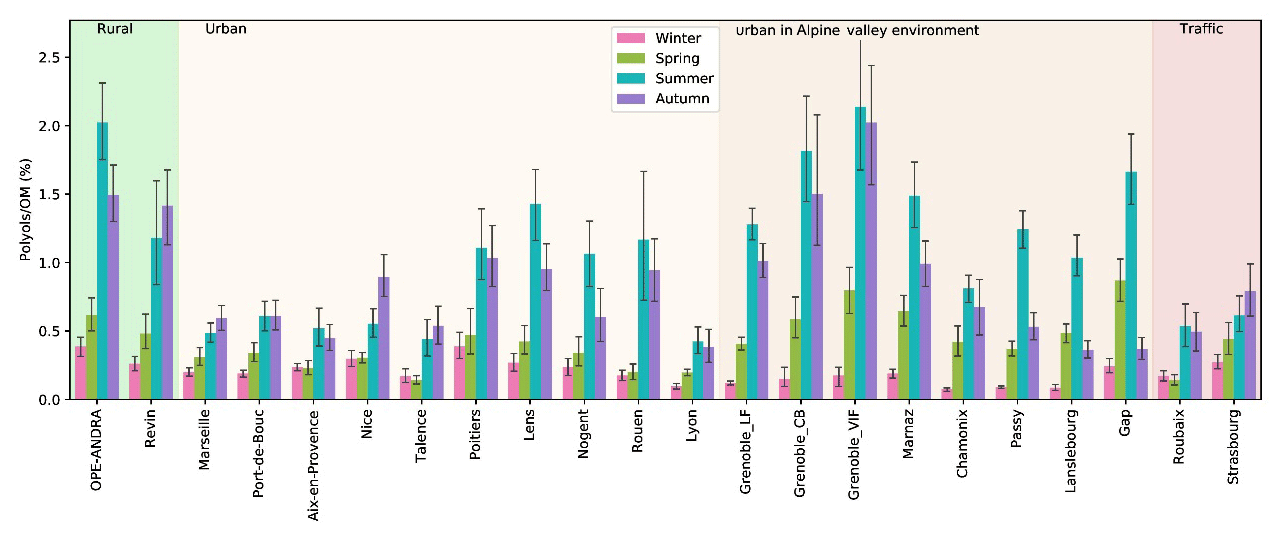
Figure 8Spatial and seasonal distributions of mean contributions (in %) of polyols to the organic matter content of PM for various types of sites in France. Daily time series of organic carbon (OC) were not available for the following sites: Gardanne, Mallet, and Meyreuil. Error bars correspond to standard deviations calculated with seasonal concentrations.
3.4.3 Relative contributions to aerosol organic matter concentrations
The average contribution of polyols to the OM content of PM clearly displayed a seasonal behavior, as shown in Fig. 8. Here again, contributions are 2 to 10 times higher during summer and autumn compared to winter and spring, consistent with the assumption of higher emissions during these periods. The seasonal mean contribution of polyols to OM fluctuates from site to site and accounts for 0.1 % to 2.1 % of overall OM for these French sites (Fig. 8). Similarly, the seasonal mean concentrations of polyols together with glucose represent between 0.2 % and 3.1 % of total OM at these sites (Fig. S2). However, on a daily basis (Samake et al., 2018), atmospheric polyol mass concentrations can represent up to 6.3 % of total OM in PM10, indicating that polyols can be amongst the major molecular species identified in aerosol organic matter (Fig. S3). Again, we could not find any simple way to group the sites according to their characteristics (typology or latitude, or climatic region) in order to better understand the drivers behind the variability in this mass fraction. Further studies are currently being conducted using multi-criterion examinations.
The seasonal polyols-to-OM distribution patterns in this study are comparable to those found for different urban or rural sites in Europe (around 0.2 % to 2.5 % of OM; Pashynska et al., 2002; Yttri et al., 2007b). Zhu et al. (2015) also reported a similar seasonal polyols-to-OM contribution trend for aerosols sampled at Cape Hedo (coastal site, Japan).
3.5 Primary biogenic factor in PMF studies
The sum of polyols (arabitol + mannitol) represents only a small fraction of the total OM. However, as proxies of PBOA, they are most probably emitted with other chemical species. Emission from biological particles is a complex topic since it may include a wide variety of compounds, both organic and inorganic (Elbert et al., 2007; Zhang et al., 2015). Moreover, it is not clear if polyols are mainly emitted directly in the atmosphere or are linked to other materials, e.g., with soil dust during resuspension processes. To investigate the relationship between polyols and other molecular tracers of emission sources, it is possible to perform simple correlation analysis with individual chemical species. This approach has the disadvantage of being a one-to-one relation and thus highly sensitive to the dynamics of all PM emission sources, not only the one we are interested in. Alternatively, another way is to use a PMF approach, also based on correlations but including much more information on the temporal variations of the different sources influencing the PM chemistry at a given receptor site.
As mentioned in Sect. 2.3, the PMF results used in this study include sites of different typologies (rural, traffic, urban sites in Alpine valley environments, etc.) for 16 different locations spread over France and part of the current dataset. At each site, the PMF studies allowed us to identify a PBOA factor, characterized by the presence of more than 90 % of the total polyol content (sum of arabitol, mannitol, and sorbitol), as presented in Table S5 and Fig. S6. Moreover, the sensitivity of this factor to random noise in the data was investigated thanks to randomly resampling the input matrix of observation. In PMF analysis, this is done via the bootstrap method (Paatero et al., 2014) in the constrained run. The PBOA factor was always mapped to itself for 13 of the sites and nearly always (97 %) for the last three ones. It means that the PBOA factor does have a very high statistical stability since it never swaps with another factor (see Fig. S5). Hence, the chemical composition of this factor may be informative to investigate the PBOA source components (Table S6), and to evaluate the importance of PBOA emissions in terms of OM mass apportionment.
3.5.1 Contributions of PBOA to OM and polyols to PBOA
Altogether, the results from the 16 sites highlight the importance of the PBOA source contribution to total OM. As shown in Fig. 9, the OM apportioned by the PBOA factor represents a significant fraction of the total OM mass on a yearly average (range 6 %–28 %; average 13±6 %). When considering only the summer period (June–July–August), this contribution is even larger and can exceed 40 % of the total OM at sites in the Alpine area (Marnaz, Passy, Chamonix, Grenoble_LF), which are partially protected from large regional influences due to the local topography. This result may be nuanced, in particular during summer, since some extent of mixing between PBOA and biogenic secondary organic aerosols (BSOAs) cannot be entirely excluded. However, several evidences tend in favor of a nonsignificant mixing between BSOA and PBOA. First, the ratio of polyols-to-OCPBOA shows a low variability from site to site, while it is unlikely that such a secondary process led to the same amount of OC for all sites since they present different meteorology, sunshine duration, etc. Second, the bootstrap analysis does not show any “swap” between factors for the PBOA profile for all sites, indicative of a well-defined factor (see Fig. S5). Finally, the OCPBOA-to-polyols ratio in this work (about 16) is in the range expected for fungal spores (12–27, when arabitol and mannitol are considered together) (Bauer et al., 2008a; Yttri et al., 2011).
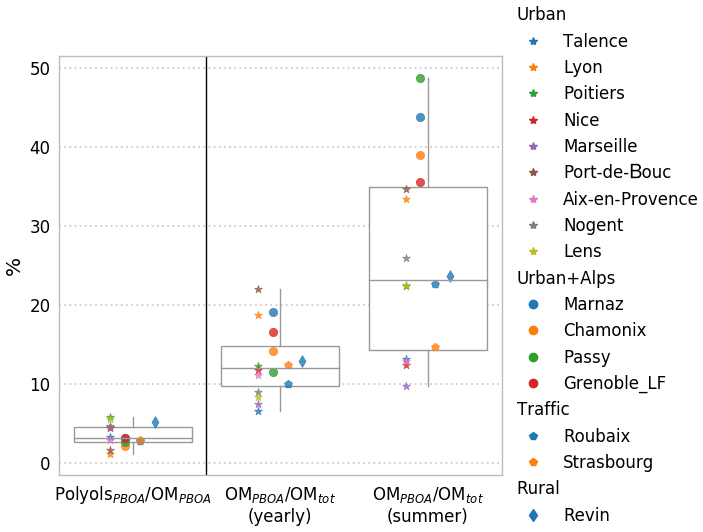
Figure 9Mass contribution of polyols to OM in the PBOA factor, and relative contributions of the OMPBOA factor to the total OM in PM for the 16 studied sites where the PMF model was run, over the year and summertime only. Stars and circles refer to urban sites without and with Alpine valley influence, respectively. Pentagons correspond to traffic sites and diamonds to rural sites.
Interestingly, some previous work using the same samples from the sites in the Arve valley (Passy, Chamonix) showed that about 90 % of the OM is from modern origin (using 14C measurements) during summer, with no apparent correlation between this modern carbon and polyol concentrations (Bonvalot et al., 2016). Hence, despite being an important contributing source, PBOA is not the major biogenic source in this type of environment.
Interestingly, opposite to the case of the Alpine valleys where this proportion is the highest, the ratios OMPBOA-to-OMtot are amongst the lowest for coastal environments (Talence, Marseille, Nice), a possible indication that the marine environment is not a large emitter for these species. Recently, much lower concentrations of polyols in aerosols from marine environments than those in terrestrially influenced sites were also reported off the coast of Japan, also suggesting a higher contribution from terrestrial sources (Kang et al., 2018).
As illustrated in Fig. 9, polyols represent only a small fraction of the OM apportioned in the PBOA factor (1.2 %–6.0 %; average 3.0±1.5 %) for the 16 studied sites. This variability is indeed rather small, considering the wide range of sites and the diversity of other potential sources (on average 8 to 10 PMF factors were obtained for the different sites). Indeed, this narrow range of the polyol fraction to the OMPBOA highlights the stability of the chemical profile of this source over a large regional scale. It indicates also that, if polyols are good proxies of the PBOA sources, a large amount of other organic species are co-emitted, which still remain unknown.
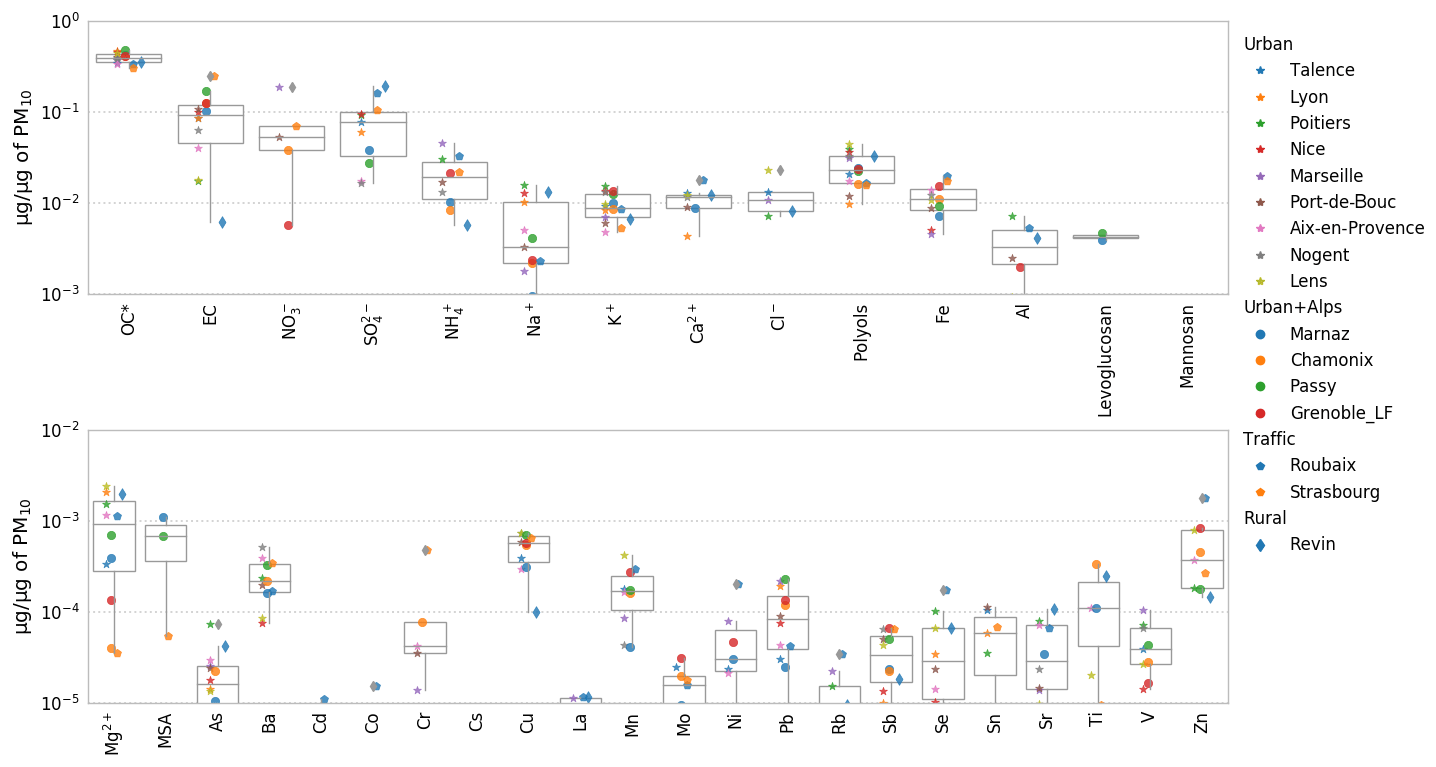
Figure 10PMF chemical profile of the PBOA factor in the DECOMBIO and SOURCES programs expressed as a fraction of the PM mass. Values lower than a few pg µg−1 are not displayed on purpose. For each box, the top, middle, and bottom lines represent the 75th, median, and 25th percentile, respectively. The whiskers at the top and bottom of the box extend from the maximum to the minimum. OC* corresponds to the bulk organic carbon fraction minus the carbon in the characterized organic species. MSA is methanesulfonic acid.
3.5.2 PBOA profile constituents and emission process
Figure 10 shows the contribution (in micrograms of species per micrograms of PM in the PBOA factor profile) of each chemical species included in the averaged PBOA factor from the 16 PMF studies. The principal contributors are OC and EC, and significant fractions of crustal material also appear (Na+, K+, Ca2+, Al, Ba, Cu, Fe, Mn, Ti, Zn) as well as secondary contributors such as nitrate and sulfate. However, EC appears to be highly variable both within and between sites under consideration. The reader may refer to Fig. S7 for an estimation of the EC mass uncertainties at the different sites. On average, the PBOA factor does not comprise a large fraction of metals and trace elements, most of them being below 1 pg µg−1. Here again, the low variability in the PBOA chemical profile encountered across a large array of sites is remarkable.
The contribution from some crustal material could agree with the coarse mode distributions of polyols (Sect. 3.3) and could be indicative of an emission process with the entrainment of spores with soil dust resuspension. To investigate the importance of mineral dust in the PBOA factor, we clustered the chemical components of PM from PBOA into seven classes: OM (= 1.8 × OC), EC, , , non-sea-salt sulfate (nss-SO4), sea-salt, and dust. The nss- is calculated from the measured minus the sea-salt fraction of ( where ) according to Seinfeld and Pandis (1997). The sea-salt fraction is calculated according to Putaud et al. (2010): sea-salt . Finally the dust fraction is estimated thanks to Putaud et al. (2004b) as dust with nss-Ca2+ meaning non-sea salt Ca2+ and is computed thanks to nss-. We note that the conversion coefficient provided by Putaud et al. (2004b) may be influenced by an extreme value and then gives only a low estimate of dust resuspension.
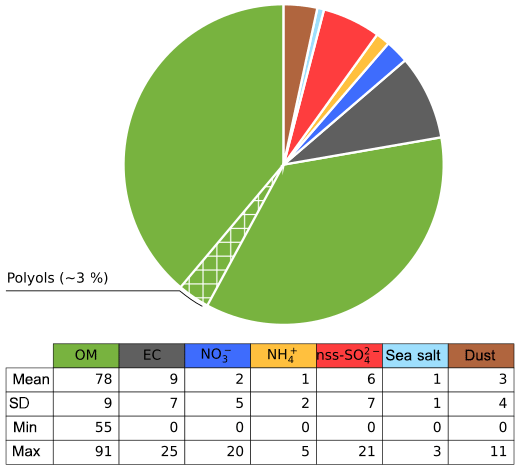
Figure 11Average contribution (%) of species in the PBOA factor for the sites in SOURCES and DECOMBIO. The hatched area represents the proportion of the OM apportioned by the polyols (see text for reconstruction method).
Figure 11 presents the normalized average contributions of these seven classes to the PBOA mass for the 16 sites with PMF modeling. It clearly reveals that the PBOA factor is dominated by contributions from OM (78±9 %), followed by EC (9±7 %), and only a minor contribution from the dust class (3±4 %).
The large value for the contribution of EC is driven by two high values obtained at the sites of Strasbourg (that reaches 25 %) and Chamonix (18 %) both influenced by direct and indirect traffic emissions. However, six other sites present no EC in PBOA. Moreover, the uncertainties of EC in the PBOA profile of Strasbourg and Chamonix is rather high (between 5 % and 30 % of PM mass at Strasbourg, see Fig. S7). On a yearly average, EC apportioned by this factor (0 to 400 ng m−3 depending on the site) is close to the rural EC background in France of about 300 ng m−3 (Golly et al., 2018).
This result on the general chemical profile of the PBOA factor, with a low crustal fraction, tends to invalidate the hypothesis of an emission process associating PBOA material with mineral dust resuspension. Indeed, our findings rather suggest that a main part of PBOA (and polyols) is most likely associated with direct biological particle emissions. It leaves only a minor fraction that could be linked to the mechanical resuspension of PBOA with crustal elements. Some minor fraction of EC in this factor could come from resuspended EC-containing dust particles being accumulated in topsoil as demonstrated in previous works (Forbes et al., 2006; Hammes et al., 2007; Zhan et al., 2016). Hence, the origin of the larger fraction of the contribution of EC remains unknown. Our conclusions are in good agreement with those made by Jia and Fraser (2011), based on the concentrations of these chemicals in different types of samples, i.e., size-fractionated (equivalent to PM2.5 and PM10) soil, plant, fungi, and atmospheric PM2.5 and PM10. They found that the ambient concentrations of primary saccharide compounds at the suburban site of Higley (USA) are typically dominated by contributions of biological materials rather than resuspension of soil dust particles and associated microbiota.
The contribution of primary biogenic organic aerosols to PM is barely documented in the scientific literature. The present study aimed at providing a broad overview of the spatial and temporal evolution of concentrations and contributions to aerosol organic matter (OM) of dominant primary sugar alcohols and saccharide compounds for a broad selection of environmental conditions in France. With 28 sites and more than 5340 samples, it is, to our knowledge, the most comprehensive dataset for these compounds. The main results obtained indicate the following:
-
Among the identified polyols, arabitol together with mannitol are the major species by mass, with lesser amounts of other polyols (e.g., erythritol, inositol, glycerol, sorbitol, and xylitol). Glucose is the dominant primary monosaccharide and its relative abundance is comparable to the sum of arabitol and mannitol.
-
The two main polyols (arabitol and mannitol) together with glucose are mainly present within the coarse aerosol mode.
-
At nearly all sites, ambient levels of the main polyols and glucose displayed clear seasonal variation cycles, with a gradual increase from spring and maximum in summer and autumn aerosols, followed by a sudden decrease in late autumn, and a winter minimum.
-
Atmospheric concentrations of the main polyols and glucose fluctuate according to site and season, and account each for between 0.1 % and 2.1 % of OM on a seasonal average basis at these French sites.
-
Ambient mass concentrations of arabitol and mannitol are comparable. Meanwhile, they display very good temporal covariation, with ratios varying between sites. Conversely, linear correlations between the main polyols and glucose concentrations are much lower, suggesting different atmospheric sources or atmospheric processes.
-
Arabitol and mannitol are efficient organic markers for PBOA. PMF studies of the yearly series from 16 sites give contributions of the primary biogenic emission (traced with the main polyols) to the total OM around 13±6 % on a yearly average and 26±12 % during summer, thereby showing that PBOA is an important source of total OM in PM10 for all sites across France. Furthermore, the average PBOA chemical source profile is made up of a very large fraction of OM (78±9 % of the total PBOA mass on average), suggesting it is mainly related to direct biogenic emissions from biological particles. Note that the presence of BSOA within the PBOA factor, particularly during summer, could not be fully ruled out and further research using additional organic tracers (such as 3-methylbutanecarboxylic acid, pinic acid, and/or cellulose) are still needed to solve this issue. Additionally, the low crustal fraction indicates that this factor is weakly linked to soil dust resuspension associated with biological material.
-
However, the PBOA source remains chemically poorly characterized as the main polyols represent only a small fraction of its total OM mass (3.0±1.5 % on average).
-
Despite comparable high concentrations in the atmosphere, the sources and processes leading to glucose concentrations and seasonal evolutions are still elusive. Indeed, the different PMF performed with glucose as input variable do not lead to a statistically stable solution.
Further investigations of the emission pathways and chemical characterization of the PBOA source associated with polyols are ongoing, which may improve our understanding of the dynamics at various geographical scales for a potential implementation in emission models in the future.
All relevant data for this paper are archived at the IGE (Institut des Géosciences de l'Environnement), and are available upon request from the corresponding author (Jean-Luc Jaffrezo).
The supplement related to this article is available online at: https://doi.org/10.5194/acp-19-3357-2019-supplement.
JLJ was the supervisor for the PhDs of AS, FC, and SW, and for the postdoc of DS. He directed all personnel who performed the analysis at IGE. He was coordinator or principal investigator (PI) of the programs that generated the data for 18 of the 28 sites in this study (OPE-ANDRA, Part'Aera, CAMERA, SRN 2013, 3 Villes PACA, DECOMBIO, QAMECS) and co-PI for programs for five other sites. He is the coordinator for the CNRS LEFE-EC2CO CAREMBIOS program that is funding the work of AS. GU was the co-supervisor for the PhD of AS and SW. OF is the coordinator of the CARA program, (co-)funding and supervising the filter sampling and chemical analyses at 12 of the 28 sites. EP, OF, and VR supervised the PhD of DMO who investigated the five sites in northern France. Finally, JLB was the coordinator (program Lanslebourg) or partner of several programs whose data were used in this study (OPE-ANDRA, Part'Aera, 3 Villes PACA, DECOMBIO), and OF was the coordinator of the SOURCES program, which includes the work of DS as a postdoctoral fellow under the supervision of JLJ to gather and prepare most of the datasets used in the present study.
All authors from the ANDRA (author affiliation no. 6) and AASQA (author affiliation nos. 7 to 14) are representatives for each network that conducted the sample collection and the general supervision of the sampling sites.
FC and DS ran the PMF analysis. AS, SW, and JLJ processed the data and wrote the manuscript. All authors reviewed and commented on the manuscript.
The authors declare that they have no conflict of interest.
The PhD of Abdoulaye Samaké and Samuël Weber are funded by the Government
of Mali and ENS Paris, respectively. We gratefully acknowledge the LEFE-CHAT
and EC2CO programs of the CNRS for financial supports of the CAREMBIOS
multidisciplinary project. Samples were collected and analyzed in the frame
of many different programs funded by ADEME, Primequal, the French Ministry of
Environment, the program CARA led by the French Reference Laboratory for Air
Quality Monitoring (LCSQA), and actions funded by many AASQA, ANDRA, IMT
Lille Douai (especially Labex CaPPA ANR-11-LABX-0005-01 and CPER CLIMIBIO)
projects. Analytical aspects were supported at IGE by the Air-O-Sol platform
within Labex OSUG@2020 (ANR10 LABX56). We acknowledge the work of many
engineers in the lab at IGE for the analyses (Aude Wack, Céline Charlet,
Fany Donaz, Fany Masson, Sylvie Ngo, Vincent Lucaire, and Anthony Vella), as
well as Bruno Malet and Laurent Y Alleman. (IMT Lille Douai) for analyzing
trace and major elements in aerosols from the northern sites. Finally, the
authors would like to kindly thank the dedicated efforts of many other people
at the sampling sites and in the laboratories for collecting and analyzing
the samples. The authors would like to thank the editor and several anonymous
referees for comments that greatly improved the manuscript.
Edited by: Willy Maenhaut
Reviewed by: four
anonymous referees
Aiken, A. C., DeCarlo, P. F., Kroll, J. H., Worsnop, D. R., Huffman, J. A., Docherty, K. S., Ulbrich, I. M., Mohr, C., Kimmel, J. R., Sueper, D., Sun, Y., Zhang, Q., Trimborn, A., Northway, M., Ziemann, P. J., Canagaratna, M. R., Onasch, T. B., Alfarra, M. R., Prevot, A. S. H., Dommen, J., Duplissy, J., Metzger, A., Baltensperger, U., and Jimenez, J. L.: O∕C and OM∕OC ratios of primary, secondary, and ambient organic aerosols with high-resolution time-of-flight aerosol mass spectrometry, Environ. Sci. Technol., 42, 4478–4485, 2008.
Alfarra, M. R., Prevot, A. S. H., Szidat, S., Sandradewi, J., Weimer, S., Lanz, V. A., Schreiber, D., Mohr, M., and Baltensperger, U.: Identification of the mass spectral signature of organic aerosols from wood burning emissions, Environ. Sci. Technol., 41, 5770–5777, 2007.
Alves, C., Pio, C., Carvalho, A., and Santos, C.: Atmospheric carbonaceous aerosols over grasslands of central Europe and a Boreal forest, Chemosphere, 63, 153–164, 2006.
Aymoz, G., Jaffrezo, J. L., Chapuis, D., Cozic, J., and Maenhaut, W.: Seasonal variation of PM10 main constituents in two valleys of the French Alps. I: EC/OC fractions, Atmos. Chem. Phys., 7, 661–675, https://doi.org/10.5194/acp-7-661-2007, 2007.
Bauer, H., Claeys, M., Vermeylen, R., Schueller, E., Weinke, G., Berger, A., and Puxbaum, H.: Arabitol and mannitol as tracers for the quantification of airborne fungal spores, Atmos. Environ., 42, 588–593, 2008a.
Bauer, H., Schueller, E., Weinke, G., Berger, A., Hitzenberger, R., Marr, I. L., and Puxbaum, H.: Significant contributions of fungal spores to the organic carbon and to the aerosol mass balance of the urban atmospheric aerosol, Atmos. Environ., 42, 5542–5549, 2008b.
Belis, C. A., Favez, O., Harrison, R. M., Larsen, B. R., Amato, F., El Haddad, I., Hopke, P. K., Nava, S., Paatero, P., Prévôt, A., Quass, U., Vecchi, R., and Viana, M.: European Commission, Joint Research Centre, and Institute for Environment and Sustainability: European guide on air pollution source apportionment with receptor models, Publications office, Luxembourg, available from: http://dx.publications.europa.eu/10.2788/9307 (last access: 13 March 2019), 2014.
Birch, M. E. and Cary, R. A.: Elemental carbon-based method for monitoring occupational exposures to particulate diesel exhaust, Aerosol Sci. Technol., 25, 221–241, 1996.
Boex-Fontvieille, E., Davanture, M., Jossier, M., Zivy, M., Hodges, M., and Tcherkez, G.: Photosynthetic activity influences cellulose biosynthesis and phosphorylation of proteins involved therein in Arabidopsis leaves, J. Exp. Bot., 65, 4997–5010, 2014.
Bonvalot, L., Tuna, T., Fagault, Y., Jaffrezo, J.-L., Jacob, V., Chevrier, F., and Bard, E.: Estimating contributions from biomass burning, fossil fuel combustion, and biogenic carbon to carbonaceous aerosols in the Valley of Chamonix: a dual approach based on radiocarbon and levoglucosan, Atmos. Chem. Phys., 16, 13753–13772, https://doi.org/10.5194/acp-16-13753-2016, 2016.
Boucher, O., Randall, D., Artaxo, P., Bretherton, C., Feingold, G., Forster, P., Kerminen, V.-M., Kondo, Y., Liao, H., and Lohmann, U.: Clouds and aerosols, in Climate change 2013: the physical science basis. Contribution of Working Group I to the Fifth Assessment Report of the Intergovernmental Panel on Climate Change, Cambridge University Press, 571–657, 2013.
Burshtein, N., Lang-Yona, N., and Rudich, Y.: Ergosterol, arabitol and mannitol as tracers for biogenic aerosols in the eastern Mediterranean, Atmos. Chem. Phys., 11, 829–839, https://doi.org/10.5194/acp-11-829-2011, 2011.
Calas, A., Uzu, G., Kelly, F. J., Houdier, S., Martins, J. M. F., Thomas, F., Molton, F., Charron, A., Dunster, C., Oliete, A., Jacob, V., Besombes, J.-L., Chevrier, F., and Jaffrezo, J.-L.: Comparison between five acellular oxidative potential measurement assays performed with detailed chemistry on PM10 samples from the city of Chamonix (France), Atmos. Chem. Phys., 18, 7863–7875, https://doi.org/10.5194/acp-18-7863-2018, 2018.
Carvalho, A., Pio, C., and Santos, C.: Water-soluble hydroxylated organic compounds in German and Finnish aerosols, Atmos. Environ., 37, 1775–1783, 2003.
Cavalli, F., Viana, M., Yttri, K. E., Genberg, J., and Putaud, J.-P.: Toward a standardised thermal-optical protocol for measuring atmospheric organic and elemental carbon: the EUSAAR protocol, Atmos. Meas. Tech., 3, 79–89, https://doi.org/10.5194/amt-3-79-2010, 2010.
Chevrier, F.: Chauffage au bois et qualité de l'air en Vallée de l'Arve?: définition d'un système de surveillance et impact d'une politique de rénovation du parc des appareils anciens, PhD thesis, Université Grenoble Alpes, 23 November, available from: https://tel.archives-ouvertes.fr/tel-01527559/document (last access: 13 March 2019), 2017.
China, S., Wang, B., Weis, J., Rizzo, L., Brito, J., Cirino, G. G., Kovarik, L., Artaxo, P., Gilles, M. K., and Laskin, A.: Rupturing of biological spores as a source of secondary particles in amazonia, Environ. Sci. Technol., 50, 12179–12186, 2016.
Cho, A. K., Sioutas, C., Miguel, A. H., Kumagai, Y., Schmitz, D. A., Singh, M., Eiguren-Fernandez, A., and Froines, J. R.: Redox activity of airborne particulate matter at different sites in the Los Angeles Basin, Environ. Res., 99, 40–47, 2005.
Després, V. R., Alex Huffman, J., Burrows, S. M., Hoose, C., Safatov, A. S., Buryak, G., Fröhlich-Nowoisky, J., Elbert, W., Andreae, M. O., Pöschl, U., and Jaenicke, R.: Primary biological aerosol particles in the atmosphere: a review, Tellus B, 64, 15598, https://doi.org/10.3402/tellusb.v64i0.15598, 2012.
Di Filippo, P., Pomata, D., Riccardi, C., Buiarelli, F., and Perrino, C.: Fungal contribution to size-segregated aerosol measured through biomarkers, Atmos. Environ., 64, 132–140, 2013.
Elbert, W., Taylor, P. E., Andreae, M. O., and Pöschl, U.: Contribution of fungi to primary biogenic aerosols in the atmosphere: wet and dry discharged spores, carbohydrates, and inorganic ions, Atmos. Chem. Phys., 7, 4569–4588, https://doi.org/10.5194/acp-7-4569-2007, 2007.
Favez, O., El Haddad, I., Piot, C., Boréave, A., Abidi, E., Marchand, N., Jaffrezo, J.-L., Besombes, J.-L., Personnaz, M.-B., Sciare, J., Wortham, H., George, C., and D'Anna, B.: Inter-comparison of source apportionment models for the estimation of wood burning aerosols during wintertime in an Alpine city (Grenoble, France), Atmos. Chem. Phys., 10, 5295–5314, https://doi.org/10.5194/acp-10-5295-2010, 2010.
Favez, O., Salameh, D., and Jaffrezo, J.-L.: Traitement harmonisé de jeux de données multi-sites pour l'étude de sources de PM par Positive Matrix Factorization (PMF) – LCSQA, available from: https://www.lcsqa.org/system/files/rapport/lcsqa2016-traitement_harmonise_etude_sources_pmf.pdf (last access: 13 March 2019), 2016.
Forbes, M. S., Raison, R. J., and Skjemstad, J. O.: Formation, transformation and transport of black carbon (charcoal) in terrestrial and aquatic ecosystems, Sci. Total Environ., 370, 190–206, https://doi.org/10.1016/j.scitotenv.2006.06.007, 2006.
Fortenberry, C. F., Walker, M. J., Zhang, Y., Mitroo, D., Brune, W. H., and Williams, B. J.: Bulk and molecular-level characterization of laboratory-aged biomass burning organic aerosol from oak leaf and heartwood fuels, Atmos. Chem. Phys., 18, 2199–2224, https://doi.org/10.5194/acp-18-2199-2018, 2018.
Franke, V., Zieger, P., Wideqvist, U., Acosta Navarro, J. C., Leck, C., Tunved, P., Rosati, B., Gysel, M., Salter, M. E., and Ström, J.: Chemical composition and source analysis of carbonaceous aerosol particles at a mountaintop site in central Sweden, Tellus B, 69, 1353387, https://doi.org/10.1080/16000889.2017.1353387, 2017.
Fraser, M. P.: Final Report, Using carbohydrates as molecular markers to determine the contribution of agricultural soil to ambient fine and course PM, Research Project Database, Grantee Research Project, ORD, USEPA, 2010.
Fröhlich-Nowoisky, J., Kampf, C. J., Weber, B., Huffman, J. A., Pöhlker, C., Andreae, M. O., Lang-Yona, N., Burrows, S. M., Gunthe, S. S., Elbert, W., Su, H., Hoor, P., Thines, E., Hoffmann, T., Després, V. R., and Pöschl, U.: Bioaerosols in the Earth system: Climate, health, and ecosystem interactions, Atmos. Res., 182, 346–376, 2016.
Fu, P., Kawamura, K., Kobayashi, M., and Simoneit, B. R. T.: Seasonal variations of sugars in atmospheric particulate matter from Gosan, Jeju Island: Significant contributions of airborne pollen and Asian dust in spring, Atmos. Environ., 55, 234–239, 2012.
Fu, P. Q., Kawamura, K., Chen, J., Charrière, B., and Sempéré, R.: Organic molecular composition of marine aerosols over the Arctic Ocean in summer: contributions of primary emission and secondary aerosol formation, Biogeosciences, 10, 653–667, https://doi.org/10.5194/bg-10-653-2013, 2013.
Fuzzi, S., Andreae, M. O., Huebert, B. J., Kulmala, M., Bond, T. C., Boy, M., Doherty, S. J., Guenther, A., Kanakidou, M., Kawamura, K., Kerminen, V.-M., Lohmann, U., Russell, L. M., and Pöschl, U.: Critical assessment of the current state of scientific knowledge, terminology, and research needs concerning the role of organic aerosols in the atmosphere, climate, and global change, Atmos. Chem. Phys., 6, 2017–2038, https://doi.org/10.5194/acp-6-2017-2006, 2006.
Fuzzi, S., Decesari, S., Facchini, M. C., Cavalli, F., Emblico, L., Mircea, M., Andreae, M. O., Trebs, I., Hoffer, A., Guyon, P., Artaxo, P., Rizzo, L. V., Lara, L. L., Pauliquevis, T., Maenhaut, W., Raes, N., Chi, X., Mayol-Bracero, O. L., Soto-García, L. L., Claeys, M., Kourtchev, I., Rissler, J., Swietlicki, E., Tagliavini, E., Schkolnik, G., Falkovich, A. H., Rudich, Y., Fisch, G., and Gatti, L. V.: Overview of the inorganic and organic composition of size-segregated aerosol in Rondônia, Brazil, from the biomass-burning period to the onset of the wet season, J. Geophys. Res., 112, D01201, https://doi.org/10.1029/2005JD006741, 2007.
Golly, B., Waked, A., Weber, S., Samake, A., Jacob, V., Conil, S., Rangonio, J., Chrétien, E., Vagnot, M., Robic, P., Besombes, J.-L., and Jaffrezo, J. L.: Organic markers and OC source apportionment for seasonal variations of PM2.5 at 5 rural sites in France, Atmos. Environ., 198, 142–157, 2018.
Gosselin, M. I., Rathnayake, C. M., Crawford, I., Pöhlker, C., Fröhlich-Nowoisky, J., Schmer, B., Després, V. R., Engling, G., Gallagher, M., Stone, E., Pöschl, U., and Huffman, J. A.: Fluorescent bioaerosol particle, molecular tracer, and fungal spore concentrations during dry and rainy periods in a semi-arid forest, Atmos. Chem. Phys., 16, 15165–15184, https://doi.org/10.5194/acp-16-15165-2016, 2016.
Graham, B., Guyon, P., Taylor, P. E., Artaxo, P., Maenhaut, W., Glovsky, M. M., Flagan, R. C., and Andreae, M. O.: Organic compounds present in the natural Amazonian aerosol: Characterization by gas chromatography-mass spectrometry: Organic compounds in Amazonian aerosols, J. Geophys. Res.-Atmos., 108, 4766, https://doi.org/10.1029/2003JD003990, 2003.
Hammes, K., Schmidt, M. W. I., Smernik, R. J., Currie, L. A., Ball, W. P., Nguyen, T. H., Louchouarn, P., Houel, S., Gustafsson, Ö., Elmquist, M., Cornelissen, G., Skjemstad, J. O., Masiello, C. A., Song, J., Peng, P., Mitra, S., Dunn, J. C., Hatcher, P. G., Hockaday, W. C., Smith, D. M., Hartkopf-Fröder, C., Böhmer, A., Lüer, B., Huebert, B. J., Amelung, W., Brodowski, S., Huang, L., Zhang, W., Gschwend, P. M., Flores-Cervantes, D. X., Largeau, C., Rouzaud, J.-N., Rumpel, C., Guggenberger, G., Kaiser, K., Rodionov, A., Gonzalez-Vila, F. J., Gonzalez-Perez, J. A., de la Rosa, J. M., Manning, D. A. C., López-Capél, E., and Ding, L.: Comparison of quantification methods to measure fire-derived (black/elemental) carbon in soils and sediments using reference materials from soil, water, sediment and the atmosphere, Global Biogeochem. Cy., 21, GB3016, https://doi.org/10.1029/2006GB002914, 2007.
Heald, C. L. and Spracklen, D. V.: Atmospheric budget of primary biological aerosol particles from fungal spores, Geophys. Res. Lett., 36, L09806, https://doi.org/10.1029/2009GL037493, 2009.
Huffman, J. A., Sinha, B., Garland, R. M., Snee-Pollmann, A., Gunthe, S. S., Artaxo, P., Martin, S. T., Andreae, M. O., and Pöschl, U.: Size distributions and temporal variations of biological aerosol particles in the Amazon rainforest characterized by microscopy and real-time UV-APS fluorescence techniques during AMAZE-08, Atmos. Chem. Phys., 12, 11997–12019, https://doi.org/10.5194/acp-12-11997-2012, 2012.
Jaenicke, R.: Abundance of cellular material and proteins in the atmosphere, Science, 308, 73–73, https://doi.org/10.1126/science.1106335, 2005.
Jennings, D. B., Ehrenshaft, M., Pharr, D. M., and Williamson, J. D.: Roles for mannitol and mannitol dehydrogenase in active oxygen-mediated plant defense, P. Natl. Acad. Sci. USA, 95, 51129–51133, 1998.
Jia, Y. and Fraser, M.: Characterization of Saccharides in Size-fractionated Ambient Particulate Matter and Aerosol Sources: The contribution of primary biological aerosol particles (PBAPs) and soil to ambient particulate matter, Environ. Sci. Technol., 45, 930–936, 2011.
Jia, Y., Bhat, S., and Fraser, M. P.: Characterization of saccharides and other organic compounds in fine particles and the use of saccharides to track primary biologically derived carbon sources, Atmos. Environ., 44, 724–732, 2010a.
Jia, Y., Clements, A. L., and Fraser, M. P.: Saccharide composition in atmospheric particulate matter in the southwest US and estimates of source contributions, J. Aerosol Sci., 41, 62–73, 2010b.
Jones, A. M. and Harrison, R. M.: The effects of meteorological factors on atmospheric bioaerosol concentrations – a review, Sci. Total Environ., 326, 151–180, 2004.
Kang, M., Fu, P., Kawamura, K., Yang, F., Zhang, H., Zang, Z., Ren, H., Ren, L., Zhao, Y., Sun, Y., and Wang, Z.: Characterization of biogenic primary and secondary organic aerosols in the marine atmosphere over the East China Sea, Atmos. Chem. Phys., 18, 13947–13967, https://doi.org/10.5194/acp-18-13947-2018, 2018.
Li, Y.-C., Shu, M., Ho, S. S. H., Yu, J.-Z., Yuan, Z.-B., Wang, X.-X., Zhao, X.-Q., and Liu, Z.-F.: Effects of chemical composition of PM2.5 on visibility in a semi-rural city of Sichuan basin, Aerosol Air Qual. Res., 18, 957–968, 2018.
Liang, L., Engling, G., Du, Z., Cheng, Y., Duan, F., Liu, X., and He, K.: Seasonal variations and source estimation of saccharides in atmospheric particulate matter in Beijing, China, Chemosphere, 150, 365–377, 2016.
Liang, L., Engling, G., Du, Z., Duan, F., Cheng, Y., Liu, X., and He, K.: Contribution of fungal spores to organic carbon in ambient aerosols in Beijing, China, Atmos. Pollut. Res., 8, 351–358, 2017.
Manninen, H. E., Bäck, J., Sihto-Nissilä, S.-L., Huffman, J. A., Pessi, A.-M., Hiltunen, V., Aalto, P. P., Hidalgo Fernández, P. J., Hari, P., Saarto, A., Kulmala, M., and Petäjä, T.: Patterns in airborne pollen and other primary biological aerosol particles (PBAP), and their contribution to aerosol mass and number in a boreal forest, Boreal Environ. Res., 19, 383–405, 2014.
Medeiros, P. M., Conte, M. H., Weber, J. C., and Simoneit, B. R. T.: Sugars as source indicators of biogenic organic carbon in aerosols collected above the Howland Experimental Forest, Maine, Atmos. Environ., 40, 1694–1705, 2006.
Morris, C. E., Sands, D. C., Bardin, M., Jaenicke, R., Vogel, B., Leyronas, C., Ariya, P. A., and Psenner, R.: Microbiology and atmospheric processes: research challenges concerning the impact of airborne micro-organisms on the atmosphere and climate, Biogeosciences, 8, 17–25, https://doi.org/10.5194/bg-8-17-2011, 2011.
Nozière, B., Kalberer, M., Claeys, M., Allan, J., D'Anna, B., Decesari, S., Finessi, E., Glasius, M., Grgić, I., Hamilton, J. F., Hoffmann, T., Iinuma, Y., Jaoui, M., Kahnt, A., Kampf, C. J., Kourtchev, I., Maenhaut, W., Marsden, N., Saarikoski, S., Schnelle-Kreis, J., Surratt, J. D., Szidat, S., Szmigielski, R., and Wisthaler, A.: The molecular identification of organic compounds in the atmosphere: state of the art and challenges, Chem. Rev., 115, 3919–3983, https://doi.org/10.1021/cr5003485, 2015.
Ntziachristos, L., Froines, J. R., Cho, A. K., and Sioutas, C.: Relationship between redox activity and chemical speciation of size-fractionated particulate matter, Part. Fibre Toxicol., 4, 5, https://doi.org/10.1186/1743-8977-4-5, 2007.
Paatero, P., Eberly, S., Brown, S. G., and Norris, G. A.: Methods for estimating uncertainty in factor analytic solutions, Atmos. Meas. Tech., 7, 781–797, https://doi.org/10.5194/amt-7-781-2014, 2014.
Pashynska, V., Vermeylen, R., Vas, G., Maenhaut, W., and Claeys, M.: Development of a gas chromatographic/ion trap mass spectrometric method for the determination of levoglucosan and saccharidic compounds in atmospheric aerosols, Application to urban aerosols, J. Mass Spectrom., 37, 1249–1257, https://doi.org/10.1002/jms.391, 2002.
Petit, J.-E., Favez, O., Sciare, J., Crenn, V., Sarda-Estève, R., Bonnaire, N., Močnik, G., Dupont, J.-C., Haeffelin, M., and Leoz-Garziandia, E.: Two years of near real-time chemical composition of submicron aerosols in the region of Paris using an Aerosol Chemical Speciation Monitor (ACSM) and a multi-wavelength Aethalometer, Atmos. Chem. Phys., 15, 2985–3005, https://doi.org/10.5194/acp-15-2985-2015, 2015.
Pietrogrande, M. C., Bacco, D., Visentin, M., Ferrari, S., and Casali, P.: Polar organic marker compounds in atmospheric aerosol in the Po Valley during the Supersito campaigns – Part 2: Seasonal variations of sugars, Atmos. Environ., 97, 215–225, 2014.
Pio, C. A., Legrand, M., Alves, C. A., Oliveira, T., Afonso, J., Caseiro, A., Puxbaum, H., Sanchez-Ochoa, A., and Gelencsér, A.: Chemical composition of atmospheric aerosols during the 2003 summer intense forest fire period, Atmos. Environ., 42, 7530–7543, https://doi.org/10.1016/j.atmosenv.2008.05.032, 2008.
Putaud, J.-P., Raes, F., Van Dingenen, R., Brüggemann, E., Facchini, M.-C., Decesari, S., Fuzzi, S., Gehrig, R., Hüglin, C., Laj, P., Lorbeer, G., Maenhaut, W., Mihalopoulos, N., Müller, K., Querol, X., Rodriguez, S., Schneider, J., Spindler, G., Brink, H. T., Tørseth, K., and Wiedensohler, A.: A European aerosol phenomenology 2: chemical characteristics of particulate matter at kerbside, urban, rural and background sites in Europe, Atmos. Environ., 38, 2579–2595, 2004a.
Putaud, J.-P., Dingenen, R. V., Dell'Acqua, A., Raes, F., Matta, E., Decesari, S., Facchini, M. C., and Fuzzi, S.: Size-segregated aerosol mass closure and chemical composition in Monte Cimone (I) during MINATROC, Atmos. Chem. Phys., 4, 889–902, https://doi.org/10.5194/acp-4-889-2004, 2004b.
Putaud, J.-P., Van Dingenen, R., Alastuey, A., Bauer, H., Birmili, W., Cyrys, J., Flentje, H., Fuzzi, S., Gehrig, R., Hansson, H. C., Harrison, R. M., Herrmann, H., Hitzenberger, R., Hüglin, C., Jones, A. M., Kasper-Giebl, A., Kiss, G., Kousa, A., Kuhlbusch, T. A. J., Löschau, G., Maenhaut, W., Molnar, A., Moreno, T., Pekkanen, J., Perrino, C., Pitz, M., Puxbaum, H., Querol, X., Rodriguez, S., Salma, I., Schwarz, J., Smolik, J., Schneider, J., Spindler, G., ten Brink, H., Tursic, J., Viana, M., Wiedensohler, A., and Raes, F.: A European aerosol phenomenology – 3: Physical and chemical characteristics of particulate matter from 60 rural, urban, and kerbside sites across Europe, Atmos. Environ., 44, 1308–1320, 2010.
Puxbaum, H. and Tenze-Kunit, M.: Size distribution and seasonal variation of atmospheric cellulose, Atmos. Environ., 37, 3693–3699, 2003.
Rathnayake, C. M., Metwali, N., Jayarathne, T., Kettler, J., Huang, Y., Thorne, P. S., O'Shaughnessy, P. T., and Stone, E. A.: Influence of rain on the abundance of bioaerosols in fine and coarse particles, Atmos. Chem. Phys., 17, 2459–2475, https://doi.org/10.5194/acp-17-2459-2017, 2017.
Ruijter, G. J. G., Bax, M., Patel, H., Flitter, S. J., Vondervoort, P. J. I. van de, Vries, R. P. de, van Kuyk, P. A., and Visser, J.: Mannitol is required for stress tolerance in aspergillus niger aonidiospores, Eukaryot. Cell, 2, 690–698, https://doi.org/10.1128/EC.2.4.690-698.2003, 2003.
Ruthenburg, T. C., Perlin, P. C., Liu, V., McDade, C. E., and Dillner, A. M.: Determination of organic matter and organic matter to organic carbon ratios by infrared spectroscopy with application to selected sites in the IMPROVE network, Atmos. Environ., 86, 47–57, 2014.
Sandradewi, J., Prévôt, A. S. H., Szidat, S., Perron, N., Alfarra, M. R., Lanz, V. A., Weingartner, E., and Baltensperger, U.: Using aerosol light absorption measurements for the quantitative determination of wood burning and traffic emission contributions to particulate matter, Environ. Sci. Technol., 42, 3316–3323, 2008.
Seinfeld, J. H. and Pandis, S. N.: Atmospheric Chemistry and Physics: From Air Pollution to Climate Change, 1st edn., Wiley-Interscience, New York, 1997.
Simoneit, B. R. T., Kobayashi, M., Mochida, M., Kawamura, K., Lee, M., Lim, H. J., Turpin, B. J., and Komazaki, Y.: Composition and major sources of organic compounds of aerosol particulate matter sampled during the ACE-Asia campaign, J. Geophys. Res., 109, D19S10, https://doi.org/10.1029/2004JD004598, 2004a.
Simoneit, B. R. T., Elias, V. O., Kobayashi, M., Kawamura, K., Rushdi, A. I., Medeiros, P. M., Rogge, W. F., and Didyk, B. M.: Sugars dominant water-soluble organic compounds in soils and characterization as tracers in atmospheric particulate matter, Environ. Sci. Technol., 38, 5939–5949, 2004b.
Srithawirat, T. and Brimblecombe, P.: Seasonal variation of saccharides and furfural in atmospheric aerosols at a semi-urban site, Aerosol Air Qual. Res., 15, 2277–2290, 2015.
Srivastava, D., Tomaz, S., Favez, O., Lanzafame, G. M., Golly, B., Besombes, J.-L., Alleman, L. Y., Jaffrezo, J.-L., Jacob, V., Perraudin, E., Villenave, E., and Albinet, A.: Speciation of organic fraction does matter for source apportionment. Part 1: A one-year campaign in Grenoble (France), Sci. Total Environ., 624, 1598–1611, 2018.
Theodosi, C., Panagiotopoulos, C., Nouara, A., Zarmpas, P., Nicolaou, P., Violaki, K., Kanakidou, M., Sempéré, R., and Mihalopoulos, N.: Sugars in atmospheric aerosols over the Eastern Mediterranean, Prog. Oceanogr., 163, 70–81, 2018.
US EPA, O.: Positive Matrix Factorization Model for environmental data analyses, US EPA, available from: https://www.epa.gov/air-research/positive-matrix-factorization-model-environmental-data-analyses (last access: 7 September 2017), 2015.
Vélëz, H., Glassbrook, N. J., and Daub, M. E.: Mannitol metabolism in the phytopathogenic fungus Alternaria alternata, Fungal Genet. Biol., 44, 258–268, 2007.
Verma, S. K., Kawamura, K., Chen, J., and Fu, P.: Thirteen years of observations on primary sugars and sugar alcohols over remote Chichijima Island in the western North Pacific, Atmos. Chem. Phys., 18, 81–101, https://doi.org/10.5194/acp-18-81-2018, 2018.
Vlachou, A., Daellenbach, K. R., Bozzetti, C., Chazeau, B., Salazar, G. A., Szidat, S., Jaffrezo, J.-L., Hueglin, C., Baltensperger, U., Haddad, I. E., and Prévôt, A. S. H.: Advanced source apportionment of carbonaceous aerosols by coupling offline AMS and radiocarbon size-segregated measurements over a nearly 2-year period, Atmos. Chem. Phys., 18, 6187–6206, https://doi.org/10.5194/acp-18-6187-2018, 2018.
Waked, A., Favez, O., Alleman, L. Y., Piot, C., Petit, J.-E., Delaunay, T., Verlinden, E., Golly, B., Besombes, J.-L., Jaffrezo, J.-L., and Leoz-Garziandia, E.: Source apportionment of PM10 in a north-western Europe regional urban background site (Lens, France) using positive matrix factorization and including primary biogenic emissions, Atmos. Chem. Phys., 14, 3325–3346, https://doi.org/10.5194/acp-14-3325-2014, 2014.
Yang, Y., Chan, C., Tao, J., Lin, M., Engling, G., Zhang, Z., Zhang, T., and Su, L.: Observation of elevated fungal tracers due to biomass burning in the Sichuan Basin at Chengdu City, China, Sci. Total Environ., 431, 68–77, 2012.
Yttri, K. E., Aas, W., Bjerke, A., Cape, J. N., Cavalli, F., Ceburnis, D., Dye, C., Emblico, L., Facchini, M. C., Forster, C., Hanssen, J. E., Hansson, H. C., Jennings, S. G., Maenhaut, W., Putaud, J. P., and Tørseth, K.: Elemental and organic carbon in PM10: a one year measurement campaign within the European Monitoring and Evaluation Programme EMEP, Atmos. Chem. Phys., 7, 5711–5725, https://doi.org/10.5194/acp-7-5711-2007, 2007a.
Yttri, K. E., Dye, C., and Kiss, G.: Ambient aerosol concentrations of sugars and sugar-alcohols at four different sites in Norway, Atmos. Chem. Phys., 7, 4267–4279, https://doi.org/10.5194/acp-7-4267-2007, 2007b.
Yttri, K. E., Simpson, D., Stenström, K., Puxbaum, H., and Svendby, T.: Source apportionment of the carbonaceous aerosol in Norway – quantitative estimates based on 14C, thermal-optical and organic tracer analysis, Atmos. Chem. Phys., 11, 9375–9394, https://doi.org/10.5194/acp-11-9375-2011, 2011.
Wang, X., Shen, Z., Liu, F., Lu, D., Tao, J., Lei, Y., Zhang, Q., Zeng, Y., Xu, H., Wu, Y., Zhang, R., and Cao, J.: Saccharides in summer and winter PM2.5 over Xi'an, Northwestern China: Sources, and yearly variations of biomass burning contribution to PM2.5, Atmos. Res., 214, 410–417, 2018.
Zhan, C., Zhang, J., Cao, J., Han, Y., Wang, P., Zheng, J., Yao, R., Liu, H., Li, H., and Xiao, W.: Characteristics and sources of black carbon in atmospheric dustfall particles from Huangshi, China, Aerosol Air Qual. Res., 16, 2096–2106, https://doi.org/10.4209/aaqr.2015.09.0562, 2016.
Zhang, T., Engling, G., Chan, C.-Y., Zhang, Y.-N., Zhang, Z.-S., Lin, M., Sang, X.-F., Li, Y. D., and Li, Y.-S.: Contribution of fungal spores to particulate matter in a tropical rainforest, Environ. Res. Lett., 5, 24010, https://doi.org/10.1088/1748-9326/5/2/024010, 2010.
Zhang, Z., Engling, G., Zhang, L., Kawamura, K., Yang, Y., Tao, J., Zhang, R., Chan, C., and Li, Y.: Significant influence of fungi on coarse carbonaceous and potassium aerosols in a tropical rainforest, Environ. Res. Lett., 10, 34015, https://doi.org/10.1088/1748-9326/10/3/034015, 2015.
Zhu, C., Kawamura, K., and Kunwar, B.: Organic tracers of primary biological aerosol particles at subtropical Okinawa Island in the western North Pacific Rim: Organic biomarkers in the North Pacific, J. Geophys. Res.-Atmos., 120, 5504–5523, 2015.
Zhu, C., Kawamura, K., Fukuda, Y., Mochida, M., and Iwamoto, Y.: Fungal spores overwhelm biogenic organic aerosols in a midlatitudinal forest, Atmos. Chem. Phys., 16, 7497–7506, https://doi.org/10.5194/acp-16-7497-2016, 2016.