the Creative Commons Attribution 4.0 License.
the Creative Commons Attribution 4.0 License.
 | 07 Mar 2019
Fine dust emissions from active sands at coastal Oceano Dunes, California
Jasper F. Kok
Raleigh L. Martin
Nitzan Swet
Itzhak Katra
Thomas E. Gill
Richard L. Reynolds
Livia S. Freire
Sand dunes and other active sands generally have a low content of fine grains and, therefore, are not considered to be major dust sources in current climate models. However, recent remote sensing studies have indicated that a surprisingly large fraction of dust storms are generated from regions covered by sand dunes, leading these studies to propose that sand dunes might be globally relevant sources of dust. To help understand dust emissions from sand dunes and other active sands, we present in situ field measurements of dust emission under natural saltation from a coastal sand sheet at Oceano Dunes in California. We find that saltation drives dust emissions from this setting that are on the low end of the range in emissions produced by non-sandy soils for similar wind speed. Laboratory analyses of sand samples suggest that these emissions are produced by aeolian abrasion of feldspars and removal of clay-mineral coatings on sand grain surfaces. We further find that this emitted dust is substantially finer than dust emitted from non-sandy soils, which could enhance its downwind impacts on human health, the hydrological cycle, and climate.
- Article
(3563 KB) - Full-text XML
-
Supplement
(2916 KB) - BibTeX
- EndNote


Dust emission by wind-blown (aeolian) processes produces important effects on the Earth system, including modulating the radiation budget (Miller et al., 2006; Kok et al., 2017), modifying cloud microphysics (DeMott et al., 2015) and the hydrological cycle (Ramanathan et al., 2001; Miller et al., 2004), and producing risks to human health (Burnett et al., 2014). Despite these critical impacts, simulations of dust emissions in current climate models have large uncertainties, particularly in predicted rates and spatial patterns of dust emissions (Engelstaedter et al., 2006; Huneeus et al., 2011; Kok et al., 2014b; Evan et al., 2015). These uncertainties arise in part from a lack of understanding (i) of the physics of the emission process and (ii) of the dust emission productivity of different soil types.
Most parameterizations of dust emissions account only for emission through soil aggregate fragmentation, which dominates for non-sandy soils (defined as containing > 10 % by mass of clay- and silt-sized soil fines; McKee, 1979), and these parameterizations do not account for dust emission through removal of clay-mineral coatings or aeolian abrasion, which might dominate emissions from sandy soils (Shao et al., 1993; Alfaro and Gomes, 2001; Ginoux et al., 2001; Zender et al., 2003; Kok et al., 2014a). For both soil types, dust emission is facilitated by aeolian saltation (the ballistic motion of sand particles) and sandblasting (saltator-driven release of dust) (Shao, 2008). Sandblasting can emit dust in four primary ways:
-
fragmentation of aggregates of clay-sized (< 2 µm in diameter) and silt-sized (2–63 µm in diameter) fine particles in the soil (Kok, 2011);
-
release of single fine particles trapped between the sand particles (also referred to as “resident fines”) (Bullard et al., 2004);
-
rupturing of clay and oxide coatings attached to the surfaces of sand grains (Bullard et al., 2004, 2007); and
-
chipping or spalling of sand grains, for instance of sharp corners, which is also known as aeolian abrasion (Kuenen, 1960; Whalley et al., 1987; Jerolmack and Brzinski, 2010; Sweeney et al., 2016).
The relative importance of the four physical processes depends largely on soil texture and composition: soil aggregate breakage is likely most important for soils with a large fraction of fine (clay- and silt-sized) grains (Shao, 2008; Kok et al., 2012; Swet and Katra, 2016), whereas removal of mineral coatings and aeolian abrasion might be more important for sandy soils (Kuenen, 1960; Bullard et al., 2004, 2007; Jerolmack et al., 2011; Crouvi et al., 2012). Many dust models use preferential source functions to identify emissions in regions with a large content of fine grains held in soil aggregates, which are implicitly used as a proxy for dust emissions through aggregate fragmentation (Ginoux et al., 2001; Tegen et al., 2002; Zender et al., 2003). As a consequence, dust models weigh emissions heavily towards non-sandy soils, and sandy soils are not treated as important dust sources in most current models (Shao et al., 1993; Ginoux et al., 2001; Tegen et al., 2002; Zender et al., 2003; Ito and Kok, 2017).
Although current models do not treat active sands (i.e., sands with active saltation transport; Swet et al., 2019) as major dust sources, recent remote sensing observations found a higher correlation between dust emission events and wind strength over dune-covered surfaces than over many other geomorphic units of the Sahara Desert, the Chihuahuan Desert, the Lake Eyre basin, and the Taklamakan Desert (Baddock et al., 2011; Bullard et al., 2011; Crouvi et al., 2012). Specifically, Crouvi et al. (2012) found that more than 40 % of Saharan dust storms originated from sand dunes and that sand dunes had a higher land erodibility (regression of number of dust storms against surface wind) than other soil types. Based on these observations, Crouvi et al. (2012) proposed aeolian abrasion on active sand dunes as an important dust emission mechanism. Although remote sensing observations are informative for regional dust emission patterns (Prospero et al., 2002; Crouvi et al., 2012), uncertainties in backtracking satellite images to locate exact dust sources, combined with the lack of information on dust concentration or composition, small-scale land–surface dynamics, and magnitude of wind stress (Bullard et al., 2011), impede the resolution of the productivity of active sands.
Considering these limitations of satellite observations, field measurements of dust emission from active sands are needed to inform whether active sands are indeed important contributors to the global dust cycle and, if so, what the physics of the emission process and the dust emission productivity of active sands are. Unfortunately, there are few measurements of dust emissions from active sands, especially under natural field conditions (Bullard et al., 2004; Sweeney et al., 2016; Swet et al., 2019). To improve our understanding of dust emission from active sands, we present the first (to our knowledge) in situ field measurements of dust emission under natural aeolian saltation from active sands at the coastal Oceano Dunes in California. Section 2 details the field campaign setup, in situ data processing methods, and laboratory techniques used to analyze sand samples. Section 3 presents results of the vertical dust mass flux, the particle size distribution of emitted dust, the size-resolved sandblasting efficiencies, and the properties of sand samples. Section 4 discusses dust emission processes at the study site and their representativeness for dust emissions from other active sands, as well as the implications of our results for downwind human health, the hydrological cycle, and climate. Conclusions follow in Sect. 5.
We conducted a field campaign from 15 May to 7 June 2015 on the southern edge of the Oceano Dunes State Vehicular Recreation Area (35.03∘ N, 120.63∘ W) where off-highway motor vehicles were prohibited (Oceano Dunes State Vehicular Recreation Area, SVRA, map: http://ohv.parks.ca.gov/?page_id=1208, last access: 27 February 2019). At the time of measurements, the site was not downwind of any vehicle activity and was completely nonvegetated and topographically mostly flat. This active coastal sand sheet is followed inland by low transverse dunes. These dunes are part of the broader late Quaternary Guadalupe-Nipomo Dunes Complex, which extends north–south along roughly 25 km of California's Central Coast and is shaped by strong onshore (westerly) sea breezes transporting sand primarily derived from fluvial deposits of the Santa Maria River estuary at the south end of the dune field (Cooper, 1967; Orme, 1992; Pye and Tsoar, 2009). Currently, active aeolian transport occurs only within 1–2 km of the beach, but inactive, vegetation-stabilized transverse dune surfaces extend up to 18 km inland.
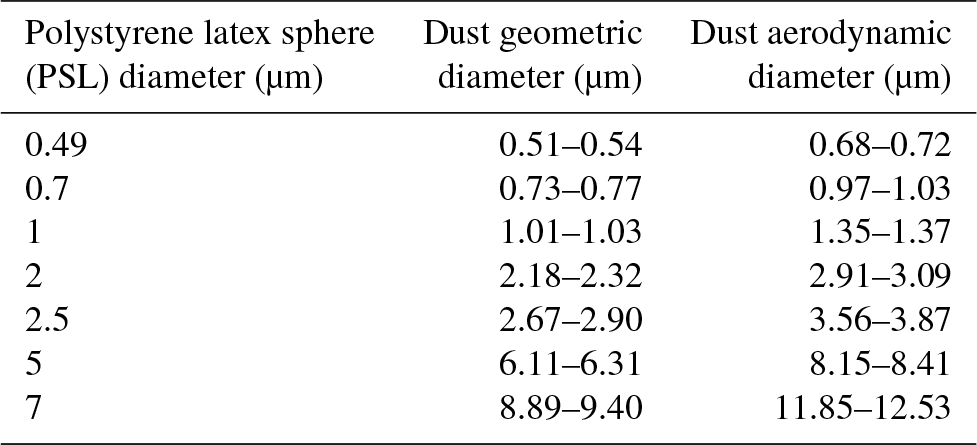
We erected a 10 m tower (Fig. 1) at a distance of ∼650 m from the shoreline to measure wind speed and direction, sand flux, and dust concentration from 15 May to 4 June 2015. We mounted six Campbell Scientific CSAT3 sonic anemometers (Liu et al., 2001) on the tower, of which we used the three-dimensional winds measured by the lowest sonic anemometer (about 0.5 m above the surface) to determine shear stress and shear velocity (details in Martin and Kok, 2017). In addition, we obtained the vertical profile of horizontal sand saltation flux q(z) from nine Wenglor YH03PCT8 electric laser gate sensors (Barchyn et al., 2014), mounted at heights z spanning from 0.02 to 0.47 m above the surface. We converted the measured particle count to sand flux by calibrating to eight concurrently sampling Big Spring Number Eight (BSNE) samplers (Fryrear, 1986; Goossens et al., 2000). We then obtained the total sand flux by integrating the flux through the depth of the saltation layer (see Martin and Kok, 2017; Martin et al., 2018). Furthermore, we obtained the dust concentration profile using six identical optical particle counters (OPCs) (the 212 ambient particulate profiler, manufactured by Met One Instruments, Inc.), of which we mounted four on the tower at four different heights at any given time within 0.74–6.44 m above the surface (location details in Table S1 in the Supplement). Each OPC measured size-resolved aerosol concentrations using seven size bins with equivalent light scattering diameter ranges within 0.49–10 µm, calibrated using polystyrene latex spheres (PSLs) (Table 1, column 1). Of the seven size bins, we only used the smallest six bins. Past studies have found that the sampling efficiency (i.e., the ratio of particle concentration measured by the sensor to the particle concentration in the ambient air; Von der Weiden et al., 2009) can decrease strongly with wind speed for coarse particles; for instance, the loss rate can approach 100 % for particles larger than 10 µm in diameter under strong wind events (Von der Weiden et al., 2009). As the dependence of sampling efficiency on wind speed and particle size was not provided by the instrument's manufacturer, we did not use the largest size bin (bin 7) and only used the smallest six bins (with PSL diameter ranging from 0.49 to 7 µm; see Table 1).
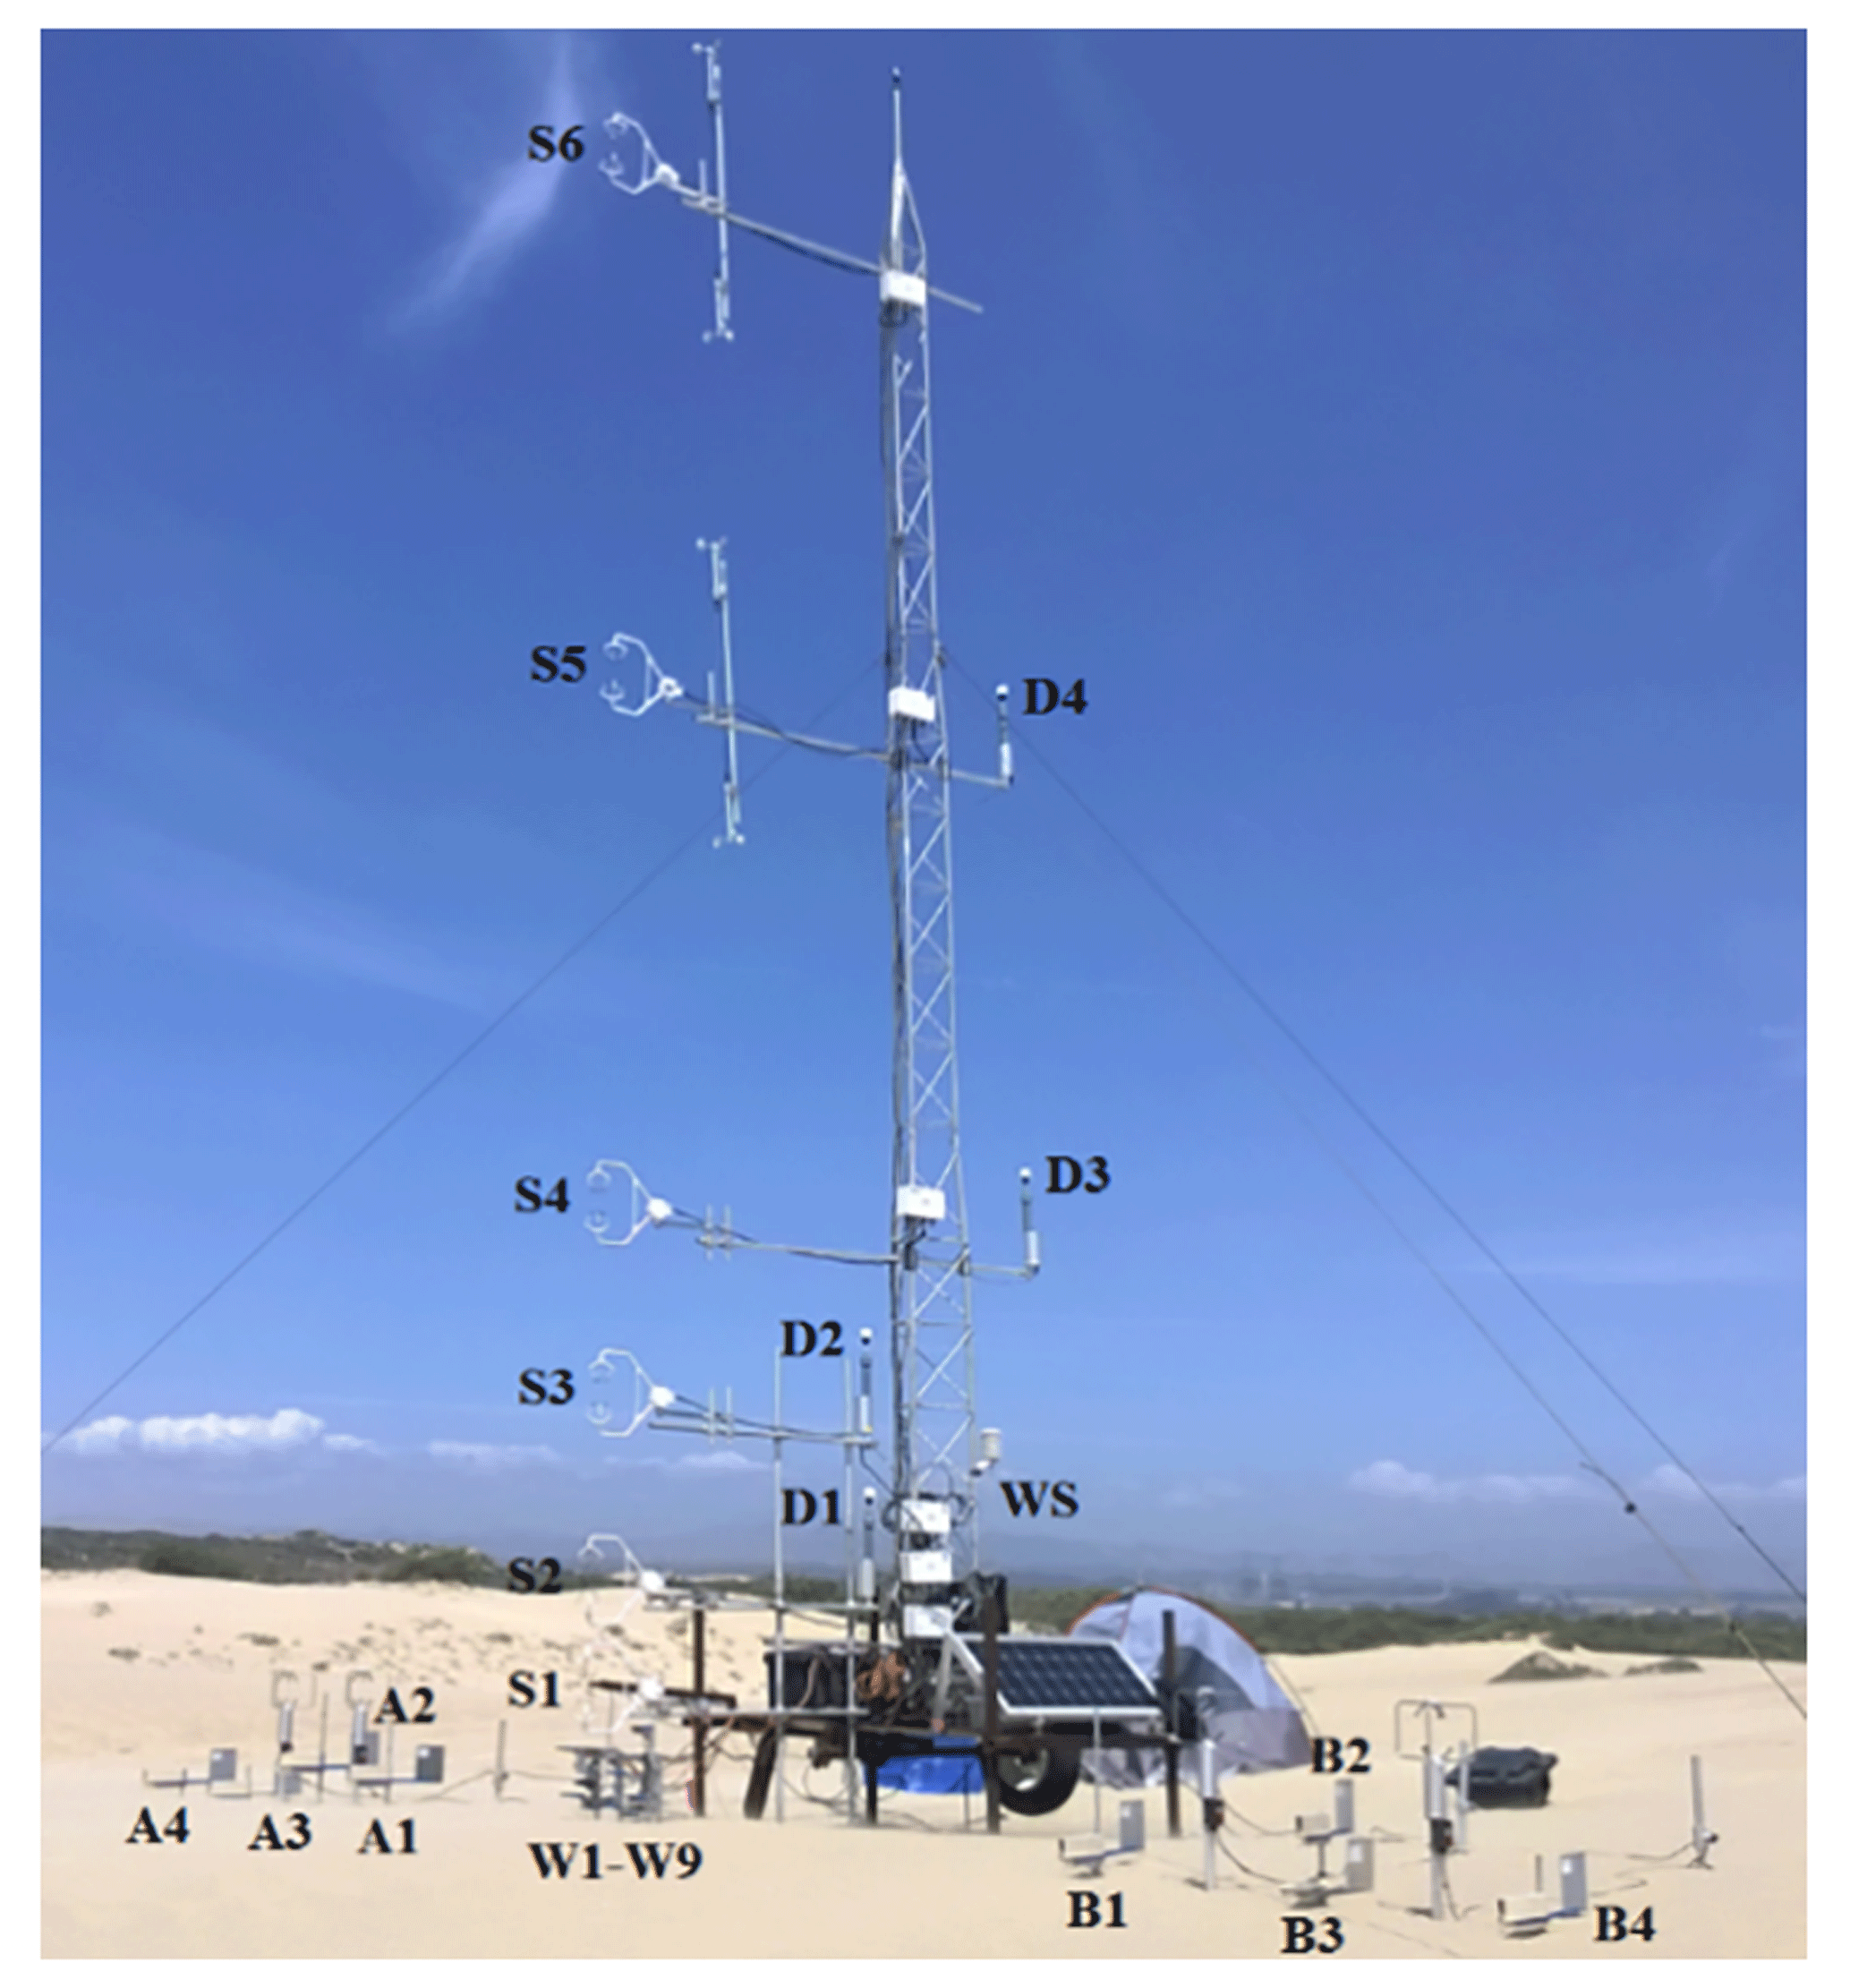
Figure 1The experimental setup at Oceano Dunes. Instrumentation includes six sonic anemometers (S1–S6), nine Wenglor particle counters (W1–W9), eight Big Spring Number Eight sand samplers (A1–A4, B1–B4), four optical particle counters (D1–D4), and a weather station with temperature and humidity sensors (WS) (following Martin and Kok, 2017).
Table 1The dust geometric and aerodynamic diameters of the seven bin boundaries. Determination of the geometric diameter ranges uses Lorenz–Mie theory such that they produce the same range of scattered light intensity as the seven manufacturer-provided polystyrene latex sphere (PSL) diameter sizes. The ranges in geometric diameters derive from the uncertainty in the dust refractive indices. We determined the aerodynamic diameter ranges by applying Eq. (6) to the geometric diameter ranges.
The optical sizing of aerosols is sensitive to differences in the refractive index between the measured aerosols and the particles used to calibrate the instrument (Hinds, 1999). The manufacturer calibrated the OPCs against PSLs, following the international standard ISO 21501-1:2009 (ISO, 2009). We corrected the manufacturer-provided bin size limits to dust size limits using Lorenz–Mie theory (Bohren and Huffman, 1983; Mätzler, 2002; Rosenberg et al., 2012), thereby approximating dust as spherical particles. Specifically, we calculated the light scattered by PSLs (refractive index: ) at the instrument's laser wavelength (589 nm) and scattering angle range (; information provided by the Met One engineering department), using the manufacturer-provided size boundaries of each of the six OPC bins. For each bin, we then determined the size range of dust particles that would produce an equal range of scattered light, using globally representative dust refractive indices (real part and imaginary part , following Kok et al., 2017). This operation yielded the corrected bin size boundaries for dust and their uncertainties (Table 1, column 2 and Fig. S4 in the Supplement).
Using the instrumentation and procedure mentioned above, we obtained shear stress, total sand flux, and size-resolved dust concentration, which we averaged over 30 min periods. We chose a 30 min averaging time interval because this interval is shorter than the typical timescale of a mesoscale weather system but sufficient to capture most of the turbulent energy spectrum (Stull, 1988; Sterk et al., 1998). Furthermore, we intercalibrated the six OPCs to reduce systematic errors in the measured dust concentration and to quantify the instrument uncertainty. To obtain measurements for this intercalibration, we mounted five OPCs (the sixth one malfunctioned after 25 May 2015) at the same height and in a line perpendicular to the wind for 3 days (5, 6, and 7 June 2015) immediately following the field campaign (Fig. S2 in the Supplement). Specifically, for each of the six size bins, we applied linear-least-squares regression on the aerosol concentration of each of the five OPCs against the mean of the five OPCs (Fig. S3a in the Supplement). This procedure yielded a concentration-dependent correction factor with uncertainty for each size bin of each OPC (Table S2 in the Supplement), which we propagated throughout our analysis (Fig. S3b in the Supplement). For all of our subsequent analysis, we did not use dust concentrations measured by the malfunctioning OPC, because they did not satisfy our data-quality control criteria (more details can be found in the Supplement).
We used the calibrated dust concentration to obtain the size-resolved mass flux of emitted dust using the gradient method, which is analogous to the methods for determining vertical scalar fluxes from turbulent and molecular diffusion in the atmospheric surface layer (Gillette et al., 1972; Shao, 2008). The gradient method assumes constant dust flux within the surface layer, neutral atmospheric stability (see supplementary Fig. 2 of Martin and Kok, 2017), and negligible dust deposition from upwind sources, and it is expressed as
where Fd,i is the vertical mass flux (kg m−2 s−1) of the ith size class of the six bins; ci denotes the mass concentration (kg m−3) of the ith size class at height z (m); Kd is the turbulent diffusivity (m−2 s−1) obtained by the mixing length theory (Stull, 1988); η is the ratio between the turbulent diffusivity of a passive tracer and that of momentum, which we take as unity based on previous studies (Gillette et al., 1972; Stull, 1988); κ is the von Kármán constant, which we take as 0.387 (Andreas et al., 2006); and u∗ is the shear velocity (m s−1). Combining Eqs. (1) and (2), and integrating from a reference height zr (m), we obtain
where ci(zr) is the reference concentration of the ith size class at zr. For calculation purposes, we set zr as the height of the “D1” OPC (Fig. 1 and Table S1, column 2, in the Supplement). Applying Eq. (3) to each of the six bin classes yields the size-resolved vertical dust mass flux Fd,i for each bin. We then obtained the bulk vertical mass flux as the sum of the size-resolved fluxes . Note that for each bin we only used measurements that showed a negative gradient (concentration decreases with height) and thus a positive dust flux, as discussed further below.
We used the size-resolved vertical dust flux obtained above to calculate the particle size distribution (PSD) of emitted dust and the sandblasting efficiency, which together give insights into the physical processes governing dust emission from active sands (Kok et al., 2014b; Mahowald et al., 2014). We computed the normalized volume PSD of dust at emission as
where Di (µm) and Di+1 (µm) are the lower and upper boundary geometric diameter sizes, respectively, of the ith size class (Table 1, column 2). The integral of over particle size thus yields unity. For each size bin we then obtained the sandblasting efficiency, which is the vertical dust flux produced by a unit horizontal sand saltation flux (Marticorena and Bergametti, 1995),
where Q (kg m−1 s−1) is the total horizontal sand flux integrated over all sand grain sizes (see Martin and Kok, 2017). We then obtained the bulk sandblasting efficiency α (m−1) by summing over the six αi (m−1), .
We used the size-resolved vertical mass flux calculated above to obtain the vertical flux for particulate matter with geometric diameter Dg≤10 µm (PM10,g) and with aerodynamic diameter Da≤2.5 µm (PM2.5,a). Dust in atmospheric circulation models is usually represented in terms of geometric diameter (Mahowald et al., 2014), and the PM10,g size range is considered most relevant to dust impacts on weather and climate (Kok et al., 2017). In contrast, aerodynamic diameter is more relevant to aerosol impacts on human health, which corresponds with the PM2.5,a concentration (Burnett et al., 2014). To obtain the PM10,g flux, we summed the mass flux of the smallest six size bins and part of the seventh size bin that is within the PM10,g size range (see Table 1, column 2), for which we integrated over the sub-bin size distribution obtained by linear-least-squares regression on the PSD of the emitted dust of the sixth and seventh size bin. To obtain the PM2.5,a flux, we first converted the geometric diameter bin sizes to aerodynamic diameter bin sizes through (Hinds, 1999)
where Da and Dg are the aerodynamic and geometric diameter, respectively; ρ0=1000 kg m−3 is the density of water; kg m−3 is the typical density of dust aerosols (Kok et al., 2017); and χ is the dynamic shape factor, which is defined as the ratio of the drag force experienced by the irregular particle to the drag force experienced by a spherical particle with diameter Dg (Hinds, 1999). We used (Kok et al., 2014a), which yielded (values of geometric and aerodynamic bin diameters are listed in Table 1). Second, we summed the mass flux of the smallest two size bins and part of the third size bin that is within the PM2.5,a size range (see Table 1, column 3), for which we integrated over the sub-bin size distribution obtained by linear-least-squares regression on the PSD of the emitted dust of the second and third size bin.
We found that aerosol concentration, vertical mass flux, and the PSD calculated with the procedure above were affected by both dust emission and sea-salt aerosol deposition. Specifically, we found deviations in the measured aerosol concentration profiles (Fig. S5 in the Supplement) from the logarithmic profile expected to occur from an active dust emission source (Stull, 1988; Kind, 1992; Gillies and Berkofsky, 2004), a result that we inferred as the influence of sea-salt aerosol. Because we measured dust concentrations ∼650 m from the shoreline, we expect increasing sea-salt aerosol concentration with height due to the upwind deposition of near-surface sea-salt aerosol (Dueker et al., 2011; Liang et al., 2016). We generally observed an increasing concentration with height for the lowest two or three OPCs when saltation was inactive (horizontal saltation flux Q=0), consistent with sea-salt aerosol deposition, but found a decrease in concentration with height when saltation was active (Q>0), consistent with dust emission (Fig. S5 in the Supplement). Furthermore, the measured PSD was coarser when saltation was inactive than when it was active (Fig. S6 in the Supplement). This observation is consistent with sea-salt aerosol being coarser than dust aerosol (O'Dowd and de Leeuw, 2007) and dominating when dust emission is not occurring. We thus mitigated the problem of the influence of sea-salt aerosol on our results by using only the lowest two sensors (D1 and D2 in Fig. 1), which were most affected by dust emission and least affected by the upwind sea-salt aerosol emission. Indeed, using only the lowest two sensors caused the aerosol flux to be small and negative (deposition) when saltation was inactive and large and positive (emission) when saltation was active (Fig. S7 in the Supplement). Because using the lowest two sensors did not eliminate the deposition flux of sea-salt aerosol from our results, we in addition subtracted mass flux measured by D1 and D2 when saltation was inactive from the flux by D1 and D2 when saltation was active. We found the sea-salt deposition flux at Oceano was of the order of 0.1 µg m−2 s−1 (Fig. S8 in the Supplement), which was roughly an order of magnitude smaller than measurements 50 m away from the shoreline in coastal Maine, USA (Dueker et al., 2011). Due to a lack of precise sea-salt deposition data in our measurements, we assumed the sea-salt aerosol deposition flux to be invariant to shear velocity (Fig. S8a in the Supplement). However, accounting for the possible dependence of sea-salt deposition flux on shear velocity does not qualitatively affect the PSD of dust at emission (Fig. S9 in the Supplement).
In order to characterize the sand grains at the experimental site, we collected four sand samples (each ∼220 g) on 14 October 2016 from the upper 2 cm of the surface, with two samples at the tower location and two at 100 m upwind. We analyzed the properties of each sand sample using a series of physical and chemical techniques. First, we analyzed the particle size distribution (PSD) using the laser diffraction technique with the ANALYSETTE 22 MicroTec Plus, Fritsch (Katra and Yizhaq, 2017), which measured particles within 0.08–2000 µm in optical diameter. We calculated the PSD of soil samples with a Fraunhofer diffraction model with a size resolution of 1 µm using MasControl software (Katra and Yizhaq, 2017). Note that we did not convert this soil PSD in terms of optical diameter into geometric or aerodynamic diameter due to a lack of information on particle shape, refractive index, scattering angle range, and laser wavelength. Second, we analyzed the mineralogical composition of the sand grains using the X-ray powder diffraction (XRPD) method (Klute, 1986). The XRPD method allows the crystal structure data to retrieve the minerals of a bulk sample. Each analyzed sample of 1 g contains hundreds of grains at the sand size of the Oceano site. Specifically, we used the Panalytical Empyrean powder diffractometer equipped with the position-sensitive detector X'Celerator (Philips 1050/70). Data were collected in the θ∕2θ geometry using Cu Kα radiation (λ=1.54178 Å) at 40 kV and 30 mA. Scans were run over ∼15 min intervals in a 2θ range of 4–60∘ with a step equal to ∼0.033∘ (Sommariva et al., 2014). The reference intensity ratio (RIR) method was used to determine the concentrations of the crystalline components. The integral intensities of main peaks were taken for computation (Gualtieri, 1996, 2000). Third, we performed a qualitative examination of the grain surfaces using scanning electron microscopy (SEM) (Quanta 200, FEI) and the energy dispersive X-ray spectroscopy (EDS) chemical analysis technique integrated within SEM. The SEM-EDS stimulates each sample using electrons and detects the spectrum of outgoing photons to retrieve the elemental analysis of the grain surfaces, which provided us with information on the mineralogy of grain coatings. In our case, each sample replica was composed of some dozens of particles, including sand-sized and dust-sized particles. It additionally provided images at extremely high magnification (6× to 1 000 000×) that enable a close analysis of the smallest dust particles (< 2 µm).
We find that dust emitted from the sand sheet at Oceano differs from dust emitted from non-sandy soils in two key ways. First, the vertical PM10,g and PM2.5,a dust fluxes at Oceano are both smaller than those fluxes from most non-sandy soils at the same shear velocity (Fig. 2). The vertical PM10,g and PM2.5,a fluxes at Oceano range from 1 to 100 µg m−2 s−1 and 0.1 to 30 µg m−2 s−1, respectively. They both increase nonlinearly with increasing shear velocity in the measured range of 0.29–0.43 m s−1. For similar shear velocities, the PM10,g and PM2.5,a dust fluxes from most non-sandy soils exceed those at Oceano, differing by a factor of ∼1–100 and ∼0.1–10, respectively. The second key difference is that dust emitted from the Oceano site is substantially finer than size-resolved dust emitted from non-sandy soils under natural saltation (Fig. 3a), and it is also significantly finer than dust measured in situ over North Africa (Fig. 3b), which likely accounts for a majority of the world's dust emissions (Prospero et al., 2002; Engelstaedter et al., 2006).

Figure 2The vertical dust mass flux as a function of shear velocity within (a) the PM10,g geometric diameter range and (b) the PM2.5,a aerodynamic diameter range. Each of the two plots includes measurements at Oceano (black open circles) and previously published field studies of natural dust emissions from non-sandy soils (open triangles). These latter measurements were compiled in Kok et al. (2014a), which corrected these measurements to the PM10,g geometric diameter range following the procedure described in that work. Furthermore, we corrected these measurements to the PM2.5,a aerodynamic diameter range assuming that their PSDs follow the prediction of the brittle fragmentation theory generated by aggregate fragmentation (Kok, 2011). Error bars on the Oceano measurements were obtained through error propagation (details in Supplement).
Our measurement of the bulk sandblasting efficiency provides further insight into the differences between dust emissions from the Oceano sand sheet and from non-sandy soils. First, the bulk sandblasting efficiency at Oceano is around 10−6 m−1 (Fig. 5), which is substantially smaller than the range within 10−5 to 10−2 m−1 typical for non-sandy soils (Kok et al., 2012). Second, the bulk sandblasting efficiency increases nonlinearly as a power law in shear velocity (Fig. 5), a result consistent with some previous studies (Shao et al., 1993; Marticorena and Bergametti, 1995; Kok et al., 2012).
We find that the dependence of the sandblasting efficiency on shear velocity changes with dust size (Fig. 6), which explains the shift in the PSD of emitted dust to finer size with increasing shear velocity (Fig. 4). Specifically, the power law exponents of the dependence of the sandblasting efficiency on shear velocity are large and positive for the smallest five bins, whereas the exponent substantially drops to a negative value for bin 6 (Fig. 6). This explains the fining of the PSD of emitted dust with increasing shear velocity, which is almost entirely due to a decreased contribution of bin 6 (Fig. 4). We consider it likely that this decreased contribution from bin 6 (with Dg ranging from 6.21 to 9.14 µm; see Table 1) with increasing shear velocity is caused by a decrease in sampling efficiency of coarse particles with wind speed (Von der Weiden et al., 2009). Therefore, it is possible that the PSD of emitted dust remains approximately invariant with shear velocity.
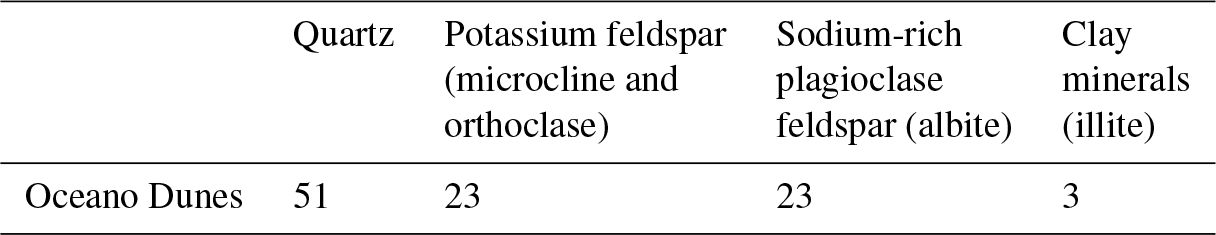
Our analyses of sand grains sampled from the field site show that the Oceano sand is characterized by a unimodal size distribution (mode at 461 µm and median at 491 µm) with 0.95 % (by mass) of loose clay- and silt-sized fine particles (∼63 µm) between the sand grains and 0.41 % of particulate matter smaller than 10 µm (Fig. 7). The sand consists of a mixture of quartz (51 % by mass), feldspars (K-rich feldspar 23 % and plagioclase 23 %), and clay minerals (3 %) analyzed by the XRPD technique (Table 2). We further find the presence of mineral coatings on the top of quartz sand grains through the SEM-EDS technique (Fig. 8d and e). Note that the mass content of clay minerals detected in the XRPD analysis can be in the form of loose fine dust in the pore spaces between the sand grains and/or clay-mineral coatings attached to the sand grains. In addition, we find that the surface of the feldspars appears more abraded than the solid surface of the quartz sand grains (compare location “B” and location “C” in Fig. 8a), which are representative of a large number of SEM-EDS observations made for these samples.
Table 2Averaged mineralogy of the Oceano Dunes sand samples in unit of percentage by mass, determined from X-ray powder diffraction (XRPD) analysis. Note that the values in the table are averages of mineralogy of four 1 g samples with two collected from the tower location and two from 100 m upwind. Each analyzed sample contains hundreds of grains.
We reported in situ field measurements of natural dust emission from an undisturbed coastal sand sheet at Oceano Dunes in California (Fig. 1 and Fig. S1 in the Supplement). We found that dust emission from these active sands differs in several key ways from dust emission from non-sandy soils, namely in the magnitude of vertical PM10,g and PM2.5,a dust fluxes (Fig. 2), the particle size distribution (PSD) of dust at emission (Fig. 3), and the magnitude and the shear velocity dependence of the sandblasting efficiency (Fig. 5). Furthermore, we found that sand grains at the study site are coarse with a mode larger than 460 µm (Fig. 7), that many sand grains contain clay-mineral coatings, and that about half of the sand grains are feldspars (K-rich feldspar and plagioclase) (Table 2). These results provide insights into several fundamental questions.
-
What physical processes drive dust emission from active Oceano sands?
-
How representative are dust emissions from the sand sheet at Oceano of active sands elsewhere?
-
What are the implications of dust emission from Oceano for downwind human health, park management, the hydrological cycle, and climate?
After addressing these questions, we end the discussion section with several limitations of our methodology.
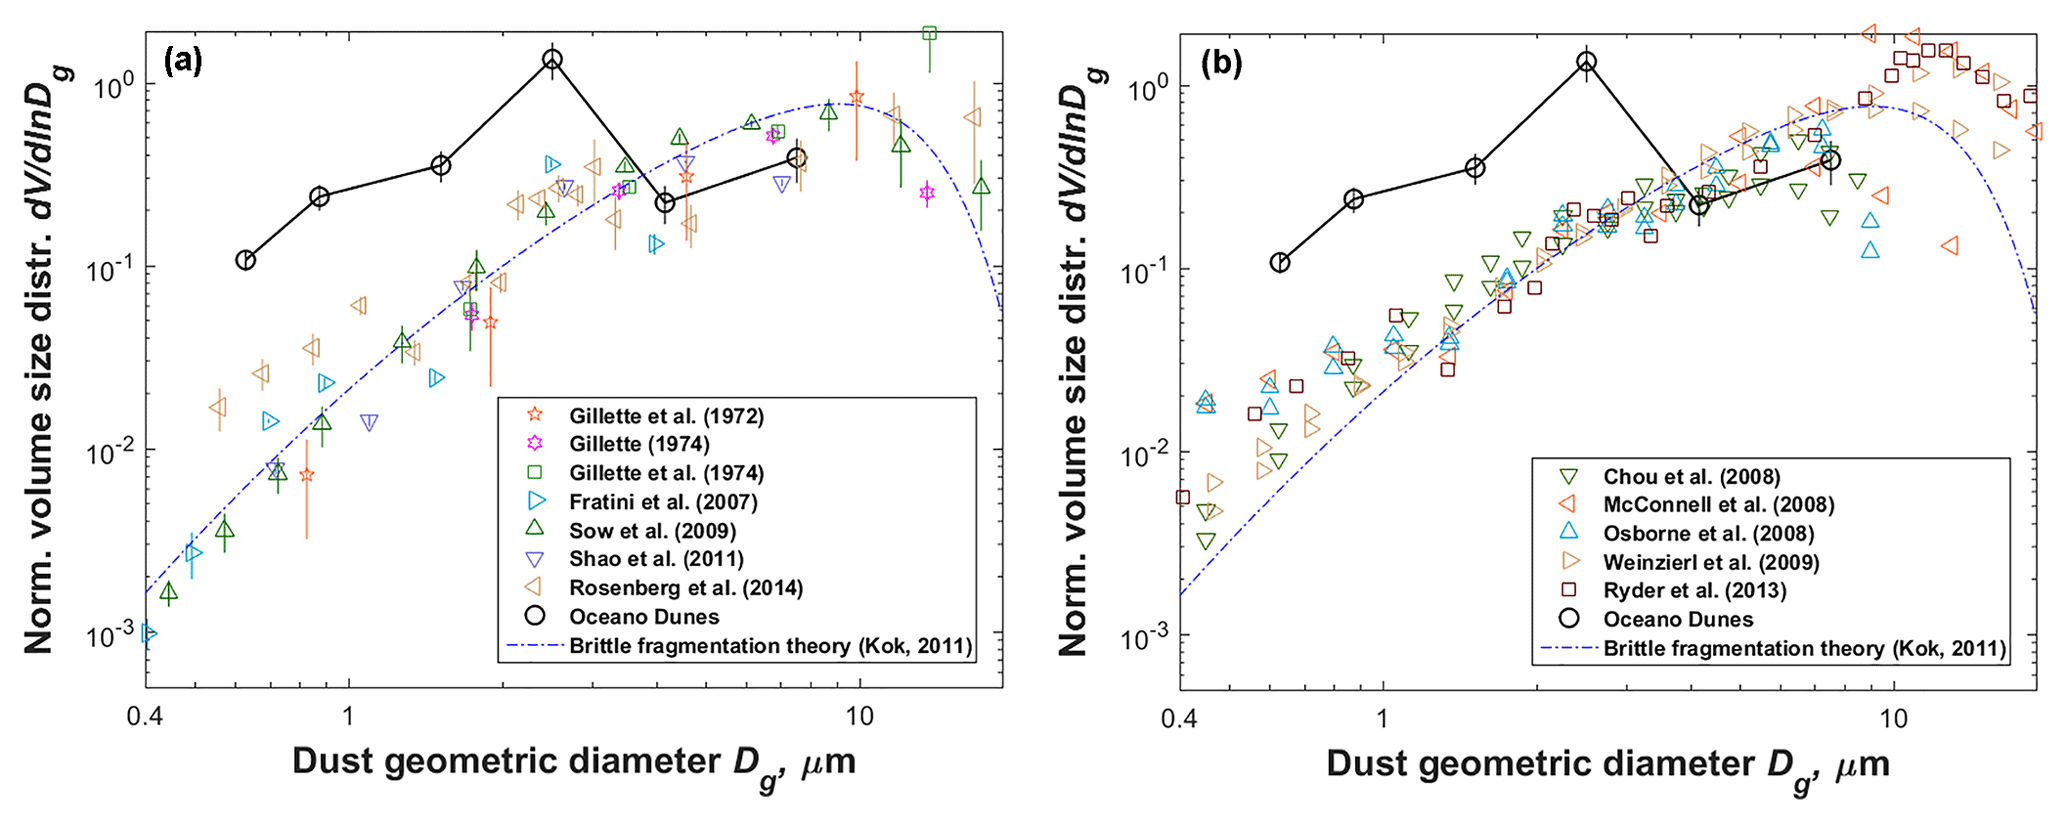
Figure 3Normalized volume particle size distribution (PSD) of dust at emission as a function of the dust aerosol geometric diameter averaged over all measurements at Oceano (black open circles). Plotted for comparison are measurements compiled by Kok et al. (2017) of (a) the emitted dust PSDs from non-sandy soils in the US (Gillette et al., 1972, 1974; Gillette, 1974), China (Fratini et al., 2007), North Africa (Sow et al., 2009; Rosenberg et al., 2014), and Australia (Shao et al., 2011) and (b) in situ aircraft measurements of dust-dominated PSDs close to the Saharan source regions. Note that these measurements are normalized using the procedure described in Kok (2011) and Kok et al. (2017), which differs somewhat from the procedure used for the Oceano data (see Sect. 2). Also plotted for comparison is the brittle fragmentation theory (dashed–dotted blue lines) on the PSD of emitted dust generated by aggregate fragmentation (Kok, 2011). Error bars on the Oceano measurements were obtained through error propagation (details in Supplement).
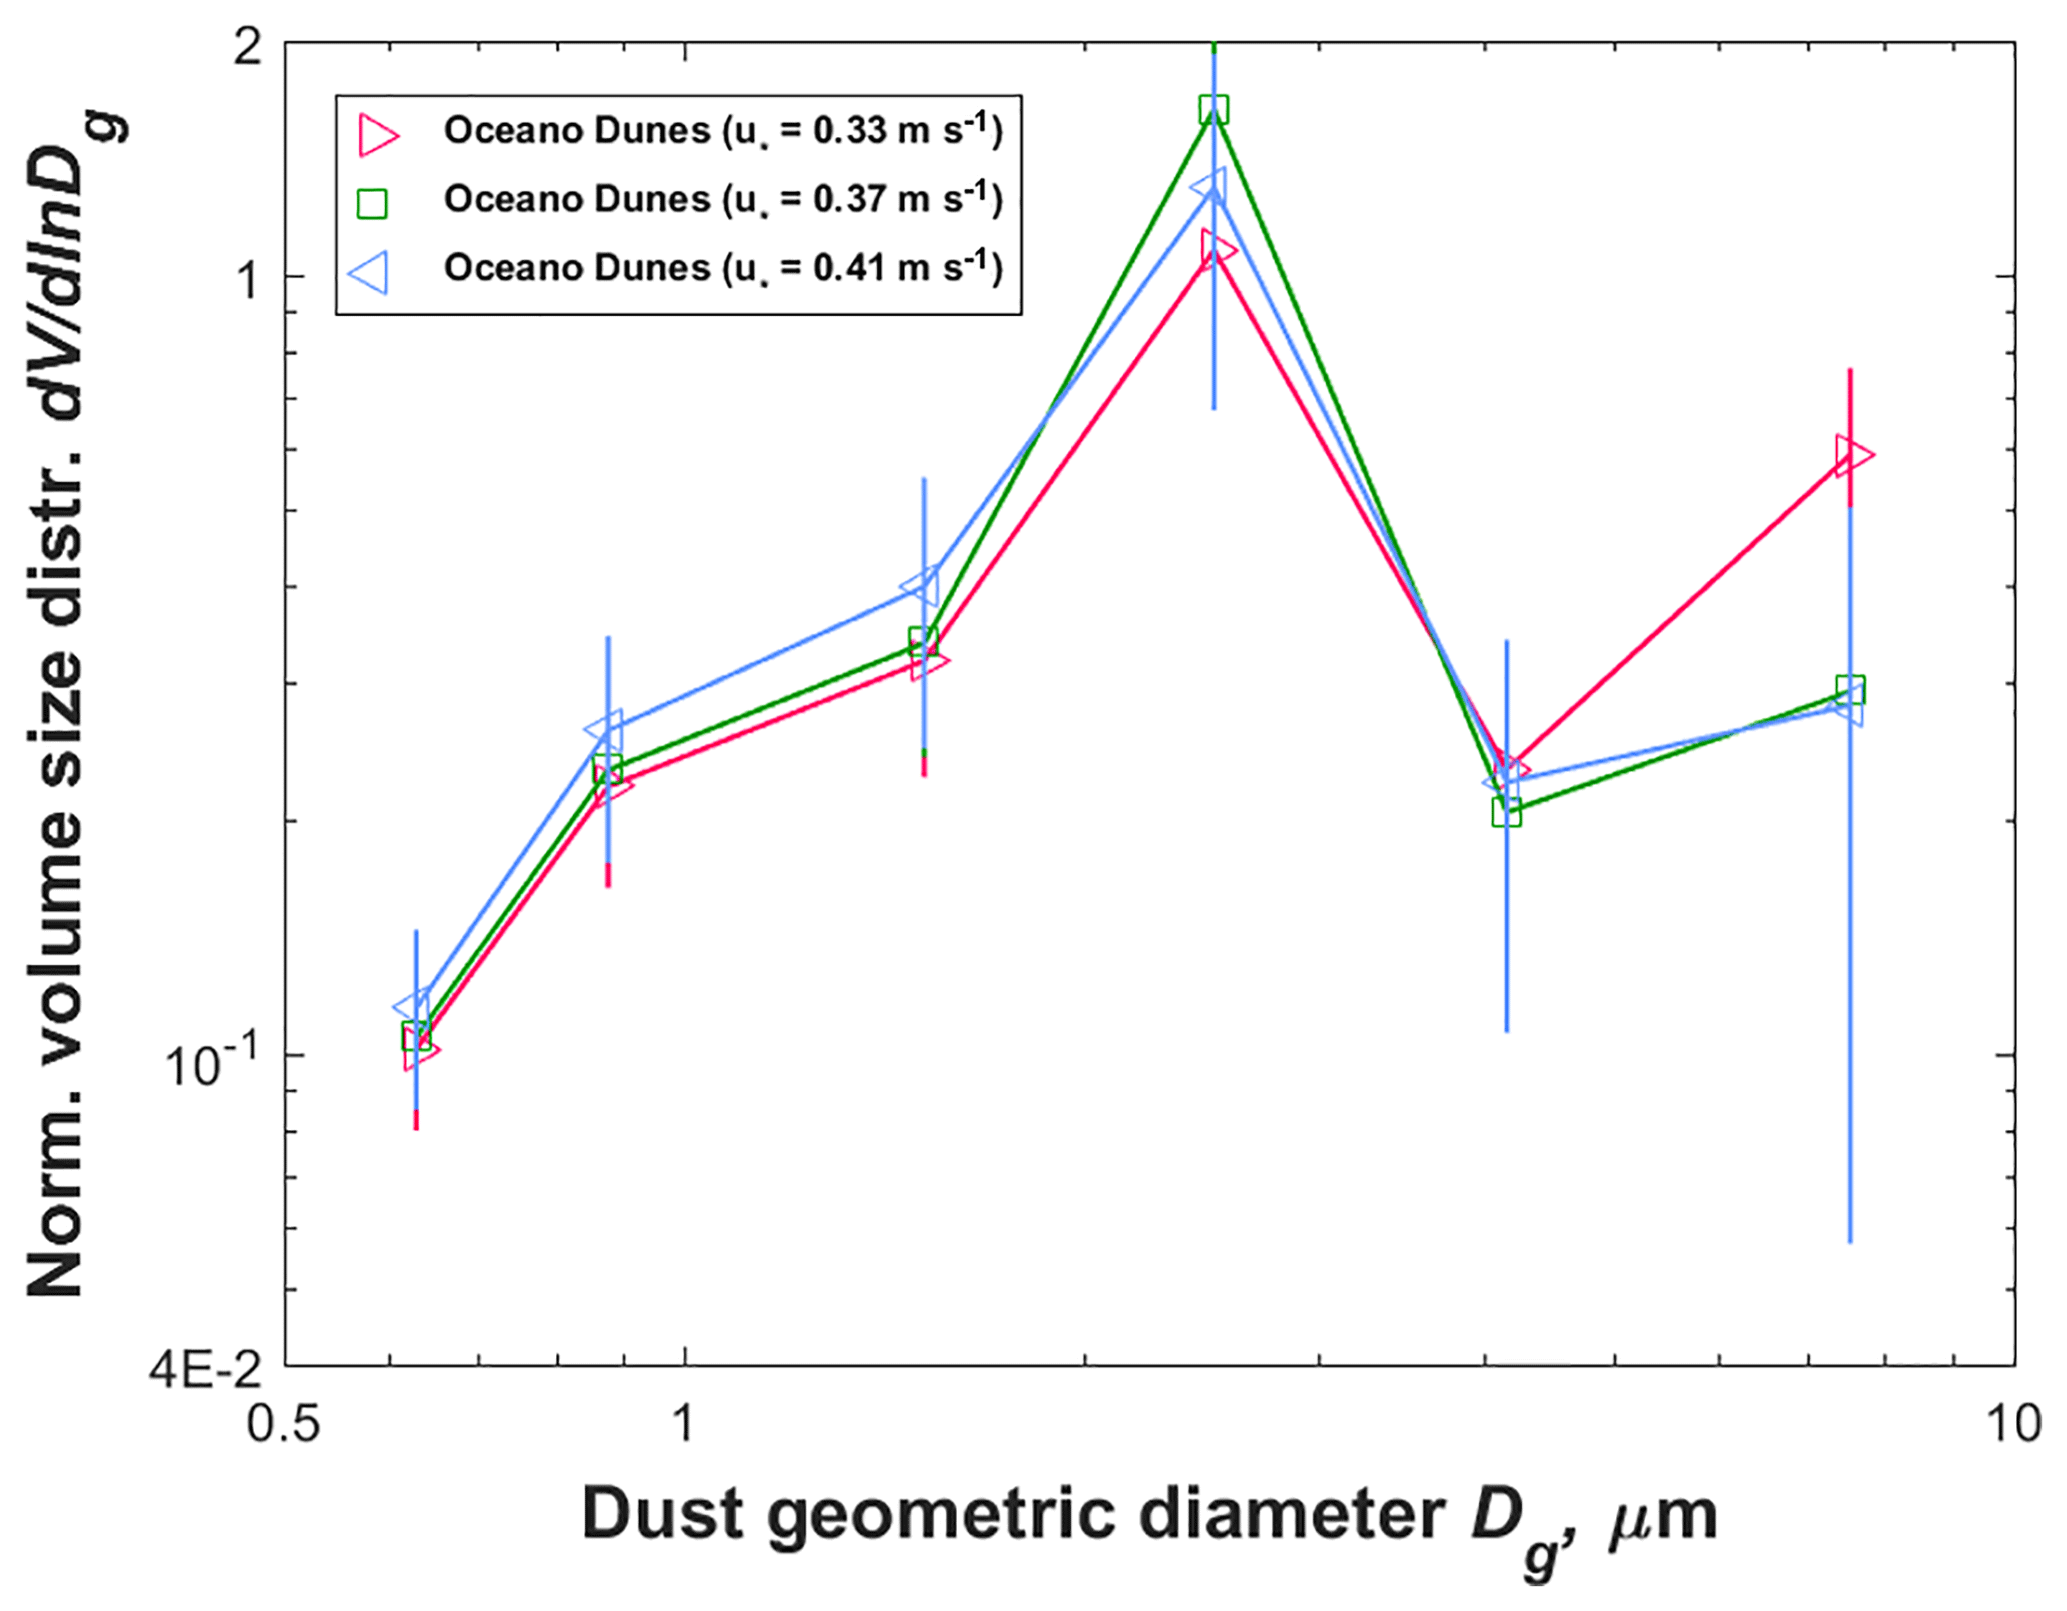
Figure 4Shear velocity dependence of the normalized volume particle size distribution of dust at emission at Oceano. We divided the measurements evenly into three shear velocity bins, with averaged values of 0.33, 0.37, and 0.41 m s−1, respectively. Error bars on the measurements were obtained through error propagation (details in Supplement).
4.1 Insights into processes producing dust from active sands at the Oceano Dunes State Vehicular Recreation Area
Our results indicate that aeolian abrasion of feldspars is one possible dust emission process at Oceano. XRPD analysis confirms the existence of feldspars (∼46 % by mass) (Table 2). Although the content of feldspars is of the same magnitude as that of quartz (∼51 % by mass) (Table 2), the surfaces of the feldspars commonly appear more abraded than the surfaces of the quartz sand grains (Fig. 8a), suggesting a higher potential to generate dust through aeolian abrasion of feldspars than of quartz grains. We list four supporting findings from other experimental studies. First, both laboratory (Dutta et al., 1993; Jari, 1995) and wind tunnel (Kuenen, 1960, 1969) experiments have found that feldspars are more fragile than quartz grains to aeolian abrasion, possibly owing to the cleavage structures of feldspars (Kuenen, 1969) and the greater propensity of feldspars to weather than quartz (Nesbitt et al., 1997). Second, the feldspar content of dust is higher than that of the parent top soils in dust-producing regions, including northern Ghana (Tiessen et al., 1991), China (Feng et al., 2008), and the UK (Moreno et al., 2003), implying the preferential generation of dust from feldspars. Third, laboratory experiments have found that aeolian abrasion of feldspars can generate a larger fraction of the PM10 and the PM2.5 size ranges than that generated from abrasion of quartz (Domingo et al., 2010). Indeed, laboratory experiments on washed and clean quartz grains (for which grain surface minerals have been removed) (Whalley et al., 1987; Bullard et al., 2007) and on freshly crushed quartz grains (Wright et al., 1998; Wright, 2001) imply that the dust produced by aeolian abrasion of quartz grains has a small portion (less than 1 % by mass) within the PM10 size range. Fourth, Pye and Sperling (1983) found that when coastal dune sands are exposed to salt solutions under desert diurnal temperature and humidity cycles, feldspars are more susceptible to breakage into fine grains than quartz. Because the Oceano measurement site is exposed to high levels of sea-salt aerosols deposition (see Sect. 2), this finding further supports our hypothesis that aeolian abrasion of feldspars is one possible dust emission process at Oceano.
Our results further suggest that the removal of clay-mineral coatings by saltator impact is another possible contributor to dust emissions at Oceano, which is supported by the following two findings. First, XRPD analysis found the content of clay minerals to be around 3 % by mass (Table 2) for Oceano sand samples, although the fraction of this contributed by clay-mineral coatings is uncertain because XRPD analysis cannot distinguish between clay-mineral coatings and loose clay-sized fines trapped in the pore spaces between sand grains (Swet et al., 2019). However, the PSD of dust emitted from the Oceano site is generally consistent with the PSD of emitted dust of laboratory experiments on sand samples taken from Australian active sand dunes (Fig. S10 in the Supplement) (Bullard et al., 2004, 2007). Specifically, Bullard and co-workers simulated aeolian abrasion within an air chamber on the Australian sand grains with the content of clay-mineral coatings as ∼1 %–2 % by mass. They concluded that the removal of clay-mineral coatings was likely the main process for PM10 dust emissions, implying that the removal of clay-mineral coatings is a key emission process at Oceano as well. Second, a companion paper reports results of wind tunnel experiments on sand grains collected from our Oceano field site, as well as from two active desert dune fields in Israel (Swet et al., 2019). They reported that all three sands produced substantial dust emissions, and their measured sandblasting efficiency of Oceano sands was consistent with our field measurements. After Swet and co-workers washed the sand grains from the two Israeli dune fields to remove most of the loose resident fines, leaving the clay-mineral coatings largely unchanged, they found that the washed sand grains still produced PM10 dust emissions that were comparable to those before the sand was washed. Although Swet et al. (2019) did not perform this last experiment on Oceano sand, these results support the interpretation that removal of clay-mineral coatings is a key process driving dust emissions from active sands, including at Oceano.
Our results imply that sandblasting of resident fines by saltators is a third possible dust emission process at Oceano. The resident fines exist as single particles trapped in between the sand grains, as was observed when we washed sand samples in the lab. Although XRPD analysis cannot distinguish between clay-mineral coatings and clay-sized resident fines in the pore spaces between sand grains (Swet et al., 2019), the content of these resident fines is less than 3 % by mass (Table 2). Because we observed a net dust emission flux only when saltation was occurring (Figs. S5 and S7 in the Supplement), it is unlikely that the direct aerodynamic entrainment of resident fines (Klose and Shao, 2012) contributed substantially to dust emissions at Oceano. The occurrence of dust emission by removal of resident fines is supported by the measurements of Swet et al. (2019), which reported that unwashed sands produced more dust than washed ones.
Our results provide two insights into the energetics of dust emission from Oceano. First, the lower bulk sandblasting efficiency at Oceano, compared to that of non-sandy soils, supports the common hypothesis that sandblasting efficiency increases sharply with clay-sized grain content (Marticorena and Bergametti, 1995; Kok et al., 2014a). Second, we find that the bulk sandblasting efficiency of Oceano sand increases as a power law with shear velocity (Fig. 5). Because such enhancement of the sandblasting efficiency occurs despite invariance of mean saltator velocity with shear velocity (Martin and Kok, 2017), such changes in sandblasting efficiency must be driven instead by changes in the probability distribution of the saltator impact energies. The recent dust emission model of Kok et al. (2014a) predicts a power law increase in the sandblasting efficiency with shear velocity for soils for which the typical saltator impact energy is substantially less than the threshold impact energy needed to overcome particle bonds. This power law increase occurs because, for such erosion-resistant soils, only particularly energetic saltator impacts are capable of emitting dust, and the fraction of saltators impacts that are particularly energetic increases nonlinearly with wind shear velocity (see Fig. 16 in Kok et al., 2012; Fig. 1 in Kok et al., 2014a). As such, our results both tentatively support the Kok et al. (2014a) dust emission model and suggest that dust emission from Oceano sands are predominantly produced by saltators with an impact energy much greater than the mean impact energy (i.e., with impact energy in the high-energy tail of the saltator-impact-energy distribution). This dependence of dust emission on the very energetic saltator impacts likely occurs because both removal of clay-mineral coatings and aeolian abrasion of feldspars are energetic processes and thus require particularly energetic saltator impacts.

Figure 5The bulk sandblasting efficiency α (m−1) at Oceano as a function of shear velocity. The linear-least-squares fit (black line) indicates that α increases as a power law in shear velocity with an exponent of 3.50±0.89. Error bars were obtained by propagating errors from the sensor intercalibration process, the regression used in the gradient method, and the subtraction of the sea-salt deposition flux (see Supplement). The two dotted black lines denote the 95 % confidence range on the fit. The geometric and the aerodynamic diameter ranges of the vertical dust mass flux Fd are noted at the top, and Q is the total horizontal sand flux integrated over all sand grain sizes (Martin et al., 2018).
4.2 Insights into the representativeness of Oceano dust emissions for other active sands
It is unclear how representative our measurements on the active coastal sand sheet at Oceano are of dust emission from other active sands, including active sand dunes, in particular in relation to the sand size distribution, the content of feldspars, and the extensiveness of clay-mineral coatings.
Our results indicate that sand at our study site, with a mode around 461 µm (Fig. 7), is coarser than the sand of most active sand dunes (Bullard et al., 2004; Pye and Tsoar, 2009; Webb et al., 2013; Swet et al., 2019). Because the threshold shear velocity required to sustain saltation increases with the grain particle size (Shao, 2008; Kok et al., 2012), the value of 0.28 m s−1 we found at Oceano (Martin and Kok, 2017, 2018) is likely somewhat higher than that at typical active sand dunes, as also confirmed in the laboratory measurements of Swet et al. (2019). As such, the horizontal saltation flux at Oceano could be somewhat lower compared with typical active sand dunes.
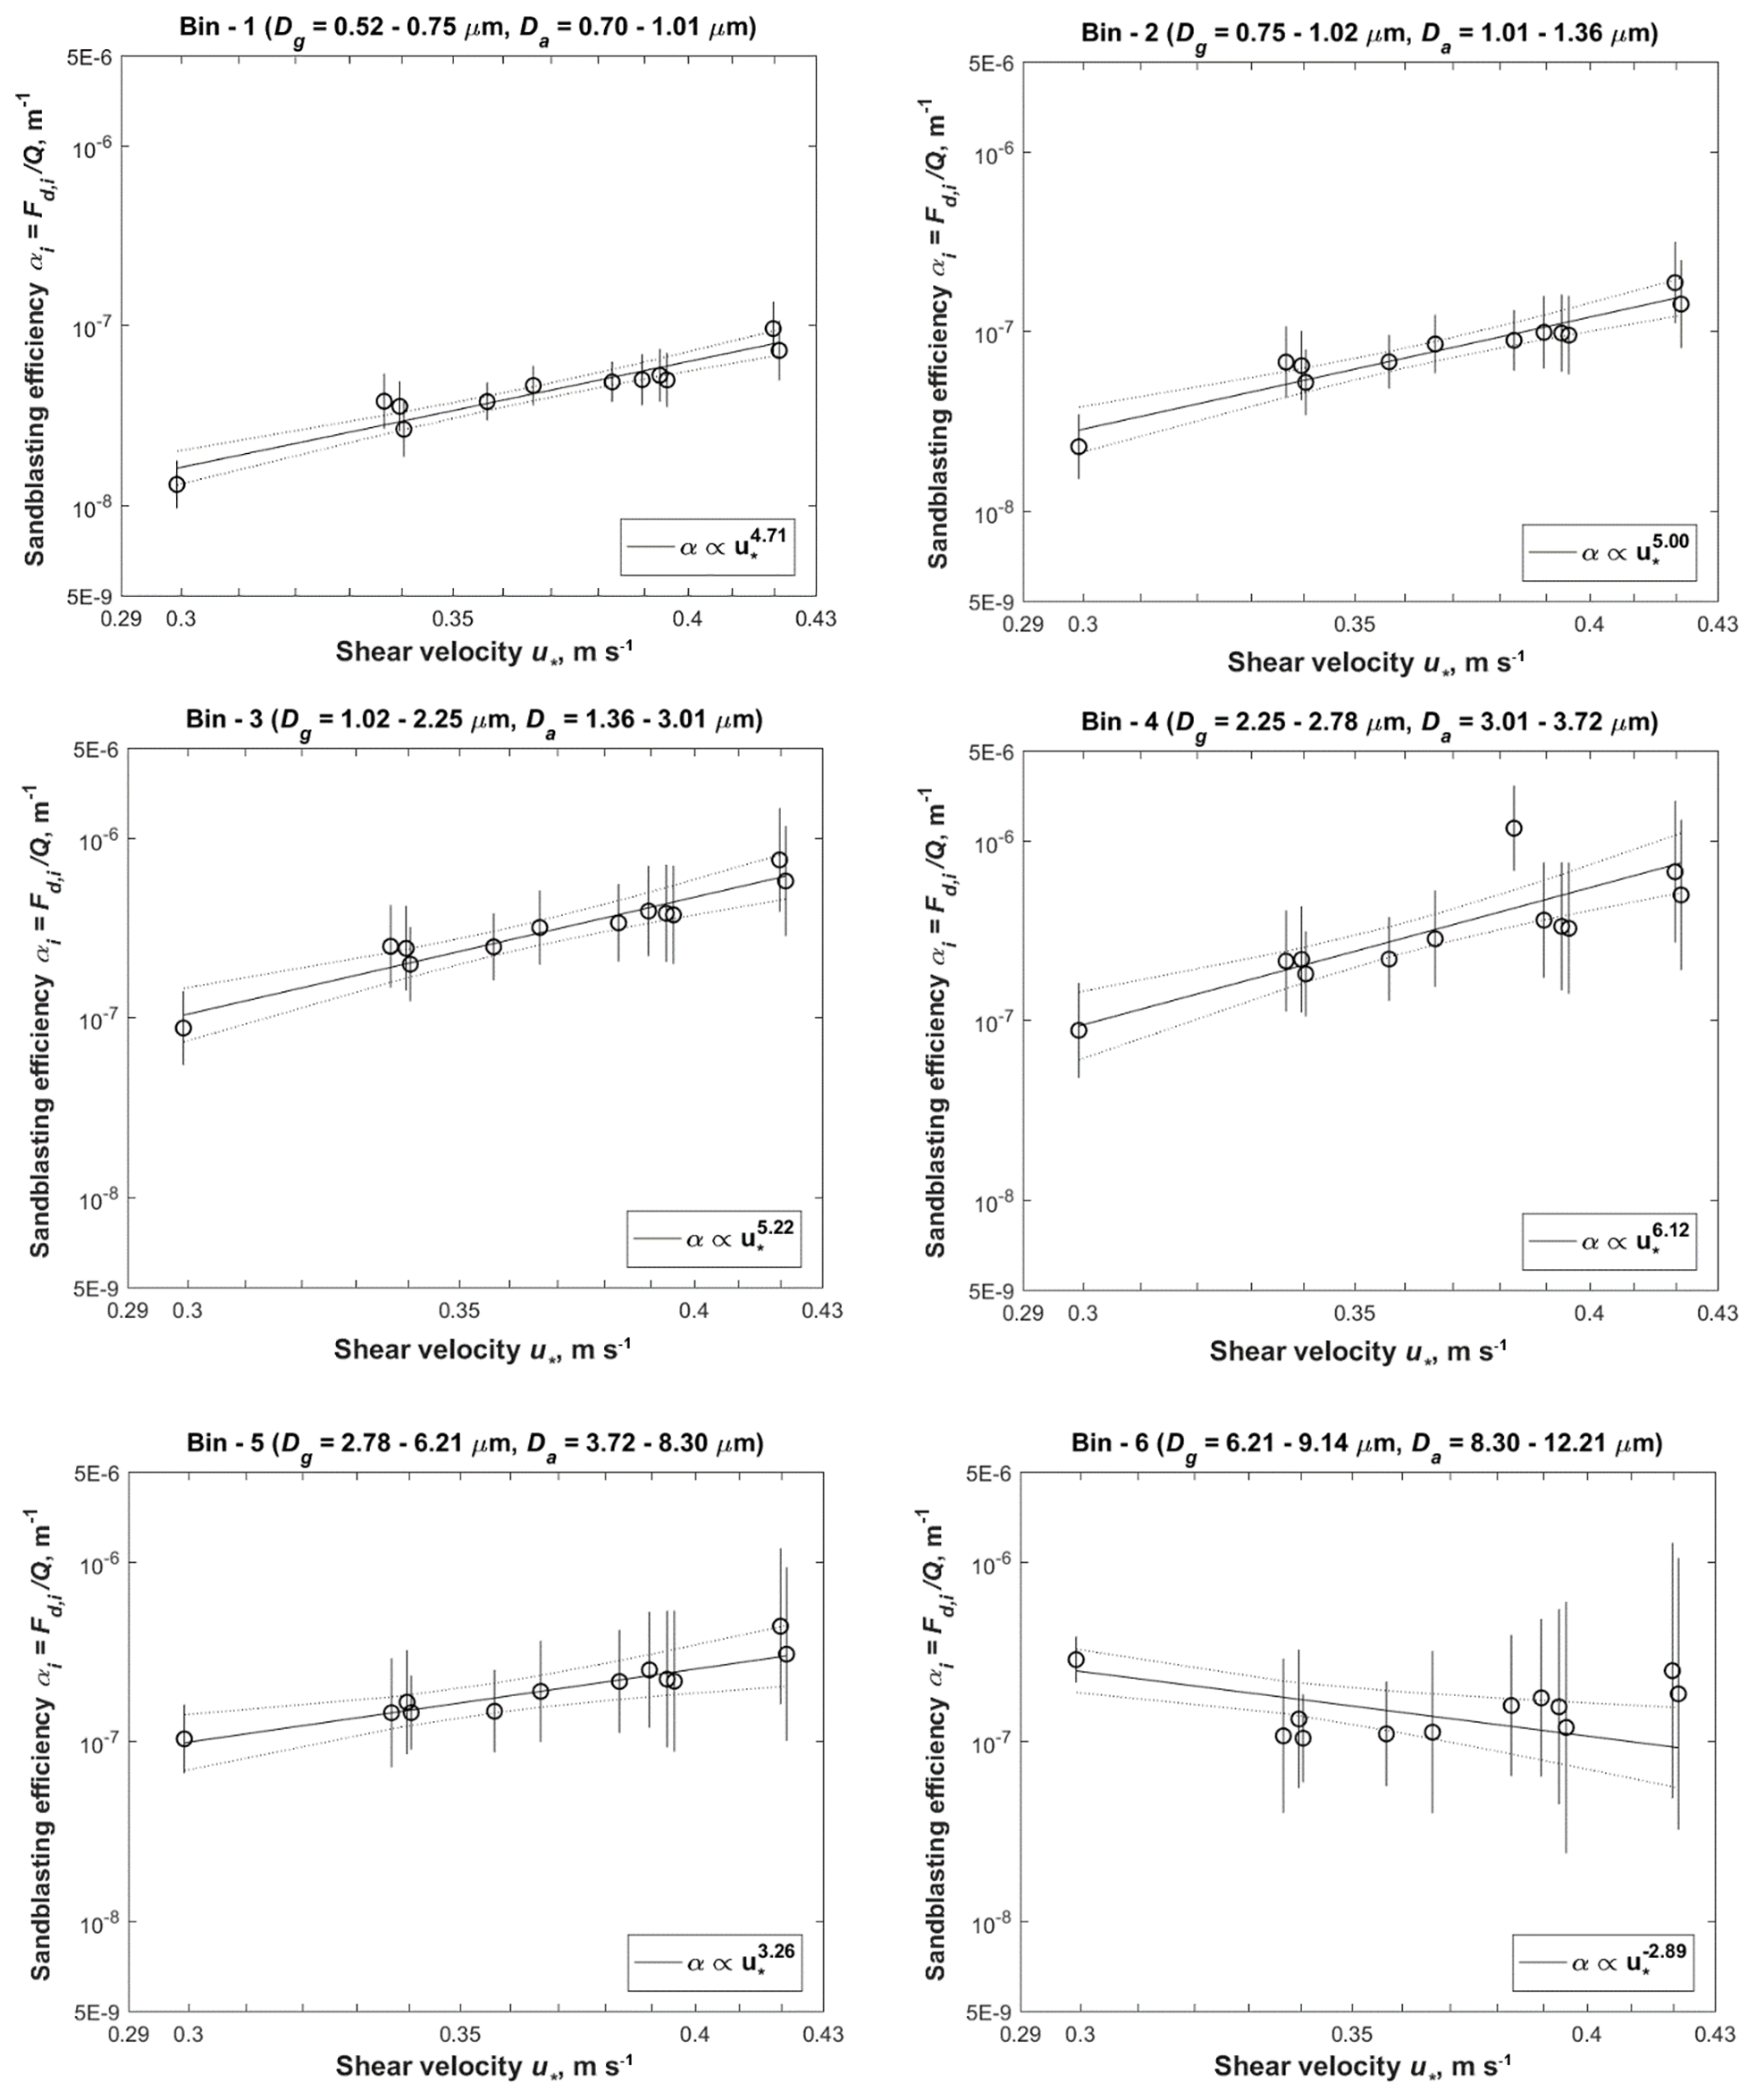
Figure 6The sandblasting efficiency αi (m−1) of the six size bins at Oceano as a function of shear velocity. The linear-least-squares fit (black line) indicates that αi varies as a power law in shear velocity with an exponent of 4.71±0.97, 5.00±1.37, 5.22±1.63, 6.12±2.11, 3.26±1.90, and for the six respective size bins. Error bars were obtained by propagating errors from the sensor intercalibration process, the regression used in the gradient method, and the subtraction of the sea-salt deposition flux (see Supplement). The two dotted black lines denote the 95 % confidence range of the fit. The geometric and the aerodynamic diameter ranges of the vertical dust mass flux Fd,i are noted at the top of each of the six plots, and Q is the total horizontal sand flux integrated over all sand grain sizes (Martin et al., 2018).
Our results further indicate that Oceano sand differs from the sand of typical active sand dunes in its mineralogy, specifically in the content of feldspars. Oceano sands contain as much as ∼46 % feldspar by mass (Table 2). This content is approximately twice the proportion of feldspar found in coastal dunes along Monterey Bay to the north (Combellick and Osborne, 1977) and more than 3 times as much as in coastal dunes in Baja California to the south (Kasper-Zubillaga et al., 2007). This mineralogically immature sand suggests rapid erosion of a feldspar-rich source rock, potentially derived from the Santa Maria River drainage. More mineralogically mature terrestrial dune fields, including most old and continentally based (as opposed to coastal) terrestrial desert sand seas and some older coastal dunes, are quartz-dominated and feldspar-depleted (McKee, 1983; Pye and Tsoar, 2009; Swet et al., 2019). The removal of feldspars by ballistic-impact-derived breakdown into dust during aeolian recycling over long periods of time contributes to the mineralogical maturation (into quartz-dominated deposits) of aeolian dune sands (Muhs et al., 1997; Muhs, 2004).
Furthermore, weathering of feldspars to clay minerals might produce some of the clay-mineral coatings on sand grains (O'Hara-Dhand et al., 2010) at the study site. Feldspars in the Oceano sand, especially plagioclase, are vulnerable to chemical weathering under the humid and salt-bearing coastal conditions (James et al., 1981; Pye and Tsoar, 2009) and mechanical breakdown (aeolian abrasion) into dust from saltator impacts in wind events (Muhs et al., 1997). Additionally, Compton (1991) described how the Santa Maria basin source sediments, both onshore and offshore, contained very fine clays derived from the alteration of volcanic glass mediated by and enhanced by weathering of feldspars. As a result, the combination of abundant feldspars in the Oceano sand and clay minerals from an additional source could help explain the observed clay-mineral coatings on Oceano sand and the fine-grained characteristics of Oceano dust emissions.
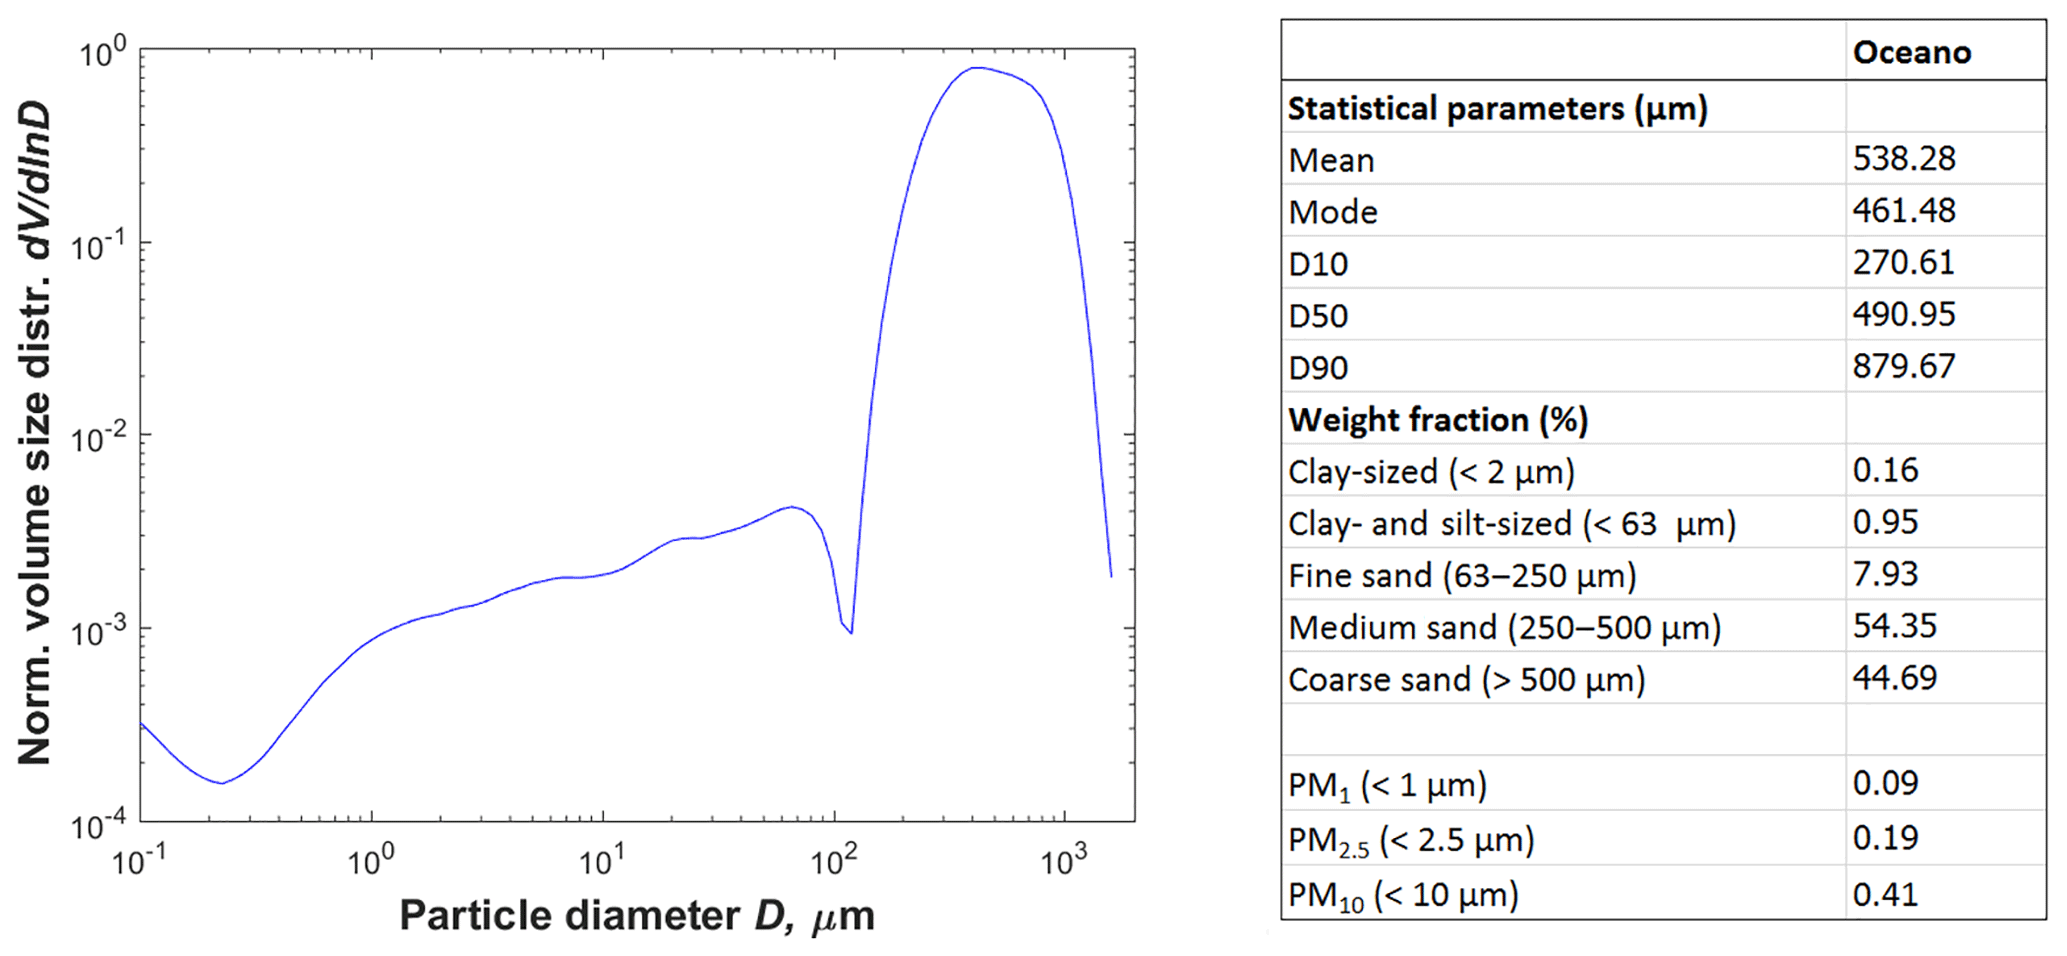
Figure 7Normalized volume particle size distribution (PSD) of sand samples collected from the Oceano field site. Statistical parameters of the PSD are reported in the table to the right. D10, D50, and D90 refer to cut-off diameters of the 10th, 50th, and 90th percentile of sample grains by mass, respectively. Note that the values are averages of four samples with two collected from the tower location and two from 100 m upwind.
Our results also imply that the dust emission processes at Oceano are not main contributors to dust emissions from North Africa. In situ measurements of the PSDs of atmospheric dust over North Africa are significantly coarser than the PSD of dust emitted from our Oceano site (Fig. 3b) and the PSD of dust generated in laboratory experiments on the removal of clay-mineral coatings (Fig. S10b; Bullard et al., 2004, 2007). As such, although the processes responsible for dust emission from the Oceano sand sheet – removal of clay-mineral coatings and aeolian abrasion of feldspars – could be important for specific North African dust sources, they are likely not primary dust emission processes on a regional scale in North Africa.
4.3 Implications of dust emissions from the Oceano Dunes State Vehicular Recreation Area for downwind human health, park management, the hydrological cycle, and climate
Dust emitted from our Oceano site is significantly finer than dust emitted from non-sandy soils (Fig. 3a), which can amplify its impacts on downwind human health, the hydrological cycle, and climate. Fine dust has a longer lifetime and therefore is usually transported over longer distances than coarse dust (Mahowald et al., 2014). Furthermore, fine dust, especially within the PM2.5,a size range, is associated with cardiopulmonary diseases, lung cancer, and ischemic heart disease (Burnett et al., 2014). On a per mass basis, dust emitted from Oceano, and from other source regions with similar emission processes, can thus be expected to have greater risks to downwind human health than dust emitted from non-sandy soils.
Our measurements of dust emission from the Oceano Dunes State Vehicular Recreation Area (SVRA) could help inform decisions on the management of this California state park. Our measurements were performed in the part of the park where public off-highway-vehicle (OHV) use is prohibited, and we found that substantial dust emissions occur in the absence of OHV use (Fig. S1 in the Supplement). Because OHV use can enhance dust emissions (Goossens and Buck, 2011; Goossens et al., 2012), reconfiguring motorized access to the park could modify dust emissions and associated downwind dust impacts on human health, vegetation, and water quality (Ouren et al., 2007). Measurements by Gillies et al. (2017) (see their Fig. 10) indicated a positive relationship between airborne PM10 and wind speed in a section of the Oceano Dunes SVRA with vehicular activity; however, their measurements of riding area dust concentrations are not directly comparable to our calculated non-riding area dust emission fluxes. Disentangling the relative contributions of natural and OHV-influenced dust emissions will be essential as the Oceano Dunes SVRA responds to a dust emission abatement order recently approved by the local air pollution control district hearing board (Vaughan, 2018).
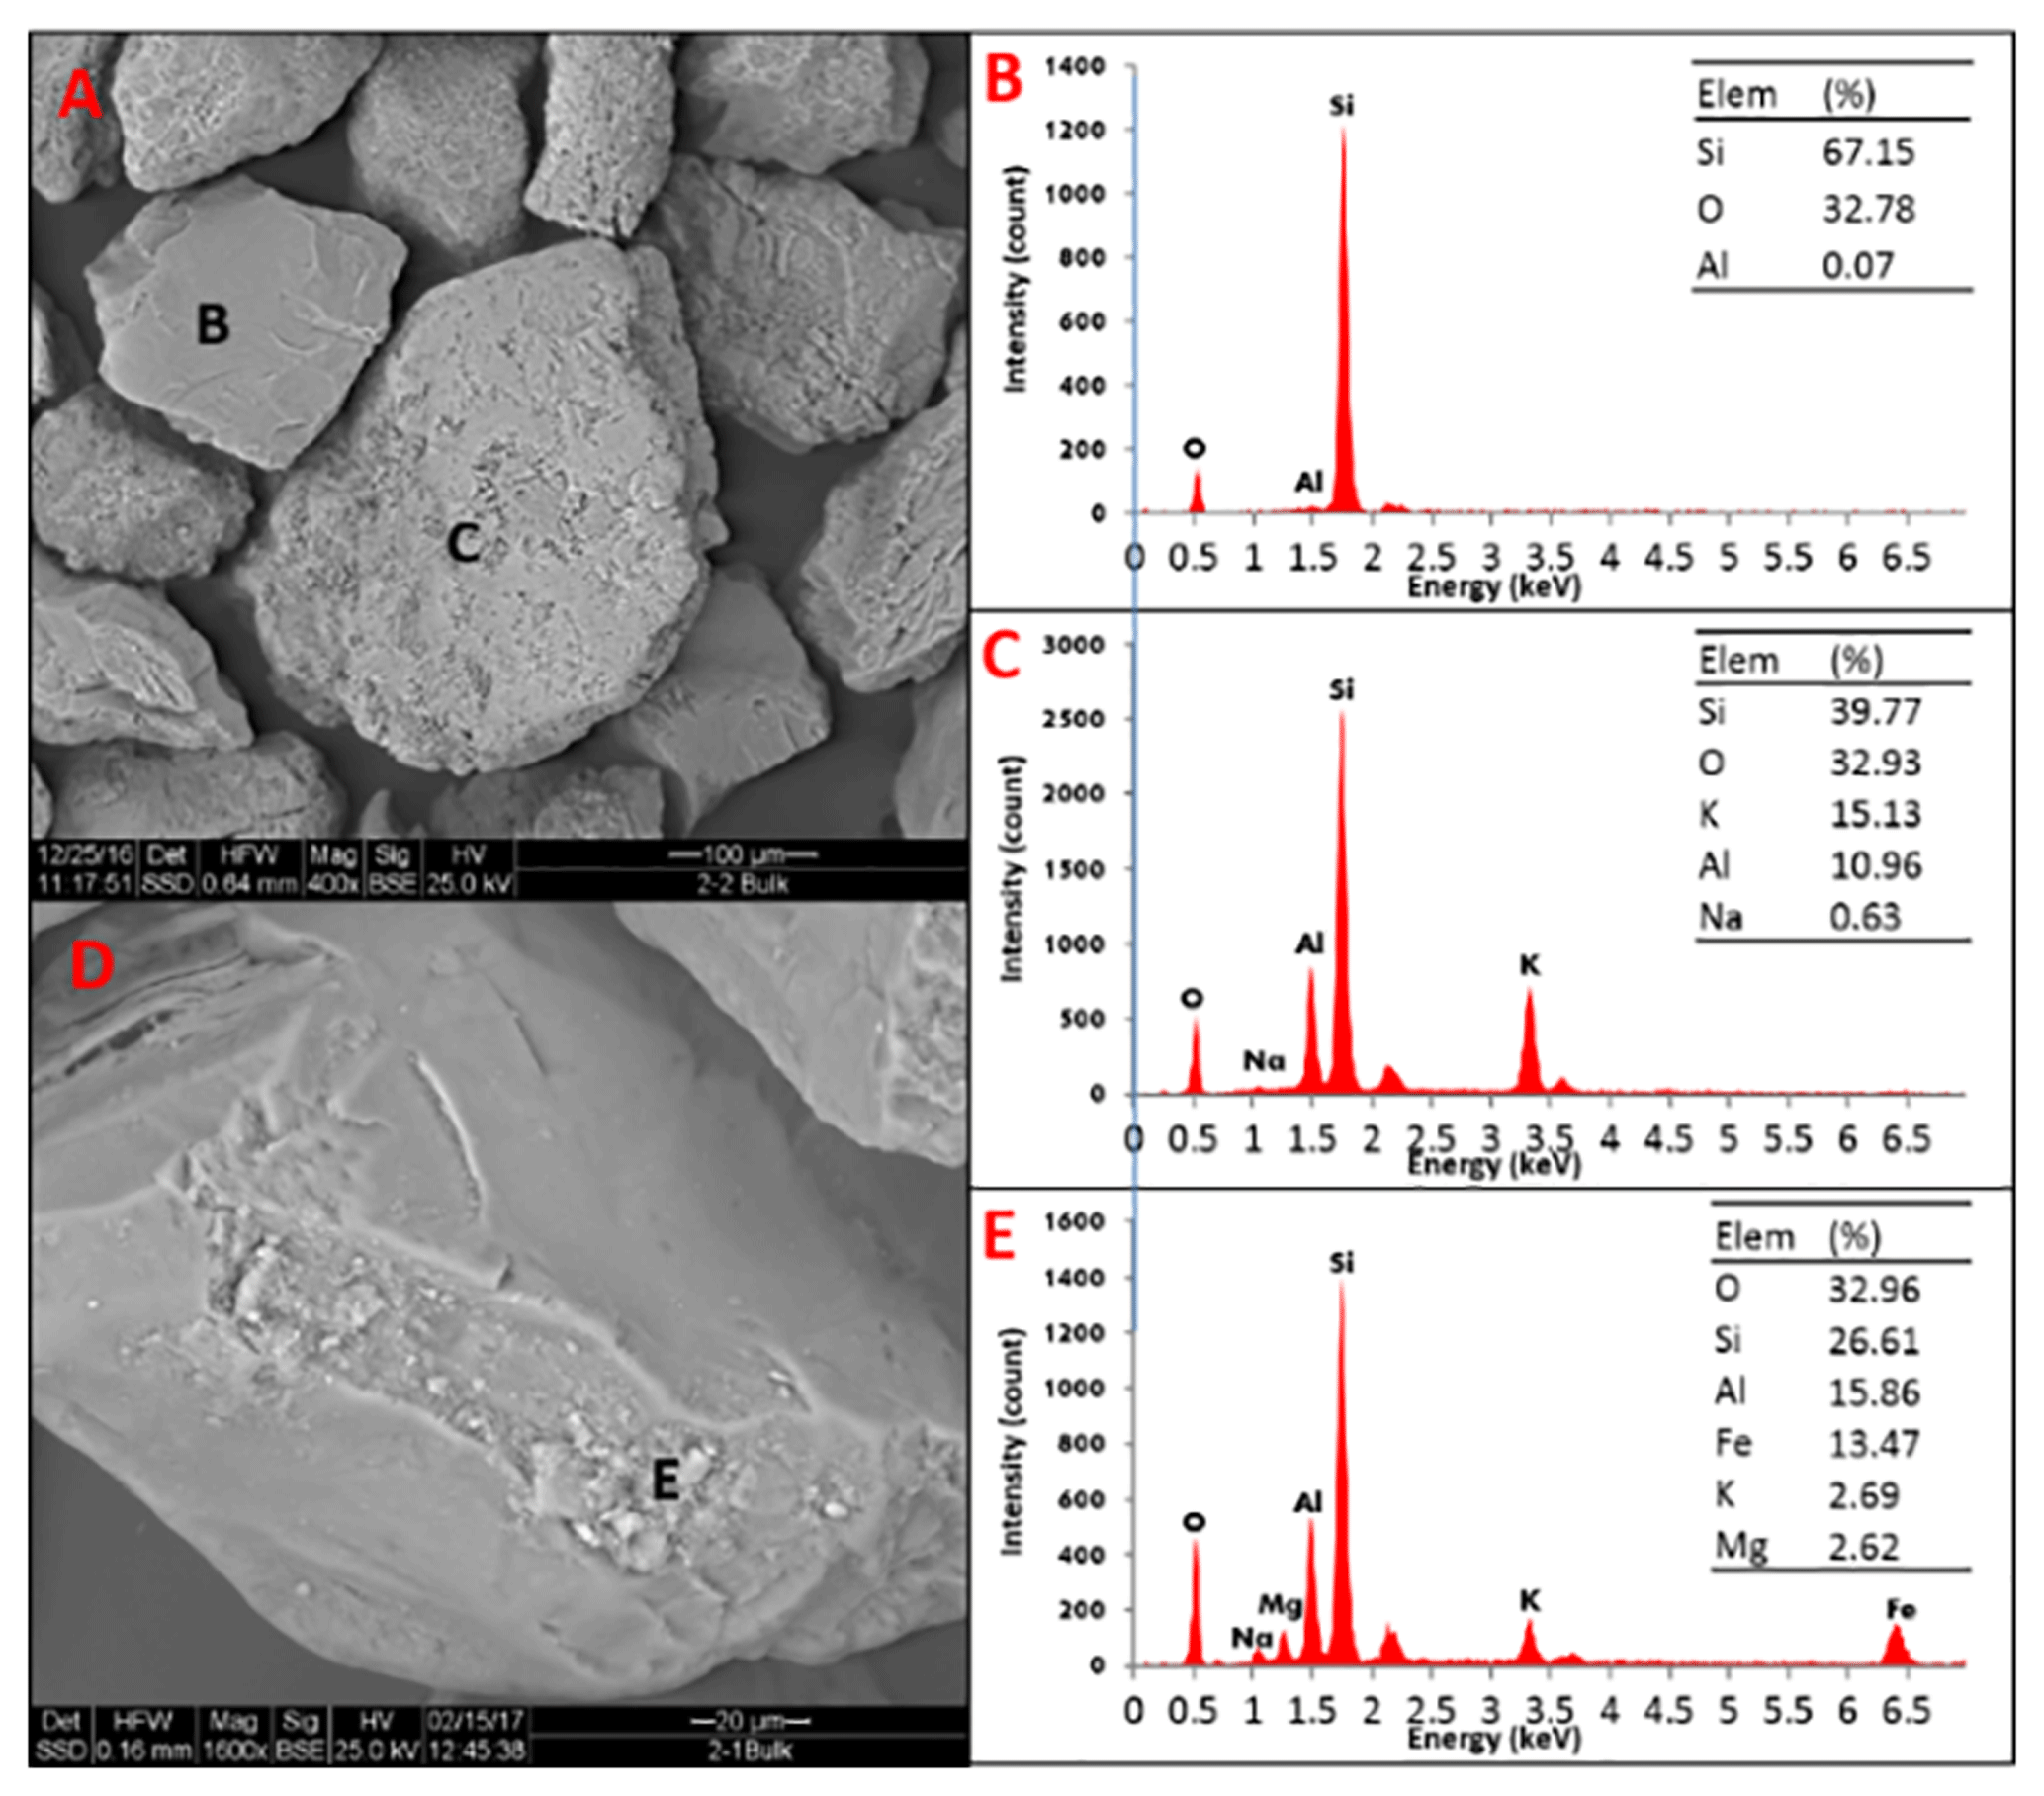
Figure 8(a) Scanning electron microscopy (SEM) image of an Oceano sand sample. (b) Energy dispersive X-ray spectroscopy (EDS) chemical composition (percentage by mass) of a quartz grain in (a) (the location of the analysis is marked by the black letter “B”). (c) EDS chemical composition of a K-rich feldspar in (a) marked by the black letter “C”. (d) Close-up image of a quartz sand grain with mineral coatings. (e) EDS chemical composition of the mineral coatings in (d) marked by the black letter “E”.
Dust emitted from Oceano sands possibly contains a large proportion of feldspars and thus might modify downwind cloud microphysics and hydrology. Oceano sand has ∼46 % feldspars by mass (Table 2), which is on the high end for dust-source regions (Murray et al., 2012; Atkinson et al., 2013). Consequently, the content of feldspars in dust emitted from Oceano is likely on the high end as well, especially considering that aeolian abrasion of feldspars (Muhs et al., 1997) could be one of the emission processes. Feldspars, especially K-rich feldspars, are considered the most important ice nuclei for mixed-phase clouds, based on both laboratory (Atkinson et al., 2013) and in situ measurements (Price et al., 2018). Recent observations suggest that cloud glaciation mediated by dust aerosols contributes to more than half of the ice-phase precipitation in the Sierra Nevada mountain range (Creamean et al., 2013), which is a major source of water for California residents (Dettinger et al., 2004). Because Oceano sands are rich in feldspars, we speculate that dust emitted from Oceano could potentially contribute to glaciating downwind clouds, thereby affecting precipitation in the Sierra Nevada region. Future measurements to determine the broader occurrence of dust production by feldspar abrasion for active sands with high feldspar content are thus clearly needed.
Our findings that dust emitted from Oceano sands is relatively fine, and that the dust flux is on the low end of that emitted from non-sandy soils, indicate the need for substantial further study to understand the role of dust emissions from active sands in past, current, and future climates. Partially because fine dust has a longer lifetime and larger surface area per unit mass than coarse dust (Mahowald et al., 2014), it produces a substantial cooling radiative effect (Kok et al., 2017). Therefore, it is important to include size-resolved dust emission in climate studies. However, the parameterization of dust emissions from active sands in climate models is difficult because of a scarcity of measurements of dust emissions from active sands. Although our measurements help to fill this gap, it remains unclear how representative our measured fine dust emissions from coastal Oceano sands are for typical active sands. Therefore, there is a clear need for future investigations of dust emissions from active sands for a range of geomorphological and sand properties, including grain size distribution, mineralogy (such as extents of clay-mineral coatings and feldspars), chemical and physical weathering rates, dune type, and palaeoenvironmental history.
A further complication in representing the role of dust emissions from active sands in climate models is that sand dunes can transition between stable and active states in past, current, and future climates. Many stable dunes have accumulated extensive clay-mineral coatings (Bowler, 1973; Gardner and Pye, 1981; Muhs et al., 1997), and, if activated, these dunes could possibly produce substantial fine dust emissions through sandblasting-induced removal of clay-mineral coatings (Fig. S10 in the Supplement; Bullard et al., 2007; Swet et al., 2019). The transition from stable to active sand dunes can be triggered by increases in wind speed or decreases in vegetation coverage, which in turn can be caused by decreased precipitation or by human activities, such as grazing and land-use change (Ashkenazy et al., 2012). Areas with coexisting active and stable sand dunes, such as coastal zones, are especially vulnerable to the reactivation of stable sand dunes (Yizhaq et al., 2009) and could thus become potent dust emission sources, especially if the dunes experienced some weathering in the humid, salt-rich coastal environment (Muhs et al., 1997). Because active sands are generally not represented as dust emission sources in climate models, reactivation of sand dunes might thus enhance future dust effects on climate beyond what current models simulate (Kok et al., 2018).
4.4 Limitations of the methodology
Our methodology has important limitations. First, our XRPD analysis could not distinguish the concentrations of clay-mineral coatings from loose individual fine particles contained in the pore spaces between sand grains. This uncertainty limits our interpretation of the relative contributions of removal of clay-mineral coatings and saltation-driven release of loose fines to our measured dust fluxes. Second, we did not collect aeolian dust samples simultaneously with the field measurements. Instead, we collected soil samples on 14 October 2016, more than a year after the field measurements in the summer of 2015, such that it is possible that these samples are not representative of the sand surfaces at the time of our field campaign. However, sand-surface properties over a large area are unlikely to change substantially within a timescale of 1 year (Hillel, 1998). Third, we approximated dust as spherical particles when correcting the OPC bin sizes, although dust is highly aspherical (Okada et al., 2001; Kandler et al., 2007). Because OPC measurements use side-scattered light to determine dust size, which remains poorly understood (Nousiainen and Kandler, 2015), we followed past work (Sow et al., 2009; Rosenberg et al., 2014; Ryder et al., 2018) in approximating dust as spheres. Fourth, we did not quantify the effect on the measured PSD due to the dependence of the sampling efficiency on particle size and wind speed (Von der Weiden et al., 2009), which might be important especially for the largest particle bin (bin 6), as suggested by the decrease in sandblasting efficiency with shear velocity for this bin, which contrasts with the increase with shear velocity for the smaller particle bins. Therefore, it is possible that the PSD of emitted dust (Fig. 4) remains invariant with shear velocity.
We presented the first (to our knowledge) in situ field measurements of dust emissions under natural saltation from an active sand sheet at the coastal Oceano Dunes in California (Fig. 1 and Fig. S1 in the Supplement). We found that although the PM10,g dust emitted from Oceano is on the low end of the range in emissions produced by non-sandy soils for similar wind speed (Fig. 2a), it is also substantially finer (Fig. 3a) such that the PM2.5,a flux is comparable in magnitude to dust emitted from non-sandy soils (Fig. 2b). As fine dust has a longer atmospheric lifetime, is associated with adverse impacts on human health, and produces a cooling radiative effect, dust emissions from Oceano could impact downwind climate and human health.
Our results provide insights into the physical processes that drive dust emissions from the sand sheet at Oceano Dunes. We found that Oceano sand has substantial clay-mineral coatings and feldspars (Table 2), suggesting that dust is emitted through a combination of removal of clay-mineral coatings, release of resident fines, and ballistic breakdown of feldspars by saltation impacts. As feldspars are the most efficient ice nuclei for mixed-phase clouds, we speculate that dust emitted from Oceano could potentially contribute to glaciating downwind clouds, thereby affecting precipitation in the Sierra Nevada region.
Our measurements provide limited insights into the contribution of active sands to the global dust cycle. We found that the PSD of dust emitted from Oceano is much finer than that observed in situ over North Africa (Fig. 3b). Therefore, although the processes responsible for dust emission at our Oceano site – removal of clay-mineral coatings and aeolian abrasion of feldspars – could be important for specific North African dust sources, they are likely not primary dust emission processes on a regional scale in North Africa. However, because it is unclear how representative the dust emission processes at our Oceano site are for emission processes occurring at typical active sands, the contributions of active sands to dust emission from North Africa and other globally important source regions remain uncertain. Further work on dust emissions from active sands with various properties (sand size distribution, mineralogy, chemical and physical weathering rates, dune type, and palaeoenvironmental history) is thus needed to evaluate the contribution of active sands to the global dust cycle.
Data used for this paper are publicly accessible and can be found on the Zenodo data depository at https://zenodo.org/record/2573973 (last access: 27 February 2019).
The supplement related to this article is available online at: https://doi.org/10.5194/acp-19-2947-2019-supplement.
YH collected soil samples, analyzed field campaign data, and wrote the manuscript. JFK designed and supervised the project. RLM designed the field campaign, helped collect soil samples, and provided advice on programming codes and SVRA OHVs. NS and IK analyzed soil samples and provided results of soil properties. TEG helped analyze soil samples and offered insights into the formations of feldspars and clay-mineral coatings. RLR offered helpful discussions about SVRA OHVs and feldspar formation. LSF helped design the field campaign and dust data collection. All authors commented on the manuscript.
The authors declare that they have no conflict of interest.
We acknowledge support from the National Science Foundation
(NSF) grants AGS-1358621 and AGS-1552519 to
Jasper F. Kok, NSF Postdoctoral Fellowship EAR-1249918 to Raleigh L. Martin,
United States–Israel Binational Science Foundation (BSF) grant 2014178 to
Jasper F. Kok and Itzhak Katra, National Oceanic and Atmospheric
Administration (NOAA, US Department of Commerce) Educational Partnership
Program agreement no. NA16SEC4810006 to Thomas E. Gill, and Brazilian
National Council for Scientific and Technological Development (CNPq)
fellowship to Livia S. Freire. We thank Hezi Yizhaq, Marcelo Chamecki,
Francis A. Turney, Jack A. Gillies, Richard P. Langford, and Cenlin He for
helpful comments and discussions. We thank Peter Rowland and Tim Pesce at the
Oceano Dunes State Vehicular Recreation Area for access and transportation
support to the Oceano field site. We also thank Vicken Etyemezian and an
anonymous reviewer for constructive comments and suggestions that improved the quality
and clarity of our paper.
Edited by: Sachin S.
Gunthe
Reviewed by: Vicken Etyemezian and one anonymous
referee
Alfaro, S. C. and Gomes, L.: Modeling mineral aerosol production by wind erosion: Emission intensities and aerosol size distributions in source areas, J. Geophys. Res.-Atmos., 106, 18075–18084, https://doi.org/10.1029/2000JD900339, 2001.
Andreas, E. L., Claffey, K. J., Jordan, R. E., Fairall, C. W., Guest, P. S., Persson, P. O. G., and Grachev, A. A.: Evaluations of the von Kármán constant in the atmospheric surface layer, J. Fluid Mech., 559, 117–149, https://doi.org/10.1017/S0022112006000164, 2006.
Ashkenazy, Y., Yizhaq, H., and Tsoar, H.: Sand dune mobility under climate change in the Kalahari and Australian deserts, Clim. Change, 112, 901–923, https://doi.org/10.1007/s10584-011-0264-9, 2012.
Atkinson, J. D., Murray, B. J., Woodhouse, M. T., Whale, T. F., Baustian, K. J., Carslaw, K. S., Dobbie, S., O'Sullivan, D., and Malkin, T. L.: The importance of feldspar for ice nucleation by mineral dust in mixed-phase clouds, Nature, 498, 355–358, https://doi.org/10.1038/nature12278, 2013.
Baddock, M. C., Gill, T. E., Bullard, J. E., Acosta, M. D., and Rivera Rivera, N. I.: Geomorphology of the Chihuahuan Desert based on potential dust emissions, J. Maps, 7, 249–259, https://doi.org/10.4113/jom.2011.1178, 2011.
Barchyn, T. E., Hugenholtz, C. H., Li, B., Neuman, C. M., and Steven Sanderson, R.: From particle counts to flux: Wind tunnel testing and calibration of the “Wenglor” aeolian sediment transport sensor, Aeolian Res., 15, 311–318, https://doi.org/10.1016/j.aeolia.2014.06.009, 2014.
Bohren, C. F. and Huffman, D. R.: Absorption and scattering of light by small particles, 1st ed., Wiley-VCH, 503 pp., 1983.
Bowler, J. M.: Clay dunes: Their occurrence, formation and environmental significance, Earth Sci. Rev., 9, 315–338, https://doi.org/10.1016/0012-8252(73)90001-9, 1973.
Bullard, J. E., Harrison, S. P., Baddock, M. C., Drake, N., Gill, T. E., McTainsh, G., and Sun, Y.: Preferential dust sources: A geomorphological classification designed for use in global dust-cycle models, J. Geophys. Res.-Earth, 116, F04034, https://doi.org/10.1029/2011JF002061, 2011.
Bullard, J. E., McTainsh, G. H., and Pudmenzky, C.: Factors affecting the nature and rate of dust production from natural dune sands, Sedimentology, 54, 169–182, https://doi.org/10.1111/j.1365-3091.2006.00827.x, 2007.
Bullard, J. E., McTainsh, G. H., and Pudmenzky, C.: Aeolian abrasion and modes of fine particle production from natural red dune sands: an experimental study, Sedimentology, 51, 1103–1125, https://doi.org/10.1111/j.1365-3091.2004.00662.x, 2004.
Burnett, R. T., Pope, C. A,, Ezzati, M., Olives, C., Lim, S. S., Mehta, S., Shin, H. H., Singh, G., Hubbell, B., Brauer, M., Anderson, H. R., Smith, K. R., Balmes, J. R., Bruce, N. G., Kan, H., Laden, F., Prüss-Ustün, A., Turner, M. C., Gapstur, S. M., Diver, W. R., and Cohen, A.: An integrated risk function for estimating the global burden of disease attributable to ambient fine particulate matter exposure, Environ. Health Perspect., 122, 397–403, https://doi.org/10.1289/ehp.1307049, 2014.
Chou, C., Formenti, P., Maille, M., Ausset, P., Helas, G., Harrison, M., and Osborne, S.: Size distribution, shape, and composition of mineral dust aerosols collected during the African Monsoon Multidisciplinary Analysis Special Observation Period 0: Dust and Biomass-Burning Experiment field campaign in Niger, January 2006, J. Geophys. Res.-Atmos., 113, D00C10, https://doi.org/10.1029/2008JD009897, 2008.
Combellick, R. A. and Osborne, R. H.: Sources and petrology of beach sand from southern Monterey Bay, California, J. Sediment. Petrol., 47, 891–907, 1977.
Compton, J. S.: Origin and diagenesis of clay minerals in the Monterey Formation, Santa Maria Basin Area, California, Clays Clay Miner., 39, 449–466, https://doi.org/10.1346/CCMN.1991.0390501, 1991.
Cooper, W. S.: Coastal dunes of California, Geol. Soc. Am. Mem., 104, 1–131, 1967.
Creamean, J. M., Suski, K. J., Rosenfeld, D., Cazorla, A., DeMott, P. J., Sullivan, R. C., White, A. B., Ralph, F., Minnis, P., Comstock, J. M., Tomlinson, J. M., and Prather, K. A.: Dust and Biological Aerosols from the Sahara and Asia Influence Precipitation in the Western U.S., Science, 339, 1572–1578, https://doi.org/10.1126/science.1227279, 2013.
Crouvi, O., Schepanski, K., Amit, R., Gillespie, A. R., and Enzel, Y.: Multiple dust sources in the Sahara Desert: The importance of sand dunes, Geophys. Res. Lett., 39, L13401, https://doi.org/10.1029/2012GL052145, 2012.
DeMott, P. J., Prenni, A. J., McMeeking, G. R., Sullivan, R. C., Petters, M. D., Tobo, Y., Niemand, M., Möhler, O., Snider, J. R., Wang, Z., and Kreidenweis, S. M.: Integrating laboratory and field data to quantify the immersion freezing ice nucleation activity of mineral dust particles, Atmos. Chem. Phys., 15, 393–409, https://doi.org/10.5194/acp-15-393-2015, 2015.
Dettinger, M. D., Cayan, D. R., Meyer, M. K., and Jeton, A.: Simulated hydrologic responses to climate variations and change in the Merced, Carson, and American River basins, Sierra Nevada, California, 1900–2099, Clim. Change, 62, 283–317, https://doi.org/10.1023/B:CLIM.0000013683.13346.4f, 2004.
Domingo, R. A., Southard, R. J., and Lee, K.: Laboratory System for Dust Generation from Soils, J. Environ. Qual., 39, 1254–1261, https://doi.org/10.2134/jeq2008.0380, 2010.
Dueker, M. E., Weathers, K. C., O'Mullan, G. D., Juhl, A. R., and Uriarte, M.: Environmental Controls on Coastal Coarse Aerosols: Implications for Microbial Content and Deposition in the Near-Shore Environment, Environ. Sci. Technol., 45, 3386–3392, https://doi.org/10.1021/es1035128, 2011.
Dutta, P. K., Zhou, Z., and dos Santos, P. R.: A theoretical study of mineralogical maturation of eolian sand, Geol. Soc. Am. Spec. Pap., 284, 203–209, 1993.
Engelstaedter, S., Tegen, I., and Washington, R.: North African dust emissions and transport, Earth-Science Rev., 79, 73–100, https://doi.org/10.1016/j.earscirev.2006.06.004, 2006.
Evan, A. T., Fiedler, S., Zhao, C., Menut, L., Schepanski, K., Flamant, C., and Doherty, O.: Derivation of an observation-based map of North African dust emission, Aeolian Res., 16, 153–162, https://doi.org/10.1016/j.aeolia.2015.01.001, 2015.
Feng, J.-L., Zhu, L.-P., Ju, J.-T., Zhou, L.-P., Zhen, X.-L., Zhang, W., and Shao-Peng, G.: Heavy dust fall in Beijing on April 16–17, 2006: geochemical properties and indications of the dust provenance, Geochem. J., 42, 221–236, https://doi.org/10.2343/geochemj.42.221, 2008.
Fratini, G., Ciccioli, P., Febo, A., Forgione, A., and Valentini, R.: Size-segregated fluxes of mineral dust from a desert area of northern China by eddy covariance, Atmos. Chem. Phys., 7, 2839–2854, https://doi.org/10.5194/acp-7-2839-2007, 2007.
Fryrear, D.: A field dust sampler, J. Soil Water Conserv., 41, 117–120, 1986.
Gardner, R. and Pye, K.: Nature, origin and palaeoenvironmental significance of red coastal and desert dune sands, Prog. Phys. Geogr., 5, 514–534, https://doi.org/10.1177/030913338100500402, 1981.
Gillette, D., Blifford Jr., I., and Fryrear, D.: The influence of wind velocity on the size distributions of aerosols generated by the wind erosion of soils, J. Geophys. Res., 79, 4068–4075, https://doi.org/10.1029/JC079i027p04068, 1974.
Gillette, D. A.: On the production of soil wind erosion aerosols having the potential for long range transport, J. Rech. Atmos., 8, 734–744, 1974.
Gillette, D. A., Blifford, I. H., and Fenster, C. R.: Measurements of aerosol size distributions and vertical fluxes of aerosols on land subject to wind erosion, J. Appl. Meteorol. Climatol., 11, 977–987, https://doi.org/10.1175/1520-0450(1972)011<0977:MOASDA>2.0.CO;2, 1972.
Gillies, J. A., Etyemezian, V., Nikolich, G., Glick, R., Rowland, P., Pesce, T., and Skinner, M.: Effectiveness of an array of porous fences to reduce sand flux: Oceano Dunes, Oceano CA, J. Wind Eng. Ind. Aerodyn., 168, 247–259, https://doi.org/10.1016/j.jweia.2017.06.015, 2017.
Gillies, J. A. and Berkofsky, L.: Eolian suspension above the saltation layer, the concentration profile, J. Sediment. Res., 74, 176–183, https://doi.org/10.1306/091303740176, 2004.
Ginoux, P., Chin, M., Tegen, I., Prospero, J. M., Holben, B., Dubovik, O., and Lin, S.-J.: Sources and distributions of dust aerosols simulated with the GOCART model, J. Geophys. Res.-Atmos., 106, 20255–20273, https://doi.org/10.1029/2000JD000053, 2001.
Goossens, D., Buck, B., and McLaurin, B.: Contributions to atmospheric dust production of natural and anthropogenic emissions in a recreational area designated for off-road vehicular activity (Nellis Dunes, Nevada, USA), J. Arid Environ., 78, 80–99, https://doi.org/10.1016/j.jaridenv.2011.10.015, 2012.
Goossens, D. and Buck, B.: Effects of wind erosion, off-road vehicular activity, atmospheric conditions and the proximity of a metropolitan area on PM10 characteristics in a recreational site, Atmos. Environ., 45, 94–107, https://doi.org/10.1016/j.atmosenv.2010.09.046, 2011.
Goossens, D., Offer, Z., and London, G.: Wind tunnel and field calibration of five aeolian sand traps, Geomorphology, 35, 233–252, https://doi.org/10.1016/S0169-555X(00)00041-6, 2000.
Gualtieri, A.: Modal analysis of pyroclastic rocks by combined Rietveld and RIR methods, Powder Diffr., 11, 97–106, https://doi.org/10.1017/S0885715600009052, 1996.
Gualtieri, A. F.: Accuracy of XRPD QPA using the combined Rietveld-RIR method, J. Appl. Crystallogr., 33, 267–278, https://doi.org/10.1107/S002188989901643X, 2000.
Hillel, D.: Environmental soil physics, 1st ed., Academic Press, San Diego, 771 pp., 1998.
Hinds, W. C.: Aerosol technology: properties, behavior, and measurement of airborne particles, 2nd ed., Wiley-Interscience, 504 pp., 1999.
Huneeus, N., Schulz, M., Balkanski, Y., Griesfeller, J., Prospero, J., Kinne, S., Bauer, S., Boucher, O., Chin, M., Dentener, F., Diehl, T., Easter, R., Fillmore, D., Ghan, S., Ginoux, P., Grini, A., Horowitz, L., Koch, D., Krol, M. C., Landing, W., Liu, X., Mahowald, N., Miller, R., Morcrette, J.-J., Myhre, G., Penner, J., Perlwitz, J., Stier, P., Takemura, T., and Zender, C. S.: Global dust model intercomparison in AeroCom phase I, Atmos. Chem. Phys., 11, 7781–7816, https://doi.org/10.5194/acp-11-7781-2011, 2011.
ISO: Determination of particle size distribution: single particle light interaction methods, part 1: Light scattering aerosol spectrometer, ISO 21501-1, 2009.
Ito, A. and Kok, J. F.: Do dust emissions from sparsely vegetated regions dominate atmospheric iron supply to the Southern Ocean?, J. Geophys. Res.-Atmos., 122, 3987–4002, https://doi.org/10.1002/2016JD025939, 2017.
James, W. C., Mack, G. H., and Suttner, L. J.: Relative alteration of microcline and sodic plagioclase in semi-arid and humid climates, J. Sediment. Petrol., 51, 151–163, 1981.
Jari, M.: Effects of grinding and chemical factors on the generation and composition of the till fine fraction: an experimental study, J. Geochemical Explor., 54, 49–62, https://doi.org/10.1016/0375-6742(95)00008-D, 1995.
Jerolmack, D. J. and Brzinski, T. A.: Equivalence of abrupt grain-size transitions in alluvial rivers and eolian sand seas: A hypothesis, Geology, 38, 719–722, https://doi.org/10.1130/G30922.1, 2010.
Jerolmack, D. J., Reitz, M. D., and Martin, R. L.: Sorting out abrasion in a gypsum dune field, J. Geophys. Res. Earth Surf., 116, F02003, https://doi.org/10.1029/2010JF001821, 2011.
Kandler, K., Benker, N., Bundke, U., Cuevas, E., Ebert, M., Knippertz, P., Rodríguez, S., Schütz, L., and Weinbruch, S.: Chemical composition and complex refractive index of Saharan Mineral Dust at Izaña, Tenerife (Spain) derived by electron microscopy, Atmos. Environ., 41, 8058–8074, https://doi.org/10.1016/j.atmosenv.2007.06.047, 2007.
Kasper-Zubillaga, J. J., Zolezzi-Ruíz, H., Carranza-Edwards, A., Girón-García, P., Ortiz-Zamora, G., and Palma, M.: Sedimentological, modal analysis and geochemical studies of desert and coastal dunes, Altar Desert, NW Mexico, Earth Surf. Process. Landforms, 32, 489–508, https://doi.org/10.1002/esp.1402, 2007.
Katra, I. and Yizhaq, H.: Intensity and degree of segregation in bimodal and multimodal grain size distributions, Aeolian Res., 27, 23–34, https://doi.org/10.1016/j.aeolia.2017.05.002, 2017.
Kind, R. J.: One-dimensional aeolian suspension above beds of loose particles – A new concentration-profile equation, Atmos. Environ., 26A, 927–931, https://doi.org/10.1016/0960-1686(92)90250-O, 1992.
Klose, M. and Shao, Y.: Stochastic parameterization of dust emission and application to convective atmospheric conditions, Atmos. Chem. Phys., 12, 7309–7320, https://doi.org/10.5194/acp-12-7309-2012, 2012.
Klute, E. A.: Methods of Soil Analysis. Part 1. Physical and Mineralogical Methods, 2nd ed., edited by: Dinauer, R. C., American Society of Agronomy, Inc., Soil Science Society of America, Inc., Madison, Wisconsin USA, 1358 pp., 1986.
Kok, J. F.: A scaling theory for the size distribution of emitted dust aerosols suggests climate models underestimate the size of the global dust cycle, P. Natl. Acad. Sci. USA, 108, 1016–1021, https://doi.org/10.1073/pnas.1014798108, 2011.
Kok, J. F., Parteli, E. J. R., Michaels, T. I., and Karam, D. B.: The physics of wind-blown sand and dust, Reports Prog. Phys., 75, https://doi.org/10.1088/0034-4885/75/10/106901, 2012.
Kok, J. F., Mahowald, N. M., Fratini, G., Gillies, J. A., Ishizuka, M., Leys, J. F., Mikami, M., Park, M. S., Park, S. U., Van Pelt, R. S., and Zobeck, T. M.: An improved dust emission model – Part 1: Model description and comparison against measurements, Atmos. Chem. Phys., 14, 13023–13041, https://doi.org/10.5194/acp-14-13023-2014, 2014a.
Kok, J. F., Albani, S., Mahowald, N. M., and Ward, D. S.: An improved dust emission model – Part 2: Evaluation in the Community Earth System Model, with implications for the use of dust source functions, Atmos. Chem. Phys., 14, 13043–13061, https://doi.org/10.5194/acp-14-13043-2014, 2014b.
Kok, J. F., Ridley, D. A., Zhou, Q., Miller, R. L., Zhao, C., Heald, C. L., Ward, D. S., Albani, S., and Haustein, K.: Smaller desert dust cooling effect estimated from analysis of dust size and abundance, Nat. Geosci., 10, 274–278, https://doi.org/10.1038/ngeo2912, 2017.
Kok, J. F., Ward, D. S., Mahowald, N. M., and Evan, A. T.: Global and regional importance of the direct dust-climate feedback, Nat. Commun., 9, 241, https://doi.org/10.1038/s41467-017-02620-y, 2018.
Kuenen, P. H.: Experimental abrasion 4: Eolian Action, J. Geol., 68, 427–449, https://doi.org/10.1086/626675, 1960.
Kuenen, P. H.: Origin of quartz silt, J. Sediment. Res., 39, 1631–1633, https://doi.org/10.1306/74D71ED3-2B21-11D7-8648000102C1865D, 1969.
Liang, T., Chamecki, M., and Yu, X.: Sea salt aerosol deposition in the coastal zone: A large eddy simulation study, Atmos. Res., 180, 119–127, https://doi.org/10.1016/j.atmosres.2016.05.019, 2016.
Liu, H., Peters, G., and Foken, T.: New equations for sonic temperature variance and buoyancy heat flux with an omnidirectional sonic anemometer, Boundary-Layer Meteorol., 100, 459–468, https://doi.org/10.1023/A:1019207031397, 2001.
Mahowald, N., Albani, S., Kok, J. F., Engelstaeder, S., Scanza, R., Ward, D. S., and Flanner, M. G.: The size distribution of desert dust aerosols and its impact on the Earth system, Aeolian Res., 15, 53–71, https://doi.org/10.1016/j.aeolia.2013.09.002, 2014.
Marticorena, B. and Bergametti, G.: Modeling the atmospheric dust cycle: 1. Design of a soil-derived dust emission scheme, J. Geophys. Res.-Atmos., 100, 16415–16430, https://doi.org/10.1029/95JD00690, 1995.
Martin, R. L. and Kok, J. F.: Wind-invariant saltation heights imply linear scaling of aeolian saltation flux with shear stress, Sci. Adv., 3, e1602569, https://doi.org/10.1126/sciadv.1602569, 2017.
Martin, R. L. and Kok, J. F.: Distinct Thresholds for the Initiation and Cessation of Aeolian Saltation From Field Measurements, J. Geophys. Res. Earth Surf., 123, 1546–1565, https://doi.org/10.1029/2017JF004416, 2018.
Martin, R. L., Kok, J. F., Hugenholtz, C. H., Barchyn, T. E., Chamecki, M., and Ellis, J. T.: High-frequency measurements of aeolian saltation flux: Field-based methodology and applications, Aeolian Res., 30, 97–114, https://doi.org/10.1016/j.aeolia.2017.12.003, 2018.
Mätzler, C.: MATLAB Functions for Mie Scattering and Absorption, IAP Res. Rep., version 2, 1–24, https://doi.org/10.1039/b811392k, 2002.
McConnell, C. L., Highwood, E. J., Coe, H., Formenti, P., Anderson, B., Osborne, S., Nava, S., Desboeufs, K., Chen, G., and Harrison, M. A. J.: Seasonal variations of the physical and optical characteristics of Saharan dust: Results from the Dust Outflow and Deposition to the Ocean (DODO) experiment, J. Geophys. Res.-Atmos., 113, D14S05, https://doi.org/10.1029/2007JD009606, 2008.
McKee, E. D.: Ancient sandstones considered to be eolian, US Geol. Surv. Prof. Pap., 1052, 189–238, 1979.
McKee, E. D.: Eolian Sand Bodies of the World, in: Eolian Sediments and Processes, edited by: Brookfield, M. E. and Ahlbrandt, T. S., 1st edn., Developments in Sedimentology, 38, 1–25, Elsevier, New York, https://doi.org/10.1016/S0070-4571(08)70785-4, 1983.
Miller, R. L., Cakmur, R. V., Perlwitz, J., Geogdzhayev, I. V., Ginoux, P., Koch, D., Kohfeld, K. E., Prigent, C., Ruedy, R., Schmidt, G. A., and Tegen, I.: Mineral dust aerosols in the NASA Goddard Institute for Space Sciences ModelE atmospheric general circulation model, J. Geophys. Res.-Atmos., 111, D06208, https://doi.org/10.1029/2005JD005796, 2006.
Miller, R. L., Tegen, I., and Perlwitz, J.: Surface radiative forcing by soil dust aerosols and the hydrologic cycle, J. Geophys. Res.-Atmos., 109, D04203, https://doi.org/10.1029/2003JD004085, 2004.
Moreno, T., Gibbons, W., Jones, T., and Richards, R.: The geology of ambient aerosols: characterising urban and rural/coastal silicate PM10−2.5 and PM2.5 using high-volume cascade collection and scanning electron microscopy, Atmos. Environ., 37, 4265–4276, https://doi.org/10.1016/S1352-2310(03)00534-X, 2003.
Muhs, D. R.: Mineralogical maturity in dunefields of North America, Africa and Australia, Geomorphology, 59, 247–269, https://doi.org/10.1016/j.geomorph.2003.07.020, 2004.
Muhs, D. R., Stafford, T. W., Swinehart, J. B., Cowherd, S. D., Mahan, S. A., Bush, C. A., Madole, R. F., and Maat, P. B.: Late Holocene eolian activity in the mineralogically mature Nebraska Sand Hills, Quat. Res., 48, 162–176, https://doi.org/10.1006/qres.1997.1913, 1997.
Murray, B. J., O'Sullivan, D., Atkinson, J. D., and Webb, M. E.: Ice nucleation by particles immersed in supercooled cloud droplets, Chem. Soc. Rev., 41, 6519, https://doi.org/10.1039/c2cs35200a, 2012.
Nesbitt, H. W., Fedo, C. M., and Young, G. M.: Quartz and Feldspar Stability, Steady and Non-Steady-State Weathering, and Petrogenesis of Siliciclastic Sands and Muds, J. Geol., 105, 173–192, https://doi.org/10.1086/515908, 1997.
Nousiainen, T. and Kandler, K.: Light scattering by atmospheric mineral dust particles, Light Scatt. Rev. 9, 3–52, 2015.
O'Dowd, C. D. and de Leeuw, G.: Marine aerosol production: a review of the current knowledge, Philos. Trans. R. Soc. A Math. Phys. Eng. Sci., 365, 1856, 1753–1774, https://doi.org/10.1098/rsta.2007.2043, 2007.
O'Hara-Dhand, K., Taylor, R. L. S., Smalley, I. J., Krinsley, D. H., and Vita-Finzi, C.: Loess and dust on Earth and Mars: particle generation by impact mechanisms, Cent. Eur. J. Geosci., 2, 45–51, https://doi.org/10.2478/v10085-010-0001-z, 2010.
Okada, K., Heintzenberg, J., Kai, K., and Qin, Y.: Shape of atmospheric mineral particles collected in three Chinese arid-regions, Geophys. Res. Lett., 28, 3123–3126, https://doi.org/10.1029/2000GL012798, 2001.
Orme, A. R.: Late Quaternary Deposits Near Point Sal, South Central California: A Time Frame For Coastal-Dune Emplacement, Soc. Sediment. Geol. Spec. Publ., 48, 310–315, https://doi.org/10.2110/pec.92.48.0309, 1992.
Osborne, S. R., Johnson, B. T., Haywood, J. M., Baran, A. J., Harrison, M. A. J., and McConnell, C. L.: Physical and optical properties of mineral dust aerosol during the Dust and Biomass-burning Experiment, J. Geophys. Res.-Atmos., 113, D00C03, https://doi.org/10.1029/2007JD009551, 2008.
Ouren, B. D. S., Haas, C., Melcher, C. P., Stewart, S. C., Ponds, P. D., Secton, N. R., Burris, L., Fancher, T., and Bowen, Z. H.: Environmental effects of off-highway vehicles on bureau of land management lands: a literature synthesis, annotated bibliographies, extensive bibliographies, and internet resources, U.S. Geol. Surv. Open-File Rep. 2007-1353, available at: https://pubs.usgs.gov/of/2007/1353/report.pdf (last access: 27 February 2019), 2007.
Price, H. C., Baustian, K. J., McQuaid, J. B., Blyth, A., Bower, K. N., Choularton, T., Cotton, R. J., Cui, Z., Field, P. R., Gallagher, M., Hawker, R., Merrington, A., Miltenberger, A., Neely, R. R., Parker, S. T., Rosenberg, P. D., Taylor, J. W., Trembath, J., Vergara-Temprado, J., Whale, T. F., Wilson, T. W., Young, G., and Murray, B. J.: Atmospheric ice-nucleating particles in the dusty tropical Atlantic, J. Geophys. Res.-Atmos., 123, 2175–2193, https://doi.org/10.1002/2017JD027560, 2018.
Prospero, J. M., Ginoux, P., Torres, O., Nicholson, S. E., and Gill, T. E.: Environmental characterization of global sources of atmospheric soil dust identified with the NIMBUS 7 Total Ozone Mapping Spectrometer (TOMS) absorbing aerosol product, Rev. Geophys., 40, 1002, https://doi.org/10.1029/2000RG000095, 2002.
Pye, K. and Sperling, C. H. B.: Experimental investigation of silt formation by static breakage processes: the effect of temperature, moisture and salt on quartz dune sand and granitic regolith, Sedimentology, 30, 49–62, https://doi.org/10.1111/j.1365-3091.1983.tb00649.x, 1983.
Pye, K. and Tsoar, H.: Aeolian sand and sand dunes, 1st ed., Springer, Berlin Heidelberg, 457 pp., 2009.
Ramanathan, V., Crutzen, P. J., Kiehl, J. T., and Rosenfeld, D.: Aerosols, climate, and the hydrological cycle, Science, 294, 2119–2124, https://doi.org/10.1126/science.1064034, 2001.
Rosenberg, P. D., Dean, A. R., Williams, P. I., Dorsey, J. R., Minikin, A., Pickering, M. A., and Petzold, A.: Particle sizing calibration with refractive index correction for light scattering optical particle counters and impacts upon PCASP and CDP data collected during the Fennec campaign, Atmos. Meas. Tech., 5, 1147–1163, https://doi.org/10.5194/amt-5-1147-2012, 2012.
Rosenberg, P. D., Parker, D. J., Ryder, C. L., Marsham, J. H., Garcia-Carrersa, L., Dorsey, J. R., Brooks, I. M., Dean, A. R., Crosier, J., McQuaid, J. B., and Washington, R.: Quantifying particle size and turbulent scale dependence of dust flux in the Sahara using aircraft measurements, J. Geophys. Res.-Atmos., 119, 7577–7598, https://doi.org/10.1002/2013JD021255, 2014.
Ryder, C. L., Highwood, E. J., Rosenberg, P. D., Trembath, J., Brooke, J. K., Bart, M., Dean, A., Crosier, J., Dorsey, J., Brindley, H., Banks, J., Marsham, J. H., McQuaid, J. B., Sodemann, H., and Washington, R.: Optical properties of Saharan dust aerosol and contribution from the coarse mode as measured during the Fennec 2011 aircraft campaign, Atmos. Chem. Phys., 13, 303–325, https://doi.org/10.5194/acp-13-303-2013, 2013.
Ryder, C. L., Marenco, F., Brooke, J. K., Estelles, V., Cotton, R., Formenti, P., McQuaid, J. B., Price, H. C., Liu, D., Ausset, P., Rosenberg, P. D., Taylor, J. W., Choularton, T., Bower, K., Coe, H., Gallagher, M., Crosier, J., Lloyd, G., Highwood, E. J., and Murray, B. J.: Coarse-mode mineral dust size distributions, composition and optical properties from AER-D aircraft measurements over the tropical eastern Atlantic, Atmos. Chem. Phys., 18, 17225–17257, https://doi.org/10.5194/acp-18-17225-2018, 2018.
Shao, Y.: Physics and modelling of wind erosion, 2nd ed., edited by: Shao, Y., Springer, the Netherlands, 452 pp., 2008.
Shao, Y., Raupach, M. R., and Findlater, P. A.: Effect of saltation bombardment on the entrainment of dust by wind, J. Geophys. Res.-Atmos., 98, 12719–12726, https://doi.org/10.1029/93JD00396, 1993.
Shao, Y., Ishizuka, M., Mikami, M., and Leys, J. F.: Parameterization of size-resolved dust emission and validation with measurements, J. Geophys. Res.-Atmos., 116, D08203, https://doi.org/10.1029/2010JD014527, 2011.
Sommariva, M., Gateshki, M., Gertenbach, J. A., Bolze, J., König, U., Vasile, B. Ş., and Surdu, V. A.: Characterizing nanoparticles with a laboratory diffractometer: From small-angle to total X-ray scattering, Powder Diff., 29, S47–S53, https://doi.org/10.1017/S0885715614001043, 2014.
Sow, M., Alfaro, S. C., Rajot, J. L., and Marticorena, B.: Size resolved dust emission fluxes measured in Niger during 3 dust storms of the AMMA experiment, Atmos. Chem. Phys., 9, 3881–3891, https://doi.org/10.5194/acp-9-3881-2009, 2009.
Sterk, G., Jacobs, A. F. G., and Van Boxel, J. H.: The effect of turbulent flow structures on saltation sand transport in the atmospheric boundary layer, Earth Surf. Process. Landf., 23, 877–887, https://doi.org/10.1002/(SICI)1096-9837(199810)23:10<877::AID-ESP905>3.0.CO;2-R, 1998.
Stull, R. B.: An introduction to boundary layer meteorology, 1st ed., Springer Netherlands, 666 pp., 1988.
Sweeney, M. R., Zlotnik, V. A., Joeckel, R. M., and Stout, J. E.: Geomorphic and hydrologic controls of dust emissions during drought from Yellow Lake playa, West Texas, USA, J. Arid Environ., 133, 37–46, https://doi.org/10.1016/j.jaridenv.2016.05.007, 2016.
Swet, N. and Katra, I.: Reduction in soil aggregation in response to dust emission processes, Geomorphology, 268, 177–183, https://doi.org/10.1016/j.geomorph.2016.06.002, 2016.
Swet, N., Elperin, T., Kok, J. F., Martin, R. L., Yizhaq, H., and Katra, I.: Can active sands generate dust particles by wind-induced processes?, Earth Planet. Sci. Lett., 506, 371–380, https://doi.org/10.1016/j.epsl.2018.11.013, 2019.
Tegen, I., Harrison, S. P., Kohfeld, K., Prentice, C. I., Coe, M., and Heimann, M.: Impact of vegetation and preferential source areas on global dust aerosol: Results from a model study, J. Geophys. Res.-Atmos., 107, AAC 14-1–AAC 14-27, https://doi.org/10.1029/2001JD000963, 2002.
Tiessen, H., Hauffe, H. K., and Mermut, A. R.: Deposition of Harmattan dust and its influence on base saturation of soils in northern Ghana, Geoderma, 49, 285–299, https://doi.org/10.1016/0016-7061(91)90081-4, 1991.
Vaughan, M.: Air Board Approves Historic Order for State Parks to Reduce Dust from Oceano Dunes, The Tribune (San Luis Obispo, California), 30 April, available at: https://www.sanluisobispo.com/news/local/environment/article210047754.html (last access: 27 February 2019), 2018.
von der Weiden, S.-L., Drewnick, F., and Borrmann, S.: Particle Loss Calculator – a new software tool for the assessment of the performance of aerosol inlet systems, Atmos. Meas. Tech., 2, 479–494, https://doi.org/10.5194/amt-2-479-2009, 2009.
Webb, N. P., Strong, C. L., Chappell, A., Marx, S. K., and McTainsh, G. H.: Soil organic carbon enrichment of dust emissions: magnitude, mechanisms and its implications for the carbon cycle, Earth Surf. Process. Landforms, 38, 1662–1671, https://doi.org/10.1002/esp.3404, 2013.
Weinzierl, B., Petzold, A., Esselborn, M., Wirth, M., Rasp, K., Kandler, K., Schütz, L., Koepke, P., and Fiebig, M.: Airborne measurements of dust layer properties, particle size distribution and mixing state of Saharan dust during SAMUM 2006, Tellus, 61, 96–117, https://doi.org/10.1111/j.1600-0889.2008.00392.x, 2009.
Whalley, W. B., Smith, B. J., McAlister, J. J., and Edwards, A. J.: Aeolian abrasion of quartz particles and the production of silt-size fragments: preliminary results, Geol. Soc. London, Spec. Publ., 35, 129–138, https://doi.org/10.1144/GSL.SP.1987.035.01.09, 1987.
Wright, J.: Making loess-sized quartz silt: data from laboratory simulations and implications for sediment transport pathways and the formation of “desert” loess deposits associated with the Sahara, Quat. Int., 76–77, 7–19, https://doi.org/10.1016/S1040-6182(00)00085-9, 2001.
Wright, J., Smith, B., and Whalley, B.: Mechanisms of loess-sized quartz silt production and their relative effectiveness: Laboratory simulations, Geomorphology, 23, 15–34, https://doi.org/10.1016/S0169-555X(97)00084-6, 1998.
Yizhaq, H., Ashkenazy, Y., and Tsoar, H.: Sand dune dynamics and climate change: A modeling approach, J. Geophys. Res.-Earth, 114, F01023, https://doi.org/10.1029/2008JF001138, 2009.
Zender, C. S., Bian, H., and Newman, D.: Mineral Dust Entrainment and Deposition (DEAD) model: Description and 1990s dust climatology, J. Geophys. Res., 108, 4416, https://doi.org/10.1029/2002JD002775, 2003.
Zobeck, T. M. and Van Pelt, R. S.: Wind-induced dust generation and transport mechanics on a bare agricultural field, J. Hazard. Mater., 132, 26–38, https://doi.org/10.1016/j.jhazmat.2005.11.090, 2006.