the Creative Commons Attribution 4.0 License.
the Creative Commons Attribution 4.0 License.
 | 22 Feb 2019
Wintertime secondary organic aerosol formation in Beijing–Tianjin–Hebei (BTH): contributions of HONO sources and heterogeneous reactions
Li Xing
Jiarui Wu
Miriam Elser
Shengrui Tong
Suixin Liu
Xia Li
Lang Liu
Junji Cao
Jiamao Zhou
Imad El-Haddad
Rujin Huang
Xuexi Tie
André S. H. Prévôt
Guohui Li
Organic aerosol (OA) concentrations are simulated over the Beijing–Tianjin–Hebei (BTH) region from 9 to 26 January 2014 using the Weather Research and Forecasting model coupled with chemistry (WRF-CHEM), with the goal of examining the impact of heterogeneous HONO sources on SOA formation and SOA formation from different pathways during wintertime haze days. The model generally shows good performance with respect to simulating air pollutants and organic aerosols against measurements in BTH. Model results show that heterogeneous HONO sources substantially enhance near-surface SOA formation, increasing the regional average near-surface SOA concentration by about 46.3 % during the episode. Oxidation and partitioning of primary organic aerosols treated as semi-volatile dominate SOA formation, contributing 58.9 % of the near-surface SOA mass in BTH. Irreversible uptake of glyoxal and methylglyoxal on aerosol surfaces constitutes the second most important SOA formation pathway during the episode, with the SOA contribution increasing from 8.5 % under non-haze conditions to 30.2 % under haze conditions. Additionally, direct emissions of glyoxal and methylglyoxal from residential sources contribute about 25.5 % of the total SOA mass on average in BTH. Our study highlights the importance of heterogeneous HONO sources and primary residential emissions of glyoxal and methylglyoxal to SOA formation over the BTH region in winter.
- Article
(8276 KB) - Full-text XML
- BibTeX
- EndNote


Organic aerosol (OA) is one of the most important components of fine particulate matter (PM2.5), constituting 20 %–90 % of the PM2.5 mass in the Northern Hemisphere (Zhang et al., 2007). OAs not only scatter or absorb a fraction of the incoming solar radiation, they also serve as cloud condensation nuclei and ice nuclei, directly and indirectly influencing the radiative energy budget of the Earth–atmosphere system (IPCC, 2013). OAs are generally classified into two types: primary OA (POA) and secondary OA (SOA). POAs are directly emitted into the atmosphere as particles by various anthropogenic and biomass burning sources, while SOAs are formed from the complex oxidation of volatile organic compounds (VOCs) followed by gas–particle transfer processes or the heterogeneous reactions of carbonyls. Some species of POA evaporate into the atmosphere and are further oxidized, repartition into aerosols, and form SOA (Robinson et al., 2007; Hallquist et al., 2009; Shrivastava et al., 2017).
In recent years, China has been suffering from severe haze pollution in winter – especially over the Beijing–Tianjin–Hebei (BTH) region (Guo et al., 2014; Bei et al., 2016; Chang et al., 2016). Observations have shown that OAs play a critical role in haze pollution in China (Xing et al., 2013; Sun et al., 2013; Huang et al., 2014; Li et al., 2017). Huang et al. (2014) reported that OA accounted for 30 %–50 % of the PM2.5 mass in four megacities in China during severe haze days, with the SOA contribution ranging from 44 % to 71 % in winter. Sun et al. (2013) observed that OA contributed 52 % of the non-refractory submicron aerosol (NR-PM1) in Beijing in the winter of 2012, whereas SOA constituted 31 % of the OA mass. H. Li et al. (2017) found that OA dominated the PM1 mass during wintertime heavy haze days in Handan, China and SOA comprised 39 % of the total OA mass.
The hydroxyl radical (OH) is one of the most important oxidants in the troposphere, controlling the daytime atmospheric oxidation capacity (AOC) and further affecting ozone (O3) and SOA formation (Volkamer et al., 2010; Stone et al., 2012). G. Li et al. (2017) demonstrated that the O3 concentration was fairly low when PM2.5 concentrations were higher than 200 µg m−3 in wintertime in the Guanzhong Basin, China, revealing the limited AOC under severe haze pollution conditions. Meanwhile, the high contribution of SOA to the OA mass during severe haze days indicates that other OH sources exist that promote SOA formation via the oxidation of VOCs or enhanced heterogeneous reactions of carbonyls.
Photolytically liable nitrous acid (HONO) is an important OH source, particularly during the early morning hours when the other OH sources are less important in the polluted atmosphere (Stutz et al., 2000; Li et al., 2010). Recent studies have shown that the reaction of NO and OH can not interpret the observed high HONO concentrations in both urban and rural areas (Li et al., 2010, 2015). Heterogeneous sources have been considered to be significant for atmospheric HONO formation, including direct emissions from vehicles, nitrogen dioxide (NO2) heterogeneous reactions on aerosol and ground surfaces, and NO2 reduction reactions with organics and soot (Arens et al., 2001; Gutzwiller et al., 2002; Aumont et al., 2003; Ndour et al., 2008). Several model studies have shown that including the HONO heterogeneous source has reasonably reproduced the observed high HONO level and consequently enhanced the simulated O3 and SOA concentrations (Li et al., 2010, 2015; Zhang et al., 2016). For example, Li et al. (2010) showed that additional heterogeneous HONO sources elevate the simulated SOA concentration by a factor of 2 in the morning in Mexico City. Furthermore, Li et al. (2015) revealed that additional HONO sources increased simulated O3 and PM2.5 concentrations by around 9 ppb and 32 µg m−3, respectively, during daytime in August 2007 in the BTH region.
Heterogeneous reactions are also an important SOA formation pathway (Fu et al., 2008; Li et al., 2013). Laboratory and field studies have indicated that glyoxal and methylglyoxal cause rapid SOA production via aerosol uptake or cloud processing (Liggio et al., 2005; Volkamer et al., 2007). Li et al. (2013) included the aqueous uptake of glyoxal and methylglyoxal into wet aerosols and cloud droplets as an additional SOA formation pathway in the 3-D regional air quality model CMAQ and simulated SOA formation in the Pearl River Delta region of China. Simulations showed that the aqueous uptake of glyoxal and methylglyoxal helped to narrow the gap in the SOA concentrations between models and measurements.
SOA simulations in chemical transport models (CTMs) have been substantially improved in recent years. Odum et al. (1996) proposed a traditional two-product model to describe SOA production, in which two oxidation products with different saturation vapor pressures are produced from one specific VOC precursor oxidation and then reversibly partitioned between the gas and particle phases to form SOA. The two-product model has been widely used in CTMs to simulate SOA formation, although it generally tends to underestimate SOA concentrations (Chung and Seinfeld, 2002; Henze and Seinfeld, 2006). Donahue et al. (2006) proposed a volatility basis set (VBS) approach to represent the wide range of volatilities of organic species and the aging of SOA by the mass transfer among different volatility bins. CTMs using the VBS approach have remarkably improved the agreement of SOA simulations with observations (e.g., Li et al., 2011; Shrivastava et al., 2013, 2015; Feng et al., 2016).
Previous studies have investigated OA formation in China and generally tend to underestimate OA concentrations (Han et al., 2008, 2016; Fu et al., 2012; Fu and Liao, 2012; Jiang et al., 2012; Li et al., 2013; Tsai et al., 2015; Feng et al., 2016; Chen et al., 2017; Hu et al., 2017). Jiang et al. (2012) used the two-product model to simulate SOA in China in 2006 and found that the model underestimated SOA concentrations by 0 %–75 %. Fu et al. (2012) simulated organic carbon (OC) in China using the two-product model including the aqueous uptake of glyoxal and methylglyoxal, and showed that the model significantly underestimated the observed OC concentrations in all seasons and failed to capture the spatiotemporal variability of OC. Han et al. (2016) used the VBS approach and the two-product model to simulate OA over East China in April 2009. The simulated SOA concentrations using the VBS approach were higher than those using the two-product model. Additionally, the predicted ratio of secondary OC to total OC in the VBS approach was about 33 %, which was much higher (around 5 %) than that in the two-product model and also close to the observation-based estimation (32 %); this suggested a more realistic representation of the SOA formation by the VBS approach through accounting for the semi-volatile and intermediate volatility organics emitted from fossil fuel and biomass burning sources. Hu et al. (2017) modeled SOA formation in China in 2013 using the two-product model, and the simulation underestimated the observed OC concentrations in the winter in Beijing, especially during heavy haze days. Recent studies have demonstrated that CTMs are prone to underestimating SOA concentrations compared with measurements when using the traditional two-product SOA module, particularly during wintertime haze days with rather low O3 levels (e.g., Jiang et al., 2012; Fu et al., 2012; Hu et al., 2017). Hence, it is imperative to improve the SOA simulations to support the design and implementation of emission control strategies to mitigate haze pollution in China.
In the study, the VBS SOA approach with aging implemented in the WRF-CHEM model is used to attempt to improve the SOA simulation during wintertime haze days in BTH: specific attention is paid to the contribution of heterogeneous HONO sources and the uptake of glyoxal and methylglyoxal with regard to SOA formation. The WRF-CHEM model configuration and observation data are described in Sect. 2, the model results are analyzed in Sect. 3, and the conclusions are summarized in Sect. 4.
2.1 WRF-CHEM model
The version of the WRF-CHEM model used in this study is developed by Li et al. (2010), and the OA module utilized is incorporated into the model by Li et al. (2011). Briefly, the model uses the SAPRC-99 gas-phase chemical mechanism, and the CMAQ/Models3 aerosol module developed by the US EPA (Binkowski and Roselle, 2003). Three different modes of log-normal distributions are superposed to represent the aerosol size distribution. Particle nucleation, coagulation, and size growth/shrink due to the addition/loss of mass are included in the aerosol module. The photolysis rates of gas-phase species are calculated using the Fast Tropospheric Ultraviolet and Visible (FTUV) radiation model that considers the aerosol effects on photolysis frequencies (Tie et al., 2003; Li et al., 2005). Inorganic aerosols are simulated using ISORROPIA version 1.7 (Nenes et al., 1998). The dry and wet deposition of chemical species are calculated using the parameterization by Wesely (1989) and the CMAQ/Models3 method, respectively.
The OA module is based on the VBS approach including aging, and detailed information regarding the module can be found in Li et al. (2011). The POA components from traffic-related combustion and biomass burning are represented by nine surrogate species with saturation concentrations (C*) ranging from 10−2 to 106 µg m−3 at room temperature (Shrivastava et al., 2008); these species are assumed to be semi-volatile and photochemically reactive (Robinson et al., 2007). SOA formation from each anthropogenic or biogenic precursor is calculated using four semi-volatile VOCs with effective saturation concentrations of 1, 10, 100, and 1000 µg m−3 at 298 K, respectively. Previous studies have demonstrated that the fragmentation reactions of semi-volatile VOCs also play an important role in SOA formation (Shrivastava et al., 2013, 2015, 2016). However, the fragmentation reactions have not been incorporated in the version of the WRF-CHEM model utilized in this study, and further studies need to been performed to include the contribution of those reactions to improve the SOA simulation. SOA formation via the heterogeneous reaction of glyoxal and methylglyoxal is parameterized as a first-order irreversible uptake by aerosol particles with an uptake coefficient of (Liggio et al., 2005; Zhao et al., 2006; Volkamer et al., 2007).
Besides the homogeneous formation of HONO by the reaction of NO and OH, the heterogeneous HONO sources are also considered in the model, including secondary HONO formation from heterogeneous NO2 reaction with semi-volatile organics and freshly emitted soot, and the heterogeneous reaction of NO2 on aerosol and ground surfaces. Details about the model parameterization of heterogeneous HONO formation can be found in Li et al. (2010).
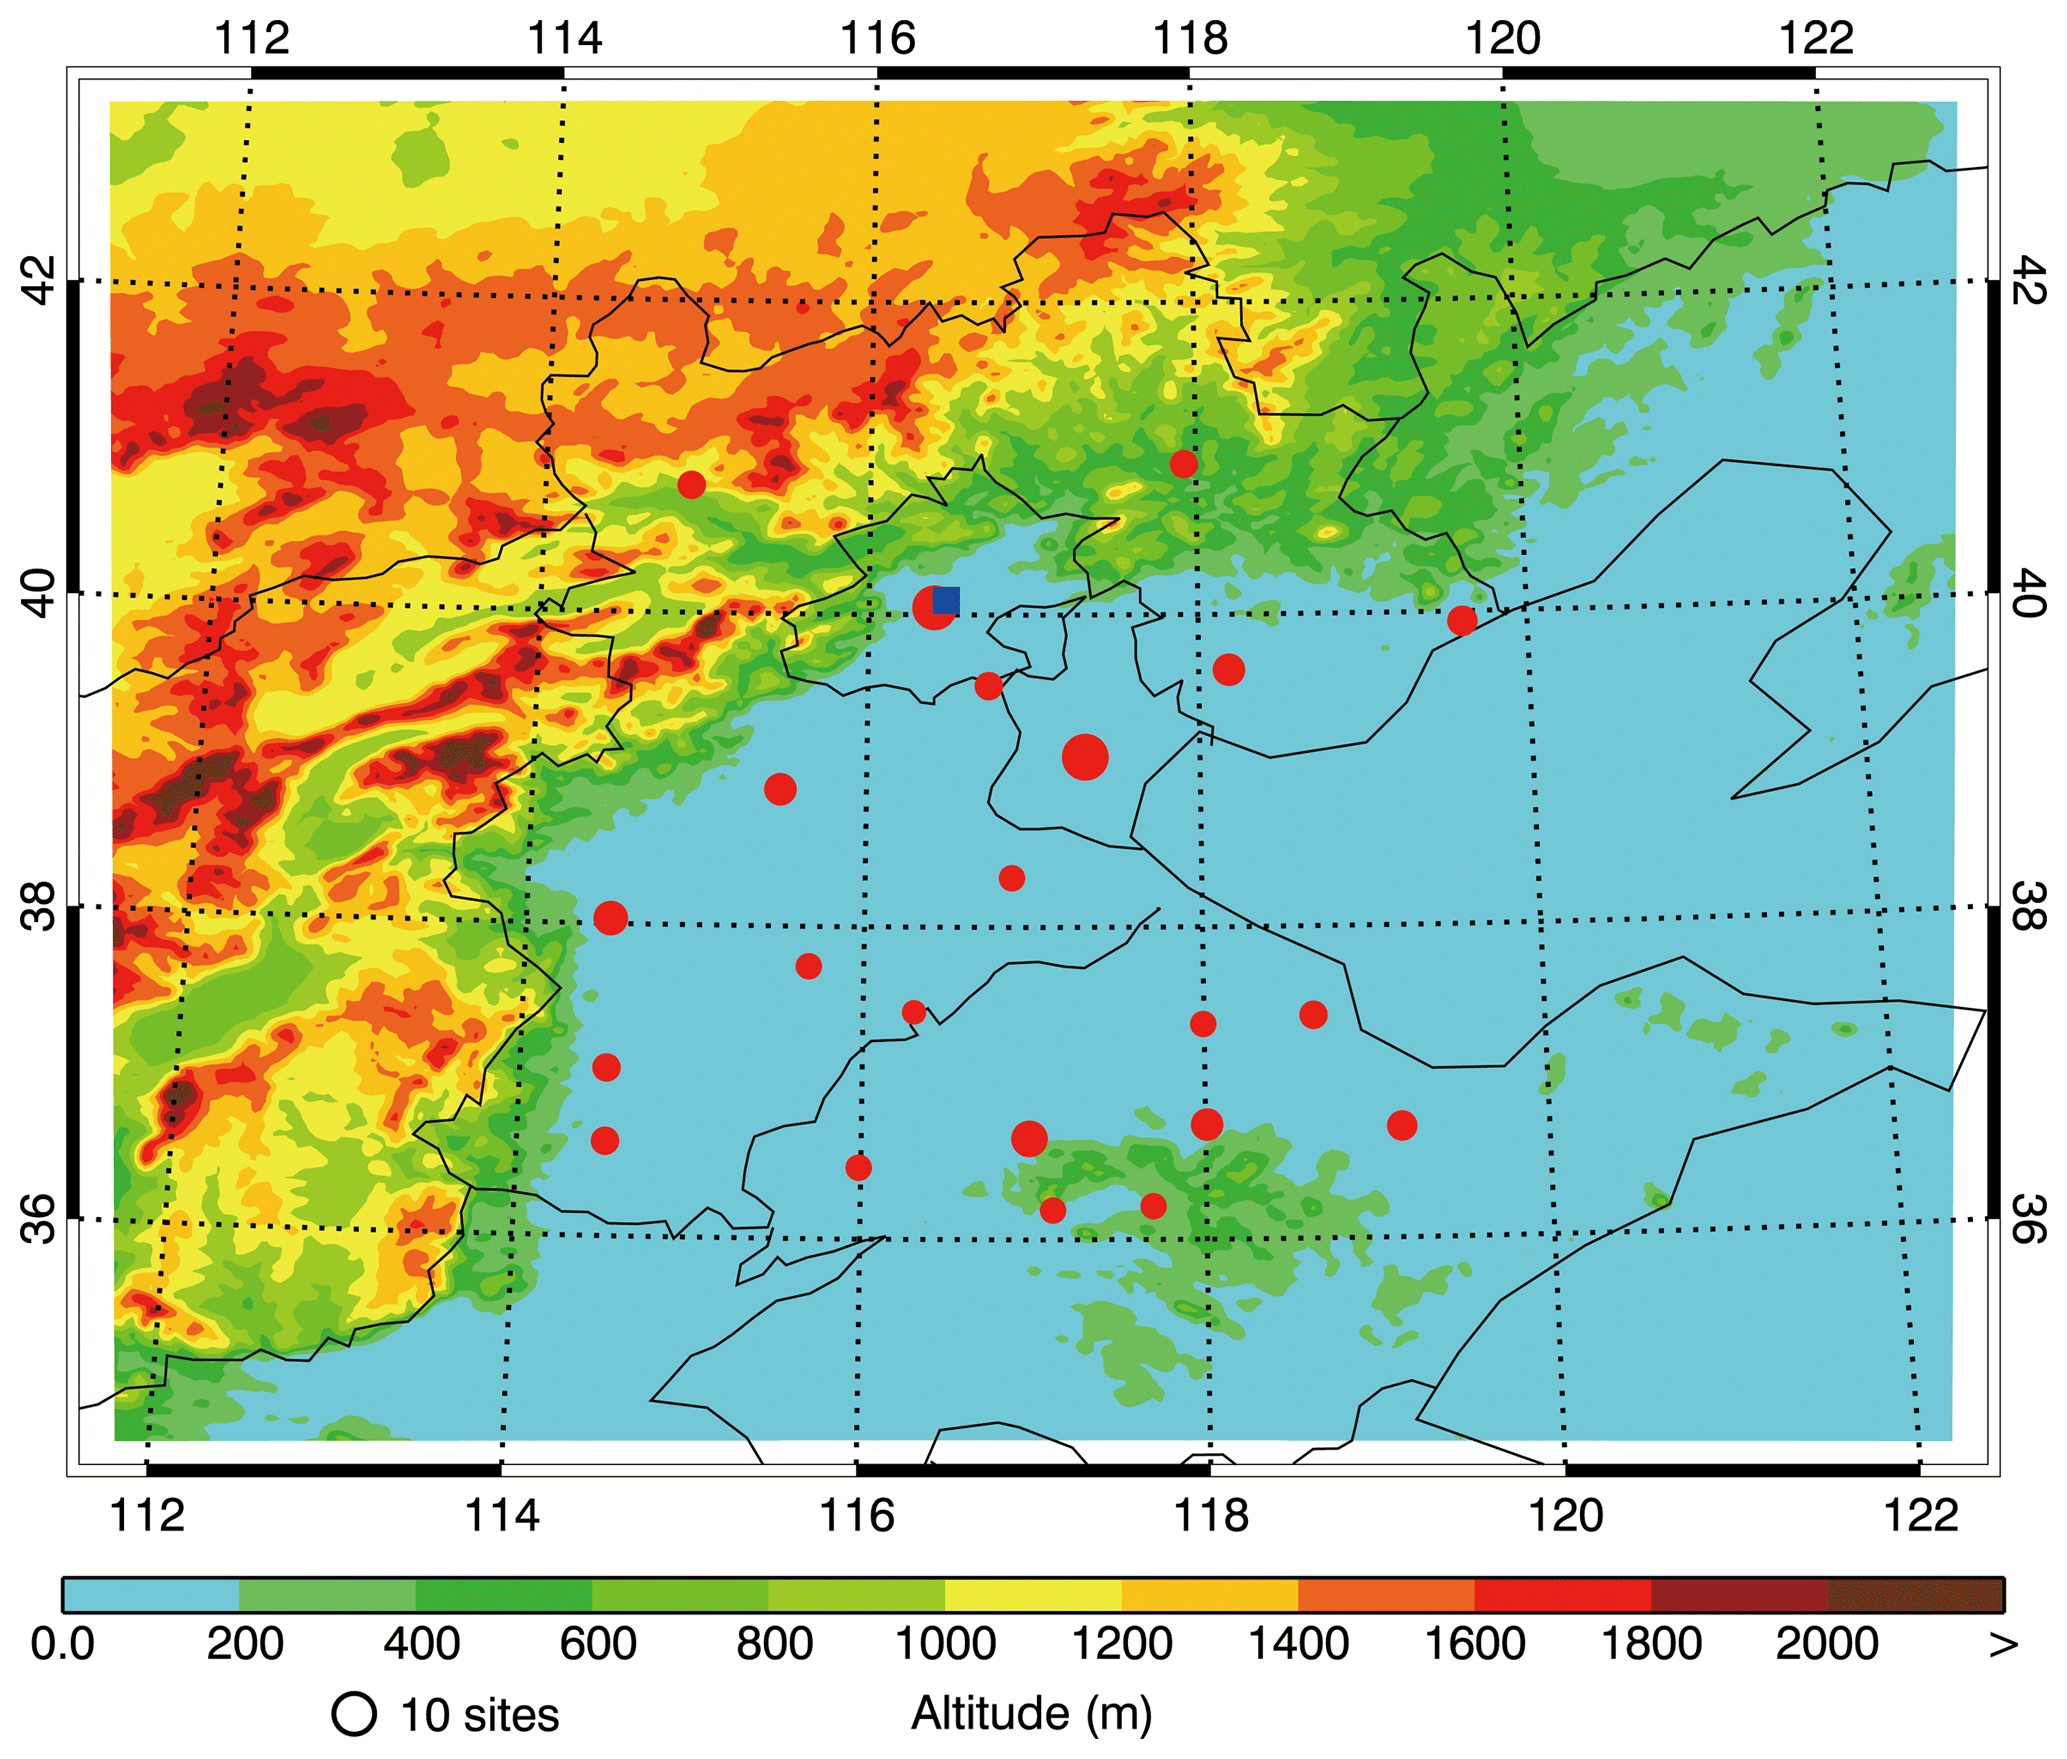
Figure 1WRF-CHEM model simulation domain with topography. The blue square denotes the location of the Institute of Remote Sensing and Digital Earth (the IRSDE site) in Beijing. The red dots denote the centers of 22 cities throughout BTH that have ambient monitoring sites, and the sizes of the circles denote the number of ambient monitoring sites in the cities.
2.2 Model configuration
The WRF-CHEM model is used to simulate a persistent air pollution episode that occurred in BTH from 9 to 26 in January 2014 in order to investigate SOA formation. The model is set up with a horizontal grid resolution of 6 km and 150×150 grid cells centered at 39∘ N and 117∘ E (Fig. 1). Thirty-five vertical levels are utilized with finer vertical resolution near the surface. The model employs the microphysical scheme of Hong and Lim (2006), the MYJ TKE planetary boundary layer scheme (Janjić, 2002), the MYJ surface layer scheme (Janjić, 2002), the unified Noah land-surface model (Chen and Dudhia, 2001), and the Goddard shortwave and longwave radiation schemes (Chou and Suarez, 1999, 2001) in the simulations. The NCEP 1∘ × 1∘ reanalysis data (https://rda.ucar.edu/datasets/ds083.2/, last access: February 2019) are used for the meteorological initial and boundary conditions. The Model for OZone And Related chemical Tracers (MOZART) output with 6 h intervals (Horowitz et al., 2003) provides the chemical initial and boundary conditions. The spin-up time for initialization is 2 days.
The anthropogenic emission inventory used in the study includes the agriculture, industry, power plant, residential, and transportation sectors in the base year of 2013 (Zhang et al., 2009; M. Li et al., 2017). The biogenic emissions are calculated online using the Model of Emissions of Gases and Aerosols from Nature (MEGAN) module (Guenther et al., 2006).
2.3 Observation data
The measurement data of hourly PM2.5, SO2, NO2, and O3 concentrations in BTH are downloaded from the http://www.aqistudy.cn/ (last access: February 2019) website, released by China's Ministry of Ecological Environment. OA were measured using the Aerodyne high-resolution time-of-flight aerosol mass spectrometer (HR-ToF-AMS) with a novel PM2.5 lens (Williams et al., 2013) from 9 to 26 January 2014 at the Institute of Remote Sensing and Digital Earth (IRSDE), Chinese Academy of Sciences (40.00∘ N, 116.38∘ E) in Beijing (Fig. 1). The positive matrix factorization (PMF) technique is used to identify the OA sources (Canonaco et al., 2013; Elser et al., 2016). Five components of OA are classified by their mass spectra and time series, including traffic-combustion hydrocarbon-like OA (HOA), cooking OA (COA), biomass burning OA (BBOA), coal combustion OA (CCOA), and oxygenated OA (OOA). HOA, COA, BBOA, and CCOA are interpreted for surrogates of primary OA (POA), and OOA is a surrogate for SOA. The details of the HR-ToF-AMS measurement and the source apportionment of OA can be found in Elser et al. (2016). HONO was measured using a homemade HONO analyzer at the IRSDE site. Further details about the measurement procedure can be found in Tong et al. (2016).
2.4 Statistical indexes for comparisons
The mean bias (MB), root mean square error (RMSE), and index of agreement (IOA) are used to assess the model prediction of aerosol species:
In the abovementioned equations, Pi and Oi are the simulated and observed concentrations of chemical species, respectively, N is the number of model and observation data for the comparisons, and is the average observed species concentration. IOA ranges from zero to one, and a larger IOA indicates better agreement between the model and the observations.
In our previous study, the WRF-CHEM simulation of the haze pollution episodes was validated using air pollutant observations in BTH (Li et al., 2018). Generally, the model predicts the horizontal distributions of PM2.5, O3, NO2, and SO2 mass concentrations well compared with the measurements. In addition, the model also reproduces the temporal profiles of the air pollutants reasonably well, but is subject to an underestimation during the haze dissipation stage compared with the observations.
The OA simulation is further compared with the HR-ToF-AMS data analyzed using the PMF technique at the IRSDE site in Beijing (Elser et al., 2016). The PMF results are hereafter referred to as “observations”, even if they are the model results constrained by observations. We have defined the base simulation including various anthropogenic and biogenic emission sources and the heterogeneous HONO formation as Li et al. (2010) – hereafter referred to as “BASE case” – and results from the BASE case are compared with the observed POA and SOA in Beijing.
3.1 POA simulations
Figure 2 presents the temporal profiles of the simulated and observed POA (the sum of HOA, BBOA, CCOA, and COA), HOA, BBOA + COA, and CCOA concentrations from 9 to 26 January 2014 at the IRSDE site in Beijing. The model generally simulates the diurnal variations of the POA concentration compared to the HR-ToF-AMS measurements, with an IOA of 0.83 (Fig. 2a). However, the model does tend to overestimate the POA concentration, with a MB of 8.7 µg m−3, although it frequently can not reproduce the observed high peaks during heavy haze days. The POA simulation also exhibits rather large dispersions, with a RMSE of 35.5 µg m−3. It is worth noting that the POA concentration in Beijing is dominated by primary emissions of vehicles, cooking, biomass burning, coal combustion, and trans-boundary transport from outside of Beijing, so uncertainties in emissions from various anthropogenic sources and the simulated meteorological fields substantially affect the simulated POA concentrations (Bei et al., 2017).

Figure 2Comparisons of observed (black dots) and simulated (solid red lines) diurnal profiles of near-surface hourly mass concentrations of (a) POA, (b) HOA, (c) BBOA + COA, and (d) CCOA at the IRSDE site in Beijing from 9 to 26 January 2014.
The model generally replicates the diurnal variations of HOA, BBOA + COA, and CCOA when compared to the observations, with IOAs of 0.72, 0.69, and 0.81, respectively. The model fails to capture the peaks of all of the POA components during nighttime on 11 and 17 January 2014, which is likely caused by the emission uncertainty. The HOA simulation is slightly better than that of BBOA + COA. One possible reason for this is the fact that the HOA emissions from vehicles have a clearer diurnal variation than those of BBOA and COA. Detailed discussion regarding the CCOA simulation can be found in Li et al. (2018).
3.2 SOA simulations and HONO contributions
The hydroxyl radical (OH) dominates the oxidation of VOCs and primary organic gases during the daytime (generally as an O3 photochemical derivative), affecting SOA formation in the atmosphere. However, insolation in North China becomes weak during wintertime, which does not facilitate O3 formation. Low surface O3 concentrations have been observed, particularly during heavy haze episodes, reducing the OH production from O3 photolysis (G. Li et al., 2017). Photolytically liable HONO has been reported to be a major OH source when the O3 level is low, such as in the morning in urban areas (Li et al., 2010; Czader et al., 2012). Figure 3 shows the diurnal cycle of observed O3 and HONO concentrations from 9 to 26 January 2014 at the IRSDE site in Beijing. Apparently, the observed peak O3 concentration is low, around 18 ppb, which is unfavorable for the photochemical production of OH. Therefore, an alternative explanation for the atmospheric OH level is the observed high HONO level, which displays the lowest concentration of 0.75 ppb in the afternoon and a peak of up to 3.0 ppb at nighttime.

Figure 3Diurnal cycle of observed (black line) and modeled (solid red and blue lines for the BASE and HOMO cases, respectively) (a) O3 and (b) HONO concentrations averaged from 9 to 26 January 2014 at the IRSDE site in Beijing.
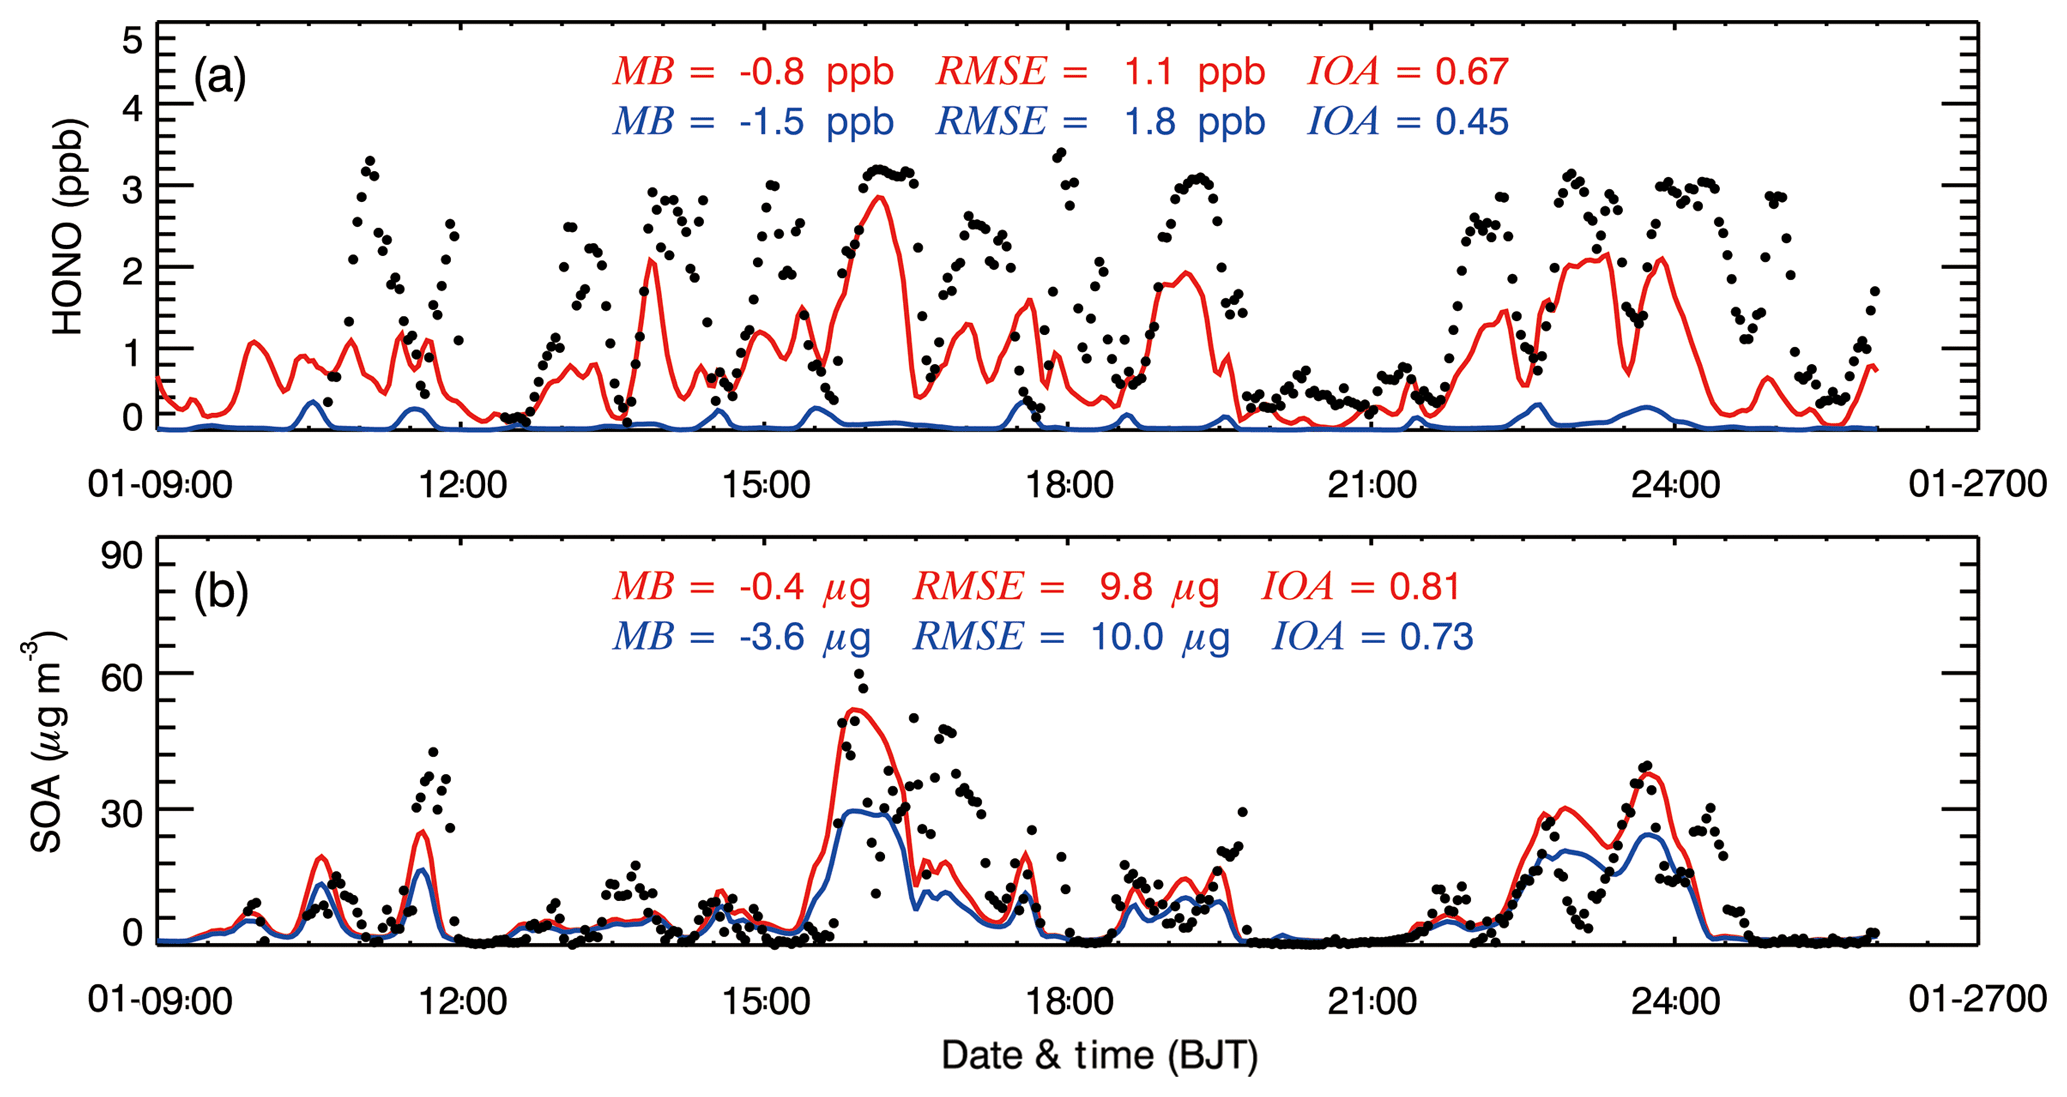
Figure 4Comparisons of observed (black dots) and simulated (solid red and blue lines for the BASE and HOMO cases, respectively) diurnal profiles of near-surface hourly mass concentrations of (a) HONO and (b) SOA at the IRSDE site in Beijing from 9 to 26 January 2014.
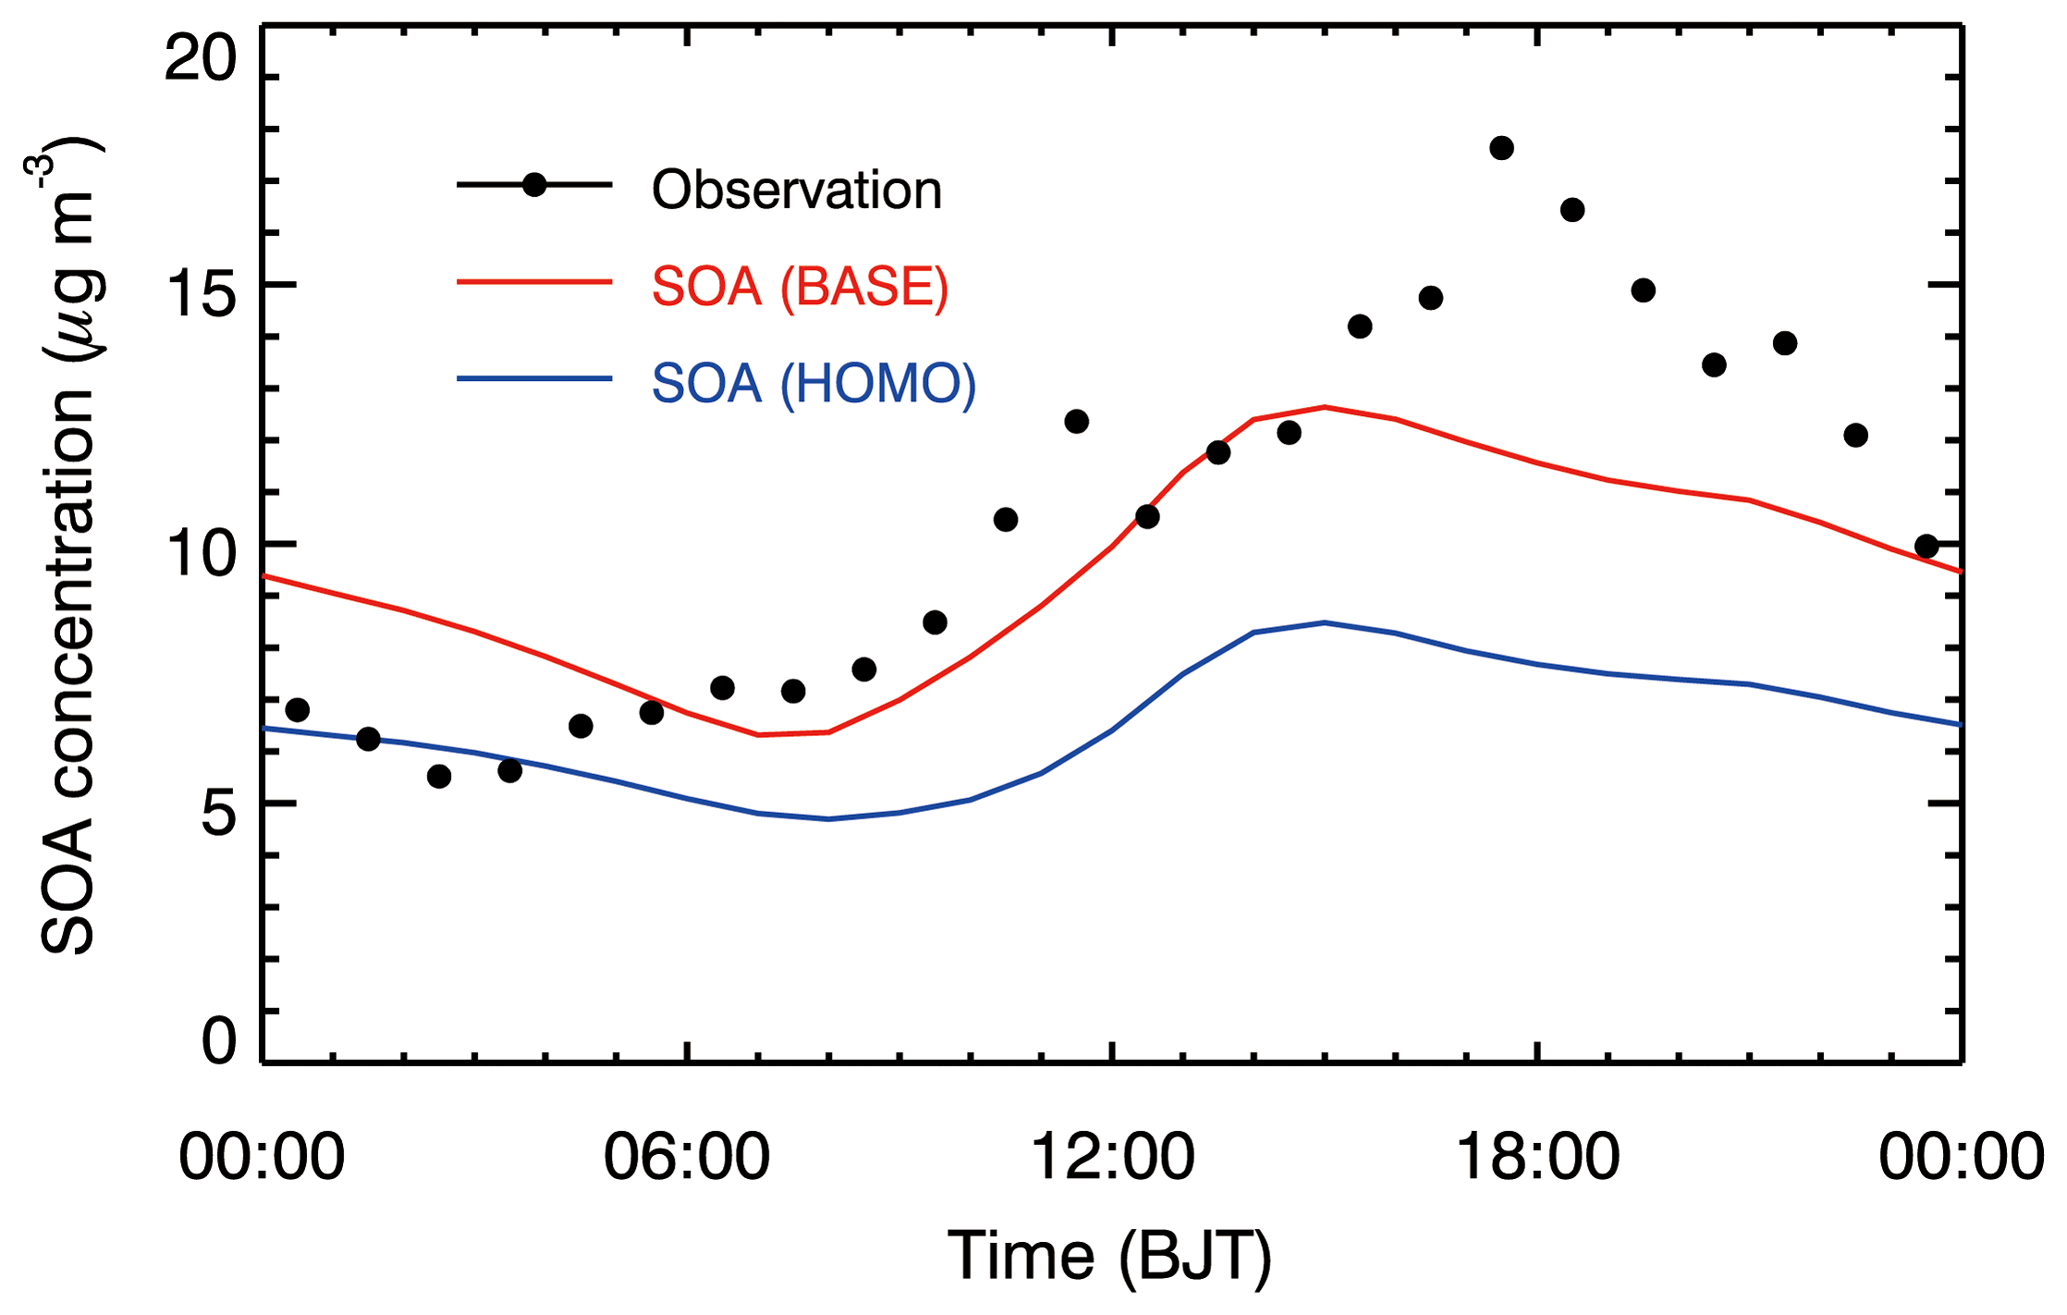
Figure 5Observed (black dots) and modeled (solid red and blue lines for the BASE and HOMO cases, respectively) SOA diurnal cycle averaged from 9 to 26 January 2014 at the IRSDE site in Beijing.
We further quantitatively evaluate the contribution of O3 and HONO to the OH production based on measurements made using the Tropospheric Ultraviolet and Visible (TUV) radiation model (http://cprm.acom.ucar.edu/Models/TUV/Interactive_TUV/, last access: February 2019). The calculation location is the IRSDE observation site (40.00∘ N, 116.38∘ E, Fig. 1) and the time and date are 15:00 Beijing time (BJT, UTC+8) and 15 January 2014, respectively. For the calculation of photolysis rates using the TUV model, the column O3 is set to 300 Dobson units and the aerosol and cloud effects are not considered. O3 photolysis generates an excited oxygen atom O(1D) and O(1D) reacts with water vapor to form OH as follows:
However, the large majority (>90 %) of O(1D) atoms are quenched to ground-state atoms O(3P) via collisions with nitrogen and oxygen. Therefore, an upper limit estimation of the OH production rate can be expressed as follows: , where is the O3 photolysis rate and represents the O3 mixing ratio. In Fig. 3a, at 15:00 BJT, the is about 18 ppb, so the estimated maximal OH production rate from O3 photolysis is approximately ppb s−1.
HONO photolysis directly produces OH, but OH reacts with NO to reform HONO:
Model studies and measurements in Mexico City have shown that the contribution of the reaction of OH with NO to HONO formation does not exceed 60 % during the daytime (Dusanter et al., 2009; Li et al., 2010). We use a lower limit where 20 % of OH yielded from HONO photolysis does not recycle, meaning that the net OH production rate from HONO photolysis can be expressed as follows: . At 15:00 BJT, cHONO is 0.75 ppb and the estimated net OH production rate from HONO photolysis is ppb s−1. The comparison of the OH production rates from O3 and HONO photolysis reveals that HONO plays a more important role than O3 regarding the wintertime AOC at ground level in the Beijing urban area.
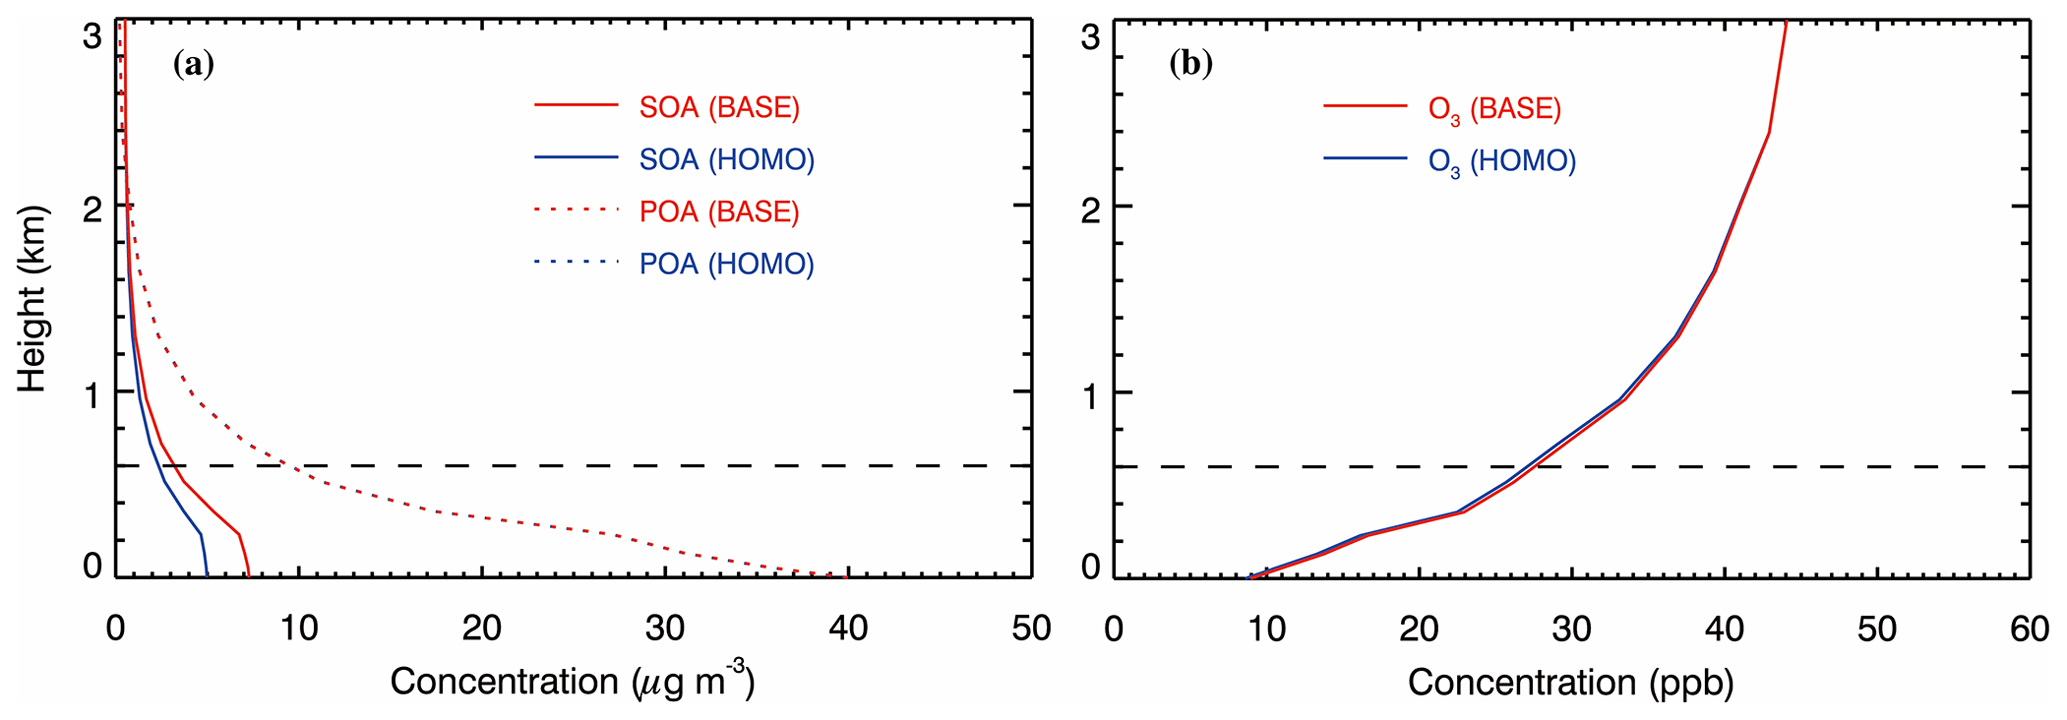
Figure 6Vertical distribution of (a) SOA and POA and (b) O3 concentrations averaged from 9 to 26 January 2014 at the IRSDE site in Beijing. Red and blue lines represent the BASE and HOMO cases, respectively.

Figure 7Spatial distribution of (a) the average SOA mass concentration for the BASE case and (b) the percentage SOA enhancement due to the heterogeneous HONO sources during the simulation period.
To investigate the contribution of HONO to the AOC and SOA formation, we performed a sensitivity simulation in which the heterogeneous HONO sources are not considered and only the homogeneous source of NO + OH is included (hereafter referred to as the “HOMO case”). Figure 4a shows the temporal profiles of the simulated HONO concentrations in the BASE and HOMO cases compared with observations at the IRSDE site from 9 to 26 January 2014. In the HOMO case where only the homogeneous reaction of NO and OH is included as the HONO source, the HONO concentrations are substantially underestimated compared with the observations, especially during nighttime, with a MB of −1.5 ppb. When the heterogeneous HONO sources of HONO are included in the BASE case, the model captures the temporal variation of the HONO concentrations compared to the observations, with an IOA of 0.67, but it frequently underestimates the HONO concentration during nighttime. The HONO simulation results are generally consistent with previous studies; this demonstrates that the homogeneous source fails to interpret the observed high HONO concentrations, and the heterogeneous HONO sources significantly improve the HONO simulations (e.g., Li et al., 2010).
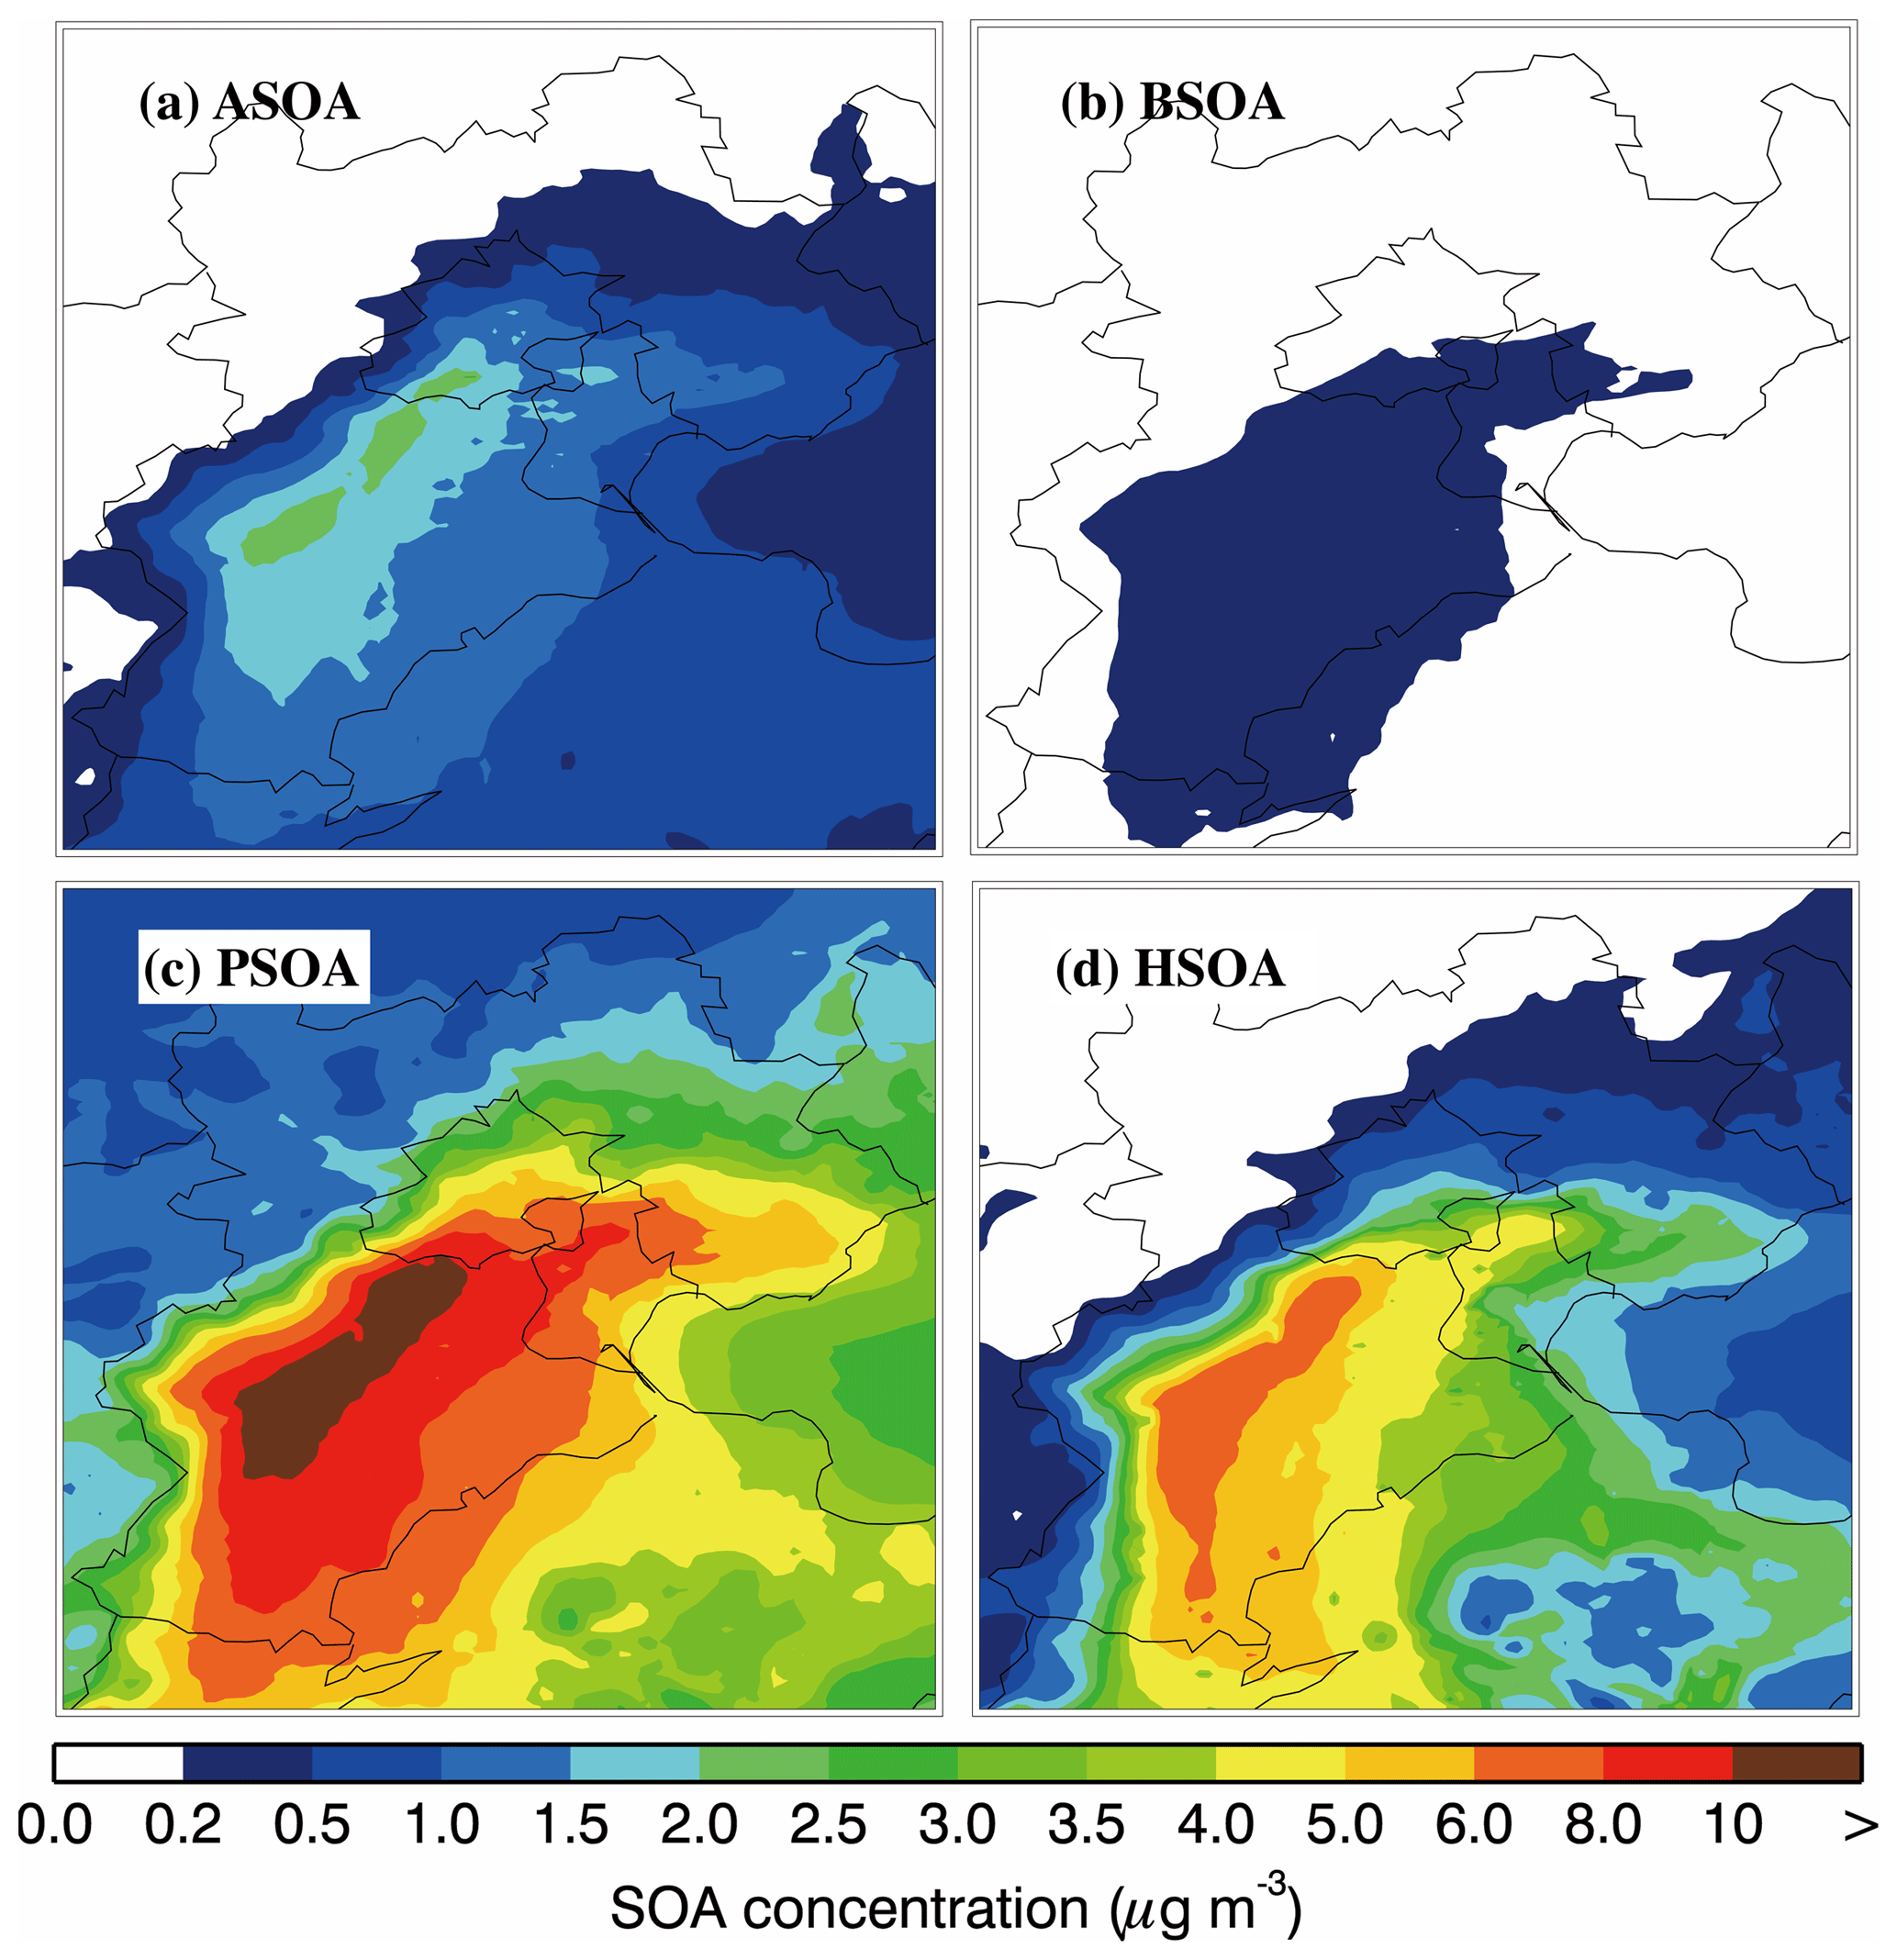
Figure 8Spatial distribution of the average SOA concentration from different formation pathways of (a) ASOA, (b) BSOA, (c) PSOA, and (d) HSOA during the simulation period.
Figure 4b shows the comparison of simulated SOA and observed OOA concentrations at the IRSDE site. For the BASE case simulation, the model reproduces the SOA temporal variation reasonably well compared with observations, with an IOA of 0.81. It slightly underestimates the SOA concentration, with a MB of −0.4 µg m−3, and the RMSE is rather large, around 9.8 µg m−3, showing considerable deviations within the SOA simulation. When heterogeneous HONO formation is excluded in the HOMO case, the model considerably underestimates the SOA concentration compared with the observations, with a MB of −3.2 µg m−3. On average, the BASE case produces about 96 % of the observed SOA concentrations, but only 65 % for the HOMO case at the IRSDE site during the haze episode. Therefore, the SOA concentrations are substantially increased by the heterogeneous HONO sources, with an average SOA contribution of about 32 % at the IRSDE site. Obviously, the heterogeneous HONO sources remarkably improve the SOA simulation, particularly during the heavy haze days. The SOA enhancement due to the heterogeneous HONO sources in Beijing is not the same as the result in Mexico City (Li et al., 2010). Li et al. (2010) showed that heterogeneous HONO sources increased SOA concentrations by more than 100 % in the morning in Mexico City but played a minor role during the rest of the day. In Beijing, the SOA enhancement due to heterogeneous HONO sources is significant throughout the whole day. The main reason for the difference is that the high O3 level in the afternoon dominates the OH production in Mexico City. Additionally, the WRF-CHEM model also generally yields the observed HONO diurnal cycle, but the underestimation is substantial at nighttime (Fig. 3b). The simulated O3 diurnal cycle is in agreement with the observations at the IRSDE site, but the model underestimates the O3 concentration compared with the measurements in the morning (Fig. 3b).
Figure 5 presents the comparison of simulated SOA and observed OOA diurnal cycles averaged during the haze episode at the IRSDE site. The observed SOA concentration continuously increases from the early morning (06:00 BJT) until noon (12:00 BJT), due to the low PBL height and progressively increasing photochemical production of SOA. After noon, although the PBL commences to develop rapidly, the SOA concentration still increases until the evening (18:00 BJT), which is caused by the enhanced AOC that facilitates SOA formation. Compared to the HOMO case, the SOA diurnal cycle simulation is considerably improved in the BASE case compared with the measurements. The model with the heterogeneous HONO sources included still fails to capture the observed SOA peak during the evening and overestimates SOA concentrations compared with the measurements from 00:00 to 06:00 BJT; this shows the WRF-CHEM model deficiency with respect to simulating the diurnal variation of SOA formation (Lennartson et al., 2018). It is worth noting that heavy haze pollution in Beijing is generally markedly influenced by regional transport (Wu et al., 2017; Li et al., 2018); therefore, uncertainties in the wind field simulations have the potential to affect the SOA diurnal cycle simulation (Bei et al., 2017).
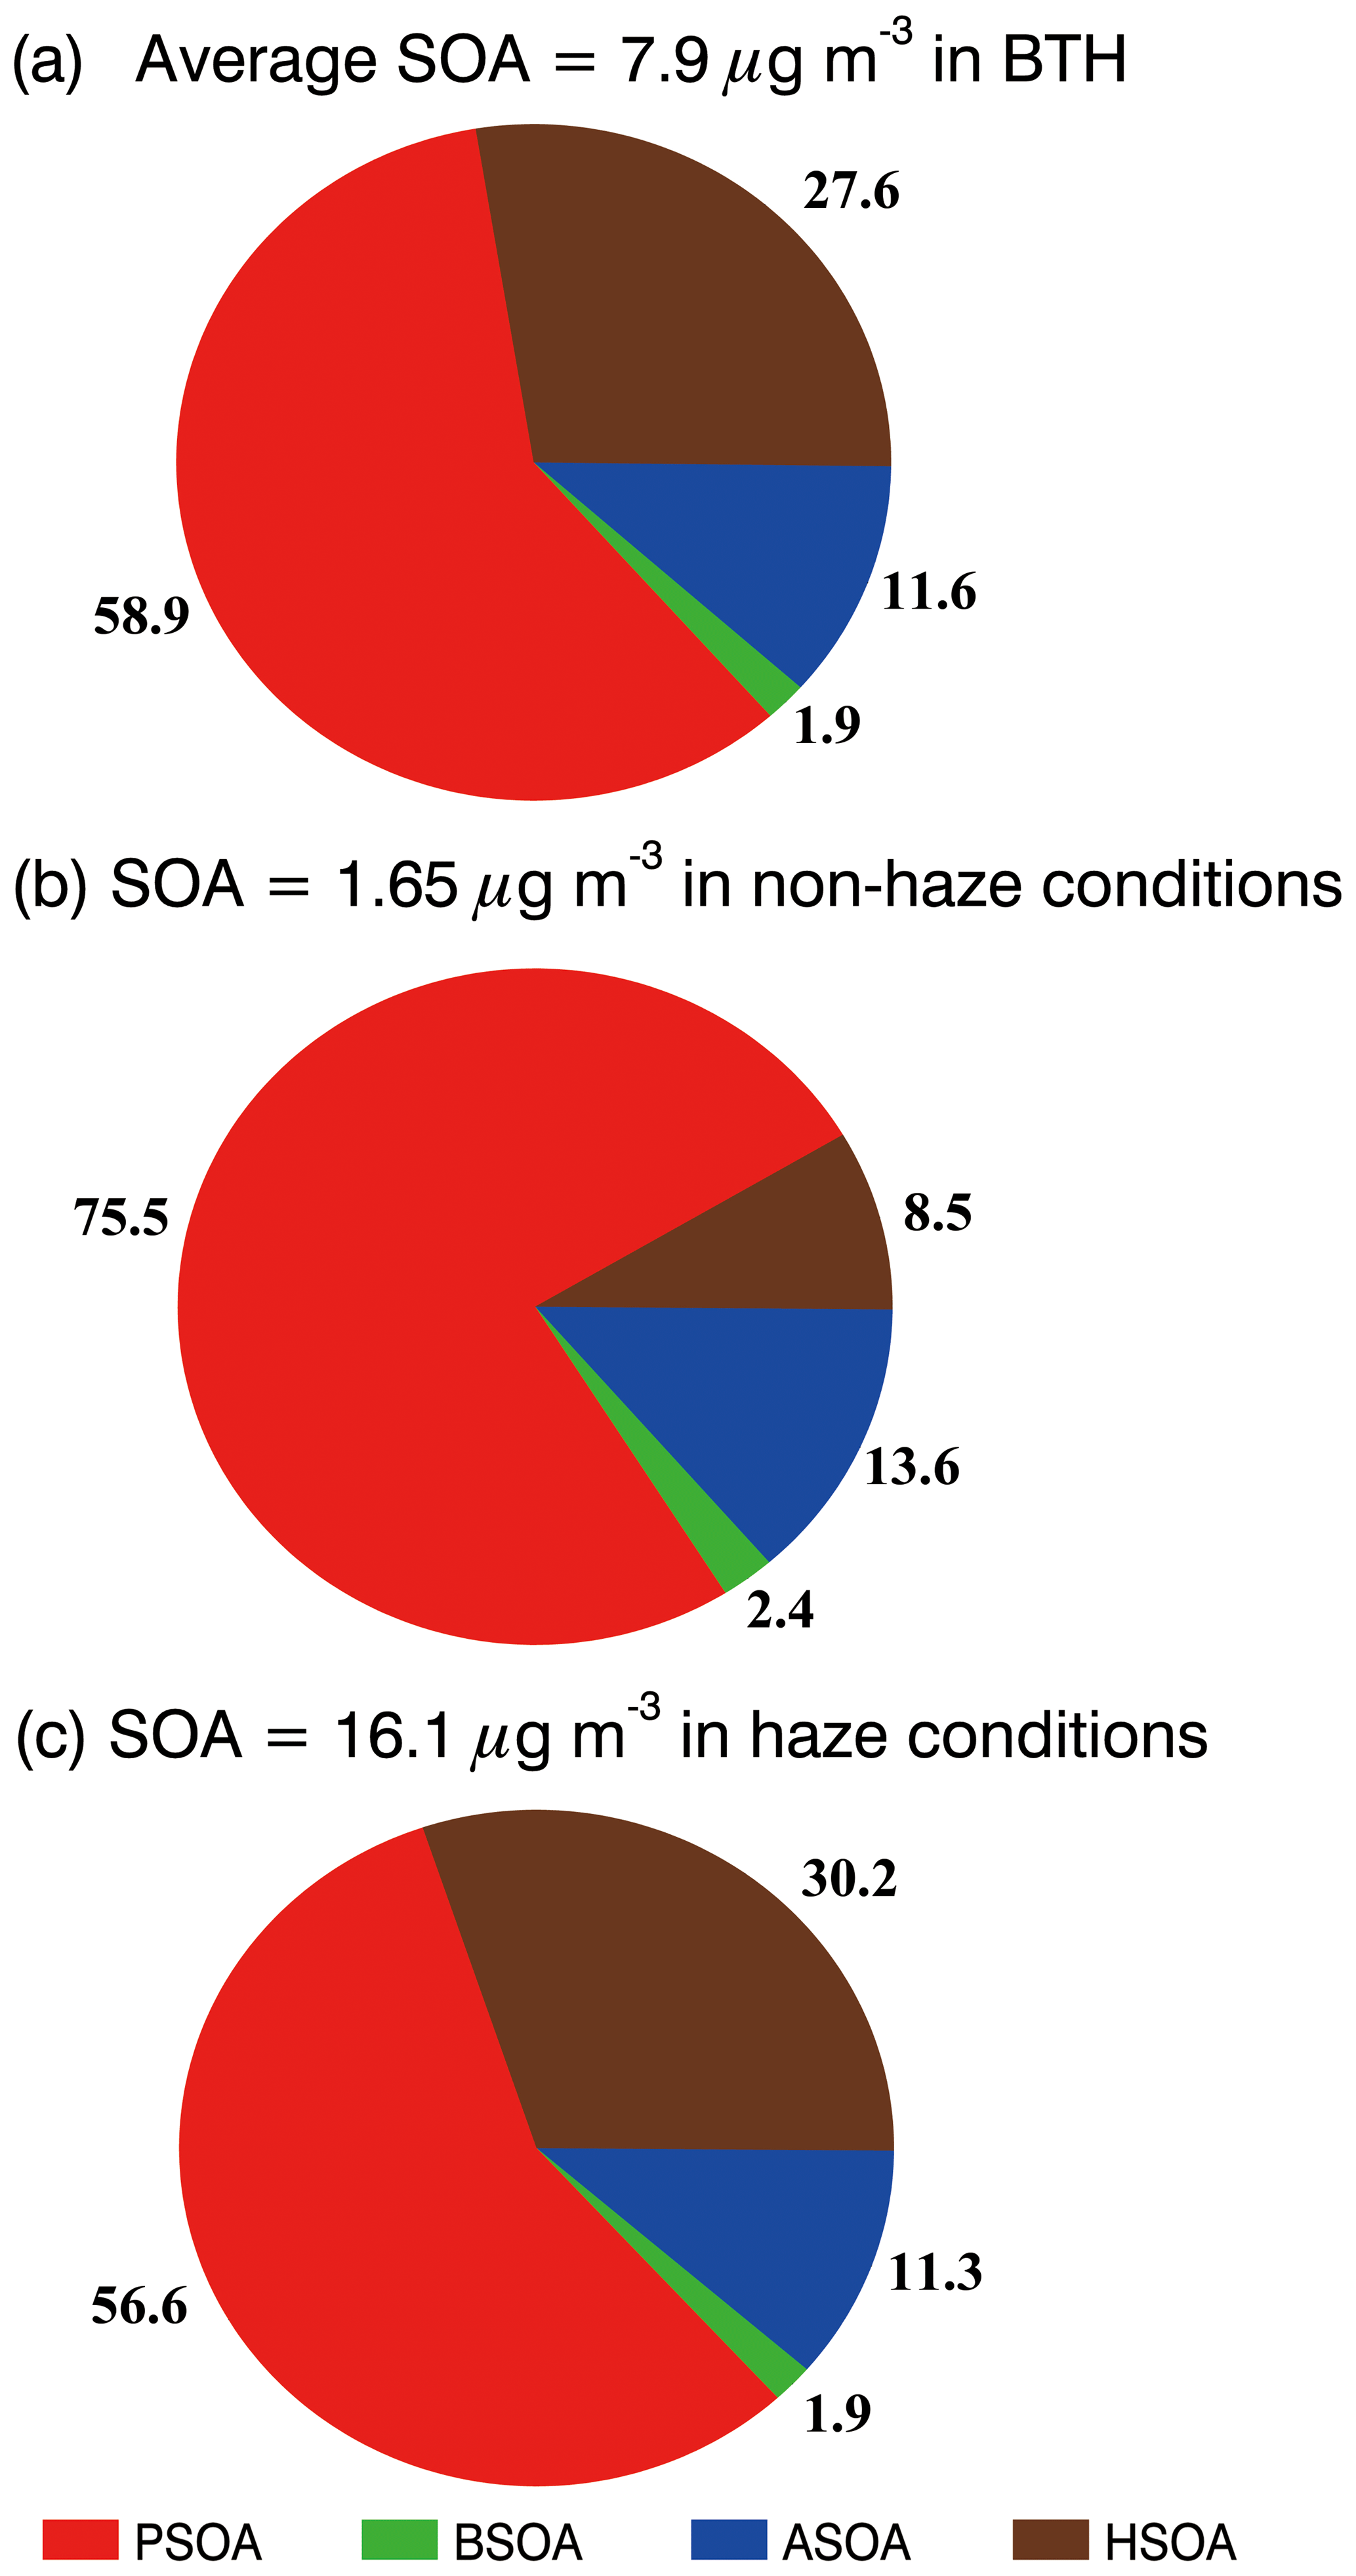
Figure 9SOA contribution of different formation pathways over BTH (a) during the whole simulation period, (b) under non-haze conditions, and (c) under haze conditions.
The vertical distribution is an important feature for evaluating the climatic impact of OA. Previous studies have shown large discrepancies between the simulated SOA vertical distribution and aircraft measurements (Heald et al., 2011; Tsigaridis et al., 2014). Although the OA vertical distribution measurements are not available during the simulation episode, analyses are still performed to explore the difference in the simulated vertical profiles of POA and SOA, caused by the heterogeneous HONO sources. Figure 6a shows the vertical distribution of the average simulated POA and SOA concentrations during the haze episode over the IRSDE site in the BASE and HOMO cases. POA and SOA concentrations decrease rapidly from the ground level to about 2 km, and are lower than 0.4 and 0.5 µg m−3 above 2 km, respectively. The POA concentration at the ground level is much higher than that of SOA, but its decrease in the vertical direction is much faster than that of SOA, which is consistent with observations from Beijing by Sun et al. (2015). They found that the SOA contribution to the OA mass at 260 m is higher than that at ground level. The SOA enhancement due to the heterogeneous HONO sources is remarkable near the ground surface and rapidly decreases with the altitude, showing the dominant HONO contribution of the ground surface. Generally, the heterogeneous HONO sources do not substantially increase the O3 concentration in the PBL, with an enhancement of less than 4 % (Fig. 6b).
Figure 7a shows the spatial pattern of simulated near-surface SOA concentrations averaged during the haze episode in the BASE case. The high near-surface SOA concentrations are concentrated in the plain region of BTH, generally exceed 10 µg m−3, and can be up to 20 µg m−3 in southern Hebei Province. Figure 7b presents the spatial distribution of the average near-surface SOA enhancement due to heterogeneous HONO sources (). Heterogeneous HONO sources play an important role in the near-surface SOA formation, increasing the SOA concentration by 10 % to 55 % in BTH; SOA enhancement is particularly remarkable in the plain region of BTH (more than 40 %). The regional average near-surface SOA concentration is increased from 5.4 µg m−3 in the HOMO case to 7.9 µg m−3 in the BASE case by heterogeneous HONO sources, which translates to an enhancement of about 46.3 %.
3.3 SOA formation from different pathways in winter
Four SOA formation pathways are considered in the WRF-CHEM model, including (1) oxidation and partitioning of POA treated as semi-volatile (PSOA), (2) oxidation of anthropogenic VOCs (ASOA), (3) oxidation of biogenic VOCs (BSOA), and (4) heterogeneous reactions of glyoxal and methylglyoxal on aerosol surfaces (HSOA). We have further analyzed the SOA formation from the four pathways in BTH during the haze episode.
Figure 8 shows the spatial distribution of the average predicted concentration of near-surface PSOA, ASOA, BSOA, and HSOA during the whole simulation period. The BSOA concentration in BTH is rather low, less than 0.5 µg m−3, which is caused by the low emissions of biogenic VOCs due to weak insolation in winter. The spatial distributions of ASOA, PSOA, and HSOA are similar, showing similar emission patterns with respect to their precursors. ASOA, PSOA, and HSOA are primarily distributed in the plain region of BTH, with concentrations exceeding 2.0, 10.0, and 6.0 µg m−3 in the southern Hebei Province, respectively.
Figure 9 provides the percentage contribution of ASOA, BSOA, PSOA, and HSOA to the total SOA mass averaged during the simulation period in BTH. PSOA dominates the total SOA mass in the region, with a contribution of 58.9 %. Unexpectedly, HSOA constitutes the second most important SOA formation pathway, contributing 27.6 % to the SOA mass. The contributions of ASOA and BSOA are 11.6 % and 1.9 %, respectively. The average near-surface SOA mass concentration increases from 1.7 µg m−3 under non-haze conditions (defined as hourly PM2.5 concentration less than 75 µg m−3) to 16.1 µg m−3 under haze conditions (defined as hourly PM2.5 concentration exceeding 75 µg m−3) (Fig. 9b and c). The contribution of HSOA to the SOA mass increases, from 8.5 % under non-haze conditions to 30.2 % under haze conditions, highlights the importance of the heterogeneous reactions of dicarbonyls to SOA formation during haze days.
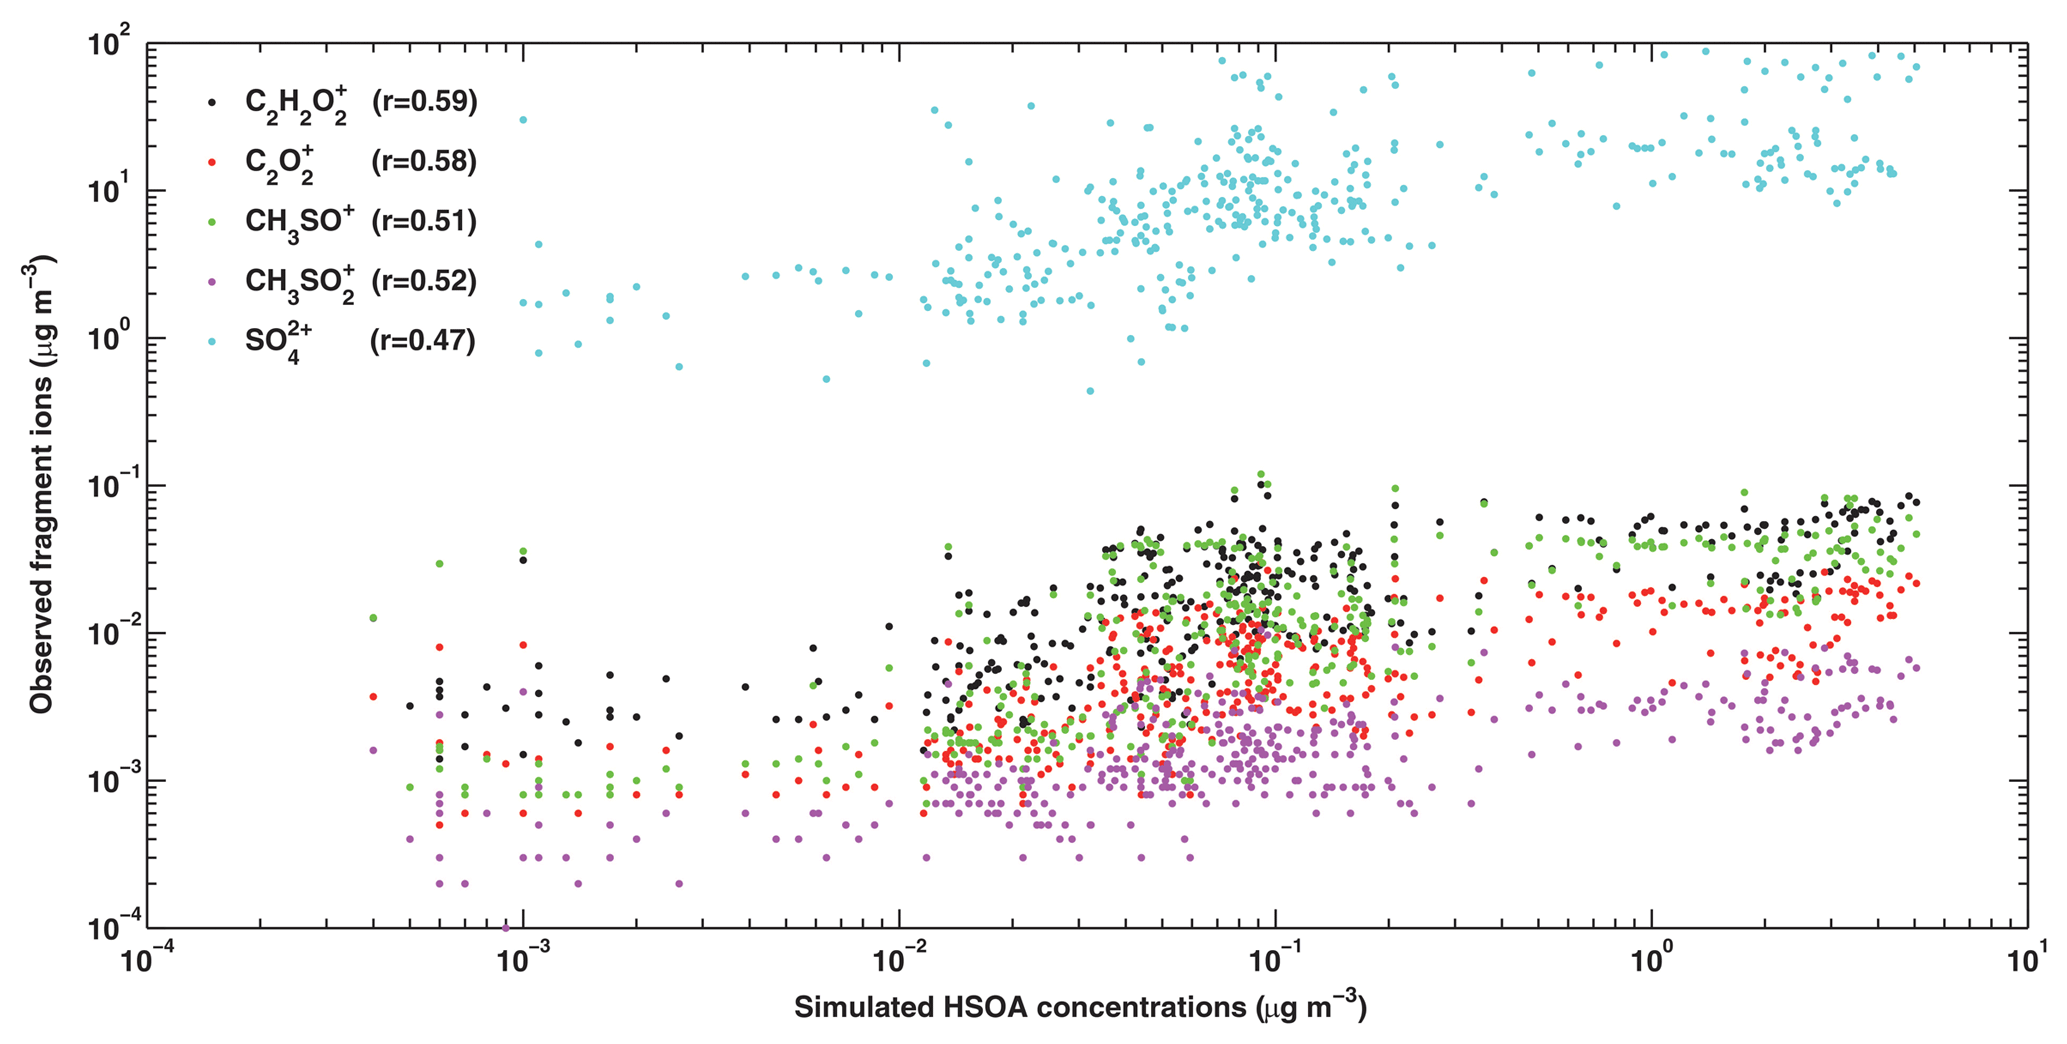
Figure 10Scatterplot of the simulated HSOA concentration and the AMS measured , , , CH3SO+, and concentrations from 9 to 26 January 2014 at the IRSDE site in Beijing. All of the correlations are statistically significant with p values smaller than 0.01.
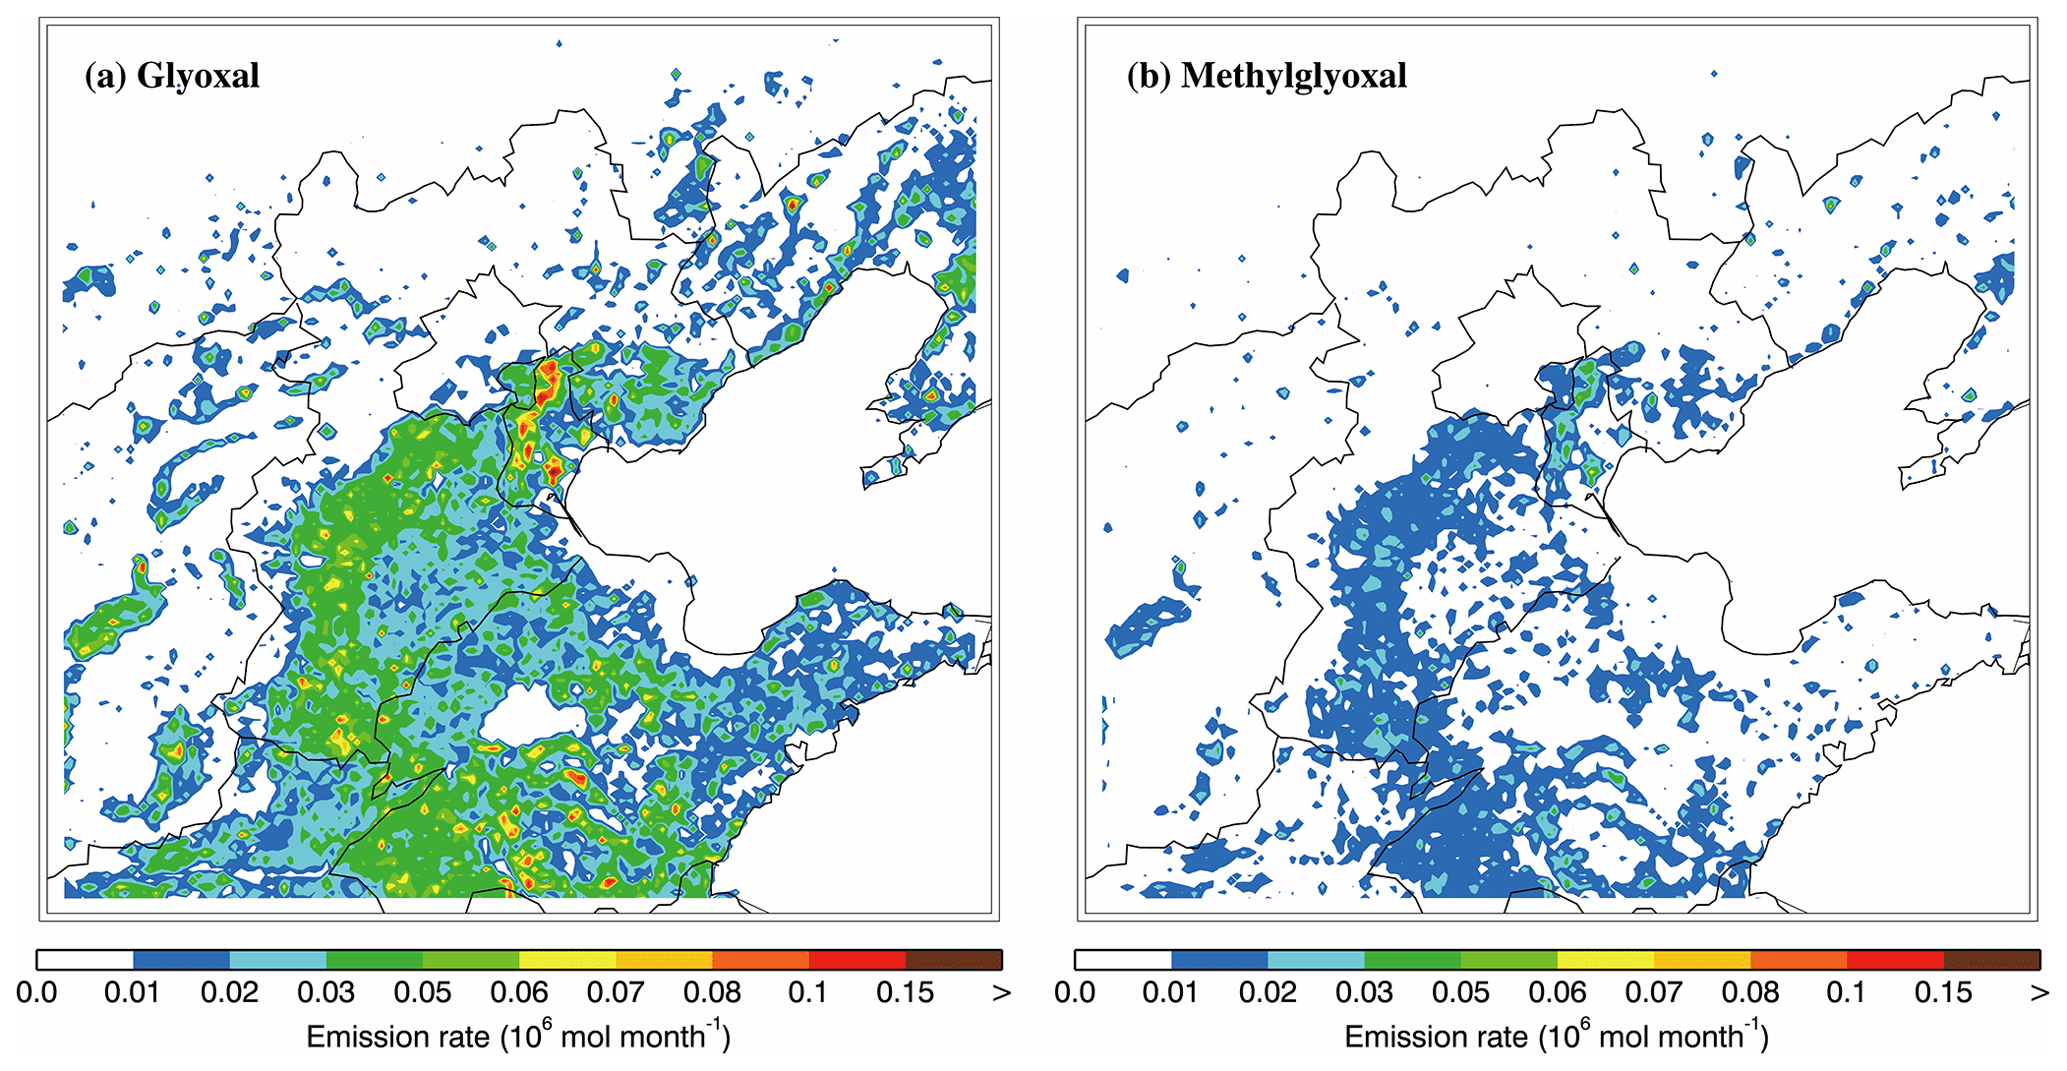
Figure 11Spatial distribution of the emission rate of (a) glyoxal and (b) methylglyoxal from residential sources in January 2014.
Considering that the irreversible uptake of glyoxal and methylglyoxal is an important pathway for SOA formation under haze conditions in BTH, the HSOA formation is further investigated. Sun et al. (2016) resolved aqueous SOA (aq-SOA) factors from the AMS measurements, and reported that aq-SOA is well correlated with several specific fragment ions, including (m∕z 58), (m∕z 56), and (m∕z 46), which are typical fragment ions of glyoxal and methylglyoxal (Chhabra et al., 2010). Additionally, aq-SOA is also highly correlated with several sulfur-containing ions, e.g., CH3SO+, , and , which are typical fragment ions of methanesulfonic acid (MSA). Sulfate is also mainly formed in the aqueous phase during wintertime haze days (G. Li et al., 2017). (m∕z 46) is not compared with the simulation, as it has the same m∕z value as the ion, causing some biases. In addition, the concentrations of can not be extracted from the AMS measurement, so it is not used for comparisons. Figure 10 shows the scatterplot of the simulated HSOA concentration in addition to the AMS measured sulfate and several specific fragment ion concentrations during the episode. The simulated HSOA exhibits good correlations with these specific fragment ions with correlation coefficients exceeding 0.50 (especially with regard to the and ions which have correlation coefficients of 0.59 and 0.58, respectively) showing reasonable simulation of HSOA formation. The correlation of sulfate with HSOA is not as good as those of the fragment ions, indicating that non-heterogeneous sources also play a considerable role in sulfate formation. All of the correlations are statistically significant with p values smaller than 0.01. Furthermore, the average observed OM ∕ OC and O ∕ C ratios during the simulation period are 1.42 and 0.21, respectively.
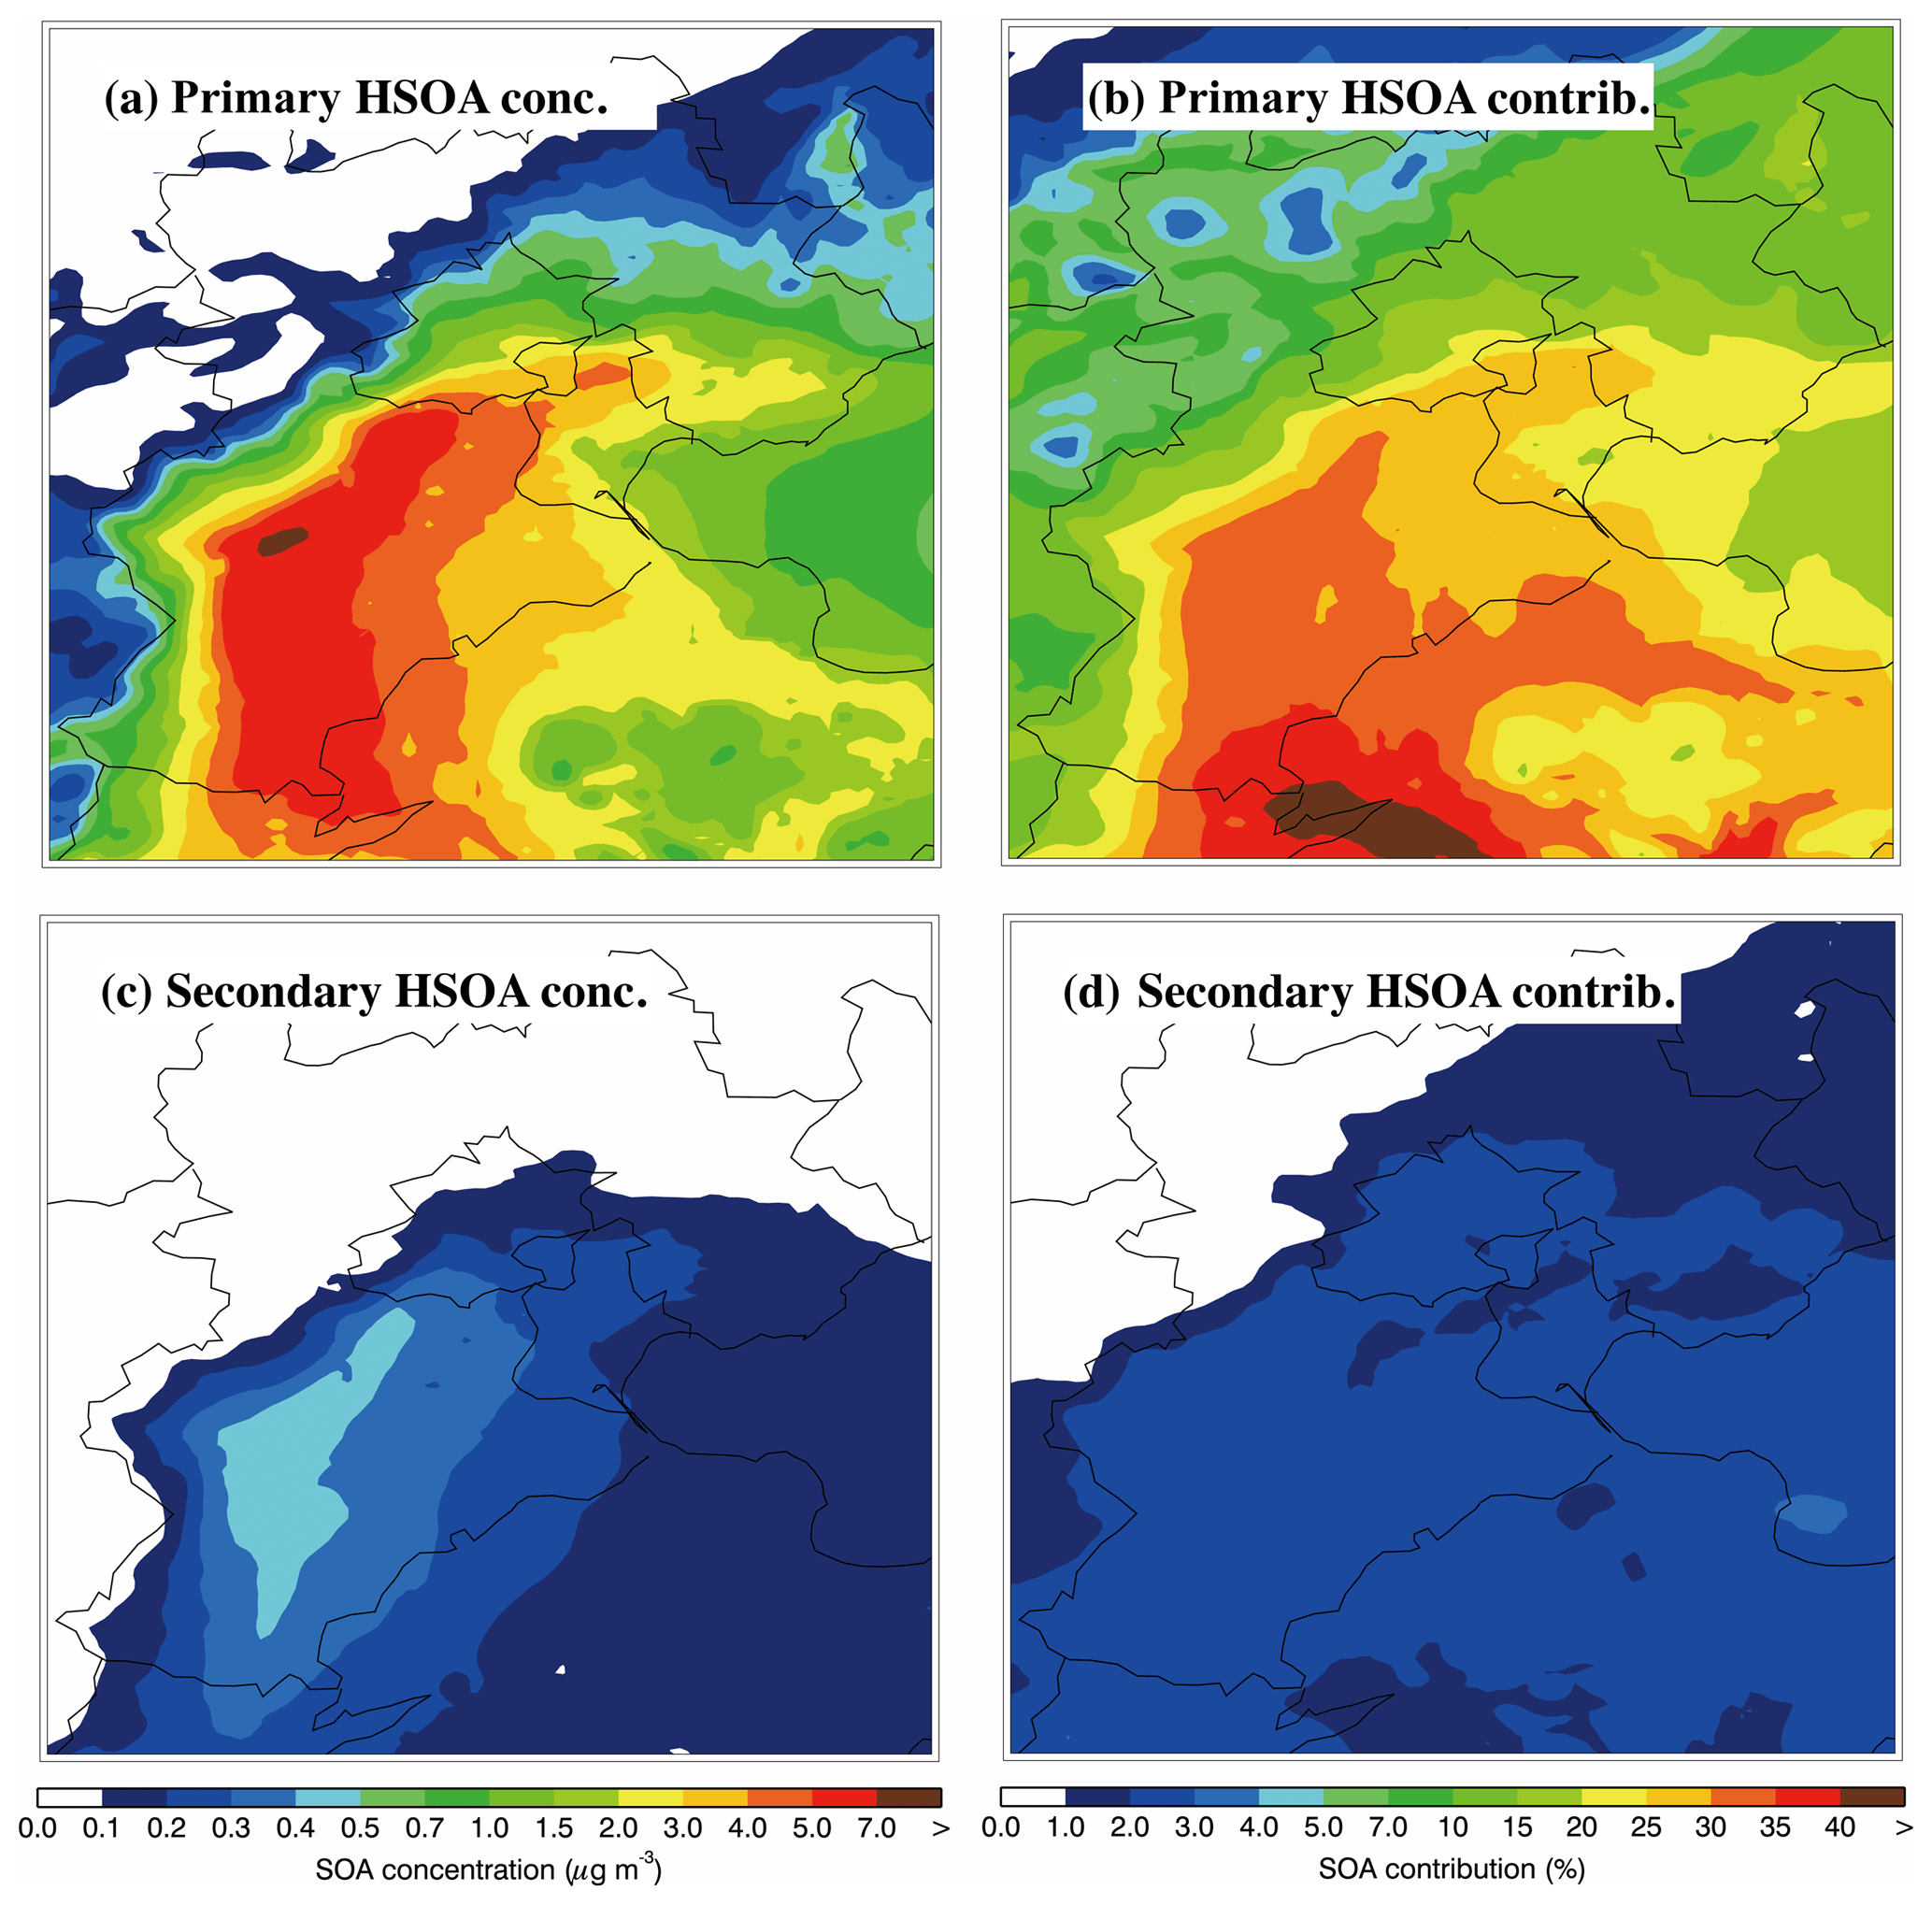
Figure 12Spatial distribution of (a) average primary HSOA concentrations and (b) the contribution of primary HSOA to total SOA; and (c) average secondary HSOA concentrations and (d) the contribution of secondary HSOA to total SOA during the simulation period.
The gas-phase glyoxal and methylglyoxal are from direct emissions and secondary formations in the atmosphere. The residential sources include biofuel and coal combustion, and attain peak emissions in winter due to residential heating in northern China. M. Li et al. (2017) estimated that the residential sector contributed about 27 % of non-methane VOC emissions in China in 2010, and biofuel combustion contributed a large part of the oxygenated VOCs, alkynes, and alkenes to residential sector emissions. Laboratory and field studies have shown that wildfires and agricultural waste burning also emit glyoxal and methylglyoxal. Hays et al. (2002) detected glyoxal and methylglyoxal emissions from six kinds of biomass in the US and measured their emission rates for different kinds of biomass. Zarzana et al. (2017) observed glyoxal and methylglyoxal emissions from agricultural biomass burning plumes by aircraft. Koss et al. (2018) measured the emission factors of glyoxal and methylglyoxal by burning biofuels characteristic of the western US. Fu et al. (2008) estimated that 20 % of glyoxal comes from biomass burning and 17 % comes from biofuel use on a global scale, whereas 5 % and 3 % of methylglyoxal comes from biomass burning and biofuel use, respectively. During wintertime, residential emissions are the most important primary source of glyoxal and methylglyoxal in the BTH region. Figure 11 shows the spatial distribution of emissions of glyoxal and methylglyoxal from residential sources. The intense emissions of glyoxal and methylglyoxal mainly occur in the plain region of BTH, and the high emission rates exceed 0.03×10⁶ and 0.01×10⁶ mol month−1, respectively. Glyoxal and methylglyoxal can also be produced from the oxidation of anthropogenic and biogenic VOCs, such as isoprene and aromatics (Fu et al., 2008; Myriokefalitakis et al., 2008).
To investigate the contribution of primary and secondary gas-phase glyoxal and methylglyoxal to HSOA, the HSOA formed from primary emissions and the oxidation of VOCs are marked as primary and secondary HSOA in the model, respectively, and are tracked in simulations. Figure 12a and b present the spatial distribution of the average concentration of primary HSOA and its contribution to the total SOA mass. The primary HSOA distribution corresponds well with the emissions of glyoxal and methylglyoxal in BTH, and the primary HSOA mass concentrations exceed 5 µg m−3 in the southern Hebei Province. The contribution of primary HSOA to the total SOA mass ranges from 20 % to 40 % in the plain region of BTH, and exceeds 40 % in the western Shandong Province, which is caused by the high emissions of glyoxal and methylglyoxal and the simulated low concentrations of PSOA, ASOA, and BSOA. The secondary HSOA concentrations are fairly low (less than 0.5 µg m−3) in BTH, and its contribution to the total SOA mass does not exceed 4 %, which is much lower than that of primary HSOA. The respective regional averages of primary and secondary HSOA over BTH are 2.0 and 0.17 µg m−3, contributing about 25.5 % and 2.1 % to the total SOA mass, respectively; this shows that primary HSOA constitutes an important SOA formation pathway.
It is worth noting that isoprene epoxydiol (IEPOX SOA) formed by aqueous chemistry also plays a considerable role in SOA formation. However, Hu et al. (2017) showed that the IEPOX SOA contribution to the SOA formation in BTH is insignificant during the wintertime due to the very low biogenic isoprene emissions and the elevated NOx concentrations which substantially suppress the production of IEPOX SOA from isoprene oxidation.
In the present study, a heavy haze episode from 9 to 26 January 2014 in the BTH region is simulated using the WRF-CHEM model to investigate the impact of heterogeneous HONO sources on SOA formation and SOA formation from different pathways. A previous study has shown that the model generally reproduces spatial distributions and temporal variations of PM2.5, SO2, NO2, and O3 concentrations well when compared with observations made during the abovementioned episode (Li et al., 2018). The model also captures the temporal variation of POA, HOA, BBOA + COA, and CCOA concentrations reasonably well compared with measurements in Beijing.
During the episode, the observed low O3 concentration does not facilitate OH production from O3 photolysis, and HONO becomes a dominant OH contributor at the surface level in Beijing. Model results reveal that when heterogeneous HONO sources are considered, the WRF-CHEM model reproduces the temporal variation of HONO concentrations reasonably well compared with measurements in Beijing. Heterogeneous HONO sources substantially enhance SOA formation and also improve the SOA simulation. The regional average near-surface SOA concentration is increased by about 46.3 % due to heterogeneous HONO sources during the episode.
The regional average contributions of ASOA, BSOA, PSOA, and HSOA to the total SOA mass are 11.6 %, 1.9 %, 58.9 %, and 27.6 % during the simulation period in BTH, respectively. HSOA constitutes the second most important contributor to the total SOA mass and the contribution increases from 8.5 % under non-haze conditions to 30.2 % under haze conditions, showing the importance of heterogeneous reactions of dicarbonyls to the SOA formation during haze days. In addition, glyoxal and methylglyoxal emitted from residential sources dominate the HSOA concentration, contributing about 25.5 % to the total SOA mass on average; this indicates that direct emissions of dicarbonyl compounds play an important role in the SOA formation during haze days in wintertime.
Our model results show that both the heterogeneous HONO sources and primary emissions of glyoxal and methylglyoxal play an important role in SOA formation in BTH during the haze episodes, constituting the key factor to close the gap between measurements and simulations. It is worth noting that, although the simulated SOA is generally consistent with the measurement when heterogeneous HONO sources and irreversible uptake of dicarbonyl compounds are considered, SOA simulations are influenced by many factors, including measurements, meteorology, emissions, SOA formation mechanisms, and treatments, which need to be comprehensively investigated.
The historic profiles of the observed ambient air pollutants can be accessed from the following website: http://www.aqistudy.cn/ (China MEP, 2013). The HR-ToF-AMS and HONO measurement data from the IRSDE site are available upon request from the corresponding author (ligh@ieecas.cn).
GL (the contact author) provided the ideas and financial support, verified the conclusions, and revised the paper. LX conducted the research, designed the experiments, carried out the methodology, performed the simulation, processed the data, prepared the data visualization, and prepared the paper with contributions from all authors. JW, XL, LL, and JZ analyzed the study data, validated the model performance, and reviewed the paper. ME, ST, SL, IEH, RH, MG, and ASHP provided the observation data from the IRSDE site, synthesized the observation, and reviewed the paper. XT and JC provided critical reviews at the pre-publication stage.
The authors declare that they have no conflict of interest.
This article is part of the special issue “Multiphase chemistry of secondary aerosol formation under severe haze”. It is not associated with a conference.
This work is financially supported by the National Key R&D Plan
(2017YFC0210000) and the National Research Program for Key Issues in Air
Pollution Control. Li Xing acknowledges the support from the National Natural
Science Foundation of China (grant nos. 41807310 and 41661144020) and the Shaanxi Province
Postdoctoral Science Foundation (grant no. 2017BSHEDZZ61). The PSI authors
acknowledge financial support from the Swiss National Science Foundation
(SNSF) within the HAZECHINA (Haze pollution in China: sources and
atmospheric evolution of particulate matter, IZLCZ2_169986) project.
Edited by: Jian Wang
Reviewed by: two anonymous referees
Arens, F., Gutzwiller, L., Baltensperger, U., Gaggeler, H. W., and Ammann, M.: Heterogeneous reaction of NO2 on diesel soot particles, Environ. Sci. Technol., 35, 2191–2199, https://doi.org/10.1021/es000207s, 2001.
Aumont, B., Chervier, F., and Laval, S.: Contribution of HONO sources to the chemistry in the polluted boundary layer, Atmos. Environ., 37, 487–498, https://doi.org/10.1016/s1352-2310(02)00920-2, 2003.
Bei, N., Li, G., Huang, R.-J., Cao, J., Meng, N., Feng, T., Liu, S., Zhang, T., Zhang, Q., and Molina, L. T.: Typical synoptic situations and their impacts on the wintertime air pollution in the Guanzhong basin, China, Atmos. Chem. Phys., 16, 7373–7387, https://doi.org/10.5194/acp-16-7373-2016, 2016.
Bei, N., Wu, J., Elser, M., Feng, T., Cao, J., El-Haddad, I., Li, X., Huang, R., Li, Z., Long, X., Xing, L., Zhao, S., Tie, X., Prévôt, A. S. H., and Li, G.: Impacts of meteorological uncertainties on the haze formation in Beijing-Tianjin-Hebei (BTH) during wintertime: a case study, Atmos. Chem. Phys., 17, 14579–14591, https://doi.org/10.5194/acp-17-14579-2017, 2017.
Binkowski, F. S. and Roselle, S. J.: Models-3 community multiscale air quality (CMAQ) model aerosol component – 1. Model description, J. Geophys. Res.-Atmos., 108, 4183, https://doi.org/10.1029/2001jd001409, 2003.
Canonaco, F., Crippa, M., Slowik, J. G., Baltensperger, U., and Prévôt, A. S. H.: SoFi, an IGOR-based interface for the efficient use of the generalized multilinear engine (ME-2) for the source apportionment: ME-2 application to aerosol mass spectrometer data, Atmos. Meas. Tech., 6, 3649–3661, https://doi.org/10.5194/amt-6-3649-2013, 2013.
Chang, L., Xu, J., Tie, X., and Wu, J.: Impact of the 2015 El Nino event on winter air quality in China, Sci. Rep., 6, 34275, https://doi.org/10.1038/srep34275, 2016.
Chen, F. and Dudhia, J.: Coupling an advanced land surface-hydrology model with the Penn State-NCAR MM5 modeling system. Part I: Model implementation and sensitivity, Mon. Weather Rev., 129, 569–585, 2001.
Chen, Q., Fu, T.-M., Hu, J. L., Ying, Q., and Zhang, L.: Modelling secondary organic aerosols in China, Natl. Sci. Rev., 4, 806–809, https://doi.org/10.1093/nsr/nwx143, 2017.
Chhabra, P. S., Flagan, R. C., and Seinfeld, J. H.: Elemental analysis of chamber organic aerosol using an aerodyne high-resolution aerosol mass spectrometer, Atmos. Chem. Phys., 10, 4111–4131, https://doi.org/10.5194/acp-10-4111-2010, 2010.
Chine MEP – Ministry of Environmental Protection: Online Monitoring and Analysis Platform of China Air Quality, available at: http://www.aqistudy.cn/ (last access: February 2019), 2013.
Chou, M. D. and Suarez, M. J.: A solar radiation parameterization for atmospheric studies, NASA/TM-1999-104606, Nasa Tech. memo, 15, 40 pp., 1999.
Chou, M. D., Suarez, M. J., Liang, X. Z., Yan, M. H., and Cote, C.: A Thermal Infrared Radiation Parameterization for Atmospheric Studies, Tech. Rep. NASA/TM-2001-104606, 19, 55 pp., 2001.
Chung, S. H. and Seinfeld, J. H.: Global distribution and climate forcing of carbonaceous aerosols, J. Geophys. Res.-Atmos., 107, 4407, https://doi.org/10.1029/2001jd001397, 2002.
Czader, B. H., Rappenglück, B., Percell, P., Byun, D. W., Ngan, F., and Kim, S.: Modeling nitrous acid and its impact on ozone and hydroxyl radical during the Texas Air Quality Study 2006, Atmos. Chem. Phys., 12, 6939–6951, https://doi.org/10.5194/acp-12-6939-2012, 2012.
Donahue, N. M., Robinson, A. L., Stanier, C. O., and Pandis, S. N.: Coupled partitioning, dilution, and chemical aging of semivolatile organics, Environ. Sci. Technol., 40, 2635–2643, https://doi.org/10.1021/es052297c, 2006.
Dusanter, S., Vimal, D., Stevens, P. S., Volkamer, R., Molina, L. T., Baker, A., Meinardi, S., Blake, D., Sheehy, P., Merten, A., Zhang, R., Zheng, J., Fortner, E. C., Junkermann, W., Dubey, M., Rahn, T., Eichinger, B., Lewandowski, P., Prueger, J., and Holder, H.: Measurements of OH and HO2 concentrations during the MCMA-2006 field campaign – Part 2: Model comparison and radical budget, Atmos. Chem. Phys., 9, 6655–6675, https://doi.org/10.5194/acp-9-6655-2009, 2009.
Elser, M., Huang, R.-J., Wolf, R., Slowik, J. G., Wang, Q., Canonaco, F., Li, G., Bozzetti, C., Daellenbach, K. R., Huang, Y., Zhang, R., Li, Z., Cao, J., Baltensperger, U., El-Haddad, I., and Prévôt, A. S. H.: New insights into PM2.5 chemical composition and sources in two major cities in China during extreme haze events using aerosol mass spectrometry, Atmos. Chem. Phys., 16, 3207–3225, https://doi.org/10.5194/acp-16-3207-2016, 2016.
Feng, T., Li, G., Cao, J., Bei, N., Shen, Z., Zhou, W., Liu, S., Zhang, T., Wang, Y., Huang, R.-J., Tie, X., and Molina, L. T.: Simulations of organic aerosol concentrations during springtime in the Guanzhong Basin, China, Atmos. Chem. Phys., 16, 10045–10061, https://doi.org/10.5194/acp-16-10045-2016, 2016.
Fu, T.-M., Jacob, D. J., Wittrock, F., Burrows, J. P., Vrekoussis, M., and Henze, D. K.: Global budgets of atmospheric glyoxal and methylglyoxal, and implications for formation of secondary organic aerosols, J. Geophys. Res.-Atmos., 113, D15303, https://doi.org/10.1029/2007jd009505, 2008.
Fu, T.-M., Cao, J. J., Zhang, X. Y., Lee, S. C., Zhang, Q., Han, Y. M., Qu, W. J., Han, Z., Zhang, R., Wang, Y. X., Chen, D., and Henze, D. K.: Carbonaceous aerosols in China: top-down constraints on primary sources and estimation of secondary contribution, Atmos. Chem. Phys., 12, 2725–2746, https://doi.org/10.5194/acp-12-2725-2012, 2012.
Fu, Y. and Liao, H.: Simulation of the interannual variations of biogenic emissions of volatile organic compounds in China: Impacts on tropospheric ozone and secondary organic aerosol, Atmos. Environ., 59, 170–185, https://doi.org/10.1016/j.atmosenv.2012.05.053, 2012.
Guenther, A., Karl, T., Harley, P., Wiedinmyer, C., Palmer, P. I., and Geron, C.: Estimates of global terrestrial isoprene emissions using MEGAN (Model of Emissions of Gases and Aerosols from Nature), Atmos. Chem. Phys., 6, 3181–3210, https://doi.org/10.5194/acp-6-3181-2006, 2006.
Guo, S., Hu, M., Zamora, M. L., Peng, J., Shang, D., Zheng, J., Du, Z., Wu, Z., Shao, M., Zeng, L., Molina, M. J., and Zhang, R.: Elucidating severe urban haze formation in China, P. Natl. Acad. Sci. USA, 111, 17373–17378, https://doi.org/10.1073/pnas.1419604111, 2014.
Gutzwiller, L., Arens, F., Baltensperger, U., Gaggeler, H. W., and Ammann, M.: Significance of semivolatile diesel exhaust organics for secondary HONO formation, Environ. Sci. Technol., 36, 677–682, https://doi.org/10.1021/es015673b, 2002.
Hallquist, M., Wenger, J. C., Baltensperger, U., Rudich, Y., Simpson, D., Claeys, M., Dommen, J., Donahue, N. M., George, C., Goldstein, A. H., Hamilton, J. F., Herrmann, H., Hoffmann, T., Iinuma, Y., Jang, M., Jenkin, M. E., Jimenez, J. L., Kiendler-Scharr, A., Maenhaut, W., McFiggans, G., Mentel, Th. F., Monod, A., Prévôt, A. S. H., Seinfeld, J. H., Surratt, J. D., Szmigielski, R., and Wildt, J.: The formation, properties and impact of secondary organic aerosol: current and emerging issues, Atmos. Chem. Phys., 9, 5155–5236, https://doi.org/10.5194/acp-9-5155-2009, 2009.
Han, Z., Zhang, R., Wang, Q. G., Wang, W., Cao, J., and Xu, J.: Regional modeling of organic aerosols over China in summertime, J. Geophys. Res.-Atmos., 113, D11202, https://doi.org/10.1029/2007jd009436, 2008.
Han, Z., Xie, Z., Wang, G., Zhang, R., and Tao, J.: Modeling organic aerosols over east China using a volatility basis-set approach with aging mechanism in a regional air quality model, Atmos. Environ., 124, 186–198, https://doi.org/10.1016/j.atmosenv.2015.05.045, 2016.
Hays, M. D., Geron, C. D., Linna, K. J., and Smith, D.: Speciation of gas-phase and fine particle emissions from burning of foliar fuels, Environ. Sci. Technol., 36, 2281–2295, https://doi.org/10.1021/es0111683, 2002.
Heald, C. L., Coe, H., Jimenez, J. L., Weber, R. J., Bahreini, R., Middlebrook, A. M., Russell, L. M., Jolleys, M., Fu, T.-M., Allan, J. D., Bower, K. N., Capes, G., Crosier, J., Morgan, W. T., Robinson, N. H., Williams, P. I., Cubison, M. J., DeCarlo, P. F., and Dunlea, E. J.: Exploring the vertical profile of atmospheric organic aerosol: comparing 17 aircraft field campaigns with a global model, Atmos. Chem. Phys., 11, 12673–12696, https://doi.org/10.5194/acp-11-12673-2011, 2011.
Henze, D. K. and Seinfeld, J. H.: Global secondary organic aerosol from isoprene oxidation, Geophys. Res. Lett., 33, L09812, https://doi.org/10.1029/2006gl025976, 2006.
Hong, S.-Y. and Lim, J.-O. J.: The WRF Single-Moment 6-Class Microphysics Scheme (WSM6), Asia-Pac. J. Atmos. Sci., 42, 129–151, 2006.
Horowitz, L. W., Walters, S., Mauzerall, D. L., Emmons, L. K., Rasch, P. J., Granier, C., Tie, X. X., Lamarque, J. F., Schultz, M. G., Tyndall, G. S., Orlando, J. J., and Brasseur, G. P.: A global simulation of tropospheric ozone and related tracers: Description and evaluation of MOZART, version 2, J. Geophys. Res.-Atmos., 108, 4784, https://doi.org/10.1029/2002jd002853, 2003.
Hu, J., Wang, P., Ying, Q., Zhang, H., Chen, J., Ge, X., Li, X., Jiang, J., Wang, S., Zhang, J., Zhao, Y., and Zhang, Y.: Modeling biogenic and anthropogenic secondary organic aerosol in China, Atmos. Chem. Phys., 17, 77–92, https://doi.org/10.5194/acp-17-77-2017, 2017.
Huang, R.-J., Zhang, Y., Bozzetti, C., Ho, K.-F., Cao, J.-J., Han, Y., Daellenbach, K. R., Slowik, J. G., Platt, S. M., Canonaco, F., Zotter, P., Wolf, R., Pieber, S. M., Bruns, E. A., Crippa, M., Ciarelli, G., Piazzalunga, A., Schwikowski, M., Abbaszade, G., Schnelle-Kreis, J., Zimmermann, R., An, Z., Szidat, S., Baltensperger, U., El Haddad, I., and Prévôt, A. S. H.: High secondary aerosol contribution to particulate pollution during haze events in China, Nature, 514, 218–222, https://doi.org/10.1038/nature13774, 2014.
IPCC: Climate Change 2013: The Physical Science Basis, Cambridge University Press, Cambridge, UK and New York, NY, USA, 1535 pp., 2013.
Janjić, Z. I.: Nonsingular Implementation of the Mellor-Yamada Level 2.5 Scheme in the NCEP Meso Model, Ncep Office Note, 437, 61 pp., 2002.
Jiang, F., Liu, Q., Huang, X., Wang, T., Zhuang, B., and Xie, M.: Regional modeling of secondary organic aerosol over China using WRF/Chem, J. Aerosol. Sci., 43, 57–73, https://doi.org/10.1016/j.jaerosci.2011.09.003, 2012.
Koss, A. R., Sekimoto, K., Gilman, J. B., Selimovic, V., Coggon, M. M., Zarzana, K. J., Yuan, B., Lerner, B. M., Brown, S. S., Jimenez, J. L., Krechmer, J., Roberts, J. M., Warneke, C., Yokelson, R. J., and de Gouw, J.: Non-methane organic gas emissions from biomass burning: identification, quantification, and emission factors from PTR-ToF during the FIREX 2016 laboratory experiment, Atmos. Chem. Phys., 18, 3299–3319, https://doi.org/10.5194/acp-18-3299-2018, 2018.
Lennartson, E. M., Wang, J., Gu, J., Castro Garcia, L., Ge, C., Gao, M., Choi, M., Saide, P. E., Carmichael, G. R., Kim, J., and Janz, S. J.: Diurnal variation of aerosol optical depth and PM2.5 in South Korea: a synthesis from AERONET, satellite (GOCI), KORUS-AQ observation, and the WRF-Chem model, Atmos. Chem. Phys., 18, 15125–15144, https://doi.org/10.5194/acp-18-15125-2018, 2018.
Li, G., Lei, W., Zavala, M., Volkamer, R., Dusanter, S., Stevens, P., and Molina, L. T.: Impacts of HONO sources on the photochemistry in Mexico City during the MCMA-2006/MILAGO Campaign, Atmos. Chem. Phys., 10, 6551–6567, https://doi.org/10.5194/acp-10-6551-2010, 2010.
Li, G., Zavala, M., Lei, W., Tsimpidi, A. P., Karydis, V. A., Pandis, S. N., Canagaratna, M. R., and Molina, L. T.: Simulations of organic aerosol concentrations in Mexico City using the WRF-CHEM model during the MCMA-2006/MILAGRO campaign, Atmos. Chem. Phys., 11, 3789–3809, https://doi.org/10.5194/acp-11-3789-2011, 2011.
Li, G., Bei, N., Cao, J., Huang, R., Wu, J., Feng, T., Wang, Y., Liu, S., Zhang, Q., Tie, X., and Molina, L. T.: A possible pathway for rapid growth of sulfate during haze days in China, Atmos. Chem. Phys., 17, 3301–3316, https://doi.org/10.5194/acp-17-3301-2017, 2017.
Li, G. H., Zhang, R. Y., Fan, J. W., and Tie, X. X.: Impacts of black carbon aerosol on photolysis and ozone, J. Geophys. Res.-Atmos., 110, D23206, https://doi.org/10.1029/2005jd005898, 2005.
Li, H., Zhang, Q., Zhang, Q., Chen, C., Wang, L., Wei, Z., Zhou, S., Parworth, C., Zheng, B., Canonaco, F., Prévôt, A. S. H., Chen, P., Zhang, H., Wallington, T. J., and He, K.: Wintertime aerosol chemistry and haze evolution in an extremely polluted city of the North China Plain: significant contribution from coal and biomass combustion, Atmos. Chem. Phys., 17, 4751–4768, https://doi.org/10.5194/acp-17-4751-2017, 2017.
Li, M., Zhang, Q., Kurokawa, J.-I., Woo, J.-H., He, K., Lu, Z., Ohara, T., Song, Y., Streets, D. G., Carmichael, G. R., Cheng, Y., Hong, C., Huo, H., Jiang, X., Kang, S., Liu, F., Su, H., and Zheng, B.: MIX: a mosaic Asian anthropogenic emission inventory under the international collaboration framework of the MICS-Asia and HTAP, Atmos. Chem. Phys., 17, 935–963, https://doi.org/10.5194/acp-17-935-2017, 2017.
Li, N., Fu, T.-M., Cao, J., Lee, S., Huang, X.-F., He, L.-Y., Ho, K.-F., Fu, J. S., and Lam, Y.-F.: Sources of secondary organic aerosols in the Pearl River Delta region in fall: Contributions from the aqueous reactive uptake of dicarbonyls, Atmos. Environ., 76, 200–207, https://doi.org/10.1016/j.atmosenv.2012.12.005, 2013.
Li, X., Wu, J., Elser, M., Feng, T., Cao, J., El-Haddad, I., Huang, R., Tie, X., Prévôt, A. S. H., and Li, G.: Contributions of residential coal combustion to the air quality in Beijing-Tianjin-Hebei (BTH), China: a case study, Atmos. Chem. Phys., 18, 10675–10691, https://doi.org/10.5194/acp-18-10675-2018, 2018.
Li, Y., An, J., Kajino, M., Gultepe, I., Chen, Y., Song, T., and Xin, J.: Impacts of additional HONO sources on O3 and PM2.5 chemical coupling and control strategies in the Beijing-Tianjin-Hebei region of China, Tellus B, 67, 23930, https://doi.org/10.3402/tellusb.v67.23930, 2015.
Liggio, J., Li, S. M., and McLaren, R.: Reactive uptake of glyoxal by particulate matter, J. Geophys. Res.-Atmos., 110, D10304, https://doi.org/10.1029/2004jd005113, 2005.
Myriokefalitakis, S., Vrekoussis, M., Tsigaridis, K., Wittrock, F., Richter, A., Brühl, C., Volkamer, R., Burrows, J. P., and Kanakidou, M.: The influence of natural and anthropogenic secondary sources on the glyoxal global distribution, Atmos. Chem. Phys., 8, 4965–4981, https://doi.org/10.5194/acp-8-4965-2008, 2008.
Ndour, M., D'Anna, B., George, C., Ka, O., Balkanski, Y., Kleffmann, J., Stemmler, K., and Ammann, M.: Photoenhanced uptake of NO2 on mineral dust: Laboratory experiments and model simulations, Geophys. Res. Lett., 35, L05812, https://doi.org/10.1029/2007gl032006, 2008.
Nenes, A., Pandis, S. N., and Pilinis, C.: ISORROPIA: A new thermodynamic equilibrium model for multiphase multicomponent inorganic aerosols, Aquat. Geochem., 4, 123–152, https://doi.org/10.1023/a:1009604003981, 1998.
Odum, J. R., Hoffmann, T., Bowman, F., Collins, D., Flagan, R. C., and Seinfeld, J. H.: Gas/particle partitioning and secondary organic aerosol yields, Environ. Sci. Technol., 30, 2580–2585, https://doi.org/10.1021/es950943+, 1996.
Robinson, A. L., Donahue, N. M., Shrivastava, M. K., Weitkamp, E. A., Sage, A. M., Grieshop, A. P., Lane, T. E., Pierce, J. R., and Pandis, S. N.: Rethinking organic aerosols: Semivolatile emissions and photochemical aging, Science, 315, 1259–1262, https://doi.org/10.1126/science.1133061, 2007.
Shrivastava, M., Lane, T. E., Donahue, N. M., Pandis, S. N., and Robinson, A. L.: Effects of gas particle partitioning and aging of primary emissions on urban and regional organic aerosol concentrations, J. Geophys. Res.-Atmos., 113, D18301, https://doi.org/10.1029/2007jd009735, 2008.
Shrivastava, M., Zelenyuk, A., Imre, D., Easter, R., Beranek, J., Zaveri, R. A., and Fast, J.: Implications of low volatility SOA and gas-phase fragmentation reactions on SOA loadings and their spatial and temporal evolution in the atmosphere, J. Geophys. Res.-Atmos., 118, 3328–3342, https://doi.org/10.1002/jgrd.50160, 2013.
Shrivastava, M., Easter, R. C., Liu, X., Zelenyuk, A., Singh, B., Zhang, K., Ma, P. L., Chand, D., Ghan, S., Jimenez, J. L., and Zhang, Q.: Global transformation and fate of SOA: Implications of low-volatility SOA and gas-phase fragmentation reactions, J. Geophys. Res.-Atmos., 120, 4169–4195, https://doi.org/10.1002/2014JD022563, 2015.
Shrivastava, M., Zhao, C., Easter, R. C., Qian, Y., Zelenyuk, A., Fast, J. D., Liu, Y., Zhang, Q., and Guenther, A.: Sensitivity analysis of simulated SOA loadings using a variance-based statistical approach, J. Adv. Model. Earth Sy., 8, 499–519, https://doi.org/10.1002/2015MS000554, 2016.
Shrivastava, M., Cappa, C. D., Fan, J., Goldstein, A. H., Guenther, A. B., Jimenez, J. L., Kuang, C., Laskin, A., Martin, S. T., Ng, N. L., and Petaja, T.: Recent advances in understanding secondary organic aerosol: Implications for global climate forcing, Rev. Geophys., 55, 509–559, https://doi.org/10.1002/2016RG000540, 2017.
Stone, D., Whalley, L. K., and Heard, D. E.: Tropospheric OH and HO2 radicals: field measurements and model comparisons, Chem. Soc. Rev., 41, 6348–6404, https://doi.org/10.1039/c2cs35140d, 2012.
Stutz, J., Kim, E. S., Platt, U., Bruno, P., Perrino, C., and Febo, A.: UV-visible absorption cross sections of nitrous acid, J. Geophys. Res.-Atmos., 105, 14585–14592, https://doi.org/10.1029/2000jd900003, 2000.
Sun, Y., Du, W., Wang, Q., Zhang, Q., Chen, C., Chen, Y., Chen, Z., Fu, P., Wang, Z., Gao, Z., and Worsnop, D. R.: Real-time characterization of aerosol particle composition above the urban canopy in Beijing: insights into the interactions between the atmospheric boundary layer and aerosol chemistry, Environ. Sci. Technol., 49, 11340–11347, https://doi.org/10.1021/acs.est.5b02373, 2015.
Sun, Y., Du, W., Fu, P., Wang, Q., Li, J., Ge, X., Zhang, Q., Zhu, C., Ren, L., Xu, W., Zhao, J., Han, T., Worsnop, D. R., and Wang, Z.: Primary and secondary aerosols in Beijing in winter: sources, variations and processes, Atmos. Chem. Phys., 16, 8309–8329, https://doi.org/10.5194/acp-16-8309-2016, 2016.
Sun, Y. L., Wang, Z. F., Fu, P. Q., Yang, T., Jiang, Q., Dong, H. B., Li, J., and Jia, J. J.: Aerosol composition, sources and processes during wintertime in Beijing, China, Atmos. Chem. Phys., 13, 4577–4592, https://doi.org/10.5194/acp-13-4577-2013, 2013.
Tie, X. X., Madronich, S., Walters, S., Zhang, R. Y., Rasch, P., and Collins, W.: Effect of clouds on photolysis and oxidants in the troposphere, J. Geophys. Res.-Atmos., 108, 4642, https://doi.org/10.1029/2003jd003659, 2003.
Tong, S. R., Hou, S. Q., Zhang, Y., Chu, B. W., Liu, Y. C., He, H., Zhao, P. S., and Ge, M. F.: Exploring the nitrous acid (HONO) formation mechanism in winter Beijing: direct emissions and heterogeneous production in urban and suburban areas, Faraday Discuss., 189, 213–230, https://doi.org/10.1039/c5fd00163c, 2016.
Tsai, I. C., Chen, J.-P., Lung, C. S.-C., Li, N., Chen, W.-N., Fu, T.-M., Chang, C.-C., and Hwang, G.-D.: Sources and formation pathways of organic aerosol in a subtropical metropolis during summer, Atmos. Environ., 117, 51–60, https://doi.org/10.1016/j.atmosenv.2015.07.005, 2015.
Tsigaridis, K., Daskalakis, N., Kanakidou, M., Adams, P. J., Artaxo, P., Bahadur, R., Balkanski, Y., Bauer, S. E., Bellouin, N., Benedetti, A., Bergman, T., Berntsen, T. K., Beukes, J. P., Bian, H., Carslaw, K. S., Chin, M., Curci, G., Diehl, T., Easter, R. C., Ghan, S. J., Gong, S. L., Hodzic, A., Hoyle, C. R., Iversen, T., Jathar, S., Jimenez, J. L., Kaiser, J. W., Kirkevåg, A., Koch, D., Kokkola, H., Lee, Y. H., Lin, G., Liu, X., Luo, G., Ma, X., Mann, G. W., Mihalopoulos, N., Morcrette, J.-J., Müller, J.-F., Myhre, G., Myriokefalitakis, S., Ng, N. L., O'Donnell, D., Penner, J. E., Pozzoli, L., Pringle, K. J., Russell, L. M., Schulz, M., Sciare, J., Seland, Ø., Shindell, D. T., Sillman, S., Skeie, R. B., Spracklen, D., Stavrakou, T., Steenrod, S. D., Takemura, T., Tiitta, P., Tilmes, S., Tost, H., van Noije, T., van Zyl, P. G., von Salzen, K., Yu, F., Wang, Z., Wang, Z., Zaveri, R. A., Zhang, H., Zhang, K., Zhang, Q., and Zhang, X.: The AeroCom evaluation and intercomparison of organic aerosol in global models, Atmos. Chem. Phys., 14, 10845–10895, https://doi.org/10.5194/acp-14-10845-2014, 2014.
Volkamer, R., Martini, F. S., Molina, L. T., Salcedo, D., Jimenez, J. L., and Molina, M. J.: A missing sink for gas-phase glyoxal in Mexico City: Formation of secondary organic aerosol, Geophys. Res. Lett., 34, L19807, https://doi.org/10.1029/2007gl030752, 2007.
Volkamer, R., Sheehy, P., Molina, L. T., and Molina, M. J.: Oxidative capacity of the Mexico City atmosphere – Part 1: A radical source perspective, Atmos. Chem. Phys., 10, 6969–6991, https://doi.org/10.5194/acp-10-6969-2010, 2010.
Wesely, M. L.: Parameterization of urface esistances to gaseous dry deposition in regional-scale numerical-models, Atmos. Environ., 23, 1293–1304, https://doi.org/10.1016/0004-6981(89)90153-4, 1989.
Williams, L. R., Gonzalez, L. A., Peck, J., Trimborn, D., McInnis, J., Farrar, M. R., Moore, K. D., Jayne, J. T., Robinson, W. A., Lewis, D. K., Onasch, T. B., Canagaratna, M. R., Trimborn, A., Timko, M. T., Magoon, G., Deng, R., Tang, D., de la Rosa Blanco, E., Prévôt, A. S. H., Smith, K. A., and Worsnop, D. R.: Characterization of an aerodynamic lens for transmitting particles greater than 1 micrometer in diameter into the Aerodyne aerosol mass spectrometer, Atmos. Meas. Tech., 6, 3271–3280, https://doi.org/10.5194/amt-6-3271-2013, 2013.
Wu, J., Li, G., Cao, J., Bei, N., Wang, Y., Feng, T., Huang, R., Liu, S., Zhang, Q., and Tie, X.: Contributions of trans-boundary transport to summertime air quality in Beijing, China, Atmos. Chem. Phys., 17, 2035–2051, https://doi.org/10.5194/acp-17-2035-2017, 2017.
Xing, L., Fu, T.-M., Cao, J. J., Lee, S. C., Wang, G. H., Ho, K. F., Cheng, M.-C., You, C.-F., and Wang, T. J.: Seasonal and spatial variability of the OM ∕ OC mass ratios and high regional correlation between oxalic acid and zinc in Chinese urban organic aerosols, Atmos. Chem. Phys., 13, 4307–4318, https://doi.org/10.5194/acp-13-4307-2013, 2013.
Zarzana, K. J., Min, K. E., Washenfelder, R. A., Kaiser, J., Krawiec-Thayer, M., Peischl, J., Neuman, J. A., Nowak, J. B., Wagner, N. L., Dubè, W. P., and St. Clair, J. M.: Emissions of Glyoxal and Other Carbonyl Compounds from Agricultural Biomass Burning Plumes Sampled by Aircraft, Environ. Sci. Technol., 51, 11761–11770, https://doi.org/10.1021/acs.est.7b03517, 2017.
Zhang, L., Wang, T., Zhang, Q., Zheng, J., Xu, Z., and Lv, M.: Potential sources of nitrous acid (HONO) and their impacts on ozone: A WRF-Chem study in a polluted subtropical region, J. Geophys. Res.-Atmos., 121, 3645–3662, https://doi.org/10.1002/2015jd024468, 2016.
Zhang, Q., Jimenez, J. L., Canagaratna, M. R., Allan, J. D., Coe, H., Ulbrich, I., Alfarra, M. R., Takami, A., Middlebrook, A. M., Sun, Y. L., Dzepina, K., Dunlea, E., Docherty, K., DeCarlo, P. F., Salcedo, D., Onasch, T., Jayne, J. T., Miyoshi, T., Shimono, A., Hatakeyama, S., Takegawa, N., Kondo, Y., Schneider, J., Drewnick, F., Borrmann, S., Weimer, S., Demerjian, K., Williams, P., Bower, K., Bahreini, R., Cottrell, L., Griffin, R. J., Rautiainen, J., Sun, J. Y., Zhang, Y. M., and Worsnop, D. R.: Ubiquity and dominance of oxygenated species in organic aerosols in anthropogenically-influenced Northern Hemisphere midlatitudes, Geophys. Res. Lett., 34, L13801, https://doi.org/10.1029/2007gl029979, 2007.
Zhang, Q., Streets, D. G., Carmichael, G. R., He, K. B., Huo, H., Kannari, A., Klimont, Z., Park, I. S., Reddy, S., Fu, J. S., Chen, D., Duan, L., Lei, Y., Wang, L. T., and Yao, Z. L.: Asian emissions in 2006 for the NASA INTEX-B mission, Atmos. Chem. Phys., 9, 5131–5153, https://doi.org/10.5194/acp-9-5131-2009, 2009.
Zhao, J., Levitt, N. P., Zhang, R., and Chen, J.: Heterogeneous reactions of methylglyoxal in acidic media: Implications for secondary organic aerosol formation, Environ. Sci. Technol., 40, 7682–7687, https://doi.org/10.1021/es060610k, 2006.