the Creative Commons Attribution 4.0 License.
the Creative Commons Attribution 4.0 License.
What controls the formation of nocturnal low-level stratus clouds over southern West Africa during the monsoon season?
Norbert Kalthoff
Bianca Adler
Julian F. Quinting
Fabienne Lohou
Cheikh Dione
Marie Lothon
Nocturnal low-level stratus clouds (LLCs) are frequently observed in the atmospheric boundary layer (ABL) over southern West Africa (SWA) during the summer monsoon season. Considering the effect these clouds have on the surface energy and radiation budgets as well as on the diurnal cycle of the ABL, they are undoubtedly important for the regional climate. However, an adequate representation of LLCs in the state-of-the-art weather and climate models is still a challenge, which is largely due to the lack of high-quality observations in this region and gaps in understanding of underlying processes. In several recent studies, a unique and comprehensive data set collected in summer 2016 during the DACCIWA (Dynamics-aerosol-chemistry-cloud interactions in West Africa) ground-based field campaign was used for the first observational analyses of the parameters and physical processes relevant for the LLC formation over SWA. However, occasionally stratus-free nights occur during the monsoon season as well. Using observations and ERA5 reanalysis, we investigate differences in the boundary-layer conditions during 6 stratus-free and 20 stratus nights observed during the DACCIWA campaign. Our results suggest that the interplay between three major mechanisms is crucial for the formation of LLCs during the monsoon season: (i) the onset time and strength of the nocturnal low-level jet (NLLJ), (ii) horizontal cold-air advection, and (iii) background moisture level. Namely, weaker or later onset of NLLJ leads to a reduced contribution from horizontal cold-air advection. This in turn results in weaker cooling, and thus saturation is not reached. Such deviation in the dynamics of the NLLJ is related to the arrival of a cold air mass propagating northwards from the coast, called Gulf of Guinea maritime inflow. Additionally, stratus-free nights occur when the intrusions of dry air masses, originating from, for example, central or south Africa, reduce the background moisture over large parts of SWA. Backward-trajectory analysis suggests that another possible reason for clear nights is descending air, which originated from drier levels above the marine boundary layer.
- Article
(13940 KB) - Full-text XML
- BibTeX
- EndNote
The nocturnal boundary layer (NBL) over southern West Africa (SWA) during the summer monsoon season is typically characterized by low-level stratus clouds (LLCs), which cover extensive areas stretching over a region of approximately 800 000 km2 at a maximum coverage (van der Linden et al., 2015). Due to the lack of ground-based observations in this region, investigations of LLC characteristics and related processes were mostly performed based on satellite images, synoptic observations and a few modeling studies (Knippertz et al., 2011; Schrage and Fink, 2012; Schuster et al., 2013; van der Linden et al., 2015; Adler et al., 2017). Within the Dynamics-aerosol-chemistry-cloud-interactions in West Africa (DACCIWA) project (Knippertz et al., 2015), an extensive field campaign was conducted in June and July 2016 (Flamant et al., 2018; Kalthoff et al., 2018). The aim of the DACCIWA ground-based campaign was to collect a comprehensive and high-quality data set (Kalthoff et al., 2018; Bessardon et al., 2019) which enables studies of LLC characteristics; the day-to-day variability of conditions in the atmospheric boundary layer (ABL) (Kalthoff et al., 2018; Adler et al., 2019; Dione et al., 2019); and physical processes relevant for formation, maintenance and dissolution of LLCs (Adler et al., 2019; Babić et al., 2019). Characteristics of the nocturnal low-level jet (NLLJ), LLCs, monsoon flow and Gulf of Guinea maritime inflow (or just maritime inflow for brevity), and their interaction during the DACCIWA campaign are analyzed in Dione et al. (2019).
Based on the above-mentioned studies, we now have a better understanding of mechanisms and factors which control the formation and maintenance of LLCs. The results show that relevant processes include the horizontal advection of cool maritime air from the Gulf of Guinea embedded in the southwesterly monsoon layer, formation of a NLLJ and turbulent mixing related to the strong wind shear underneath the NLLJ (Schuster et al., 2013; Adler et al., 2017, 2019; Babić et al., 2019). High-resolution simulations and DACCIWA observations suggest that additional processes could be important for LLC formation; these include vertical cold-air advection related to orographically induced lifting on the windward side of the mountains as well as to gravity waves and enhanced convergence and upward motion upstream of existing clouds (Schuster et al., 2013; Adler et al., 2017, 2019). Cooling is found to be the dominant process for LLC formation at Savè (Benin; 08∘02′ N 02∘29′ E; 166 m a.s.l.), leading to a continuous increase in relative humidity (RH) until finally saturation is reached and LLCs form with a cloud-base height (CBH) near the height of NLLJ maximum (Adler et al., 2017, 2019; Babić et al., 2019). Adler et al. (2019) find that the horizontal cold-air advection contributes about 50 % to the observed cooling prior to the LLC formation, cooling by radiative flux divergence is roughly 20 %, and cooling by sensible heat flux divergence in the presence of a NLLJ is about 22 %. After the LLCs form, turbulent mixing supports the cooling below the cloud base, while strong radiative cooling at the cloud top helps to maintain a thick stratus layer (Schuster et al., 2013; Babić et al., 2019). Based on the analysis of data gathered during the DACCIWA field campaign, Lohou et al. (2019) developed a conceptual model of LLC formation, maintenance and dissolution over SWA.
However, stratus clouds do not necessarily form every night during the monsoon season (e.g., Kalthoff et al., 2018), even though some of the key features, such as southwesterly monsoon flow and an embedded NLLJ, are present. So far, only a few studies have investigated differences in the conditions between nights with and without stratus clouds in West Africa. Schrage et al. (2007) investigated local and synoptic conditions for 11 cloudy and 12 clear nights using radiosonde measurements from Parakou (Benin; 9∘21′ N, 2∘37′ E; 324 m a.s.l.) and operational model output from the European Centre for Medium-Range Weather Forecasts (ECMWF). They related cloudy nights to increased overall frictional drag and shear stresses in a neutrally stratified ABL, which remained coupled to the surface. This resulted in a positive net moisture flux convergence due to large-scale wind speed convergence (i.e., changes in the speed of the flow along the streamline) in the ABL. On the other hand, they found clear nights to occur when a nocturnal inversion caused the decoupling of the boundary layer from the surface. This resulted in a reduced frictional drag, which coincided with moisture flux divergence north of 6∘ N. Schrage and Fink (2012) used remote-sensing observations between May and October 2006 farther north of Savè, at Nangatchori in Benin (9∘39′ N, 1∘44′ E; 434 m a.s.l.), and they concluded that the shear-generated turbulence beneath the NLLJ axis is the major mechanism explaining stratus formation by reducing the stability of surface layer and causing vertical mixing of moisture. However, open questions remain, since their study neither explained why then the NLLJ is observed on many stratus-free nights nor why the NLLJ did not form on some non-precipitating cloudy nights. Based on the high-resolution regional simulations performed with the Weather Research and Forecasting model for the July–September 2006 period, Schuster et al. (2013) analyzed differences between the 15 cloudiest and 15 clearest nights at 6.2∘ N. Their model results indicate that cooling during cloudy nights is caused by cold-air advection from the south up to about 1000 m a.g.l. (meters above ground level), which are also characterized by stronger vertical mixing having a larger vertical extend. They have found that on cloudy nights the layer between 300 and 600 m a.g.l. cools by approximately 1 K more and dries by about 0.3 g kg−1 less than for clear nights between 18:00 and 06:00 UTC. They also found a stronger monsoon circulation during cloudy nights.
The analysis of atmospheric conditions and processes during stratus and stratus-free nights has important practical implications with respect to the regional climate, especially considering the challenges that state-of-the-art numerical weather prediction and climate models encounter in representing extensive and persistent LLCs over SWA (Knippertz et al., 2011; Hannak et al., 2017). In this work, we present an observation-based analysis of differences in conditions and processes during stratus and stratus-free nights based on a high-quality, comprehensive data set collected during the DACCIWA campaign. Therefore, our results not only provide the observational verification of previous modeling studies but also complement the previous observational studies reported farther north of Savè (e.g., Schrage et al., 2007; Schrage and Fink, 2012), thus enabling a comprehensive overview for the SWA. The research questions we address in this study are as follows: (i) what are the main differences in the ABL conditions between nights with and without stratus clouds? (ii) How do the observed differences influence the main processes relevant for the development of LLCs? (iii) What are the main factors leading to these differences?
The paper is organized as follows: in Sect. 2 a brief description of the study site and data and methods used is given. In Sect. 3 the spatial distribution of LLCs in the DACCIWA region is presented, while in Sect. 4 we compare ABL conditions during stratus and stratus-free nights. Two case studies representing stratus and stratus-free nights are presented in Sect. 5, while the large-scale setting and its impact on the formation of LLCs is given in Sect. 6. Section 7 provides the discussion of the results, while the main findings are summarized in Sect. 8.
In this study we analyze the data collected during the DACCIWA ground-based measurement campaign at three supersites in Kumasi (Ghana), Savè (Benin) and Ile-Ife (Nigeria), which took place in June and July 2016. Specifically, we use remote sensing and in situ data collected at the Savè supersite (Bessardon et al., 2019; Kalthoff et al., 2018), where the “KITcube” mobile platform (Kalthoff et al., 2013) and the instrumentation from the Université Paul Sabatier (UPS) in Toulouse were installed. Additionally, we use radiosonde measurements (Maranan and Fink, 2016) performed as part of the DACCIWA radiosonde campaign (Flamant et al., 2018) at three coastal stations, namely in Abidjan (Côte d'Ivoire), Accra (Ghana) and Cotonou (Benin), and two stations inland at Lamto (Côte d'Ivoire) and Parakou (Benin; Fig. 1). We also use the ERA5 reanalysis data set for the investigation of large-scale conditions over the whole region of SWA and for the calculation of backward trajectories (Sect. 2.2).
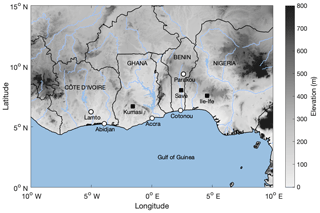
Figure 1Geographical map of the DACCIWA study region. The location of the three DACCIWA supersites is indicated with black squares. The white dots indicate the location of radiosonde measurements performed as part of the radiosonde campaign along the coast in Abidjan (Côte d'Ivoire), Accra (Ghana) and Cotonou (Benin) and inland at Lamto (Côte d'Ivoire) and Parakou (Benin).
2.1 DACCIWA ground-based measurements
At the Savè supersite, the CBH is determined from the attenuated backscatter coefficient profiles measured by the CHM15k ceilometer based on a threshold method (manufacturer Lufft, personal communication, 2016). The CHM15k ceilometer is based on a lidar principle with a narrow-beam solid state laser technology (Nd:YAG diode-pumped laser) operating at 1064 nm up to 15 km a.g.l. and has a vertical resolution of 15 m, while the accuracy measured on a hard target in 10 km distance is ±5 m. Since the 1064 nm wavelength is not significantly influenced by the water vapor absorption, the uncertainty in the retrieved backscatter profile should be lower than 10 % (Wiegner et al., 2014). From the backscatter profiles averaged over 60 s, the threshold method provides up to three CBHs, from which we use only the first (lowest).
Figure 2 shows a 30 min frequency distribution of CBHs detected below 500 m a.g.l. measured at Savè during the whole DACCIWA campaign. We note that LLCs formed on many nights; however, some stratus-free nights occurred as well. Periods without stratus during the night consist of one night which occurred before the monsoon onset, two consecutive nights at the beginning of post-onset phase and three consecutive nights in July during the vortex phase, a period when a cyclonic–anticyclonic vortex couplet passed across the DACCIWA region (Knippertz et al., 2017), resulting in a total of six stratus-free nights during the campaign. We note that for typical monsoon conditions (post-onset phase; Fig. 2), stratus usually formed during the night. Based on ceilometer measurements, precipitation records and satellite images, the nights with intermittent and scattered LLCs are excluded from the analysis as well as the nights with rain or the presence of mesoscale convective systems at night in the vicinity of the Savè supersite. In total, 20 nights with LLCs and undisturbed conditions are selected for the analysis and comparison with 6 stratus-free nights.
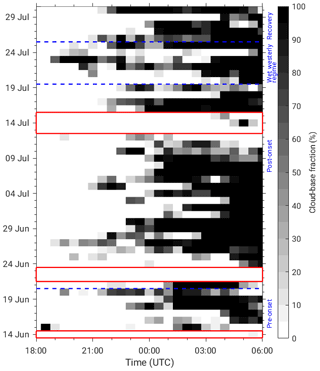
Figure 2The cloud-base fraction for CBH detected between 0 and 500 m a.g.l. measured at Savè in the period between 18:00 and 06:00 UTC during the whole DACCIWA campaign. Red rectangles indicate six stratus-free nights. The periods of different synoptic phases (Knippertz et al., 2017) are denoted with blue dashed lines.
Radiosonde measurements, as well as different continuously running remote-sensing instruments, such as an ultra-high frequency (UHF) wind profiler (information on the wind speed and direction profiles at the temporal resolution of 2 min and 75 m radial resolution for the period 19 June to 30 July 2016) and microwave radiometer (potential temperature profiles at 15 min temporal resolution from 30 June to 30 July 2016) provided highly resolved information of dynamic and thermodynamic conditions in the ABL. Radiosondes were launched at Savè every day during the campaign at 05:00 UTC (to correspond to standard synoptic time, 06:00 UTC, when it reaches the tropopause). Please note that the local standard time for Benin is UTC+1. During 15 intensive observation periods (IOPs), radiosondes were launched in regular intervals of 1–1.5 h starting at 17:00 UTC prior to the IOP day until 11:00 UTC on the IOP day. At other radiosonde stations radiosondes are performed four times daily at standard synoptic times (i.e., at 06:00, 12:00, 18:00 and 00:00 UTC). We also use near-surface measurements at 4 m a.g.l. of standard meteorological parameters, 30 min averaged turbulence fluxes, and turbulence variables and radiation fluxes (Kohler et al., 2016).
2.2 ERA5 reanalysis data and calculation of backward trajectories
The large-scale conditions during stratus and stratus-free nights affecting the SWA are investigated based on the ERA5 reanalysis data (Copernicus Climate Change Service, 2017) from the ECMWF with a 30 km horizontal grid, 137 vertical levels and hourly temporal resolution. For each stratus and stratus-free night, backward trajectories are calculated using the Lagrangian analysis tool (LAGRANTO; Sprenger and Wernli, 2015) for the Savè region (represented by five ERA5 grid points surrounding Savè; i.e., at 8∘ N, 2∘ E; 8∘ N, 2.5∘ E; 8∘ N, 3∘ E; 7.5∘ N, 2.5∘ E; and 8.5∘ N, 2.5∘ E), which defines a 60 km×60 km box. We used hourly 3-D wind fields from the ERA5 reanalysis data set. The trajectories start at 03:00 UTC, since for most stratus nights, LLCs are present at this time (Fig. 2) and integrated backward for 48 h. In order for the backward trajectories to represent air masses at the levels in (and immediately above and below) the stratus clouds, they start from 10 to 100 hPa (83–830 m) above the surface at intervals of 10 hPa. In the analysis presented in Sect. 6, the results are averaged at all five points representing the Savè region and averaged in the layer 30–50 hPa (250–415 m) above the surface, since this represents the level where LLCs form (Kalthoff et al., 2018). In order to obtain insights about the physical properties of the air masses, the pressure, potential temperature, specific humidity and RH are tracked along the trajectories. Considering temporal and horizontal resolution of ERA5 reanalysis data set, we calculate backward trajectories in order to investigate where the air masses that reach Savè come from, i.e., to assess the impact of synoptic-scale disturbances on the observed conditions, and not to track individual air parcels. In order to track air parcels in the ABL, where typical temporal scales are on the order of 1 h, one should use a high-resolution model output, such as an large-eddy simulation.
For the selected stratus and stratus-free nights at the Savè supersite, maps of the low-level cloud cover at 06:00 UTC at 53 stations across SWA are shown in Fig. 3. Although these reports do not discriminate between stratus and other low-level cloud types, it is most likely that the reported coverage corresponds to stratus clouds. The information on the low-level cloud cover is retrieved from the Karlsruhe African Surface Station Database (KASS-D), which contains long-term, in situ observations for the whole African continent from various sources. Due to long-standing collaborations with African national weather services and African researchers, KASS-D contains many observations not available in standard, GTS-fed (global telecommunication system-fed) station databases, and it is an especially valuable source of the precipitation observations (Fink et al., 2017; Vogel et al., 2018). We use these visual observations of cloudiness from trained observers in order to investigate whether the 20 stratus and 6 stratus-free nights at Savè are representative of the low-level cloud structure on the larger regional scale (Fig. 3). Figure 3a and b show lower mean low-level cloud cover at 06:00 UTC along the coastal stations as well as farther north of approximately 9∘ N, while an increased cloud cover is present inland of the coastal strip. A similar distribution of stratiform cloud cover was reported by Schrage and Fink (2012), who analyzed a much longer period between May and October 2006. We note that in the central part of the DACCIWA region (Ghana, Togo and Benin) stratus-free nights are characterized by lower cloud cover on average than for stratus nights. For stratus-free nights, the stations in Nigeria and Côte d'Ivoire show average coverage of more than 5 oktas, which is similar to stratus nights.
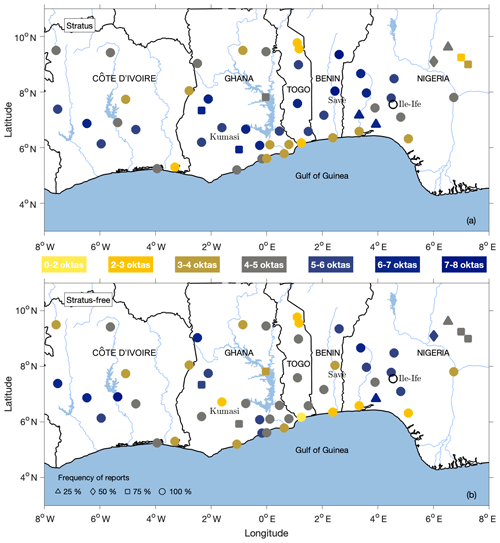
Figure 3The mean low-level cloud coverage (color) reported at synoptic weather stations across SWA at 06:00 UTC for stratus (a) and stratus-free (b) nights. Different marker types indicate how often the reports were available at a particular station.
The impact of clouds is also evident in the net longwave radiation measurements near the surface, shown for three supersites in Fig. 4. Kalthoff et al. (2018) have found that net longwave radiation of −10 W m−2 can be considered to be a proxy for LLC presence. We note that for stratus nights the median net longwave radiation starts to increase after 23:50 UTC, from −25 to −7 W m−2, which can be related to the occurrence of stratus fractus preceding stratus (Adler et al., 2019). After 02:50 UTC, on most stratus nights LLCs are present until sunrise at 06:00 UTC. On the other hand, for stratus-free nights at Savè the net longwave radiation is lower, with the median value around −25 W m−2. The net longwave radiation measurements in Kumasi and Ile-Ife show that stratus nights defined for Savè were also covered with LLCs, while stratus-free nights are characterized by lower cloud cover at Kumasi and Ile-Ife as well. Considering that nights with LLCs at Savè are characterized by clouds at other locations in the DACCIWA region and the same is observed for stratus-free nights, this suggests that observations of conditions and processes leading to the formation of LLCs, or the lack of them, at Savè can possibly be extended to a larger area. However, due to the small number of observed stratus-free nights, in our analysis we pay special attention to the possible extreme cases, which might influence the general conclusions about similarities or differences in ABL conditions between nights with and without LLCs.
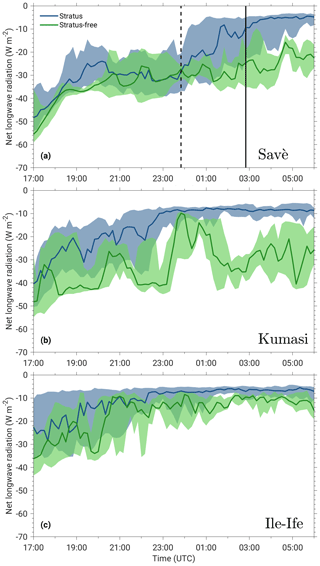
Figure 4The net longwave radiation for stratus (blue) and stratus-free (green) nights measured at three supersites: (a) Savè, (b) Kumasi and (c) Ile-Ife. The solid line shows the median, and the shading indicates the range between 25th and 75th percentile. In panel (a), the vertical dashed line at 23:50 UTC indicates the beginning of stratus fractus phase, while the solid vertical line (02:50 UTC) corresponds to the stratus phase during cloudy nights.
4.1 ABL conditions at Savè supersite
We investigate the difference in ABL dynamic and thermodynamic conditions during stratus and stratus-free nights by analyzing the composites of the wind speed and potential temperature shown in Fig. 5. At this point the results for Savè presented below are meant to illustrate general similarities and differences in the ABL conditions between nights with and without stratus and not to represent the whole DACCIWA region. Due to the fact that we analyze a small number of stratus-free nights (compared to the number of stratus nights), we present median values, since we notice that one extreme case can considerably alter the mean. Before 18:00 UTC the wind field during stratus nights is characterized by a median wind speed of 4 m s−1. For stratus-free nights, starting after 15:00 UTC the wind speed increases from 4 m s−1 to a maximum of 7 m s−1 in the lowest 750 m a.g.l. At around 20:00 UTC the onset of a NLLJ is observed for stratus and stratus-free nights, with the median wind speed maximum of 8 m s−1 at the level of 200 m a.g.l. The height of the jet maximum on stratus nights increases with height after 00:00 UTC, which is due to the cloud presence (Adler et al., 2019; Babić et al., 2019), since the static stability below and in the LLCs decreases and the NLLJ axis shifts upwards towards the top of the layer with higher stability. The jet height for stratus-free nights is approximately constant during the night and is closer to the ground, which is consistent with numerical simulations by Schuster et al. (2013). Additionally, in the second part of the night for stratus-free nights, the NLLJ speed increases further, resulting in stronger wind shear compared to stratus nights (not shown).
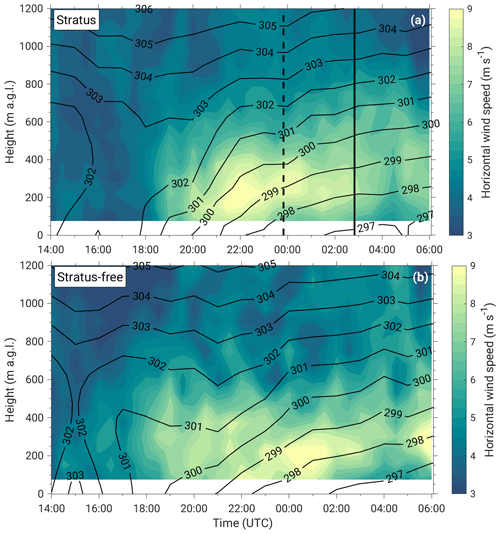
Figure 5Time–height median composite of horizontal wind speed measured with UHF wind profiler (color) and potential temperature obtained from microwave radiometer (black isolines) for stratus (a) and stratus-free (b) nights at Savè supersite. The vertical dashed and solid lines in panel (a) indicate the beginning of stratus fractus and stratus phases for stratus nights, respectively.
With respect to the potential temperature, we note that stratus nights are 1 K warmer on average in the late afternoon, and a temperature decrease of approximately 4 K over the period of 5 h (18:00–23:00 UTC) is observed in the lowest 700 m. After 00:00 UTC, the potential temperature does not change much mostly due to the presence of the clouds (cf. Babić et al., 2019). In contrast, on stratus-free nights the temperature starts to decrease after 16:00 UTC and is concurrent with the wind speed increase indicating an earlier arrival of the maritime inflow. For stratus-free nights a cooling of about 2 K in the period between 18:00 and 23:00 UTC is observed compared to 4 K during stratus nights. This cooling is also confined to a shallower layer (up to 400 m a.g.l.) than for stratus nights. In the first part of the night, the vertical potential temperature gradient increases until approximately 20:00 UTC on stratus and 22:00 UTC on stratus-free nights, with stronger static stability near the ground between 21:00 and 00:00 UTC for stratus-free nights (not shown). After 00:00 UTC the stability is slightly reduced due to mechanical mixing induced by the increasing wind shear below the jet axis and, additionally, cloud coverage on stratus nights.
Figure 6 shows that during the afternoon the near-surface wind speed and turbulent kinetic energy (TKE) are higher for stratus-free nights than on stratus nights, while after sunset both have low values for a few hours (Fig. 6a, d). Lothon et al. (2008) found that a NLLJ can induce dynamical turbulence down to the surface, and the impact of the NLLJ onset is visible in the near-surface measurements (Fig. 6a, d). While UHF profiler measurements indicate concurrent onset of NLLJ (Fig. 5), the near-surface wind speed and TKE increase 1 h later on stratus-free nights compared to stratus nights. This is most likely related to the stronger static stability close to the surface on stratus-free nights between 18:00 and 22:00 UTC (not shown). The NLLJ causes an increase in turbulent mixing close to the surface, which for stratus nights does not change much on average during the whole night mostly due to the presence of LLCs (Fig. 6d). Differences in the near-surface temperature between stratus and stratus-free nights are only a few degrees in the late afternoon (Fig. 6b), with higher temperatures on average for stratus-free nights; however, the large range of variability is also present. The temperature decreases during the whole night for stratus-free nights, whereas the impact of LLCs is reflected in nearly constant near-surface temperature after 00:00 UTC for stratus nights. Due to the radiative cooling, which leads to the buildup of the stable stratification close to the surface on stratus-free nights, decrease in wind and turbulence is observed after 01:00 UTC (Fig. 6a, d). The most distinct difference between stratus and stratus-free nights is evident in specific humidity, which is around 1 g kg−1 lower on average for stratus-free nights (Fig. 6c).
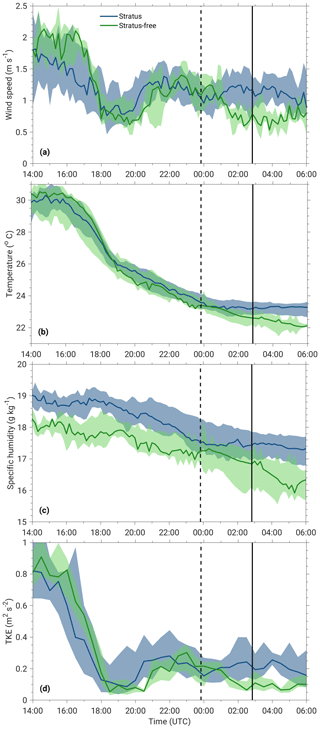
Figure 6Near-surface measurements (4 m a.g.l.) of wind speed (a), temperature (b), specific humidity (c) and turbulent kinetic energy (TKE; d) at Savè. The solid line indicates the median, and shaded area represents the range between 25th and 75th percentile. Stratus and stratus-free nights are shown in blue and green, respectively. The vertical dashed and solid lines show the same as in Fig. 4a.
4.2 ABL conditions in the DACCIWA region
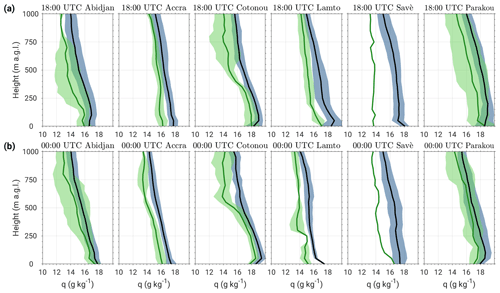
In order to analyze the ABL conditions in the DACCIWA region, we compare vertical profiles of wind speed, potential temperature and specific humidity from radiosondes measured at 18:00 and 00:00 UTC at Savè, at three coastal stations (Abidjan, Accra and Cotonou), and at Lamto and Parakou during stratus and stratus-free nights. At Savè unfortunately just one profile for stratus-free nights is available, corresponding to one stratus-free IOP, while the stratus-free profiles in Lamto and Parakou reflect conditions during the three mid-July nights of the vortex period. The number of available radiosonde profiles included in the analysis at each station is given in Table 1.
Table 1The number of radiosonde profiles available at 18:00 and 00:00 UTC at coastal stations, Abidjan, Accra and Cotonou, and stations inland of coastal strip, Lamto, Savè and Parakou, during stratus and stratus-free nights.
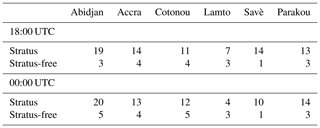
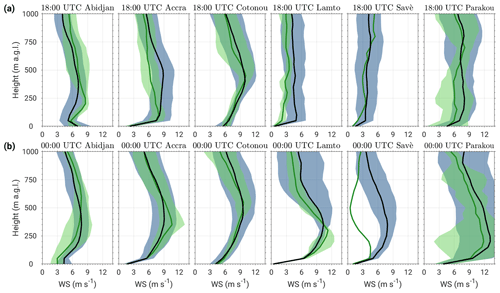
Figure 7Vertical profiles of horizontal wind speed (WS) measured with radiosondes at 18:00 UTC (a) and 00:00 UTC (b) at inland stations Lamto, Savè and Parakou and coastal stations Abidjan, Accra and Cotonou. The solid line indicates the mean, and shading represents the standard deviation. Stratus and stratus-free nights are shown in blue and green, respectively. The number of analyzed profiles for each station is given in Table 1.
Figure 7 shows wind speed profiles at 18:00 and 00:00 UTC. For the investigated period, the mean wind conditions at the coastal stations are similar for stratus and stratus-free nights, with similar variability, suggesting quite stationary monsoon flow. Meridional and zonal wind components indicate slightly stronger southerly flow for stratus nights and only slightly stronger westerly flow on clear nights (not shown). The ABL wind profiles for stratus and stratus-free nights at the Savè supersite at 18:00 UTC are characterized by a mean wind of 4 m s−1 and a large standard deviation, which is a result of a combination of days with weak wind and days with strong monsoon flow (Adler et al., 2019; Dione et al., 2019). The large wind speed standard deviations are observed at two other inland stations, Lamto and Parakou, with stronger winds at the northernmost station, Parakou. Later, at 00:00 UTC, a NLLJ wind profile is observed at three inland stations during both stratus and stratus-free nights. The magnitude of the mean wind at Lamto and Savè corresponds to the wind speed observed at the coast, indicating the presence of the maritime air mass. Farther north at Parakou, the average wind speed has even larger values than in the maritime air mass; however, a substantial variability is observed as well. At the Savè supersite, for this particular stratus-free night, wind speed has a maximum below 250 m a.g.l., corresponding to the top of the shallow inversion layer (not shown). The NLLJ in this particular case arrived after 00:00 UTC, as shown in Sect. 5, and the same was observed at Parakou.
The potential temperature profiles at 18:00 and 00:00 UTC indicate similar values for stratus and stratus-free nights at three coastal stations and in Lamto (not shown). Slightly larger differences in potential temperature are observed at Savè and Parakou at 18:00 UTC, with an average temperature below 750 m a.g.l. for stratus nights roughly 1 K higher than for the stratus-free nights. At 00:00 UTC, the stratus and stratus-free profiles are quite similar, with differences in the lowest 500 m a.g.l. on the order of 0.5 K, which is within the measurement accuracy of the sensor. Between 18:00 and 00:00 UTC, on average only a slight decrease in potential temperature occurred at the coast, indicating the presence of the same maritime air mass (not shown). For the inland stations, Savè and Parakou, the temperature for stratus nights decreased on average by 3 K below 500 m a.g.l., while on stratus-free nights temperature decreased on average by 1.5 K in the same layer, leading to a much weaker cooling rate during these 6 h.
The largest differences between stratus and stratus-free nights are observed in specific humidity not just at Savè but also at all other stations (Fig. 8). That is, for stratus-free nights, specific humidity is 1 g kg−1 lower on average at six radiosonde stations, while for one individual case, differences at Savè go up to 4 g kg−1 in the late afternoon hours. This implies that the background level of specific humidity potentially has an important role in LLC formation. Possible reasons for the reduced specific humidity are discussed in Sect. 7.
In order to assess the impact of the observed differences in ABL conditions on processes relevant for LLC formation, we investigate two IOP cases in detail: IOP 7 (4–5 July), which is a rather typical stratus night case (Adler et al., 2019), and IOP 10 (13–14 July), which represents a stratus-free night. For the investigation of atmospheric conditions and processes during these IOPs, we use radiosondes, which were released with a temporal resolution of 1.5 h starting at 17:00 UTC.
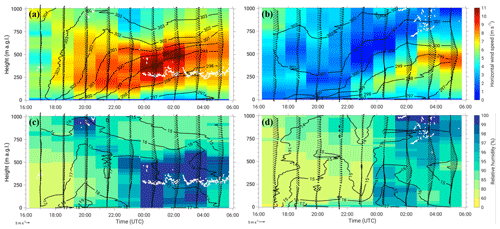
Figure 9Temporal evolution of horizontal wind speed (color), horizontal wind vectors (arrows) and potential temperature (black isolines) measured at Savè supersite with normal and frequent radiosondes every 1.5 h during stratus case (IOP 7; a) and stratus-free case (IOP 10; b). The white dots indicate the CBH. Temporal evolution of RH (color) and specific humidity (in g kg−1; black isolines) for IOP 7 (c) and 10 (d). The arrows in panels (c) and (d) show horizontal wind vectors. Please note that the scale of wind vectors corresponding to the same horizontal wind speed is not the same for IOP 7 and 10.
In the stratus case, the period between 18:00 and 00:00 UTC is characterized by a quite strong southwesterly monsoon flow and an early onset of NLLJ, which had already happened at around 18:00 UTC (Fig. 9a). Prior to LLC formation at 00:00 UTC, the potential temperature indicates a strong temperature decrease and specific humidity values are between 16 and 19 g kg−1 in the lowest 1000 m a.g.l. (Fig. 9c). On the other hand, the same period during the stratus-free case has much lower RH (Fig. 9d), especially in the layer between 100 and 700 m a.g.l., with westerly and northwesterly wind which is weaker than the average for status-free nights (Fig. 9b). The specific humidity reaches values between 14 and 16 g kg−1 in the lowest 1000 m a.g.l.; i.e., it is 2–3 g kg−1 lower than during the stratus night. Around 23:00 UTC, we notice a wind direction change to southerly, which is accompanied by stronger decrease in temperature over a 600 m deep layer, together with an increase in specific humidity of about 2 up to 17 g kg−1 and substantial increase in RH during the second part of the night; however, the saturation is not reached (Fig. 9b, d). In the stratus case, LLCs form at around 00:00 UTC, with the CBH at 250–300 m a.g.l., and RH profiles indicate a 250–300 m deep cloud layer on average. The conditions observed afterwards are very similar to conditions observed on another typical IOP (IOP 8, Babić et al., 2019).
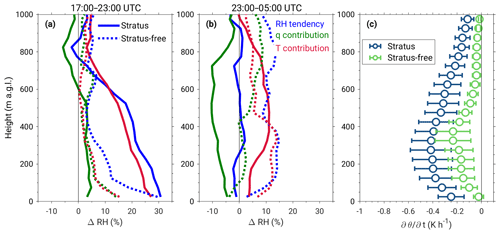
Figure 10The observed RH tendency profiles obtained from radiosonde measurements for the period 17:00–23:00 UTC (a) and 23:00–05:00 UTC (b) are shown in blue. The contributions from specific humidity changes and temperature changes are shown in green and red, respectively. Solid lines represent the stratus case (IOP 7), and dotted lines show the stratus-free case (IOP 10). (c) Mean profiles of the contributions by horizontal advection to the observed cooling for the period 17:00–23:00 UTC for stratus case (blue) and for the period 23:00–05:00 UTC in stratus-free case (green). Error bars indicate the standard deviation, which is estimated from the calculations for three coastal stations (Abidjan, Accra and Cotonou) and four different maximum inland propagation distances of the maritime inflow front (50, 75, 100 and 125 km).
Figure 10 shows the contributions from observed temperature and specific humidity changes to the RH tendency for these two case studies (the formula is given in Babić et al., 2019). These contributions are calculated from the radiosonde measurements at 17:00, 23:00 and 05:00 UTC. Figure 10a shows the period between 17:00 and 23:00 UTC, and evidently for the stratus case a strong increase in RH, with a total change of around 25 % below 500 m a.g.l., is observed mostly due to cooling, while the contribution from moistening is only about 5 %. This is in correspondence with the results for 11 IOPs in Adler et al. (2019). At the same time, RH change during stratus-free night is much weaker, with both terms contributing equally. In the second part of the stratus night, RH tendency is close to zero, which is mostly due to opposite contributions from cooling and drying during this period (Fig. 10b). For the stratus-free night, an increase in RH after 00:00 UTC is observed mostly due to the cooling, while the specific humidity contribution is negligible below 500 m a.g.l. The stronger cooling in the second part of the clear night is most likely related to the wind direction change to southerly and the onset of the NLLJ after 23:00 UTC. However, the maximum increase in RH below 500 m a.g.l. is about 15 %. Previous studies have shown that the cooling during the period of southwesterly NLLJ onset is mostly caused by the horizontal advection of cold maritime air mass (Adler et al., 2019; Babić et al., 2019). Therefore, using the approach described in Adler et al. (2019) we estimate the contribution from horizontal cold-air advection to the observed cooling. For the stratus case, the horizontal advection is estimated using radiosonde measurements from 17:00 and 23:00 UTC, while for stratus-free case it is estimated from 23:00 and 05:00 UTC measurements, since the onset of NLLJ in the stratus-free case is observed after 23:00 UTC. The calculation of horizontal cold-air advection is done for two different time periods in order to fulfill the underlying assumptions defined in Adler et al. (2019), and the results are shown in Fig. 10c. We note that for the stratus case the mean cooling rate in the layer 200–400 m a.g.l., i.e., the level of NLLJ axis, is on the order of −0.4 K h−1. One the other hand, a weak cooling in the second part of stratus-free night is a result of a smaller contribution from the cold-air advection, which has the maximum mean value of −0.2 K h−1. The relation of the NLLJ onset time to the monsoon strength and its implications on the formation of LLCs are discussed in Sect. 7.
Using ERA5 reanalysis, we now compare large-scale conditions during 20 stratus and 6 stratus-free nights, focusing on the conditions in the boundary layer. Our aim here is to investigate whether the observations during the DACCIWA campaign are reproduced by reanalysis and, consequently, to examine the representability of these conditions for the whole SWA. The investigation of large-scale conditions should also elucidate where the air masses, which cause drier conditions during stratus-free nights, come from.
Figure 11 shows geopotential height, wind, temperature and specific humidity differences between stratus and stratus-free nights at 18:00 UTC at the 950 hPa isobaric level, which is approximately in the middle of the ABL and also corresponds to the mean stratus layer (e.g., Kalthoff et al., 2018; Dione et al., 2019). Northwest of the DACCIWA region, in the region that corresponds to the Saharan heat low (SHL), lower geopotential heights of the 950 hPa isobaric level are evident for stratus nights, indicating a slightly stronger SHL than on stratus-free nights. The overall lower pressure on stratus-free nights over the whole area of investigation is mostly due to the low pressure during the vortex period. Also, overall lower pressure is more often observed in the pre-monsoon period (Schrage et al., 2007; Knippertz et al., 2017).
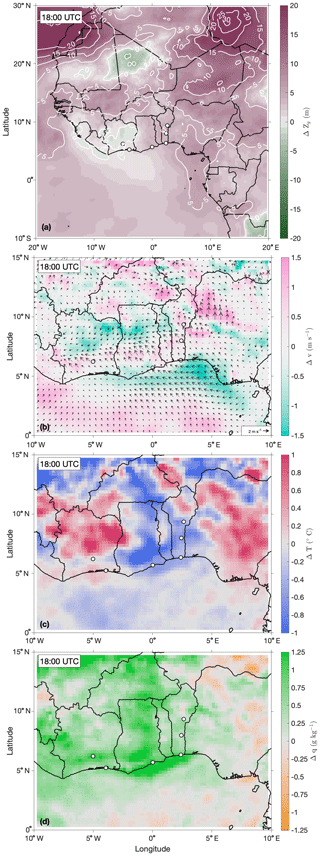
Figure 11The differences between stratus-stratus-free nights in (a) geopotential height (color and white isolines), (b) wind speed (color) and wind vectors (arrows), (c) temperature, and (d) specific humidity at 950 hPa isobaric level at 18:00 UTC from ERA5 reanalysis. Please note that horizontal wind vectors are plotted at every other grid point.
With respect to the wind speed, we find quite good agreement between the radiosoundings and ERA5 data, which show slightly stronger wind at inland stations during stratus nights, while differences in Abidjan and Cotonou are very small in both observations and reanalysis (Fig. 11b). The large differences in wind speed between stratus and stratus-free nights measured for Accra are not obvious in ERA5 data. A possible reason for this are the two missing radiosonde measurements in June. We note that during stratus nights a slight reduction in wind speed exists along the coast and over the Gulf of Guinea. Differences in the wind direction suggest that this could be related to a slightly stronger westerly flow component on clear nights, which also indicates a slightly stronger southerly wind component over the ocean on stratus nights. A band of higher wind speeds around 6 and 7∘ N is also visible, probably related to the stronger maritime inflow front winds during stratus nights. The differences in the wind direction over the land, which do not show any preferred direction, are most likely the result of mesoscale convective systems in the area, which should in particular influence the average of stratus-free nights due to the lower number.
In the reanalysis data, stratus nights in central parts of the DACCIWA region are colder on average (up to 1 K) than stratus-free nights (Fig. 11c). This is contrary to observations at Savè (Fig. 5a, b) and for Parakou (not shown), which are, according to measurements, 1 K warmer on average during stratus nights. At other stations radiosonde measurements indicate differences in temperature on the order of 0.5 K (not shown), and the same differences, but of the opposite sign, are found in ERA5. Considering that differences in temperature between stratus and stratus-free nights are within the range of the instrument measurement accuracy, we believe that the reanalysis data are capable of realistic representation of the large-scale conditions. They suggest that in the whole SWA region, stratus-free nights are drier compared to stratus nights (Fig. 11d), with a difference on the order of 1 g kg−1. This is consistent with the observations (Fig. 8), and the strongest signal is seen in the central part of the DACCIWA region.
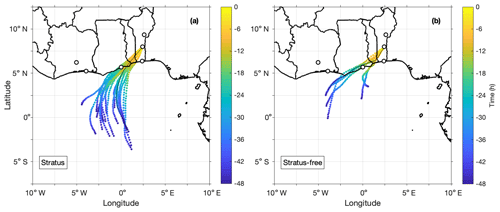
Figure 12Geographical representation of the mean trajectories in the layer 30–50 hPa above the surface for each stratus (a) and stratus-free night (b) from −48 to 0 h (color). Trajectories start at 03:00 UTC. Black solid lines indicate the path of air parcels in IOPs 7 (a) and 10 (b).
Figure 12a and b show that each of the trajectories for stratus and stratus-free nights started at 03:00 UTC, since at this time stratus clouds formed for the most stratus nights, integrated backward for 48 h and averaged between 30 and 50 hPa above the ground, i.e., the layer corresponding to the mean cloud layer. The starting time for each trajectory corresponds to 0 h. We note that trajectories on stratus nights on average stretch farther above the Atlantic Ocean, and their travel time over the land is shorter (13.2 h on average) than for stratus-free nights (20.2 h on average). For four out of six analyzed stratus-free trajectories, the origin is around 4∘ W, while the two slowest trajectories (closer to the coast) start around 0∘ E. Generally, there are no substantial differences in the origin and path of the trajectories for stratus and stratus-free nights, and the air parcels travel with the dominant southwesterly monsoon flow.
The thermodynamic history of the air parcels which represent the near-surface air mass during stratus and stratus-free nights is shown in Fig. 13. In addition to median values of pressure, RH, specific humidity and potential temperature along the trajectories, the individual backward trajectories for each stratus and stratus-free night are shown. We note that a substantial variability for each of the parameters is present in both cases, which is more pronounced for stratus-free nights. The temporal evolution of the pressure along the trajectories indicates that air masses in both stratus and stratus-free nights are found on average within the marine boundary layer before reaching the land. Analysis of individual trajectories indicates that for two nights the trajectories originated from levels above 900 hPa – that is, well above the marine boundary layer – with potential temperature above 300 K and specific humidity below 11 g kg−1 at −48 h (Fig. 13a, c, d). These conditions correspond to two consecutive nights in June (22–24 June) at the beginning of the monsoon post-onset phase, which are shown in Fig. 12b as the two trajectories reaching from the south, while the other four have an origin farther to the southwest. These two June cases are rather different than the other four stratus-free nights, therefore affecting the average statistics, as clearly seen in the RH, specific humidity and potential temperature. Unaffected by these two extreme cases is the temporal evolution of specific humidity along the trajectories, which indicates its increase and moistening of air parcels as they approach Savè, and the same is found for stratus nights (Fig. 13c).
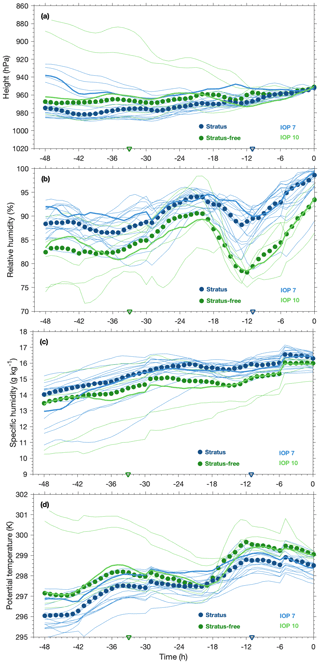
Figure 13Temporal evolution of the median pressure (a), relative humidity (b), specific humidity (c) and potential temperature (d) along the trajectories averaged in the layer 30–50 hPa (250–416 m) above the surface for stratus (blue circles) and stratus-free nights (green circles). The individual trajectories of each stratus and stratus-free night are shown in light blue and green, respectively. The thick blue and green lines indicate trajectories for IOP 7 and 10, respectively, while the blue and green triangles indicate the time when trajectories reach the land for IOP 7 and 10, respectively.
In addition to the statistical overview, temporal evolution of pressure, relative and specific humidity, and potential temperature for trajectories corresponding to stratus and stratus-free cases analyzed in Sect. 5 illustrate that air masses in the stratus-free case can originate and travel within the marine boundary layer with similar specific humidity and temperature to the stratus case (Fig. 13). However, during the stratus-free case, air parcels reach the coastline already during the previous night (Fig. 12b) and, therefore, exhibit stronger warming in the convective boundary layer over land between 09:00 and 15:00 UTC (Fig. 13d). This results in a strong decrease in the air parcels' RH, with a minimum at around 15:00 UTC, which afterwards increases linearly up to 94 % until 03:00 UTC (Fig. 13b). On the other hand, for the stratus case the RH is nearly 100 % at 03:00 UTC, which is consistent with observations, while the specific humidity is only 0.5 g kg−1 higher and the potential temperature is 0.5 K lower than in the stratus-free case. This illustrates the complexity of atmospheric conditions and involved processes over SWA. Namely, stratus-free nights occur in situations when air masses originate above the marine boundary layer, and thus are drier and warmer, or in cases when they experience a strong warming in the convective boundary layer due to the longer presence over the land while at the same time being slightly drier.
In this section we compare our results with previous studies on this topic and discuss possible pathways for the reduced moisture during stratus-free nights. For instance, Schrage et al. (2007) also found drier conditions for clear nights at all levels farther north of Savè at Parakou. They state that the differences in moisture profiles in the middle and higher troposphere reflect differences in large-scale monsoon conditions. Additionally, they found the presence of dry layers for clear nights to correspond to layers of northerly flow and high dew point depression. In our case, the observed differences in specific humidity are limited to the lowest 2 km a.g.l. for Savè data and without dry layers present (not shown), while pronounced differences at coastal stations are up to 3.5 km, with individual dry layers between 1.5 and 3 km (not shown). A question which arises is the following: where does this dry air come from? We note that 50 % of the stratus-free nights were observed during mid-July, when a propagating cyclonic–anticyclonic vortex couplet occurred (Knippertz et al., 2017). A southern anticyclonic system slowly propagated from Gabon across the tropical eastern Atlantic, bringing dry air from the area of subsidence in the equatorial zone or even Southern Hemisphere (Knippertz et al., 2017). The radiosondes from Abidjan show a sudden intrusion of very dry air into the 850–700 hPa layer on 11 July, causing a drop in RH from 85 to under 20 % and persisting until the morning of 14 July (Knippertz et al., 2017). In the central part of this episode, which occurred between 22:00 UTC on 11 July and 22:00 UTC on 13 July, a drop in specific humidity to only 3 g kg−1 was recorded. The same dry layers between 1.5 and 3 km a.g.l. are observed for the two other coastal stations (Accra and Cotonou), with slightly higher moisture values indicating that the western parts of the Guinean coast were more strongly affected (not shown). These dry layers most likely originated from a central and southern African dry air mass, which is typically filled with biomass burning aerosol and is transported to the west over the eastern tropical Atlantic in the layer between 2 and 4 km a.g.l. (Haslett et al., 2019). Their conclusion is supported by the evidence of aged aerosol particles which were measured by a research aircraft (Flamant et al., 2018; Haslett et al., 2019). The calculation of additional 10 d backward trajectories using LAGRANTO and ERA5 reanalysis, which were started on 13 July at 00:00 UTC, confirms the validity of this hypothesis; namely, the northwestward air masses transport from central Africa (Angola) and descend from 750 hPa level toward the top of the marine boundary layer and further transport toward the northeast with southwesterly monsoon flow (not shown). The above-mentioned studies suggest that reduced moisture over West Africa is a result of intrusions of dry air originating either from the Southern Hemisphere (with the biomass burning aerosol as a tracer) in its southern parts (Haslett et al., 2019) or from dry Saharan air layer in its northern parts (Schrage et al., 2007).
Our results are contrary to Schrage et al. (2007) and Schuster et al. (2013), who found stronger NLLJ for cloudy nights to be a consequence of a stronger monsoon circulation. Possible reasons why we do not observe stronger NLLJ and stronger monsoon for stratus nights at the Savè supersite could be due to the investigated period between mid-June and the end of July, which mostly corresponds to post-onset phase of the monsoon (Knippertz et al., 2017). Namely, the onset of West African monsoon flow is related to the surface pressure contrast between the SHL, which develops due to the intense surface heating during boreal summer (Lavaysse et al., 2009), and relatively cool waters of the eastern tropical Atlantic. Typically, the monsoon onset occurs around the end of June (Janicot et al., 2008; Sultan and Janicot, 2003), while during 2016 its onset occurred on 22 June (Knippertz et al., 2017). Therefore, the differences in the NLLJ for cloudy and clear nights found in previous work could be related to the analysis of a larger number of nights from the pre-monsoon or late monsoon period compared to our analysis. Related to this, the small number of observed stratus-free nights during the DACCIWA campaign compared to the number of clear nights analyzed in previous works could be the cause of the discrepancies in the reported results regarding the strength of the NLLJ. Another possible reason is perhaps due to the different geographic location analyzed, since the characteristics of NLLJ can differ across the region (Schuster et al., 2013). On the other hand, Schrage et al. (2007) have concluded that the differences between cloudy and clear nights are most likely related to day-to-day synoptic changes in the monsoon structure, and a similar conclusion seems to apply to our analysis.
Furthermore, the analysis of the two cases studies suggests that the magnitude of the cooling related to the cold-air advection with the maritime inflow depends on the timing of the NLLJ onset and its speed. Dione et al. (2019) found the timing of the maritime inflow to be correlated with the strength of the monsoon flow, and, therefore, the late arrival of the NLLJ during stratus-free case study suggests weaker monsoon flow. However, this one case does not necessarily reflect the general conditions for all clear nights. Schuster et al. (2013) also found that stronger cold-air advection up to about 1000 m supports cooling during cloudy nights. Hence, it seems that in our case study the combination of weak cooling due to the smaller contribution from horizontal cold-air advection and low background values of moisture resulted in a stratus-free night.
This study investigates differences in the boundary-layer conditions between stratus and stratus-free nights over SWA during the 2016 summer monsoon season. We have used observational data collected during the DACCIWA campaign as well as the newest ERA5 reanalysis data set. Conditions during 6 stratus-free nights are compared with 20 nights with LLCs using in situ and remote-sensing measurements at the Savè supersite and radiosonde measurements from coastal stations (Abidjan, Accra and Cotonou) and inland stations in Lamto and Parakou. The analysis is complemented by the investigation of the large-scale conditions during the selected nights, for which we use ERA5 reanalysis, as well as by backward-trajectory calculation using LAGRANTO.
We find that LLCs typically form during undisturbed monsoon flow, while stratus-free nights occurred in the pre-monsoon period as well as after the monsoon onset. This implies that the differences between stratus and stratus-free nights are most likely a result of day-to-day synoptic changes within the monsoon flow. For example, the three consecutive stratus-free nights were observed in mid-July during the vortex period, when a cyclonic–anticyclonic vortex couplet passed across the area of investigation (Knippertz et al., 2017). Considering the small number of stratus-free nights observed, we note that the conclusions on general conditions and similarities or differences between stratus and stratus-free nights have to be drawn carefully. Hence, we pay a special attention to possible extreme cases which might influence the general conclusion.
The onset of NLLJ at the Savè supersite is observed for both stratus and stratus-free nights, with similar onset time and strength. With the onset of NLLJ a shear-induced turbulent mixing is observed in both cloudy and clear nights, which is further maintained after the LLCs form on stratus nights, since the LLC presence weakens the surface cooling. For stratus-free nights, the near-surface layer continues to cool and, simultaneously, the wind speed and turbulent mixing start to decrease. Around the sunset at 18:00 UTC stratus nights are 1 K warmer on average than stratus-free nights, with similar temperatures at around 00:00 UTC, which corresponds to slightly stronger cooling in the layer between 100 and 700 m a.g.l. during stratus nights.
Furthermore, the near-surface measurements of specific humidity at Savè and from radiosondes at additional five locations in the DACCIWA region suggest that stratus-free nights are 1 g kg−1 drier on average than stratus nights. The analysis of 10 d backward trajectories initialized on 13 July at 00:00 UTC confirms that the decreased values of humidity observed during the vortex period in mid-July originated from dry air masses in central Africa and were transported into the DACCIWA region with southwesterly monsoon flow (Knippertz et al., 2017; Haslett et al., 2019). Considering that stratus did not form during three consecutive nights in the vortex period, this implies the potentially important role of the background level of specific humidity in the LLC formation. In addition to this, the analysis of two contrasting case studies, presented in Sect. 5, shows that the timing and onset of NLLJ, which is related to the arrival of maritime inflow, may affect the horizontal cold-air advection. Namely, for the clear-night case with a late NLLJ onset (after 23:00 UTC) the weak magnitude of cooling is mostly due to the small contribution by horizontal cold-air advection, which equals half of the typically observed cooling rate (cf. Adler et al., 2019). Finally, the backward-trajectory analysis suggests that stratus-free nights occur when air masses reaching the Savè supersite originate from drier levels above the marine boundary layer or when they spend more time over the land, experiencing stronger warming in the convective boundary layer, which leads to a stronger decrease in RH than for stratus nights.
Like in the modeling study of Schuster et al. (2013), our results show that subtle differences in the strength and onset time of the maritime inflow and NLLJ, in cooling rates mostly due to the horizontal cold-air advection and, additionally, in background specific humidity determine whether LLCs will form or not. Please note that not necessarily all of these processes simultaneously occur for each of the clear nights.
These results highlight that in order to adequately simulate the LLCs over SWA it is crucial to reproduce and capture the main features, i.e., the onset time and strength of the maritime inflow and NLLJ, turbulent mixing, cold-air advection and the background moisture level. Considering that the involved processes range from synoptic and mesoscale to the boundary-layer microscale, it is necessary to apply numerical models with horizontal grid spacing able to resolve the involved scales of motions and to use appropriate parameterization schemes. Finally, the comprehensive, high-quality DACCIWA data set can serve as an observational benchmark for investigating which of the relevant processes are realistically reproduced in the numerical models as well as to contribute to their improvement.
The DACCIWA data from the Savè supersite and coastal radiosonde stations are available on the SEDOO database (http://baobab.sedoo.fr/DACCIWA/, last access: 3 November 2019; Derrien et al., 2016; Handwerker et al., 2016; Kohler et al., 2016; Maranan and Fink, 2016; Wieser et al., 2016) for scientists interested in boundary-layer studies in southern West Africa. KASS-D is not publicly available. It is maintained by researchers at Karlsruhe Institute of Technology, and anyone interested in the data should contact Andreas Fink.
KB wrote the paper, with contributions from all co-authors. The data analysis was mostly conducted by KB and to smaller extent by BA and JFQ. BA, NK, CD, FL and ML participated in the DACCIWA field campaign.
The authors declare that they have no conflict of interest.
This article is part of the special issue “Results of the project “Dynamics-aerosol-chemistry-cloud interactions in West Africa” (DACCIWA) (ACP/AMT inter-journal SI)”. It is not associated with a conference.
The DACCIWA project has received funding from the European Union Seventh Framework Programme (FP7/2007-2013) under grant agreement no. 603502. The contribution of Julian F. Quinting was supported by the Helmholtz Association (grant no. VH-NG-1243). We thank the staff of KIT (Karlsruhe Institute of Technology) and UPS (Université Paul Sabatier) for helping us to install and run the equipment as well as the staff of INRAB in Savè for allowing us to use their grounds for the experiment. We thank Andreas Fink for fruitful discussions and Anke Kniffka for providing the KASS-D data. We thank two anonymous reviewers for their useful comments and suggestions.
This research has been supported by the European Commission (DACCIWA (grant no. 603502)) and the Helmholtz Association (grant no. VH-NG-1243).
The article processing charges for this open-access
publication were covered by a Research
Centre of the Helmholtz Association.
This paper was edited by Ademe Mekonnen and reviewed by two anonymous referees.
Adler, B., Kalthoff, N., and Gantner, L.: Nocturnal low-level clouds over southern West Africa analysed using high-resolution simulations, Atmos. Chem. Phys., 17, 899–910, https://doi.org/10.5194/acp-17-899-2017, 2017. a, b, c, d
Adler, B., Babić, K., Kalthoff, N., Lohou, F., Lothon, M., Dione, C., Pedruzo-Bagazgoitia, X., and Andersen, H.: Nocturnal low-level clouds in the atmospheric boundary layer over southern West Africa: an observation-based analysis of conditions and processes, Atmos. Chem. Phys., 19, 663–681, https://doi.org/10.5194/acp-19-663-2019, 2019. a, b, c, d, e, f, g, h, i, j, k, l, m, n, o
Babić, K., Adler, B., Kalthoff, N., Andersen, H., Dione, C., Lohou, F., Lothon, M., and Pedruzo-Bagazgoitia, X.: The observed diurnal cycle of low-level stratus clouds over southern West Africa: a case study, Atmos. Chem. Phys., 19, 1281–1299, https://doi.org/10.5194/acp-19-1281-2019, 2019. a, b, c, d, e, f, g, h, i
Bessardon, G., Brooks, B., Abiye, O., Adler, B., Ajao, A., Ajileye, O., Altstädter, B., Amekudzi, L. K., Aryee, J. N. A., Atiah, W. A., Ayoola, M., Babić, K., Bärfuss, K., Bezombes, Y., Bret, G., Brilouet, P.-E., Cayle-Aethelhard, F., Danuor, S., Delon, C., Derrien, S., Dione, C., Durand, P., Fosu-Amankwah, K., Gabella, O., Groves, J., Handwerker, J., Kalthoff, N., Kohler, M., Kunka, N., Jambert, C., Jegede, G., Lampert, A., Leclercq, J., Lohou, F., Lothon, M., Medina, P., Pätzold, F., Pedruzo Bagazgoitia, X., Reinares, I., Sharpe, S., Smith, V., Sunmonu, L. A., Tan, N., and Wieser, A.: A dataset of the 2016 monsoon season meteorology in southern West Africa – an overview from the DACCIWA campaign, Sci. Data, in review, 2019. a, b
Copernicus Climate Change Service: ERA5: Fifth generation of ECMWF atmospheric reanalyses of the global climate, Copernicus Climate Change Service Climate Data Store (CDS), available at: https://cds.climate.copernicus.eu/cdsapp#!/home (last access: 3 November 2019), 2017. a
Derrien, S., Bezombes, Y., Bret, B., Gabella, O., Jarnot, C., Medina, P., Piques, E., Delon, C., Dione, C., Campistron, B., Durand, P., Jambert, C., Lohou, F., Lothon, M., Pacifico, F., and Meyerfeld, Y.: DACCIWA field campaign, Savè super-site, UPS instrumentation, SEDOO OMP, https://doi.org/10.6096/dacciwa.1618, 2016. a
Dione, C., Lohou, F., Lothon, M., Adler, B., Babić, K., Kalthoff, N., Pedruzo-Bagazgoitia, X., Bezombes, Y., and Gabella, O.: Low-level stratiform clouds and dynamical features observed within the southern West African monsoon, Atmos. Chem. Phys., 19, 8979–8997, https://doi.org/10.5194/acp-19-8979-2019, 2019. a, b, c, d, e
Fink, A. H., Engel, T., Ermert, V., van der Linden, R., Schneidewind, M., Redl, R., Afiesimama, E., Thiaw, W. M., Yorke, C., Evans, M., and Janicot, S.: Mean Climate and Seasonal Cycle, edited by: Parker, D. J. and Diop‐Kane, M., John Wiley & Sons, Ltd, 1–39, https://doi.org/10.1002/9781118391297.ch1, 2017. a
Flamant, C., Knippertz, P., Fink, A. H., Akpo, A., Brooks, B., Chiu, C. J., Coe, H., Danuor, S., Evans, M., Jegede, O., Kalthoff, N., Konarè, A., Liousse, C., Lohou, F., Mari, C., Schlager, H., Schwarzenboeck, A., Adler, B., Amekudzi, L., Aryee, J., Ayoola, M., Batenburg, A. M., Bessardon, G., Borrmann, S., Brito, J., Bower, K., Burnet, F., Catoire, V., Colomb, A., Denjean, C., Fosu-Amankwah, K., Hill, P. G., Lee, J., Lothon, M., Maranan, M., Marsham, J., Meynadier, R., Ngamini, J.-B., Rosenberg, P., Sauer, D., Smith, V., Stratmann, G., Taylor, J. W., Voigt, C., and Yoboué, V.: The Dynamics–Aerosol–Chemistry–Cloud Interactions in West Africa field campaign: Overview and research highlights, B. Am. Meteorol. Soc., 99, 83–104, https://doi.org/10.1175/BAMS-D-16-0256.1, 2018. a, b, c
Handwerker, J., Scheer, S., and Gamer, T.: DACCIWA field campaign, Savè super-site, Cloud and precipitation, SEDOO OMP, https://doi.org/10.6096/dacciwa.1686, 2016. a
Hannak, L., Knippertz, P., Fink, A. H., Kniffka, A., and Pante, G.: Why do global climate models struggle to represent low-level clouds in the West African summer monsoon?, J. Climate, 30, 1665–1687, https://doi.org/10.1175/JCLI-D-16-0451.1, 2017. a
Haslett, S. L., Taylor, J. W., Evans, M., Morris, E., Vogel, B., Dajuma, A., Brito, J., Batenburg, A. M., Borrmann, S., Schneider, J., Schulz, C., Denjean, C., Bourrianne, T., Knippertz, P., Dupuy, R., Schwarzenböck, A., Sauer, D., Flamant, C., Dorsey, J., Crawford, I., and Coe, H.: Remote biomass burning dominates southern West African air pollution during the monsoon, Atmos. Chem. Phys. Discuss., https://doi.org/10.5194/acp-2019-38, in review, 2019. a, b, c, d
Janicot, S., Thorncroft, C. D., Ali, A., Asencio, N., Berry, G., Bock, O., Bourles, B., Caniaux, G., Chauvin, F., Deme, A., Kergoat, L., Lafore, J.-P., Lavaysse, C., Lebel, T., Marticorena, B., Mounier, F., Nedelec, P., Redelsperger, J.-L., Ravegnani, F., Reeves, C. E., Roca, R., de Rosnay, P., Schlager, H., Sultan, B., Tomasini, M., Ulanovsky, A., and ACMAD forecasters team: Large-scale overview of the summer monsoon over West Africa during the AMMA field experiment in 2006, Ann. Geophys., 26, 2569–2595, https://doi.org/10.5194/angeo-26-2569-2008, 2008. a
Kalthoff, N., Adler, B., Wieser, A., Kohler, M., Träumner, K., Handwerker, J., Corsmeier, U., Khodayar, S., Lambert, D., Kopmann, A., Kunka, N., Dick, G., Ramatschi, M., Wickert, J., and Kottmeier, C.: KITcube – a mobile observation platform for convection studies deployed during HyMeX, Meteorol. Z., 22, 633–647, https://doi.org/10.1127/0941-2948/2013/0542, 2013. a
Kalthoff, N., Lohou, F., Brooks, B., Jegede, G., Adler, B., Babić, K., Dione, C., Ajao, A., Amekudzi, L. K., Aryee, J. N. A., Ayoola, M., Bessardon, G., Danuor, S. K., Handwerker, J., Kohler, M., Lothon, M., Pedruzo-Bagazgoitia, X., Smith, V., Sunmonu, L., Wieser, A., Fink, A. H., and Knippertz, P.: An overview of the diurnal cycle of the atmospheric boundary layer during the West African monsoon season: results from the 2016 observational campaign, Atmos. Chem. Phys., 18, 2913–2928, https://doi.org/10.5194/acp-18-2913-2018, 2018. a, b, c, d, e, f, g, h
Knippertz, P., Fink, A. H. Schuster, R., Trentmann, J., and Schrage, J.: Ultra-low clouds over the southern West African monsoon region, Geophys. Res. Lett., 38, L21808, https://doi.org/10.1029/2011GL049278, 2011. a, b
Knippertz, P., Coe, H., Chiu, J. C., Evans, M. J., Fink, A. H., Kalthoff, N., Liousse, C., Mari, C., Allan, R. P., Brooks, B., Danour, S., Flamant, C., Jegede, O. O., Lohou, F., and Marsham, J. H.: The DACCIWA Project: Dynamics–Aerosol–Chemistry–Cloud Interactions in West Africa, B. Am. Meteorol. Soc., 96, 1451–1460, https://doi.org/10.1175/BAMS-D-14-00108.1, 2015. a
Knippertz, P., Fink, A. H., Deroubaix, A., Morris, E., Tocquer, F., Evans, M. J., Flamant, C., Gaetani, M., Lavaysse, C., Mari, C., Marsham, J. H., Meynadier, R., Affo-Dogo, A., Bahaga, T., Brosse, F., Deetz, K., Guebsi, R., Latifou, I., Maranan, M., Rosenberg, P. D., and Schlueter, A.: A meteorological and chemical overview of the DACCIWA field campaign in West Africa in June–July 2016, Atmos. Chem. Phys., 17, 10893–10918, https://doi.org/10.5194/acp-17-10893-2017, 2017. a, b, c, d, e, f, g, h, i, j
Kohler, M., Kalthoff, N., Seringer, J., and Kraut, S.: DACCIWA field campaign, Savè super-site, Surface measurements, SEDOO OMP, https://doi.org/10.6096/dacciwa.1690, 2016. a, b
Lavaysse, C., Flamant, C., Janicot, S., Parker, D. J., Lafore, J.-P., Sultan, B., and Pelon, J.: Seasonal evolution of the West African heat low: a climatological perspective, Clim. Dynam., 33, 313–330, https://doi.org/10.1007/s00382-009-0553-4, 2009. a
Lohou, F., Kalthoff, N., Adler, B., Babić, K., Dione, C., Lothon, M., Pedruzo-Bagazgoitia, X., and Zouzoua, M.: Conceptual model of diurnal cycle of stratiform low-level clouds over southern West Africa, Atmos. Chem. Phys. Discuss., https://doi.org/10.5194/acp-2019-566, in review, 2019. a
Lothon, M., Saïd, F., Lohou, F., and Campistron, B.: Observation of the diurnal cycle in the low trophosphere of West Africa, Mon. Weather Rev., 136, 3477–3500, https://doi.org/10.1175/2008MWR2427.1, 2008. a
Maranan, M. and Fink, A.: Radiosonde – All sites, SEDOO OMP, https://doi.org/10.6096/baobab-dacciwa.1656, 2016. a, b
Schrage, J. M. and Fink, A. H.: Nocturnal continental low-level stratus over tropical West Africa: Observations and possible mechanisms controlling its onset, Mon. Weather Rev., 140, 1794–1809, https://doi.org/10.1175/MWR-D-11-00172.1, 2012. a, b, c, d
Schrage, J. M., Augustyn, S., and Fink, A. H.: Nocturnal stratiform cloudiness during the West African monsoon, Meteorol. Atmos. Phys., 95, 73–86, https://doi.org/10.1007/s00703-006-0194-7, 2007. a, b, c, d, e, f, g
Schuster, R., Fink, A. H., and Knippertz, P.: Formation and maintenance of nocturnal low-level stratus over the southern West African monsoon region during AMMA 2006, J. Atmos. Sci., 70, 2337–2355, https://doi.org/10.1175/JAS-D-12-0241.1, 2013. a, b, c, d, e, f, g, h, i, j
Sprenger, M. and Wernli, H.: The LAGRANTO Lagrangian analysis tool – version 2.0, Geosci. Model Dev., 8, 2569–2586, https://doi.org/10.5194/gmd-8-2569-2015, 2015. a
Sultan, B. and Janicot, S.: The West African Monsoon Dynamics. Part II: The “Preonset” and “Onset” of the Summer Monsoon, J. Climate, 16, 3407–3427, https://doi.org/10.1175/1520-0442(2003)016<3407:TWAMDP>2.0.CO;2, 2003. a
van der Linden, R., Fink, A. H., and Redl, R.: Satellite-based climatology of low-level continental clouds in southern West Africa during the summer monsoon season, J. Geophys. Res., 120, 1186–1201, https://doi.org/10.1002/2014JD022614, 2015. a, b
Vogel, P., Knippertz, P., Fink, A. H., Schlueter, A., and Gneiting, T.: Skill of Global Raw and Postprocessed Ensemble Predictions of Rainfall over Northern Tropical Africa, Weather Forecast., 33, 369–388, https://doi.org/10.1175/WAF-D-17-0127.1, 2018. a
Wiegner, M., Madonna, F., Binietoglou, I., Forkel, R., Gasteiger, J., Geiß, A., Pappalardo, G., Schäfer, K., and Thomas, W.: What is the benefit of ceilometers for aerosol remote sensing? An answer from EARLINET, Atmos. Meas. Tech., 7, 1979–1997, https://doi.org/10.5194/amt-7-1979-2014, 2014. a
Wieser, A., Adler, B., and Deny, B.: DACCIWA field campaign, Savè super-site, Thermodynamic data sets, SEDOO OMP, https://doi.org/10.6096/dacciwa.1659, 2016. a
- Abstract
- Introduction
- Data and methods
- Spatial distribution of LLCs
- Comparison of ABL conditions for stratus and stratus-free nights
- Comparison of atmospheric conditions and quantification of RH tendency for two contrasting cases
- The influence of large-scale conditions on the formation of stratus clouds
- Discussion
- Summary and conclusions
- Data availability
- Author contributions
- Competing interests
- Special issue statement
- Acknowledgements
- Financial support
- Review statement
- References


