the Creative Commons Attribution 4.0 License.
the Creative Commons Attribution 4.0 License.
 | 09 Oct 2019
Enhanced heterogeneous uptake of sulfur dioxide on mineral particles through modification of iron speciation during simulated cloud processing
Zhenzhen Wang
Tao Wang
Hongbo Fu
Liwu Zhang
Mingjin Tang
Christian George
Vicki H. Grassian
Iron-containing mineral aerosols play a key role in the oxidation of sulfur species in the atmosphere. Simulated cloud processing (CP) of typical mineral particles, such as illite (IMt-2), nontronite (NAu-2), smectite (SWy-2) and Arizona Test Dust (ATD) is shown here to modify sulfur dioxide (SO2) uptake onto mineral surfaces. Heterogeneous oxidation of SO2 on particle surfaces was firstly investigated using an in situ DRIFTS apparatus (diffuse reflectance infrared Fourier transform spectroscopy). Our results showed that the Brunauer–Emmett–Teller (BET) surface area normalized uptake coefficients (γBET) of SO2 on the IMt-2, NAu-2, SWy-2 and ATD samples after CP were 2.2, 4.1, 1.5 and 1.4 times higher than the corresponding ones before CP, respectively. The DRIFTS results suggested that CP increased the amounts of reactive sites (e.g., surface OH groups) on the particle surfaces and thus enhanced the uptake of SO2. Transmission electron microscopy (TEM) showed that the particles broke up into smaller pieces after CP, and thus produced more active sites. The “free-Fe” measurements confirmed that more reactive Fe species were present after CP, which could enhance the SO2 uptake more effectively. Mössbauer spectroscopy further revealed that the formed Fe phases were amorphous Fe(III) and nanosized ferrihydrite hybridized with Al ∕ Si, which were possibly transformed from the Fe in the aluminosilicate lattice. The modification of Fe speciation was driven by the pH-dependent fluctuation coupling with Fe dissolution–precipitation cycles repeatedly during the experiment. Considering both the enhanced SO2 uptake and subsequent promotion of iron dissolution along with more active Fe formation, which in turn led to more SO2 uptake, it was proposed that there may be a positive feedback between SO2 uptake and iron mobilized on particle surfaces during CP, thereby affecting climate and biogeochemical cycles. This self-amplifying mechanism generated on the particle surfaces may also serve as the basis of high sulfate loading in severe fog–haze events observed recently in China.
- Article
(4254 KB) - Full-text XML
-
Supplement
(155 KB) - BibTeX
- EndNote


Mineral dust is a major fraction of the global atmospheric aerosol budget, with an estimated annual emission flux of 1000 to 3000 Tg into the atmosphere (Jickells et al., 2005; Andreae and Rosenfeld, 2008). Mineral dust aerosol mainly consists of quartz, feldspars, carbonates (calcite, dolomite) and clay minerals (illite, kaolinite, chlorite, montmorillonite), the exact composition varies with source (Claquin et al., 1999; Formenti et al., 2008; Journet et al., 2008). A long-range transport would result in a decrease in quartz relative to the clay fraction because of the more rapid removal of quartz, hence clay is an important component of mineral dusts (Mahowald et al., 2005; Journet et al., 2008). During the long-range transport, mineral dust provides a reactive surface for heterogeneous chemistry (Zhang et al., 2006; George et al., 2015; Huang et al., 2015). Heterogeneous reactions of atmospheric trace gases on mineral dust particles are of great significance as these reactions alter the chemical balance of the atmosphere and modify the properties of individual particles (Usher et al., 2003; Wu et al., 2011; Huang et al., 2015).
SO2 is an important trace gas, which is released mainly by fossil fuel combustion and volcanic emission. The heterogeneous conversion of SO2 on mineral dust surfaces leads to the formation of sulfuric acid and sulfate aerosols, resulting in a significant cooling effect on the global climate by scattering solar radiation and acting as cloud condensation nuclei (CCN) to affect climate indirectly (Lelieveld and Heintzenberg, 1992; Usher et al., 2003; Kolb et al., 2010). In addition, sulfate-containing particles play a significant role in the haze formation in China in recent years (Sun et al., 2014; Wang et al., 2014; Yang et al., 2017). SO2 can be oxidized to sulfate by OH radical in the gas phase, be oxidation in cloud and fog droplets by ozone and hydrogen peroxide in the aqueous phase (Luria and Sievering, 1991), or through heterogeneous processes that occur on aerosol particle surfaces (Usher et al., 2003; Ullerstam et al., 2003). However, the high sulfate levels measured in recent field observations cannot be explained by current atmospheric models (Kerminen et al., 2000; Wang et al., 2003; Cheng et al., 2016), leading to a large gap between the modeled and field-observed sulfate concentrations using known oxidation pathways (Herman, 1991; Kasibhatla et al., 1997; Barrie et al., 2016). Overall, on a global scale, atmospheric SO2 concentrations were typically overestimated, while sulfate tended to be underestimated, suggesting missing sulfate production pathways (Harris et al., 2013; Kong et al., 2014).
It has been suggested that the heterogeneous conversion of SO2 could make an important contribution to the atmospheric sulfate loading. Laboratory studies typically focus on SO2 uptake onto a variety of metal oxides and mineral particles (Goodman et al., 2001; Usher et al., 2002; Zhao et al., 2015; Yang et al., 2016) and have confirmed that its conversion rate on the surface of Fe (hydr)oxides was faster compared to other metal oxides investigated, in good agreement with the field measurements (Usher et al., 2002; Zhang et al., 2006). Atmospheric Fe is emitted from both anthropogenic (primarily biomass burning, coal and oil combustion) and natural (mineral dust and volcanic ash) sources, with the mineral dust source dominant globally (Siefert et al., 1998; Luo et al., 2008; Ito et al., 2019). It has been established that an important in-cloud S(IV) oxidation pathway is catalyzed by natural transition-metal ions, especially Fe hosted within mineral particles (Alexander et al., 2009; Harris et al., 2013).
Another important consideration for heterogeneous chemistry of mineral dust aerosol is how mineral dust particles change in the atmosphere. During long-range transport, mineral particles often undergo chemical ageing by atmospheric processes (Mahowald et al., 2005; Baker and Croot, 2010; Shi et al., 2011). Cloud processing involves cloud water condensation and evaporation on the particle surfaces, along with drastic liquid water content and pH fluctuations (Mackie, 2005; Shi et al., 2011; Rubasinghege et al., 2016). During cloud processing (CP), the high relative humidity (RH) results in high aerosol water content and relatively high pH (Behra et al., 1989; Baker and Croot, 2010; Shi et al., 2011). When water evaporates from cloud droplets to wet aerosol at higher temperature, the particles only contain a concentrated aqueous aerosol solution in which the pH can be lower than 2 (Zhu et al., 1993; Meskhidze, 2003; Shi et al., 2015). Therefore, there is a highly acidic film (e.g., pH = 2) in the “wet aerosol” phase versus a less acidic droplet (near neutral, 5–6) in the “cloud droplet” phase within clouds (Shi et al., 2015). During its lifetime, a typical aerosol particle may experience several cloud cycles involving large pH variations before being removed from the atmosphere as rain or through dry deposition (Pruppacher and Jaenicke, 1995; Maters et al., 2016). Herein, the simulated CP experiment was conducted by changing pH between 2 and 5–6, in accordance with the previous studies (Spokes et al., 1994; Mackie, 2005; Shi et al., 2009).
It has been well documented that pH is especially important for Fe mobilization (Zhu et al., 1993; Desboeufs et al., 2001; Deguillaume et al., 2010; Maters et al., 2016). The fluctuating pH during CP will impact and change the Fe speciation and morphology in dust particles (Zhuang et al., 1992; Wurzler et al., 2000; Shi et al., 2009; Kadar et al., 2014). The low pH will increase Fe solubility and bioavailability of dust during transport, thereby providing Fe external input to the open ocean surface to promote marine primary productivity (Spokes et al., 1994; Desboeufs et al., 2001). It has been found that Fe-rich nanoparticle aggregates were formed from Saharan soil and goethite upon simulated CP conditions, in good agreement with their field measurements from the wet-deposited Saharan dusts collected from the western Mediterranean (Shi et al., 2009). Fe nanoparticles are more chemically reactive (Wurzler et al., 2000; Desboeufs et al., 2001), and possibly lead to a remarkable difference in heterogeneous chemistry. However, little is known about the influence of CP on SO2 uptake onto particle surfaces up to now.
In this study, we employed four typical Fe-containing mineral samples as surrogates to perform simulated CP experiments. The SO2 uptakes on the mineral particles before and after CP were compared using in situ diffuse reflectance infrared Fourier transform spectroscopy (DRIFTS). Transmission electron microscopy (TEM) was applied to observe the morphological and mineralogical change of mineral particles. The Fe speciation modification during simulated CP was further monitored by the dissolved Fe measurement, the free-Fe analysis and Mössbauer spectroscopic characterization.
2.1 Mineral particles
The standard mineral samples of IMt-2, NAu-2 and SWy-2 were purchased from the Source Clay Minerals Repository (Purdue University, West Lafayette, IN, USA). ATD was purchased from Powder Technology Inc. (Burnsville, MN, USA). The mineral samples were coarsely ground using a mortar and pestle before being more finely ground using an all-dimensional planetary ball mill QM-QX (Nanjing University Instrument Plant) and were sieved to particle diameters (Dp) <45 µm prior to analysis. The Brunauer–Emmett–Teller (BET) specific surface areas (SBET) of the samples were measured with a Quantachrome Nova 1200 BET apparatus. Total iron content (FeT) of the samples was determined using inductively coupled plasma atomic emission spectroscopy (ICP-AES, Jobin Yvon Ultima). The chemical compositions of the particles were analyzed by X-ray fluorescence spectrometry (XRF, PANalytical Axios Advanced).
2.2 Cloud processing simulation experiment
The simulated CP experiments were conducted at a constant temperature (298±1 K) using a Pyrex glass vessel with a water jacket. The suspensions contained a mineral particle loading of 1 g L−1 and were subjected to acidic (pH = 2±0.1, 24 h) and near-neutral pH (pH = 5–6, 24 h) cycles for one to three times according to the previous methods (Spokes et al., 1994; Mackie, 2005; Shi et al., 2009). Suspension pH was adjusted by adding dilute H2SO4 or NH4OH. The CaCO3 equivalent alkalinity of the dust was determined in accordance with APHA (American Public Health Association) method 2320B so that acid additions to control pH could be adjusted accordingly (Mackie, 2005). The amount of acid or alkali added to achieve these pH cycles was less than 1 % of the total volume of the suspensions. The experiments were performed under a constant stirring (about 50 rpm) in the dark for 144 h. At the end of the CP experiment, the suspensions were filtered through 0.2 µm PTFE filters (Millipore). The filter residue was air-dried and was further applied to the DRIFTS experiment, as well as TEM observation, free-Fe measurement and Mössbauer spectroscopic characterization.
2.3 SO2 uptake on the mineral particles
The SO2 uptake on the particle surfaces before and after CP was investigated by a Shimadzu Tracer-100 FTIR spectrometer equipped with a high-sensitivity mercury cadmium telluride (MCT) detector and a diffuse reflectance accessory. A temperature controller was fitted to the DRIFTS chamber to ensure constant reaction temperature (298 K). Weighted samples were placed into a ceramic crucible (0.35 mm depth, 5 mm i.d.) in the chamber. Mass flow controllers (Beijing Sevenstar electronics Co., LTD) were used to adjust the reactant gases to a flux with expected concentration and relative humidity. The sample was firstly pretreated in a 100 mL min−1 flow of synthetic air (21 % O2 and 79 % N2) for 1 h to blow off water and impurities on particle surfaces. When the background spectrum of the fresh sample reached steady state, the reactant gas of SO2 (5.0 ppm) along with synthetic air was introduced into the chamber at a total flow rate of 120 mL min−1 for 45 min, during which the IR spectrum was recorded automatically every 5 min at a resolution of 4 cm−1 for 100 scans in the spectral range of 900 to 4000 cm−1. Atmospheric moisture was simulated with a RH level around 40 % by guiding one high-purity air flux through water. The humidity value was monitored using a hygrometer.
The sulfate products were analyzed by ion chromatograph (IC) after the DRIFTS experiments. The particles were extracted with 5 mL ultrapure water by an ultrasonic extractor. After 10 min, the extracted solution was passed through a 0.22 µm PTFE membrane filter and the leaching solution was analyzed using a Metrohm 883 Basic IC equipped with an A5-250 column. A weak base eluent (3.2 mmol L−1 Na2CO3 plus 1.0 mmol L−1 NaHCO3) was used for anion detection at a flow rate of 0.70 mL min−1. To discriminate the adsorbed sulfate during simulated CP experiment and the sulfate ions generated from the heterogeneous reaction, the adsorbed sulfate on the particles during simulated CP experiment was initially measured as blank. The heterogeneous uptake of SO2 was calculated by subtracting the blank value from the total sulfate ions.
The reactive uptake coefficient (γ) was defined as the rate of sulfate formation on the surface (d ∕dt, ions per second) divided by collision frequency (Z, molecules per second) (Usher et al., 2003; Ullerstam et al., 2003; Kong et al., 2014; Huang et al., 2015).
where As is the effective sample surface of the samples (m2), ν is the mean molecular velocity of SO2 (m s−1), R is the gas constant (J mol K−1), T is the absolute temperature (K), and is the molecular weight of SO2 (kg mol−1).
A conversion factor was obtained by a calibration plot with numbers of analyzed by ion chromatography (IC, Metrohm 883 Basic, Switzerland) versus the integrated areas of sulfate products from DRIFTS spectra. The residual sulfate during simulated CP experiments were deducted as background. The calculated conversion factor of is 1.170×10¹⁵ (ions per integrated units). Integrated areas for the total sulfur-containing products were calculated to show the maximal sulfate formation rates. The reactive uptake coefficients for SO2 were determined to be γBET and γgeo using the BET area (ABET = mass × SBET) and geometric area (Ageo = mass × Sgeo) as the reactive area, respectively.
2.4 Morphological and mineralogical characterization of the Fe speciation
A FEI TECNAI G2 S-TWIN F20 TEM equipped with an Oxford energy-dispersive X-ray (EDX) spectrometer was used to analyze the morphological and chemical composition of individual particles before and after CP. Suspensions (0.2 g L−1) of each particle were prepared in methanol and sonicated for at least 1 h. A drop of this suspension was then applied to a carbon-coated Cu TEM grid (400 mesh; EMS) and allowed to air-dry. The operation was conducted in bright field mode at 120 kV. The Fe contents of the typical individual mineral particle were calculated from the values of 50 typical particles. To obviously observe the morphological changes, high-resolution TEM (HRTEM) images were also collected to observe nanoscale structural features, e.g., surface roughness and lattice fringes.
The content of free Fe in the mineral particles was determined by a citrate-buffered-dithionite (CBD) sequential Fe extractions method according to the literature (Lafon et al., 2004; Shi et al., 2009). Simply, 30 mg of the dust samples was treated for 24 h with a 10 mL ascorbate solution (pH = 7.5) to extract chemically highly labile Fe phases (FeA), mainly composed of amorphous, nanoparticle and/or poorly crystalline ferrihydrite. The solutions were filtered through 0.2 µm polycarbonate filters. The dust particles collected on the filters were subsequently treated for 2 h with a 10 mL sodium dithionite solution (pH = 4.8) to extract crystalline Fe (oxyhydr)oxides (FeD), which are mainly goethite and hematite. After each reaction step, the dissolved Fe concentrations (FeA and FeD) in the filtrates were determined using ICP-AES. The sum of these two pools (FeA + FeD) was defined as the “free-Fe” fraction (Shi et al., 2011). The other fraction was denoted as the “structural-Fe” fraction in aluminosilicate crystals, which could be calculated from the difference between the FeT and free-Fe fractions (Lafon et al., 2004).
The Mössbauer spectroscopic analysis performed in transmission geometry with a constant acceleration was used to inspect the chemical valence and the surrounding structure of Fe in the particles before and after CP. 57Co was used as the Mössbauer source, and a 1 mm thick Na(TI) scintillator coupled to a EMI9750B photoelectric multiplier was used as the detector (Cwiertny et al., 2008). The measurement was carried out at room temperature (RT) with a duration of 24 h for one sample (around 1.5×10⁶ counts per channel). Experimental data were fitted by a least-squares fitting program. The isomer shift values were calibrated against a spectrum for α-Fe metal foil.
During the simulated CP experiment, the total dissolved iron (Fes) and the dissolved Fe(II) in the suspensions were measured colorimetrically by the ferrozine method, as described in previous studies (Viollier et al., 2000; Cwiertny et al., 2008). For Fe(II) analysis, 200 mL of a 5 mM 1,10-phenanthroline solution and 200 mL of an ammonium acetate buffer were added into 1 mL of sample. To avoid possible interference from Fe(III), which can also form a complex with 1,10-phenanthroline when present at high concentrations, 50 mL of 0.43 M ammonium fluoride was added to the sample prior to 1,10-phenanthroline. The mixture was allowed to sit in the dark for 30 min prior to ultraviolet–visible spectroscopy (UV–Vis) analysis, during which time a reddish-orange color developed if Fe(II) was present. Fes was determined via the same protocol, except that 20 mL of 1.5 M hydroquinone, which reduces Fe(III) to Fe(II), was added to the sample rather than ammonium fluoride. Absorbance measured at 510 nm was converted to concentrations using aqueous standards prepared from anhydrous beads of ferrous chloride. Standards were prepared in each acid used in dissolution studies, and no matrix effects were observed. These conditions resulted in a detection limit of 1 µM. The concentration of dissolved Fe(III) was calculated from the difference in experimentally measured concentrations of total dissolved iron and dissolved Fe(II).
Additionally, the dissolved Fe(III) could precipitate out as the pH increased, and then the Fe mineralogy of the deposit was also observed. NAu-2 released about 300 µM of dissolved Fe at pH 2. The dissolving solution (200 mL) was sampled after filtration (0.2 µm polycarbonate filter). The clear solution was subjected to changing acidity from pH 2 to 5 by the stepwise addition of dilute NH4OH. The precipitated particles were separated out by 0.2 µm filters and were used in TEM and Mössbauer analysis. Size distributions for the Fe-bearing particles formed in the suspensions were determined by a Horiba LB-500 light scattering microscope within the size range of 3–6000 nm.
3.1 Morphological change of the mineral particles after CP
The characteristic results are shown in Tables S1 and S2 in the Supplement. The samples exhibited SBET in the range from 4.3±0.3 to 22.6±2.3 m2 g−1. The FeT contents were 5.45±0.34 %, 26.30±0.57 %, 2.36±0.56 % and 1.48±0.56 % for IMt-2, NAu-2, SWy-2 and ATD, respectively. The proportions of Fe2O3 in IMt-2, NAu-2, SWy-2 and ATD were 7.95 %, 39.03 %, 5.55 % and 2.57 %, respectively.
Figure 1 shows the TEM images of the mineral particles before and after CP. As shown in Fig. 1a, c, e and g, the IMt-2, NAu-2, SWy-2 and ATD samples before CP primarily consisted of laminar aluminosilicate with irregular shape and rough morphologies mainly at the micrometer scale, all of which were characterized by various fractions of Fe (1.5 %–26.2 %), along with minor Mg (0.1 %–16.5 %), K (0.0 %–7.8 %) and Ca (0.0 %–1.1 %). The Fe within the aluminosilicates of the particles was evenly distributed. Besides, some Fe-rich crystals of several hundreds of nanometers in size were found to attach onto the ATD particles, which were identified as α-Fe2O3 from the typical d spacing analysis of HRTEM (Janney et al., 2000).
After the simulated CP, all of the processed mineral particles showed much smaller size than the ones before CP. For example, the typical IMt-2 and NAu-2 particles after CP (Fig. 1b and d) were <1 µm in size. Under the TEM, the average Fe content of the individual IMt-2 and SWy-2 particles (Fig. 1b and f) decreased from 5.5 % (±1.9 %; n=50) to 4.1 % (±1.6 %; n=50) and from 2.4 % (±0.6 %; n=50) to 2.1 % (±0.5 %; n=50), respectively. In addition, the IMt-2 particles after CP showed a heterogeneous distribution of the Fe on the basis of the EDX data. Most of the aluminosilicate in IMt-2 after CP hosted lower Fe content (4.1 %), whereas a few of the Fe-rich particles with less Si ∕ Al were observed with irregular shapes at the nanoscale. The TEM images of the NAu-2 and ATD particles after CP (Fig. 1h) showed some pseudohexagonal nanoparticles with around 5 nm in diameter. Based on the EDX and selected area electron diffraction (SAED) analysis, these nanoparticles were Fe-rich and the d spacings was at about 1.5–2.5 Å, all of which were identified to be 2-line ferrihydrite (Janney et al., 2000; Shi et al., 2009).
The TEM observation suggested that CP induced the disintegration of mineral particles and thus produced enhanced surface area, resulting in more active sites available on the particle surfaces for SO2 uptake. Results of TEM also showed that CP influenced the Fe mineralogy and lead to the Fe-rich nanoparticle formation, which could partly explain the higher SO2 uptake on the mineral particles after CP.
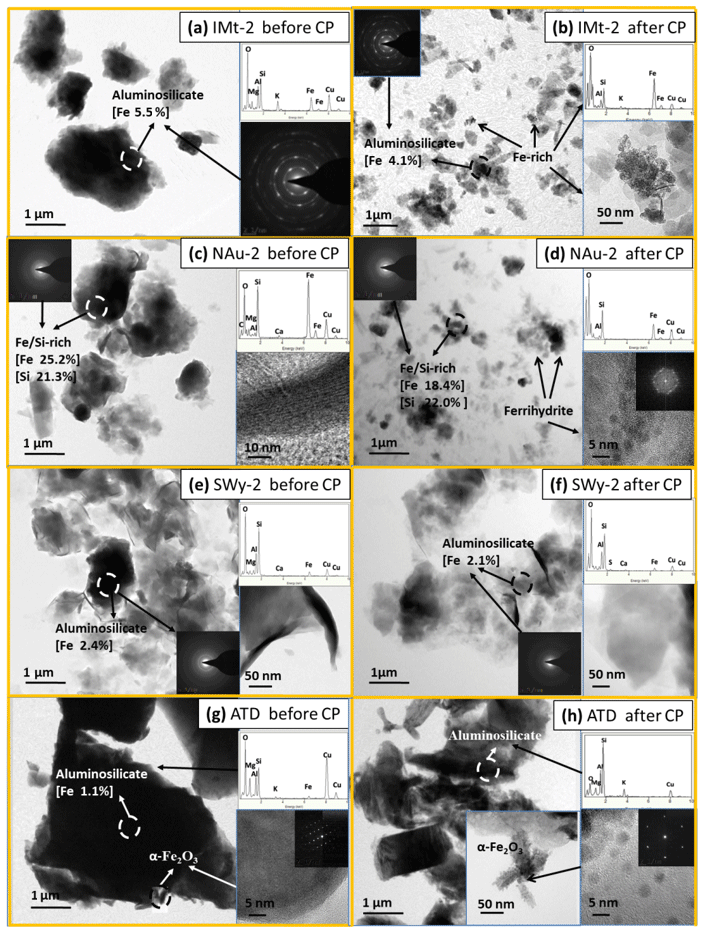
Figure 1Comparison of morphologies and chemical properties for samples collected before and after CP using TEM. The dotted circles indicate the positions of the electron beam for the HRTEM images and SAED patterns. Elements of the detected parts of individual particles are also presented. Square brackets indicate mass percent of iron. The iron species were identified by the Miller indices and the SAED patterns. (a) IMt-2 particles characterized by high fractions of Al and Si, along with other crustal elements including Mg, K and Fe. (b) IMt-2 particles after CP were almost all less than 1 µm in size. Some Fe-rich particles with less Si and Al were observed on the nanoscale dimension. (c) NAu-2 particles with high Fe ∕ Si ratios contain Mg, Al and Ca elements. (d) NAu-2 particles after CP were much smaller than the ones before CP. Some ferrihydrite clusters were observed and were attached on the surface of the NAu-2 particles after CP. (e) Typical SWy-2 particles were Al ∕ Si rich, containing Fe, Mg and Ca elements. (f) TEM images of the SWy-2 particles after CP appeared smaller than the particles before CP. (g) The Si ∕ Al-rich crystals in ATD particles were aluminosilicate with a low content of Fe, and typical α-Fe2O3 particles were found to attach onto the aluminosilicate surface. (h) The pseudohexagonal nanoparticles were observed to on the surface of the α-Fe2O3 crystal among the ATD particles. The SAED lattice constants of these nanoparticles were found to be very close to that of 2-line ferrihydrite.
3.2 Effect of simulated CP on heterogeneous transformation of SO2
The in situ DRIFTS spectra on the IMt-2, NAu-2, SWy-2 and ATD samples before and after CP exposed to SO2 as a function of time are shown in Fig. 2. For the IMt-2 sample before CP (Fig. 2a and b), the intensities of the broad peaks from 3600 to 3000 cm−1 and a weak peak at 1650 cm−1 increased with time. The band between 3600 and 3000 cm−1 was attributed to the vibrations of hydrogen-bonded hydroxyl species (Zhao et al., 2015), while the absorption peak at 1650 cm−1 was mainly associated with H2O produced from the reaction between SO2 and surface hydroxyls (Nanayakkara et al., 2012; Cheng et al., 2016). A weak vibration was observed at around 1100 cm−1, which might be attributed to free sulfate anions on the particle surface (Ullerstam et al., 2003; Nanayakkara et al., 2012; Yang et al., 2016). Previous studies established that various types of surface OH groups are the key reactive sites for sulfite or sulfate and bisulfite or bisulfate formation on mineral oxides (Faust et al., 1989; Usher et al., 2003; Ullerstam et al., 2003), because of the complexes formed between sulfite or sulfate species and the surface OH. Generally, the SO2 adsorption grows in intensity with decreasing OH stretching and H2O banding (Zhang et al., 2006). However, the OH peaks herein were not observed to decrease with prolonged time because the losses of H2O and OH groups on the particle surfaces were replenished by maintaining the constant RH in this study.
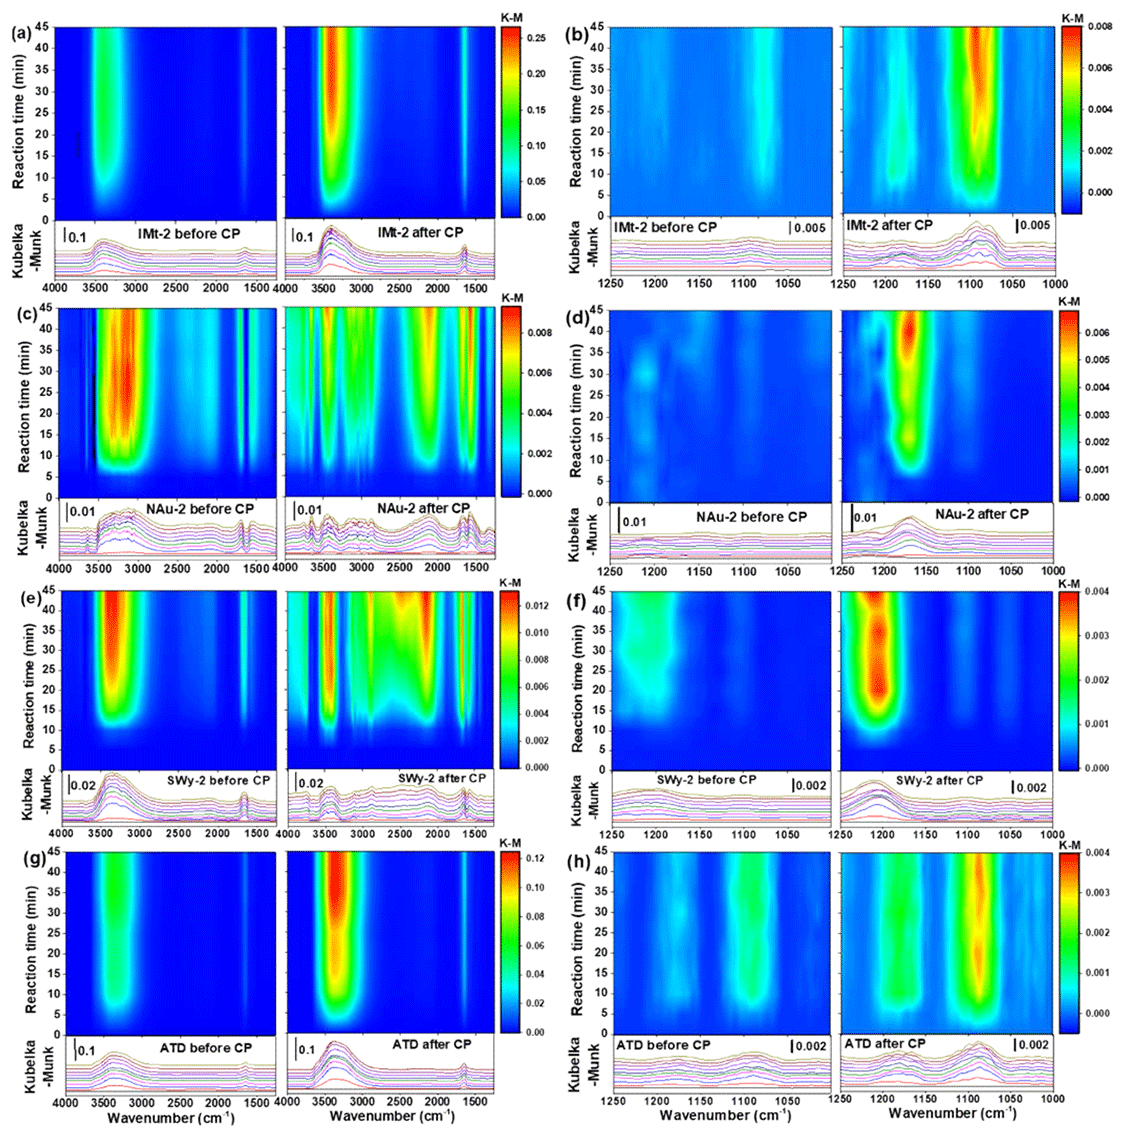
Figure 2Comparison of the DRIFT spectra of mineral dust samples upon exposure to SO2 for 45 min before and after CP. Data for IMt-2 (a, b), NAu-2 (c, d), SWy-2 (e, f) and ATD (g, h) are shown in the ranges of 4000 to 1250 cm−1 or 1250 to 1000 cm−1.
When the same set of experiments was carried out using the IMt-2 sample after CP (Fig. 2b), the intensities of the prominent peaks were significantly higher than those for the IMt-2 sample before CP. Four new bands were readily observed at 1167, 1100, 1088 and 1077 cm−1. The new bands were easily assigned to the stretching motion of surface-coordinated sulfate species (1167 cm−1), i.e., bidentate surface sulfate complexes, free sulfate ion (1100 cm−1), and sulfite or bisulfite species (1088 and 1077 cm−1) (Peak et al., 1999; Ullerstam et al., 2003; Yang et al., 2016). These new bands remained when an argon blow-off process was carried out, suggesting that the surface-adsorbed sulfite or sulfate species between 1250 and 1000 cm−1 was chemisorbed (Zhang et al., 2006).
Upon adsorption of SO2 on the surface of the NAu-2 sample before CP (Fig. 2c and d), the broad band from 3600 to 2800 cm−1 and the peaks at 1580 and 1675 cm−1 increased drastically with time. These absorbance bands were all attributed to the surface hydroxyl species (OH) and H2O. No peaks were observed over the range of 1000 to 1250 cm−1, suggesting that the sulfite or sulfate products were not newly formed on the surface of the NAu-2 sample before CP. Upon adsorption of SO2 on the surface of the NAu-2 sample after CP (Fig. 2d), the new bands at 3661 and 3450 cm−1, the broad band between 3400 and 2700 cm−1, and the broad band centered at 2131 cm−1 were observed as the exposure time increased. In detail, the band at 3661 cm−1 could be assigned to stretching vibration modes of isolated or bridged surface hydroxyl groups bonded to the surface iron ions embedded in the octahedral and tetrahedral sites (Faust et al., 1989; Nanayakkara et al., 2012; Zhao et al., 2015). The peaks at around 3450, 2131 cm−1 and the band between 3400 and 2700 cm−1 were all attributed to surface OH groups (Ma et al., 2010; Zhao et al., 2017). These new bands generated on the processed NAu-2 particles suggested that CP changed the location of diverse OH groups on the particle surfaces. Over the range of 1250–1000 cm−1, the new bands centered at 1170 cm−1 were assigned to the asymmetric stretching of sulfate (Kong et al., 2014; Yang et al., 2015).
The spectra of the SWy-2 samples before and after CP (Fig. 2e and f) showed a similar spectral character with those of the NAu-2 samples. The spectra for the ATD samples before and after CP (Fig. 2g and h) were roughly the same as the ones for IMt-2. All of the results demonstrated that the characteristic peaks for the active OH sites and the sulfite or sulfate products on the mineral particles after CP were significantly higher than those on the ones before CP, indicating the higher hygroscopicity and greater SO2 uptake on the particles after CP. The data shown herein confirmed that CP could potentially promote the transformation of SO2 on the particle surfaces.

Figure 3Comparison of the integrated areas on DRIFTS spectra in the range of 1250–1000 cm−1 for the sulfate species formed on the samples before and after CP.
3.3 Uptake coefficient of SO2 on the mineral particles before and after CP
The areas of the bands (from 1250 to 1000 cm−1) attributed to the sulfite or sulfate products as a function of time are shown in Fig. 3. It was evident that the peak areas of the products on the mineral particles after CP were generally greater than the ones before CP. The reaction on the sample surfaces was practically saturated to SO2 uptake within 15 min, except for the NAu-2 and IMt-2 samples after CP. As for all of the sample, the saturation coverages of the sulfite or sulfate products after CP were obviously greater than the corresponding values before CP, suggesting that CP favored the sulfate formation on the mineral surfaces due to improving active site number, as expected previously.
The maximum uptake coefficients (γgeo and γBET) for SO2 uptake on the samples were estimated on the basis of the sulfate formation rates in the initial 15 min. The values on the mineral samples before and after CP are shown in Table 1. The γgeo values of SO2 on the IMt-2, NAu-2, SWy-2 and ATD samples before CP were , , and , respectively, which were in the order of SWy-2, ATD, IMt-2 and NAu-2. The γgeo values of SO2 on the IMt-2, NAu-2, SWy-2 and ATD samples after CP were 4.7, 19.4, 2.7 and 2.0 times higher than the values before CP, respectively, suggesting that the SO2 uptake on the mineral particles significantly increased after CP.
Table 1Sulfate formation rates and uptake coefficients of SO2 on particle samples before and after CP.
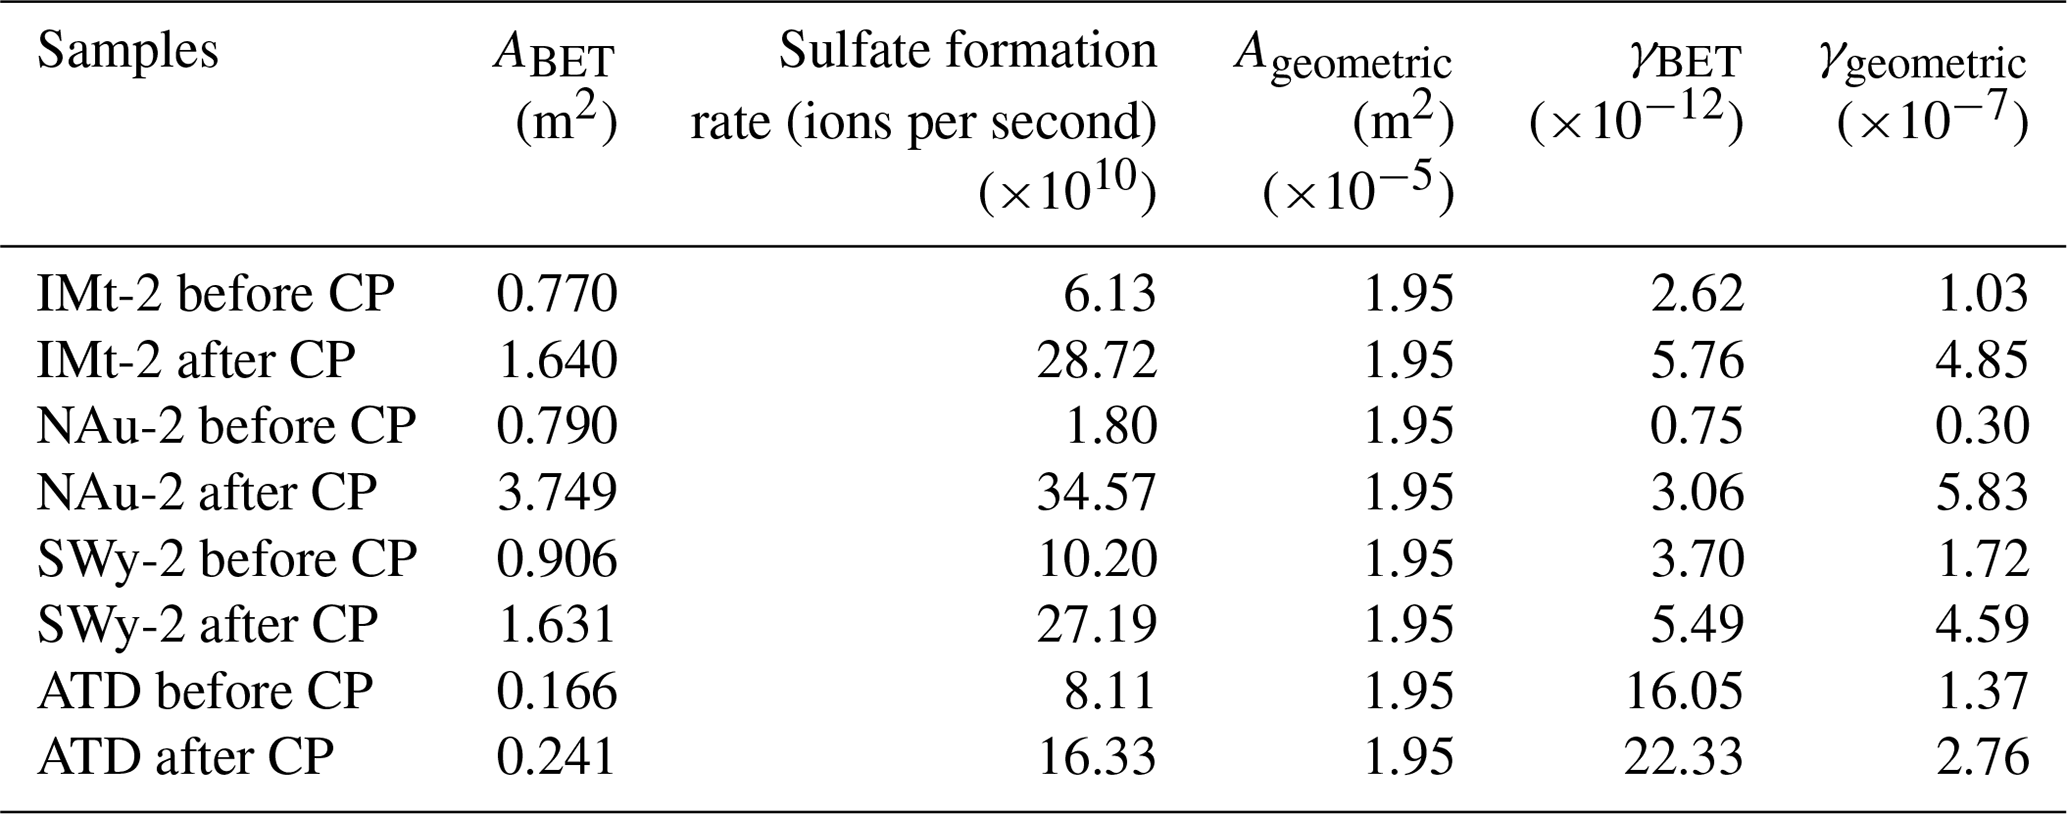
ABET was more appropriate to represent the effective area because the reactant may diffuse into tiny holes of the entire sample. The γBET values of SO2 on the IMt-2, NAu-2, SWy-2 and ATD samples before CP were , , and , respectively, which were in the order of ATD, SWy-2, IMt-2 and NAu-2. It was noteworthy that the SBET of samples increased after CP, as shown in Table 1. The γBET values of SO2 on the IMt-2, NAu-2, SWy-2 and ATD after CP were 2.2, 4.1, 1.5 and 1.4 times higher than the values before CP, respectively. The discrepancies in the γBET value confirmed that the higher sulfate formation rates of the particles after CP were not only due to the increased surface area of the particles but also resulting from the chemical modification on the particle surfaces.
The estimated uptake coefficients were several orders of magnitude lower than the results from Ullerstam et al. (2003) and Usher et al. (2003), which could be partly explained by the difference in the preparation of mineral dust samples or the difference between diverse experimental structures such as the DRIFTS and Knudsen cell in kinetics discussion. In this study, mineral dust particles were in a highly accumulative state in the sample support of the Knudsen cell. The many layers of particles in the latter study will hinder the diffusion of gas into the underlayer particles, resulting in the underestimate of γBET. However, the values herein were comparable to those obtained by the similar DRIFTS setup (Fu et al., 2007), indicating the reliability of our measurements.
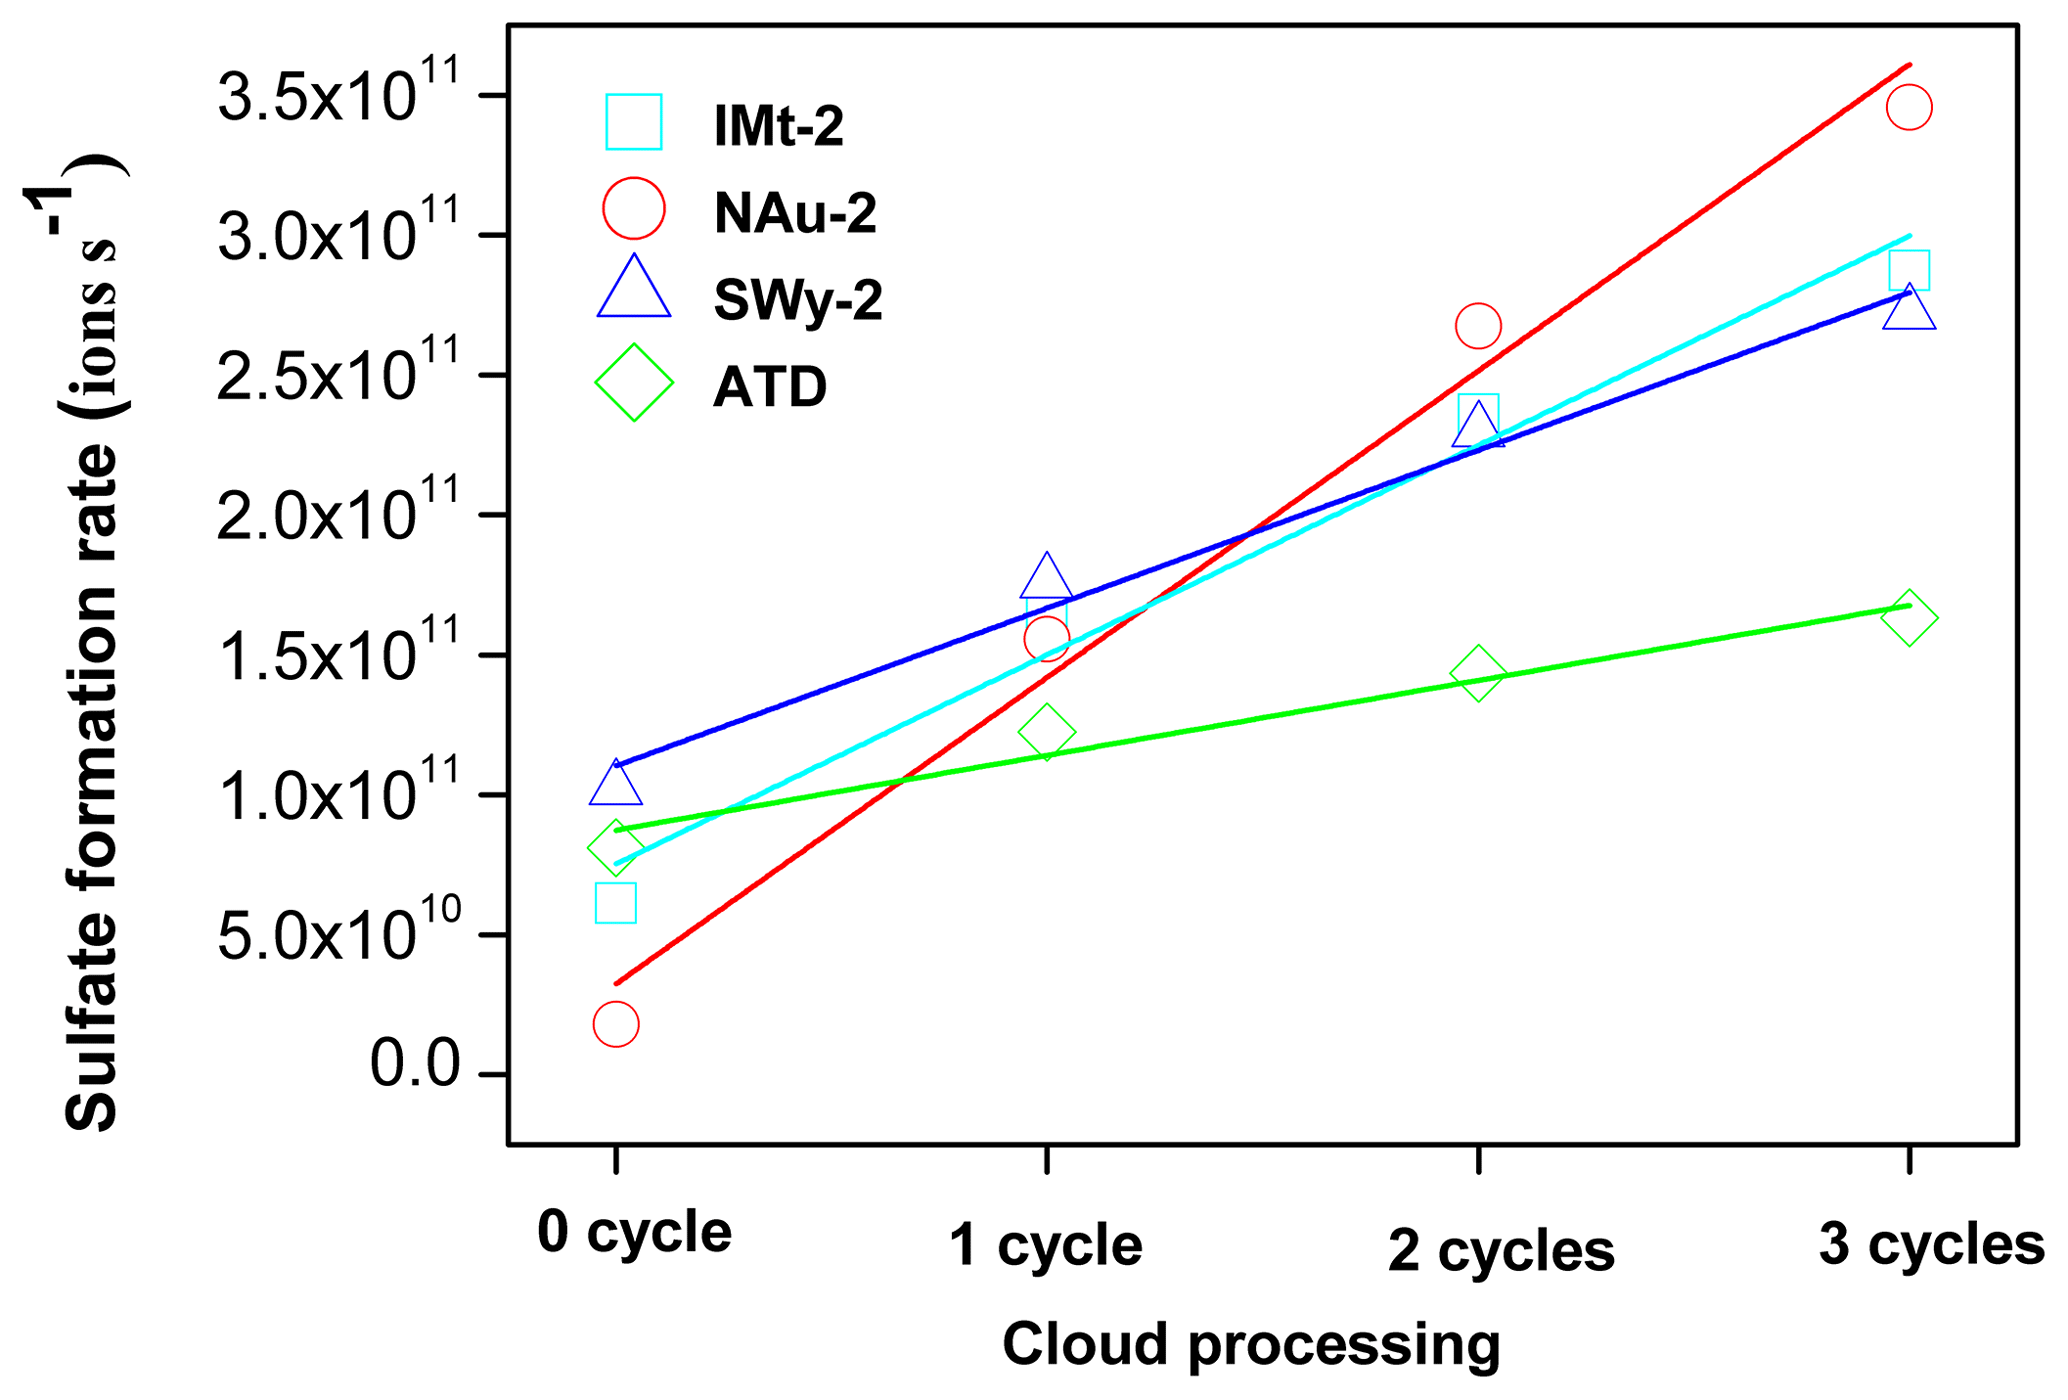
In addition, the formation rate of sulfate appeared as a linear increasing trend as a function of pH cycles. Specifically, the increasing amount of sulfate ions for the IMt-2, NAu-2, SWy-2 and ATD samples after each pH cycle during CP were 7.0×10¹⁰, 1.0×10¹¹, 5.0×10¹⁰, 3.0×10¹⁰ and in the order of NAu-2 > IMt-2 > SWy-2 > ATD (Fig. 4). The multiple factors for γBET (γgeo) coincided with the total Fe content of these samples: NAu-2 (26.30 %) > IMt-2 (5.45 %) > SWy-2 (2.36 %) > ATD (1.48 %). We thus supposed that the SO2 uptake on these dust samples was closely related to the Fe hosted in the particles.

Figure 5The free-Fe (FeA and FeD) and structural-Fe fractions were measured by the chemical CBD extractions for the samples before and after CP. Results are present as relative percentage of FeT.
3.4 Fe speciation analysis before and after CP
The free-Fe (including FeA and FeD) and structural-Fe fractions in the mineral particles before and after CP were determined by the CBD extraction (Fig. 5). In terms of total Fe, the amorphous Fe (FeA) (e.g., nanoparticulate and poorly crystalline ferrihydrite) contents of the IMt-2, NAu-2, SWy-2 and ATD samples before CP were 0.7 %, 0.5 %, 0.7 % and 3.8 %, respectively. The crystalline Fe (oxyhydr)oxides (FeD) (e.g., α-FeOOH and α-Fe2O3) contents of the IMt-2, NAu-2, SWy-2 and ATD samples before CP were 7.2 %, 2.3 %, 4.5 % and 35.5 %, respectively. As a result, the structural-Fe fractions before CP were 92.1 %, 97.2 %, 94.8 % and 60.7 %, respectively, for IMt-2, NAu-2, SWy-2 and ATD.
After CP, the FeA contents of the IMt-2, NAu-2, SWy-2 and ATD samples reached 1.8 %, 1.2 %, 1.7 % and 24.2 %, respectively, which increased by 2.6, 2.4, 2.4 and 6.4 times as compared to the ones before CP. The crystalline Fe (oxyhydr)oxides (FeD) contents of the samples after CP were not significantly changed as compared to the ones before CP, whereas the contents of the structural-Fe fraction in the Al-Si crystals of the IMt-2, NAu-2, SWy-2 and ATD samples after CP decreased by various degrees to 91.1 %, 96.1 %, 93.2 % and 42.5 %, respectively. Previous research had indicated that FeA increased as a result of the simulated CP (Shi et al., 2009). Herein, we further proposed that the increased fractions of FeA could be mostly transformed from the structural-Fe fraction in the aluminosilicate phase of the particles during CP, which is in good agreement with the TEM observation. For example, the FeA in the ATD samples increased from 3.8 % to 24.2 % after CP, accompanied by a sharp decrease in the structural-Fe content from 60.7 % to 42.5 %.
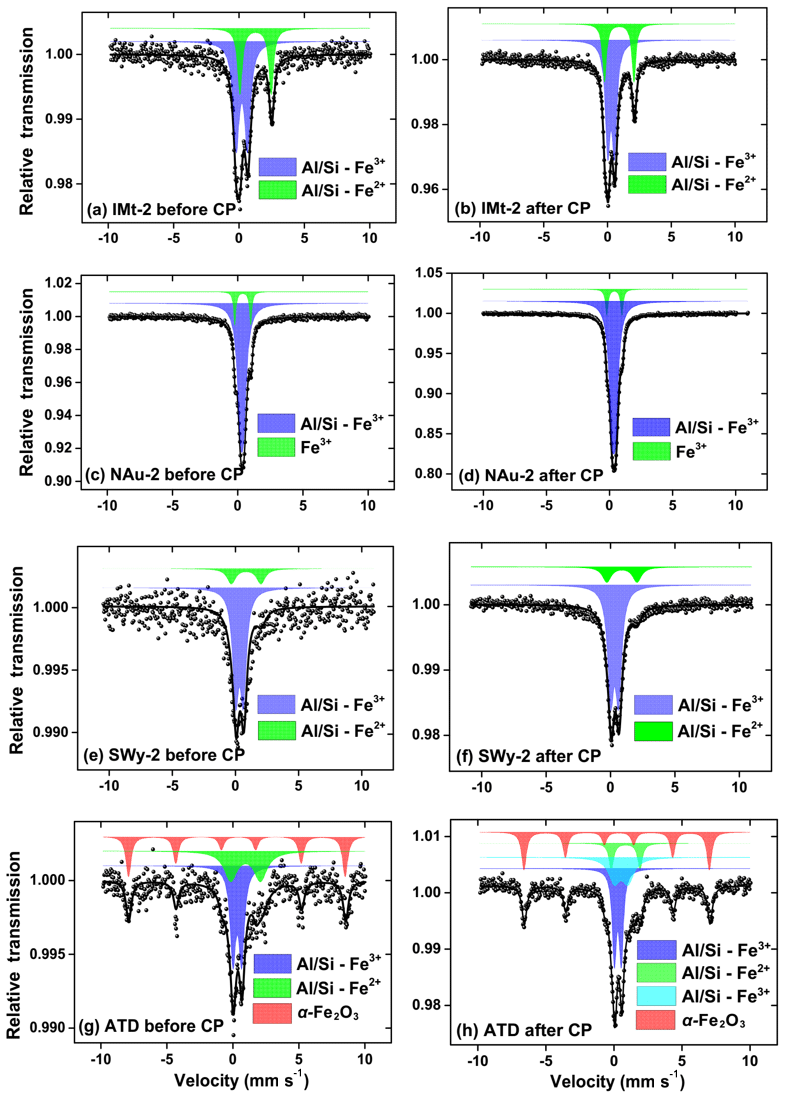
Figure 6Mössbauer spectroscopy measured for samples. IMt-2 before and after CP (a, b), NAu-2 before and after CP (c, d), SWy-2 before and after CP (e, f), ATD before and after CP (g, h). Experimental data were fit using a least-squares fitting program. The IS values were relative to α-Fe at RT. Prominent spectral features associated with different iron species are indicated.
The Mössbauer spectra and their fitted results are shown in Fig. 6. The corresponding hyperfine parameters estimated from the best fitted spectra are presented in Table S3. The central doublet with isomer shift (IS) of 0.37 mm s−1 and quadrupole shift (QS) of 0.72 mm s−1 were typical for high-spin Fe(III) in octahedral symmetry (Eyre and Dickson, 1995), while the other one with IS of 1.12 mm s−1 and QS of 2.65 mm s−1 was characteristic of high-spin Fe(II) (Hofstetter et al., 2003; Kopcewicz et al., 2015). The two doublet components of the IMt-2, NAu-2, SWy-2 and ATD samples before CP were all attributed to different fractions of Fe(III) and Fe(II) in the aluminosilicate crystals. Before CP, the Fe(II) fraction in the IMt-2, NAu-2, SWy-2 and ATD samples were 34.0 %, 12.9 %, 18.3 % and 29.0 %, respectively (Fig. 6a, c, e and g). Furthermore, the spectra of the ATD sample before CP showed not only two central quadrupole doublets but also one MHS (magnetic hyperfine splitting) sextet with IS of 0.39 mm s−1, QS of −0.13 mm s−1 and Hf of 51.1 T. The MHS sextet, which shared 31.8 % of the whole area, could be ascribed to α-Fe2O3 (Kopcewicz and Kopcewicz, 1991), in agreement with the TEM analysis and free-Fe measurement as mentioned previously.
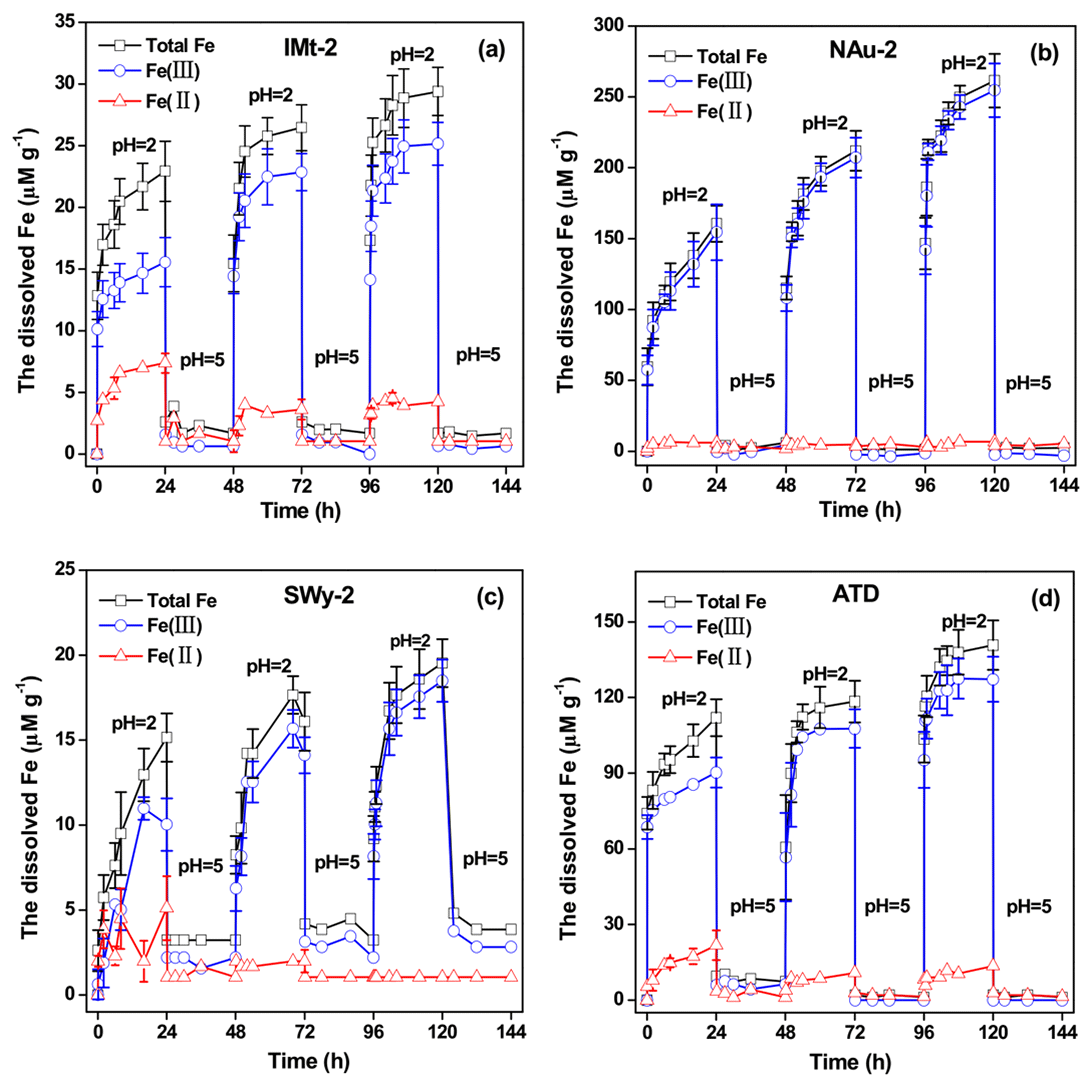
Figure 7The concentrations of Fes, dissolved Fe(II) and Fe(III) in the suspensions measured over 144 h in the solution cycled between pH 2 and pH 5 for IMt-2 (a), NAu-2 (b), SWy-2 (c) and ATD (d), respectively.
After CP, the Fe(II) contents of the samples decreased to 31.5 %, 11.6 %, 17.1 % and 10.9 %, respectively, for IMt-2, NAu-2, SWy-2 and ATD (Fig. 6b, d, f and h). It was supposed that the Fe(II) release is more energetically favorable than the one of Fe(III) due to the bond strength. As to the ATD sample after CP (Fig. 6h), not only did the Fe(II) fraction decrease from 29.0 % to 10.9 % but the Fe(III) fraction in the aluminosilicates also decreased from 39.0 % to 33.0 %. Meanwhile, the α-Fe2O3 fraction was not significantly changed (31.8 % vs. 32.3 %). As discussed previously, the Fe mobilization was dependent on the specific chemical bonds. The FeD phase in α-Fe2O3 with the strong FeO bond was less liable than that embedded in the aluminosilicate lattice (Strehlau et al., 2017). It has been well documented that the Fe replacing alkaline elements as the interlayer ions was easily mobilized compared to the Fe bound by covalent bonds in the aluminosilicate matrix (Luo et al., 2005; Cwiertny et al., 2008; Journet et al., 2008). Therefore, the Fe in the aluminosilicate fraction of the mineral particles exhibited varied iron solubility.
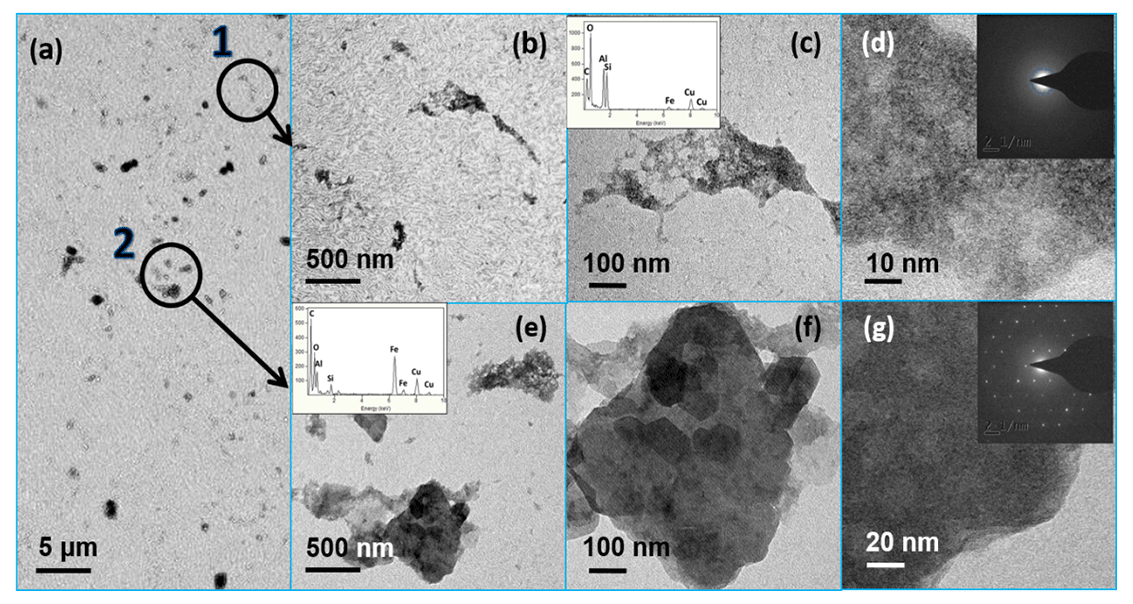
Figure 8TEM images of the newly formed particles in the precipitation experiment. Based on the TEM-EDX measurement and SAED analysis, these particles could be categorized into two different types, which are circled in (a). The typical sizes of the first type were hundreds of nanometers. The enlarged images are displayed in (b, c, d). The insert EDX data and SAED image confirmed that they were poorly crystalline aluminosilicate with low Fe but high Si ∕ Al contents. The second particle type (e, f, g) was Fe rich but with a lower amount of Si ∕ Al, which was nearly 1 µm in size. Based on the EDX data and the SAED analysis, these bigger particles were ambiguously identified as Na0.42Fe3Al6B309Si6O18(OH)3.65.
Particularly, a new quadrupole doublet with IS of 0.67 mm s−1 and QS of 1.21 mm s−1 was observed in the spectra of the ATD sample after CP (Fig. 6h), which shared 23.8 % of the total area, and was possibly indicative of the Fe(III) oxide hybridized in the aluminosilicate matrix (Kopcewicz and Kopcewicz, 1991). The free-Fe measurements have indicated that the FeA fraction of ATD increased by 20.4 % after CP, so this Fe phase was most likely an amorphous Fe(III) hybridized with Al ∕ Si. In terms of the other samples after CP, the magnetic signal of the newly formed Fe(III) phase was not detected. This was probably due to the fact that the newly formed Fe fractions were not available at sufficiently high levels to be clearly resolved by the Mössbauer spectroscopy method, and/or the slight signal drift and the poor signal-to-noise ratio made an unambiguous identification difficult. Herein, the newly formed amorphous Fe(III) phase was supposed to be a reactive Fe-bearing component, which may contribute significantly to the SO2 uptake even at a low level.
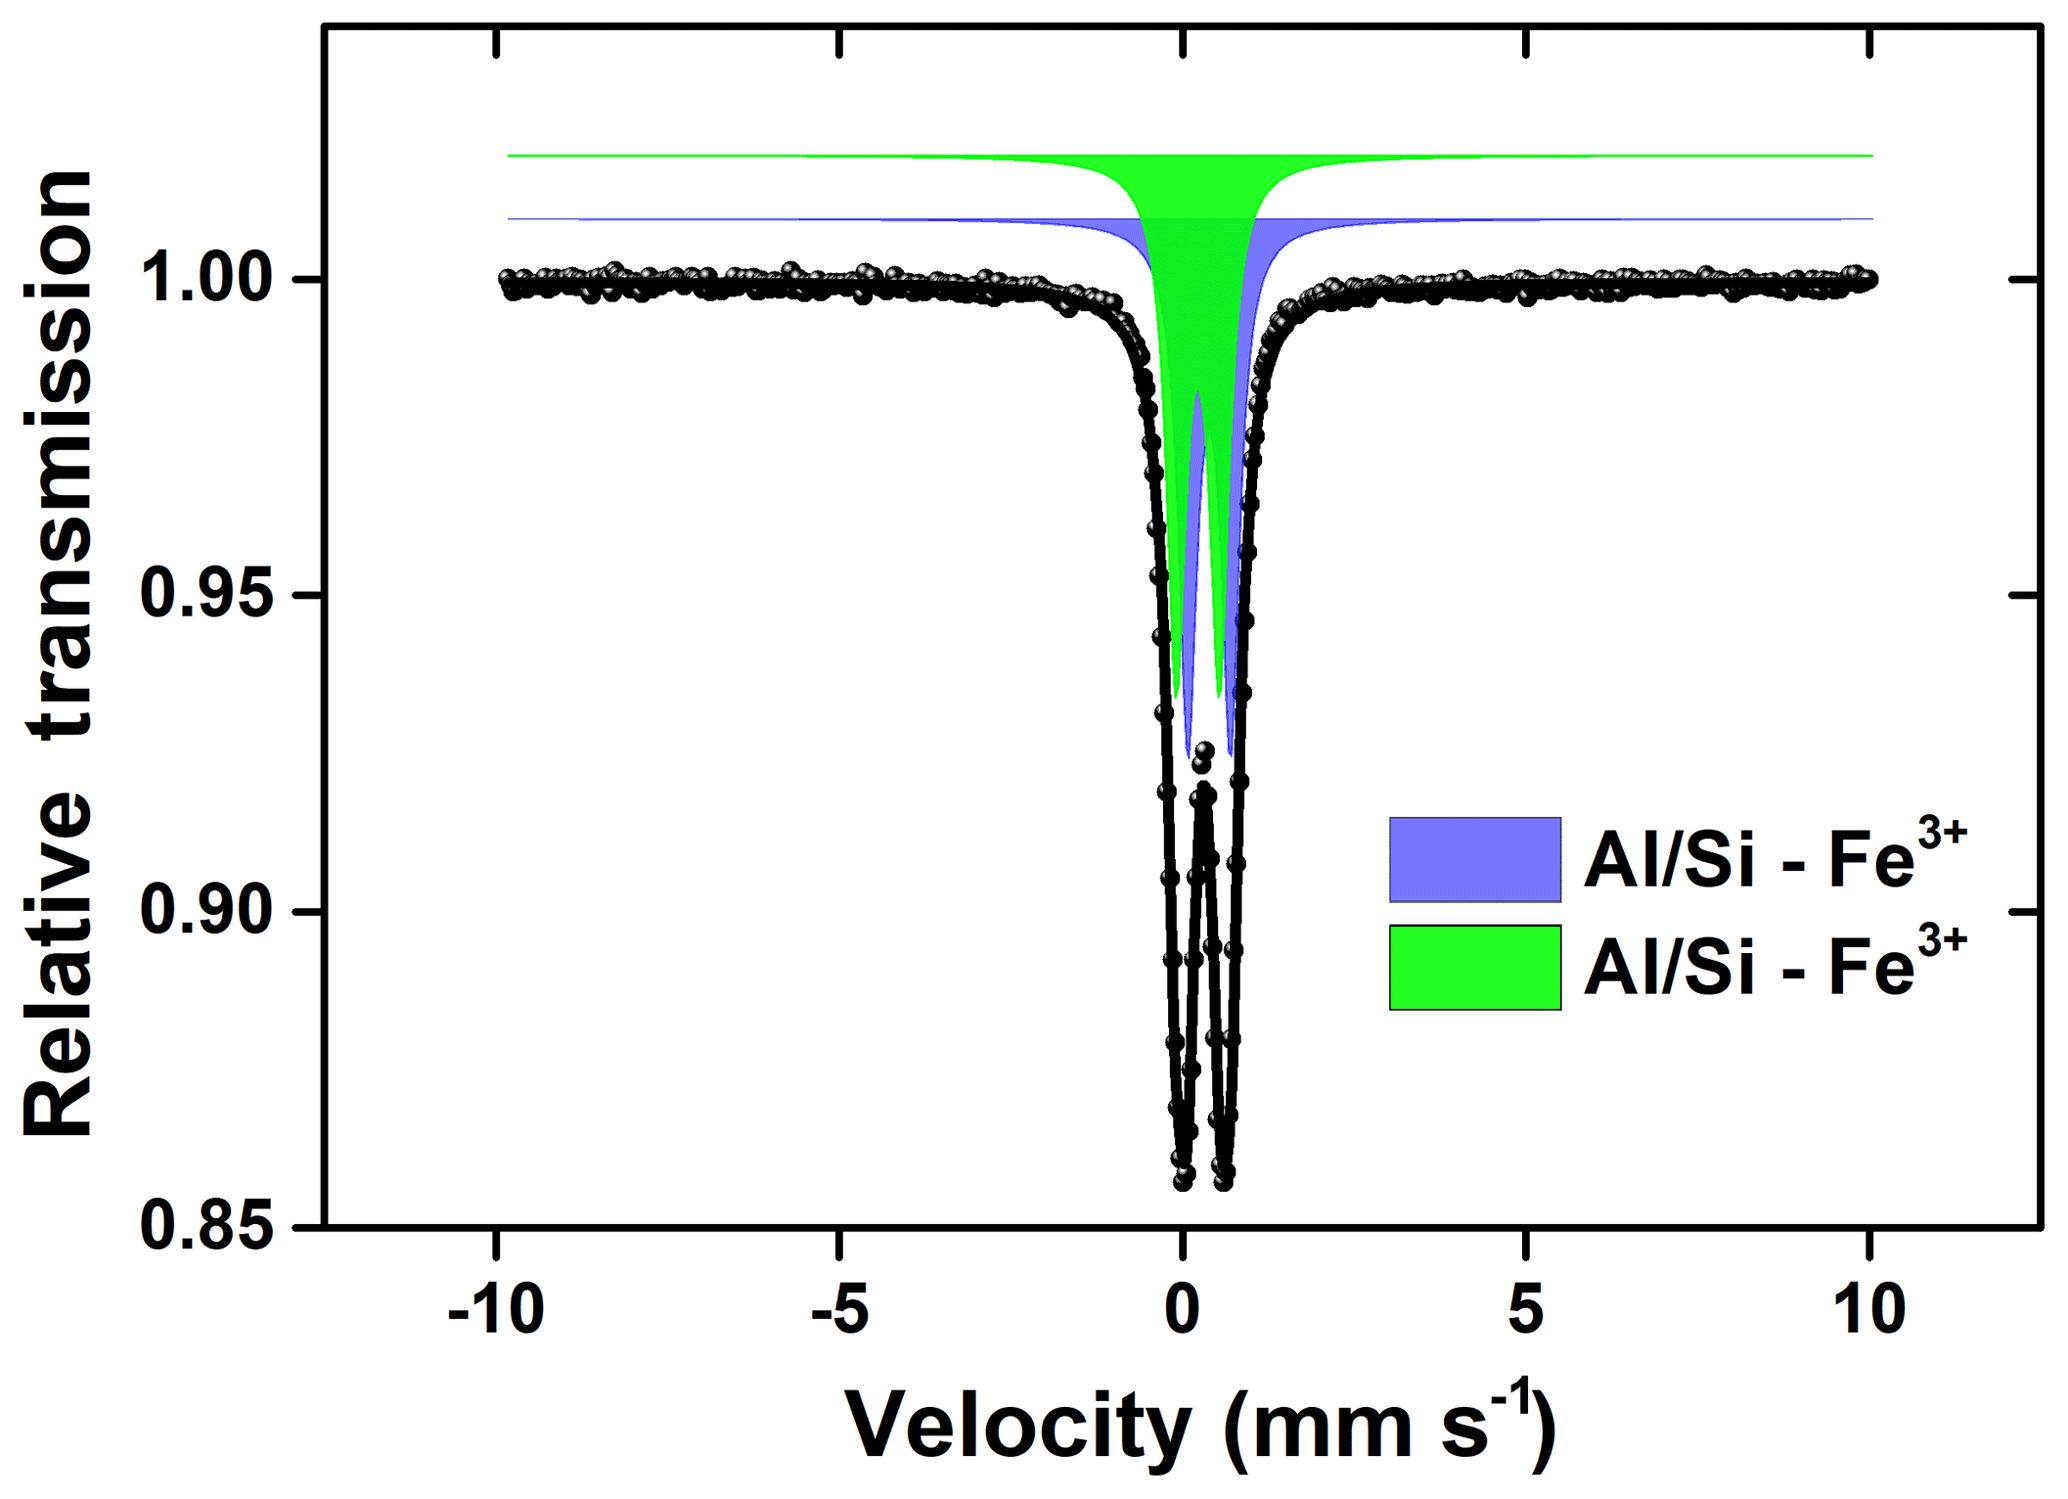
Figure 9Mössbauer spectroscopy measured at RT for the newly formed particles collected in the precipitation experiment.
3.5 The dissolution–precipitation cycle of the mineral Fe during CP
During the simulated CP experiments, the concentrations of total dissolved Fe (Fes), dissolved Fe(II) and Fe(III) released from the particles, as a function of time are shown in Fig. 7. Similar dissolution trends were observed for all of the samples. One can see that the suspensions at pH 2 induced a rapid increase in Fes. Increasing the pH from 2 to 5 resulted in a rapid and almost complete removal of Fes. In fact, only a rather small fraction of the Fe in dusts could be dissolved at pH values above 4 (Zuo and Hoigne, 1992). The dissolved Fe precipitated rapidly as an insoluble deposit at pH 5. When the suspension pH was again reduced to 2, a steep increase in the Fes concentration was measured once again. The fast Fe release was due to the redissolution of the Fe-rich precipitates, which was proposed to be reactive Fe phases (Shi et al., 2009, 2015). Such highly soluble Fe-bearing precipitates have been observed under the TEM, as well as the free-Fe measurement and Mössbauer characterization.
For each pH cycle during the simulated CP experiment, the overall changes in total released Fe concentrations were reproducible. The Fe ion on the particle surfaces would experience a continuous process of dissolution, precipitation, redissolution and reprecipitation when the pH cycles between pH 2 and pH 5 (cloud-aerosol modes). During this process, the Fe(II) fraction would be transformed to Fe(III). The results shown herein suggest that CP could significantly modify Fe partitioning between dissolved and particulate phases in the real atmosphere. Not only did the increase in specific surface area contribute to the enhanced sulfate formation but the highly reactive Fe on the particle surfaces yielded during CP were also responsible for the higher SO2 uptake on the particles after CP.
When investigating the NAu-2 sample, once the pH of the clear solution increased from 2 to 5–6, the Fe-bearing nanoparticles separated out from the solution rapidly and precipitate out slowly. The sample developed an initial yellow color and then an orange colored suspension. The TEM images of the precipitated particles are shown in Fig. 8. The particles could be categorized into two different types. One type of particle could be characterized as hundreds of nanometers in size, with low Fe but high Si ∕ Al content. The other type displayed particle sizes of nearly 1 µm and were Fe rich but contained a smaller amount of Si ∕ Al components. These bigger particles were ambiguously identified as Na0.42Fe3Al6B309Si6O18(OH)3.65 on the basis of the EDX data and SAED analysis. It is likely that the Al ∕ Si elements also precipitated out along with the Fe.
The Mössbauer spectra of the precipitated Fe-rich particles are shown in Fig. 9. Two central doublets were distinguished: one (48.4 %) of IS = 0.45 mm s−1 and QS = 0.75 mm s−1 and the other (51.6 %) of IS = 0.24 mm s−1 and QS = 0.76 mm s−1. Both of the two doublet components could be attributed to the Fe(III) fraction in the aluminosilicates (Kopcewicz et al., 2015). The results were in good agreement with the TEM observation, which showed that most of these Fe particles were mostly present as the Fe(III) hybridized with Al ∕ Si. The particle size distributions in the suspensions were also determined by dynamic light scattering, as shown in Fig. 10. When pH was lower than 2.0, the particles seemed to stabilize below 10 nm in size. These Fe colloids were thought to be a source of soluble Fe (Janney et al., 2000). Once pH increased, the size of precipitated particles quickly increased, even to the microscale, and the suspension was featured with a polydispersed size distribution.
Conclusively, the precipitated Fe particles were mainly Fe(III) with weak crystal structure and/or ferrihydrite nanoparticles hybridized with Al ∕ Si, which were possibly transformed from the Fe hosted in the aluminosilicate matrix of the particles. The particle surfaces after CP were coated by these reactive Fe to provide more surface OH species, resulting in enhanced SO2 uptake.
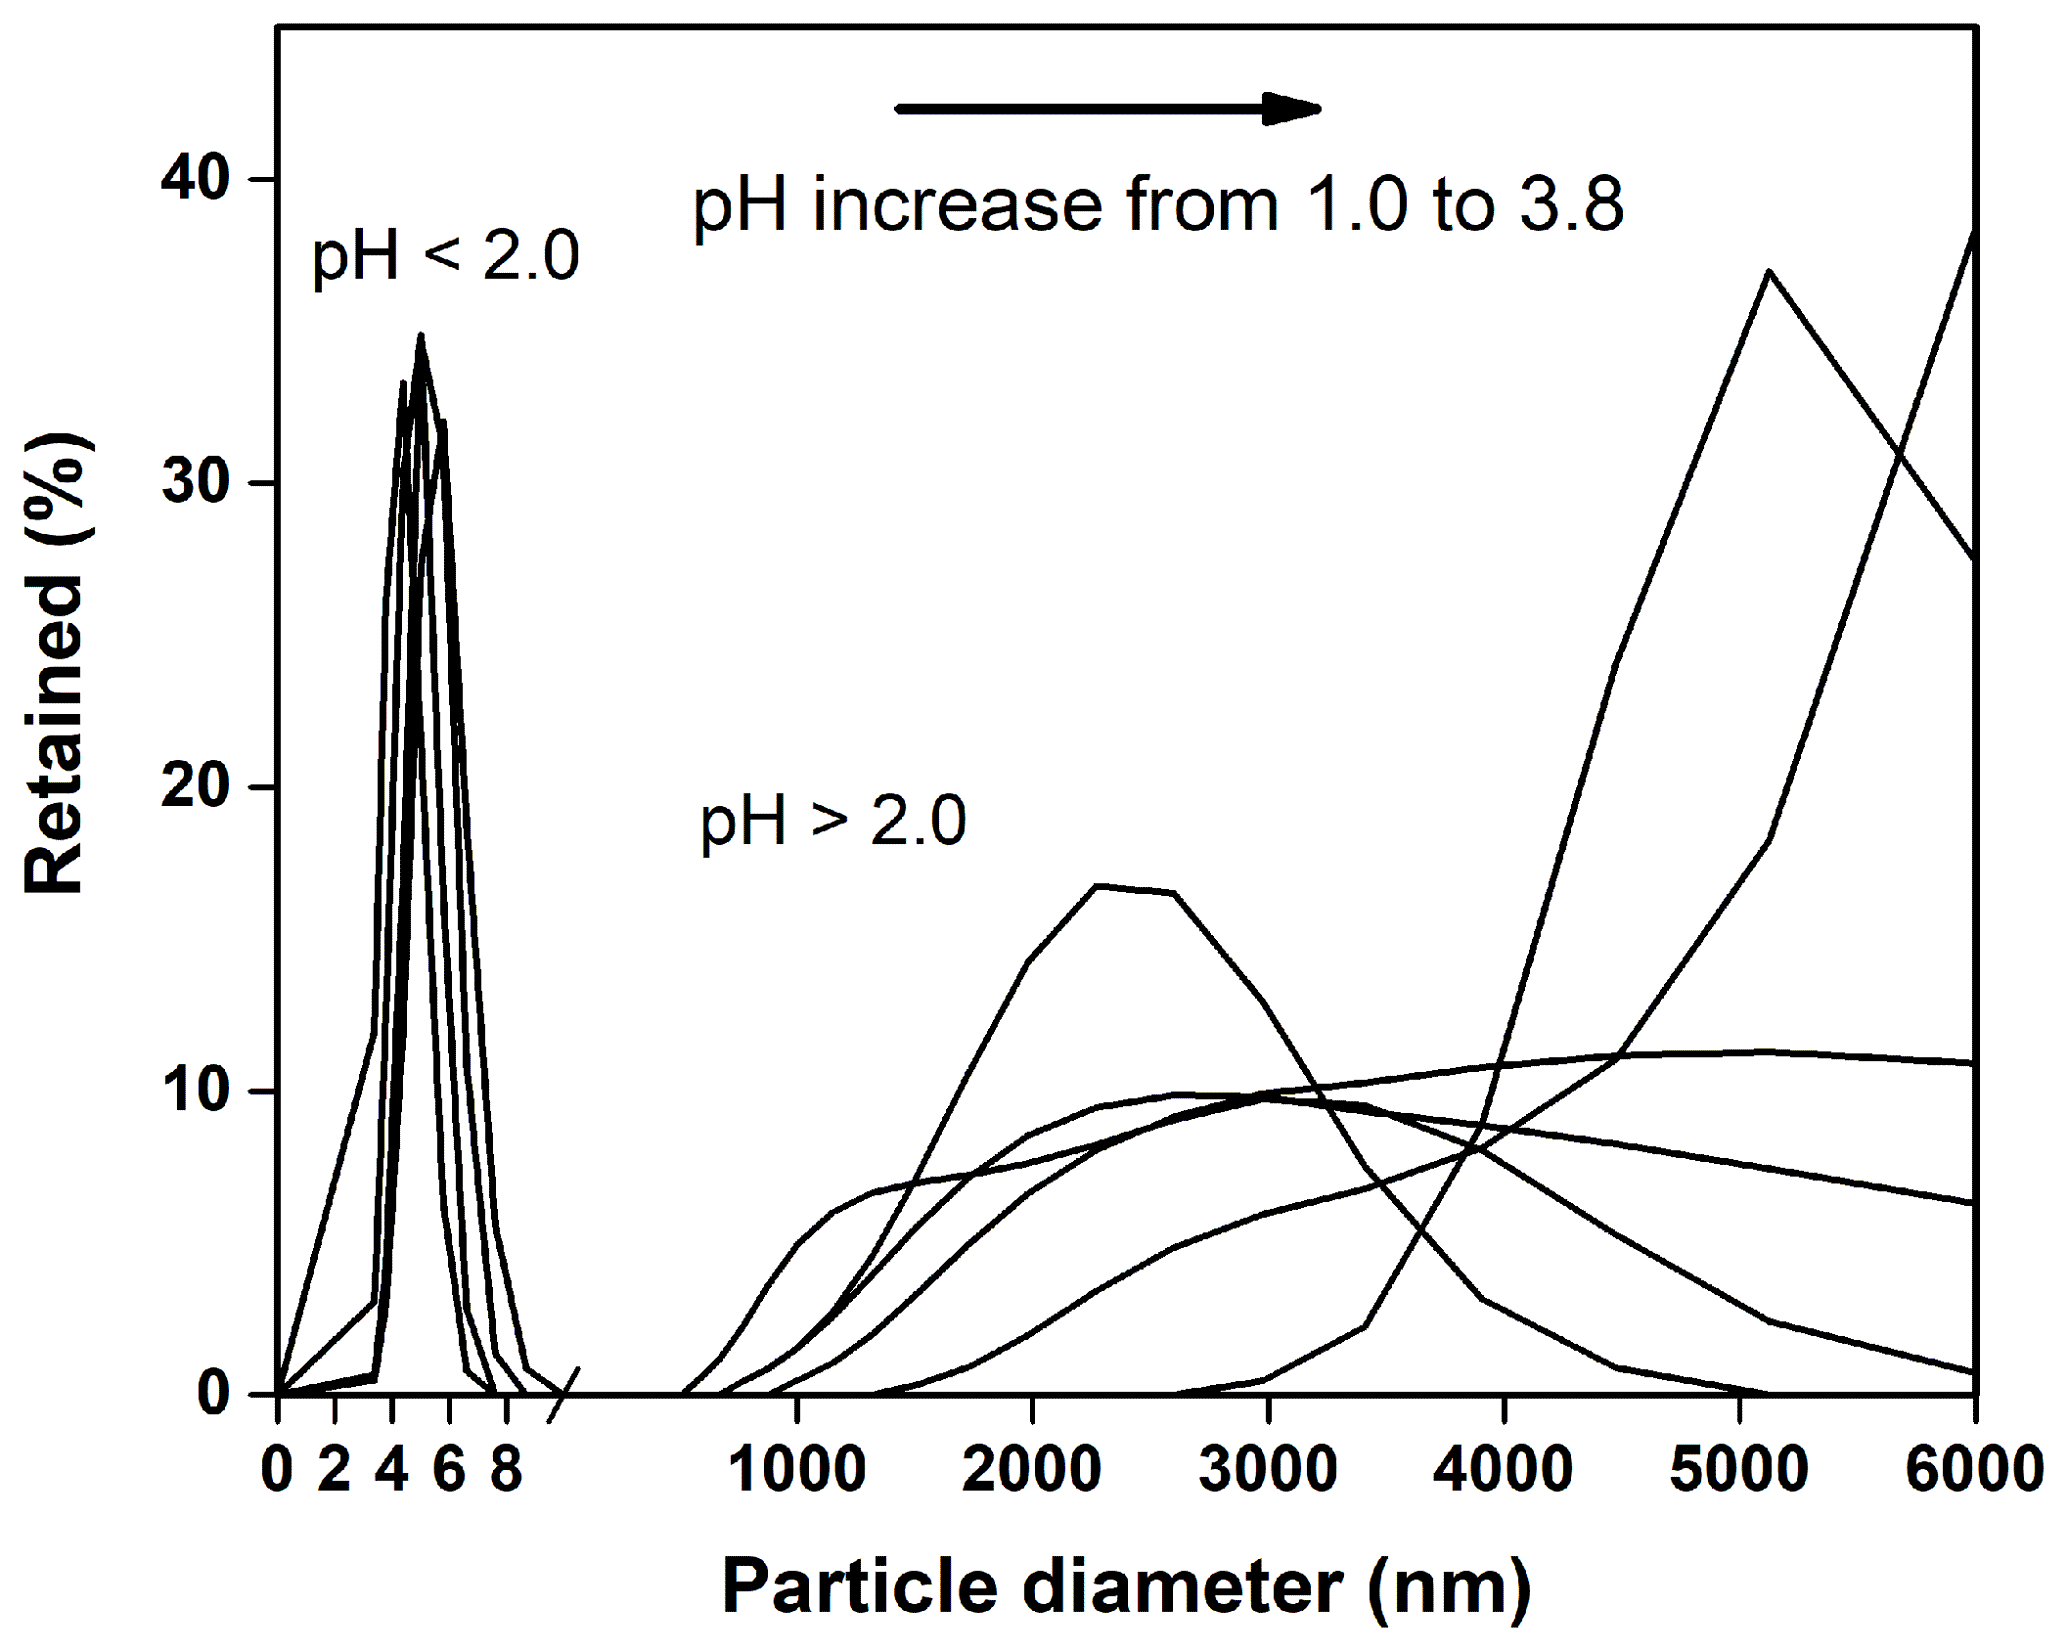
Figure 10During the precipitation experiment, the particle size distributions in the suspensions were determined by dynamic light scattering. The presented size distributions are characteristic of newly formed nanoparticles or microparticles as the suspension pH raised from 1.0 to 3.8.
Transition metal ions, especially Fe(III), can catalyze SO2 oxidation rapidly in cloud drops (Harris et al., 2013). This study further confirmed that SO2 uptake on the mineral particles could be greatly enhanced by CP, possibly more than described previously. The higher uptake coefficient of the particles after CP was not only due to increased surface area but also resulted from the chemical modification of the particle surfaces. The free-Fe and Mössbauer analyses suggested that CP triggered new formation of amorphous Fe particles on the surfaces, which were mostly transformed from the Fe hosted in the aluminosilicate matrix. TEM showed that the amorphous Fe(III) and/or ferrihydrite nanoparticles were hybridized with Al ∕ Si. In general, the acidity fluctuation during CP enables the dissolution–precipitation cycles of mineral Fe to yielded more reactive Fe, resulting in more SO2 uptake on the particle surfaces. More SO2 adsorption further increases the surface acidity of dust particles, in turn leading to higher Fe solubility; again, more sulfate formation. It was thus proposed that there is a positive feedback relative to SO2 uptake and iron mobilized from mineral particles during CP, therefore enhanced sulfate formation greatly.
Our results also serve to explain high sulfate loading in fog–haze episodes of China. It has been recommended that sulfate contributed significantly to the explosive growth of fine particles, thus exacerbating severe fog–haze development (Kasibhatla et al., 1997; Nie et al., 2014; Barrie et al., 2016). Haze and fog within an episode was often found to transform each other at a short time due to the diurnal variation in RH, whereby the haze-fog transition was probably analogous to the aerosol–cloud interaction. Water content of aerosol or fog drops was regulated by RH, and thus allowed the particle acidity fluctuation. Although the aerosol acidity could not be accurately determined from field measurements or calculated using the thermodynamic model, we recognized that the large pH fluctuations between the haze-fog modes could significantly modify the microphysical properties of mineral particles, trigger formation of reactive Fe particles and thus accelerate sulfate formation via a self-amplifying process, contributing to explosive growth of fine particles at the initial stage of fog–haze events. The data presented herein also highlight that CP provides more bioavailable iron from mineral particles than one expected previously, which is a key speciation to promote oceanic primary productivity. Results of this study could partly explain the missing source of sulfate and improve agreement between models and field observations.
Additionally, previous studies indicated that Fe in pyrogenic aerosols was always presented as liable Fe, such as ferric sulfate and aggregated nanocrystals of magnetite (Fe3O4) (Fu et al., 2012), and displayed higher Fe solubility compared to dust (Desboeufs et al., 2005; Sedwick et al., 2007; Ito et al., 2019). Alexander et al. (2009) demonstrated that the sulfate formed through metal catalysis was highest over the polluted industrial regions of northern Eurasia, suggesting that the increasing importance of the metal-catalyzed S(IV) oxidation pathway due to anthropogenic emissions (Alexander et al., 2009). With the rapid development of industry and agriculture, the pyrogenic Fe-containing aerosols are indispensable contributors to the atmospheric Fe load in China. Thus, the acidic solution at pH 2 and high sulfate loading of fine particles in severe fog–haze events of China might be more relevant to Fe-containing combustion aerosols than mineral dust. Based on the current findings, not only the potential influences of cloud liquid water content, light and organic ligands but also the solubility and speciation of Fe in pyrogenic aerosols will be considered during the simulated CP experiments in the future. A more detailed understanding of the iron–sulfur cycle during CP is therefore critical to estimate accurately the contribution of CP to global sulfate loading and its impact on the climate.
All data described in this study are available upon request from the corresponding authors.
The supplement related to this article is available online at: https://doi.org/10.5194/acp-19-12569-2019-supplement.
ZW, HF and JC designed the experiments. ZW, TW, HF and LZ performed the laboratory experiments. HF, JC, LZ and VG contributed reagents and analytic tools. CG, VG and MT gave some valuable suggestions in designing the experiments. ZW, TW and HF analyzed data. ZW and HF wrote the article with inputs from all coauthors.
The authors declare that they have no conflict of interest.
This article is part of the special issue “Multiphase chemistry of secondary aerosol formation under severe haze”. It is not associated with a conference.
This work was supported by the National Natural Science Foundation of China (nos. 91744205, 21777025, 21577022, 21177026), the National Key R&D Program of China (2016YFC0202700), and the Opening Project of Shanghai Key Laboratory of Atmospheric Particle Pollution and Prevention.
This research has been supported by the National Key R&D Program of China (grant no. 2016YFC0202700), the National Natural Science Foundation of China (grant nos. 91744205, 21777025, 21577022, 21177026), the International Cooperation Project of Shanghai Municipal Government (grant no. 15520711200), and the Opening Project of Shanghai Key Laboratory of Atmospheric Particle Pollution and Prevention (grant no. 46685365).
This paper was edited by Hang Su and reviewed by two anonymous referees.
Alexander, B., Park, R. J., Jacob, D. J., and Gong, S.: Transition metal-catalyzed oxidation of atmospheric sulfur: Global implications for the sulfur budget, J. Geophys. Res., 114, D02309, https://doi.org/10.1029/2008JD010486, 2009.
Andreae, M. O. and Rosenfeld, D.: Aerosol-cloud-precipitation interactions. Part 1. The nature and sources of cloud-active aerosols, Earth Sci. Rev., 89, 13–41, https://doi.org/10.1016/j.earscirev.2008.03.001, 2008.
Baker, A. R. and Croot, P. L.: Atmospheric and marine controls on aerosol iron solubility in seawater, Mar. Chem., 120, 4–13, https://doi.org/10.1016/j.marchem.2008.09.003, 2010.
Barrie, L. A., Yi, Y., Leaitch, W. R., Lohmann, U., Kasibhatla, P., Roelofs, G. J., Wilson, J., McGovern, F., Benkovitz, C., Méliéres, M. A., Law, K., Prospero, J., Kritz, M., Bergmann, D., Bridgeman, C., Chin, M., Christensen, J., Easter, R., Feichter, J., Land, C., Jeuken, A., Kjellström, E., Koch, D., and Rasch, P.: A comparison of large-scale atmospheric sulphate aerosol models (COSAM): Overview and highlights, Tellus B, 53, 615–645, https://doi.org/10.1034/j.1600-0889.2001.530507.x, 2016.
Behra, P., Sigg, L., and Stumm, W.: Dominating influence of NH3 on the oxidation of aqueous SO2: the coupling of NH3 and SO2 in atmospheric water, Atmos. Environ., 23, 2691–2707, https://doi.org/10.1016/0004-6981(89)90549-0, 1989.
Cheng, Y. F., Zheng, G. J., Wei, C., Mu, Q., Zheng, B., Wang, Z. B., Gao, M., Zhang, Q., He, K. B., Carmichael, G., Poschl, U., and Su, H.: Reactive nitrogen chemistry in aerosol water as a source of sulfate during haze events in China, Sci. Adv., 2, 1–11, https://doi.org/10.1126/sciadv.1601530, 2016.
Claquin, T., Schulz, M., and Balkanski, Y. J.: Modeling the mineralogy of atmospheric dust sources, J. Geophys. Res.-Atmos., 104, 22243–22256, https://doi.org/10.1029/1999JD900416, 1999.
Cwiertny, D. M., Baltrusaitis, J., Hunter, G. J., Laskin, A., Scherer, M. M., and Grassian, V. H.: Characterization and acid-mobilization study of iron-containing mineral dust source materials, J. Geophys. Res.-Atmos., 113, D05202, https://doi.org/10.1029/2007JD009332, 2008.
Deguillaume, L., Desboeufs, K. V., Leriche, M., Long, Y., and Chaumerliac, N.: Effect of iron dissolution on cloud chemistry: from laboratory measurements to model results, Atmos. Pollut. Res., 1, 220–228, https://doi.org/10.5094/APR.2010.029, 2010.
Desboeufs, K. V., Losno, R., and Colin, J. L.: Factors influencing aerosol solubility during cloud processes, Atmos. Environ., 35, 3529–3537, https://doi.org/10.1016/S1352-2310(00)00472-6, 2001.
Desboeufs, K. V., Sofikitis, A., Losno, R., Colin, J. L., and Ausset, P.: Dissolution and solubility of trace metals from natural and anthropogenic aerosol particulate matter, Chemosphere, 58, 195–203, https://doi.org/10.1016/j.chemosphere.2004.02.025, 2005.
Eyre, J. K. and Dickson, D. P. E.: Mössbauer spectroscopy analysis of iron-containing minerals in the Chinese loess, J. Geophys. Res., 100, 17925–17930, https://doi.org/10.1029/95JB01060, 1995.
Faust, B. C., Hoffmann, M. R., and Bahnemann, D. W.: Photocatalytic oxidation of sulfur dioxide in aqueous suspensions of α-Fe2O3, J. Phys. Chem., 93, 6371–6381, https://doi.org/10.1021/j100354a021, 1989.
Formenti, P., Rajot, J. L., Desboeufs, K., Caquineau, S., Chevaillier, S., Nava, S., Gaudichet, A., Journet, E., Triquet, S., Alfaro, S., Chiari, M., Haywood, J., Coe, H., and Highwood, E.: Regional variability of the composition of mineral dust from western Africa: Results from the AMMA SOP0/DABEX and DODO field campaigns, J. Geophys. Res., 113, D00C13, https://doi.org/10.1029/2008JD009903, 2008.
Fu, H. B., Wang, X., Wu, H. B., Yin, Y., and Chen, J. M.: Heterogeneous uptake and oxidation of SO2 on iron oxides, J. Phys. Chem. C, 111, 6077–6085, https://doi.org/10.1021/jp070087b, 2007.
Fu, H. B., Lin, J., Shang, G. F., Dong, W. B., Grassian, V. H., Carmichael, G. R., Li, Y., and Chen, J. M.: Solubility of iron from combustion source particles in acidic media linked to iron speciation, Environ. Sci. Technol., 46, 11119–11127, https://doi.org/10.1021/es302558m, 2012.
George, C., Ammann, M., D'Anna, B., Donaldson D. J., and Nizkorodov, S. A.: Heterogeneous Photochemistry in the Atmosphere, Chem. Rev., 115, 4218–4258, https://doi.org/10.1021/cr500648z, 2015.
Goodman, A. L., Li, P., Usher, C. R., and Grassian, V. H.: Heterogeneous uptake of sulfur dioxide on aluminum and magnesium oxide particles, J. Phys. Chem. A, 105, 6109–6120, https://doi.org/10.1021/jp004423z, 2001.
Harris, E., Sinha, B., Foley, S., Crowley, J. N., Borrmann, S., and Hoppe, P.: Sulfur isotope fractionation during heterogeneous oxidation of SO2 on mineral dust, Atmos. Chem. Phys., 12, 4867–4884, https://doi.org/10.5194/acp-12-4867-2012, 2012.
Harris, E., Sinha, B., van Pinxteren, D., Tilgner, A., Fomba, K. W., Schneider, J., Roth, A., Gnauk, T., Fahlbusch, B., Mertes, S., Lee, T., Collett, J., Foley, S., Borrmann, S., Hoppe, P., and Herrmann, H.: Enhanced role of transition metal ion catalysis during in-cloud oxidation of SO2, Science, 340, 727–730, https://doi.org/10.1126/science.1230911, 2013.
Herman, L. M. S.: Heterogeneous and homogeneous oxidation of SO2 in the remote marine atmosphere, Atmos. Environ., 25, 1489–1496, https://doi.org/10.1016/0960-1686(91)90008-U, 1991.
Hofstetter, T. B., Schwarzenbach, R. P., and Haderlein, S. B.: Reactivity of Fe(II) species associated with clay minerals, Environ. Sci. Technol., 37, 519–528, https://doi.org/10.1021/es025955r, 2003.
Huang, L., Zhao, Y., Li, H., and Chen, Z.: Kinetics of heterogeneous reaction of sulfur dioxide on authentic mineral dust: Effects of relative humidity and hydrogen peroxide, Environ. Sci. Technol., 49, 10797–17805, https://doi.org/10.1021/acs.est.5b03930, 2015.
Ito, A., Myriokefalitakis, S., Kanakidou, M., Mahowald, N., Scanza, R., Hamilton, D., Baker, A., Jickells, T., Sarin, M., Bikkina, S., Gao, Y., Shelley, R., Buck, C., Landing, W., Bowie, A., Perron, M., Guieu, C., Meskhidze, N., Johnson, M., Feng, Y., Kok, J., Nenes, A. and Duce, R.: Pyrogenic iron: The missing link to high iron solubility in aerosols, Sci. Adv., 5, eaau7671, https://doi.org/10.1126/sciadv.aau7671, 2019.
Janney, D. E., Cowley, J. M., and Buseck, P. R.: Transmission electron microscopy of synthetic 2-and 6-line ferrihydrite, Clay Clay Miner., 48, 111–119, https://doi.org/10.1346/CCMN.2000.0480114, 2000.
Jickells, T. D., An, Z. S., Andersen, K. K., Baker, A. R., Bergametti, G., Brooks, N., Cao, J. J., Boyd, P. W., Duce, R. A., Hunter, K. A., Kawahata, H., Kubilay, N., laRoche, J., Liss, P. S., Mahowald, N., Prospero, J. M., Ridgwell, A. J., Tegen, I., and Torres, R.: Global iron connections between desert dust, ocean biogeochemistry, and climate, Science, 308, 67–71, https://doi.org/10.1126/science.1105959, 2005.
Journet, E., Desboeufs, K. V., Caquineau, S., and Colin, J.-L.: Mineralogy as a critical factor of dust iron solubility, Geophys. Res. Lett., 35, L07805, https://doi.org/10.1029/2007GL031589, 2008.
Kadar, E., Fisher, A., Stolpe, B., Calabrese, S., Lead, J., Valsami-Jones, E., and Shi, Z.: Colloidal stability of nanoparticles derived from simulated cloud-processed mineral dusts, Sci. Total. Environ., 466, 864–870, https://doi.org/10.1016/j.scitotenv.2013.07.119, 2014.
Kasibhatla, P., Chameides, W. L., and John, J. S.: A three-dimensional global model investigation of seasonal variations in the atmospheric burden of anthropogenic sulfate aerosols, J. Geophys. Res.-Atmos., 102, 3737–3759, https://doi.org/10.1029/96JD03084, 1997.
Kerminen, V. M., Pirjola, L., Boy, M., Eskola, A., Teinila, K., Laakso, L., Asmi, A., Hienola, J., Lauri, A., Vainio, V., Lehtinen, K., and Kulmala, M.: Interaction between SO2 and submicron atmospheric particles, Atmos. Res., 54, 41–57, https://doi.org/10.1016/S0169-8095(00)00038-7, 2000.
Kolb, C. E., Cox, R. A., Abbatt, J. P. D., Ammann, M., Davis, E. J., Donaldson, D. J., Garrett, B. C., George, C., Griffiths, P. T., Hanson, D. R., Kulmala, M., McFiggans, G., Pöschl, U., Riipinen, I., Rossi, M. J., Rudich, Y., Wagner, P. E., Winkler, P. M., Worsnop, D. R., and O'Dowd, C. D.: An overview of current issues in the uptake of atmospheric trace gases by aerosols and clouds, Atmos. Chem. Phys., 10, 10561–10605, https://doi.org/10.5194/acp-10-10561-2010, 2010.
Kong, L. D., Zhao, X., Sun, Z. Y., Yang, Y. W., Fu, H. B., Zhang, S. C., Cheng, T. T., Yang, X., Wang, L., and Chen, J. M.: The effects of nitrate on the heterogeneous uptake of sulfur dioxide on hematite, Atmos. Chem. Phys., 14, 9451–9467, https://doi.org/10.5194/acp-14-9451-2014, 2014.
Kopcewicz, B. and Kopcewicz, M.: Moössbauer study of iron-containing atmospheric aerosols, Struct. Chem., 2, 303–312, https://doi.org/10.1007/BF00672227, 1991.
Kopcewicz, B., Kopcewicz, M., and Pietruczuk, A.: The Mössbauer study of atmospheric iron-containing aerosol in the coarse and PM2.5 fractions measured in rural site, Chemosphere, 131, 9–16, https://doi.org/10.1016/j.chemosphere.2015.02.038, 2015.
Lafon, S., Rajot, J.-L., Alfaro, S. C., and Gaudichet, A.: Quantification of iron oxides in desert aerosol, Atmos. Environ., 38, 1211–1218, https://doi.org/10.1016/j.atmosenv.2003.11.006, 2004.
Lelieveld, J. and Heintzenberg, J.: Sulfate cooling effect on climate through in-cloud oxidation of anthropogenic SO2, Science, 258, 117–120, https://doi.org/10.1126/science.258.5079.117, 1992.
Luo, C., Mahowald, N. M., Meskhidze, N., Chen, Y., Siefert, R. L., Baker, A. R., and Johansen, A. M.: Estimation of iron solubility from observations and a global aerosol model, J. Geophys. Res., 110, D23, https://doi.org/10.1029/2005JD006059, 2005.
Luo, C., Mahowald, N., Bond, T., Chuang, P. Y., Artaxo, P., Siefert, R., Chen, Y., and Schauer, J.: Combustion iron distribution and deposition, Global Biogeochem. Cycles, 22, GB1012, https://doi.org/10.1029/2007GB002964, 2008.
Luria, M. and Sievering, H.: Heterogeneous and homogeneous oxidation of SO2 in the remote marine atmosphere, Atmos. Environ., 25, 1489–1496, https://doi.org/10.1016/0960-1686(91)90008-U, 1991.
Ma, Q., He, H., and Liu, Y.: In situ DRIFTS study of hygroscopic behavior of mineral aerosol, J. Environ. Sci., 22, 555–560, https://doi.org/10.1016/S1001-0742(09)60145-5, 2010.
Mackie, D. S.: Simulating the cloud processing of iron in Australian dust: pH and dust concentration, Geophys. Res. Lett., 32, L06809, https://doi.org/10.1029/2004GL022122, 2005.
Mahowald, N. M., Baker, A. R., Bergametti, G., Brooks, N., Duce, R. A., Jickells, T. D., Kubilay, N., Prospero, J. M., and Tegen, I.: Atmospheric global dust cycle and iron inputs to the ocean, Global Biogeochem. Cy., 19, GB4025, https://doi.org/10.1029/2004GB002402, 2005.
Maters, E. C., Delmelle, P., and Bonneville, S.: Atmospheric processing of volcanic glass: Effects on iron solubility and redox speciation, Environ. Sci. Technol., 50, 5033–5040, https://doi.org/10.1021/acs.est.5b06281, 2016.
Meskhidze, N.: Iron mobilization in mineral dust: Can anthropogenic SO2 emissions affect ocean productivity? Geophys. Res. Lett., 30, 1–2, https://doi.org/10.1029/2003GL018035, 2003.
Nanayakkara, C. E., Pettibone, J., and Grassian, V. H.: Sulfur dioxide adsorption and photooxidation on isotopically-labeled titanium dioxide nanoparticle surfaces: Roles of surface hydroxyl groups and adsorbed water in the formation and stability of adsorbed sulfite and sulfate, Phys. Chem. Chem. Phys., 14, 6957–6966, https://doi.org/10.1039/C2CP23684B, 2012.
Nie, W., Ding, A. J., Wang, T., Kerminen, V., George, C., Xue, L. K., Wang, W. X., Zhang, Q. Z., Petäjä, T., Qi, X. M., Gao, X. M., Wang, X. F., Yang, X. Q., Fu, C. B., and Kulmala, M.: Polluted dust promotes new particle formation and growth, Sci. Rep., 4, 6634, https://doi.org/10.1038/srep06634, 2014.
Peak, D., Ford, R. G., and Sparks, D. L.: An in situ ATR-FTIR investigation of sulfate bonding mechanisms on goethite, J. Colloid Interface Sci., 218, 289–299, https://doi.org/10.1006/jcis.1999.6405, 1999.
Pruppacher, H. R., Jaenicke, R.: The processing of water-vapor and aerosols by atmospheric clouds, a global estimate, Atmos. Res., 38, 283–295, https://doi.org/10.1016/0169-8095(94)00098-X, 1995.
Rubasinghege, G., Lentz, R. W., Scherer, M. M., and Grassian, V. H.: Simulated atmospheric processing of iron oxyhydroxide minerals at low pH: roles of particle size and acid anion in iron dissolution, P. Natl. Acad. Sci. USA, 107, 6628–6633, https://doi.org/10.1073/pnas.0910809107, 2010.
Sedwick, P. N., Sholkovitz, E. R., and Church, T. M.: Impact of anthropogenic combustion emissions on the fractional solubility of aerosol iron: Evidence from the Sargasso Sea, Geochem. Geophys. Geosyst., 8, Q10Q06, https://doi.org/10.1029/2007GC001586, 2007.
Shi, Z., Bonneville, S., Krom, M. D., Carslaw, K. S., Jickells, T. D., Baker, A. R., and Benning, L. G.: Iron dissolution kinetics of mineral dust at low pH during simulated atmospheric processing, Atmos. Chem. Phys., 11, 995–1007, https://doi.org/10.5194/acp-11-995-2011, 2011.
Shi, Z., Krom, M. D., Bonneville, S., Baker, A. R., Jickells, T. D., and Benning, L. G.: Formation of iron nanoparticles and increase in iron reactivity in mineral dust during simulated cloud processing, Environ. Sci. Technol., 43, 6592–6596, https://doi.org/10.1021/es901294g, 2009.
Shi, Z., Krom, M. D., Bonneville, S., Baker, A. R., Bristow, C., Drake, N., Mann, G., Carslaw, K., McQuaid, J. B., Jickells, T., and Benning, L. G.: Influence of chemical weathering and aging of iron oxides on the potential iron solubility of Saharan dust during simulated atmospheric processing, Global Biogeochem. Cy., 25, GB2010, https://doi.org/10.1029/2010GB003837, 2011.
Shi, Z., Krom, M. D., Bonneville, S., and Benning, L. G.: Atmospheric processing outside clouds increases soluble iron in mineral dust, Environ. Sci. Technol., 49, 1472–1477, https://doi.org/10.1021/es504623x, 2015.
Siefert, R. L., Johansen, A. M., Hoffmann, M. R., and Pehkonen, S. O.: Measurements of trace metal (Fe, Cu, Mn, Cr) oxidation states in fog and stratus clouds, J. Air Waste Manage., 48, 128–143, https://doi.org/10.1080/10473289.1998.10463659, 1998.
Spokes, L. J., Jickells, T. D., and Lim, B.: Solubilization of aerosol trace-metals by cloud processing – a laboratory study, Geochim. Cosmochim. Acta., 58, 3281–3287, https://doi.org/10.1016/0016-7037(94)90056-6, 1994.
Strehlau, J. H., Schultz, J. D., Vindedahl, A. M., Arnold, W. A., and Penn, R. L.: Effect of nonreactive kaolinite on 4-chloronitrobenzene reduction by Fe(II) in goethite-kaolinite heterogeneous suspensions, Environ. Sci.-Nano, 4, 325–334, https://doi.org/10.1039/C6EN00469E, 2017.
Sun, Y. L., Jiang, Q., Wang, Z. F., Fu, P. Q., Li, J., Yang, T., and Yin, Y.: Investigation of the sources and evolution processes of severe haze pollution in Beijing in January 2013, J. Geophys. Res.-Atmos., 119, 4380–4398, https://doi.org/10.1002/2014JD021641, 2014.
Ullerstam, M., Johnson, M. S., Vogt, R., and Ljungström, E.: DRIFTS and Knudsen cell study of the heterogeneous reactivity of SO2 and NO2 on mineral dust, Atmos. Chem. Phys., 3, 2043–2051, https://doi.org/10.5194/acp-3-2043-2003, 2003.
Usher, C. R., Al-Hosney, H., Carlos-Cuellar, S., and Grassian, V. H.: A laboratory study of the heterogeneous uptake and oxidation of sulfur dioxide on mineral dust particles, J. Geophys. Res.-Atmos., 107, 161–169, https://doi.org/10.1029/2002JD002051, 2002.
Usher, C. R., Michel, A. E., and Grassian, V. H.: Reactions on mineral dust, Chem. Rev., 103, 4883–4940, https://doi.org/10.1021/cr020657y, 2003.
Viollier, E., Inglett, P. W., Hunter, K., Roychoudhury, A. N., and Van Cappellen, P.: The ferrozine method revisited: Fe(II)/Fe(III) determination in natural waters, Appl. Geochem., 15, 785–790, https://doi.org/10.1016/S0883-2927(99)00097-9, 2000.
Wang, G., Wang, H., Yu, Y., Gao, S., Feng, J., Gao, S., and Wang, L.: Chemical characterization of water-soluble components of PM10 and PM2.5 atmospheric aerosols in five locations of Nanjing, China, Atmos. Environ., 37, 2893–2902, https://doi.org/10.1016/S1352-2310(03)00271-1, 2003.
Wang, Y., Zhang, Q., Jiang, J., Zhou, W., Wang, B., He, K., Duan, F., Zhang, Q., Philip, S., and Xie, Y.: Enhanced sulfate formation during China's severe winter haze episode in January 2013 missing from current models, J. Geophys. Res.-Atmos., 119, 10425–10440, https://doi.org/10.1002/2013JD021426, 2014.
Wu, L. Y., Tong, S. R., Wang, W. G., and Ge, M. F.: Effects of temperature on the heterogeneous oxidation of sulfur dioxide by ozone on calcium carbonate, Atmos. Chem. Phys., 11, 6593–6605, https://doi.org/10.5194/acp-11-6593-2011, 2011.
Wurzler, S., Reisin, T. G., and Levin, Z.: Modification of mineral dust particles by cloud processing and subsequent effects on drop size distributions, J. Geophys. Res.-Atmos., 105, 4501–4512, https://doi.org/10.1029/1999JD900980, 2000.
Yang, W., He, H., Ma, Q., Ma, J., Liu, Y., Liu, P., and Mu, Y.: Synergistic formation of sulfate and ammonium resulting from reaction between SO2 and NH3 on typical mineral dust, Phys. Chem. Chem. Phys., 18, 956–964, https://doi.org/10.1039/C5CP06144J, 2016.
Yang, W., Zhang, J., Ma, Q., Zhao, Y., Liu, Y., and He, H.: Heterogeneous reaction of SO2 on manganese oxides: the effect of crystal structure and relative humidity, Sci. Rep., 7, 4550, https://doi.org/10.1038/s41598-017-04551-6, 2017.
Zhang, X., Zhuang, G., Chen, J., Wang, Y., Wang, X., An, Z., and Zhang, P.: Heterogeneous reactions of sulfur dioxide on typical mineral particles, J. Phys. Chem. B, 110, 12588–12596, https://doi.org/10.1021/jp0617773, 2006.
Zhao, X., Kong, L., Sun, Z., Ding, X., Cheng, T., Yang, X., and Chen, J.: Interactions between heterogeneous uptake and adsorption of sulfur dioxide and acetaldehyde on hematite, J. Phys. Chem. A, 119, 4001–4008, https://doi.org/10.1021/acs.jpca.5b01359, 2015.
Zhao, Y., Liu, Y., Ma, J., Ma, Q., and He, H.: Heterogeneous reaction of SO2 with soot: The roles of relative humidity and surface composition of soot in surface sulfate formation, Atmos. Environ., 152, 465–476, https://doi.org/10.1016/j.atmosenv.2017.01.005, 2017.
Zhu, X., Prospero, J. M., Savoie, D. L., Millero, F. J., Zika, R. G., and Saltzman, E. S.: Photoreduction of iron(III) in marine mineral aerosol solutions, J. Geophys. Res.-Atmos., 98, 9039–9046, https://doi.org/10.1029/93JD00202, 1993.
Zhuang, G. S., Yi, Z., Duce, R. A., and Brown, P. R.: Link between iron and sulfur cycles suggested by detection of Fe(II) in remote marine aerosols, Nature, 355, 537–539, https://doi.org/10.1038/355537a0, 1992.
Zuo, Y. G. and Hoigne, J.: Formation of hydrogen-peroxide and depletion of oxalic-acid in atmospheric water by photolysis of iron(III) oxalato complexes, Environ. Sci. Technol., 26, 1014–1022, https://doi.org/10.1021/es00029a022, 1992.