the Creative Commons Attribution 4.0 License.
the Creative Commons Attribution 4.0 License.
 | 15 Aug 2019
Variability in vertical structure of precipitation with sea surface temperature over the Arabian Sea and the Bay of Bengal as inferred by Tropical Rainfall Measuring Mission precipitation radar measurements
Basivi Radhakrishna
Thota Narayana Rao
Sreedharan Krishnakumari Satheesh
Tropical Rainfall Measuring Mission (TRMM) precipitation radar measurements are used to examine the variation in vertical structure of precipitation with sea surface temperature (SST) over the Arabian Sea (AS) and Bay of Bengal (BOB). The variation in reflectivity and precipitation echo top with SST is remarkable over the AS but small over the BOB. The reflectivity increases with SST (from 26 to 31 ∘C) by ∼1 and 4 dBZ above and below 6 km, respectively, over the AS, while its variation is <0.5 dBZ over the BOB. The transition from shallow storms at lower SSTs (≤27 ∘C) to deeper storms at higher SSTs is strongly associated with the decrease in stability and mid-tropospheric wind shear over the AS. In contrary, the storms are deeper at all SSTs over the BOB due to weaker stability and mid-tropospheric wind shear. At lower SSTs, the observed high aerosol optical depth (AOD) and low total column water (TCW) over AS results in the small cloud effective radius (CER) and weaker reflectivity. As SST increases, AOD decreases and TCW increases, leading to a large CER and high reflectivity. The changes in these parameters with SST are marginal over the BOB and hence the CER and reflectivity. The predominance of collision–coalescence process below the bright band is responsible for the observed negative slopes in the reflectivity over both the seas. The observed variations in reflectivity originate at the cloud formation stage over both the seas, and these variations are magnified during the descent of hydrometeors to the ground.
Please read the corrigendum first before continuing.
-
Notice on corrigendum
The requested paper has a corresponding corrigendum published. Please read the corrigendum first before downloading the article.
-
Article
(6682 KB)
- Corrigendum
-
Supplement
(507 KB)
-
The requested paper has a corresponding corrigendum published. Please read the corrigendum first before downloading the article.
- Article
(6682 KB) - Full-text XML
- Corrigendum
-
Supplement
(507 KB) - BibTeX
- EndNote


The Indian summer monsoon (ISM; June through September) is one of the most complex weather phenomena, involving coupling between the atmosphere, land, and ocean. At the boundary of the ocean and atmosphere, air–sea interactions play a key role in the coupled Earth system (Wu and Kirtman, 2005; Feng et al., 2018). The relations between sea surface temperature (SST) and precipitation are the important measures for the air–sea interactions on different temporal scales (Woolnough et al., 2000; Rajendran et al., 2012). Recent studies (Wang et al., 2005; Rajeevan et al., 2012; Chaudhari et al., 2013, 2016; Weller et al., 2016; Feng et al., 2018) have shown that the simulation of the ISM can be improved with the exact representation of the SST–precipitation relationship. SST modulates the meteorological factors that influence the formation and evolution of different kinds of precipitating systems over tropical oceans (Gadgil et al., 1984; Schumacher and Houze, 2003; Takayabu et al., 2010; Oueslati and Bellon, 2015). The studies dealing with SST and cloud and/or precipitation population considered whole Indian Ocean to be a single entity (Gadgil et al., 1984; Woolnough et al., 2000; Rajendran et al., 2012; Sabin et al., 2012; Meenu et al., 2012; Nair and Rajeev, 2014; Roxy, 2014). But in reality the Bay of Bengal (BOB) and the Arabian Sea (AS) of the Indian Ocean possess distinctly different features (Kumar et al., 2014; Shige et al., 2017; Rajendran et al., 2018; Saikranthi et al., 2019). The monsoon experiment (MONEX) and Bay of Bengal monsoon experiment (BOBMEX) have shown how these two seas are different with respect to each other, in terms of SST, background atmosphere and the occurrence of precipitating systems (Krishnamurti, 1985; Houze and Churchill, 1987; Gadgil, 2000; Bhat et al., 2001). The SST in the AS cools between 10 and 20∘ N during the monsoon season, whereas warming is seen in other global oceans between the same latitudes (Krishnamurti, 1981). SST variability is large over the AS than the BOB at seasonal and intraseasonal scales (Sengupta et al., 2001; Roxy et al., 2013). The monsoonal winds (in particular the low-level jet) are stronger over the AS than BOB (Findlater, 1969). Also, lower-tropospheric thermal inversions are more frequent and stronger over the AS than BOB (Narayanan and Rao, 1981; Sathiyamoorthy et al., 2013). Thus, the atmospheric and sea surface conditions, and in turn the occurrence of different kinds of precipitating systems, are quite different over the BOB and the AS during the ISM period. For instance, long-term measurements of the Tropical Rainfall Measuring Mission (TRMM) precipitation radar (PR) have shown that shallow systems are more prevalent over the AS, while deeper systems occur frequently over the BOB (Liu et al., 2007; Romatschke et al., 2010; Saikranthi et al., 2014, 2018; Houze et al., 2015).
The aforementioned studies mainly focused on the morphology of vertical structure of precipitation, but none of them studied the variation in vertical structure of precipitation (in terms of occurrence and intensity) with SST and the differences in the vertical structure over AS and BOB. On the other hand, information on the vertical structure of precipitation is essential for improving the accuracy of rainfall estimation (Fu and Liu, 2001; Sunilkumar et al., 2015), understanding the dynamical and microphysical processes of hydrometeor growth–decay mechanisms (Houze, 2004; Geets and Dejene, 2005; Saikranthi et al., 2014; Rao et al., 2016), and improving the latent heating retrievals (Tao et al., 2006, 2016). SST being the main driving force to trigger precipitating systems through air–sea interactions (Sabin et al., 2012; Nuijens et al., 2017) can alter the vertical structure of precipitation (Oueslati and Bellon, 2015). Therefore, the present study aims to understand the variation in vertical structure of precipitation (in terms of precipitation top height and intensity) with SST over the AS and BOB. Besides the SST, vertical structure can be modified by aerosols (or CCN, mostly at the cloud formation stage) and thermodynamics of the ambient atmosphere. For instance, recent studies have shown the impact of surface PM10 aerosols in altering the vertical structure of precipitation (Guo et al., 2018). All these parameters, therefore, are considered in the present study to explain the differences in the vertical structure.
The present study utilizes 16 years (1998–2013) of TRMM PR's 2A25 (version 7) dataset, being comprised of vertical profiles of attenuation corrected reflectivity (Iguchi et al., 2009), during the ISM. The range resolution of TRMM PR reflectivity profiles is 250 m with a horizontal footprint size of ∼4.3 and 5 km before and after the boosting of its orbit from 350 to 403 km, respectively. It scans ±17∘ from the nadir with a beam width of 0.71 ∘, covering a swath of 215 km (245 km after the boost). The uniqueness of TRMM PR data is their ability to pigeonhole the precipitating systems into convective, stratiform and shallow rain. This classification is based on two methods, namely the horizontal method (H-method) and the vertical method (V-method; Awaka et al., 2009). The original TRMM PR 2A25 vertical profiles of attenuation corrected reflectivity are gridded to a three-dimensional Cartesian coordinate system with a spatial resolution of 0.05∘ × 0.05∘. The detailed methodology of interpolating the TRMM PR reflectivity data into the 3-D Cartesian grid is discussed in Houze et al. (2007). This dataset is available at the University of Washington website (http://trmm.atmos.washington.edu/, last access: 4 May 2017). Profiles are classified as deep if their storm top reflectivity ≥17 dBZ lies above the 0 ∘C isotherm and shallow if it lies 1 km below the 0 ∘C isotherm.
To understand the observed variations in the vertical structure of precipitation in the light of microphysics of clouds, Moderate Resolution Imaging Spectroradiometer (MODIS) AQUA satellite level 3 data (MYD08) are considered. In particular, the daily atmospheric products of aerosol optical depth (AOD; Hubanks et al., 2008) and cloud effective radius (CER) liquid (Platnick et al., 2017) during the period 2003 and 2013 have been used. The MODIS AOD dataset is a collection of aerosol optical properties at the 550 nm wavelength as well as particle size information. Level 2 MODIS AOD is derived from radiances using one of the three different algorithms, i.e., the algorithm from Remer et al. (2005) for over the ocean, the Dark Target algorithm for over land (Levy et al., 2007) and the Deep Blue algorithm for brighter land surfaces (Hsu et al., 2004). The CER is nothing but the weighted mean of the size distribution of cloud drops, i.e., the ratio of the third moment to the second moment of the drop size distribution. In the level 3 MODIS daily dataset, aerosol and cloud products of level 2 data pixels with valid retrievals within a calendar day are first aggregated and gridded to a daily average with a spatial resolution of 1∘ × 1∘. For CER grid box values, CER values are weighted by the respective ice and/or liquid water cloud pixel counts for the spatiotemporal aggregation and averaging processes.
The background atmospheric structure (winds and total column water) and SST information are taken from the European Centre for Medium-Range Weather Forecasting (ECMWF) Interim Reanalysis (ERA-Interim; Dee et al., 2011). ERA-Interim runs 4D-VAR assimilation twice daily (00:00 and 12:00 UTC) to determine the most likely state of the atmosphere at a given time (analysis). The consistency across variables in space and time (during 12 h intervals) is thus ensured by the atmospheric model and its error characteristics as specified in the assimilation. ERA-Interim is produced at the T255 spectral resolution (about 0.75∘; ∼83 km), with a temporal resolution of 6 h for upper air fields and 3 h for surface fields. The original 0.75∘ × 0.75∘ spatial resolution gridded dataset is rescaled to a resolution of 0.125∘ × 0.125∘. The temporal resolution of the dataset used in the present study is 6 h (00:00, 06:00, 12:00 and 18:00 UTC). The equivalent potential temperature (θe) is estimated from the ERA-Interim datasets using the following formula (Wallace and Hobbs, 2006):
where θ is the potential temperature, Lv is the latent heat of vaporization, ws is the saturation mixing ratio, Cp is the specific heat at constant pressure and T is the absolute temperature.
The variation in the vertical structure of precipitation with SST is studied by considering the dataset between 8–20∘ N and 63–72∘ E over the AS and 8–21∘ N and 83–92∘ E over the BOB. These regions of interest, along with the ISM seasonal mean SST over the two seas, are depicted in Fig. 1. These regions are selected in such a way that the costal influence on SST is eluded from the analysis. As the rainfall is scanty over the western AS (west of 63∘ E latitude) during the ISM (Saikranthi et al., 2018), this region is also not considered in the present analysis. The seasonal mean SST is higher over the BOB than in the AS by more than 1 ∘C during the ISM season, in agreement with Shenoi et al. (2002). The nearest space- and time-matched SST data from ERA-Interim are assigned to the TRMM PR and MODIS observations for further analysis.
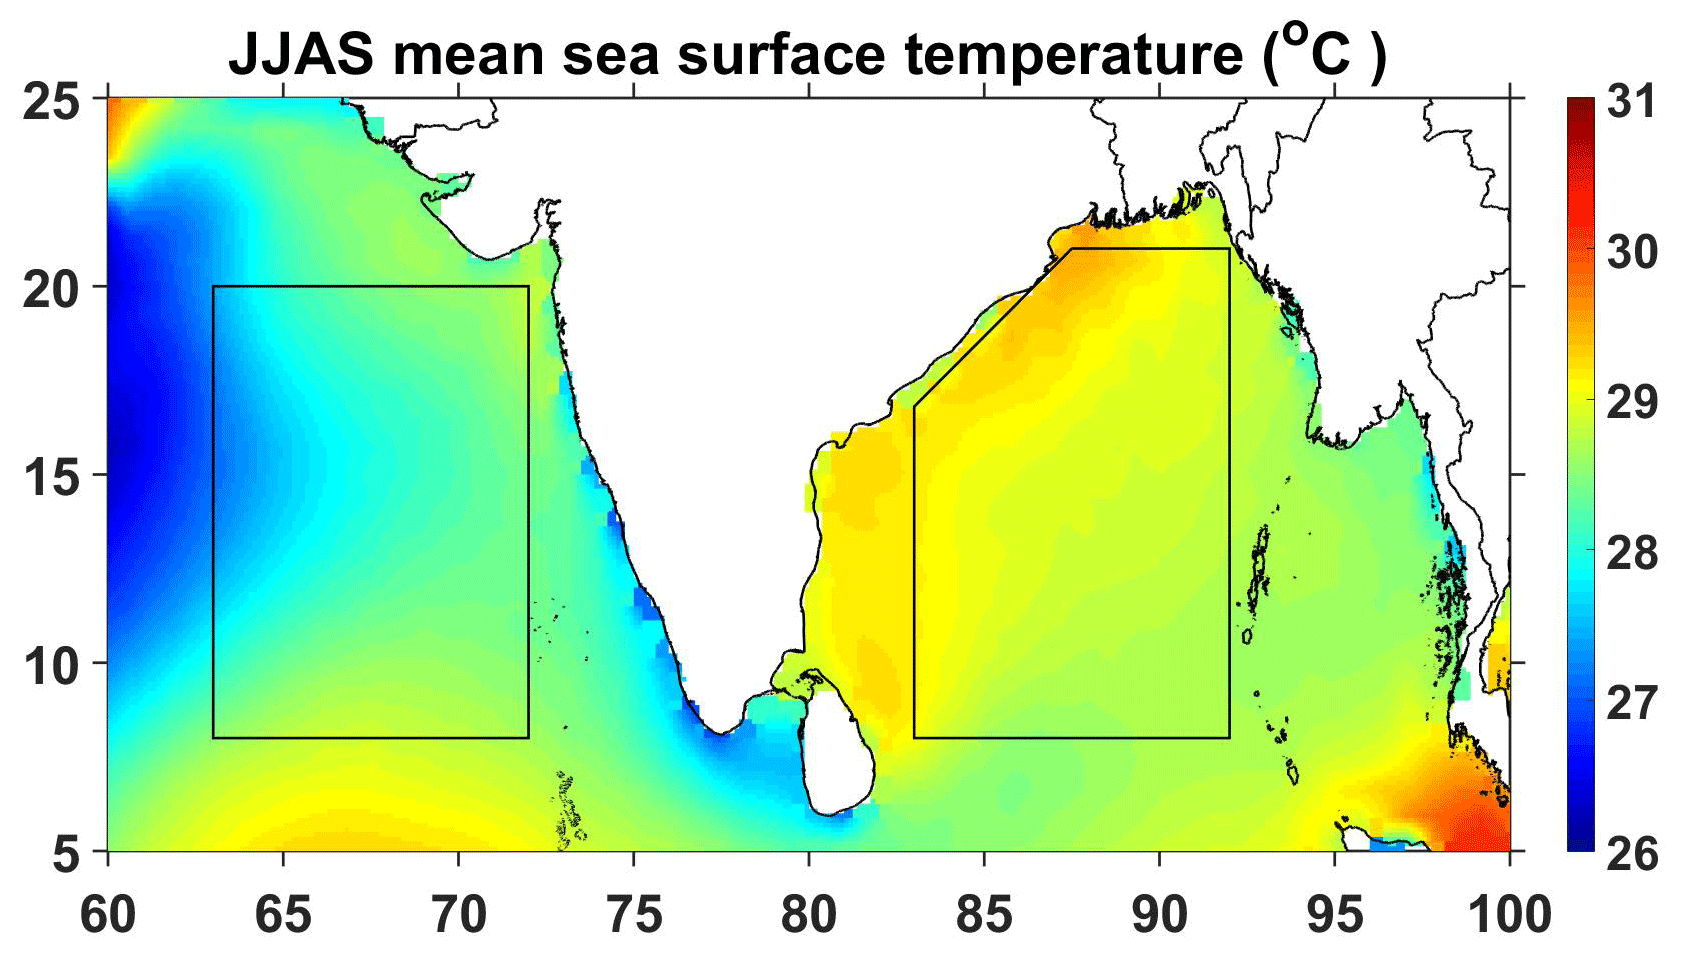
Figure 1Spatial distribution of ISM mean SST (in ∘C) obtained from ERA-Interim reanalysis data over the AS (8–20∘ N, 63–72∘ E) and the BOB (8–21∘ N, 83–92∘ E). The regions considered in this analysis over these two seas are shown with the boxes.
The occurrence (in terms of %) of conditional precipitation echoes (Z≥17 dBZ) at different altitudes as a function of SST over the AS and the BOB is shown in Fig. 2. The variation in precipitation echo occurrence frequency with SST is quite different over both the seas. The top of the precipitation echoes extends to higher altitudes with increasing SST over the AS, while such variation is not quite evident over the BOB. Precipitation echoes are confined to <8 km at lower SST (<28 ∘C) over the AS but exhibit a gradual rise in height with an increase in SST. Large population density of precipitation echoes at lower altitudes is mainly due to the abundant occurrence of shallow storms over the AS (Saikranthi et al., 2014, 2019; Rao et al., 2016). Interestingly, the occurrence of precipitation echoes is seen at higher altitudes even at lower SSTs over the BOB, indicating the presence of deeper storms. Such systems exist at all SSTs over the BOB.
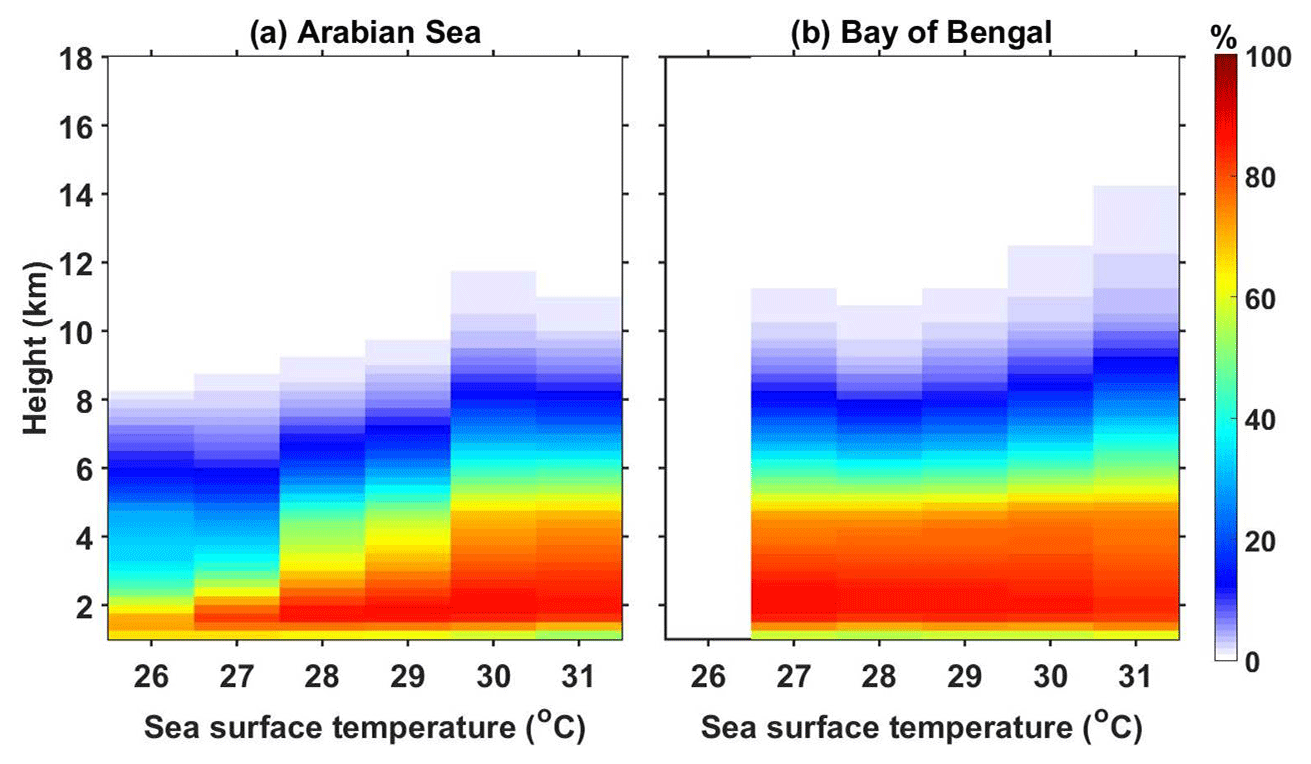
Figure 2(a) and (b) represent the altitudinal distribution of occurrence of conditional reflectivity (≥17 dBZ) as a function of SST with respect to precipitation occurrence at that particular SST interval over the AS and the BOB, respectively.
To examine the variation in reflectivity profiles with SST, median profiles of reflectivity in each SST bin are computed over the AS and the BOB separately for deep and shallow systems and are depicted in Figs. 3 and 4, respectively. The space- and time-matched conditional reflectivity profiles are grouped into 1 ∘C SST bins, and then the median is estimated at each height, only if the number of conditional reflectivity pixels (Fig. 3c, f; Fig. 4c, f) is greater than 500. The median reflectivity profiles corresponding to the deep systems are distinctly different over the AS and the BOB (Fig. 3a, d), even at the same SST. Over the AS, reflectivity of deep systems at different SSTs shows small variations (≤1 dBZ) above the melting region (>5 km) but varies significantly (∼4.5 dBZ) below the melting level (<5 km). These variations in reflectivity profiles with SST are negligible (<0.5 dBZ) over the BOB both above and below the melting region. The reflectivity increases from ∼26.5 to ∼31 dBZ, with an increase in SST from 26 to 30 ∘C over the AS, but it is almost the same (∼30 dBZ) at all SSTs over the BOB below the melting layer. The standard deviation of reflectivity, representing the variability in reflectivity within the SST bin, is similar at all SSTs over both the seas except for the 26 ∘C SST over AS. At this SST, the standard deviation is less than that of other SSTs by ∼1 dBZ.
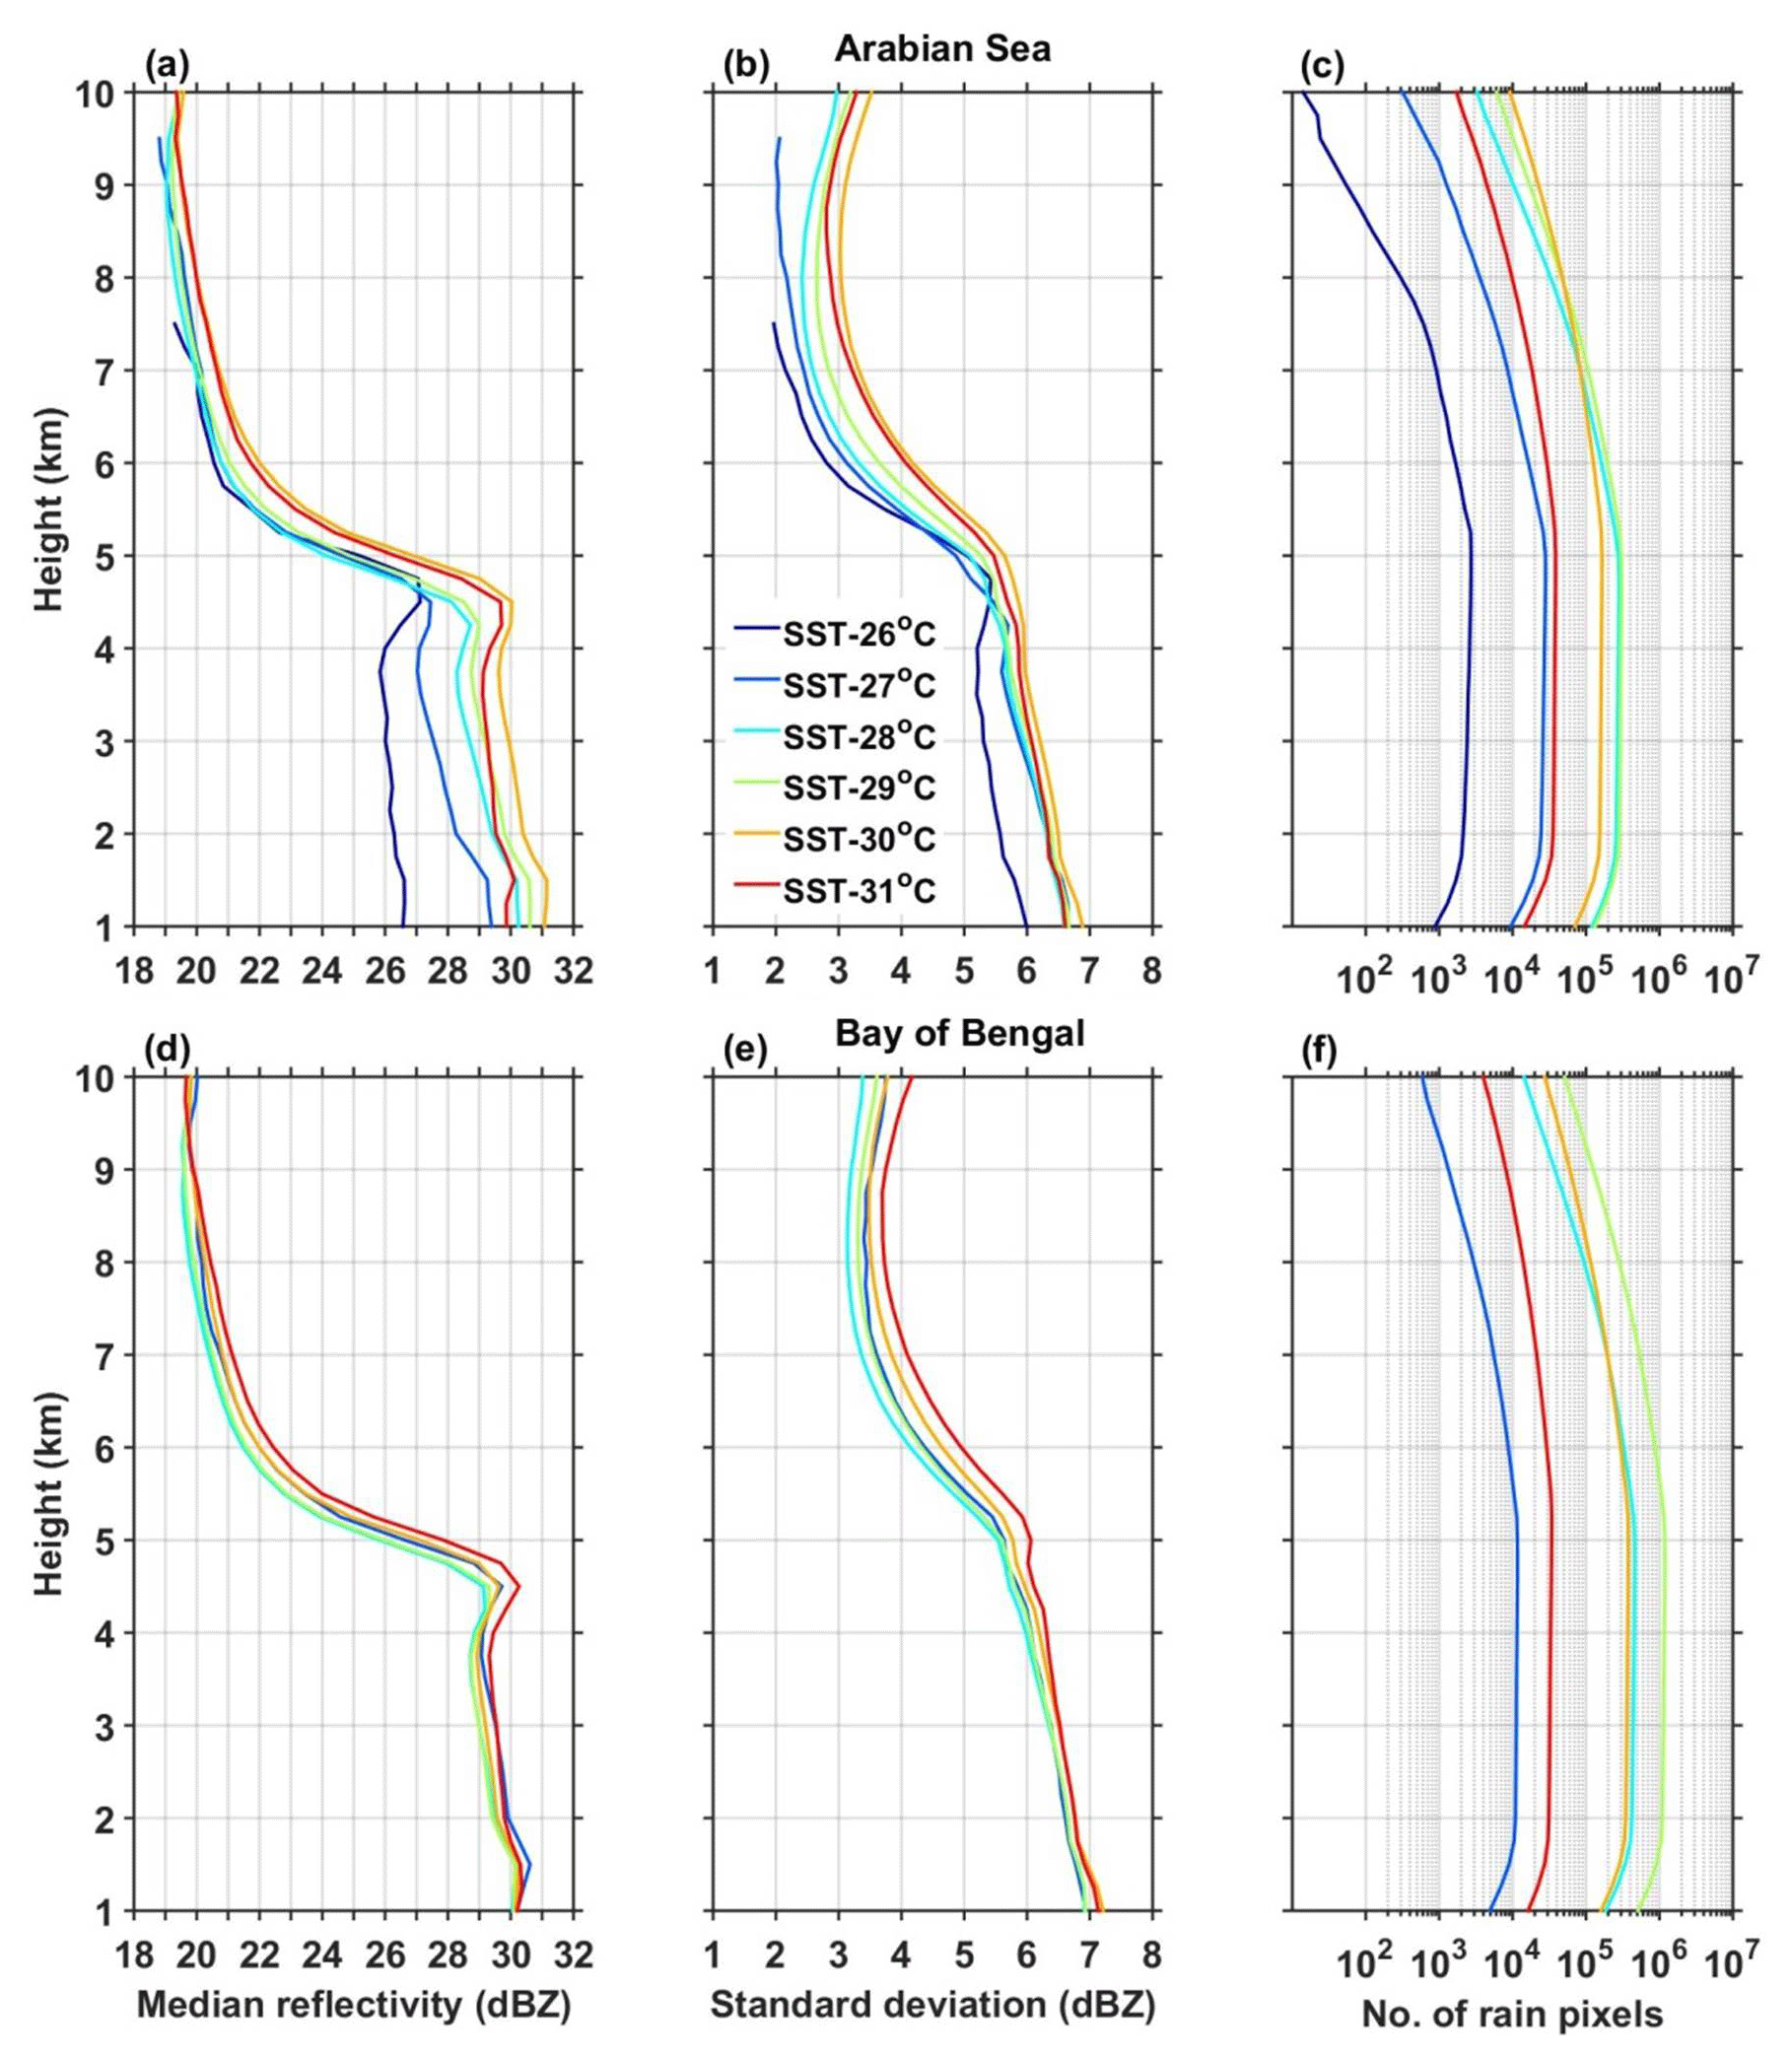
Figure 3(a) and (d) and (b) and (e) represent vertical profiles of median reflectivity corresponding to deep systems and their standard deviation (in dBZ) with SST over the AS and the BOB, respectively, during the ISM season. (c) and (f) show the number of conditional reflectivity pixels at each altitude used for the estimation of the median and standard deviation.
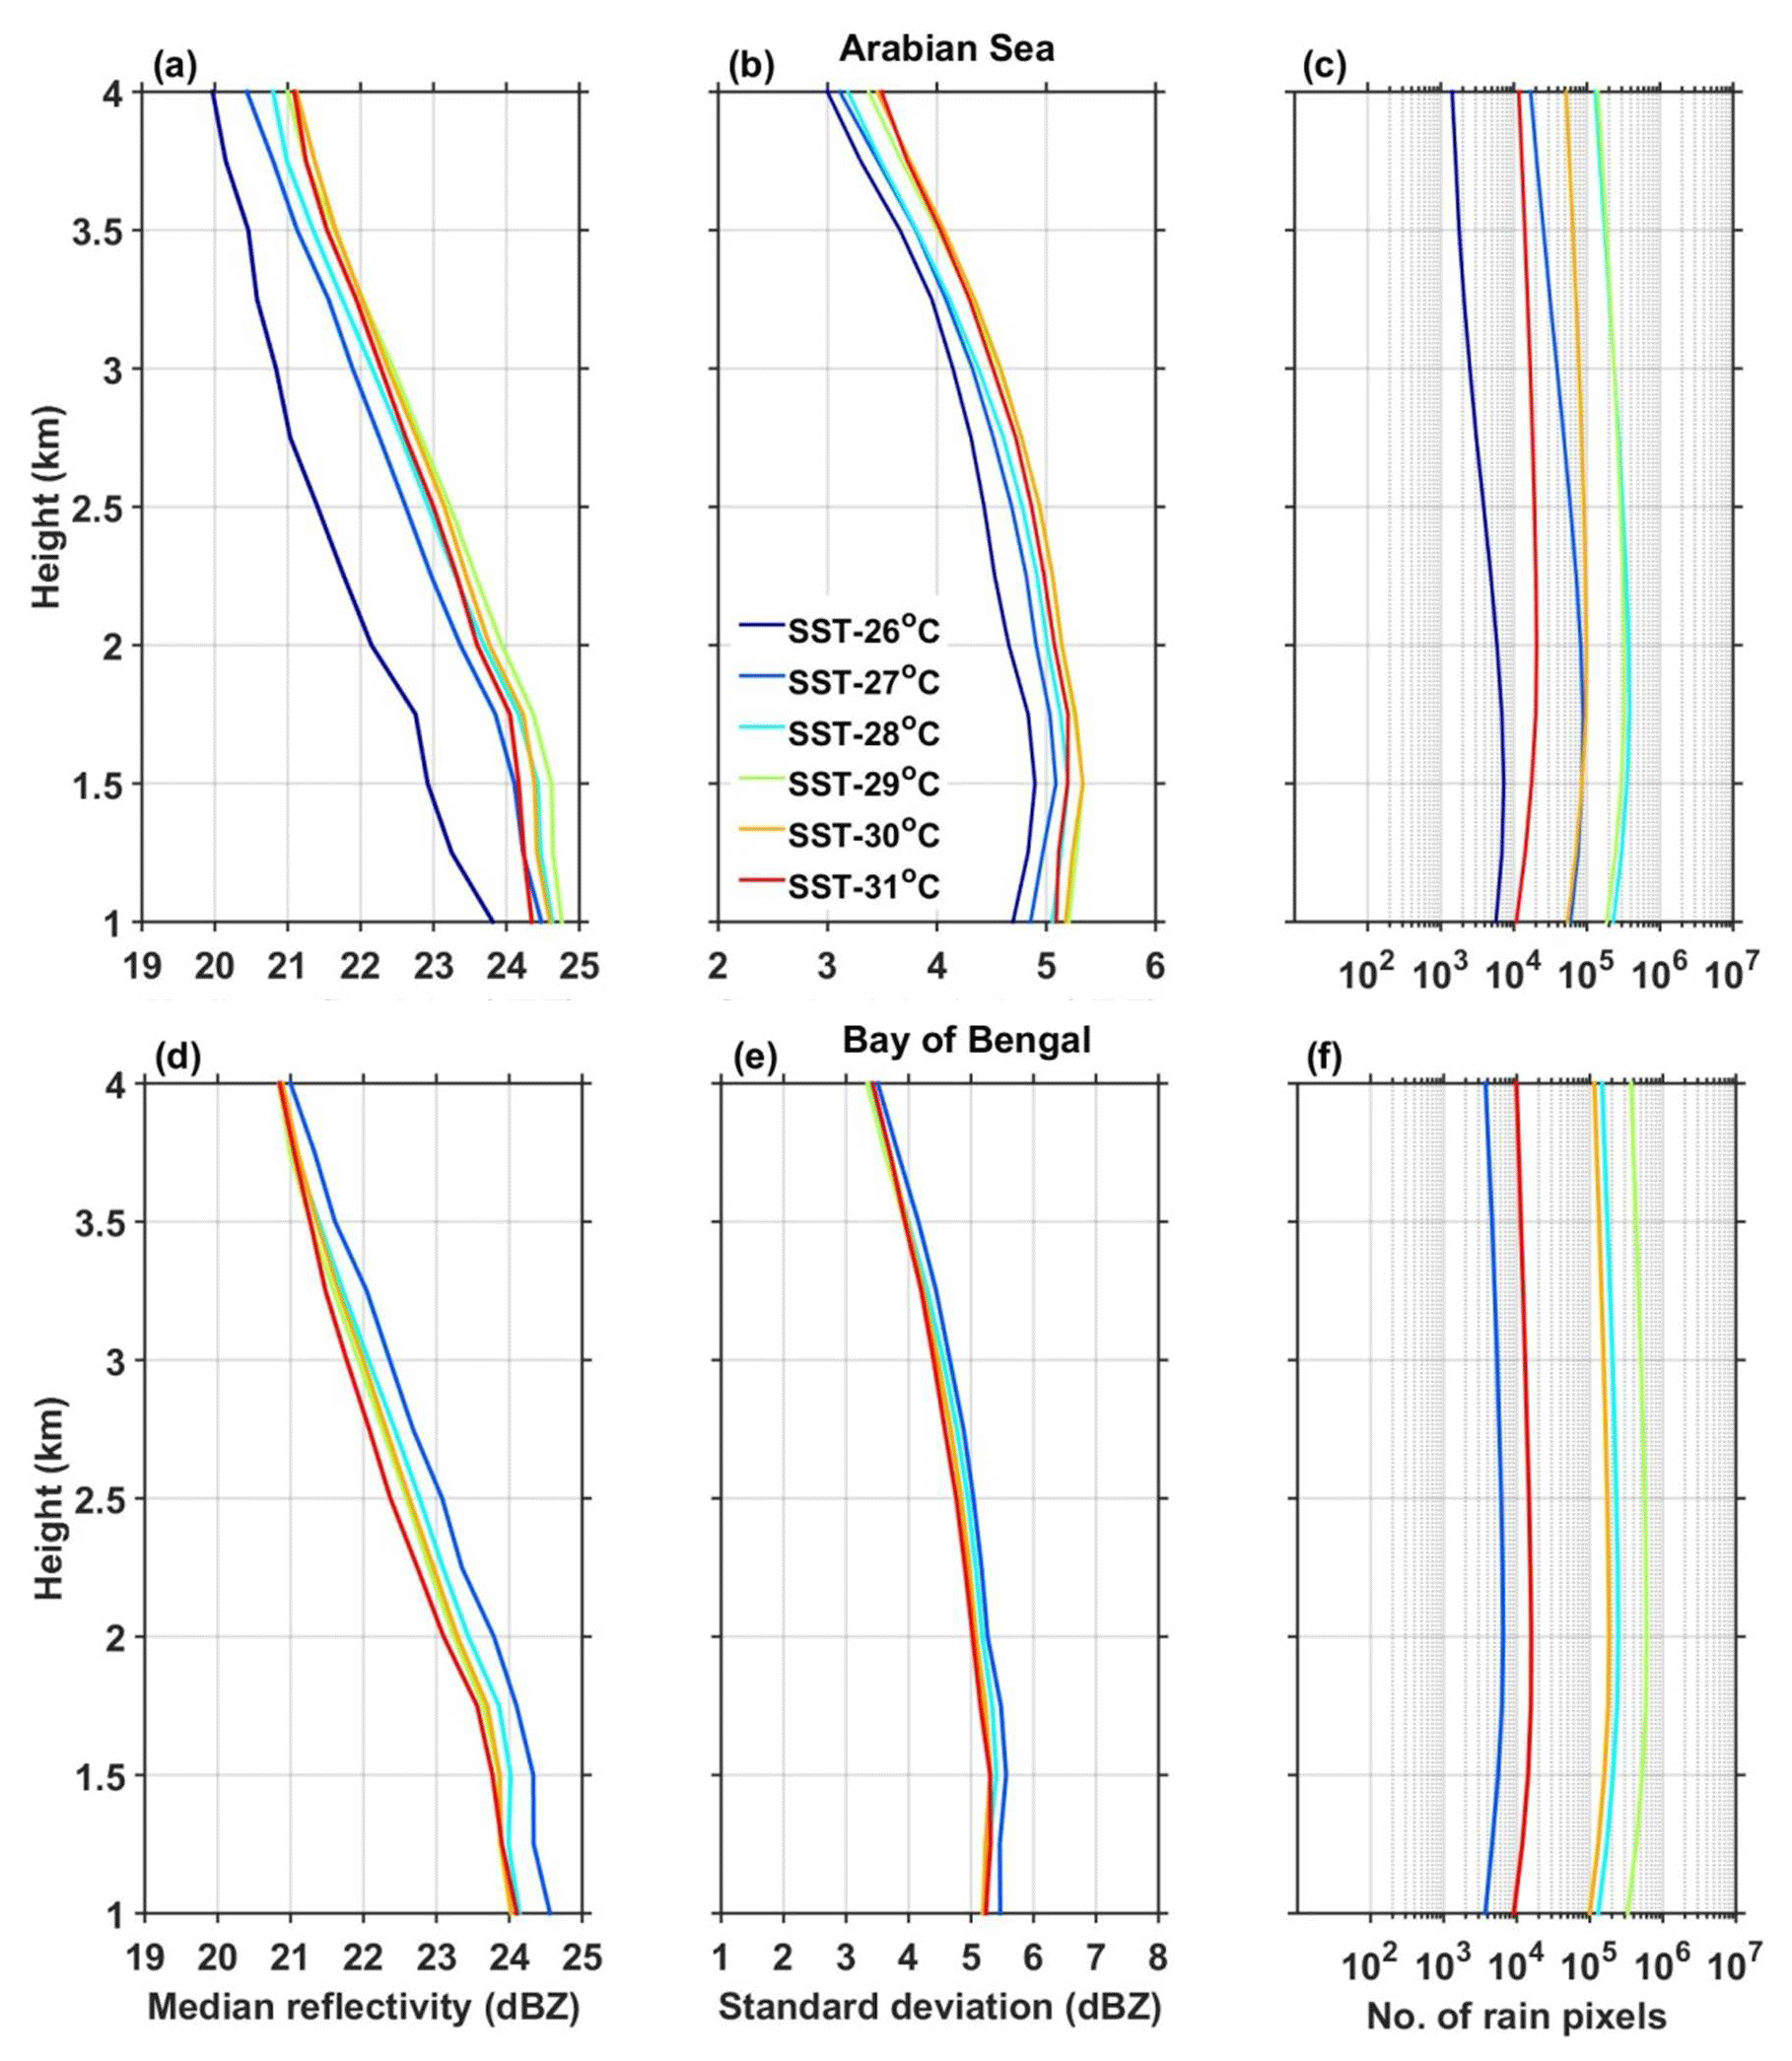
The median reflectivity profiles of shallow storms depicted in Fig. 4a and d also show a gradual increase in reflectivity from 20 dBZ to ∼22 dBZ as SST changes from 26 to 31 ∘C at the precipitation top altitude over the AS and do not show any variation with SST over the BOB. However at 1 km altitude, except at the 26 ∘C SST over the AS, the reflectivity variation with SST is not substantial over both the seas. The standard deviations of reflectivity profiles show ∼1 dBZ variation with SST (from 26 to 31 ∘C) at all altitudes over the AS and do not show any variation over the BOB. The standard deviation of reflectivity for shallow storms varies from 3 to 4 dBZ at the precipitation top altitude and from 4.5 to 5.3 dBZ at 1 km altitude over the AS, while it is ∼4 dBZ at precipitation top and ∼5.5 dBZ at 1 km altitude over the BOB.
The formation and evolution of precipitating systems over oceans depend on dynamical, thermodynamical and microphysical factors, like SST, wind shear, vertical wind velocity, stability, the CER, etc., and need to be considered for understanding the vertical structure of precipitation (Li and Min, 2010; Creamean et al., 2013; Chen et al., 2015; Shige and Kummerow, 2016; Guo et al., 2018).
4.1 Dynamical and thermodynamical factors
Takahashi and Dado (2018) have shown that zonal wind variations can also explain some variability of rain. To examine the impact of zonal wind on rainfall over the Arabian Sea and Bay of Bengal, the data are segregated into three wind regimes as weak (monsoon westerlies lie between 0 and 6 m s−1), moderate (monsoon westerlies lie between 6 to 12 m s−1) and strong (monsoon westerlies >12 m s−1) winds. The median vertical profiles of reflectivity are computed for each SST bin, corresponding to deep and shallow systems (not shown here). Two important observations are noted from these figures. (1) Vertical profiles of reflectivity show considerable variation (2–5 dBZ) in all wind categories over the Arabian Sea, but such variations are absent over the Bay of Bengal. It implies that the reported differences in reflectivity profiles over the Arabian Sea and Bay of Bengal exist in all wind regimes. (2) The variation in reflectivity with SST increases with a weak to strong wind regime over the Arabian Sea, indicating some influence of wind on reflectivity (rainfall) variation.
To understand the role of stability and instability, θe values computed (1) using the ERA-Interim datasets during the ISM period over the AS and the BOB are averaged for a season and are depicted in Fig. 5a and b, respectively. The surface θe (at 1000 hPa) values are larger over the BOB than those over the AS for the same SST, indicating that the instability and convective available potential energy (CAPE) could be higher over the BOB. Indeed, higher CAPE is seen over the BOB (Fig. S1 in the Supplement; calculated following Emanuel, 1994) than the AS at all SSTs by a magnitude >300 J kg−1. The θe increases with SST from 358 to 368 K from 27 to 31 ∘C and from 350 to 363 K from 26 to 31 ∘C over the BOB and the AS, respectively. The CAPE also increases with a rise in SST over both the seas. To know the stability of the atmosphere, θe gradients are considered. Irrespective of SST, positive gradients in θe are observed between 900 and 800 hPa levels over the AS, indicating the presence of strong stable layers. The strength of these stable layers decreases with increasing SST. These stable layers are formed mainly due to the flow of continental dry warm air from the Arabian Desert and Africa above the maritime air, causing temperature inversions below 750 hPa level over the AS during the ISM period (Narayanan and Rao, 1981). However, over the BOB, such temperature inversions are not seen in the lower troposphere.
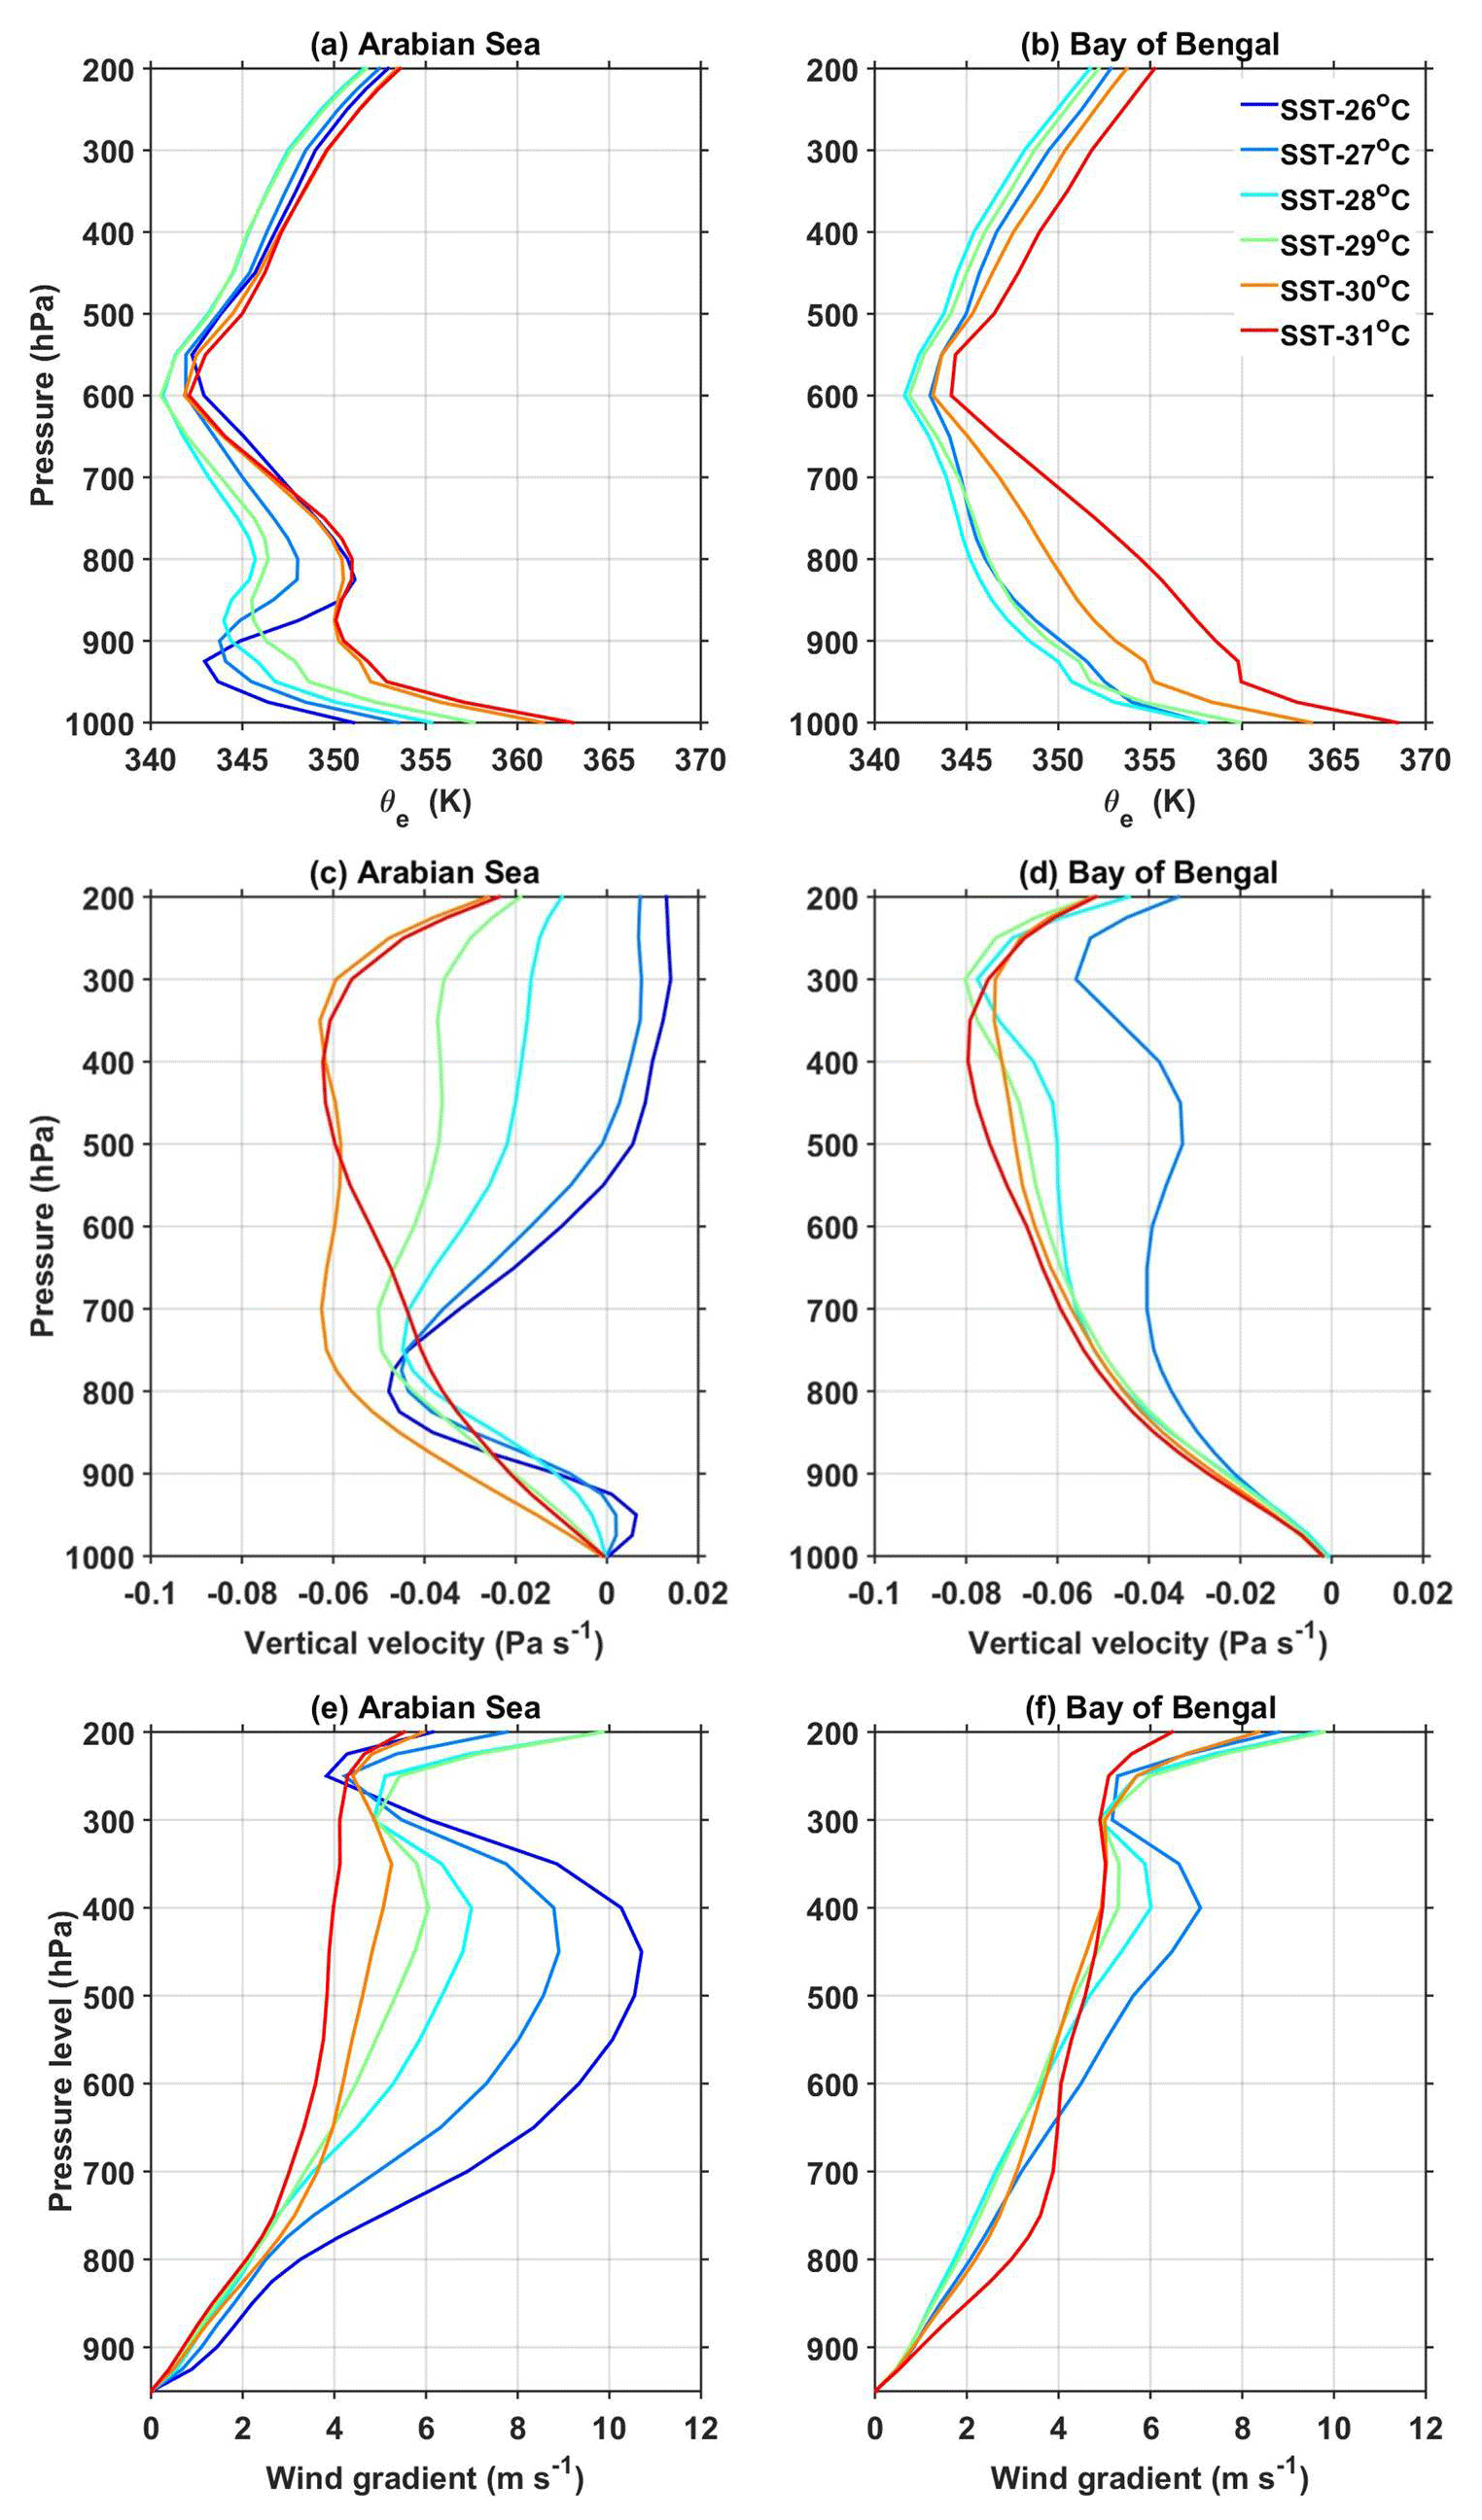
Figure 5(a) and (b), respectively, represent the vertical profiles of mean θe (in K) with SST over the AS and the BOB during the ISM season. (c) and (d) and (e) and (f) are same as (a) and (b) but for mean vertical velocity (in Pa s−1) and wind gradient with reference to 950 hPa level (in m s−1).
To understand the effect of the wind field on the vertical structure of precipitation, profiles of ISM seasonal mean vertical wind velocity and vertical shear in horizontal wind at various SSTs over the AS and the BOB are shown in Fig. 5c, d, e and f. The updrafts are prevalent at all SSTs throughout the troposphere over the BOB, whereas downdrafts are seen in the mid-troposphere (between 200 and 600 hPa levels) up to 27 ∘C, and updrafts are seen in the entire troposphere at higher SSTs over the AS. Also, the magnitude of the vertical wind velocity varies significantly with SST in the mid-troposphere over the AS. Over the BOB, the magnitude of updrafts increases with altitude in the lower and mid-troposphere but does not vary much with SST. In the mid-troposphere, updrafts are stronger by >0.02 Pa s−1 over the BOB than over the AS. The profiles shown in Fig. 5e and f are the mean vertical shear in horizontal wind estimated following Chen et al. (2015) at different levels with reference to the 950 hPa level. The wind shear increases with increasing altitude at all the SSTs up to 400 hPa, but the rate of increase is distinctly different between the AS and the BOB at SSTs less than 28 ∘C and nearly the same at higher SSTs. The wind shear decreases systematically with SST (∼1.5 m s−1 for a 1∘ increase in SST) in the mid-troposphere over the AS, while the change is minimal over the BOB (∼2 m s−1 for 27 and 31 ∘C).
Chen et al. (2015) highlighted the importance of the mid-tropospheric wind shear in generating mesoscale local circulations, like low-level cyclonic and upper-level anticyclonic circulations. This feature is apparent over the AS, where downdrafts are prevalent in mid-troposphere to upper troposphere and updrafts in the lower troposphere at lower SSTs. As SST increases, the wind shear decreases and the updraft increases in the mid-troposphere to upper troposphere. However, over the BOB the wind shear is relatively week when compared to the AS, and hence the updrafts are seen up to 200 hPa level at all SSTs. The weaker CAPE and stable mid-troposphere coupled with upper- to mid-tropospheric downdrafts at lower SSTs over the AS inhibit the growth of precipitating systems to higher altitudes and in turn precipitate in the form of shallow rain. This result is in accordance with the findings of Shige and Kummerow (2016) that showed that the static stability at lower levels inhibits the growth of clouds and promotes the detrainment of clouds over the Asian monsoon region and is considered to be an important parameter in determining the precipitation top height. As SST increases, large CAPE and updrafts in the mid-troposphere collectively support the precipitating systems to grow to higher altitudes, as evidenced in Fig. 2a. On the other hand, large CAPE and updrafts in the mid-troposphere prevalent over the BOB at all SSTs are conducive to the precipitating systems growing to higher altitudes, as seen in Fig. 2b.
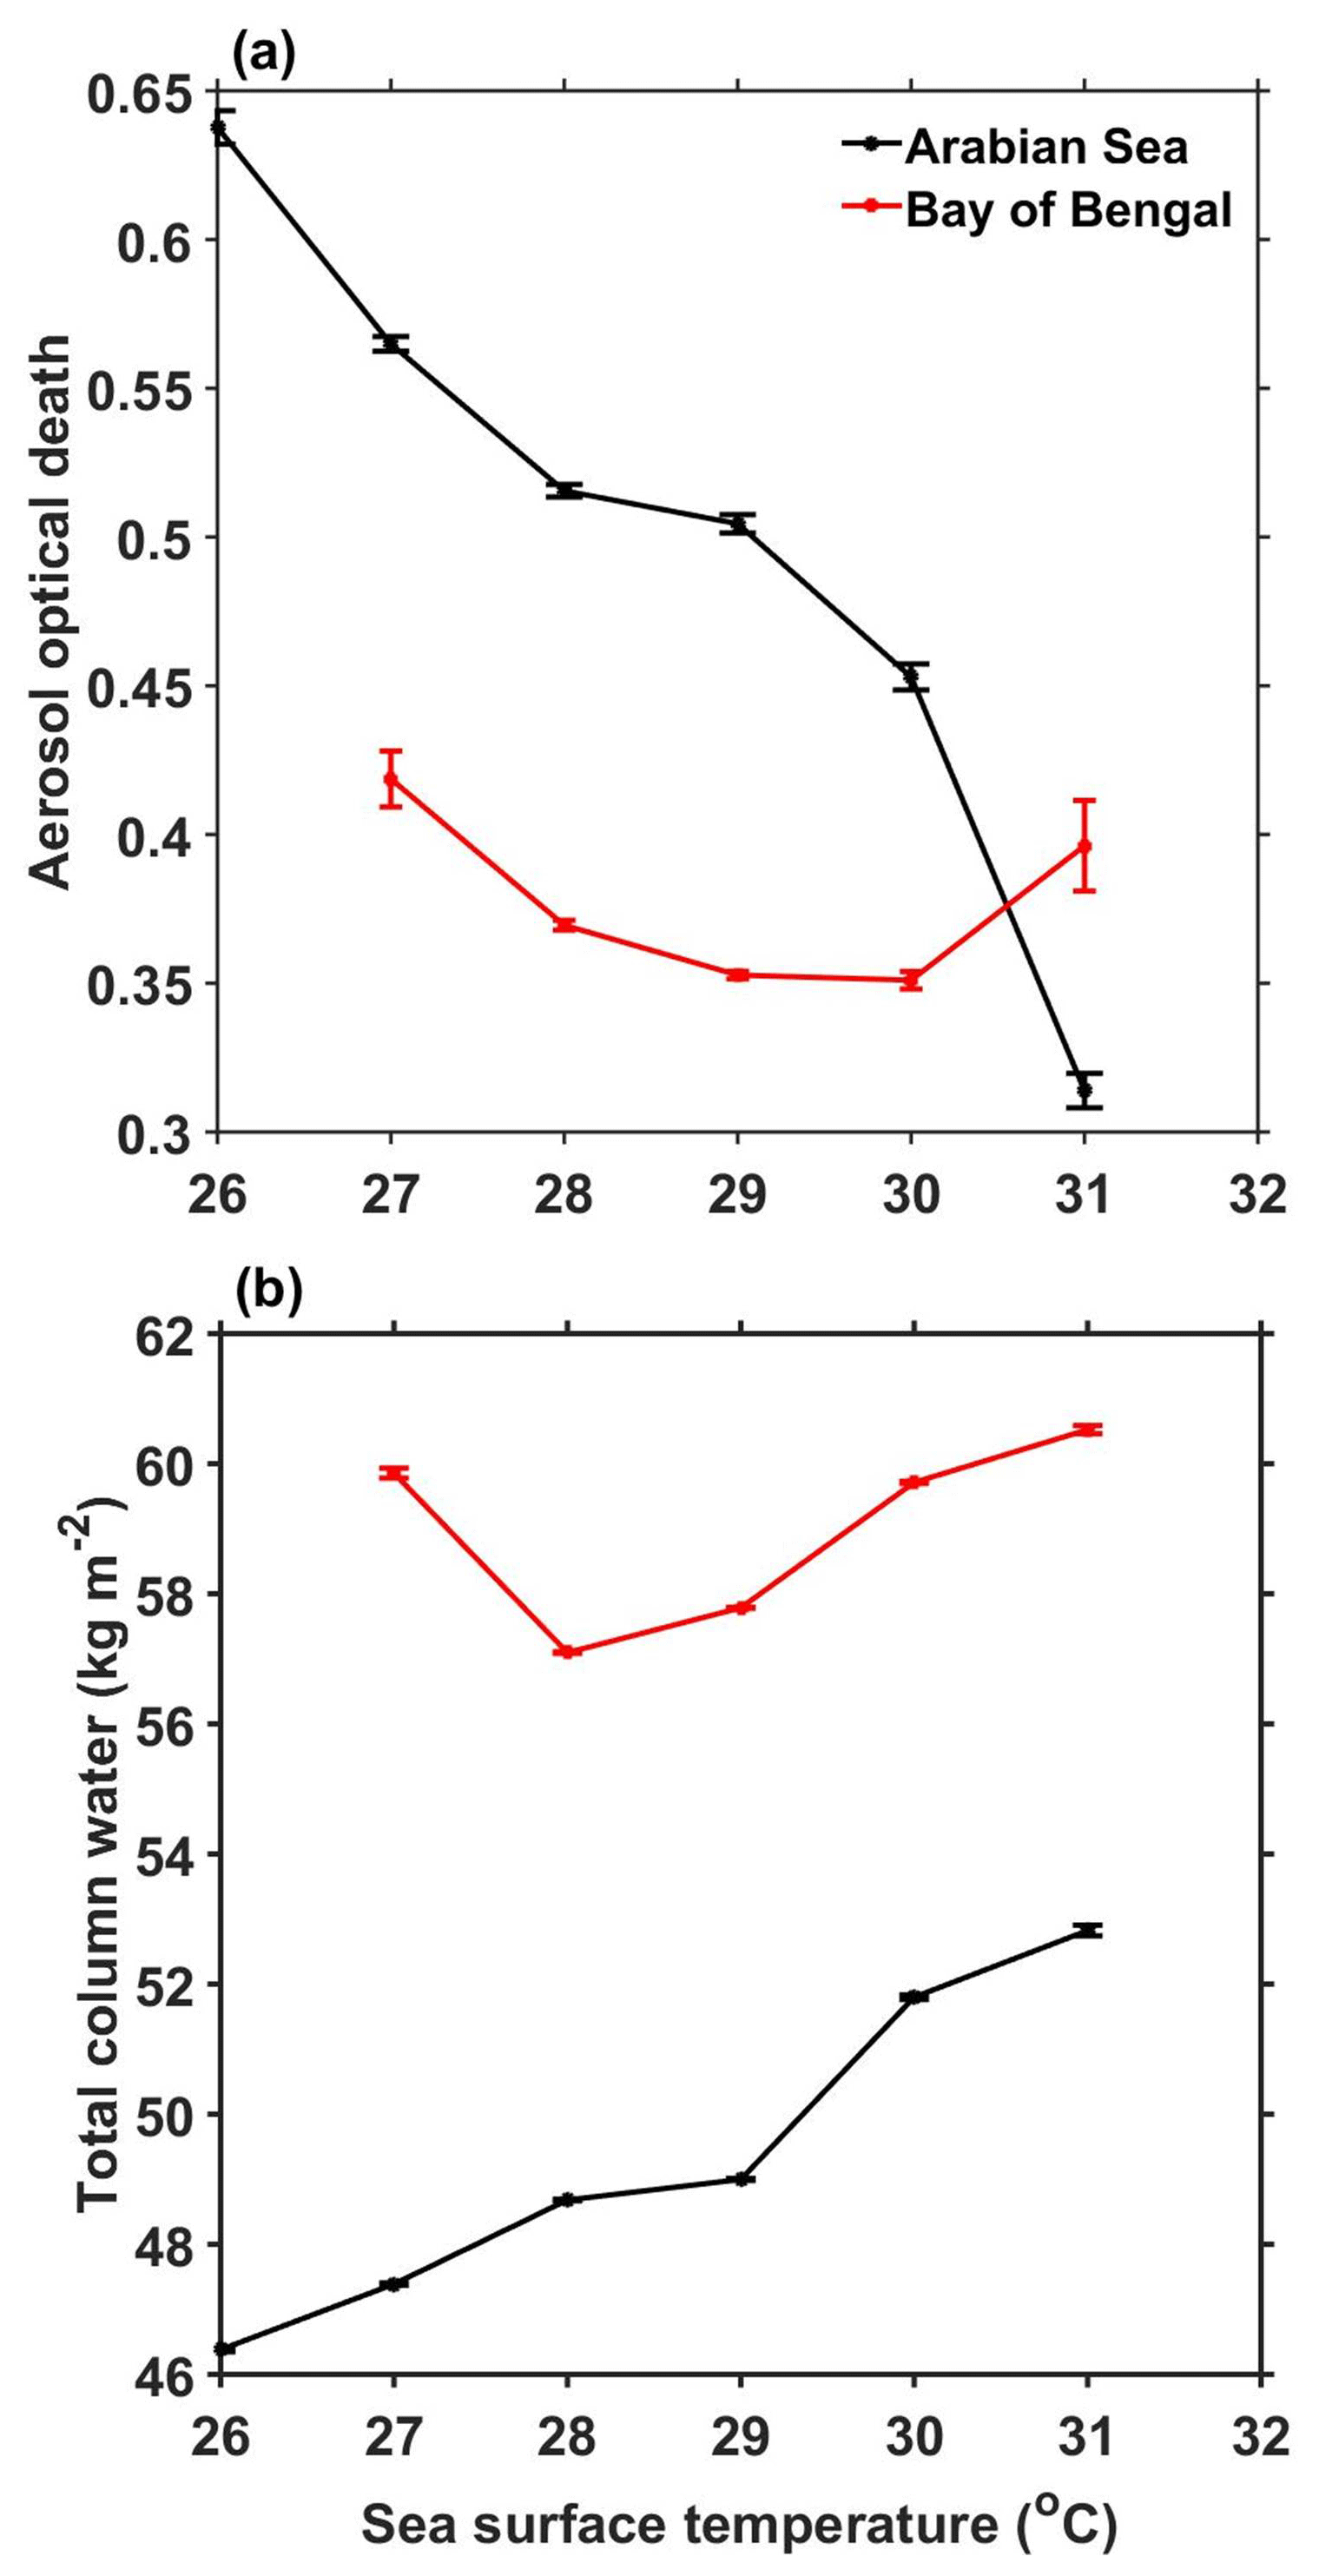
Figure 6(a) Mean and standard error of AOD and (b) TCW (in kg m−2) with SST over the AS and the BOB during ISM.
4.2 Microphysical factors
The observed differences in reflectivity profiles of precipitation with SST could originate at the cloud formation stage itself or be manifested during the evolution stage or due to both. Information on AOD and the CER would be ideal for inferring microphysical processes at the cloud formation stage. CER values are mainly controlled by the ambient aerosol concentration and the available moisture (Twomey, 1977; Albrecht, 1989; Tao et al., 2012; Rosenfeld et al., 2014). For a fixed liquid water content, as the concentration of aerosols increases, the number of cloud drops increases and the CER decreases (Twomey, 1977). To understand the variation in AOD and total column water (TCW) and the resultant CER with SST, the mean AOD and TCW for different SST bins are plotted in Fig. 6a and b. The mean and standard error are calculated only when the number of data points is more than 100 in each SST bin. AOD decreases from 0.62 to 0.31 with a rise in SST from 26 to 31 ∘C over the AS, but only from 0.42 to 0.36, as SST varies from 27 to 30 ∘C and then increases at higher SSTs over the BOB. The variation in TCW with SST (Fig. 6b) shows a gradual increase with SST over the AS, while it decreases initially from 27 to 28 ∘C and then increases over the BOB. At a given SST the TCW is more in the BOB (>8 mm) than in the AS.
The decrease in AOD and an increase in TCW with SST result in an increase in the CER (14.7 to 20.8 µm from 26 to 31 ∘C) over the AS (Fig. 7). On the other hand, the CER does not show much variation with SST (18.5 to 19.5 µm from 27 to 31 ∘C) over BOB due to smaller variations in AOD and TCW. This also shows that the cloud droplets are smaller in size at lower SSTs over the AS than BOB, while they are bigger and nearly equal in size at higher SSTs. Since reflectivity is more sensitive to the precipitating particle size (Z∝D6), the smaller-sized hydrometeors at lower SSTs over the AS yield weaker reflectivity than over the BOB (both for deep and shallow systems). As the SST increases, the CER, as well as the reflectivity, increases over the AS. At higher SSTs, the CER values are approximately equal over both the seas and in turn the observed reflectivities (Figs. 3a, 4a). This suggests that the variations seen in the reflectivity originate in the cloud formation stage itself.
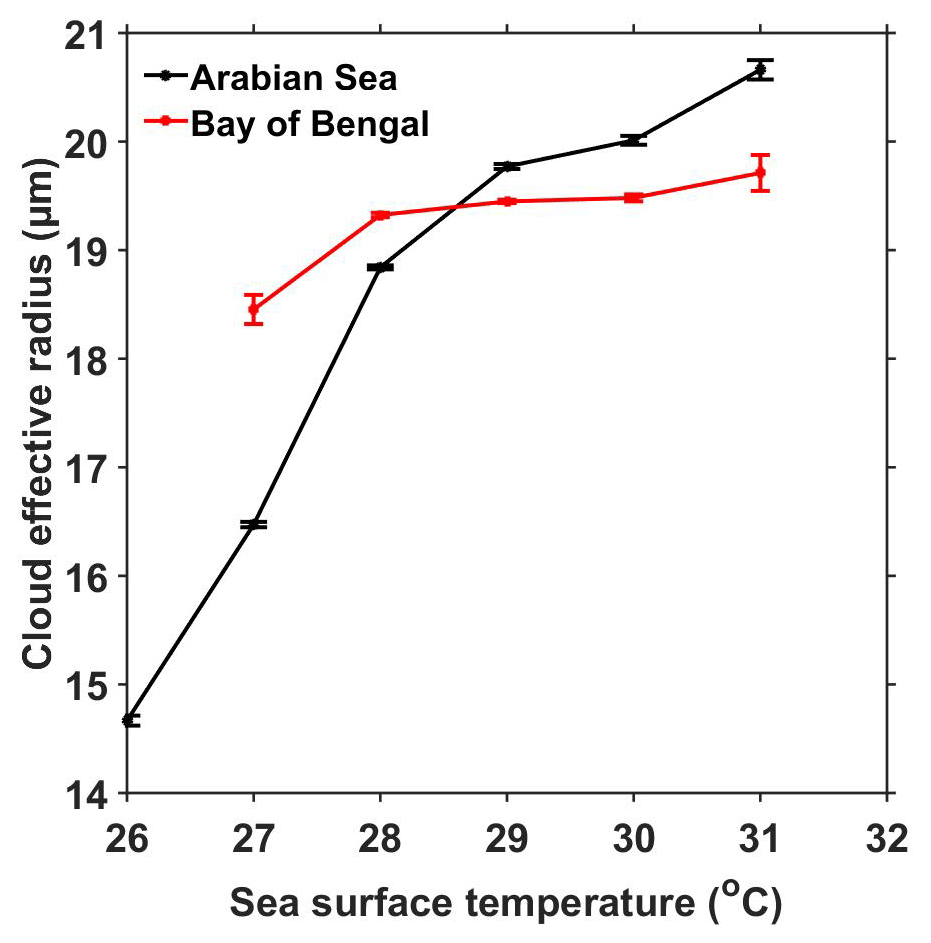
Figure 7Variation in mean and standard error of CER liquid (in µm) with SST over the AS and the BOB during the ISM season.
The hydrometeors also evolve during their descent to the ground due to several microphysical processes. These processes can be inferred from the vertical structure of precipitation or vertical profiles of reflectivity. The median reflectivity profiles of deep systems show a gradual increase from ∼10 to 6 km, and an abrupt enhancement is seen just below 6 km over both the seas (Fig. 3a, d). The sudden enhancement at the freezing level (radar bright band) is primarily due to the aggregation of hydrometeors, change in the dielectric factor from ice to water and change in fall speed from ice hydrometers to raindrops (Fabry and Zawadzki, 1995; Rao et al., 2008; Cao et al., 2013). Below the bright band, raindrops grow from the collision–coalescence process and reduce their size by either breakup and/or evaporation processes. The collision–coalescence results in negative slope in the reflectivity profile, whereas breakup and evaporation results in positive slope (Liu and Zipser, 2013; Cao et al., 2013; Saikranthi et al., 2014; Rao et al., 2016). The observed negative slope ( dBZ km−1) in the median reflectivity profiles below the bright band indicates dominance of low-level hydrometeor growth over both the seas. The magnitude of the slope decreases with SST over the AS, while it is nearly equal at all SSTs over the BOB. It indicates that the growth rate decreases with SST over the AS and remains the same at all SSTs over the BOB. The median reflectivity profiles of shallow systems also show negative slopes ( dBZ km−1) at all SSTs, representing the predominance of low-level hydrometeor growth by collision–coalescence processes over both the seas.
The present analysis shows that the observed reflectivity changes with SST over both the seas originate at the cloud formation stage and being magnified further during the descent of hydrometeors to the ground.
Sixteen years of TRMM PR 2A25 reflectivity profiles and 11 years of MODIS AOD and CER data are utilized to understand the differences in variation in vertical structure of precipitation with SST over AS and BOB. Precipitation top height increases with SST over the AS, indicating that systems grow to higher altitudes with increase in SST, while it is almost same at all SSTs, indicating that the systems are deeper over the BOB. The decrease in stability and mid-tropospheric wind shear with SST over the AS favor the formation of deeper system at higher systems. However the low stability and small wind shear at all SSTs over the BOB help the formation of deeper systems. The variation in reflectivity with SST is found to be remarkable over the AS and marginal over the BOB. The reflectivity increases with a rise in SST over the AS and remains the same at all SSTs over the BOB. This change in reflectivity over the AS is more prominent below the freezing-level height (∼4 dBZ) than the above (∼1 dBZ). Over the AS, the abundance of aerosols and less moisture at SSTs smaller than 27 ∘C result in high concentration of smaller cloud droplets. As SST increases, the aerosol concentration decreases and moisture increases, leading to the formation of bigger cloud droplets. Thus, the reflectivity increases with a rise in SST over the AS. On the other hand, AOD, TCW and the CER do not show substantial variation with SST over the BOB, and hence the change in reflectivity is small. Over the BOB, the mid-troposphere is wet, and hydrometeor's size at the formation stage is nearly the same at all SSTs. The evolution of hydrometeors during their descent is also similar at all SSTs. The collision–coalescence process is predominant below the bright band region over both the seas and is responsible for the observed negative slope in the reflectivity profiles.
The authors would like to thank Robert Houze and his team for the interpolated 3-D gridded TRMM PR dataset (http://trmm.atmos.washington.edu, last access: 4 May 2017; University of Washington, 2017), the ECMWF (https://apps.ecmwf.int/datasets/, last access: 4 May 2017; ECMWF, 2017) team for providing the ERA-Interim dataset, and the MODIS (https://ladsweb.modaps.eosdis.nasa.gov/, last access: 4 May 2017; LAADS DAAC, 2017) science team for providing the AOD and CER dataset.
The supplement related to this article is available online at: https://doi.org/10.5194/acp-19-10423-2019-supplement.
KS conceived the idea. KS and BR designed the analysis, plotted the figures and wrote the paper. TNR and SKS contributed in discussions as well as in improving the quality of the paper.
The authors declare that they have no conflict of interest.
This article is part of the special issue “Interactions between aerosols and the South West Asian monsoon”. It is not associated with a conference.
The authors express their gratitude to J. Srinivasan for his fruitful discussions and valuable suggestions in improving the quality of the paper. The corresponding author would like to thank Department of Science & Technology (DST), India, for providing the financial support through the grant number DST/INSPIRE/04/2017/001185. We thank the anonymous referees for their critical comments in improving the quality of the paper.
This research has been supported by the Department of Science & Technology, India (grant no. DST/INSPIRE/04/2017/001185).
This paper was edited by Armin Sorooshian and reviewed by five anonymous referees.
Albrecht, B. A.: Aerosols, cloud microphysics, and fractional cloudiness, Science, 245, 1227–1230, 1989.
Awaka, J., Iguchi, T., and Okamoto, K.: TRMM PR standard algorithm 2A23 and its performance on bright band detection, J. Meteorol. Soc. Jpn., 87A, 31–52, 2009.
Bhat, G. S., Gadgil, S., Kumar, P. V. H., Kalsi, S. R., Madhusoodanan, P., Murty, V. S., Rao, C. V. P., Babu, V. R., Rao, L. V., Rao, R. R., Ravichandran, M., Reddy, K. G., Rao, P. S., Sengupta, D., Sikka, D. R., Swain, J., and Vinayachandran, P. N.: BOBMEX: The Bay of Bengal Monsoon Experiment, B. Am. Meteorol. Soc., 82, 2217–2244, 2001.
Cao, Q., Hong, Y., Gourley, J. J., Qi, Y., Zhang, J., Wen, Y., and Kirstetter, P. E.: Statistical and physical analysis of the vertical structure of precipitation in the mountainous west region of the United States using 11+ years of space borne observations from TRMM precipitation radar, J. Appl. Meteorol. Climatol., 52, 408–424, 2013.
Chaudhari, H. S., Pokhrel, S., Mohanty, S., and Saha, S. K.: Seasonal prediction of Indian summer monsoon in NCEP coupled and uncoupled model, Theor. Appl. Climatol., 114, 459–477, https://doi.org/10.1007/s00704-013-0854-8, 2013.
Chaudhari, H. S., Pokhrel, S., Kulkani, A., Hazra, A., and Saha, S. K.: Clouds-SST relationship and interannual variability modes of Indian summer monsoon in the context of clouds and SSTs: observational and modelling aspects, Int. J. Climatol., 36, 4723–4740, https://doi.org/10.1002/ joc.4664, 2016.
Chen, Q., Fan, J., Hagos, S., Gustafson Jr., W. I., and Berg, L. K.: Roles of wind shear at different vertical levels: Cloud system organization and properties, J. Geophys. Res.-Atmos., 120, 6551–6574, 2015.
Creamean, J. M., Suski, K. J., Rosenfeld, D., Cazorla, A., DeMott, P. J., Sullivan, R. C., White, A. B., Ralph, F. M., Minnis, P., Comstock, J. M., Tomlinson, J. M., Kimberly, A., and Prather, K. A.: Dust and biological aerosols from the Sahara and Asia influence precipitation in the western U.S., Science, 339, 1572–1578, https://doi.org/10.1126/science.1227279, 2013.
Dee, D. P., Uppala, S. M., Simmons, A. J., Berrisford, P., Poli, P., Kobayashi, S., Andrae, U., Balmaseda, M. A., Balsamo, G., Bauer, P., Bechtold, P., Beljaars, A. C., van de Berg, L., Bidlot, J., Bormann, N., Delsol, C., Dragani, R., Fuentes, M., Geer, A. J., Haimberger, L., Healy, S. B., Hersbach, H., Hólm, E. V., Isaksen, L., Kållberg, P., Köhler, M., Matricardi, M., McNally, A. P., Monge-Sanz, B. M., Morcrette, J., Park, B., Peubey, C., de Rosnay, P., Tavolato, C., Thépaut, J., and Vitart, F.: The ERA-Interim reanalysis: Configuration and performance of the data assimilation system, Q. J. Roy. Meteorol. Soc., 137, 553–597, 2011.
ECMWF: ERA Interim Reanalysis Datasets, available at: https://apps.ecmwf.int/datasets/, last access: 4 May 2017.
Emanuel, K. A.: Atmospheric convection, Oxford University Press, Oxford, 1994.
Fabry, F. and Zawadzki, I.: Long-term radar observations of the melting layer of precipitation and their interpretation, J. Atmos. Sci., 52, 838–851, 1995.
Feng, X., Haines, K., Liu, C., de Boisséson, E., and Polo, I., Improved SST-precipitation intraseasonal relationships in the ECMWF coupled climate reanalysis, Geophys. Res. Lett., 45, 3664–3672, 2018.
Findlater, J.: A major low-level air current near the Indian Ocean during the northern summer, Q. J. Roy. Meteorol. Soc., 95, 362–380, 1969.
Fu, Y. and Liu, G.: The variability of tropical precipitation profiles and its impact on microwave brightness temperatures as inferred from TRMM data, J. Appl. Meteorol., 40, 2130–2143, 2001.
Gadgil, S.: Monsoon–ocean coupling, Current Sci., 78, 309–323, 2000.
Gadgil, S., Joseph, P. V., and Joshi, N. V.: Ocean atmosphere coupling over monsoonal regions, Nature, 312, 141–143, 1984.
Geerts, B. and Dejene, T.: Regional and diurnal variability of the vertical structure of precipitation systems in Africa based on space borne radar data, J. Climate, 18, 893–916, 2005.
Guo, J., Liu, H., Li, Z., Rosenfeld, D., Jiang, M., Xu, W., Jiang, J. H., He, J., Chen, D., Min, M., and Zhai, P.: Aerosol-induced changes in the vertical structure of precipitation: a perspective of TRMM precipitation radar, Atmos. Chem. Phys., 18, 13329–13343, https://doi.org/10.5194/acp-18-13329-2018, 2018.
Houze, R. A.: Mesoscale convective systems, Rev. Geophys., 42, RG4003, https://doi.org/10.1029/2004RG000150, 2004.
Houze, R. A. and Churchill, D. D.: Mesoscale organization and cloud microphysics in a Bay of Bengal depression, J. Atmos. Sci., 44, 1845–1867, 1987.
Houze, R. A., Wilton, D. C., and Smull, B. F.: Monsoon convection in the Himalayan region as seen by the TRMM precipitation radar, Q. J. Roy. Meteorol. Soc., 133, 1389–1411, 2007.
Houze, R. A., Rasmussen, K. L., Zuluaga, M. D., and Brodzik, S. R.: The variable nature of convection in the tropics and subtropics: A legacy of 16 years of the Tropical rainfall measuring mission satellite, Rev. Geophys., 53, 994–1021, 2015.
Hsu, N., Tsay, S., King, M., and Herman, J.: Aerosol properties over bright-reflecting source regions, Geosci. Remote Sens. IEEE Trans., 42, 557–569, 2004.
Hubanks, P., King, M., Platnick, S., and Pincus, R.: MODIS atmosphere L3 gridded product algorithm theoretical basis document collection 005 Version 1.1, Tech. Rep. ATBD-MOD-30, NASA, 2008.
Iguchi, T., Kozu, T., Kwiatkowski, J., Meneghini, R., Awaka, J., and Okamoto, K.: Uncertainties in the rain profiling algorithm for the TRMM precipitation radar, J. Meteor. Soc. Japan, 87A, 1–30, https://doi.org/10.2151/jmsj.87A.1, 2009.
Krishnamurti, T.: Cooling of the Arabian Sea and the onset-vortex during 1979, Recent progress in equatorial oceanography: A report of the final meeting of SCOR WORKING GROUP 47 in Venice, Italy, 1–12, 1981 (Available from Nova Univ., Ocean Science Center, Dania, FL 33004).
Krishnamurti, T. N.: Summer monsoon experiment – A review, Mon. Weather Rev., 113, 1590–1626, 1985.
Kumar, S., Hazra, A., and Goswami, B. N.: Role of interaction between dynamics, thermodynamics and cloud microphysics on summer monsoon precipitating clouds over the Myanmar coast and the Western Ghats, Clim. Dynam., 43, 911–924, https://doi.org/10.1007/s00382-013-1909-3, 2014.
LAADS DAAC: Earth Data, available at: https://ladsweb.modaps.eosdis.nasa.gov/, last access: 4 May 2017.
Levy, R., Remer, L., Mattoo, S., Vermote, E., and Kaufman, Y.: Second-generation operational algorithm: Retrieval of aerosol properties over land from inversion of moderate resolution imaging spectroradiometer spectral reflectance, J. Geophys. Res., 112, D13211, https://doi.org/10.1029/2006JD007811, 2007.
Li, R. and Min, Q.-L.: Impacts of mineral dust on the vertical structure of precipitation, J. Geophys. Res., 115, D09203, https://doi.org/10.1029/2009JD011925, 2010.
Liu. C. and Zipser, E. J.: Why does radar reflectivity tend to increase downward toward the ocean surface, but decrease downward toward the land surface?, J. Geophys. Res.-Atmos., 118, 135–148, https://doi.org/10.1029/2012JD018134, 2013.
Liu, C., Zipser, E., and Nesbitt, S. W.: Global distribution of tropical deep convection: Different perspectives using infrared and radar as the primary data source, J. Climate, 20, 489–503, 2007.
Meenu, S., Parameswaran, K., and Rajeev, K.: Role of sea surface temperature and wind convergence in regulating convection over the tropical Indian Ocean, J. Geophys. Res.-Atmos., 117, D14102, https://doi.org/10.1029/2011JD016947, 2012.
Nair, A. K. M. and Rajeev, K.: Multiyear CloudSat and CALIPSO observations of the dependence of cloud vertical distribution on sea surface temperature and tropospheric dynamics, J. Climate, 27, 672–683, https://doi.org/10.1175/JCLI-D-13-00062.1, 2014.
Narayanan, M. S. and Rao, B. M.: Detection of monsoon inversion by TIROS-N satellite, Nature, 294, 546–548, 1981.
Nuijens, L., Emanuel, K., Masunaga, H., and L'Ecuyer, T.: Implications of warm rain in shallow cumulus and congestus clouds for large-scale circulations, Surv. Geophys., 38, 1257–1282, 2017.
Oueslati, B. and Bellon, G.: The double ITCZ bias in CMIP5 models: interaction between SST, large-scale circulation and precipitation, Clim. Dynam., 44, 585–607, 2015.
Platnick, S., Meyer, K. G., King, M. D., Wind, G., Amarasinghe, N., Marchant, B., Arnold, G. T., Zhang, Z., Hubanks, P. A., Holz, R. E., Yang, P., Ridgway, W. L., and Riedi, J.: The MODIS cloud optical and microphysical products: Collection 6 updates and examples from Terra and Aqua, IEEE Trans. Geosci. Remote Sens., 55, 502–525, https://doi.org/10.1109/TGRS.2016.2610522, 2017.
Rajeevan, M., Unnikrishnan, C. K., and Preethi, B.: Evaluation of the ENSEMBLES multi-model seasonal forecasts of Indian summer monsoon variability, Clim. Dynam., 38, 2257–2274, 2012.
Rajendran, K., Nanjundiah, R. S., Gadgil, S., and Srinivasan, J.: How good are the simulations of tropical SST–rainfall relationship by IPCC AR4 atmospheric and coupled models?, J. Earth Sys. Sci., 121, 595–610, 2012.
Rajendran, K., Gadgil, S. and Surendran, S.: Monsoon season local control on precipitation over warm tropical oceans, Meteorol. Atmos. Phys., https://doi.org/10.1007/s00703-018-0649-7, in press, 2018.
Rao, T. N., Kirankumar, N. V. P., Radhakrishna, B., Rao, D. N., and Nakamura, K.: Classification of tropical precipitating systems using wind profiler spectral moments. Part I: Algorithm description and validation, J. Atmos. Ocean. Technol., 25, 884–897, 2008.
Rao, T. N., Saikranthi, K., Radhakrisna, B., and Rao, S. V. B.: Differences in the climataological characteristics of precipitation between active and break spells of the Indian summer monsoon, J. Climate, 29, 7797–7814, 2016.
Remer, L., Kaufman, Y., Tanr,́ D., Mattoo, S., Chu, D., Martins, J., Li, R., Ichoku, C., Levy, R., Kleidman, R., Eck, T., Vermote, E., and Holben, B.: The MODIS aerosol algorithm, products, and validation, J. Atmos. Sci., 62, 947–973, 2005.
Romatschke, U., Medina, S., and Houze, R. A.: Regional, seasonal, and diurnal variations of extreme convection in the South Asian region, J. Climate, 23, 419–439, 2010.
Rosenfeld, D., Andreae, M. O., Asmi, A., Chin, M., de Leeuw, G., Donovan, D. P., Kahn, R., Kinne, S., Kivekäs, N., Kulmala, M., Lau, W., Sebastian Schmidt, K., Suni, T., Wagner, T., Wild, M., and Quaas, J.: Global observations of aerosol-cloud-precipitation-climate interactions, Rev. Geophys., 52, 750–808, https://doi.org/10.1002/2013RG000441, 2014.
Roxy, M.: Sensitivity of precipitation to sea surface temperature over the tropical summer monsoon region—and its quantification, Clim. Dynam., 43, 1159–1169, 2014.
Roxy, M., Tanimoto, Y., Preethi, B., Terray, P., and Krishnan, R.: Intraseasonal SST-precipitation relationship and its spatial variability over the tropical summer monsoon region, Clim. Dynam., 41, 45–61, 2013.
Sabin, T., Babu, C., and Joseph, P.: SST–convection relation over tropical oceans, Int. J. Climatol., 33, 1424–1435, 2012.
Saikranthi, K., Rao, T. N., Radhakrishna, B., and Rao, S. V. B.: Morphology of the vertical structure of precipitation over India and adjoining oceans based on long-term measurements of TRMMPR, J. Geophys. Res.-Atmos., 119, 8433–8449, https://doi.org/10.1002/2014JD021774, 2014.
Saikranthi, K., Radhakrishna, B., Satheesh, S. K., and Rao, T. N.: Spatial variation of different rain systems during El Niño and La Niña periods over India and adjoining ocean, Clim. Dynam., 50, 3671–3685, https://doi.org/10.1007/s00382-017-3833-4, 2018.
Saikranthi, K., Radhakrishna, B., Rao, T. N., and Satheesh, S. K.: Differences in the association of sea surface temperature – precipitating systems over the Bay of Bengal and the Arabian Sea during southwest monsoon season, Int. J. Climatol., https://doi.org/10.1002/joc.6074, in press, 2019.
Sathiyamoorthy, V., Mahesh, C., Gopalan, K., Prakash, S., Shukla, B. P., and Mathur, A.: Characteristics of low clouds over the Arabian Sea, J. Geophys. Res.-Atmos., 118, 13489–13503, 2013.
Schumacher, C. and Houze, R. A.: Stratiform rain in the tropics as seen by the TRMM precipitation radar, J. Climate, 16, 1739–1756, 2003.
Sengupta, D., Goswami, B. N., and Senan, R.: Coherent intraseasonal oscillations of ocean and atmosphere during the Asian summer monsoon, Geophys. Res. Lett., 28, 4127–4130, 2001.
Shenoi, S. S. C., Shankar, D., and Shetye, S. R.: Differences in heat budgets of the near-surface Arabian Sea and Bay of Bengal: Implications for the summer monsoon, J. Geophys. Res., 107, 3052, https://doi.org/10.1029/2000JC000679, 2002.
Shige, S. and Kummerow, C. D.: Precipitation-Top Heights of Heavy Orographic Rainfall in the Asian Monsoon Region, J. Atmos. Sci., 73, 3009–3024, 2016.
Shige, S., Nakano, Y., and Yamamoto, M. K.: Role of orography, diurnal cycle, and intraseasonal oscillation in summer monsoon rainfall over Western Ghats and Myanmar coast, J. Climate, 30, 9365–9381, https://doi.org/10.1175/JCLI-D-16-0858.1, 2017.
Sunilkumar, K., Rao, T. N., Saikranthi, K., and Rao, M. P.: comprehensive evaluation of multisatellite precipitation estimates over India using gridded rainfall data, J. Geophys. Res.-Atmos., 120, 8987–9005, https://doi.org/10.1002/2015JD023437, 2015.
Takahashi, H. G. and Dado, J. M. B.: Relationship between sea surface temperature and rainfall in the Philippines during the Asian summer monsoon, J. Meteor. Soc. Japan, 96, 283–290, https://doi.org/10.2151/jmsj.2018-031, 2018.
Takayabu, Y. N., Shige, S., Tao, W., and Hirota, N.: Shallow and deep latent heating modes over tropical Oceans observed with TRMM PR spectral latent heating Data, J. Climate, 23, 2030–2046, 2010.
Tao, W., Smith, E. A., Adler, R. F., Haddad, Z. S., Hou, A. Y., Iguchi, T., Kakar, R., Krishnamurti, T. N., Kummerow, C. D., Lang, S., Meneghini, R., Nakamura, K., Nakazawa, T., Okamoto, K., Olson, W. S., Satoh, S., Shige, S., Simpson, J., Takayabu, Y., Tripoli, G. J., and Yang, S.: Retrieval of latent heating from TRMM measurements, B. Am. Meteorol. Soc., 87, 1555–1572, 2006.
Tao, W.-K., Chen, J.-P., Li, Z., Wang, C., and Zhang, C.: Impact of aerosols on convective clouds and precipitation, Rev. Geophys., 50, RG2001, https://doi.org/10.1029/2011RG000369, 2012.
Tao, W., Takayabu, Y. N., Lang, S., Shige, S., Olson, W., Hou, A., Skofronick-Jackson, G., Jiang, X., Zhang, C., Lau, W., Krishnamurti, T. N., Waliser, D., Grecu, M., Ciesielski, P. E., Johnson, R. H., Houze, R., Kakar, R., Nakamura, K., Braun, S., Hagos, S., Oki, R., and Bhardwaj, A.: TRMM latent heating retrieval: Applications and comparisons with field campaigns and large-scale analyses, Meteorological Monographs – Multi-scale Convection-Coupled Systems in the Tropics: A tribute to Dr. Michio Yanai, 56, 2.1–2.34, https://doi.org/10.1175/AMSMONOGRAPHS-D-15-0013.1, 2016.
Twomey, S.: The influence of pollution on the short wave albedo of clouds, J. Atmos. Sci., 34, 1149–1152, 1977.
University of Washington: 3-D gridded TRMM Data Set, available at: http://trmm.atmos.washington.edu/, last access: 4 May 2017.
Wallace, J. M. and Hobbs, P. V.: Atmospheric science: An introductory survey, Second edition, Academic press, 85 pp., 2006.
Wang, B., Ding, Q., Fu, X., Kang, I.-S., Jin, K., Shukla, J., and Doblas-Reyes, F.: Fundamental challenge in simulation and prediction of summer monsoon rainfall, Geophys. Res. Lett., 32, L15711, https://doi.org/10.1029/2005GL022734, 2005.
Weller, R. A., Farrar, J. T., Buckley, J., Mathew, S., Venkatesan, R., Lekha, J. S., Chaudhuri, D., Kumar, N. S., and Kumar, B. P.: Air-sea interaction in the Bay of Bengal, Oceanography, 29, 28–37, 2016.
Woolnough, S. J., Slingo, J. M., and Hoskins, B. J.: The relationship between convection and sea surface temperature on intraseasonal timescales, J. Climate, 13, 2086–2104, 2000.
Wu, R. and Kirtman, B. P.: Roles of Indian and Pacific Ocean air–sea coupling in tropical atmospheric variability, Clim. Dynam., 25, 155–170, 2005.
- Abstract
- Introduction
- Data
- Variation in vertical structure of precipitation with SST
- Factors affecting the vertical structure of precipitation and their variability with SST
- Conclusions
- Data availability
- Author contributions
- Competing interests
- Special issue statement
- Acknowledgements
- Financial support
- Review statement
- References
- Supplement
The requested paper has a corresponding corrigendum published. Please read the corrigendum first before downloading the article.
- Article
(6682 KB) - Full-text XML
- Corrigendum
-
Supplement
(507 KB) - BibTeX
- EndNote
- Abstract
- Introduction
- Data
- Variation in vertical structure of precipitation with SST
- Factors affecting the vertical structure of precipitation and their variability with SST
- Conclusions
- Data availability
- Author contributions
- Competing interests
- Special issue statement
- Acknowledgements
- Financial support
- Review statement
- References
- Supplement