the Creative Commons Attribution 4.0 License.
the Creative Commons Attribution 4.0 License.
 | 20 Mar 2018
Aerosol optical depth in the European Brewer Network
Javier López-Solano
Thomas Carlund
Juan J. Rodriguez-Franco
Henri Diémoz
Sergio F. León-Luis
Bentorey Hernández-Cruz
Carmen Guirado-Fuentes
Natalia Kouremeti
Julian Gröbner
Stelios Kazadzis
Virgilio Carreño
Alberto Berjón
Daniel Santana-Díaz
Manuel Rodríguez-Valido
Veerle De Bock
Juan R. Moreta
John Rimmer
Andrew R. D. Smedley
Lamine Boulkelia
Nis Jepsen
Paul Eriksen
Alkiviadis F. Bais
Vadim Shirotov
José M. Vilaplana
Keith M. Wilson
Tomi Karppinen
Aerosols play an important role in key atmospheric processes and feature high spatial and temporal variabilities. This has motivated scientific interest in the development of networks capable of measuring aerosol properties over large geographical areas in near-real time. In this work we present and discuss results of an aerosol optical depth (AOD) algorithm applied to instruments of the European Brewer Network. This network is comprised of close to 50 Brewer spectrophotometers, mostly located in Europe and adjacent areas, although instruments operating at, for example, South America and Australia are also members. Although we only show results for instruments calibrated by the Regional Brewer Calibration Center for Europe, the implementation of the AOD algorithm described is intended to be used by the whole network in the future. Using data from the Brewer intercomparison campaigns in the years 2013 and 2015, and the period in between, plus comparisons with Cimel sun photometers and UVPFR instruments, we check the precision, stability, and uncertainty of the Brewer AOD in the ultraviolet range from 300 to 320 nm. Our results show a precision better than 0.01, an uncertainty of less than 0.05, and, for well-maintained instruments, a stability similar to that of the ozone measurements. We also discuss future improvements to our algorithm with respect to the input data, their processing, and the characterization of the Brewer instruments for the measurement of AOD.
- Article
(1023 KB) - Full-text XML
- BibTeX
- EndNote


Concerning atmospheric physics and chemistry, it is well known that aerosols play an important role in processes such as the interaction with the solar radiation and the formation of clouds, which are key to our understanding of the radiative balance of the Earth–atmosphere system. As pointed out in the IPCC Fifth Assessment Report (IPCC, 2014), the high spatial and temporal variability of aerosols, and the different absorbing properties depending on their type, introduce large uncertainties to radiative forcing estimations. This makes networks capable of measuring aerosol properties, over a wide spatial range, in near-real time, of special importance for the study of climate change. Of course, other research topics, from satellite validation to the assessment of aerosol-related health issues, also benefit from the availability of these data sets.
Previous works have already demonstrated the feasibility of using Brewer spectrophotometers, usually devoted to the measurement of the total ozone column (TOC) and UV irradiance, to determine the aerosol optical depth (AOD); see, e.g., Harrison and Michalsky (1994), Bais (1997), Marenco et al. (1997), Carvalho and Henriques (2000), Gröbner et al. (2001), Marenco et al. (2002), Cheymol and De Backer (2003), Arola and Tapani (2004), Gröbner and Meleti (2004), Savastiouk and McElroy (2004a), Savastiouk and McElroy (2004b), Silva and Kirchhoff (2004), Kazadzis et al. (2005), Savastiouk (2006), Sellitto et al. (2006), Kazadzis et al. (2007), De Bock et al. (2010), Kumharn (2010), Kumharn et al. (2012), De Bock et al. (2014), Kumharn et al. (2015), Rodriguez-Franco (2015), Diémoz et al. (2016), and Kumharn and Hanprasert (2016). Although Brewer spectrophotometers can be used to retrieve AOD at longer wavelengths, in their standard operational mode most instruments can only produce data in the 300–320 nm range. This is nevertheless an important wavelength range to study, because the optical properties of aerosols in the UVB are rather different from those in the visible and are as of yet not well known (Bais et al., 2015). It is also worth noting that the shortest wavelength provided by the AOD product of the Aerosol Robotic Network (AERONET; https://aeronet.gsfc.nasa.gov/), one of the most used sources for ground-based aerosol data, is 340 nm, which makes Brewer AOD data in the 300–320 nm range a useful complement.
At the Regional Brewer Calibration Center for Europe (RBCC-E, Izaña Atmospheric Research Center, Agencia Estatal de Meteorología, Spain; http://rbcce.aemet.es/), and as part of the activities carried out at the WMO-CIMO Testbed for Aerosols and Water Vapor Remote Sensing Instruments (Izaña, Spain), we have implemented an AOD algorithm for the instruments integrated in EUBREWNET (COST Action ES1207, “a European Brewer Network”; Rimmer et al., 2018; http://www.eubrewnet.org/cost1207), which is comprised of close to 50 Brewer spectrophotometers. Most of these Brewer instruments operate in Europe and adjacent areas, although some located farther away, for example in South America and Australia, have also joined the network. One feature of the AOD algorithm implemented at the RBCC-E is that all the necessary data for the AOD determination in the 300 to 320 nm wavelength range can be obtained from the standard ozone, direct sun measurements available in near-real time at EUBREWNET's data server (http://rbcce.aemet.es/eubrewnet). This data server allows for the harmonization of network data, providing four ozone product levels (three in near-real time) with an increasing number of corrections to improve data quality (Rimmer et al., 2018). It should be noted that EUBREWNET's data server is currently maintained by the RBCC-E, which itself has operated without interruption since 2003 under the auspices of the WMO/GAW and the Spanish Agencia Estatal de Meteorología (http://www.aemet.es/).
Also needed for the determination of the AOD is the data provided by the calibration of the Brewer instruments. To carry out this task, the RBCC-E maintains a reference triad of Brewer spectrophotometers at the Izaña Atmospheric Observatory (IZO, Agencial Estatal de Meteorología, Spain; http://izana.aemet.es/), located at 2370 in the island of Tenerife. Most of the year, the meteorological conditions at IZO are excellent for the absolute calibration of the Brewer instruments via the well-known Langley calibration method (Shaw et al., 1973; Ångström, 1970). The multiple research programs carried out at IZO (Cuevas et al., 2015) provide additional information that helps to carry out calibrations, such as forecasts of adverse weather conditions. This absolute calibration is transferred to participating instruments at international intercomparison campaigns, held in alternate years at El Arenosillo Atmospheric Observatory (Instituto Nacional de Técnica Aeroespacial, Huelva, Spain) and the Arosa Lichtklimatisches Observatorium (MeteoSwiss, Switzerland). For an overview of the last three campaigns, see Redondas et al. (2015), Redondas and Rodriguez-Franco (2015a), and Redondas and Rodriguez-Franco (2015b).
It should be noted that the RBCC-E provides calibration data for approximately half the Brewer spectrophotometers integrated in EUBREWNET, and this paper is focused on these instruments. However, the present implementation of the AOD algorithm is intended to run directly on EUBREWNET's data server using any measurements and calibration data available. This would allow one to extend the applicability of the present implementation of the AOD algorithm, with minor modifications as needed, to the whole EUBREWNET network, because any other calibration data can be used in addition to that supplied by the RBCC-E. This includes calibrations transferred from other Brewer reference spectrophotometers, such as the one operated by International Ozone Services (Toronto, Canada; http://www.io3.ca/). Furthermore, preliminary work on the feasibility of using an Ultraviolet Precision Filter Radiometer (UVPFR) from the Physikalisch-Meteorologisches Observatorium Davos and World Radiation Center (Davos, Switzerland; https://www.pmodwrc.ch/) to calibrate Brewer instruments has also been carried out (Carlund et al., 2017).
The present work is organized as follows. The AOD algorithm implemented at the RBCC-E is described in Sect. 2. In Sect. 3 we present results of the calibration of selected Brewers carried out in 2013, and estimate the precision of these instruments for the AOD determination. Next, we check the stability of the AOD from these Brewer instruments for the approximately 2-year period between the eighth and tenth intercomparison campaigns of the RBCC-E, both held at El Arenosillo. For this, we compare the Brewer AOD with data of collocated Cimel sun photometers as provided by AERONET. To close Sect. 3, we compare the Brewer AOD with the data produced by an UVPFR and derive the Brewer AOD uncertainty using data acquired during the tenth intercomparison campaign of the RBCC-E. In Sect. 4 we discuss future improvements of our AOD algorithm, and in Sect. 5 we provide some closing remarks.
We begin this section by providing a short overview of the Brewer spectrophotometer. Next, we describe the Brewer AOD equation used in the AOD algorithm implemented at the RBCC-E, placing special emphasis on the origin of each term. This is followed first by a description of the calibration procedure, and then by an analytic derivation of the AOD uncertainty within some simplifications. Finally, we briefly describe the Cimel and UVPFR instruments.
2.1 The Brewer spectrophotometer
The Brewer spectrophotometer was developed in Canada during the 1970s, and a commercial, automated version became available in the early 1980s. Currently, it is one of the primary ground-based instruments used to report TOC data, together with the Dobson spectrometer. The Brewer spectrophotometer performs measurements of the direct spectral UV irradiances which, through a well-defined process, are used to calculate the TOC value. In the rest of this section we highlight the most relevant details for the present work of the instrument and the measurement process; see Kerr (2010) for further information.
The Brewer spectrophotometer measures the direct spectral irradiance in six channels in the UV (303.2, 306.3, 310.1, 313.5, 316.8, and 320.14 nm), each with approximately a 0.5 nm bandwidth (resolving power 600), although that of the shortest wavelength varies with the Brewer model. The spectral analysis is achieved by a holographic grating in combination with a slit mask which selects the channel to be analyzed by a photomultiplier. There are three types of Brewer instruments currently in use in the EUBREWNET network: the Mk II and Mk IV models are single monochromators, and the Mk III model is a double monochromator, a characteristic that reduces stray light in its measurements (Karppinen et al., 2015).
During direct sun measurements, sunlight enters the instrument through an inclined quartz window. A right-angle prism directs the incoming light from the Sun to the optical axis of the instrument. The light subsequently passes through the fore-optics, which consist of a set of lenses to adequately focus the beam, an iris diaphragm, and two filter wheels. A ground quartz diffuser is located on the first filter wheel. The second filter wheel consists of a set of five neutral density filter attenuators and guarantees that the detector is working in its linear regime. After passing through the filter wheels, radiation is then focused onto the entrance slit of the monochromator.
The Brewer retrieval of the TOC requires instrument characteristics which in some cases can only be determined by calibration experiments performed at intercomparison campaigns (Redondas and Rodriguez-Franco, 2015a, b; Redondas et al., 2015). The instrumental calibration includes all the parameters that affect the counts measured by the spectrometer, in particular the dead time correction, temperature coefficients, and filter attenuations. The wavelength calibration determines the ozone and Rayleigh absorption coefficient. The exact wavelengths measured by each Brewer spectrophotometer are slightly different from instrument to instrument. The so-called “dispersion test” is thus used to determine the exact wavelengths of each instrument and its slit, or instrumental, functions. An extraterrestrial (calibration) constant is determined by the Langley method or by comparison with a reference instrument. The TOC is then finally determined using ratios of measurements at four wavelengths. In contrast, the individual (absolute) measurements are used for the determination of the AOD together with calibration parameters specific to each wavelength, as discussed next.
2.2 AOD equation for Brewer spectrophotometers
The attenuation of the direct solar irradiance as it travels through the Earth's atmosphere is described by the well-known Beer–Lambert–Bouguer equation (Iqbal, 1983):
where I(λ) is the direct solar irradiance of wavelength λ measured at the ground, I0(λ) is the extraterrestrial (outside the atmosphere) solar irradiance, τ(λ) is the so-called optical depth, and m is the optical air mass. Note that, instead of absolute irradiances, proportional magnitudes can be used, like for example measured photon rates. The two parameters τ(λ) and m describe the attenuation of the solar radiation by the different components of the atmosphere. In the UV range and for cloudless conditions, the main contributions are produced by the ozone, nitrogen and sulfur dioxides, Rayleigh molecular scattering, and aerosols. Following previous authors (Marenco et al., 2002) we currently do not consider the contribution of the nitrogen and sulfide dioxides to the optical depth, which should be rather small in the UV range except at polluted sites (Carlund et al., 2017). Under these assumptions, the optical depth in the UV range can thus be written as
where the subscripts refer to the contributions by ozone (o), Rayleigh (R), and aerosols (a).
Solving for the aerosol optical depth τa(λ), Eq. (1) then becomes
It should be stressed that Eq. (3) is wavelength dependent and valid for each wavelength λ measured by the Brewer spectrophotometer in the UV range. In this work we will consider only the five wavelengths between 306.3 and 320.1 nm which are measured by all Brewer models. The wavelength at 303.2 nm has a variable bandwidth which depends on the Brewer model, and other wavelengths above 320.1 nm are only routinely measured by Mk IV and V models.
In terms of variables either measured by the Brewer spectrophotometer or determined by the calibration carried out by the RBCC-E, Eq. (3) can be rewritten as (see Appendix A for the corresponding expression written in the scaled logarithmic space used internally by the standard Brewer software)
where the variables are as follows:
-
I0(λ): extraterrestrial counts per second for each wavelength, determined by any of the two calibration methods described in Sect. 2.3.
-
I(λ): counts per second measured by the Brewer instrument at each wavelength. In addition to the usual corrections applied to the raw counts in the standard ozone data reduction (Kipp and Zonen, 2014), we also apply those described below. This requires the determination of some parameters which are specific to each Brewer instrument, a process which is carried out during the instrumental calibration performed by the RBCC-E.
-
Xo: measured TOC in atm-cm. We currently use the real-time ozone level 1.5 product available at EUBREWNET's data server. However, instead of the Rayleigh coefficients supplied by default for all Brewer spectrophotometers, we use specific coefficients for each instrument determined during the RBCC-E calibration. These coefficients are calculated following the formula of Nicolet (1984), and this modification in the Rayleigh contribution lowers the ozone value by approx. 0.003 cm, in agreement with the value reported by Kiedron and Stierle (2009).
-
ko(λ): ozone absorption coefficients derived from the Bass and Paur cross sections for each wavelength in cm−1. These coefficients are also determined during the standard ozone calibration performed by the RBCC-E for each Brewer spectrophotometer (Redondas et al., 2014).
-
mo: ozone optical air mass, calculated as
where , h=22 km, and SZA is the solar zenith angle in degrees.
-
p: climatological pressure at the observation site, in millibars.
-
τR0(λ): Rayleigh optical depth at sea level following the formula of Nicolet (1984), for each wavelength determined during the RBCC-E calibration process.
-
mR: Rayleigh optical air mass, calculated with the same expression as the ozone optical mass but for an altitude h = 5 km.
-
ma: aerosol optical air mass, which we approximate with mR. Note that we only consider measurements up to a maximum optical air mass value of 3.5, so the exact altitude of the aerosol layer has a small effect on the optical air mass. Thus, for example, in the case of aerosols at sea level, the approximation ma≈mR introduces at most a ∼ 1 % error in the aerosol optical air mass.
As mentioned above, starting from the raw counts measured by the Brewer instrument, the counts per second used in the AOD calculation are determined taking into account the effects produced by the dark counts, dead time, and temperature in the same way as in the ozone data processing (Kipp and Zonen, 2014). Further AOD-specific corrections include the following:
-
Filter correction, to remove the effect of the different attenuation of each filter used by the Brewer instrument to avoid the saturation of the photomultiplier. This correction is also applied in the ozone data reduction, but here we include the wavelength dependence of the attenuation coefficients, as determined during the calibration process. Note, however, that we perform our Langley calibration with all the filters separately (see Sect. 2.3), so that any remaining effect of the different attenuations is taken into account in the calibration constants.
-
Internal polarization correction, to correct for the loss of sensitivity of the Brewer due to the polarization effects produced by its window and grating, mostly noticeable when operating at high solar zenith angles. We use the correction from the field experiment performed by Cede et al. (2006).
-
Correction for the seasonal variation of the Earth–Sun distance, using the eccentricity correction factor of the Earth's orbit from Spencer (1971), as quoted by Iqbal (1983):
where .
To these corrected counts per second we also apply the data-quality criteria defined within EUBREWNET's level 1.5 ozone product (see http://rbcce.aemet.es/dokuwiki/doku.php for further details):
-
SD (or cloud) filter, used to remove groups of five measurements with large variability (SD above 2.5 DU) and thus likely affected by fast-moving clouds.
-
Optical air mass filter, used to remove measurements taken under conditions of high ozone optical air mass (above 3.5), unreliable due to the fast rising and setting of the Sun in low and mid-latitudes, and affected by stray-light errors in Mk II and IV instruments (Karppinen et al., 2015).
-
Mercury lamp test filter, to remove measurements likely affected by a wavelength shift usually produced by temperature changes in the grating of the Brewer spectrophotometer.
Furthermore, following Gröbner and Meleti (2004), we also remove groups of five AOD measurements for which their SD is greater than 0.02. Together with the criterion on the SD of the ozone data described above, this ensures that measurements affected by clouds are removed.
2.3 AOD calibration of Brewer instruments
In this section we provide details of two AOD calibration methods for Brewer spectrophotometers. The Langley plot method is used to calibrate the RBCC-E reference Brewer spectrophotometer operating at IZO. The calibration transfer method is then used to calibrate other Brewer instruments operating simultaneously with the RBCC-E reference Brewer during the intercomparison campaigns. Under the stable atmospheric conditions in which Brewer calibrations have to take place, the total optical depth τ can be considered constant. Equation (1) can then be rewritten as a linear equation with the total optical air mass m as the independent variable and logeI0 as the intercept:
Following the Langley plot method, the determination of the calibration constant I0 then just requires fitting a linear equation to the data of a logeI vs. m plot. Note that this equation is valid for each wavelength and filter position, so that multiple Langley fits are thus necessary to determine all the calibration constants. We show an example in Sect. 3.1.
In practice, we follow Gröbner and Kerr (2001), and apply the Langley plot method using
where the Rayleigh term is considered explicitly, so that the τ′ optical depth now contains the contributions from the ozone and aerosols, as it also happens with the optical air mass. However, during a large part of the year the atmospheric conditions at IZO can be considered ideal for the Langley calibration method, in particular usually featuring a low aerosol load except in summer months (García et al., 2017; Rodríguez et al., 2015). In these conditions, the largest contribution to τ′ in the UV range is produced by ozone, and mo can indeed be considered a good approximation for the optical air mass on the right-hand side of Eq. (8). A more elaborate term for the optical air mass could be used instead, such as the average weighted by the optical depths proposed in Carlund et al. (2017). However, we have found that in the atmospheric conditions of IZO and within the optical air mass limits described below, switching from mo to ma produces differences of ∼ 0.01 % in the calibration constants obtained from the Langley plot, so we do not expected any combination of the two air masses to introduce any significant changes.
Following the usual ozone calibration procedure for Brewer spectrophotometers (Redondas, 2008), we make separate Langley plots for each half-day if there are at least 20 observations taken with the same filter, and consider optical air masses between 1.1 and 3.5. Finally, we average the calibration constants obtained over a period of 1–2 months, discarding those corresponding to linear regressions with r2 coefficients of determination below 0.995, and/or above/below 1.20 times the median of the whole ensemble of calibration constants for the whole period.
Performing this Langley calibration procedure at IZO, we can only obtain calibration constants for just two filter wheel positions (nos. 2 and 3), leaving another four positions without characterization due to a lack of measurements at this filter wheel positions. This includes filter wheel position nos. 0 and 1, which are frequently used at high-latitude sites because they correspond to lower attenuations (actually, in position no. 0 no filter is used). To get a more complete calibration for our reference instrument, another Langley calibration is performed, but with less-demanding limits – an extended optical air mass range from 1.1 to 5.5, and a more tolerant value of 0.9 for the r2 coefficient of the linear regression. We have found that this less-demanding calibration produces results for filter nos. 0 to 3, but at the price of a higher uncertainty. In order to retain the lower uncertainty of the more-demanding calibration, from the results of the less-demanding Langley we only use the differences between calibration constants of different filters. When added to the results for filter position nos. 2 and 3 of the more-demanding calibration, these differences allow us to determine calibration constants for filter position nos. 0 and 1. This is thus the calibration of the reference Brewer spectrophotometer that we transfer to other Brewer instruments during intercomparison campaigns.
If the Brewer spectrophotometer to be calibrated is operating at the same place and simultaneously with a reference instrument already producing reliable AOD values, Eq. (4) can be solved for the calibration constant:
Here, the AOD value is provided by the reference instrument, and the remaining data are measured by the Brewer being calibrated. Note that the counts per second I measured by the Brewer being calibrated include all the corrections described in Sect. 2.2. Equation (9) is valid for each simultaneous measurement, with a specific wavelength and filter position. The complete set of calibration constants I0 can thus be determined solving this equation for multiple measurements taken under different conditions.
The last days of the intercomparison campaigns of the RBCC-E, after the Brewer instruments have received maintenance and their ozone calibrations have been updated or confirmed, provide the necessary timespan to carry out this calibration transfer procedure. Measurements within 1 min of the reference instrument are considered simultaneous, and the average of multiple calibration constants for each wavelength and filter position provides the final AOD calibration constants.
In Sect. 3 we will show results for selected Brewer spectrophotometers which took part in both the eighth and tenth intercomparison campaigns of the RBCC-E, held in the years 2013 and 2015, respectively, at El Arenosillo Atmospheric Observatory. Brewer #185, the traveling standard of the IZO triad, was present at both campaigns, and has been used as a reference to calibrate other participating instruments using the calibration transfer method just described. The traveling standard of the RBCC-E itself was calibrated using the Langley plot method, following the procedure described at the beginning of this section.
2.4 Brewer AOD uncertainty
A full analytic derivation of the uncertainty is outside the scope of this paper. However, we will consider here a simplified model, taking into account only the three largest contributions found by Carlund et al. (2017) to the total uncertainty in the UV range for the UVPFR instrument, whose AOD algorithm shares similarities with that of the Brewer. We also assume no correlation between variables, and work within the approximation . This latter approximation is reasonable within the maximum optical air mass value of 3.5 used in the present work, in which case the differences between the various optical air mass terms is ∼1 % at most. A more careful examination of the optical air mass is required in other cases; see Savastiouk and McElroy (2004b).
Taking into account all the above considerations, we write the AOD uncertainty as
where each uncertainty u on the right-hand side includes, if necessary, a factor of 2 to translate from 1σ to 2σ level (GUM, 2008). These uncertainties arise from the following:
-
The ozone optical depth, which has been found by Carlund et al. (2017) to be the largest contribution in the UV range for the UVPFR instrument. Ignoring the correlation between variables, the uncertainty of the ozone optical depth can be approximated by .
-
Calibration, which is the second-largest contribution according to Carlund et al. (2017), and which contributes to the total uncertainty.
-
Pressure, which we keep fixed at a climatological value for each station, thus introducing a term .
For the estimation of the AOD uncertainty, we can assume an average ozone of 340 Dobson units with 1 % uncertainty, values which correspond to Brewer #185 during the tenth intercomparison campaign of the RBCC-E at El Arenosillo. Ozone absorption coefficients for the wavelengths between 310 and 320 nm of Brewer #185 range from 2.31 to 0.67 cm−1, with a 2.1 % uncertainty according to Weber et al. (2016). This results in a 2σ uncertainty of the ozone optical depth between 0.04 and 0.01. The uncertainty associated with the calibration can be approximated by the relative SD of the series of calibration constants calculated in the Langley calibration. In our case, this value is 1 % at the most for all wavelengths and filters. For the pressure term, the Rayleigh coefficients of Brewer #185 at sea level are ∼ 1 at all wavelengths, and we will consider a 1σ uncertainty of 5 hPa.
Within all the approximations considered in this simplified model, the standard AOD uncertainty at the 95 % level is then 0.04–0.02 in the 310–320 nm wavelength range. An analogue calculation produces 0.06 for the standard uncertainty at 306.3 nm. As we will see in Sect. 3.3, there is fair agreement between these values and those determined in the Brewer–UVPFR comparison. Regarding previous works, Kazadzis et al. (2005) reported a 2σ uncertainty of ∼ 0.1 for the Brewer AOD in the UVA range, and Carlund et al. (2017) recently calculated an uncertainty better than 0.02 for the UVPFR instrument operating close to 320 nm.
2.5 Cimel and UVPFR instruments
During the period considered in this work, the Cimel sun photometer model CE318-N was the standard instrument of AERONET. The sun photometer performs automatic direct-sun measurements every 15 min at 340, 380, 440, 500, 675, 870, 940, 1020, and 1640 nm nominal wavelengths with a 1.2∘ field of view. The value of the full width at half maximum (FWHM) is 2 nm. Solar extinction measurements are used to derive spectral AOD and the corresponding Ångström exponent (Holben et al., 1998). The estimated AOD uncertainty is approximately 0.01, increasing up to 0.02 in the UV wavelengths (Eck et al., 1999; Holben et al., 2001). Data acquisition protocols, calibration procedures, and data processing methods have been extensively described; see, e.g., Holben et al. (1998), Dubovik et al. (2000), and Smirnov et al. (2000). We use the highest-quality data set currently available from Cimel sun photometers, the cloud-screened and quality-assured version 2 level 2.0 product downloaded from the AERONET site (http://aeronet.gsfc.nasa.gov). We use the shortest wavelength provided, which is 340 nm, and the 340–440 Ångström exponent to extrapolate to 320 nm, which is the longest wavelength measured by the Brewer in its most usual ozone operational mode.
The UVPFR sun photometer is a special version of the Precision Filter Radiometer (PFR) designed and built at the Physikalisch-Meteorologisches Observatorium Davos and World Radiation Center (PMOD/WRC) in Davos, Switzerland. It measures the direct solar irradiance at the four nominal wavelengths of 305, 311, 318, and 332 nm. The filters and detectors are operated at a constant temperature of 20 ∘C and are exposed to solar radiation only during actual measurements. In order to perform direct sun measurements, the UVPFR is mounted on a solar tracker so that it is continuously pointing to the Sun. Direct sun measurements are taken each full minute and the stored signal values are averages of 10 samples for each channel made over a total duration of 1.25 s. The width of the spectral response functions is in the order of 1.0–1.3 nm at FWHM. Both Langley calibrations and AOD retrievals are affected by the finite FWHMs. Corrections which were used to reduce this influence, together with more detailed information about the UVPFR, are described by Carlund et al. (2017). Where necessary for our comparisons, the UVPFR data at the closest wavelengths to those of the Brewer have been interpolated using the Ångström relationship.
In this section we use data from the eighth and tenth intercomparison campaigns of the RBCC-E, and the period in between, to analyze
-
the precision of the Brewer AOD data, by checking Brewer–Brewer comparisons (Sect. 3.1);
-
the stability of the Brewer as an AOD-measuring instrument over a 2-year period, by comparing Brewer and Cimel data (Sect. 3.2);
-
the uncertainty of the Brewer AOD data, by comparing with Cimel and UVPFR instruments (Sect. 3.2 and 3.3).
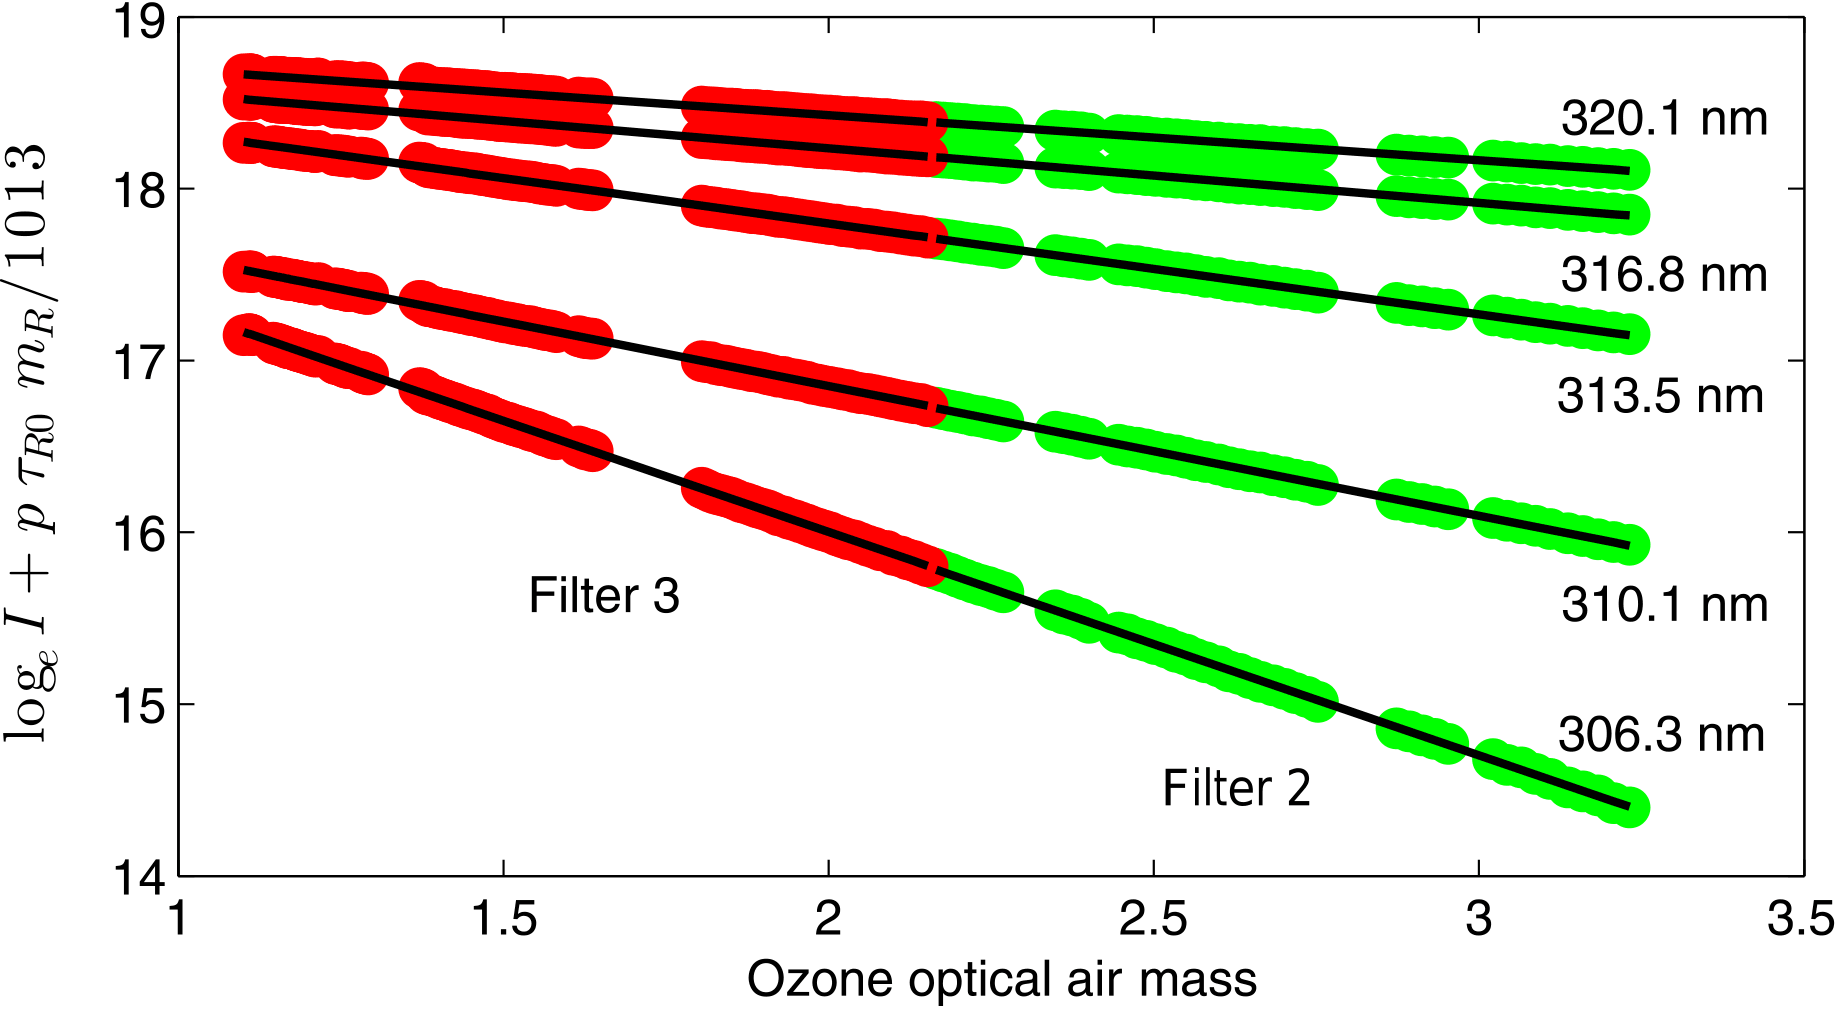
Figure 1Langley plots for the five Brewer wavelengths between 306.3 and 320.1 nm, for measurements taken with filter nos. 2 (green) and 3 (red) of Brewer #185 operating at IZO in the morning of 31 May 2013.
3.1 Precision and Brewer–Brewer comparison
In this section we discuss the calibration of different Brewer spectrophotometers in the year 2013, starting with Brewers #183 and #185, both belonging to the RBCC-E triad based at IZO. These instruments were independently calibrated at IZO via the Langley procedure described in Sect. 2.3, using data from 1 April to 3 June for Brewer #183, and from 7 May to 3 June in the case of Brewer #185. Both instruments were shipped to the eighth intercomparison campaign of the RBCC-E, held in El Arenosillo (Huelva) in June 2013, marking the end of these date ranges. Regarding the starting dates, atmospheric conditions at IZO were not appropriate for the Langley calibration before the beginning of April, and furthermore Brewer #185 experienced instrumental issues in this month, leaving us with roughly 2 months of data for the Langley calibration of Brewer #183 and 1 month for Brewer #185. As an example, Fig. 1 shows the Langley plots for the five wavelengths measured by Brewer #185 on one morning. Because we have considered data for each filter separately, we obtain calibration constants for each wavelength and filter. The difference between the results for different filters is ∼ 1 % at most, showing that the filter correction applied to the data (see Sect. 2.2) removes most of the effect produced by the different attenuation of the different filters.
Table 1Summary of the AOD comparison between Brewer #185 and selected instruments – Brewers #183, #070, #075, #186, #201, and #202, the first also calibrated by the Langley plot method, and the last five by transfer from Brewer #185. We show the ID and model of each instrument, the total number of simultaneous observations within 1 min with Brewer #185, and, for each nominal Brewer wavelength, the Pearson's correlation coefficient between the two AOD data sets and the median and SD of their differences.
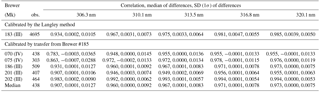
For the four longest wavelengths, the comparison between the independently calibrated Brewers #183 and #185 in Table 1 shows correlation coefficients higher than 0.97, and biases (provided by the median of the Brewer–Brewer AOD differences) and SDs lower than 0.005 and 0.007, respectively. For the lowest wavelength at 306.3 nm, the results are slightly worse, with a correlation of 0.94 and a SD of 0.01. The deterioration of the results at the 306.3 nm wavelength can be explained by the reduction of the signal-to-noise ratio as the wavelength becomes shorter, a trend we observe in all the results presented in this work. Still the biases are rather small at all wavelengths, and both Brewers are of the same model and operate under the same conditions, so the SDs can be considered to be the precision (or instrumental repeatability) at the 1σ level, which ranges from 0.01 at 306.3 nm to 0.005 at 320 nm. Carlund et al. (2017) recently reported a precision of 0.01 (1σ) for both UVPFR and Brewer instruments while measuring AOD in the UV. For Cimel instruments measuring total optical depth, Mitchell and Forgan (2003) provided a 1σ precision of better than 0.0025. Note that this latter result corresponds to the visible range, and the value corresponding to the UV range will likely be larger, as is also the case with the uncertainty of the Cimel instruments, which increases from 0.01 in the visible to 0.02 in the UV range (Eck et al., 1999).
The WMO traceability criteria (WMO/GAW, 2005) can also be used to check the quality of the AOD measured by the Brewer instruments. For finite field-of-view instruments, this criteria requires at least 95 % of the differences between the measurements of two instruments to be within the limits

Figure 2AOD differences between observations within 1 min of the independently calibrated Brewers #183 and #185, plotted as a function of the aerosol optical air mass. The WMO traceability limits for finite field-of-view instruments (Eq. 11) are shown as thick black lines.
Figure 2 shows the differences in AOD for Brewers #183 and #185 as a function of the aerosol optical air mass (which we consider to be equal to the Rayleigh optical air mass; see Sect. 2.2) together with the WMO traceability limits. The percentages of differences within the limits range from 73 % at the shortest wavelength to 93 % at the longest. It has to be noted that the WMO traceability criteria requiring 95 % of the compared data within the limits of Eq. (11) was originally defined for selected wavelengths where the absorption of trace gases is minimal. In this case, UVB AOD differences of 73 to 93 % fulfilling this criterion can be considered quite good. These values are also in the same range as those reported in previous studies involving Brewer instruments. Kouremeti et al. (2014) found percentages between 46 and 88 % when comparing independently calibrated Brewer and Cimel instruments at wavelengths between 306 and 320 nm (extrapolated from 340 nm in the case of the Cimel). Diémoz et al. (2016) calibrated a Mk IV Brewer with respect to a Cimel instrument at 437 nm, finding that 90 % of the observations were within the WMO traceability limit once a temperature correction for the Brewer was included. Carlund et al. (2017) reported percentages between 85.6 and 97 % between UVPFR and Brewer photometers operating in the 306–320 nm range, the Brewer being calibrated using the UVPFR's AOD as reference.
Using the data of the eighth intercomparison campaign of the RBCC-E, held at El Arenosillo (Huelva, Spain) in June 2013, we have been able to transfer the Langley calibration of Brewer #185 to five other instruments, namely Brewers #070 and #186 from Madrid (Spain), #075 from Reading (UK), and #201 from Tamanrasset (Algeria). Furthermore, we also transferred the same calibration to Brewer #202 from Kangerlussuaq (Greenland), which was present at IZO in November 2013. According to the results in Table 1, Brewers #186, #201, and #202 show results similar to Brewer #183, and thus confirm the precision of 0.01–0.005 for the AOD measurement. Instruments #070 and #075 are, however, in worse agreement with the reference, particularly at the shortest measured wavelength. These two Brewer instruments are Mk IV models, while the others (including #183 and #185) are Mk III. Very recently, Carreño et al. (2016) reported that the polarization correction proposed by Cede et al. (2006) might not be adequate for all Brewer models, and these results might point toward this direction. Another source of error may be the lack of a correction for the stray light of the single-grating Mk II and IV Brewer spectrophotometers, although in previous studies this has been found to be a non-issue for the AOD determination (Silva and Kirchhoff, 2004).
3.2 Stability and Brewer–Cimel comparison
In this section we analyze the stability of the Brewer AOD by comparing with Cimel data over ∼ 2 years, from June 2013 to May 2015. We analyze the AOD from Brewer spectrophotometers considered in the previous section, operating at their observation sites. In all cases we compare the Brewer instruments with collocated Cimel sun photometers, except for the Brewer at Reading for which the closest Cimel is located ∼ 60 km away at Chilbolton (Kumharn, 2010).
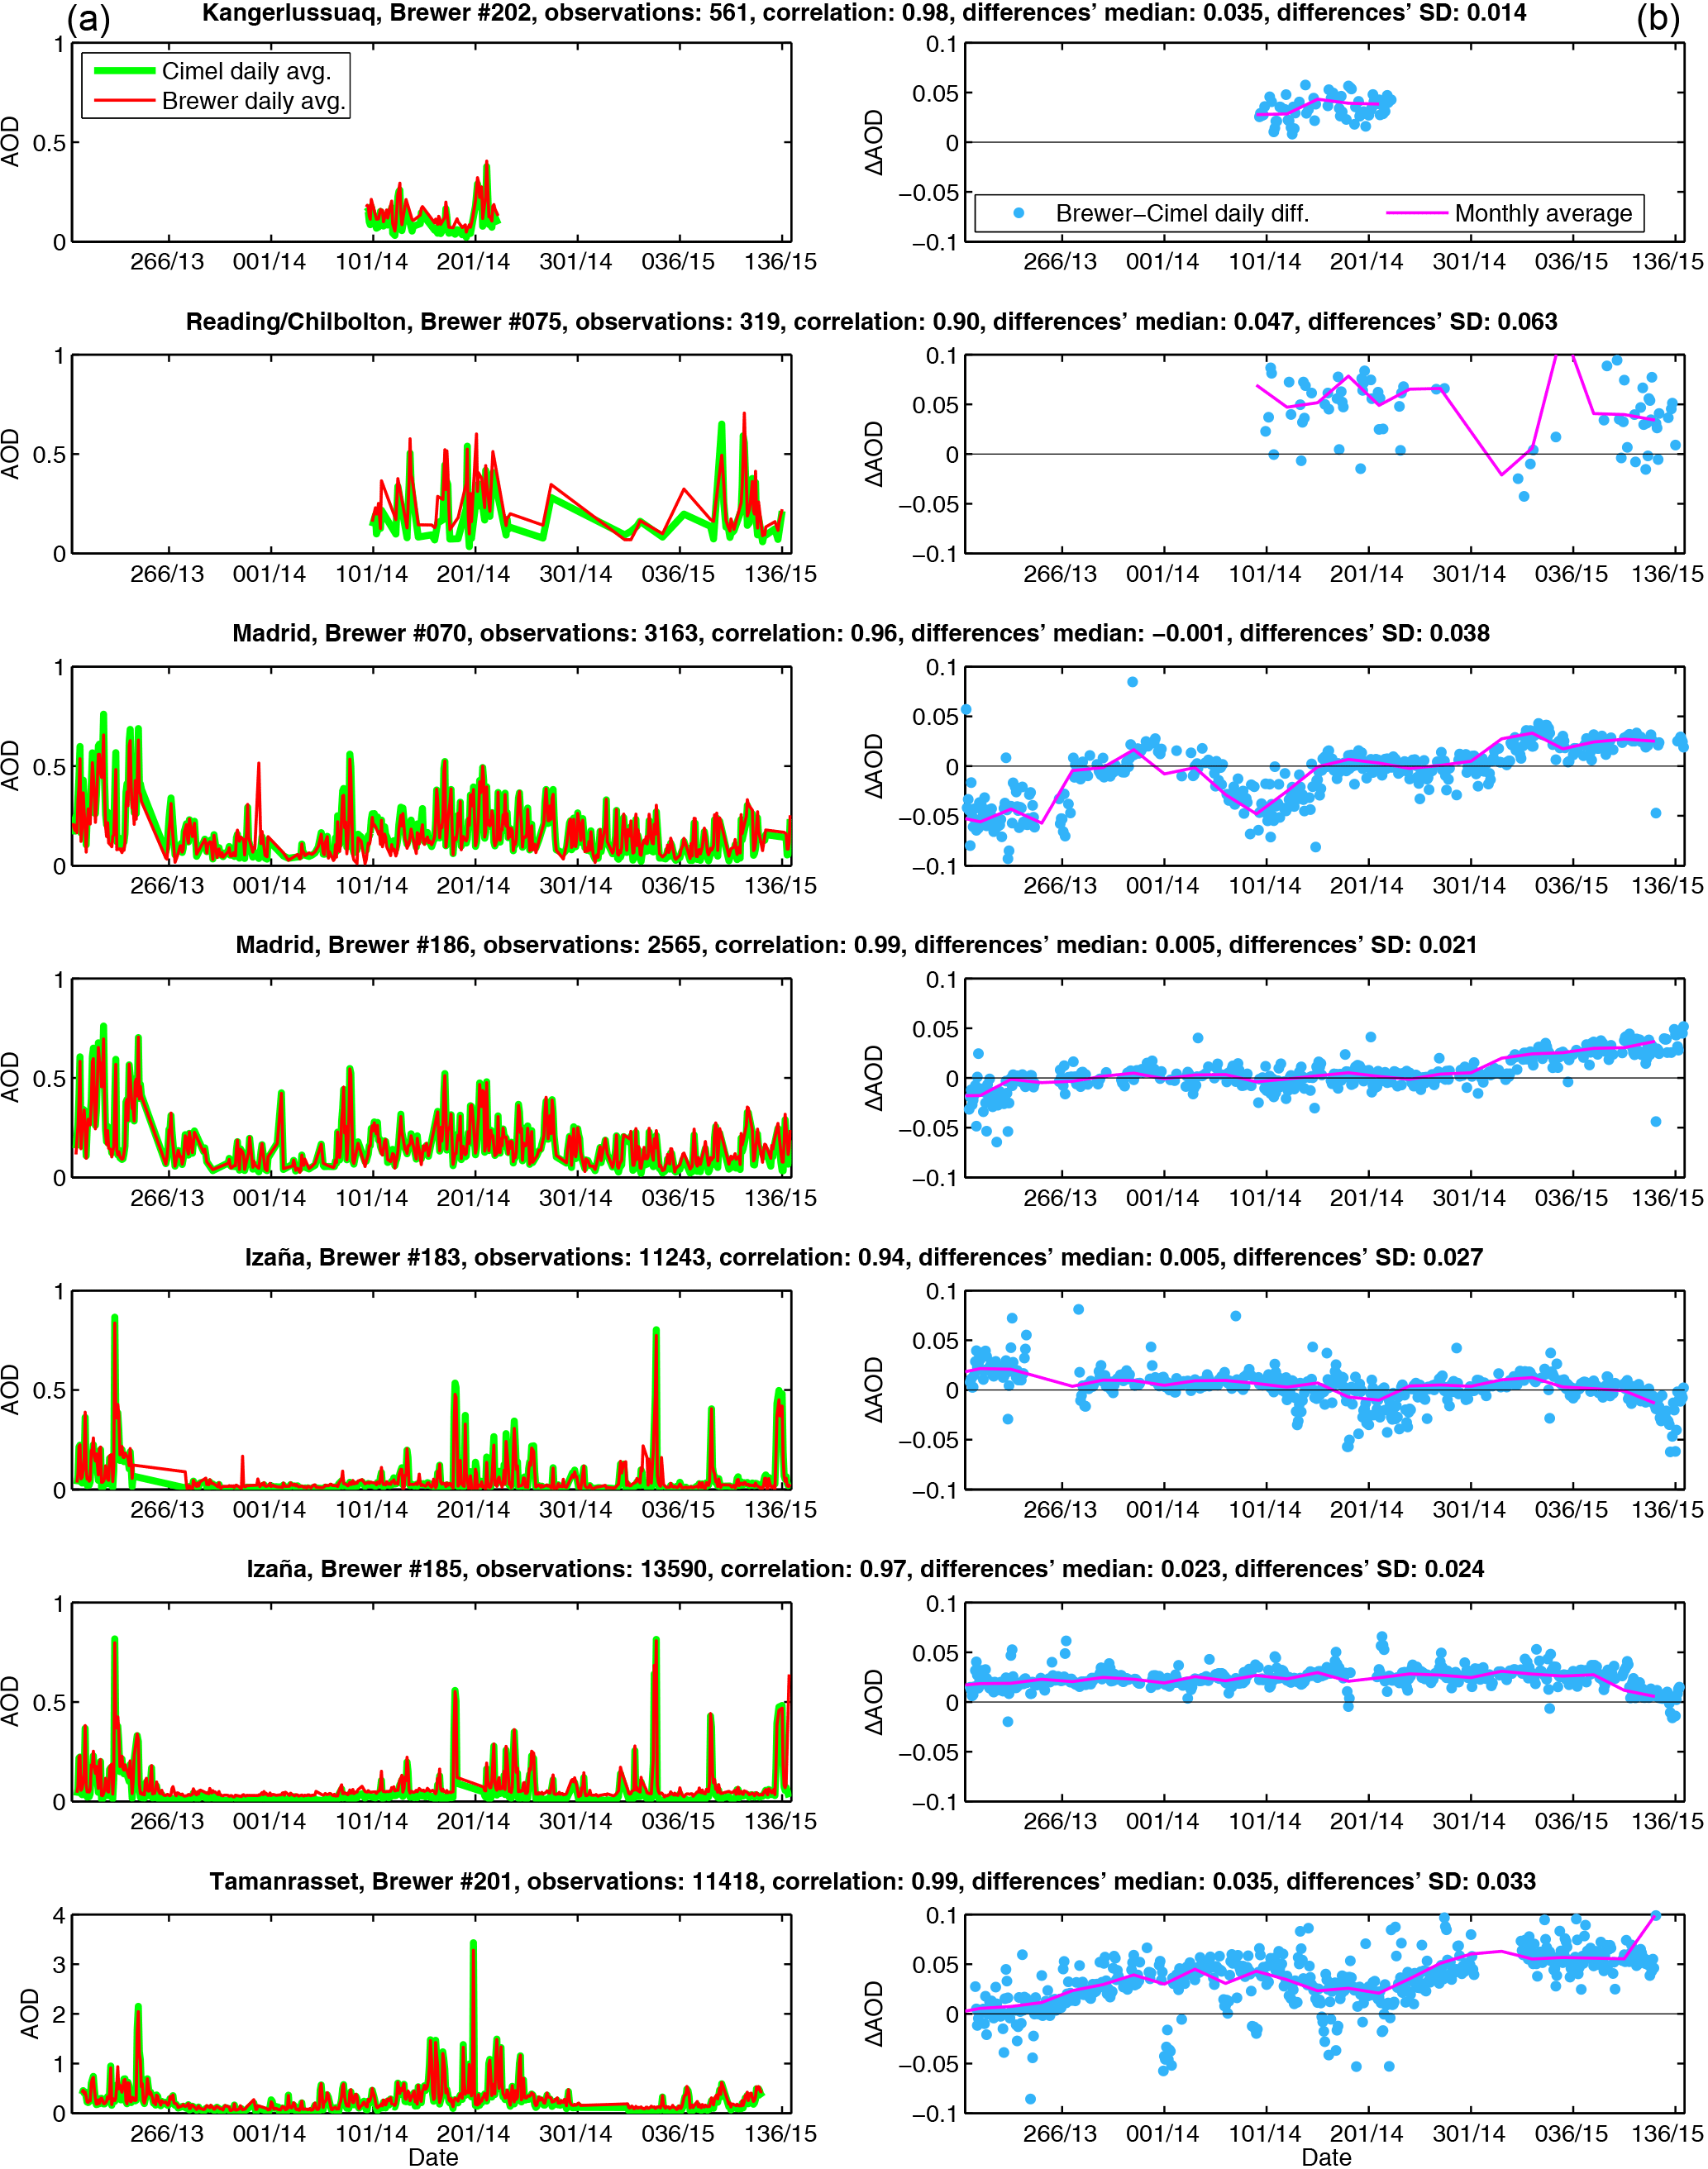
Figure 3Brewer and Cimel AOD for the 2013–2015 period. AOD series shown in the (a) panels correspond to daily averages calculated from Brewer (red) and Cimel (green) observations within 1 min. Daily (blue) and monthly (magenta) averages of AOD differences are shown in (b). For the Brewer we use the data for the longest measured wavelength at 320.1 nm, and for the Cimel, the 340 nm AERONET level 2.0 product extrapolated to 320 nm using the 340–440 Ångström exponent. Note that Brewer #075 operating at Reading is compared to the Cimel sun photometer operating at Chilbolton. The y axes of the figures on the left go up to 1 in all cases except Tamanrasset, for which it reaches a value of 4. Dates on the x axes are shown in DOY/YY format, where DOY is day of year.
Figure 3 summarizes the comparison between the Brewer and Cimel AOD in the 2013–2015 period. As shown by the AOD series, there is clear correlation between the data of both instruments, with correlation coefficients above 0.90. The lowest correlation corresponds to the Reading/Chilbolton data, which also shows the largest spread of Brewer–Cimel differences, in part due to the separation between the Brewer and Cimel sites, and in part due to sporadic data from the Cimel sun photometer. Besides this instrument, Brewers #070 and #201 show the largest changes. The latter operates at Tamanrasset under extreme aerosol conditions with very frequent dust aerosol intrusions, which makes maintenance of the utmost importance (Guirado et al., 2014). Note also that some maintenance issues that do not produce noticeable errors for the determination of TOC might affect the AOD, because the former uses ratios of measurements at different wavelengths, while the latter uses their absolute values. Regarding Brewer #070, in Sect. 3.1 it was found to be one of the instruments in worst agreement with the reference after the calibration transfer. The better behavior of the collocated Brewer #186 in these 2-year comparison points to a bad calibration and/or to maintenance issues as possible reasons for the instability of Brewer #070 AOD data. Of the remaining instruments, Brewers #183, #185, and #186 remain within the initial Brewer–Cimel AOD difference for a period of at least ∼ 1.5 years, from June 2013 to November 2014. The rather good stability of these instruments proves that it is possible to provide quality AOD data when the instrument maintenance is properly performed. It should be noted that Brewer intercomparison campaigns are held every 2 years, fairly close to the 1.5-year stability period mentioned, and provide an opportunity to verify, provide maintenance, and recalibrate the instruments for AOD operation if necessary.
Although we expect the extrapolated Cimel data to provide a good and stable reference for comparison with the Brewer AOD, the uncertainties introduced by the extrapolation, as well as the change of Brewer AOD calibration over the 2-year period, preclude any precise determination of the Brewer uncertainty from the data presented in this section. Still, assuming as in Mitchell and Forgan (2003) that the biases are a systematic error which can be corrected (by using, e.g., a different formula of the ozone absorption coefficients or a different pressure value), the SD of the Brewer–Cimel difference for the three most stable instruments in Fig. 3 results in a standard uncertainty at the 95 % (2σ) level (see, e.g., GUM, 2008) of ∼ 0.05. From this value and accepting the 2σ uncertainty of 0.02 for the Cimel in the UV mentioned in Sect. 2.5, the uncertainty of the Brewer would be almost 0.05 at 320 nm. In the next section we compare our Brewer AOD with that of an UVPFR instrument.
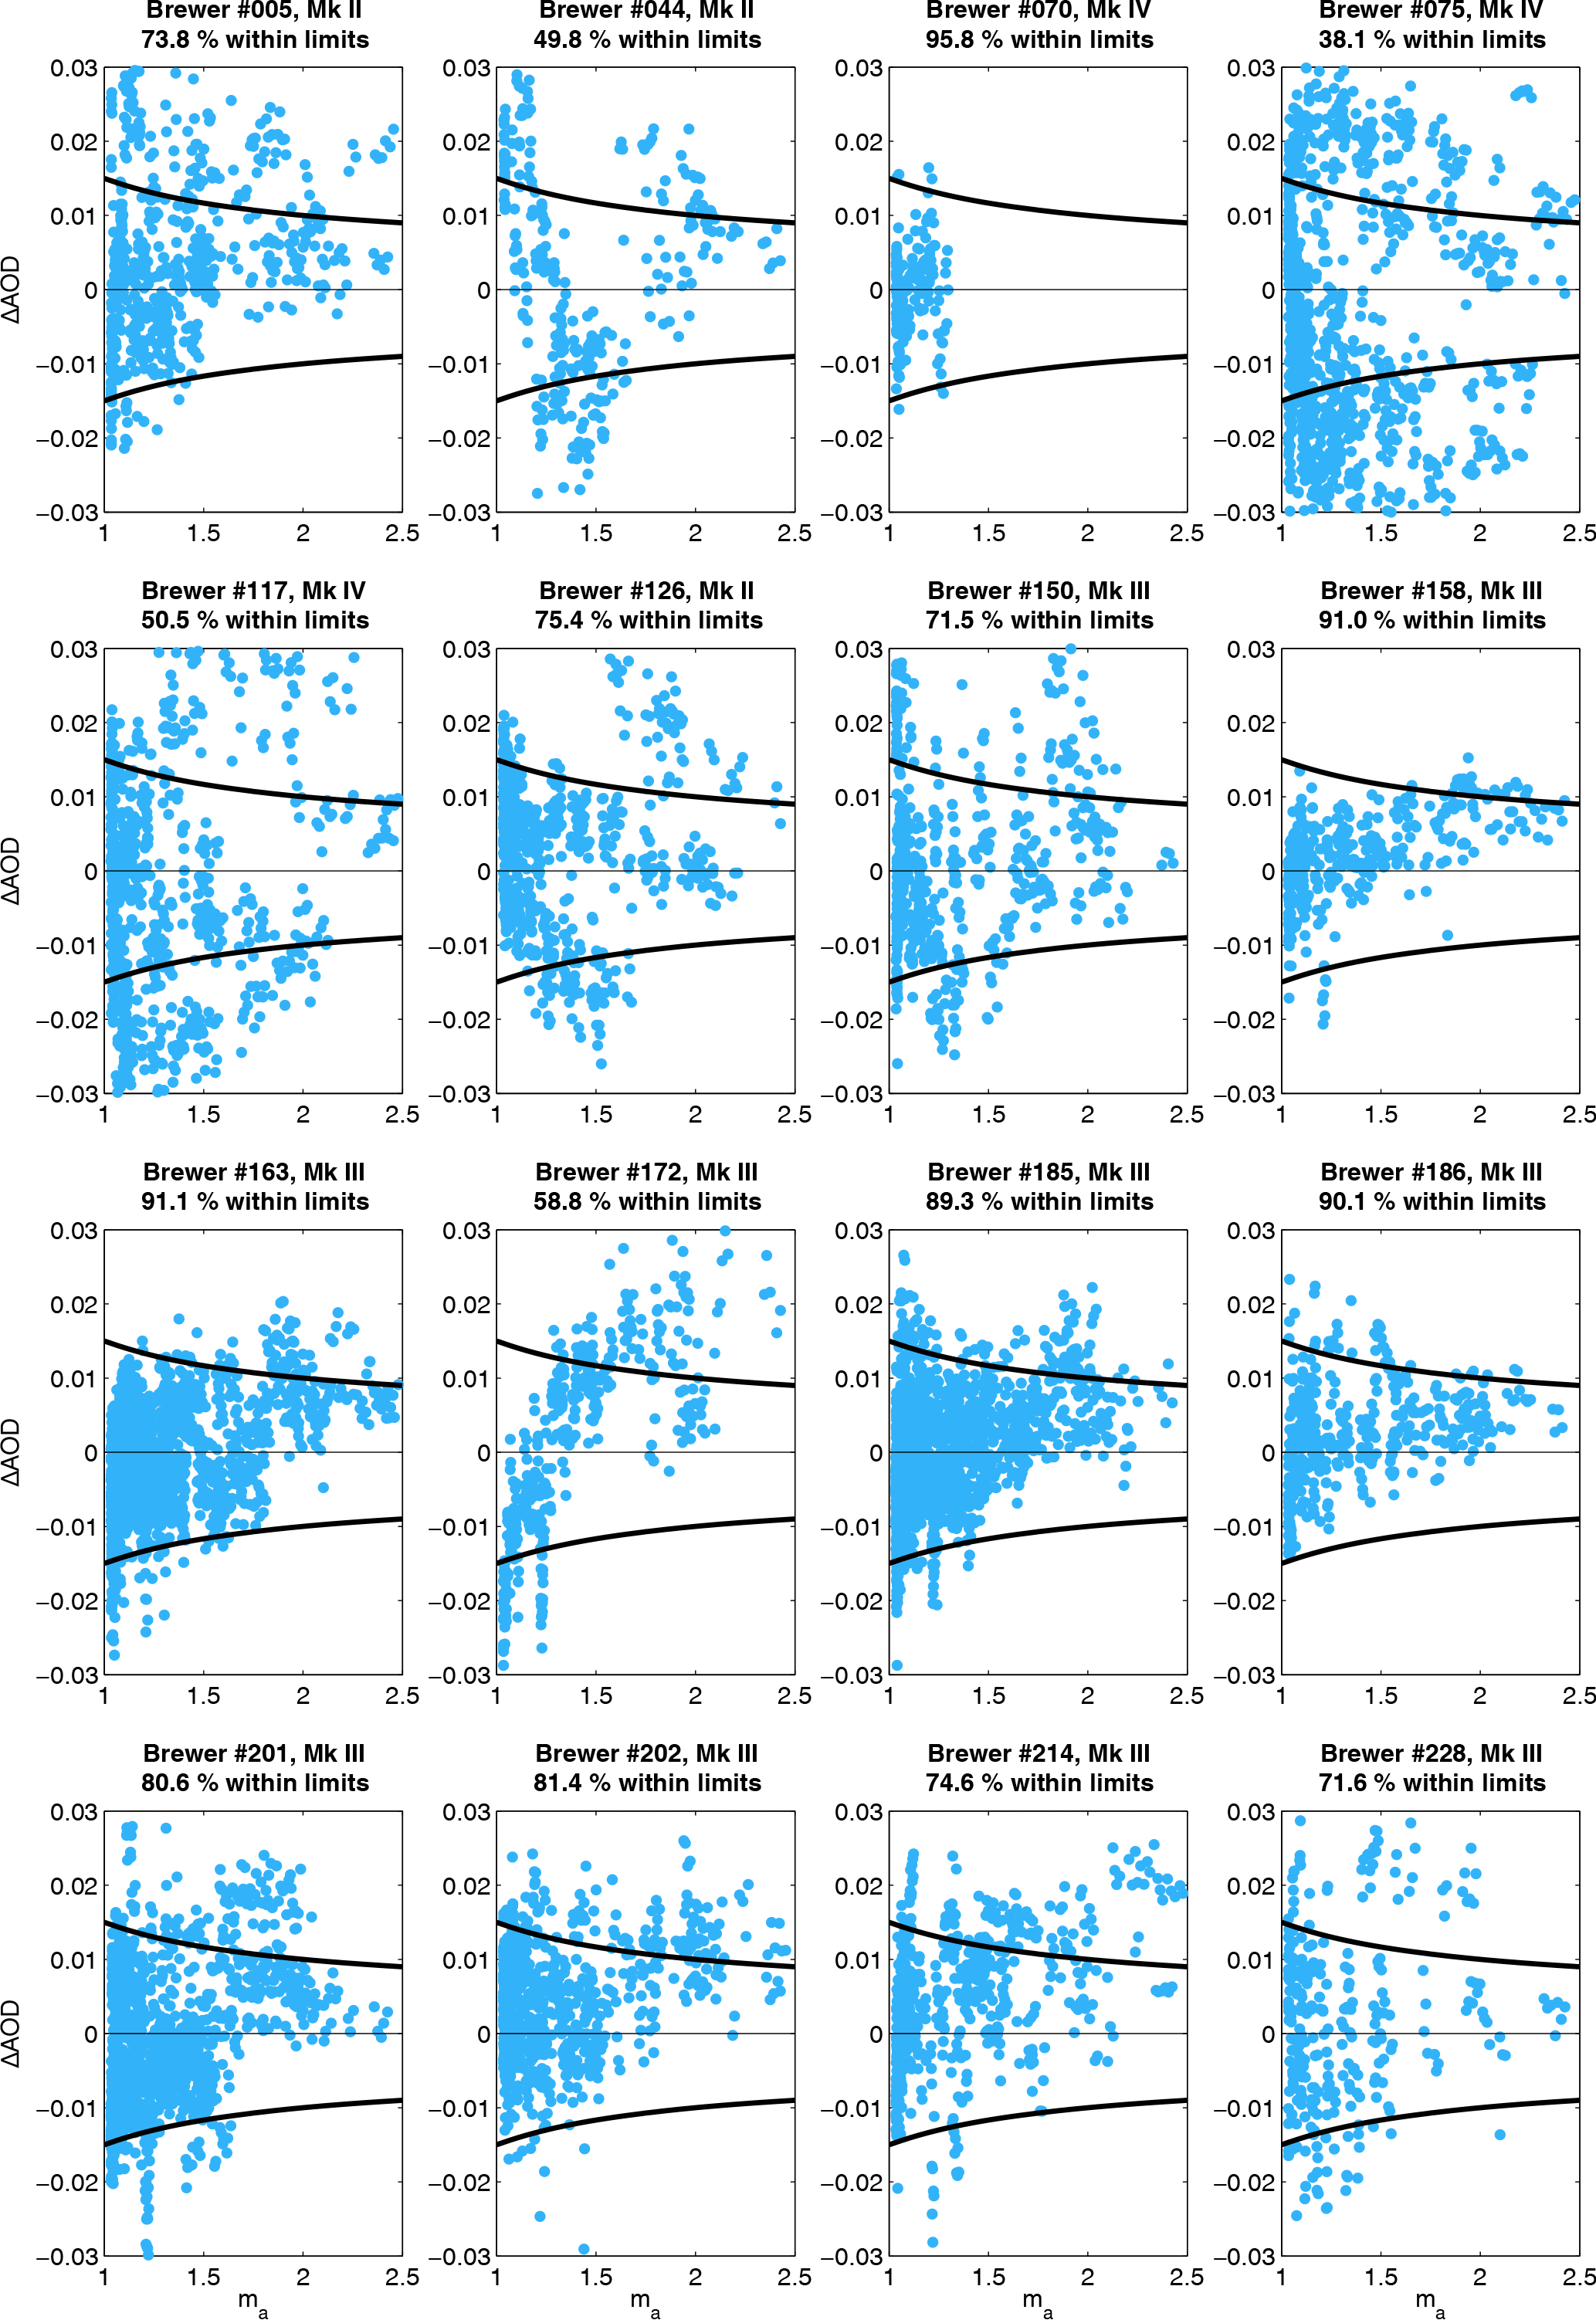
Figure 4AOD differences, for observations within 1 min at 313.5 nm, between the Brewer instruments and the UVPFR during the tenth intercomparison campaign of the RBCC-E, plotted as a function of the aerosol optical air mass. The UVPFR data have been interpolated from those at wavelengths 311.3 and 317.5 nm using the Ångström relationship. The WMO traceability limits for finite field-of-view instruments (Eq. 11) are shown as thick black lines.
3.3 Uncertainty and Brewer–UVPFR comparison
A better experimental determination of the uncertainty can be derived from the comparison with the UVPFR sun photometer, independently calibrated and operated by the PMOD/WRC at the tenth intercomparison campaign of the RBCC-E, held at El Arenosillo in May–June 2015. We present results for 16 of the Brewer instruments present, including reference Brewer #185 from the IZO triad. As in the case of the eighth intercomparison campaign, Brewer #185 was calibrated using the Langley plot method at IZO before the campaign, and this calibration was then transferred to the other Brewer spectrophotometers using simultaneous data acquired after the instruments had received maintenance at the campaign.
The plots of the Brewer–UVPFR AOD differences vs. the aerosol optical air mass in Fig. 4 show that some Brewer instruments, like #044 and #172, largely deviate from the expected 1∕ma behavior of the differences (Mitchell and Forgan, 2003), while others such as #075 and #117 show a large spread of the data. Both issues might be related either to problems not solved by the maintenance performed during the campaign or to effects not fully considered in our AOD determination method, such as the different polarization corrections required by the different Brewer models. It should also be noted that our method currently only includes one data-quality filter specific to AOD, and this may be insufficient to remove all outliers. Overall, though, Fig. 4 shows a reasonably good agreement between the Brewer and UVPFR instruments, with percentages of differences within the WMO traceability limits similar to those presented in Sect. 3.1. AOD differences with respect to reference Brewer #185 are fairly similar to those shown in Fig. 4, although in the comparison with the UVPFR the differences seem to increase with the optical air mass, something that does not happen in the Brewer–Brewer comparisons.
Table 2Comparison between the AOD data of the Brewer and UVPFR instruments at the tenth intercomparison campaign of the RBCC-E. We use data from observations within 1 min and show the same statistics as in Table 1.
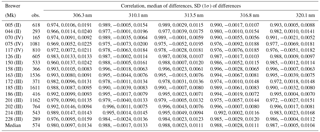
Table 2 summarizes the comparison between the Brewer and UVPFR data within 1 min at the five standard Brewer ozone wavelengths. As before, the shortest wavelength shows slightly worse results than the other four. At 306.3 nm, correlation coefficients are above 0.96, and biases and SDs below 0.015 and 0.024, respectively. In the range of 310.1 to 320.1 nm, correlations are above 0.97, and biases and SDs are lower than 0.009 and 0.020, respectively.
The uncertainty of the Brewer AOD can be obtained from the SDs in Table 2 and the uncertainty of the UVPFR. Care must be taken, however, to include the effect of terms common to the Brewer and UVPFR AOD. Among these, the largest according to Carlund et al. (2017) is the ozone optical depth τo. Taking into consideration only this term, the 2σ uncertainty of the Brewer AOD can then be written as
The SD σ of the Brewer–UVPFR difference for Brewer #185 at wavelengths between 310.1 and 320.1 nm contributes (2⋅0.01)2 to the total squared uncertainty. For the uncertainty of the ozone optical depth, we can use the same values calculated in Sect. 2.4. Finally, for the UVPFR, Carlund et al. (2017) reports a 2σ uncertainty between 0.04 and 0.02 in this range of wavelengths. All this points to a 2σ uncertainty between 0.04 and 0.01 for the Brewer AOD in the range of wavelengths from 310.1 to 320.1 nm. For 306.3 nm, the same calculation yields an uncertainty of 0.05. These values are fairly close to the ones found in our analytical derivation in Sect. 2.4.
Despite the generally good results shown in the previous section for our AOD determination method, there are multiple improvements that could be introduced in three different aspects: data processing, input data, and instrumental characterization. Regarding the data processing, note that besides the ozone-specific filters to mainly remove observations under cloudy conditions, only one AOD-specific filter is included in our AOD algorithm. This AOD filter is based on the SD of five consecutive observations and is expected to remove measurements affected by fast-moving clouds (Gröbner and Meleti, 2004). Further cloud-detection methods and filters used to remove measurements under cloudy conditions should be devised and implemented to improve the quality of the Brewer AOD product. This will require a more extensive analysis of the AOD data from the whole EUBREWNET network. Furthermore, optical air mass limits specific to each Brewer model can be implemented. This would specially benefit Mk III instruments (which are largely free from stray-light issues) operating at high latitudes.
With regard to the data used as input, first it should be noted that our AOD is currently produced in real time and as such uses the highest-quality real-time data available in EUBREWNET, namely the ozone level 1.5 product. Once the configuration of a Brewer instrument issued in one campaign has been validated in the next one, a level 2.0 ozone product is produced at EUBREWNET. We plan to implement an AOD product which will use these validated ozone values instead of the real-time data. A second point to consider is that currently the AOD algorithm uses the same pressure value used in the determination of the ozone, which is the climatological value for the station where the Brewer operates. A 2σ uncertainty of 10 hPa in the pressure leads to ∼ 0.01 added uncertainty in the Brewer AOD at the UV wavelengths, which is approximately half the uncertainty we considered for the calibration. Using a pressure value measured in situ would be thus advisable, although this would require adding further hardware and software infrastructure to the EUBREWNET network. A faster and easier-to-implement alternative would be to use the pressure data provided by any of the reanalysis products available, as in AERONET's Version 2 Direct Sun Algorithm. Likewise, the ozone layer height is currently fixed at 22 km, also the same value used in the default ozone determination carried out by the Brewer. This could be improved by using a specific value for each latitude, as in AERONET's algorithm. Finally, note that we currently use data from wavelengths between 306 and 320 nm because they are available from the standard ozone measurements. However, it is planned to implement an AOD-specific measurement routine in selected Brewers of the EUBREWNET network which will allow one to determine the AOD at longer wavelengths, including 340 and 354 nm. Note that extending the wavelength measurement range will likely require changes in our Langley calibration method, because ozone will stop being the largest contribution to the extinction. Besides the scientific interest, extending the measurement range will also allow for a better comparison with data from the AERONET network and satellite products from, e.g., the Ozone Monitoring Instrument (OMI).
Regarding the characterization of the Brewer instruments, an important first point which requires further analysis is the relationship between the TOC and AOD calibrations, and more specifically which hardware changes in the Brewer instruments affect one or both retrieval-related calibrations. Going into more specific details, our results indicate that improvements in the current polarization correction and taking stray-light effects into consideration might be necessary. Our polarization correction is applied to data from all Brewer models taken at solar zenith angles greater than 55∘. However, Carreño et al. (2016) reported very recently different polarization corrections depending on the Brewer model. Furthermore, these authors have also investigated the polarization at measurement angles below 35∘, finding that a small but non-negligible correction might also be necessary. Further study is also necessary to characterize the uncertainty and correction needed by the stray light produced by the scattering on the single grating of Mk II and IV Brewer spectrophotometers (Karppinen et al., 2015). Finally, it should be noted that currently the temperature correction coefficients provided by the RBCC-E for the ozone calculation are also used in the present implementation of the Brewer AOD algorithm. These coefficients are relative to the value calculated for the shortest wavelength, but in the case of the AOD determination they should be absolute values because data for each wavelength are used individually. The determination of the absolute temperature coefficients is currently under study (Berjón et al., 2016).
In this work we have presented results of the AOD retrieval for selected instruments participating in EUBREWNET. We have considered the wavelengths between 306 and 320 nm, which correspond to the common range for all Brewer models operating in ozone-measurement mode. Both historical and near-real-time data are already available at EUBREWNET's data server in these wavelengths, and could be used to determine the AOD at most sites taking part in the network. Furthermore, Mk IV Brewer models routinely measure in the visible range up to 450 nm, and Mk III models can reach 360 nm with specific measurement programs, so it would be possible to determine the AOD in an extended wavelength range, thus providing a more complete characterization of aerosols.
As we have shown, a well-maintained and calibrated Brewer instrument is capable of measuring AOD with a precision of 0.005 and an uncertainty of 0.04 in the UV range from 310 to 320 nm, with the corresponding values for 306 nm being slightly worse, 0.01 and 0.05, respectively. Comparison between the data from Brewer and collocated Cimel instruments over a 2-year period shows that Brewer spectrophotometers are relatively stable and can be considered reliable AOD-measuring instruments. Indeed, good maintenance carried out regularly at their operational sites and during intercomparison campaigns might result in almost the same stability as in their usual ozone-measurement role.
The European Brewer Network can thus provide reliable aerosol data across Europe and adjacent areas (plus some more distant locations in, e.g., South America and Australia) in near-real time and over an extended wavelength range. The availability of these data together with those of ozone and UV irradiance already available at its data server will confirm the status of EUBREWNET as a key source of scientific information.
The implementation of the present AOD algorithm in EUBREWNET's data server is expected in the upcoming months. Once functional, AOD data for the Brewer spectrophotometers calibrated at the intercomparison campaigns of the RBCC-E will be available in near-real time.
Equation (4) is written in the standard terms used in optical depth calculations. However, the code used by Brewer spectrophotometers works in an internal, base 10 logarithmic space further multiplied by 104. If variables defined within this internal space are used, the AOD equation for a specific wavelength then becomes
Note that the total ozone column is now in Dobson units, and that the ozone absorption coefficients are usually provided divided by 10 (hence the 10 multiplicative factor in its term).
The authors declare that they have no conflict of interests.
This article is part of the special issue “Quadrennial Ozone Symposium 2016 – Status and trends of atmospheric ozone (ACP/AMT inter-journal SI)”. It is a result of the Quadrennial Ozone Symposium 2016, Edinburgh, United Kingdom, 4–9 September 2016.
This article is based upon work from the COST Action ES1207 “The European
Brewer Network” (EUBREWNET), supported by COST (European Cooperation in
Science and Technology). Part of this work has been developed within the
IDEAS+ project of the European Space Agency, in collaboration with
LuftBlick Earth Observation Technologies. This work has been supported by the
European Metrology Research Programme (EMRP) within the joint research
project ENV59 “Traceability for atmospheric total column ozone” (ATMOZ).
The EMRP is jointly funded by the EMRP participating countries within EURAMET
and the European Union. These activities have been partially developed in the
WMO-CIMO Testbed for Aerosols and Water Vapor Remote Sensing Instruments
(Izaña, Spain). We also acknowledge the support of the Ministry of Economy
and Competitiveness of Spain and the European Regional Development Fund
(ERDF) under the AEROATLAN project (CGL2015-66299-P). Thomas Carlund was
supported through grant no. C14.0025 from the Swiss Staatssekretariat
für Bildung, Forschung und Innovation (SBFI) within COST Action ES1207.
Juan J. Rodriguez-Franco gratefully acknowledges the support from COST Action
ES1207 to conduct a short-term scientific mission at the PMOD/WRC. Carmen
Guirado-Fuentes acknowledges the funding from the POLARMOON project
(CTM2015-66742-R) of the Spanish MINECO. Stratospheric ozone and spectral UV
baseline monitoring in the UK has been supported by DEFRA, The Department for the
Environment, Food, and Rural Affairs, since 2003. We thank Juan R. Moreta Gonzalez, Judith Jeffery, Emilio Cuevas, and Brent Holben for their effort in
establishing and maintaining the Madrid, Chilbolton, Izaña, Tamanrasset,
and Kangerlussuaq AERONET sites. The AERONET sun photometers at the Madrid,
Chilbolton, Izaña, and Tamanrasset stations have been calibrated within the
AERONET Europe TNA, supported by the European Community Research
Infrastructure Action under the Horizon 2020 research and innovation program,
ACTRIS-2 grant agreement no. 654109.
Edited by:
Stefan Reis
Reviewed by: Vladimir Savastiouk and two anonymous
referees
Ångström, A.: Apparent solar constant variations and their relation to the variability of atmospheric transmission, Tellus, 22, 205–218, https://doi.org/10.3402/tellusa.v22i2.10215, 1970. a
Arola, A. and Tapani, K.: On the sources of bias in aerosol optical depth retrieval in the UV range, J. Geophys. Res., 109, D08209, https://doi.org/10.1029/2003JD004375, 2004. a
Bais, A. F.: Absolute spectral measurements of direct solar ultraviolet irradiance with a Brewer spectrophotometer, Appl. Optics, 36, 5199–5204, https://doi.org/10.1364/AO.36.005199, 1997. a
Bais, A. F., McKenzie, R. L., Bernhard, G., Aucamp, P. J., Ilyas, M., Madronich, S., and Tourpali, K.: Ozone depletion and climate change: impacts on UV radiation, Photoch. Photobio. Sci., 14, 19–52, https://doi.org/10.1039/c4pp90032d, 2015. a
Berjón, A., Redondas, A., Sildoja, M., Nevas, S., Carreño, V., Santana-Díaz, D., Hernández-Cruz, B., León-Luis, S., and López-Solano, J.: Characterization of the Temperature Dependence of Brewer Spectrophotometer, available at: https://presentations.copernicus.org/QOS2016-110_presentation.pdf (last access: 12 March 2018), 2016. a
Carlund, T., Kouremeti, N., Kazadzis, S., and Gröbner, J.: Aerosol optical depth determination in the UV using a four-channel precision filter radiometer, Atmos. Meas. Tech., 10, 905–923, https://doi.org/10.5194/amt-10-905-2017, 2017. a, b, c, d, e, f, g, h, i, j, k, l
Carreño, V., Diémoz, H., León-Luis, S., López-Solano, J., Hernández-Cruz, B., Berjón, A., Santana-Díaz, D., Rodríguez Valido, M., and Redondas, A.: Brewer Direct Irradiance Measurements: Polarization Effects and Model Simulation, available at: http://presentations.copernicus.org/QOS2016-225_presentation.pdf (last access: 12 March 2018), 2016. a, b
Carvalho, F. and Henriques, D. V.: Use of Brewer ozone spectrophotomer for aerosol optical depth measurements on ultraviolet region, Adv. Space Res., 25, 997–1006, 2000. a
Cede, A., Kazadzis, S., Kowalewski, M., Bais, A., Kouremeti, N., Blumthaler, M., and Herman, J.: Correction of direct irradiance measurements of Brewer spectrophotometers due to the effect of internal polarization, Geophys. Res. Lett., 33, L02806, https://doi.org/10.1029/2005GL024860, 2006. a, b
Cheymol, A. and De Backer, H.: Retrieval of the aerosol optical depth in the UV-B at Uccle from Brewer ozone measurements over a long time period 1984-2002, J. Geophys. Res.-Atmos., 108, 13-1–13-10, https://doi.org/10.1029/2003JD003758, 2003. a
Cuevas, E., Milford, C., Bustos, J. J., del Campo-Hernández, R., García, O. E., García, R. D., Gómez-Peláez, A. J., Ramos, R., Redondas, A., Reyes, E., Rodríguez, S., Romero-Campos, P. M., Schneider, M., Belmonte, J., Gil-Ojeda, M., Almansa, F., Alonso-Pérez, S., Barreto, A., González-Morales, Y., Guirado-Fuentes, C., López-Solano, C., Afonso, S., Bayo, C., Berjón, A., Bethencourt, J., Camino, C., Carreño, V., Castro, N. J., Cruz, A. M., Damas, M., De Ory-Ajamil, F., García, M. I., Fernández-de Mesa, C. M., González, Y., Hernández, C., Hernández, Y., Hernández, M. A., Hernández-Cruz, B., Jover, M., Kühl, S. O., López-Fernández, R., López-Solano, J., Peris, A., Rodriguez-Franco, J. J., Sálamo, C., Sepúlveda, E., and Sierra, M.: Izaña Atmospheric Research Center Activity Report 2012–2014, no. 219 in: GAW Report, State Meteorological Agency (AEMET), Madrid, Spain, and World Meteorological Organization, Geneva, Switzerland, available at: http://www.wmo.int/pages/prog/arep/gaw/documents/Final_GAW_Report_No_219.pdf (last access: 12 March 2018), 2015. a
De Bock, V., De Backer, H., Mangold, A., and Delcloo, A.: Aerosol Optical Depth measurements at 340 nm with a Brewer spectrophotometer and comparison with Cimel sunphotometer observations at Uccle, Belgium, Atmos. Meas. Tech., 3, 1577–1588, https://doi.org/10.5194/amt-3-1577-2010, 2010. a
De Bock, V., De Backer, H., Van Malderen, R., Mangold, A., and Delcloo, A.: Relations between erythemal UV dose, global solar radiation, total ozone column and aerosol optical depth at Uccle, Belgium, Atmos. Chem. Phys., 14, 12251–12270, https://doi.org/10.5194/acp-14-12251-2014, 2014. a
Diémoz, H., Eleftheratos, K., Kazadzis, S., Amiridis, V., and Zerefos, C. S.: Retrieval of aerosol optical depth in the visible range with a Brewer spectrophotometer in Athens, Atmos. Meas. Tech., 9, 1871–1888, https://doi.org/10.5194/amt-9-1871-2016, 2016. a, b
Dubovik, O., Smirnov, A., Holben, B. N., King, M. D., Kaufman, Y. J., Eck, T. F., and Slutsker, I.: Accuracy assessments of aerosol optical properties retrieved from Aerosol Robotic Network (AERONET) Sun and sky radiance measurements, J. Geophys. Res., 105, 9791–9806, https://doi.org/10.1029/2000JD900040, 2000. a
Eck, T. F., Holben, B. N., Reid, J. S., Dubovik, O., Smirnov, A., O'Neill, N. T., Slutsker, I., and Kinne, S.: Wavelength dependence of the optical depth of biomass burning, urban, and desert dust aerosol, J. Geophys. Res., 104, 31333–31350, https://doi.org/10.1029/1999JD900923, 1999. a, b
García, M. I., Rodríguez, S., and Alastuey, A.: Impact of North America on the aerosol composition in the North Atlantic free troposphere, Atmos. Chem. Phys., 17, 7387–7404, https://doi.org/10.5194/acp-17-7387-2017, 2017. a
Gröbner, J. and Kerr, J. B.: Ground-based determination of the spectral ultraviolet extraterrestrial solar irradiance: providing a link between space-based and ground-based solar UV measurements, J. Geophys. Res.-Atmos., 106, 7211–7217, https://doi.org/10.1029/2000JD900756, 2001. a
Gröbner, J. and Meleti, C.: Aerosol optical depth in the UVB and visible wavelength range from Brewer spectrophotometer direct irradiance measurements: 1991–2002, J. Geophys. Res., 109, D09202, https://doi.org/10.1029/2003JD004409, 2004. a, b, c
Gröbner, J., Vergaz, R., Cachorro, V. E., Henriques, D. V., Lamb, K., Redondas, A., Vilaplana, J. M., and Rembges, D.: Intercomparison of aerosol optical depth measurements in the UVB using Brewer spectrophotometers and a Li-Cor spectrophotometer, Geophys. Res. Lett., 28, 1691–1694, 2001. a
Guirado, C., Cuevas, E., Cachorro, V. E., Toledano, C., Alonso-Pérez, S., Bustos, J. J., Basart, S., Romero, P. M., Camino, C., Mimouni, M., Zeudmi, L., Goloub, P., Baldasano, J. M., and de Frutos, A. M.: Aerosol characterization at the Saharan AERONET site Tamanrasset, Atmos. Chem. Phys., 14, 11753–11773, https://doi.org/10.5194/acp-14-11753-2014, 2014. a
GUM: Evaluation of Measurement Data – Guide to the Expression of Uncertainty in Measurement, available at: http://www.bipm.org/utils/common/documents/jcgm/JCGM_100_2008_E.pdf (last access: 12 March 2018), 2008. a, b
Harrison, L. and Michalsky, J.: Objective algorithms for the retrieval of optical depths from ground-based measurements, Appl. Optics, 33, 5126–5132, https://doi.org/10.1364/AO.33.005126, 1994. a
Holben, B. N., Eck, T. F., Slutsker, I., Tanré, D., Buis, J. P., Setzer, A., Vermote, E., Reagan, J. A., Kaufman, Y. J., Nakajima, T., Lavenu, F., Jankowiak, I., and Smirnov, A.: AERONET – a federated instrument network and data archive for aerosol characterization, Remote Sens. Environ., 66, 1–16, https://doi.org/10.1016/S0034-4257(98)00031-5, 1998. a, b
Holben, B. N., Tanré, D., Smirnov, A., Eck, T. F., Slutsker, I., Abuhassan, N., Newcomb, W. W., Schafer, J. S., Chatenet, B., Lavenu, F., Kaufman, Y. J., Vande Castle, J., Setzer, A., Markham, B., Clark, D., Frouin, R., Halthore, R., Karneli, A., O'Neill, N. T., Pietras, C., Pinker, R. T., Voss, K., and Zibordi, G.: An emerging ground-based aerosol climatology: aerosol optical depth from AERONET, J. Geophys. Res., 106, 12067–12097, https://doi.org/10.1029/2001JD900014, 2001. a
IPCC: Climate Change 2013: The Physical Science Basis: Working Group I Contribution to the IPCC Fifth Assessment Report, Cambridge University Press, Cambridge, available at: http://www.ipcc.ch/report/ar5/wg1/ (last access: 12 March 20118), 2014. a
Iqbal, M.: An Introduction to Solar Radiation, Academic Press, 1983. a, b
Karppinen, T., Redondas, A., García, R. D., Lakkala, K., McElroy, C. T., and Kyrö, E.: Compensating for the effects of stray light in single-monochromator Brewer spectrophotometer ozone retrieval, Atmos. Ocean, 53, 66–73, https://doi.org/10.1080/07055900.2013.871499, 2015. a, b, c
Kazadzis, S., Bais, A., Kouremeti, N., Gerasopoulos, E., Garane, K., Blumthaler, M., Schallhart, B., and Cede, A.: Direct spectral measurements with a Brewer spectroradiometer: absolute calibration and aerosol optical depth retrieval, Appl. Optics, 44, 1681–1690, https://doi.org/10.1364/AO.44.001681, 2005. a, b
Kazadzis, S., Bais, A., Amiridis, V., Balis, D., Meleti, C., Kouremeti, N., Zerefos, C. S., Rapsomanikis, S., Petrakakis, M., Kelesis, A., Tzoumaka, P., and Kelektsoglou, K.: Nine years of UV aerosol optical depth measurements at Thessaloniki, Greece, Atmos. Chem. Phys., 7, 2091–2101, https://doi.org/10.5194/acp-7-2091-2007, 2007. a
Kerr, J. B.: The Brewer Spectrophotometer, in: UV Radiation in Global Climate Change, 160–191, Springer, New York, 2010. a
Kiedron, P. and Stierle, S.: Rayleigh Optical Depths used by Brewer, Tech. rep., NOAA-EPA Brewer Spectrophotometer UV and Ozone Network, available at: http://www.esrl.noaa.gov/gmd/grad/neubrew/docs/RayleighInBrewer.pdf (last access: 12 March 2018), 2009. a
Kipp and Zonen: Brewer MkIII Spectrophotometer Operators manual, 2014. a, b
Kouremeti, N., Gröbner, J., and Redondas, A.: Aerosol optical depth in the UV spectral region retrieved by filter sunphotometers and a Brewer spectroradiometer, in: 12 International Conference of Meteorology, Climatology and Physics of the Atmosphere, Heraklion, Crete, 28–31 May 2014, Crete University Press, 2014. a
Kumharn, W.: Assessing the Role of Brewer Spectrophotometer in Determining Aerosol Optical Properties in the UK and Tropics, PhD thesis, The University of Manchester, Manchester, UK, available at: https://www.escholar.manchester.ac.uk/uk-ac-man-scw:96924 (last access: 12 March 2018), 2010. a, b
Kumharn, W. and Hanprasert, K.: Aerosol optical properties in ultraviolet ranges and respiratory diseases in Thailand, Atmos. Environ., 142, 221–228, https://doi.org/10.1016/j.atmosenv.2016.07.046, available at: http://www.sciencedirect.com/science/article/pii/S1352231016305660 (last access: 12 March 2018), 2016. a
Kumharn, W., Rimmer, J. S., Smedley, A. R. D., Ying, T. Y., and Webb, A. R.: Aerosol optical depth and the Global Brewer Network: a study using U.K.- and Malaysia-based Brewer spectrophotometers, J. Atmos. Ocean. Tech., 29, 857–866, https://doi.org/10.1175/JTECH-D-11-00029.1, 2012. a
Kumharn, W., Sudhibrabha, S., and Hanprasert, K.: Aerosol optical depth: a study using Thailand based Brewer spectrophotometers, Adv. Space Res., 56, 2384–2388, https://doi.org/10.1016/j.asr.2015.09.031, available at: http://linkinghub.elsevier.com/retrieve/pii/S0273117715006924 (last access: 12 March 2018), 2015. a
Marenco, F., Santacesaria, V., Bais, A. F., Balis, D., Sarra, A. D., Papayannis, A., and Zerefos, C.: Optical properties of tropospheric aerosols determined by lidar and spectrophotometric measurements (Photochemical Activity and Solar Ultraviolet Radiation campaign), Appl. Optics, 36, 6875–6886, https://doi.org/10.1364/AO.36.006875, available at: https://www.osapublishing.org/abstract.cfm?uri=ao-36-27-6875 (last access: 12 March 2018), 1997. a
Marenco, F., di Sarra, A., and De Luisi, J.: Methodology for determining aerosol optical depth from Brewer 300–320-nm ozone measurements, Appl. Optics, 41, 1805–1814, 2002. a, b
Mitchell, R. and Forgan, B.: Aerosol measurement in the Australian outback: intercomparison of Sun photometers, J. Atmos. Ocean. Tech., 20, 54–66, https://doi.org/10.1175/1520-0426(2003)020<0054:AMITAO>2.0.CO;2, 2003. a, b, c
Nicolet, M.: On the molecular scattering in the terrestrial atmosphere: an empirical formula for its calculation in the homosphere, Planet. Space Sci., 32, 1467–1468, https://doi.org/10.1016/0032-0633(84)90089-8, 1984. a, b
Redondas, A.: Ozone absolute Langley Calibration, in: The Tenth Biennial WMO Consultation on Brewer Ozone and UV Spectrophotometer Operation, Calibration and Data Reporting, no. 176 in: GAW Report, World Meteorological Organization, available at: https://library.wmo.int/pmb_ged/wmo-td_1420.pdf (last access: 12 March 2018), 2008. a
Redondas, A. and Rodriguez-Franco, J.: Eighth Intercomparison Campaign of the Regional Brewer Calibration Center Europe (RBCC-E), no. 223 in: GAW Report, World Meteorological Organization, available at: http://library.wmo.int/pmb_ged/gaw_223_en.pdf (last access: 12 March 2018), 2015a. a, b
Redondas, A. and Rodriguez-Franco, J.: Ninth Intercomparison Campaign of the Regional Brewer Calibration Center Europe (RBCC-E), no. 224 in: GAW Report, World Meteorological Organization, available at: http://library.wmo.int/pmb_ged/gaw_224_en.pdf (last access: 12 March 2018), 2015b. a, b
Redondas, A., Evans, R., Stuebi, R., Köhler, U., and Weber, M.: Evaluation of the use of five laboratory-determined ozone absorption cross sections in Brewer and Dobson retrieval algorithms, Atmos. Chem. Phys., 14, 1635–1648, https://doi.org/10.5194/acp-14-1635-2014, 2014. a
Redondas, A., Rodriguez-Franco, J., Gröbner, J., Köhler, U., and Stuebi, R.: Seventh Intercomparison Campaign of the Regional Brewer Calibration Center Europe (RBCC-E), no. 216 in: GAW Report, World Meteorological Organization, available at: http://library.wmo.int/pmb_ged/gaw_216_en.pdf (last access: 12 March 2018), 2015. a, b
Rimmer, J. S., Redondas, A., and Karppinen, T.: EuBrewNet – A European Brewer network (COST Action ES1207), an overview, Atmos. Chem. Phys. Discuss., https://doi.org/10.5194/acp-2017-1207, in review, 2018. a, b
Rodríguez, S., Cuevas, E., Prospero, J. M., Alastuey, A., Querol, X., López-Solano, J., García, M. I., and Alonso-Pérez, S.: Modulation of Saharan dust export by the North African dipole, Atmos. Chem. Phys., 15, 7471–7486, https://doi.org/10.5194/acp-15-7471-2015, 2015. a
Rodriguez-Franco, J.: Brewer AOD Calibration and Retrieval in the UV-B – short term scientific mission report, 2015. a
Savastiouk, V.: Improvements to the Direct-Sun Ozone Observations Taken with the Brewer spectrophotometer, Ph.D. thesis, York University, Toronto, Ontario, 2006. a
Savastiouk, V. and McElroy, C.: An algorithm for real-time calculations of the aerosol optical depth with the, https://doi.org/10.13140/2.1.2505.1527, 2004a. a
Savastiouk, V. and McElroy, C.: Calculating air mass factors for Ozone and Rayleigh air mass factor calculations for ground-based spectrophotometers, https://doi.org/10.13140/2.1.3553.7284, 2004b. a, b
Sellitto, P., Sarra, A. D., and Siani, A. M.: An improved algorithm for the determination of aerosol optical depth in the ultraviolet spectral range from Brewer spectrophotometer observations, J. Opt. A-Pure Appl. Op., 8, 849–855, https://doi.org/10.1088/1464-4258/8/10/005, available at: http://stacks.iop.org/1464-4258/8/i=10/a=005?key=crossref.044f33ec882d6c1c06ce3b3cfb17cad5 (last access: 12 March 2018), 2006. a
Shaw, G. E., Reagan, J. A., and Herman, B. M.: Investigations of atmospheric extinction using direct solar radiation measurements made with a multiple wavelength radiometer, J. Appl. Meteorol., 12, 374–380, https://doi.org/10.1175/1520-0450(1973)012<0374:IOAEUD>2.0.CO;2, 1973. a
Silva, A. A. and Kirchhoff, V. W. J. H.: Aerosol optical thickness from Brewer spectrophotometers and an investigation into the stray-light effect, Appl. Optics, 43, 2484–2489, https://doi.org/10.1364/AO.43.002484, 2004. a, b
Smirnov, A., Holben, B. N., Eck, T. F., Dubovik, O., and Slutsker, I.: Cloud screening and quality control algorithms for the AERONET data base, Remote Sens. Environ., 73, 337–349, https://doi.org/10.1016/S0034-4257(00)00109-7, 2000. a
Spencer, J. W.: Fourier series representation of the position of the sun, Search, 2, 172, 1971. a
Weber, M., Gorshelev, V., and Serdyuchenko, A.: Uncertainty budgets of major ozone absorption cross sections used in UV remote sensing applications, Atmos. Meas. Tech., 9, 4459–4470, https://doi.org/10.5194/amt-9-4459-2016, 2016. a
WMO/GAW: Technical Coordination for Better Integration of a Global Network, Recommendations of Working Group II, in: WMO/GAW Experts Workshop on a Global Surface-Based Network for Long Term Observations of Column Aerosol Optical Properties, edited by: Baltensperger, U., Barrie, L., and Wehrli, C., no. 162 in: GAW Report, World Meteorological Organization, available at: http://www.wmo.int/pages/prog/arep/gaw/documents/gaw162.pdf (last access: 12 March 2018), 2005. a