the Creative Commons Attribution 4.0 License.
the Creative Commons Attribution 4.0 License.
 | 13 Feb 2018
High-resolution sampling and analysis of ambient particulate matter in the Pearl River Delta region of southern China: source apportionment and health risk implications
Shengzhen Zhou
Perry K. Davy
Minjuan Huang
Jingbo Duan
Xuemei Wang
Qi Fan
Ming Chang
Yiming Liu
Weihua Chen
Shanju Xie
Travis Ancelet
William J. Trompetter
Hazardous air pollutants, such as trace elements in particulate matter (PM), are known or highly suspected to cause detrimental effects on human health. To understand the sources and associated risks of PM to human health, hourly time-integrated major trace elements in size-segregated coarse (PM2.5–10) and fine (PM2.5) particulate matter were collected at the industrial city of Foshan in the Pearl River Delta region, China. Receptor modeling of the data set by positive matrix factorization (PMF) was used to identify six sources contributing to PM2.5 and PM10 concentrations at the site. Dominant sources included industrial coal combustion, secondary inorganic aerosol, motor vehicles and construction dust along with two intermittent sources (biomass combustion and marine aerosol). The biomass combustion source was found to be a significant contributor to peak PM2.5 episodes along with motor vehicles and industrial coal combustion. Conditional probability function (CPF) analysis was applied to estimate the source locations using the PMF-resolved source contribution coupled with the surface wind direction data. Health exposure risk of hazardous trace elements (Pb, As, Si, Cr, Mn and Ni) and source-specific values were estimated. The total hazard quotient (HQ) of PM2.5 was 2.09, higher than the acceptable limit (HQ = 1). The total carcinogenic risk (CR) was 3.37 × 10⁻³ for PM2.5, which was 3 times higher than the least stringent limit (1.0 × 10⁻⁴). Among the selected trace elements, As and Pb posed the highest non-carcinogenic and carcinogenic risks to human health, respectively. In addition, our results show that the industrial coal combustion source is the dominant non-carcinogenic and carcinogenic risk contributor, highlighting the need for stringent control of this source. This study provides new insight for policy makers to prioritize sources in air quality management and health risk reduction.
- Article
(7228 KB) - Full-text XML
-
Supplement
(826 KB) - BibTeX
- EndNote


Ambient particulate matter (PM) is ubiquitously suspended in the atmosphere, which profoundly affects human health, visibility and global climate. A number of epidemiologic studies have suggested that short- or long-term exposure to PM is associated with a growing risk of the respiratory and cardiac illness, and even premature mortality (Pope et al., 2009; Dockery et al., 1993). PM mass concentration is considered a standard metric used for examining human health risks. More recently, the size and chemical component of PM have been recognized as the important factors for their toxicity. For instance, Kan et al. (2007) found significant associations of daily mortality with PM2.5 (fine mode), but not with PM2.5–10 (coarse mode) in Shanghai. Reche et al. (2012) reported higher toxicity for PM1.0−2.5 than PM2.5–10 to human cells. From the epidemiological and experimental findings, it is convincing that trace elements in the PM components such as Ni, V, Pb and Zn appear to be important causes of both pulmonary and cardiovascular diseases (Chen and Lippmann, 2009; Heal et al., 2012). Moreover, airborne particles and associated trace elements originate from various emission sources, such as motor vehicles, metallurgical industry, coal burning and soil dust, and could be emitted in a broad size range. Studies suggest that some particle sources are more harmful than others and recommend that controlling some of the specific sources of PM could be a more effective way for protecting public health (Bell et al., 2014; Khan et al., 2016). Airborne particle health risk assessment is increasingly dependent on the source apportionment of PM using chemical component data. In particular, elemental components are often applied for PM source identification because of their atmospheric stability and source specificity (Taiwo et al., 2014; Visser et al., 2015b).
To identify the sources contributing to measured PM concentrations, multivariate receptor models were used. Positive matrix factorization (PMF) is a powerful and commonly used multivariate receptor technique that is capable of resolving factors, or PM sources, without prior source knowledge. It is, however, important to note that source-specific profiles (fingerprints) must be known to properly assign the PMF model outputs. PMF has a number of advantages over traditional factor analysis techniques including non-negativity constraints and the ability to accommodate data that are missing or below the detection limit. The results of the analysis are directly interpretable as mass contributions to PM from each source factor (Paatero and Tapper, 1994; Paatero, 1997; Song et al., 2001). A majority of PM source apportionment studies in the literature are documented at a lower temporal resolution, typically in 12–24 h integrated filter samples (Pant and Harrison, 2012; Belis et al., 2013). Only limited studies have applied PMF to determine the trace element emission sources at a high time (hourly) resolution (Gao et al., 2016; Dall'Osto et al., 2013; Pancras et al., 2013; Moreno et al., 2011; Crilley et al., 2017; Visser et al., 2015a; Ancelet et al., 2012, 2014). Increasing the time resolution of measurements can capture the impact of PM concentration and personal exposure from many intermittent sources such as biomass combustion or industry emission plumes.
The subtropical Pearl River Delta (PRD) region is one of the most urbanized and industrialized areas in China. In recent years, the PRD region has been facing severe particulate matter pollution and photochemical smog events (Zhang et al., 2008; R. J. Huang et al., 2014), threatening the health of over 57 million residents (http://www.gdstats.gov.cn/tjnj/2016/directory.html). We have collected hourly samples of fine (PM2.5) and coarse (PM2.5–10) particulate matter at an important industrial city, Foshan, in the PRD region. Trace elements were measured by the particle-induced X-ray emission (PIXE) technique, providing hourly elemental concentration in the fine and coarse PM. The average concentration, temporal and diurnal variations and effects of meteorology on the trace element concentrations have been reported in Zhou et al. (2016). In this study, we applied a PMF receptor model (EPA PMF 5.0) to characterize the PM sources in Foshan city utilizing the size-resolved hourly elemental data and other gas-phase pollutants. In addition, we assessed the human health risk exposure to selected trace elements in PM released from specific sources, as identified by the PMF model. Our results provide valuable information for optimizing the corresponding management and control strategies of PM pollution in the PRD region and cities in other regions.
2.1 Description of the sampling site
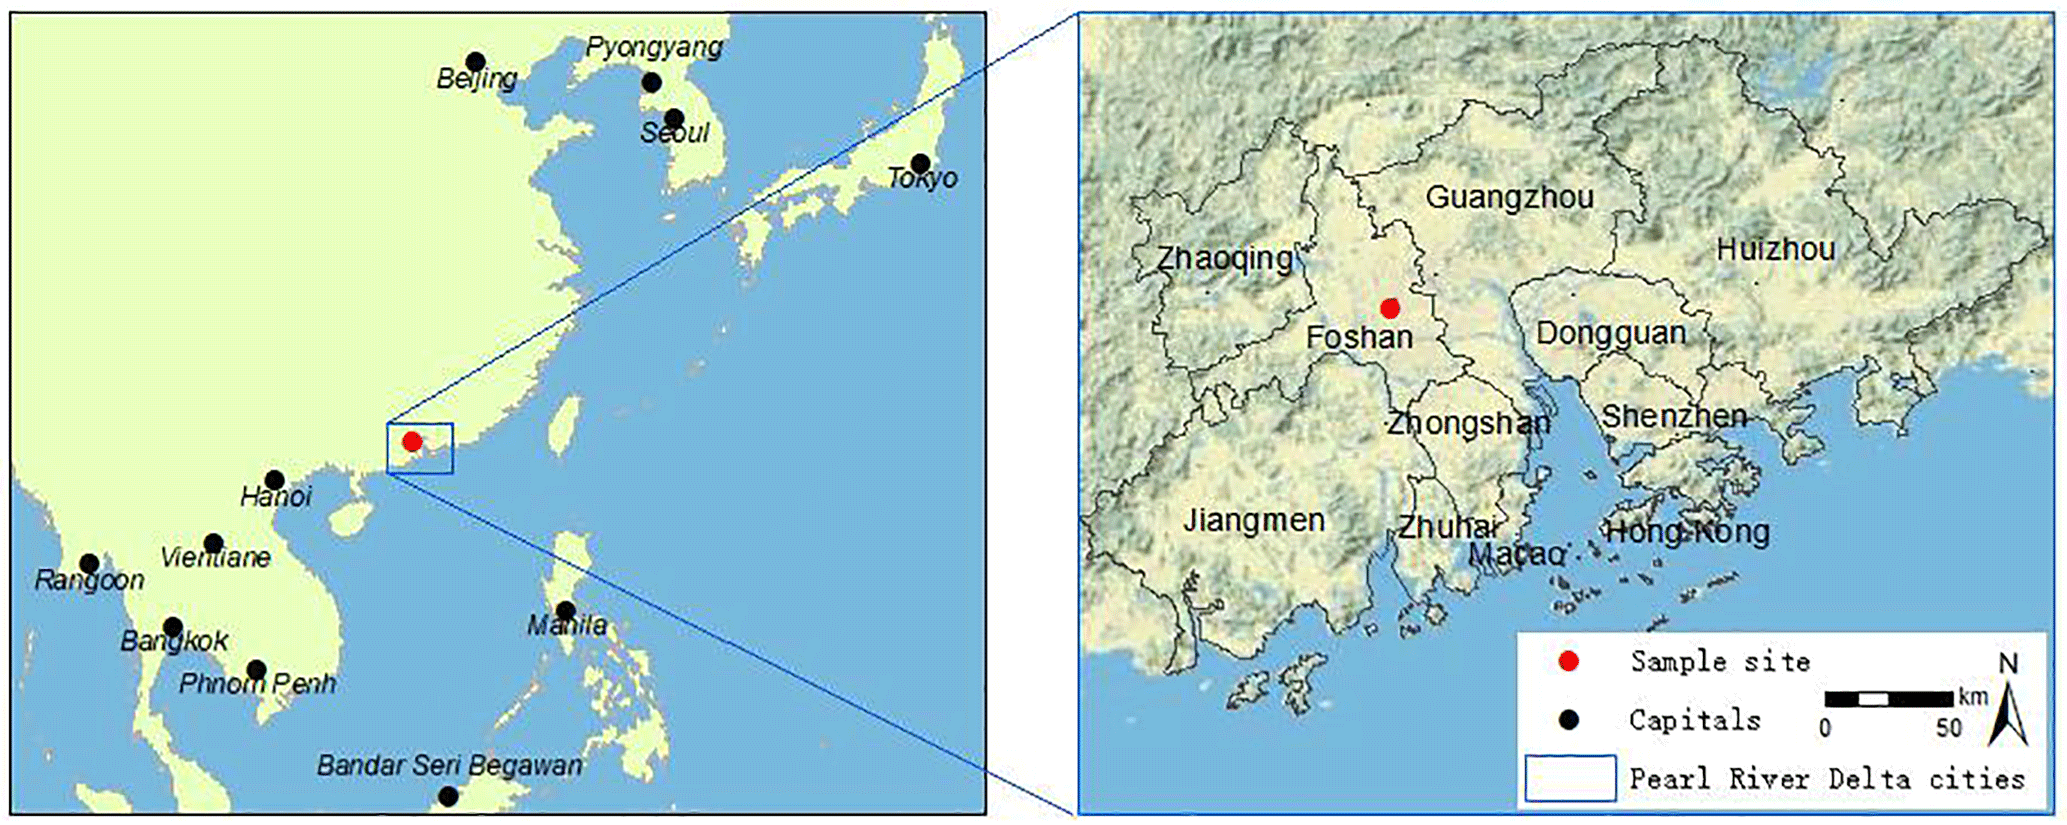
The monitoring station was located in Foshan, Guangdong Province, China (Fig. 1), on top of the Foshan Environmental Monitoring Center (Foshan EMC; 23.0025∘ N, 113.1035∘ E; approximately 35 m above ground level). Foshan is one of the most important manufacturing hubs in China, characterized by the ceramics industry and household appliance industry, and produces ∼ 15 % of China's home appliances and ∼ 30 % of the world's ceramics (Guo et al., 2011). Adjacent to the monitoring site is a continuous sampling system measuring NOx (Advanced Pollution Instrumentation, API, model 200E), CO (API, model 300E), SO2 (API, model 100E), O3 (API, model 300E) and PM2.5 and PM10 (Thermo Scientific, model FH62C14), operated by the Foshan Environmental Monitoring Center. The station is surrounded by residential buildings and business offices on flat terrain. Meteorological parameters, including wind speed (WS), wind direction (WD), temperature (T), relative humidity (RH) and rainfall were obtained from Foshan Meteorological Bureau. The meteorological station is situated in the Foshan No. 1 Middle School, about 5 km north of Foshan EMC. The time resolution for the meteorological data is 10 min.
2.2 Sampling of aerosol
Hourly time-integrated samples of size-segregated coarse (PM2.5–10) and fine (PM2.5) PM samples were collected using a modified Streaker sampler (PIXE International Corporation, USA ). The Streaker sampler has previously been described in detail (Annegarn et al., 1988), and used in a number of studies (Annegarn et al., 1992, 1996; Filippi et al., 1999; D'Alessandro et al., 2004). The Streaker sampler system used in this study is described in Zhou et al. (2016). Briefly, the Streaker sampler consists of a pre-impactor that removes particles larger than PM10 from the incoming air flow, a thin Kapton foil that collects coarse particles through impaction and a Nucleopore filter (0.4 µm pore size) that collects fine particles. An electronic control system regulates the Streaker sampler pneumatics mass flow (1 L min−1) and stepper motor rotation of the filter between each user-defined sampling period. The hourly samples were collected with discrete spacing between each deposit to ensure that each deposit only consisted of particulate matter collected during the intended hour. A total of 60 samples or 60 h can be collected on each filter.
The high-resolution particulate matter sampling system was installed on the roof of Foshan Environmental Monitoring Center. The sampler was set to collect hourly samples beginning at 12:00 UTC+8 on 24 October 2014 and ending at 10:00 on 14 December 2014. A total of 47 samples or 2 days were collected per filter (coarse and fine) with the sampling ending at 11:00 (47 h later), allowing an hour to change over filters before the sampling was restarted again at 12:00. In all, 1127 samples each of PM2.5 and PM2.5–10 were collected, representing 1127 h or 7 weeks of sampling.
2.3 Sample analysis
Ion beam analysis (IBA) was used to measure the concentrations of elements with atomic numbers above neon in the PM samples. The IBA was performed using a 3 MeV accelerator proton beam with standards (SrF2, NaCl, Cr, Ni, SiO, KCl, Al) run before and after each analytical cycle. Spectral X-ray peak deconvolution was performed using Gupix software (Maxwell et al., 1995). The number of pulses (counts) in each peak for a given element is used by the Gupix software to calculate the concentration of that element. The background and neighboring elements determine the statistical error and the limit of detection. Note that Gupix provides a specific statistical error and limit of detection (LOD) for each element in each PM sample and these have been used to provide the uncertainty matrix using in the PMF analysis. IBA measurements were carried out at the New Zealand National Isotope Centre operated by the Institute of Geological and Nuclear Sciences (GNS) in Gracefield, Lower Hutt, New Zealand (Trompetter et al., 2005). Further details on the IBA techniques used, analytical uncertainties and limits of detection have been reported previously (Ancelet et al., 2012). Black carbon was measured using a M43D digital smoke stain reflectometer (Ancelet et al., 2011).
2.4 Receptor modeling using PMF
Receptor modeling and apportionment of PM mass by PMF was performed using the EPAPMF version 5.0.14 program in accordance with the user's guide (https://www.epa.gov/air-research/epa-positive-matrix-factorization-50-fundamentals-and-user-guide). With PMF, sources are constrained to have non-negative species concentrations; no sample can have a negative source contribution and error estimates for each observed point are used as point-by-point weights. This is a distinct advantage of PMF, since it can accommodate missing or below detection limit data that is a common feature of environmental monitoring (Song et al., 2001). Another advantage of PMF is that PM mass concentrations can be included in the model as another variable and the results are directly interpretable as the covariant PM mass contributions associated with each factor (source). Prior to the PMF analyses, data and uncertainty matrices were prepared in the same manner as previous studies (Polissar et al., 1998; Song et al., 2001). Data screening and the source apportionment were performed in accordance with the protocols and recommendations set out by Paatero et al. (2014) and Brown et al. (2015). Due to the effect that random analytical noise can have on the receptor modeling process, variables with low signal-to-noise ratios were examined by alternate inclusion and exclusion in a modeling run and only those variables that could be explained in association with source emissions were included in the final results (Paatero and Hopke, 2003).
2.5 Conditional probability function (CPF)
In order to locate the local sources and estimate the wind direction impacts on each source identified using PMF, the CPF method was applied. The CPF calculates the probability that a source is located with a particular wind direction sector (Pekney et al., 2006). The probability that a source originates from a given wind direction is estimated by comparing the wind direction distribution for the upper 25 % (or 75 percentile) of source contributions relative to the total wind direction distribution in this study:
where mΔθ is the number of occurrences from wind sector Δθ for the upper 25 % of concentrations and nΔθ is the total number of occurrences from the same wind sector.
Using the high-temporal-resolution data, bivariate polar plots were generated with the R statistical and Openair software packages (Carslaw and Ropkins, 2012). Using bivariate polar plots, source concentrations can be shown as a function of both wind speed and direction, providing invaluable information about the direction of potential sources and the influence of wind speed on concentrations. In this study we produced bivariate polar plots using the conditional probability function analysis (CPF) to identify the directions from which high source concentrations are likely to originate. A full description of CPF analysis can be found in Carslaw and Ropkins (2012).
2.6 Human health risk assessment
Among the detected elements, As, Pb, Mn, Si and Cr were identified as non-carcinogenic risks, while inorganic As, Pb and Ni were considered carcinogenic (USEPA, 2017). The reference levels and cancer risk slopes for Cr vary with its valences (e.g., Cr(VI) and Cr(III)) and exposure pathways (e.g., oral intake, inhalation). However, neither reference concentration (Rfc) nor cancer risk slope for inhalation of Cr(III) are available in the Integrated Risk Information System (IRIS), so we assumed that the total Cr in our study was Cr(VI), the Rfc and cancer risk slope of which are provided in IRIS (USEPA, 2017).
The adjusted air concentrations (Cair-adj) for the toxic elements contained in PM2.5 was calculated from Eq. (1), modified based on the equations in the risk assessment guidance (USEPA, 2009).
where Cair is the hourly ambient trace elements concentration detected in PM2.5 (µg m−3); ETi is the exposure time (1 h day−1); ED is the exposure duration (6 years for children and 30 years for adults); EF is exposure frequency (350 days year−1 in this study); AT is the averaging time (30 years × 365 days year−1 for non-carcinogens; 75 years × 365 days year−1 for carcinogens; M. Huang et al., 2014, 2016).
The obtained adjusted air concentrations of the toxic trace elements were subsequently divided by their respiratory reference concentrations (RfCs) to yield the respective hazard quotient (HQ; USEPA, 2017). Hazard index (HI) was produced by summing up all the hazard quotients (HQs) based on the hypothesis that the adverse effect is proportional to the sum of hazard quotients (HQs). Hazard index of less than 1 indicated no significant adverse non-carcinogenic effect.
For the carcinogenic risks assessment, the obtained adjusted air concentrations of the toxic elements of cancer risks from Eq. (1) were multiplied by their slope factors to calculate the carcinogenic risks (CRs; USEPA, 2017). The carcinogenic risk refers to a person's chance of developing cancer from the exposure to any carcinogenic agent. CR equal to 1 × 10⁻⁴ is considered as the least stringent level, above which indicating significant cancer risk.
3.1 Concentrations of PM2.5 and PM10 and mass closure analysis
The hourly variations of PM2.5 and PM10 mass concentrations during the observation are displayed in Fig. S1 in the Supplement. The PM2.5 and PM10 concentrations varied from ∼ 8 to ∼ 270 and ∼ 16 to 363 µg m−3, with an average value of 62.5 ± 33.5 and 91.6 ± 47.2 µg m−3, respectively. Around 25 % PM2.5 mass concentrations exceeded the second grade of new issued National Ambient Air Quality Standard (NAAQS, GB 3095-2012) of China, with daily average value of 75 µg m−3. In addition, the mean ratio of PM2.5 / PM10 was estimated to be about 0.67, which is consistent with the ratio reported by the previous studies in the Pearl River Delta region, North China Plain and Yangtze River Delta region (Wang et al., 2006; Sun et al., 2004; Hu et al., 2014). This result indicated that fine particles, PM2.5, accounted for a majority of PM10.
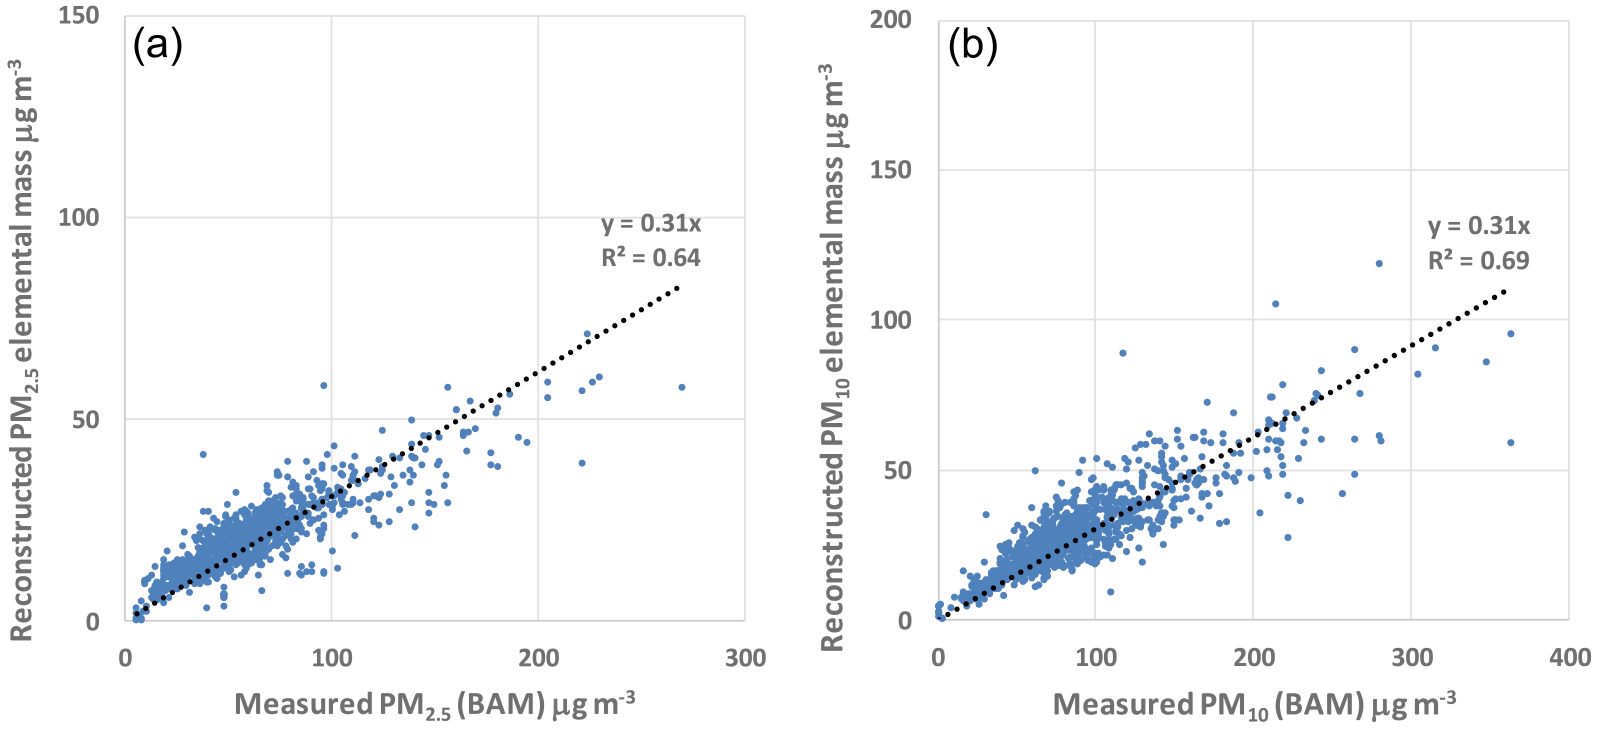
Figure 2Elemental reconstructed mass versus PM mass measured using the beta attenuation monitor (BAM) technique for (a) PM2.5 and (b) PM10 at the Foshan site.
In order to compare the relationship between the range of analytes measured in PM and the total PM mass, a mass closure approach was used. Ideally, when elemental analysis and organic compound analysis have been undertaken on the same sample one can reconstruct the mass using the following general equation for ambient samples as a first approximation (Cahill et al., 1989; Cohen, 1999; Malm et al., 1994):
where [Soil] = 2.20[Al] + 2.49[Si] + 1.63[Ca] + 2.42[Fe] + 1.94[Ti], [OM] = Σ[Concentrations of organic compounds], [BC] = Concentration of black carbon (soot), [Smoke] = [K] − 0.6[Fe], [Seasalt] = 2.54[Na], [Sulfate] = 4.125[S].
The reconstructed mass (RCM) is based on the fact that the six composite variables or “pseudo” sources given in Eq. (2) are generally the major contributors to fine and coarse particle mass and are based on geochemical principles and constraints. As a measure of [OM] was not available in this study, it was assumed that it composed part of the “remaining mass” (the difference between RCM and measured PM (BAM)) that includes water and nitrates as major components (Cahill et al., 1989). As Na was below the LOD across most of the samples, the reciprocal calculation of [Seasalt] = 1.65[Cl] was substituted, though care was taken with the interpretation of this pseudo source due to the potential for Cl loss by volatilization from aerosol (or from filters) in the presence of acidic aerosol species, particularly in the fine fraction (Lee et al., 1999; Chen et al., 2016). Most fine sulfate particles are the result of oxidation of SO2 gas to sulfate particles in the atmosphere (Malm et al., 1994). For RCM, it is assumed that sulfate is present in fully neutralized form as ammonium sulfate. [Sulfate] therefore represents the ammonium sulfate contribution to aerosol mass with the multiplicative factor of 4.125[S] to account for ammonium ion and oxygen mass (i.e., (NH4)2SO4= ((14 + 4) × 2 + 32 + (16 × 4) ∕ 32); Cahill et al., 1989; Cohen, 1999; Malm et al., 1994).
The RCM and mass closure calculations using the pseudo-source and pseudo-element approach are a useful way to examine initial relationships in the data and how the measured mass of species in samples compares to total PM mass, an important consideration for receptor modeling studies. Figure 2 indicates that the RCM of measured elements accounts for approximately 30 % of total mass for both PM2.5 and PM10 and that there was significant correlation (r2 = 0.64 and 0.69 for PM2.5 and PM10, respectively), which indicates that the unmeasured PM components (OM, nitrate, bound H2O) are likely to be strongly associated with those species that were measured. Analysis of the data showed that most of the remaining mass (RM) for PM10 was in fact PM2.5, as would be expected for such aerosol species as OM (including secondary organic aerosol) and nitrate. Therefore, an extra variable was calculated, RM (where RM = PM2.5 − RCM, to be included in the PMF analysis as a placeholder for the unmeasured components, an approach that has been successfully applied in other studies (Belis et al., 2013). The advantage of such an approach is that all PM mass is accounted for in the PMF model. However, the limitation is that it still does not define exactly what aerosol species the RMPM2.5 variable includes, although some inferences can be made depending on the source association.
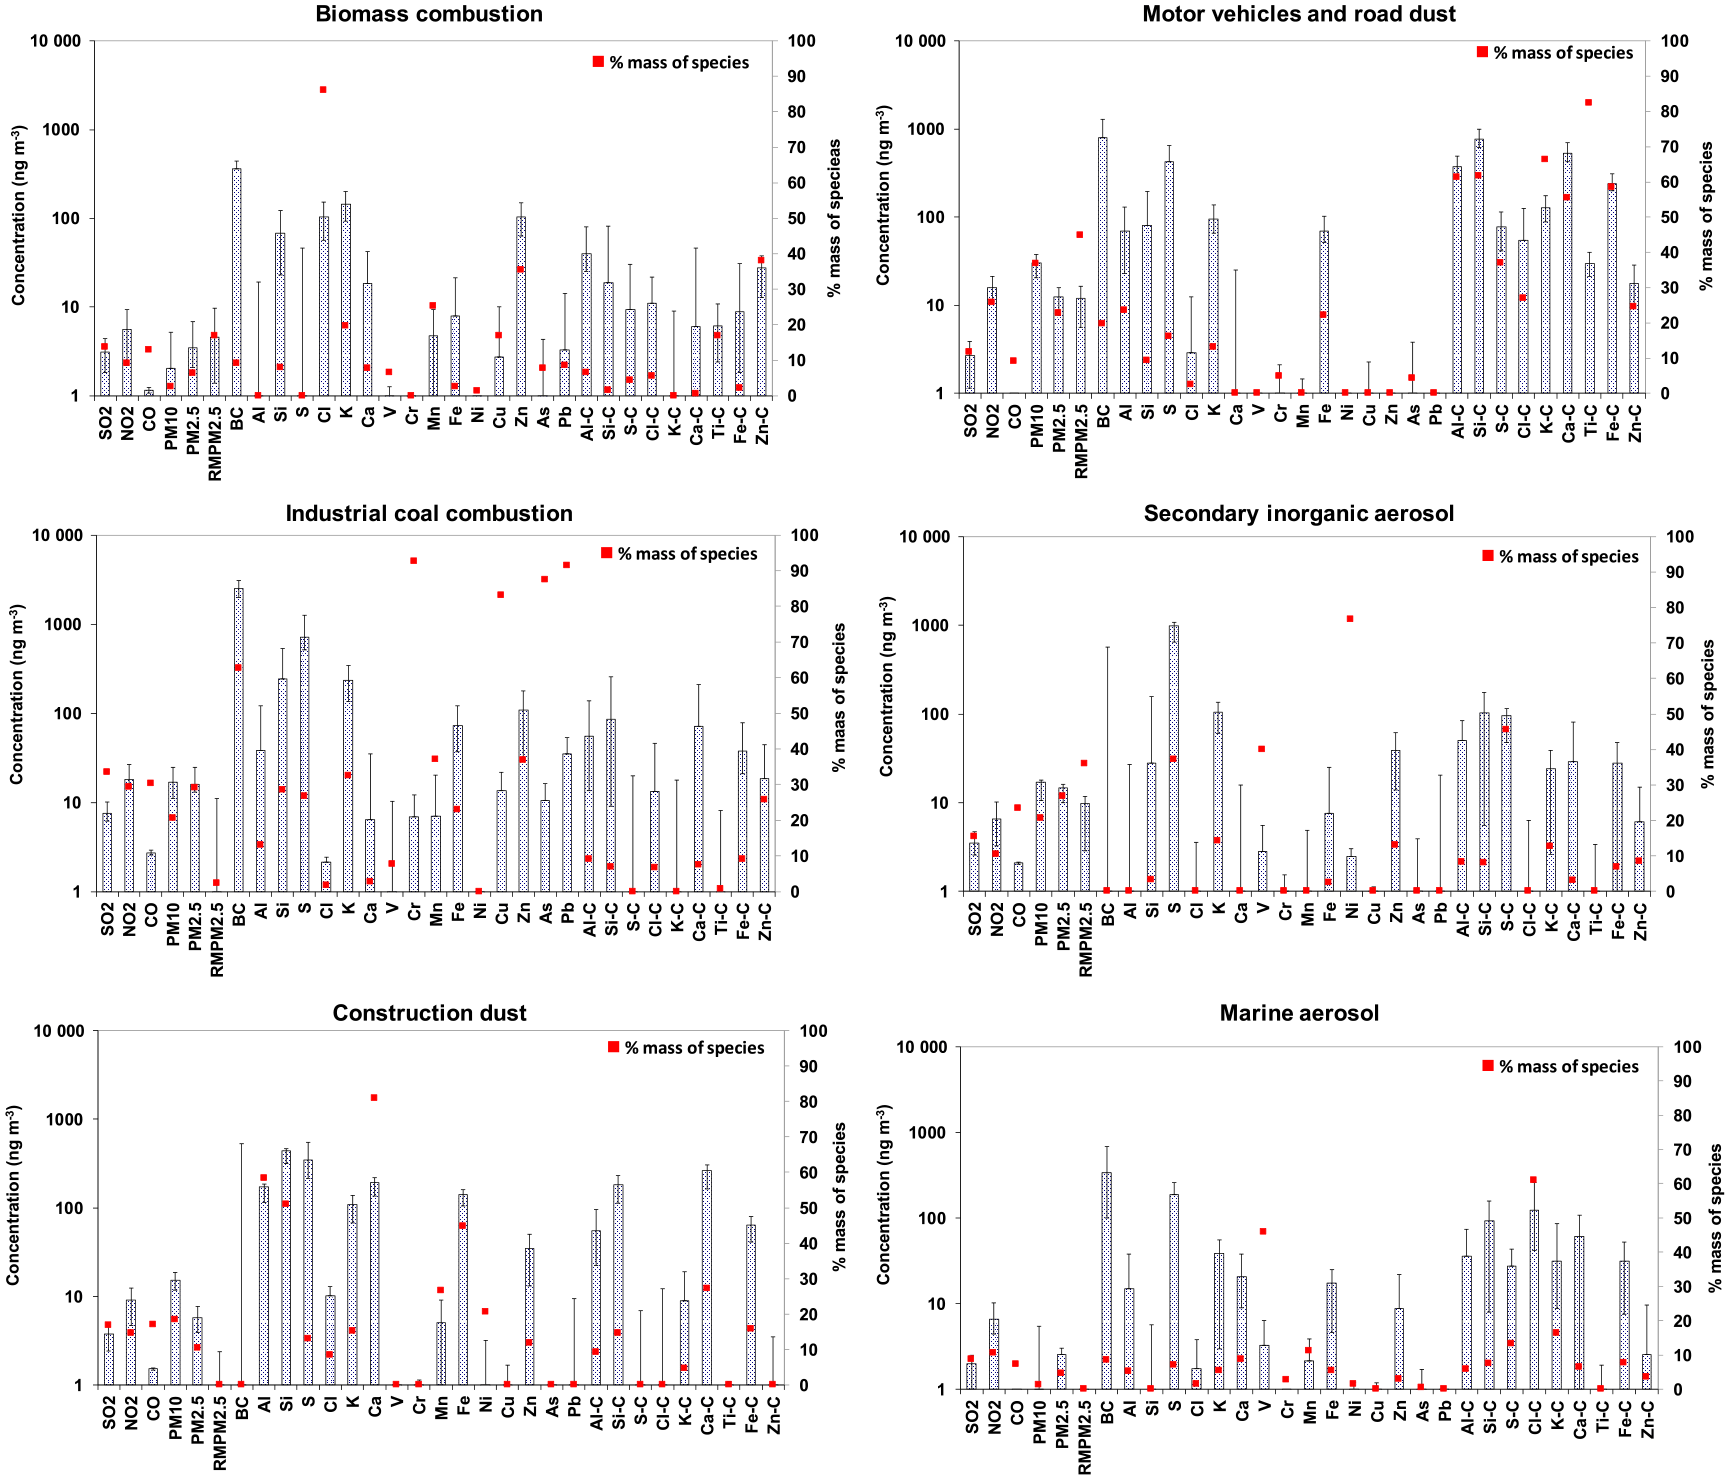
Figure 3Factor profiles for sources at Foshan EMC showing the concentrations of PM10, PM2.5, SO2, NO2 (all in µg m−3) and CO (in mg m−3 × 10; the error bars are the 5th and 95th percentiles generated from EPAPMF diagnostics).
3.2 Sources identification and apportionment of PM2.5 and PM10 during the observation
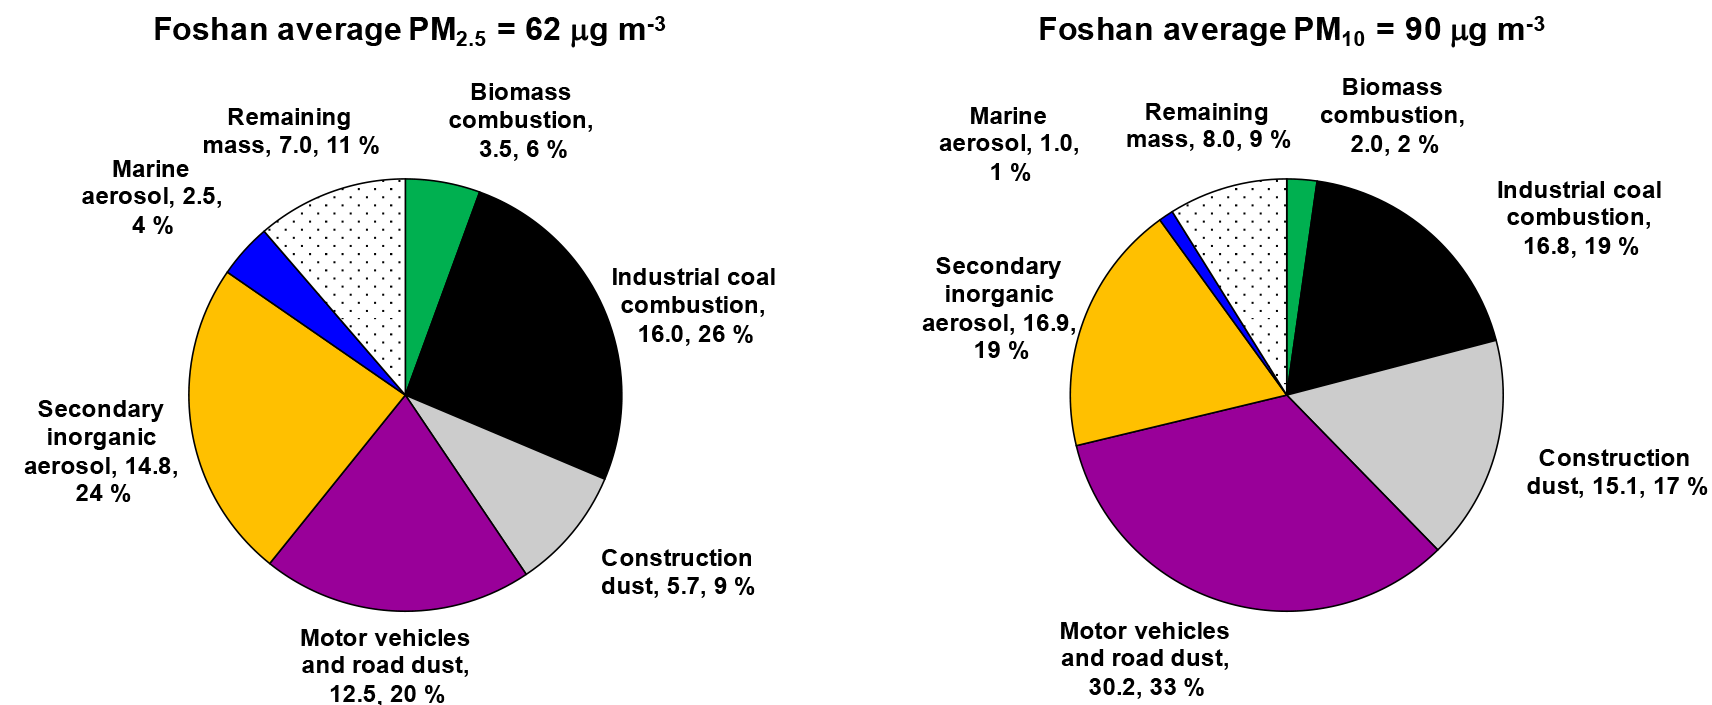
Figure 4Source contributions to PM at Foshan showing the average concentrations of PM2.5, PM10 (in µg m−3) during the monitoring period.
Using the combined fine and coarse PM elemental data sets along with the gaseous data from the Foshan EMC, PMF was used to identify six factors or sources contributing to PM concentrations during the monitoring period. PMF modeling diagnostics and other parameters are detailed in the Supplement. Multiple PMF model runs were performed choosing fewer and more factors to examine the effect on modeling diagnostics and interpretability of the source profiles coupled with the advantage of high-resolution data to examine the diurnal concentration variations. The final six-factor solution adopted included an Fpeak rotation (−3, %dQ(Robust) = 2.91) that provided good separation of the minor marine aerosol source as evidenced by the Fpeak bootstrapping results. Note that the gaseous components (SO2, NO2 and CO) have been included to aid with source identification and to examine those PM emission sources or secondary aerosol sources they are closely associated (covariant) with. This method has been also adopted in previous studies, and proved to enhance the resolving power of source apportionment studies (Zhou et al., 2005; Liu et al., 2006). The sources identified were marine aerosol, biomass combustion, construction dust, motor vehicles and road dust, secondary inorganic aerosol and industrial coal combustion. These sources were found to explain 89 and 91 % of the PM2.5 and PM10 mass, respectively (Fig. S3). The factor profiles are presented in Fig. 3, where elements in the coarse fraction are denoted as X-C (e.g., Al-C). The first factor represents biomass combustion because of the presence of BC, K and fine Cl as primary species along with Zn, which is consistent with previous studies and represents the burning of wood or plant material (Maenhaut, 2018; Ancelet et al., 2012). Motor vehicles and road dust were identified as the source of the second factor based on the presence of NO2, BC and crustal matter components Al, Si, Ca, Fe and Zn from the coarse fraction as the significant elements in the profile. This profile represents both exhaust (tailpipe) emissions and non-exhaust (road dust and brake and tire wear) emissions, hence the combination of coarse and fine elemental species and the higher contribution of the source to PM10 concentrations relative to PM2.5. Ambient source profiles derived for motor vehicles generally include particulate matter from all engine types as emissions tend to be co-mingled by turbulent air movement at street level due to road traffic and are therefore temporally and spatially covariant (Amato et al., 2009; Pant and Harrison, 2013). The third source contains most of the black carbon, a substantial amount of CO, SO2, NO2, S and fine fraction heavy metals (Cr, Mn, Cu, Zn, As, Pb) and has been attributed to coal combustion which is likely to include coal-fired power station emissions that are probably mixed with industrial process emissions (Song et al., 2007; Tian et al., 2014). The fourth factor contains the majority of both coarse and fine S, which dominates the elemental mass and is considered to represent the secondary inorganic aerosol component from gas-to-particle transformation in the atmosphere. Vanadium and nickel were also associated with this source suggesting contributing source emissions from the combustion of sulfur-containing fuels such as heavy fuel oil or oil refinery emissions (Querol et al., 2008; Maenhaut, 2018). Secondary aerosols are primarily fine particles from the gas-to-particle conversion process, but some of the particle size range does extend into the coarse fraction (Anlauf et al., 2006), particularly where heterogeneous atmospheric chemistry takes place on the surface of particles or in aerosol droplets during the reaction of sulfur gaseous species to form secondary sulfate particle species (George and Abbatt, 2010). The fifth factor, construction dust, with a high Ca loading in the profile along with crustal matter components (Al, Si, Fe) in both the fine and coarse fractions, has been attributed to activities that generate cementitious (hence the high Ca content) and crustal matter dusts in the area such as construction/demolition of buildings and other structures (i.e., cement mixing, concrete pouring, concrete cutting or drilling and soil excavation), which significantly distinguishes the source from that which might be associated with motor vehicles/road dust emissions (Owega et al., 2004; Chueinta et al., 2000; Maenhaut, 2018). The sixth source was characterized as marine aerosol due to the predominance of Cl-C. Interestingly, as indicated in Fig. 3 most of the calculated variable, RMPM2.5 (derived in Sect. 3.1), was associated with the motor vehicle and biomass combustion sources (45 and 17 %), respectively (Fig. S4), most likely indicating the association of OC with these sources (Querol et al., 2013; Pósfai et al., 2004), and the remainder of RMPM2.5 (36 %) was associated with the secondary aerosol source and is probably indicative of secondary nitrate and secondary organic aerosol concentrations (Huang et al., 2011; Freney et al., 2014).
Average source contributions to particulate mass concentrations are presented in Fig. 4, which shows that industrial coal combustion (26 %, 16.0 µg m−3), secondary inorganic aerosol (24 %, 14.8 µg m−3) and motor vehicle emissions (20 %, 12.5 µg m−3) dominated PM2.5 concentrations during the monitoring period. Mass contributions to PM10 from coal combustion and secondary inorganic aerosol were essentially unchanged from the fine fraction (16.8 and 16.9 µg m−3, respectively), while the contributions from motor vehicles (30.2 µg m−3) and construction dust (15.1 µg m−3) increased due to the significant coarse particle component associated with these latter sources.
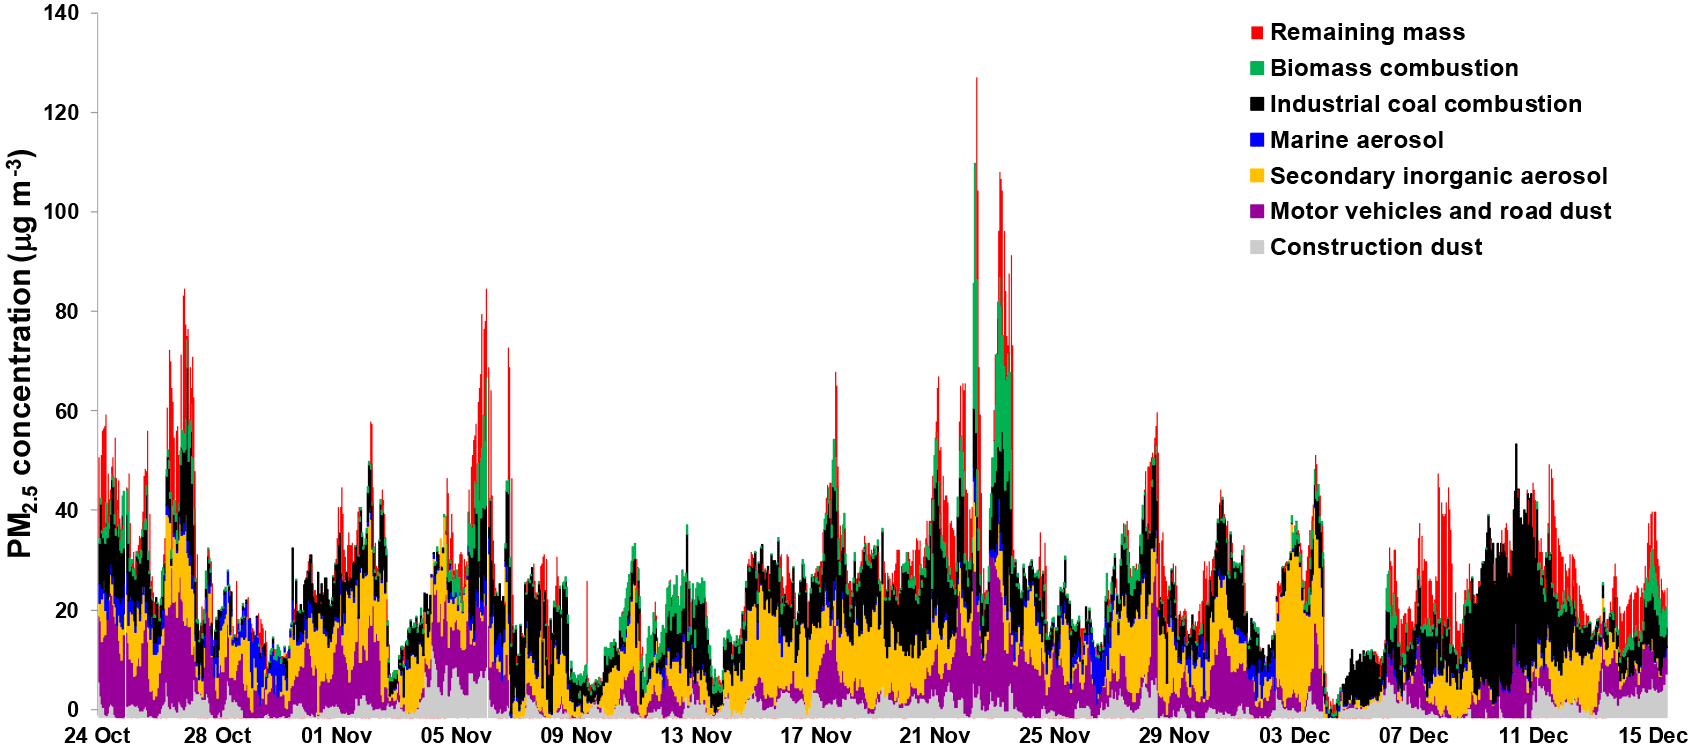
Figure 5Time series for source contributions to PM2.5 at Foshan EMC during the monitoring period.
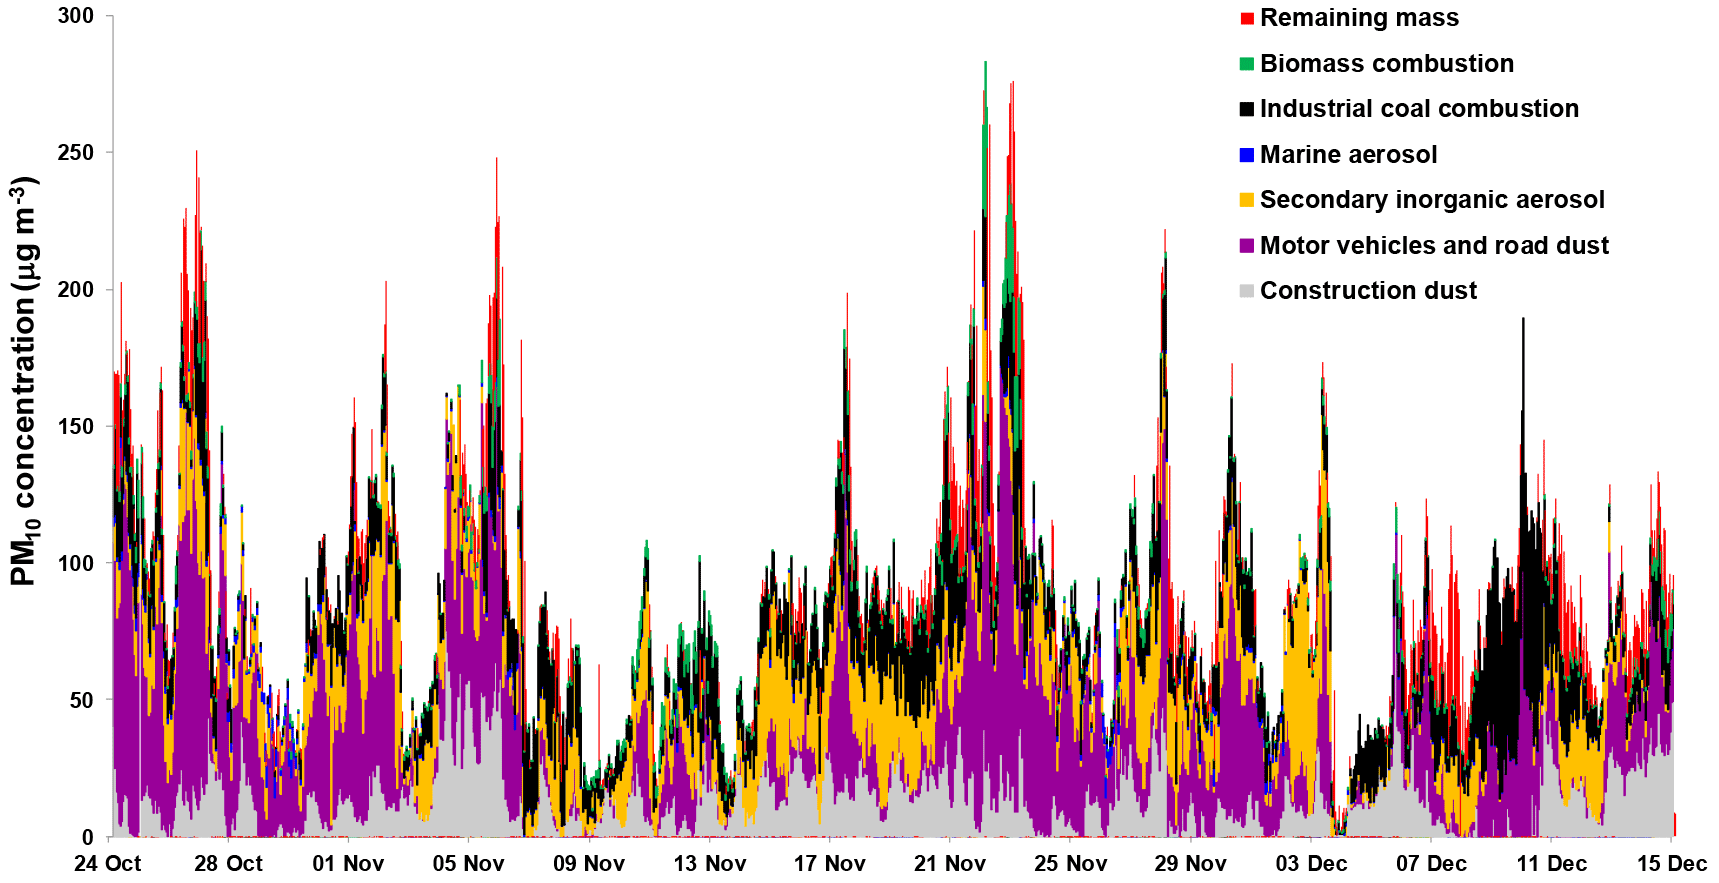
Figure 6Time series for source contributions to PM10 at Foshan EMC during the monitoring period.
When considering the gases, SO2 was strongly associated with the industrial coal combustion source. Meanwhile, the majority of NO2 was split between motor vehicles and the industrial coal combustion source. Interestingly CO was primarily associated with the industrial coal combustion and secondary inorganic aerosol sources. CO, NOx and SO2 emissions are associated with the light-duty motor vehicles (i.e., petrol vehicles), which emit few particles directly. The petrol vehicles as well as coal combustion-emitted NOx and SO2 transform to nitrate and sulfate particles through chemical reactions. The association of CO with secondary inorganic aerosol is explained by co-emission of CO with the gaseous combustion product precursors (e.g., SO2, NOx) of secondary inorganic aerosol, and they are therefore present (covariant) in the same air mass. Diesel-powered vehicles produce very little CO initially (Rhys-Tyler et al., 2011). It is assumed that diesel vehicle tailpipe emissions are primarily responsible for motor-vehicle-related PM2.5 concentrations in the Foshan urban airshed, consistent with international research (Kirchstetter et al., 2008; Kim et al., 2009; Wang et al., 2012; Targino et al., 2016). Therefore, CO is not associated with motor-vehicle-emitted particulate matters (primary aerosol). Also included in the source contribution graphs (Fig. 4) is the remaining mass (i.e., measured PM mass minus predicted PM mass). The time series plots presented in Figs. 5 and 6 for PM2.5 and PM10, respectively, show that the biomass burning and marine aerosol sources were episodic and that the concentrations of the motor vehicles and construction dust sources increased in PM10 due to the coarse particle content.
Peak PM2.5 and PM10 episodes were associated with motor vehicle and coal combustion, particularly when PM from biomass combustion was also a significant contributor. This suggests that biomass combustion sources were additive over the other sources and forced the PM2.5 concentrations to extreme highs. Analysis of satellite imagery (MODIS fire spot) indicates that biomass combustion activities were outside of the region to the north and northeast of Foshan and were advected over the city during the peak PM pollution events (Fig. S2). High concentrations of potassium were also detected during the biomass burning episodes (Zhou et al., 2016). It is most likely that the biomass combustion source is associated with agricultural burn-off around Foshan. The time averaged daily patterns in source concentrations were examined and as shown in Fig. 7a, the industrial coal combustion source concentrations were generally higher at night, perhaps due to a stable nocturnal boundary layer/mixing height effect. The construction dust concentrations (Fig. 7b) were significantly higher during the day reflecting the pattern of daytime activities generating the dusts. The motor vehicles and road dust sources (Fig. 7c) showed a bimodal pattern with peaks in the morning and evening rush hours, which was ascribed to the morning and evening commuter traffic and lower boundary layer. We could see the distinguishing diurnal variations between motor vehicle/road dust and construction dust sources.
The secondary inorganic aerosol source (Fig. 7d) demonstrated slightly higher concentrations at night than at daytime. Precursor gaseous emissions are oxidized via various gas or aqueous pathways and are then converted to sulfate aerosol (Seinfeld and Pandis, 2006; Sun et al., 2014). However, the impacts of changes in the boundary layer tend to build up the air pollutants during the nighttime. This is also consistent with the fact that there is a considerable amount of precursor gas emissions from upwind regions and that processing has already occurred there, or while the parcel has undergone dynamical transport. This implies that there is a higher chance of being mixed throughout the boundary layer and lower troposphere as well and therefore it is not as sensitive with respect to a ground-based measurement as more local emissions. The marine aerosol and biomass combustion sources are not shown in Fig. 7 due to their episodic nature.
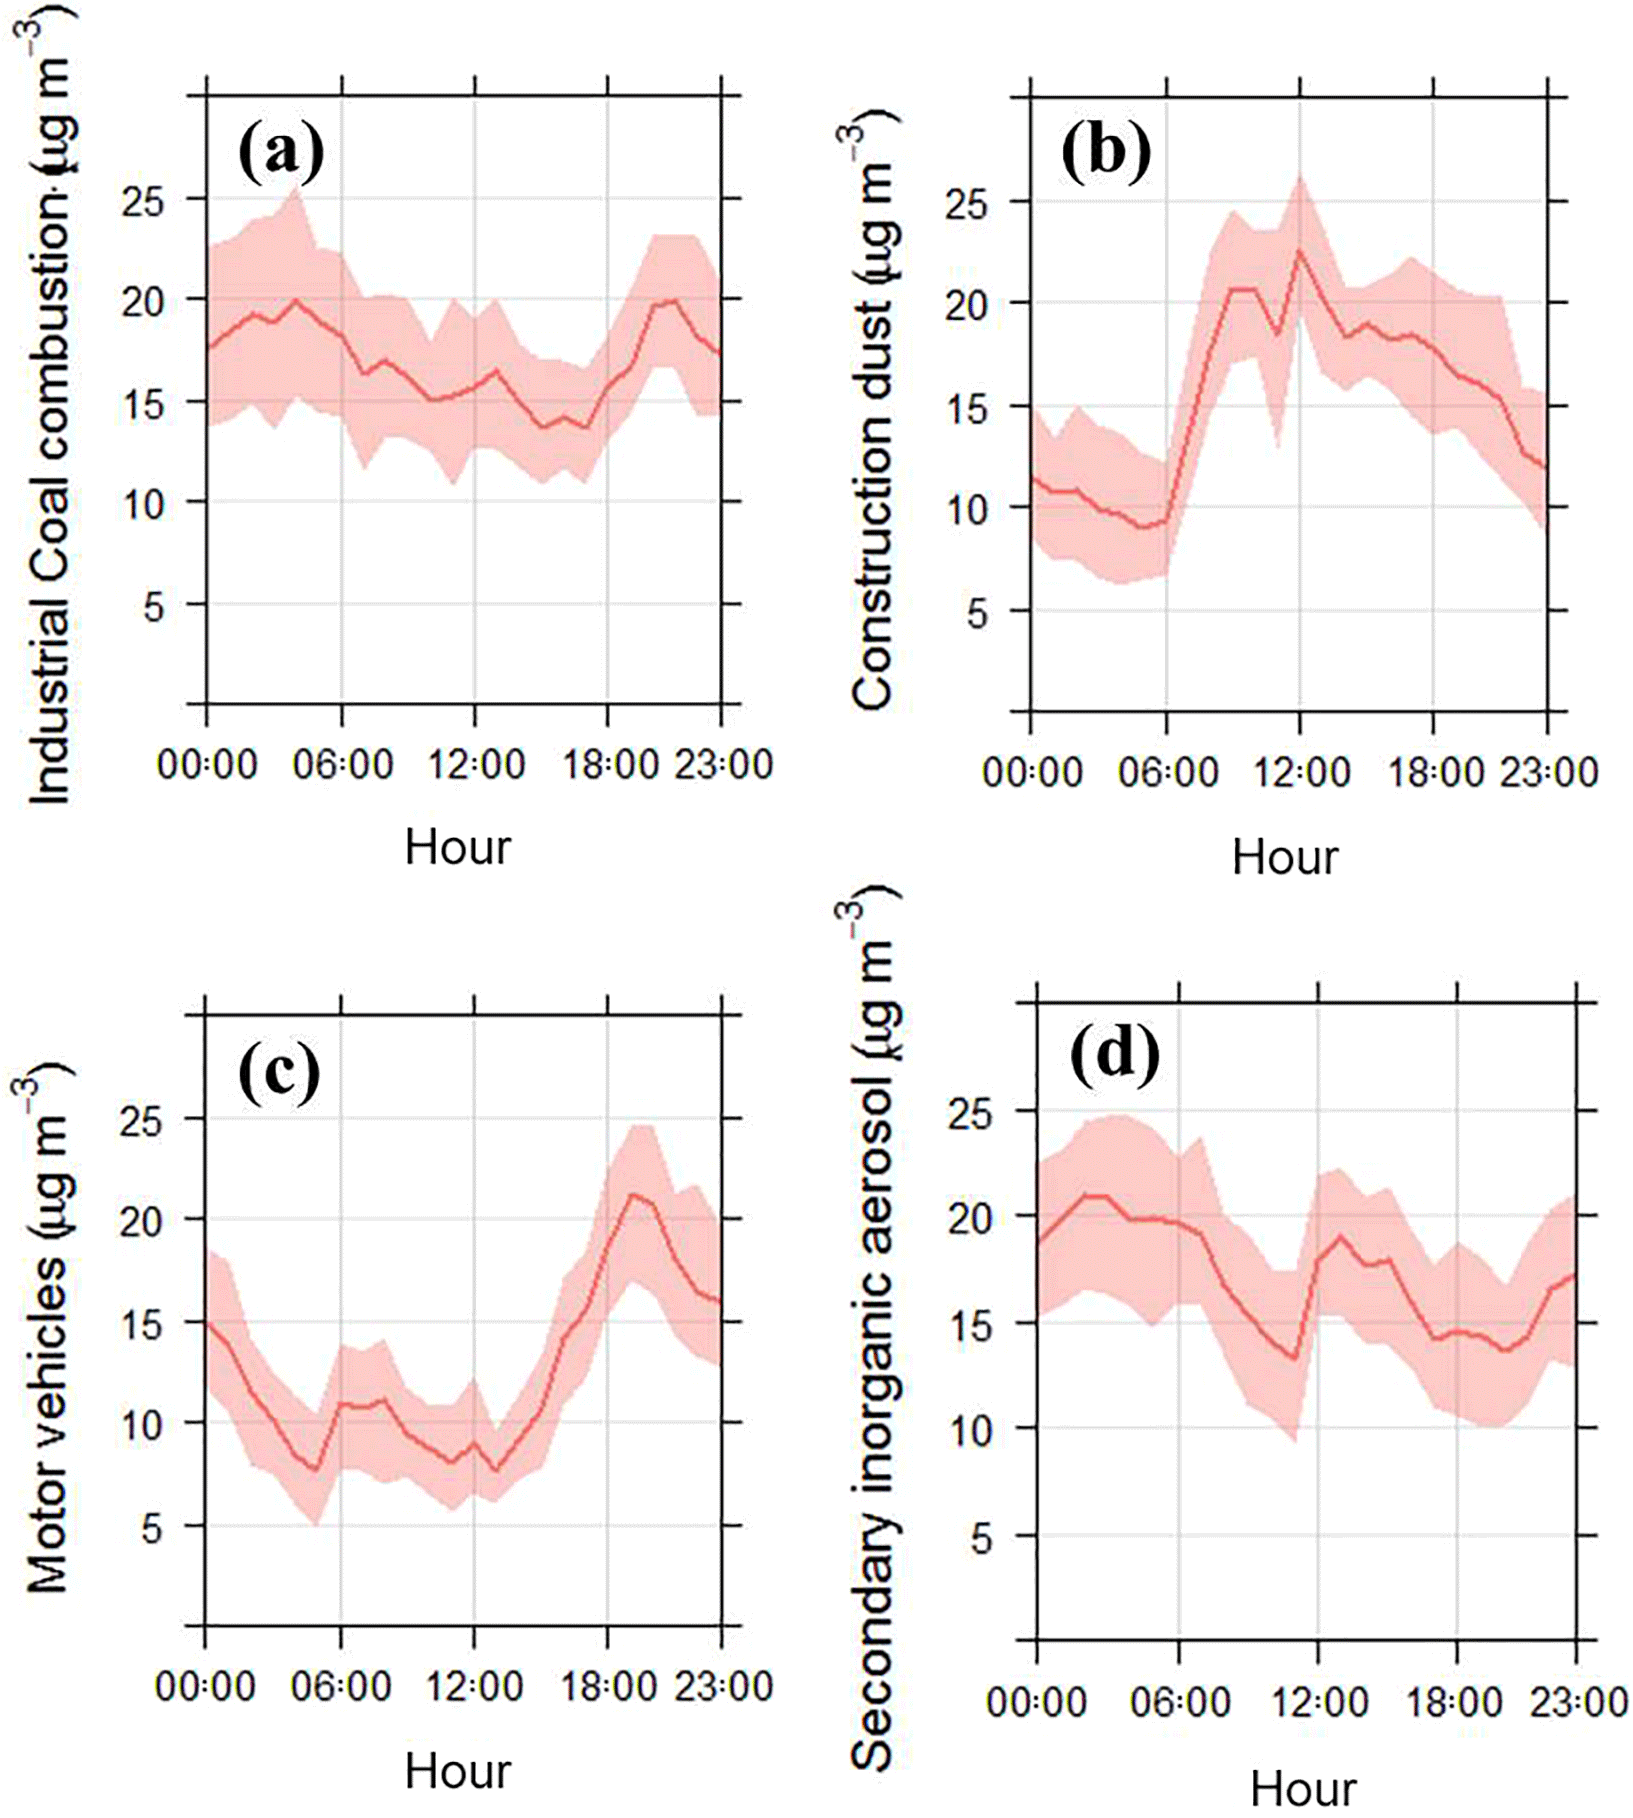
Figure 7Diurnal patterns in source contributions to PM at Foshan EMC during the monitoring period (the shaded area is the 5th and 95th confidence interval of the calculated mean).
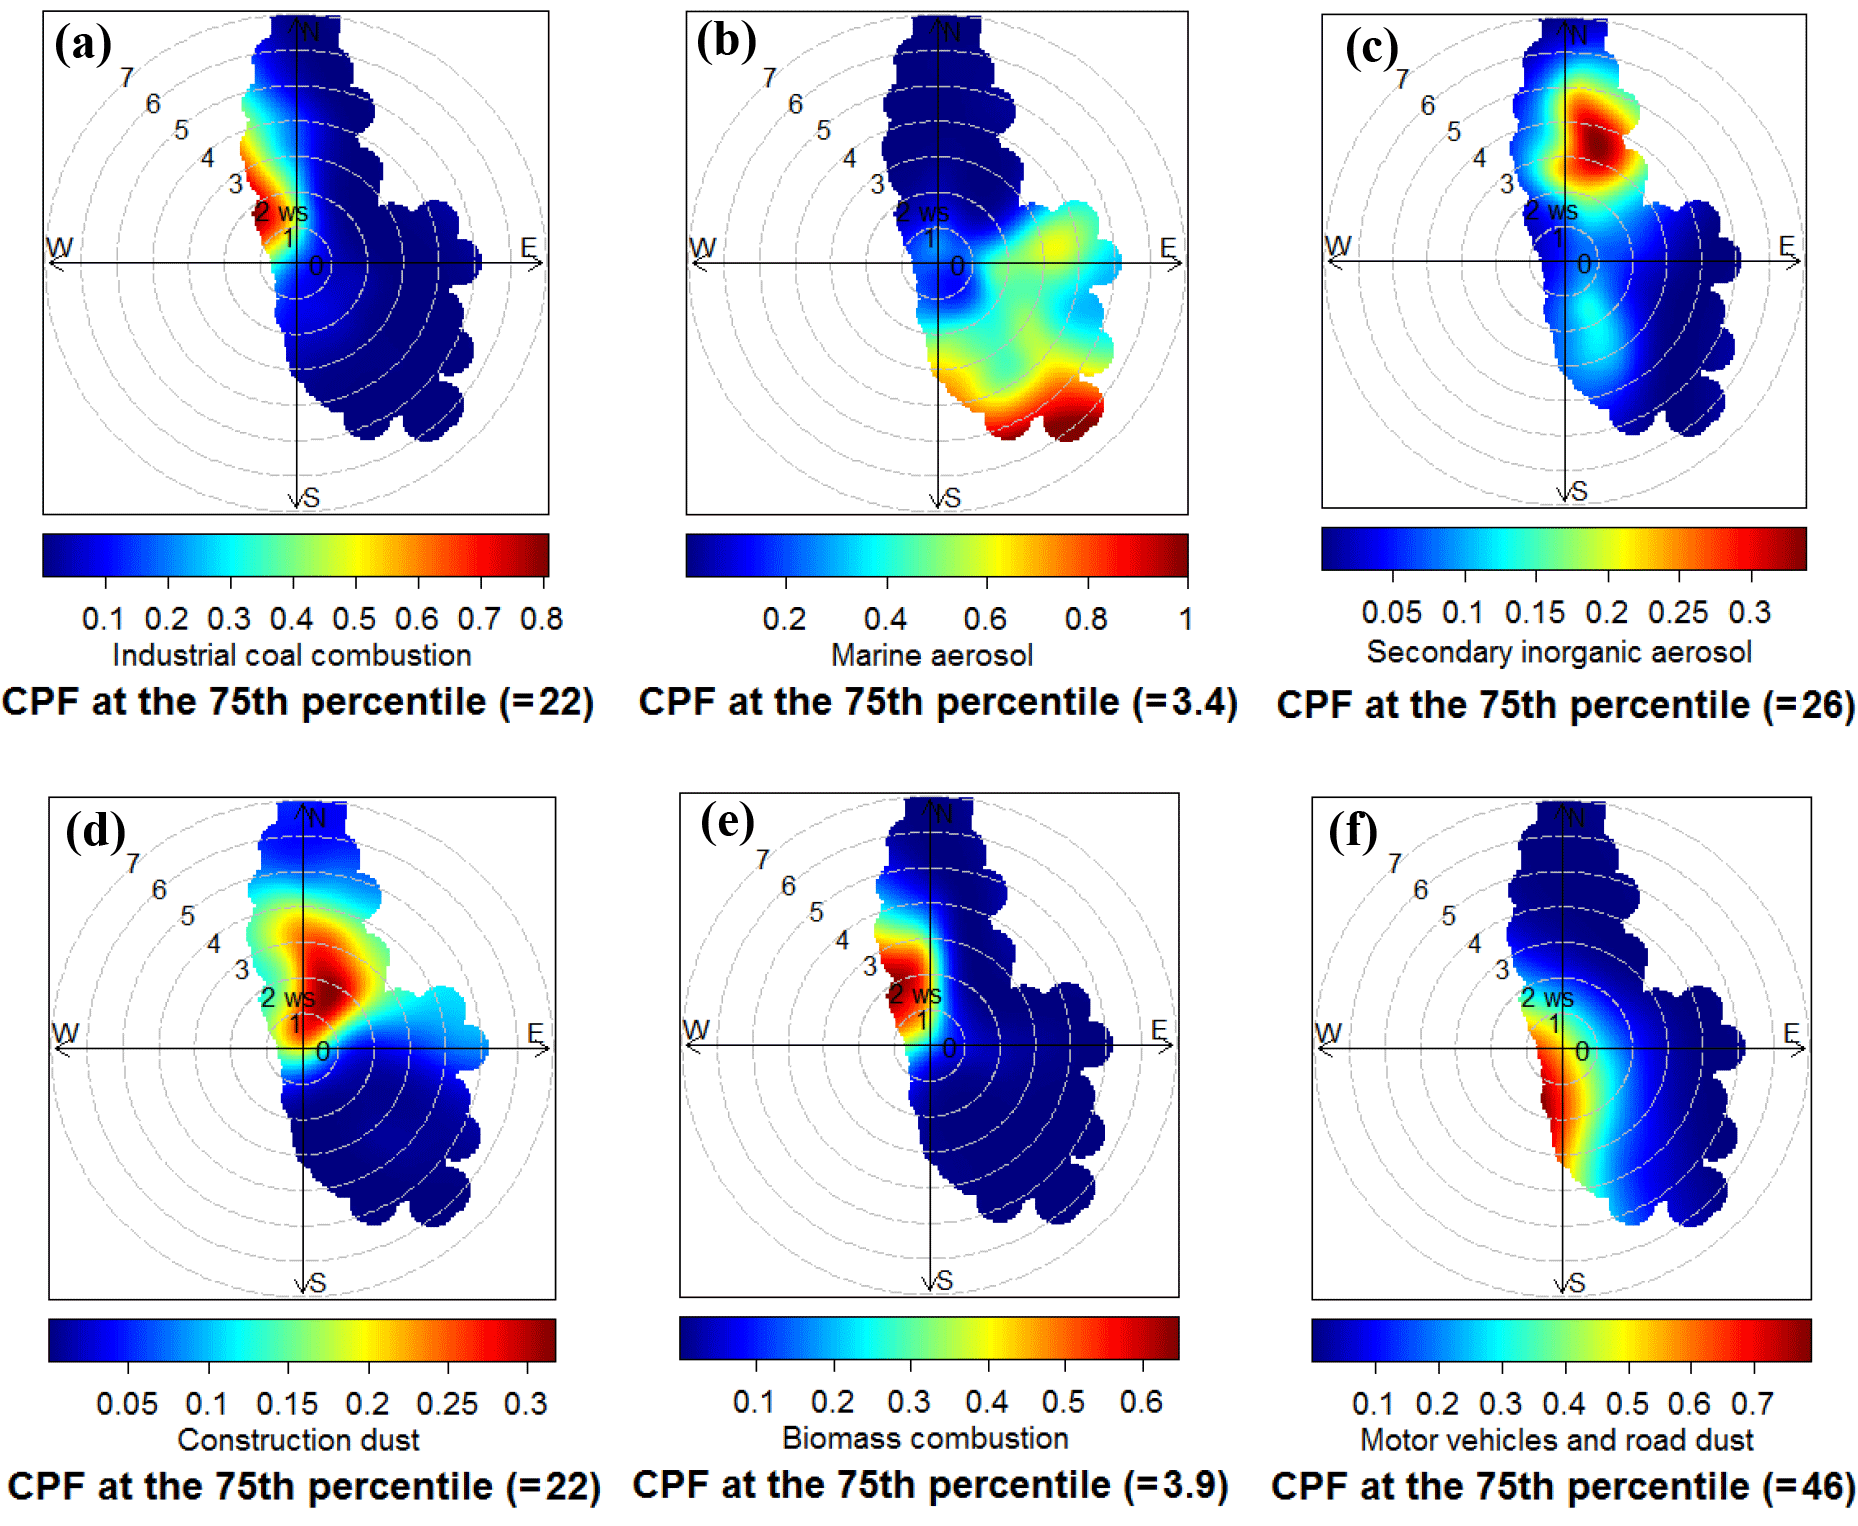
Figure 8 presents bivariate CPF polar plots for the source contributions to PM. Fig. 8a shows that the highest 25 % of industrial coal combustion source contributions originated from the west to northwest quadrants under light winds (1–3 m s−1).
A highly resolved spatial anthropogenic emission inventory for PRD was conducted by South China University of Technology for the base year 2012 (Yin et al., 2017). The data shows that the highest density of PM2.5 combustion sources (including power plants and industrial combustion) and industrial processes emissions were concentrated within 30 km to the west and northwest of the Foshan EMC as presented in Fig. S5. Three other large coal fired power stations were also located approximately 20 km to the west–southwest of the monitoring site.
Peak marine aerosol (Fig. 8b) arrived at the site from the southeast at higher wind speeds (5–7 m s−1) in the direction of the South China Sea. Secondary inorganic aerosol (Fig. 8c) came from the north-northeast direction at moderate wind speeds (3–5 m s−1) with a smaller component from the south-southeast. Construction dusts (Fig. 8d) were highest during low to moderate wind speeds out of the northeast sector, arriving from the direction of the Foshan city center, where the majority of construction activities were occurring. The upper 25 % of biomass combustion concentrations (Fig. 8e) were from the northwest sector. It is likely that the biomass combustion emission sources were intermittent and regional, related to agricultural activities or possibly wildfires. Peak motor vehicle source concentrations (Fig. 8f) occurred during south-southwest winds. The PM sampler was located 35 m above Fen Jiang Nan Road, which is an arterial route with six lanes running north–south past the monitoring site. The CPF result suggests that winds from the south-southwest were most effective in transporting roadway emissions to the sampler.
3.3 Health exposure risk of PM2.5 elements
3.3.1 PM2.5 elements human health assessment
Although none of the individual HQ values (As: 0.88, Mn: 0.54, Si: 0.29, Pb: 0.27, Cr: 0.09) for the identified toxic elements exceed 1, the HI value (sum of their HQs) was 2.09, much higher than the safe level (HQ = 1). This indicates significant non-carcinogenic risks. Arsenic was observed to have the highest risk, followed by Mn, Pb, Si and Cr (Fig. 9a). The non-carcinogenic HI did not show a distinct diurnal pattern (Fig. 10a).
On the other hand, the total CR of the carcinogenic elements was 3.37 × 10⁻⁴, higher than the least stringent level of 1.0 × 10⁻⁴ for adults. Pb (3.30 × 10⁻⁴) was found to be the most risky element (Fig. 9b). In addition, the CRs of Cr and As were 4.51 × 10⁻⁵ and 2.27 × 10⁻⁵, respectively, exceeding the middle stringent cancer risk level (1.0 × 10⁻⁵), and the CR of Ni was 8.71 × 10⁻⁷, lower than the least stringent level (1.0 × 10⁻⁶). The predominant contribution of Pb to the cancer risk could exactly explain why the diurnal variation of carcinogenic risk was in response to the pattern of ambient-air-detected Pb concentrations (Fig. 10). From the source apportionment results, lead was mainly emitted from industrial coal combustion (91.5 %), and slightly from biomass burning (8.5 %). Around 08:00 was found to be the most risky time period of the day (Fig. 10).
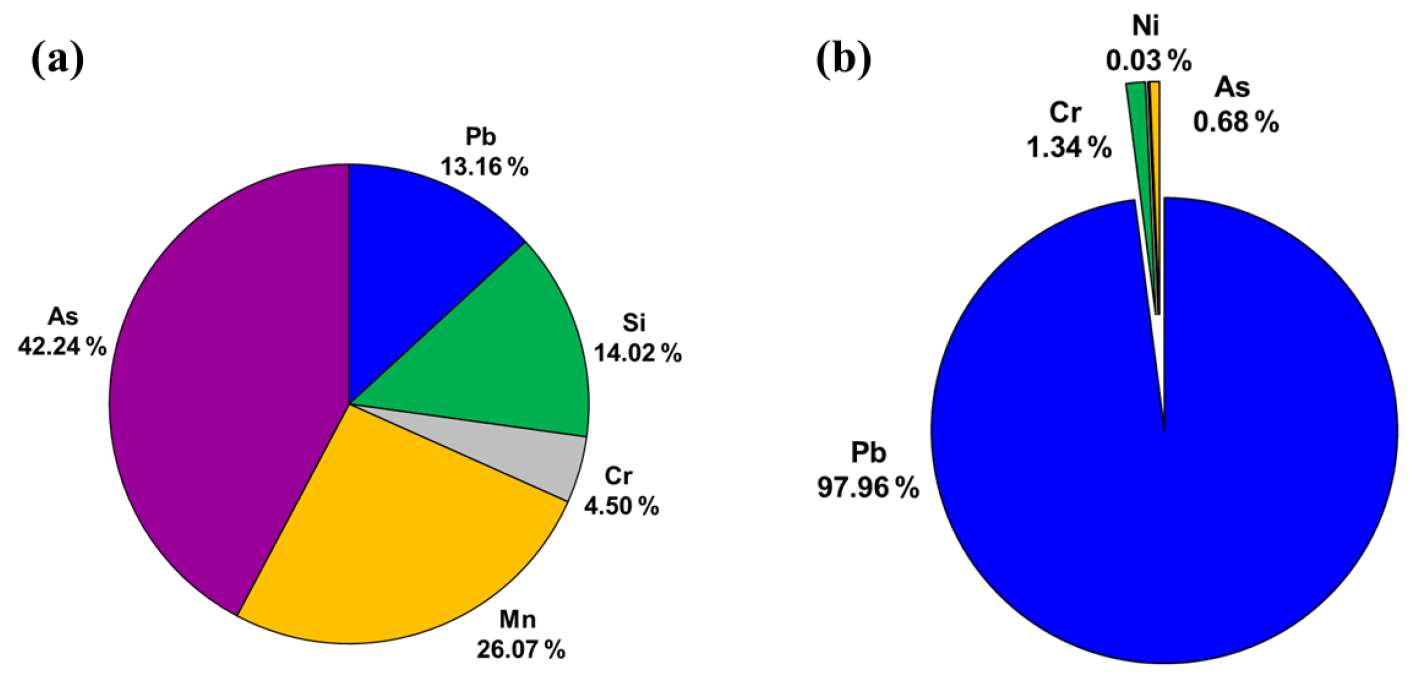
Figure 9(a) Average contribution percentage of selected trace elements to HI and (b) average contribution percentage of selected trace elements to total carcinogenic risk (CR).
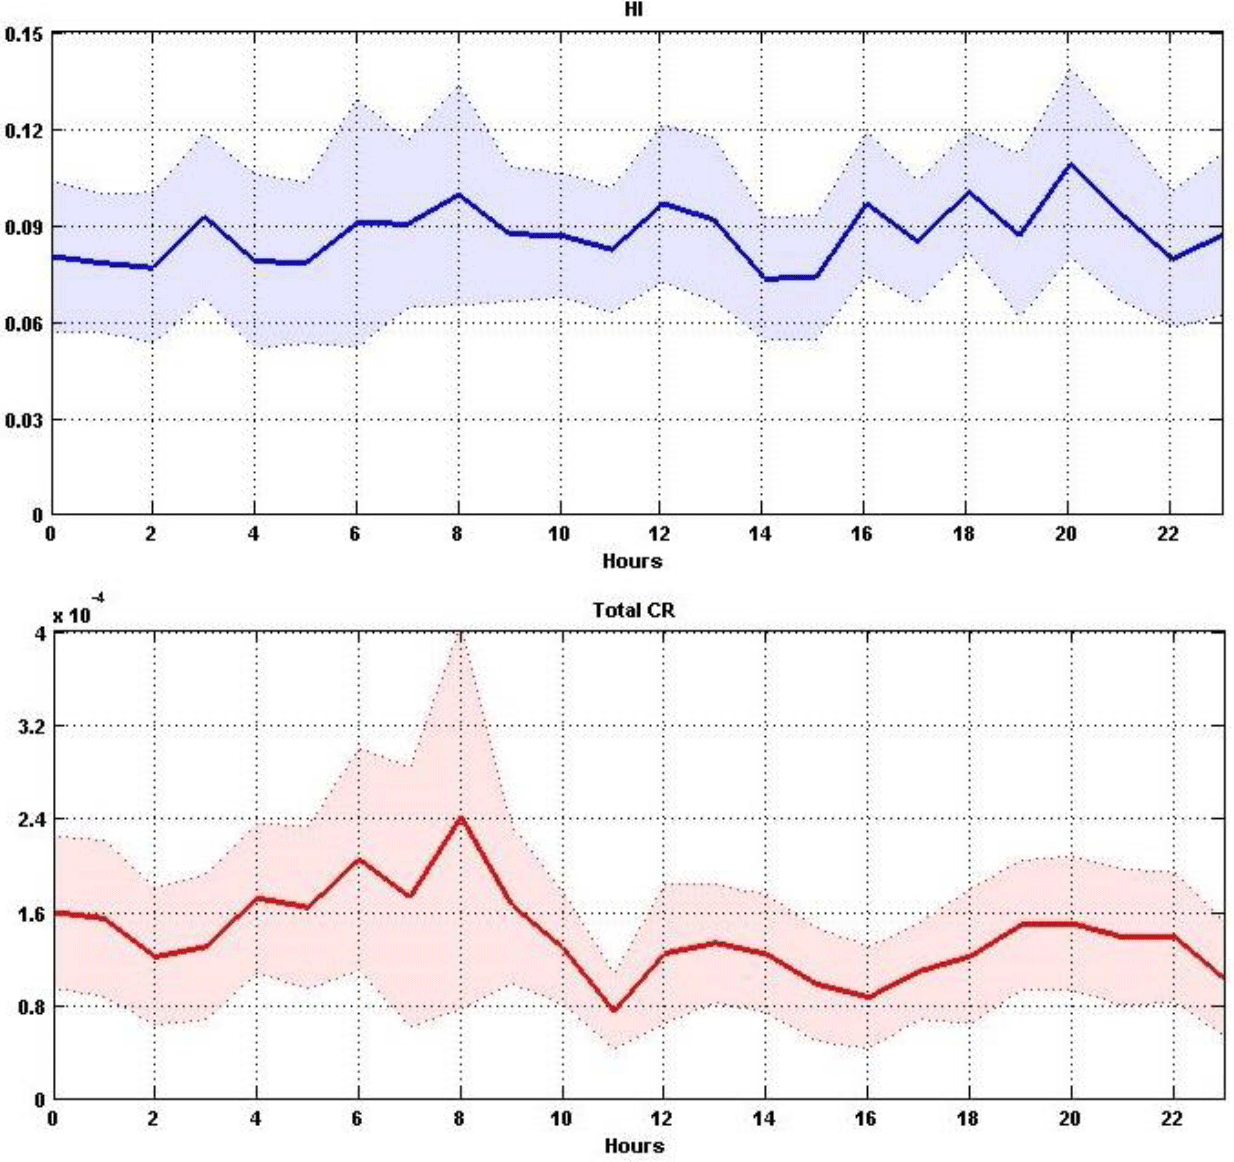
Figure 10Diurnal variations of HI and CR from selected trace elements in PM2.5 in Foshan City. Shaded areas represent the 95 % confidence intervals.
3.3.2 Health risk assessment of resolved PM sources
Based on PMF source apportionment results and the contribution of each toxic element to the non-carcinogenic/carcinogenic risks, the industrial coal combustion source was identified as the largest non-carcinogenic risk contributor (Fig. 11). Construction dust and secondary inorganic aerosol were also important sources (Fig. 11). For the carcinogenic risks, industrial coal combustion was found to be the largest contributor, followed by biomass burning sources. Similar findings were reported by Khan et al. (2016) in the tropical environment in Malaysia. Secondary inorganic aerosols contributed approximately 25 % of the PM2.5 mass, but they posed little carcinogenic risk. The other three sources (i.e., construction dust, motor vehicles and road dust and marine aerosol) also contributed generally low to CR.
From the perspective of human health effects, industrial coal combustion has been identified as the most important emission source. We also found that it contributed the most to PM2.5 mass from the source apportionment results (Sect. 3.2). Therefore, controlling industrial coal combustion sources achieves the benefit of reducing both PM2.5 mass concentration and human health risks.
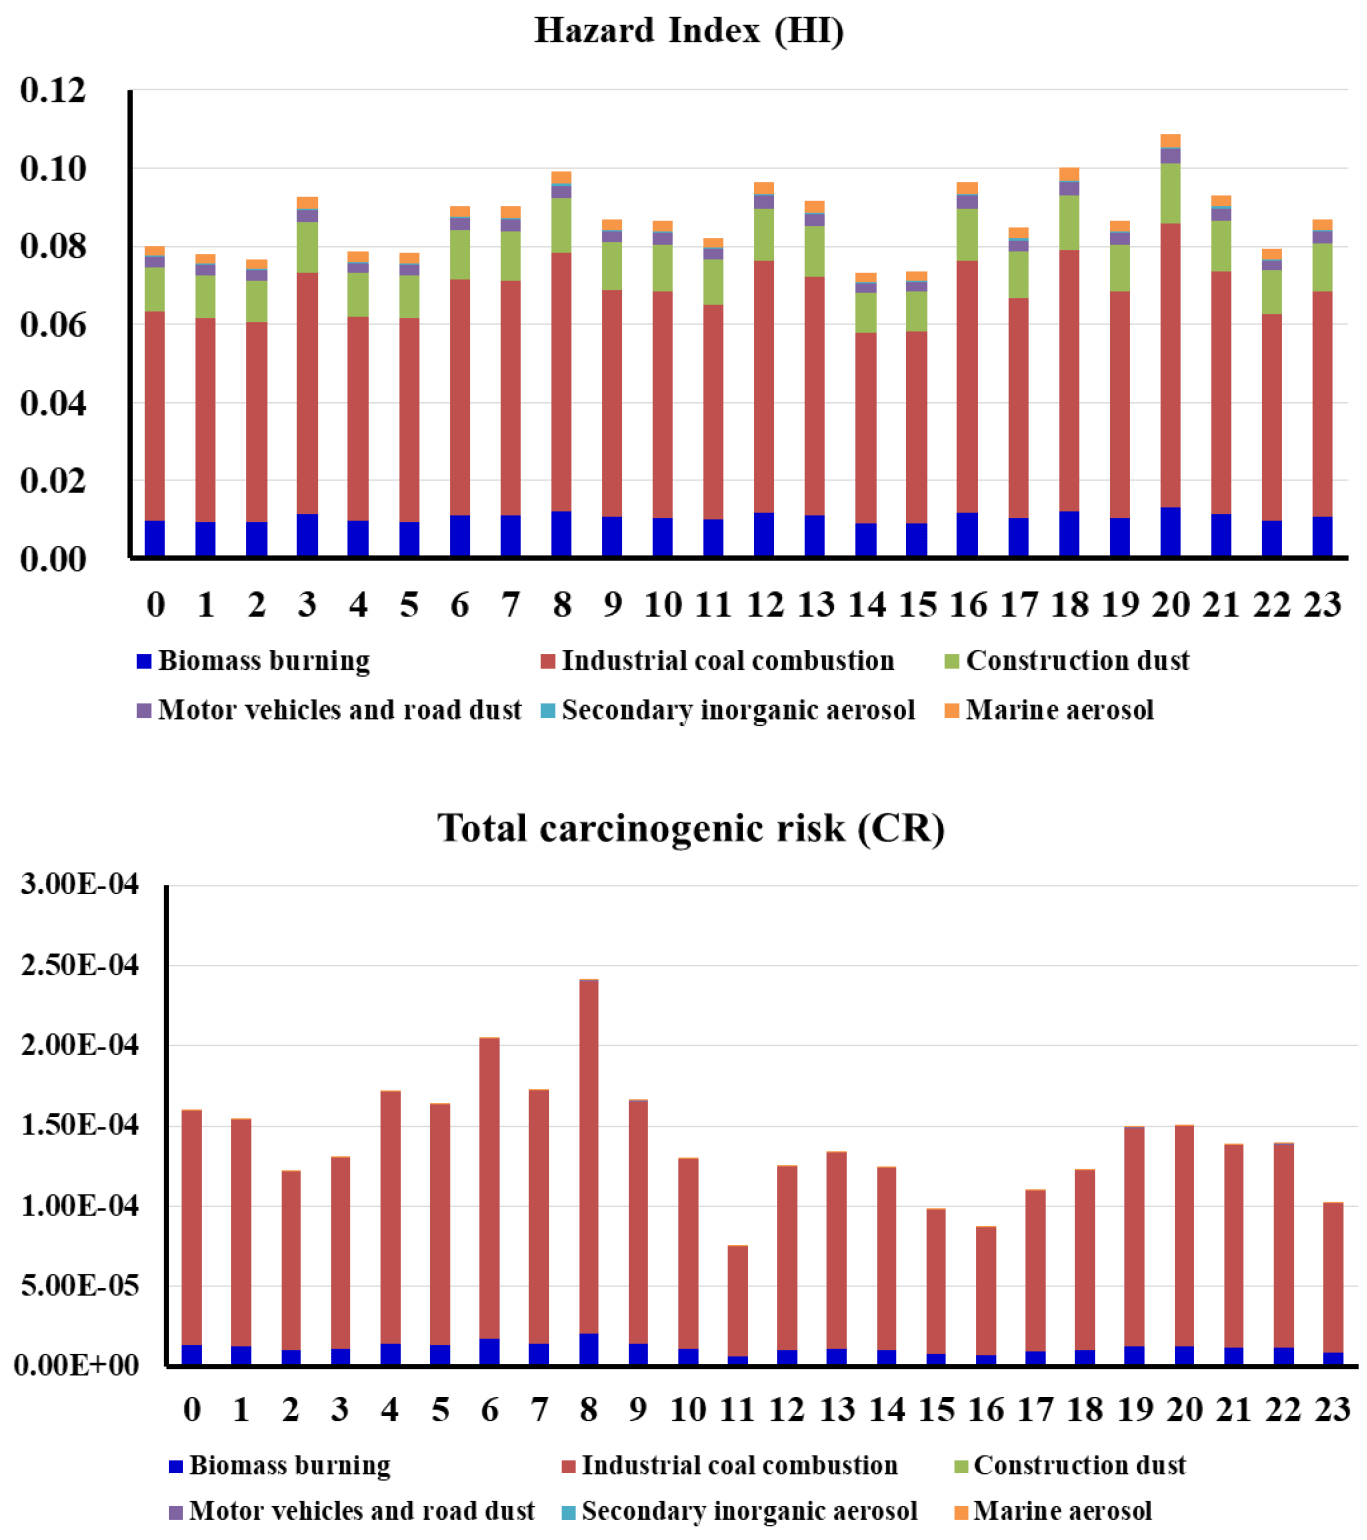
Figure 11Daily variation of average contribution of the identified sources to health risks over the observation periods.

Figure 12CPF analysis polar plots of (a) HI and (b) total carcinogenic risk at Foshan City. The center of each plot represents a wind speed of zero with increasing radially outward. The HI and CR probability is shown by the color scale.
The CPF analysis indicated that the highest health risks of PM2.5 came from north and northwest directions (Fig. 12). As stated in Sect. 3.2, there are a large number of industrial activities in the north and northwest directions including ceramic industry and coal combustion. Foshan is an industrial city famous for its ceramic and manufacturing industries (Wan et al., 2011; Tan et al., 2014). The emissions of large quantities of air pollutants from the above-mentioned industries resulted in deteriorating air quality in Foshan, a city which has always ranked among cities with the heaviest air pollution in the PRD region. Since 2007, the Foshan government has launched a series of policy measures to improve the local air quality. The policies are effective in the reduction of PM concentrations, especially in the anthropogenic elements and water soluble ions (Tan et al., 2016). However, our results showed that more efforts are needed to further protect human health.
In this study, hourly time-resolved major trace elemental composition in coarse (PM2.5–10) and fine (PM2.5) particulate matter were measured during autumn 2014 at an industrial city Foshan, in the Pearl River Delta region. PM2.5 and PM10 mass concentration and some of the gas-phase pollutants were concurrently recorded using commercial continuous PM and gases monitors. The results showed that PM2.5 and PM10 displayed drastic variations with the highest hourly averaged concentration over 250 and 350 µg m−3, respectively, suggesting the severe PM pollution in autumn/winter seasons at Foshan city. Source apportionment of PM using positive matrix factorization on the hourly data revealed six PM2.5 and PM10 sources: industrial coal combustion, secondary inorganic aerosol, motor vehicles and road dust, construction dust, biomass combustion and marine aerosol. Using the hourly resolution elemental data, we improved the source apportionment of PM, especially for the sources with notably temporal variation, such as biomass burning. We found that the industrial coal combustion sources were the largest contributor to PM2.5, while motor vehicles and road dust sources had the highest contribution to PM10. Additionally, biomass combustion was observed to additively contribute to PM2.5 levels resulting in the highest PM2.5 concentrations measured during the monitoring period. Control of regional biomass combustion activities may be one option for preventing extreme PM2.5 events and the associated health burden.
Based on the PMF-resolved sources, the health risks posed by selected trace elements (Pb, As, Si, Cr, Mn and Ni) in PM2.5 via inhalation exposure were assessed. The results indicated that As and Pb posed the highest non-carcinogenic and carcinogenic risks to human health, respectively. Industrial coal combustion was the dominant source responsible for human health impacts, constituting 66.8 % of the hazard index and 92 % of the cancer risks. CPF results indicated high health risks in the north and northwest directions, which was assigned to the intensive industrial activities such as coal burning and manufacturing industry. Therefore, controlling industrial coal combustion sources will result in reducing both PM2.5 mass concentration and health risk. This study utilized the hourly measured elemental components combined with PM2.5, PM10 and gas pollutants, and provided valuable information on PM sources identification and control. The source–risk apportionment method helps decision makers to manage air quality more effectively.
The data used in this study are available from the authors upon request (eeswxm@mail.sysu.edu.cn).
The supplement related to this article is available online at: https://doi.org/10.5194/acp-18-2049-2018-supplement.
The authors declare that they have no conflict of interest.
This article is part of the special issue “Regional transport and transformation of air pollution in eastern China”. It does not belong to a conference.
Funding for the program collaboration was provided by the Natural Science
Foundation of Guangdong Province (2014A030310497), National Natural Science
Foundation of China (41505106), Guangdong Provincial Scientific Planning
Project (2016B050502005), National Science Fund for Distinguished Young
Scholars (41425020), High-end Foreign Experts Recruitment Program of
Guangdong Province (02090-52920003) and the Science and Technology Planning
Project of Guangdong Province (2014B020216003). The New Zealand Ministry of
Business, Innovation and Employment, the New Zealand Institute of Geological
and Nuclear Sciences, and Foshan Environmental Monitoring Center are also
acknowledged.
Edited by: Jianmin Chen
Reviewed by: three anonymous referees
Amato, F., Pandolfi, M., Escrig, A., Querol, X., Alastuey, A., Pey, J., Perez, N., and Hopke, P.: Quantifying road dust resuspension in urban environment by multilinear engine: a comparison with PMF2, Atmos. Environ., 43, 2770–2780, https://doi.org/10.1016/j.atmosenv.2009.02.039, 2009.
Ancelet, T., Davy, P. K., Trompetter, W. J., Markwitz, A., and Weatherburn, D. C.: Carbonaceous aerosols in an urban tunnel, Atmos. Environ., 45, 4463–4469, https://doi.org/10.1016/j.atmosenv.2011.05.032, 2011.
Ancelet, T., Davy, P. K., Mitchell, T., Trompetter, W. J., Markwitz, A., and Weatherburn, D. C.: Identification of Particulate Matter Sources on an Hourly Time-Scale in a Wood Burning Community, Environ. Sci. Technol., 46, 4767–4774, https://doi.org/10.1021/es203937y, 2012.
Ancelet, T., Davy, P. K., Trompetter, W. J., Markwitz, A., and Weatherburn, D. C.: Particulate matter sources on an hourly timescale in a rural community during the winter, J. Air Waste Manage., 64, 501–508, https://doi.org/10.1080/10962247.2013.813414, 2014.
Anlauf, K., Li, S.-M., Leaitch, R., Brook, J., Hayden, K., Toom-Sauntry, D., and Wiebe, A.: Ionic composition and size characteristics of particles in the Lower Fraser Valley: Pacific 2001 field study, Atmos. Environ., 40, 2662–2675, https://doi.org/10.1016/j.atmosenv.2005.12.027, 2006.
Annegarn, H. J., Cahill, T. A., Sellschop, J. F. P., and Zucchiatti, A.: Time sequence particulate sampling and nuclear analysis, Phys. Scripta, 37, 282–290, https://doi.org/10.1088/0031-8949/37/2/016, 1988.
Annegarn, H. J., Marcazzan, G. M. B., Cereda, E., Marchionni, M., and Zucchiatti, A.: Source profiles by unique ratios (spur) analysis: Determination of source profiles from receptor-site streaker samples, Atmos. Environ. A-Gen., 26A, 333–343, https://doi.org/10.1016/0960-1686(92)90314-B, 1992.
Annegarn, H. J., Flanz, M., Kenntner, T., Kneen, M. A., Helas, G., and Piketh, S. J.: Airborne streaker sampling for PIXE analysis, Nucl. Instrum. Meth. B, 109–110, 548–550, https://doi.org/10.1016/0168-583X(95)00966-3, 1996.
Belis, C., Karagulian, F., Larsen, B., and Hopke, P.: Critical review and meta-analysis of ambient particulate matter source apportionment using receptor models in Europe, Atmos. Environ., 69, 94–108, https://doi.org/10.1016/j.atmosenv.2012.11.009, 2013.
Bell, M. L., Ebisu, K., Leaderer, B. P., Gent, J. F., Lee, H. J., Koutrakis, P., Wang, Y., Dominici, F., and Peng, R. D.: Associations of PM2.5 Constituents and Sources with Hospital Admissions: Analysis of Four Counties in Connecticut and Massachusetts (USA) for Persons >or = 65 Years of Age, Environ. Health Persp., 122, 138–144, https://doi.org/10.1289/ehp.1306656, 2014.
Brown, S. G., Eberly, S., Paatero, P., and Norris, G. A.: Methods for estimating uncertainty in PMF solutions: Examples with ambient air and water quality data and guidance on reporting PMF results, Sci. Total Environ., 518, 626–635, https://doi.org/10.1016/j.scitotenv.2015.01.022, 2015.
Cahill, T. A., Eldred, R. A., Motallebi, N., and Malm, W. C.: Indirect measurement of hydrocarbon aerosols across the United States by nonsulfate hydrogen-remaining gravimetric mass correlations, Aerosol Sci. Tech., 10, 421–429, https://doi.org/10.1080/02786828908959281, 1989.
Carslaw, D. C. and Ropkins, K.: Open-Source Tools for Analysing Air Pollution Data, Environ. Modell. Softw., 27–28, 52–61, https://doi.org/10.1016/j.envsoft.2011.09.008, 2012.
Chen, L. C. and Lippmann, M.: Effects of metals within ambient air particulate matter (PM) on human health, Inhal. Toxicol., 21, 1–31, https://doi.org/10.1080/08958370802105405, 2009.
Chen, W., Wang, X., Cohen, J. B., Zhou, S., Zhang, Z., Chang, M., and Chan, C.-Y.: Properties of aerosols and formation mechanisms over southern China during the monsoon season, Atmos. Chem. Phys., 16, 13271–13289, https://doi.org/10.5194/acp-16-13271-2016, 2016.
Chueinta, W., Hopke, P. K., and Paatero, P.: Investigation of sources of atmospheric aerosol at urban and suburban residential areas in Thailand by positive matrix factorization, Atmos. Environ., 34, 3319–3329, https://doi.org/10.1016/S1352-2310(99)00433-1, 2000.
Cohen, D. D.: Accelerator based ion beam techniques for trace element aerosol analysis, Advances in Environmental, Industrial and Process Control Technologies, 1, 139–196, 1999.
Crilley, L. R., Lucarelli, F., Bloss, W. J., Harrison, R. M., Beddows, D. C., Calzolai, G., Nava, S., Valli, G., Bernardoni, V., and Vecchi, R.: Source apportionment of fine and coarse particles at a roadside and urban background site in London during the 2012 summer ClearfLo campaign, Environ. Pollut., 220, 766–778, https://doi.org/10.1016/j.envpol.2016.06.002, 2017.
D'Alessandro, A., Nava, S., Van Ham, R., Adriaens, A., Lucarelli, F., Marcazzan, G., Prati, P., Valli, G., Vecchi, R., and Zucchiatti, A.: PIXE and ToF-SIMS analysis of streaker samplers filters, Nucl. Instrum. Meth. B, 222, 261–269, https://doi.org/10.1016/j.nimb.2004.02.014, 2004.
Dall'Osto, M., Querol, X., Amato, F., Karanasiou, A., Lucarelli, F., Nava, S., Calzolai, G., and Chiari, M.: Hourly elemental concentrations in PM2.5 aerosols sampled simultaneously at urban background and road site during SAPUSS – diurnal variations and PMF receptor modelling, Atmos. Chem. Phys., 13, 4375–4392, https://doi.org/10.5194/acp-13-4375-2013, 2013.
Dockery, D. W., Pope, C. A., Xu, X., Spengler, J. D., Ware, J. H., Fay, M. E., Ferris Jr., B. G., and Speizer, F. E.: An association between air pollution and mortality in six US cities, New Engl. J. Med., 329, 1753–1759, https://doi.org/10.1056/NEJM199312093292401, 1993.
Filippi, E., Prati, P., Zucchiatti, A., Lucarelli, F., Ariola, V., and Corvisiero, P.: Hourly measurement of particulate concentrations with streaker samplers and optical methods, Nucl. Instrum. Meth. B, 150, 370–374, https://doi.org/10.1016/S0168-583X(98)01075-1, 1999.
Freney, E. J., Sellegri, K., Canonaco, F., Colomb, A., Borbon, A., Michoud, V., Doussin, J.-F., Crumeyrolle, S., Amarouche, N., Pichon, J.-M., Bourianne, T., Gomes, L., Prevot, A. S. H., Beekmann, M., and Schwarzenböeck, A.: Characterizing the impact of urban emissions on regional aerosol particles: airborne measurements during the MEGAPOLI experiment, Atmos. Chem. Phys., 14, 1397–1412, https://doi.org/10.5194/acp-14-1397-2014, 2014.
Gao, J., Peng, X., Chen, G., Xu, J., Shi, G. L., Zhang, Y. C., and Feng, Y. C.: Insights into the chemical characterization and sources of PM2.5 in Beijing at a 1-h time resolution, Sci. Total Environ., 542, 162–171, https://doi.org/10.1016/j.scitotenv.2015.10.082, 2016.
George, I. and Abbatt, J.: Heterogeneous oxidation of atmospheric aerosol particles by gas-phase radicals, Nat. Chem., 2, 713–722, https://doi.org/10.1038/nchem.806, 2010.
Guo, S., Tan, J., Ma, Y., Yang, F., Yu, Y., and Wang, J.: Characteristics of atmospheric non-methane hydrocarbons during high PM10 episodes and normal days in Foshan, China, Atmos.Res., 101, 701–710, https://doi.org/10.1016/j.atmosres.2011.04.022, 2011.
Heal, M. R., Kumar, P., and Harrison, R. M.: Particles, air quality, policy and health, Chem. Soc. Rev., 41, 6606–6630, https://doi.org/10.1039/c2cs35076a, 2012.
Hu, J., Wang, Y., Ying, Q., and Zhang, H.: Spatial and temporal variability of PM2.5 and PM10 over the North China Plain and the Yangtze River Delta, China, Atmos. Environ., 95, 598–609, https://doi.org/10.1016/j.atmosenv.2014.07.019, 2014.
Huang, M., Wang, W., Chan, C. Y., Cheung, K. C., Man, Y. B., Wang, X., and Wong, M. H.: Contamination and risk assessment (based on bioaccessibility via ingestion and inhalation) of metal (loid) s in outdoor and indoor particles from urban centers of Guangzhou, China, Sci. Total Environ., 479, 117–124, https://doi.org/10.1016/j.scitotenv.2014.01.115, 2014.
Huang, M., Deng, S., Dong, H., Dai, W., Pang, J., and Wang, X.: Impacts of Atmospheric Mercury Deposition on Human Multimedia Exposure: Projection from Observations in the Pearl River Delta Region, South China, Environ. Sci. Technol., 50, 10625–10634, https://doi.org/10.1021/acs.est.6b00514, 2016.
Huang, R. J., Zhang, Y., Bozzetti, C., Ho, K. F., Cao, J. J., Han, Y., Daellenbach, K. R., Slowik, J. G., Platt, S. M., Canonaco, F., Zotter, P., Wolf, R., Pieber, S. M., Bruns, E. A., Crippa, M., Ciarelli, G., Piazzalunga, A., Schwikowski, M., Abbaszade, G., Schnelle-Kreis, J., Zimmermann, R., An, Z., Szidat, S., Baltensperger, U., Haddad, I. E., and Prevot, A. S. H.: High secondary aerosol contribution to particulate pollution during haze events in China, Nature, 514, 218–222, https://doi.org/10.1038/nature13774, 2014.
Huang, X.-F., He, L.-Y., Hu, M., Canagaratna, M. R., Kroll, J. H., Ng, N. L., Zhang, Y.-H., Lin, Y., Xue, L., Sun, T.-L., Liu, X.-G., Shao, M., Jayne, J. T., and Worsnop, D. R.: Characterization of submicron aerosols at a rural site in Pearl River Delta of China using an Aerodyne High-Resolution Aerosol Mass Spectrometer, Atmos. Chem. Phys., 11, 1865–1877, https://doi.org/10.5194/acp-11-1865-2011, 2011.
Kan, H., London, S. J., Chen, G., Zhang, Y., Song, G., Zhao, N., Jiang, L., and Chen, B.: Differentiating the effects of fine and coarse particles on daily mortality in Shanghai, China, Environ. Int., 33, 376–384, https://doi.org/10.1016/j.envint.2006.12.001, 2007.
Khan, M. F., Latif, M. T., Saw, W. H., Amil, N., Nadzir, M. S. M., Sahani, M., Tahir, N. M., and Chung, J. X.: Fine particulate matter in the tropical environment: monsoonal effects, source apportionment, and health risk assessment, Atmos. Chem. Phys., 16, 597–617, https://doi.org/10.5194/acp-16-597-2016, 2016.
Kim Oanh, N. T., Thiansathit, W., Bond, T. C., Subramanian, R., Winijkul, E., and Pawarmart, I.: Compositional characterization of PM2.5 emitted from in-use diesel vehicles, Atmos. Environ., 44, 15–22, https://doi.org/10.1016/j.atmosenv.2009.10.005, 2009.
Kirchstetter, T. W., Aguiar, J., Tonse, S., Fairley, D., and Novakov, T.: Black carbon concentrations and diesel vehicle emission factors derived from coefficient of haze measurements in California: 1967–2003, Atmos. Environ., 42, 480–491, https://doi.org/10.1016/j.atmosenv.2007.09.063, 2008.
Lee, E., Chan, C. K., and Paatero, P.: Application of positive matrix factorization in source apportionment of particulate pollutants in Hong Kong, Atmos. Environ., 33, 3201–3212, https://doi.org/10.1016/S1352-2310(99)00113-2, 1999.
Liu, W., Wang, Y. H., Russell, A., and Edgerton, E. S.: Enhanced source identification of southeast aerosols using temperature-resolved carbon fractions and gas phase components, Atmos. Environ., 40, 445–466, https://doi.org/10.1016/j.atmosenv.2005.11.079, 2006.
Maenhaut, W.: Source apportionment revisited for long-term measurements of fine aerosol trace elements at two locations in southern Norway, Nucl. Instrum. Meth. B, 417, 133–138, https://doi.org/10.1016/j.nimb.2017.07.006, 2018.
Malm, W. C., Sisler, J. F., Huffman, D., Eldred, R. A., and Cahill, T. A.: Spatial and seasonal trends in particle concentration and optical extinction in the United States, J. Geophys. Res.-Atmos., 99, 1347–1370, 1994.
Maxwell, J., Teesdale, W., and Campbell, J.: The Guelph PIXE software package II, Nucl. Instrum. Meth. B, 95, 407–421, https://doi.org/10.1016/0168-583X(94)00540-0, 1995.
Moreno, T., Querol, X., Alastuey, A., Reche, C., Cusack, M., Amato, F., Pandolfi, M., Pey, J., Richard, A., Prévôt, A. S. H., Furger, M., and Gibbons, W.: Variations in time and space of trace metal aerosol concentrations in urban areas and their surroundings, Atmos. Chem. Phys., 11, 9415–9430, https://doi.org/10.5194/acp-11-9415-2011, 2011.
Owega, S., Khan, B.-U.-Z., D'Souza, R., Evans, G. J., Fila, M., and Jervis, R. E.: Receptor Modeling of Toronto PM2.5 Characterized by Aerosol Laser Ablation Mass Spectrometry, Environ. Sci. Technol., 38, 5712–5720, https://doi.org/10.1021/es035177i, 2004.
Paatero, P.: Least squares formulation of robust non-negative factor analysis, Chemometr. Intell. Lab., 37, 23–35, https://doi.org/10.1016/S0169-7439(96)00044-5, 1997.
Paatero, P. and Hopke, P. K.: Discarding or downweighting high-noise variables in factor analytic models, Anal. Chim. Acta, 490, 277–289, https://doi.org/10.1016/S0003-2670(02)01643-4, 2003.
Paatero, P. and Tapper, U.: Positive matrix factorization: A non-negative factor model with optimal utilization of error estimates of data values, Environmetrics, 5, 111–126, https://doi.org/10.1002/env.3170050203, 1994.
Paatero, P., Eberly, S., Brown, S. G., and Norris, G. A.: Methods for estimating uncertainty in factor analytic solutions, Atmos. Meas. Tech., 7, 781–797, https://doi.org/10.5194/amt-7-781-2014, 2014.
Pancras, J. P., Landis, M. S., Norris, G. A., Vedantham, R., and Dvonch, J. T.: Source apportionment of ambient fine particulate matter in Dearborn, Michigan, using hourly resolved PM chemical composition data, Sci. Total Environ., 448, 2–13, https://doi.org/10.1016/j.scitotenv.2012.11.083, 2013.
Pant, P. and Harrison, R. M.: Critical review of receptor modelling for particulate matter: A case study of India, Atmos. Environ., 49, 1–12, https://doi.org/10.1016/j.atmosenv.2012.11.009, 2012.
Pant, P. and Harrison, R. M.: Estimation of the contribution of road traffic emissions to particulate matter concentrations from field measurements: A review, Atmos. Environ., 77, 78–97, https://doi.org/10.1016/j.atmosenv.2013.04.028, 2013.
Pekney, N. J., Davidson, C. I., Zhou, L., and Hopke, P. K.: Application of PSCF and CPF to PMF-Modeled Sources of PM2.5 in Pittsburgh, Aerosol Sci. Tech., 40, 952–961, https://doi.org/10.1080/02786820500543324, 2006.
Polissar, A. V., Hopke, P. K., Paatero, P., Malm, W. C., and Sisler, J. F.: Atmospheric aerosol over Alaska: 2. Elemental composition and sources, J. Geophys. Res.-Atmos., 103, 19045–19057, https://doi.org/10.1029/98jd01212, 1998.
Pope III, C. A., Ezzati, M., and Dockery, D. W.: Fine-particulate air pollution and life expectancy in the United States, New Engl. J. Med., 360, 376–386, https://doi.org/10.1056/NEJMsa0805646, 2009.
Pósfai, M., Gelencsér, A., Simonics, R., Arató, K., Li, J., Hobbs, P., and Buseck, P.: Atmospheric tar balls: Particles from biomass and biofuel burning, J. Geophys. Res.-Atmos., 109, D06213, https://doi.org/10.1029/2003JD004169, 2004.
Querol, X., Pey, J., Minguillón, M. C., Pérez, N., Alastuey, A., Viana, M., Moreno, T., Bernabé, R. M., Blanco, S., Cárdenas, B., Vega, E., Sosa, G., Escalona, S., Ruiz, H., and Artíñano, B.: PM speciation and sources in Mexico during the MILAGRO-2006 Campaign, Atmos. Chem. Phys., 8, 111–128, https://doi.org/10.5194/acp-8-111-2008, 2008.
Querol, X., Alastuey, A., Viana, M., Moreno, T., Reche, C., Minguillón, M. C., Ripoll, A., Pandolfi, M., Amato, F., Karanasiou, A., Pérez, N., Pey, J., Cusack, M., Vázquez, R., Plana, F., Dall'Osto, M., de la Rosa, J., Sánchez de la Campa, A., Fernández-Camacho, R., Rodríguez, S., Pio, C., Alados-Arboledas, L., Titos, G., Artíñano, B., Salvador, P., García Dos Santos, S., and Fernández Patier, R.: Variability of carbonaceous aerosols in remote, rural, urban and industrial environments in Spain: implications for air quality policy, Atmos. Chem. Phys., 13, 6185–6206, https://doi.org/10.5194/acp-13-6185-2013, 2013.
Reche, C., Moreno, T., Amato, F., Viana, M., van Drooge, B. L., Chuang, H.-C., Bérubé, K., Jones, T., Alastuey, A., and Querol, X.: A multidisciplinary approach to characterise exposure risk and toxicological effects of PM10 and PM2.5 samples in urban environments, Ecotox. Environ. Safe., 78, 327–335, https://doi.org/10.1016/j.ecoenv.2011.11.043, 2012.
Rhys-Tyler, G. A., Legassick, W., and Bell, M. C.: The significance of vehicle emissions standards for levels of exhaust pollution from light vehicles in an urban area,Atmos. Environ., 45, 3286–3293, https://doi.org/10.1016/j.atmosenv.2011.03.035, 2011.
Seinfeld, J. and Pandis, S.: Atmospheric Chemistry and Physics: From air pollution to climate change, John Wiley & Sons, New York, USA, 2006.
Song, X., Polissar, A., and Hopke, P.: Sources of fine particle composition in the northeastern US, Atmos. Environ., 35, 5277–5286, https://doi.org/10.1016/S1352-2310(01)00338-7, 2001.
Song, Y., Tang, X., Xie, S., Zhang, Y., Wei, Y., Zhang, M., Zeng, L., and Lu, S.: Source apportionment of PM2.5 in Beijing in 2004, J. Hazard. Mater., 146, 124–130, https://doi.org/10.1016/j.jhazmat.2006.11.058, 2007.
Sun, Y., Zhuang, G., Wang, Y., Han, L., Guo, J., Dan, M., Zhang, W., Wang, Z., and Hao, Z.: The air-borne particulate pollution in Beijing – concentration, composition, distribution and sources, Atmos. Environ., 38, 5991–6004, https://doi.org/10.1016/j.atmosenv.2004.07.009, 2004.
Sun, Y., Jiang, Q., Wang, Z., Fu, P.Q., Li, J., Yang, T., and Yin, Y.: Investigation of the sources and evolution processes of severe haze pollution in Beijing in January 2013, J. Geophys. Res.-Atmos., 119, 2169–8996, https://doi.org/10.1002/2014JD021641, 2014.
Taiwo, A. M., Beddows, D. C. S., Shi, Z., and Harrison, R. M.: Mass and number size distributions of particulate matter components: Comparison of an industrial site and an urban background site, Sci. Total Environ., 475, 29–38, https://doi.org/10.1016/j.scitotenv.2013.12.076, 2014.
Tan, J. H., Duan, J. C., Ma, Y. L., Yang, F. M., Cheng, Y., He, K.-B., Yu, Y. C., and Wang, J. W.: Source of atmospheric heavy metals in winter in Foshan, China, Sci. Total Environ., 493, 262–270, https://doi.org/10.1016/j.scitotenv.2014.05.147, 2014.
Tan, J. H., Duan, J., Ma, Y., He, K., Cheng, Y., Deng, S. X., Huang, Y. L., and Si-Tu, S. P.: Long-term trends of chemical characteristics and sources of fine particle in Foshan City, Pearl River Delta: 2008–2014, Sci. Total Environ., 565, 519–528, https://doi.org/10.1016/j.scitotenv.2016.05.059, 2016.
Targino, A. C., Gibson, M. D., Krecl, P., Rodrigues, M. V. C., dos Santos, M. M., and de Paula Corrêa, M.: Hotspots of black carbon and PM2.5 in an urban area and relationships to traffic characteristics, Environ. Pollut., 218, 475–486, https://doi.org/10.1016/j.envpol.2016.07.027, 2016.
Tian, H., Liu, K., Zhou, J., Lu, L., Hao, J., Qiu, P., Gao, J., Zhu, C., Wang, K., and Hua, S.: Atmospheric Emission Inventory of Hazardous Trace Elements from China- Coal-Fired Power Plants-Temporal Trends and Spatial Variation Characteristics, Environ. Sci. Technol., 48, 3575–3582, https://doi.org/10.1021/es404730j, 2014.
Trompetter, W., Markwitz, A., and Davy, P., K.: Air particulate research capability at the New Zealand Ion Beam Analysis Facility using PIXE and IBA Techniques, Int. J. PIXE, 15, 249–255, https://doi.org/10.1142/S0129083505000581, 2005.
USEPA: Risk Assessment Guidance for Superfund, Volume I: Human Health Evaluation Manual (Part F, Supplemental Guidance for Inhalation Risk Assessment), Office of Superfund Remediation and Technology Innovation, Environmental Protection Agency, Washington, D.C., USA, 2009.
USEPA: Integrated Risk Information System; National Center for Environmental Assessment, U.S. Environmental Protection Agency, available at: https://www.epa.gov/iris, last access: 11 May 2017.
Visser, S., Slowik, J. G., Furger, M., Zotter, P., Bukowiecki, N., Canonaco, F., Flechsig, U., Appel, K., Green, D. C., Tremper, A. H., Young, D. E., Williams, P. I., Allan, J. D., Coe, H., Williams, L. R., Mohr, C., Xu, L., Ng, N. L., Nemitz, E., Barlow, J. F., Halios, C. H., Fleming, Z. L., Baltensperger, U., and Prévôt, A. S. H.: Advanced source apportionment of size-resolved trace elements at multiple sites in London during winter, Atmos. Chem. Phys., 15, 11291–11309, https://doi.org/10.5194/acp-15-11291-2015, 2015a.
Visser, S., Slowik, J. G., Furger, M., Zotter, P., Bukowiecki, N., Dressler, R., Flechsig, U., Appel, K., Green, D. C., Tremper, A. H., Young, D. E., Williams, P. I., Allan, J. D., Herndon, S. C., Williams, L. R., Mohr, C., Xu, L., Ng, N. L., Detournay, A., Barlow, J. F., Halios, C. H., Fleming, Z. L., Baltensperger, U., and Prévôt, A. S. H.: Kerb and urban increment of highly time-resolved trace elements in PM10, PM2.5 and PM1.0 winter aerosol in London during ClearfLo 2012, Atmos. Chem. Phys., 15, 2367–2386, https://doi.org/10.5194/acp-15-2367-2015, 2015b.
Wan, J. M., Lin, M., Chan, C.-Y., Zhang, Z.-S., Engling, G., Wang, X. M., Chan, I. N., and Li, S. Y.: Change of air quality and its impact on atmospheric visibility in central-western Pearl River Delta, Environ. Monit. Assess., 172, 339–351, https://doi.org/10.1007/s10661-010-1338-2, 2011.
Wang, R., Tao, S., Wang, W., Liu, J., Shen, H., Shen, G., Wang, B., Liu, X., Li, W., Huang, Y., Zhang, Y., Lu, Y., Chen, H., Chen, Y., Wang, C., Zhu, D., Wang, X., Li, B., Liu, W., and Ma, J.: Black carbon emissions in China from 1949 to 2050, Environ. Sci. Technol., 46, 7595–7603, https://doi.org/10.1021/es3003684, 2012.
Wang, X., Bi, X., Sheng, G., and Fu, J.: Hospital indoor PM10/PM2.5 and associated trace elements in Guangzhou, China, Sci. Total Environ., 366, 124–135, https://doi.org/10.1016/j.scitotenv.2005.09.004, 2006.
Yin, X., Huang, Z., Zheng, J., Yuan, Z., Zhu, W., Huang, X., and Chen, D.: Source contributions to PM2.5 in Guangdong province, China by numerical modeling: Results and implications, Atmos. Res., 186, 63–71, https://doi.org/10.1016/j.atmosres.2016.11.007, 2017.
Zhang, Y., Hu, M., Zhong, L., Wiedensohler, A., Liu, S., Andreae, M., Wang, W., and Fan, S.: Regional integrated experiments on air quality over Pearl River Delta 2004 (PRIDE-PRD2004): Overview, Atmos. Environ., 42, 6157–6173, https://doi.org/10.1016/j.atmosenv.2008.03.025, 2008.
Zhou, L. P. K., Hopke, C. O., Stanier, S. N., Pandis, J. M., Ondov, K., and Pancras, J. P.: Investigation of the relationship between chemical composition and size distribution of airborne particles by partial least squares and positive matrix factorization, J. Geophys. Res.-Atmos., 110, D07S18, https://doi.org/10.1029/2004JD005050, 2005.
Zhou, S. Z., Davy, P. K., Wang, X. M., Cohen, J. B., Liang, J. Q., Huang, M. J., Fan, Q., Chen, W. H., Chang, M., Ancelet, T., and Trompetter W.: High time-resolved elemental components in fine and coarse particles in the Pearl River Delta region of Southern China: Dynamic variations and effects of meteorology, Sci. Total Environ., 572, 634–648, https://doi.org/10.1016/j.scitotenv.2016.05.194, 2016.