the Creative Commons Attribution 4.0 License.
the Creative Commons Attribution 4.0 License.
 | 19 Dec 2018
Source apportionment of the organic aerosol over the Atlantic Ocean from 53° N to 53° S: significant contributions from marine emissions and long-range transport
Zhijun Wu
Manuela van Pinxteren
Maik Merkel
Denise Assmann
Hartmut Herrmann
Alfred Wiedensohler
Marine aerosol particles are an important part of the natural aerosol systems and might have a significant impact on the global climate and biological cycle. It is widely accepted that truly pristine marine conditions are difficult to find over the ocean. However, the influence of continental and anthropogenic emissions on the marine boundary layer (MBL) aerosol is still less understood and non-quantitative, causing uncertainties in the estimation of the climate effect of marine aerosols. This study presents a detailed chemical characterization of the MBL aerosol as well as the source apportionment of the organic aerosol (OA) composition. The data set covers the Atlantic Ocean from 53∘ N to 53∘ S, based on four open-ocean cruises in 2011 and 2012. The aerosol particle composition was measured with a high-resolution time-of-flight aerosol mass spectrometer (HR-ToF-AMS), which indicated that sub-micrometer aerosol particles over the Atlantic Ocean are mainly composed of sulfates (50 % of the particle mass concentration), organics (21 %) and sea salt (12 %). OA has been apportioned into five factors, including three factors linked to marine sources and two with continental and/or anthropogenic origins. The marine oxygenated OA (MOOA, 16 % of the total OA mass) and marine nitrogen-containing OA (MNOA, 16 %) are identified as marine secondary products with gaseous biogenic precursors dimethyl sulfide (DMS) or amines. Marine hydrocarbon-like OA (MHOA, 19 %) was attributed to the primary emissions from the Atlantic Ocean. The factor for the anthropogenic oxygenated OA (Anth-OOA, 19 %) is related to continental long-range transport. Represented by the combustion oxygenated OA (Comb-OOA), aged combustion emissions from maritime traffic and wild fires in Africa contributed, on average, a large fraction to the total OA mass (30 %). This study provides the important finding that long-range transport was found to contribute averagely 49 % of the submicron OA mass over the Atlantic Ocean. This is almost equal to that from marine sources (51 %). Furthermore, a detailed latitudinal distribution of OA source contributions showed that DMS oxidation contributed markedly to the OA over the South Atlantic during spring, while continental-related long-range transport largely influenced the marine atmosphere near Europe and western and central Africa (15∘ N to 15∘ S). In addition, supported by a solid correlation between marine tracer methanesulfonic acid (MSA) and the DMS-oxidation OA (MOOA, R2>0.85), this study suggests that the DMS-related secondary organic aerosol (SOA) over the Atlantic Ocean could be estimated by MSA and a scaling factor of 1.79, especially in spring.
- Article
(3304 KB) - Full-text XML
-
Supplement
(1346 KB) - BibTeX
- EndNote


As one of the most important natural aerosol systems at the global level, the marine aerosol plays a significant role in the global radiation budget through both direct and indirect climate effects, as well as playing a role in biogeochemical cycling (O'Dowd and De Leeuw, 2007; Saltzman, 2009). In pristine conditions, marine aerosols consist of primary and secondary particles. Primary particles, usually referring to sea salt, are mechanically generated via sea–air interaction (Andreas, 2002). Secondary marine aerosol particles are chemically produced from atmospheric reactions of gases emitted by organisms in the ocean (Charlson et al., 1987). As one of the most well-known biological gases, dimethyl sulfide (DMS), emitted by marine phytoplankton, can be oxidized to eventually form sulfate and methanesulfonic acid (MSA) in the particulate phase (Ayers and Gillett, 2000; Bates et al., 1987; Charlson et al., 1987; Gondwe et al., 2003; Hertel et al., 1994; Shiro Hatakeyama, 1985; von Glasow and Crutzen, 2004). Other volatile organic compounds, such as isoprene and monoterpenes, can also be produced by marine organisms (Bonsang et al., 1992; Shaw et al., 2010; Yassaa et al., 2008) and transformed to secondary particles (Fu et al., 2011). However, the chemical and physical properties of the marine aerosol are still poorly understood.
For a long time, non-sea-salt sulfate (nss-SO4) has attracted substantial research attention, because it has been recognized as the major source of cloud condensation nuclei (CCN) over the ocean, consequently influencing the cloud albedo (Charlson et al., 1987). This biological regulation of climate has been referred to as the CLAW hypothesis (Charlson et al., 1987). Recently, this hypothesis was challenged because of the possible importance of non-DMS sources of the marine boundary layer (MBL) CCN, specifically sea salt and organics (Quinn and Bates, 2011). On the one hand, sea salt has been found to be a major mass component (60 %) in the residual particles of dried cloud droplets (Twohy and Anderson, 2008). On the other hand, sea surface water is also a reservoir of organic matter that can be injected into the air and enriched in the particles (Aller et al., 2005; Kuznetsova et al., 2005; Russell et al., 2010; Schmitt-Kopplin et al., 2012; van Pinxteren et al., 2017). Organic matter has been observed to dominate the particle mass (up to 77 %) during phytoplankton bloom periods at a coastal station in Ireland (O'Dowd et al., 2004; Ovadnevaite et al., 2011). However, many marine aerosol studies were based on observations of islands or in coastal areas, where biological activities are much higher than the remote ocean (as illustrated by global maps of chlorophyll a – Chl a: https://earthobservatory.nasa.gov/GlobalMaps/view.php?d1=MY1DMM_CHLORA; last access: 15 November 2018). Hence, more measurements aboard ships are required to provide details of the chemical composition and physical properties of marine aerosol over the open ocean far from the coast.
The aerosol particle number size distribution and chemical composition over the ocean can be influenced by many non-marine sources, including continental and ship emissions (Andreae, 2007; Simpson et al., 2014). It is therefore difficult to find pristine conditions over the ocean. Significant impacts from ship and continental emissions were observed over the Pacific and Atlantic (63 % of the sampling time; Frossard et al., 2014), the Arctic (Chang et al., 2011), and the North Pacific between southern Asia and northern Japan (Choi et al., 2017). Nevertheless, there are still some regions with little anthropogenic impact on marine aerosols, such as the station on the coast of Ireland in the northeastern Atlantic (Ceburnis et al., 2011; O'Dowd et al., 2014). Due to the paucity of ship-based measurements, the non-marine influence on MBL aerosol particles is still unknown, especially for a large area of the oceans. Additionally, previous studies were often based on offline measurements, which could hardly provide variation of aerosol chemical properties at high temporal and spatial resolution. In this study, aerosol particle measurements were conducted on board the German research vessel (R/V) Polarstern, based on four cruises in the Atlantic Ocean in 2011 and 2012, covering the range from 53∘ N to 53∘ S. The detailed chemical properties of the aerosol over the Atlantic Ocean were measured by a high-resolution time-of-flight aerosol mass spectrometer (HR-ToF-AMS). Based on this unique data set, sources of the organic aerosol particles over a major part of the Atlantic Ocean were investigated at a high temporal and spatial resolution to provide a latitudinal distribution of organic aerosol (OA) source contributions in spring and autumn in both the Northern and Southern Hemispheres.
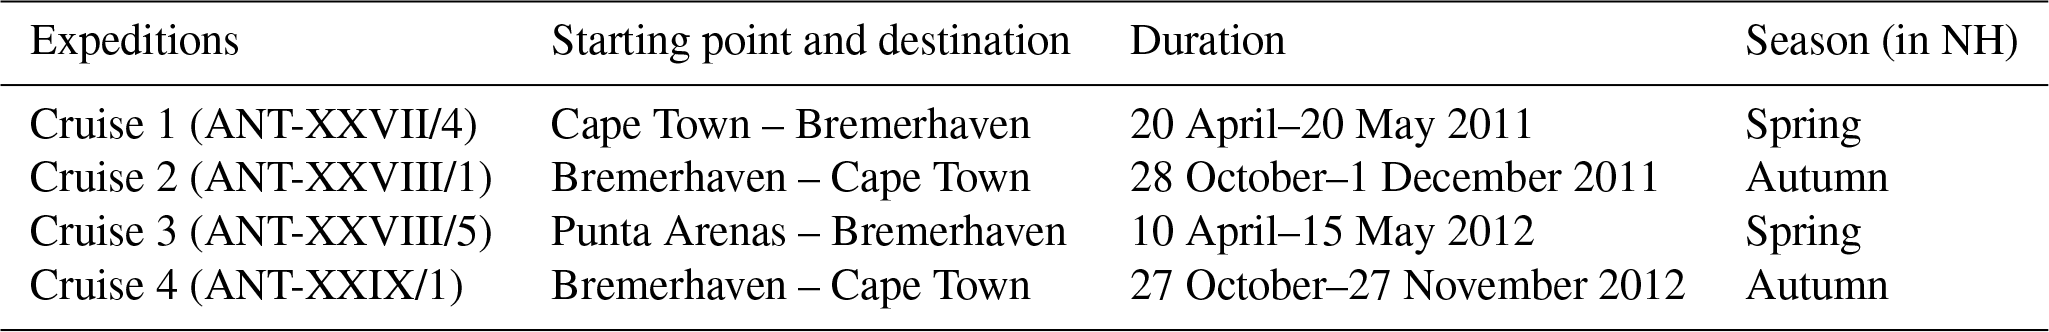
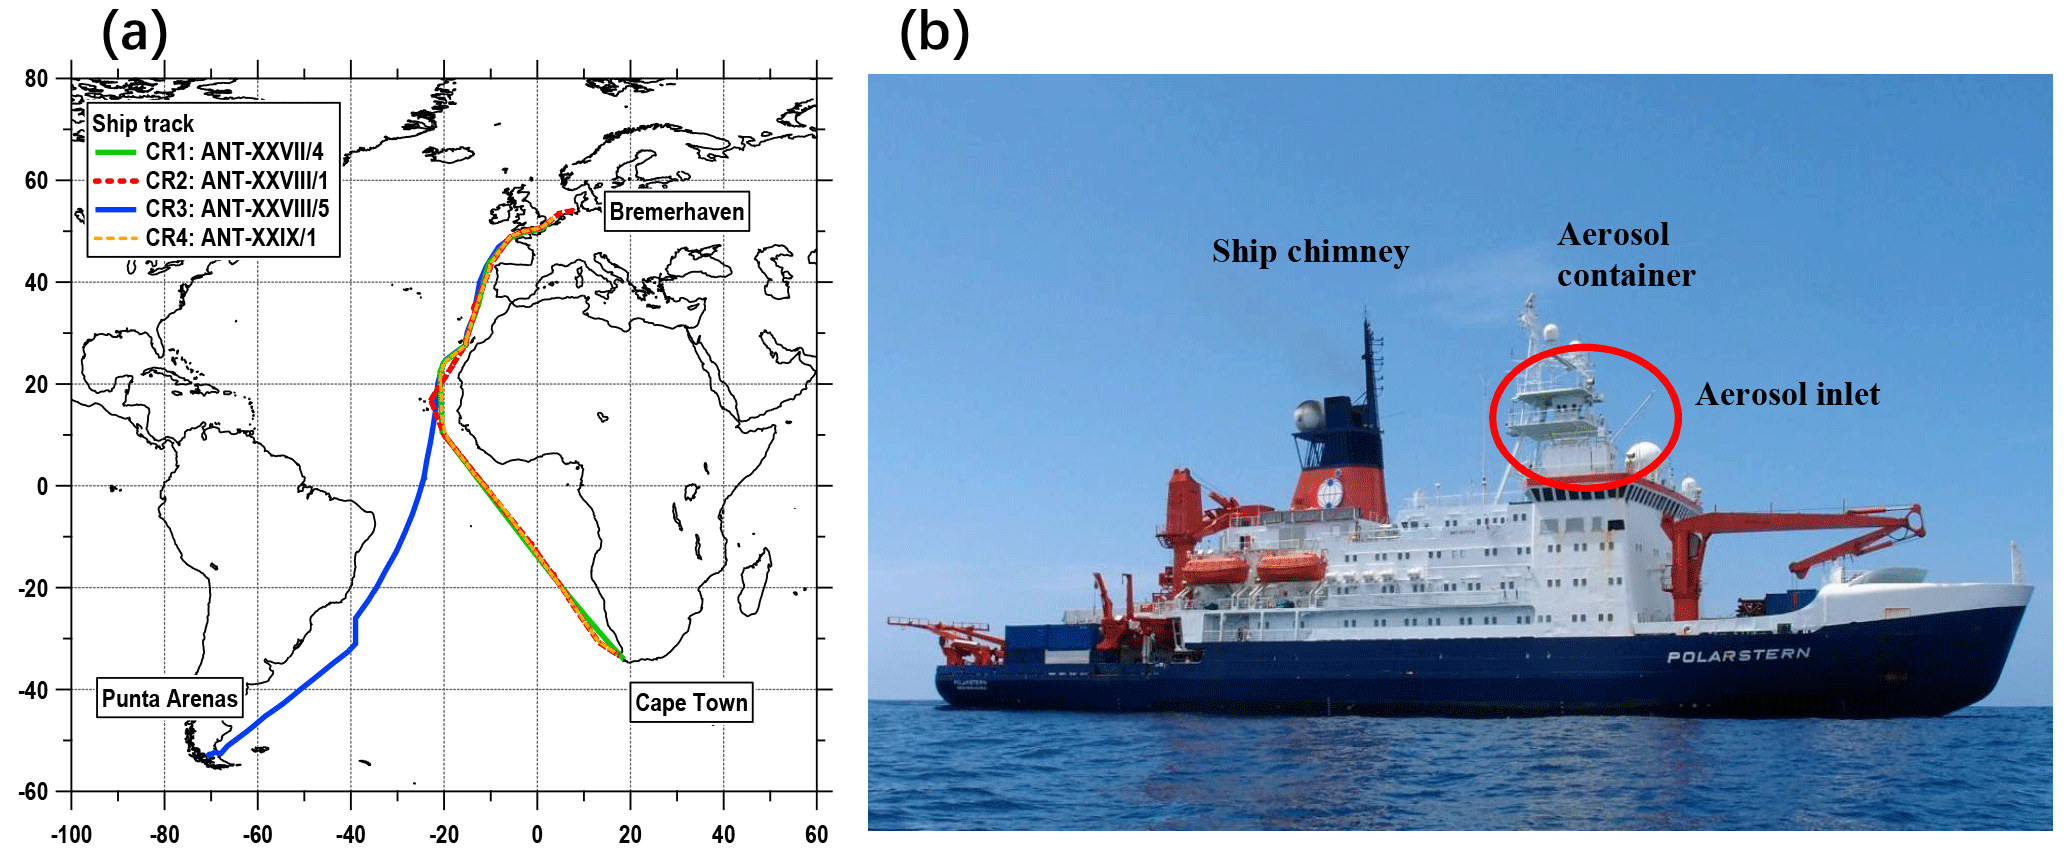
Figure 1(a) Ship tracks of four cruises; (b) The position of the container during Polarstern cruises.
2.1 Onboard ship campaigns measuring sub-micrometer marine aerosols over the Atlantic Ocean
This study is based on aerosol measurements conducted by the Leibniz Institute for Tropospheric Research (TROPOS) during four cruises on the R/V Polarstern in 2011 and 2012. Expedition details and ship tracks of the cruises are shown in Table 1 and Fig. 1. All cruises were part of transfer voyages between Bremerhaven, Germany (53∘33′ N, 8∘35′ E), and the German Antarctic research station via either Cape Town, South Africa (33∘55′ S, 18∘25′ E), or Punta Arenas, Chile (53∘10′ S, 70∘56′ W). During each cruise, the ship briefly (and only) moored at Las Palmas, Spain (28∘9′ N, 15∘25′ W), for resupply. The cruises can be divided into two groups according to the period of the year; Cruise 1 (CR1) and Cruise 3 (CR3) correspond to spring in the Northern Hemisphere (NH), while Cruise 2 (CR2) and Cruise 4 (CR4) correspond to autumn in the NH. In terms of the spatial range, CR1, CR2 and CR4 followed almost the same route, while CR3 had different tracks in the Southern Hemisphere but followed the same route as the other three cruises from approximately 15 to 53∘ N (Fig. 1).
During all four cruises, the instruments were deployed inside (and on the roof) of an air-conditioned laboratory container, which was located on the first deck of the vessel, approximately 30 m above the ocean surface (Fig. 1). The whole-air sampling inlet of the container was made of a stainless-steel tube (6 m long, 40 mm diameter, with an inclination angle of 45∘ to the container roof). A vacuum system maintained a stable total aerosol flow rate of 15 L min−1 through the inlet. The inlet loss due to diffusion and deposition was calculated (Fig. S1 in the Supplement), suggesting that the average inlet efficiency was nearly 100 % in the particle size range between 10 and 1000 nm but decreased rapidly for particles smaller than 2 nm and larger than 1500 nm. Therefore, the inlet could be considered a PM1.5 inlet.
An isokinetic splitter was used downstream of the aerosol inlet to distribute the aerosol flow to different online instruments for analysis of aerosol physicochemical properties, as mentioned below. Particle size distributions from 10 nm to 3 µm (mobility diameter, equal to volume equivalent diameter for spherical particles) were provided by a combination of one TROPOS-type mobility particle size spectrometer (MPSS, 10–800 nm, TROPOS custom-built; see Wiedensohler et al., 2012) and one aerodynamic particle size spectrometer (TSI APS model 3321, 500 nm–10 µm, TSI Inc., Shoreview, MN, USA). The particle hygroscopicity at 90 % relative humidity (RH) was measured by a Hygroscopicity Tandem Differential Mobility Analyzer (HTDMA, TROPOS custom-built; e.g., Wu et al., 2011). A differential mobility analyzer, the Cloud Condensation Nuclei Counter (DMA-CCNc, TROPOS custom-built; e.g., Henning et al., 2014), was used for size-resolved CCN measurements. Optical properties including light scattering and absorption coefficients of particles were provided by an integrating nephelometer (Model 3563, TSI Inc., Shoreview, MN, USA), a multi-angle absorption photometer (MAAP, Model 5012, Thermo Scientific, Waltham, MA, USA; see Müller et al., 2011) and a particle soot absorption photometer (PSAP, Radiance Research, Inc., Seattle, WA, USA). Particle chemical properties were investigated using a HR-ToF-AMS (Aerodyne Research, Inc., Billerica, MA, USA), which is the central instrument for the present study. In parallel, a high-volume PM1 sampler (DIGITEL, DHA-80, DIGITEL Elektronik AG, Switzerland) was fixed on the roof of the aerosol container and provided daily (24 h) filter samples. Before each campaign, all instruments in the aerosol container were synchronized to UTC (Coordinated Universal Time).
Table 2The 20 min detection limits during four Polarstern cruises (µg m−3).
2.2 Measurements
2.2.1 Particle chemical analysis
HR-ToF-AMS
The HR-ToF-AMS (referred to as AMS in the following text) can provide the size-resolved chemical composition of non-refractory submicron particles (Canagaratna et al., 2007; DeCarlo et al., 2006). Its size cut is within the range of near unity transmission efficiency of the main container inlet during R/V Polarstern cruises (Fig. S1). To minimize the inlet loss between the AMS and MPSS, the AMS was located next to the MPSS, and the inlet of AMS was connected directly in front of the MPSS inlet. The two instruments shared a Nafion dryer to maintain the RH of the sampling flow below 40 %. The AMS was operated alternatively between V- and W-modes at a time resolution of 2 min. Regular calibration was performed according to reported methods (Jimenez et al., 2003). Collection efficiency (CE) of 0.7 was applied based on intercomparisons between the (1) AMS and MPSS and (2) AMS and offline measurements, as already described in Huang et al. (2017).
The default components measured by the AMS include organics, sulfate, nitrate, ammonium and chloride. In particular, the marine biogenic tracer MSA was quantified by the AMS based on standard calibrations and validated by collocated offline measurements (Huang et al., 2017). To reduce the signal noise, AMS data at 20 min resolution are calculated and used in the following analysis except as noted. Table 2 provides the detection limits (DLs) of detected AMS species at 20 min resolution (for calculation details, see Huang et al., 2017). In addition, a total uncertainty of approximately 30 % is estimated for AMS measurements, including 10 % for the inlet system, 20 % for the ionization efficiency calibration and 20 % for the collection efficiency (Poulain et al., 2014).
The AMS data measured during R/V Polarstern cruises were analyzed using the software Squirrel v1.54 for the unit resolution and Pika v1.13 for the high resolution, both downloaded from the ToF-AMS webpage (http://cires1.colorado.edu/jimenez-group/ToFAMSResources/ToFSoftware/index.html, last access: 15 December 2018). The software was based on Igor Pro (version 6.22A, WaveMetrics Inc., Portland, OR, USA).
Offline measurements
A PM1 high-volume DIGITEL filter sampler was deployed to sample aerosol particles at a 24 h time resolution (midnight to midnight, UTC) during R/V Polarstern CR1, CR2 and CR3, operating at a flow rate of 500 L min−1. The daily aerosol masses were collected on quartz fiber filters (150 mm, Munktell and Filtrak, MK 360, Bärenstein, Germany), which were pretreated at 105 ∘C for 24 h before being measured. All filter samples were refrigerated at −20 ∘C until analysis. The total aerosol particle mass was determined by the weight of the clean and particle-loaded filter, and the particle-loaded filter was separated into several aliquots for different analyses. Inorganic ions were measured after aqueous filter extraction (25 % of the filter in 20 mL, filtered with a 0.45 µm syringe) with ion chromatography (IC; ICS3000, Dionex, Sunnyvale, CA, USA). Organic carbon (OC) and elemental carbon (EC) were analyzed by a thermo-optical method with a Sunset Laboratory Dual-Optical Carbonaceous Analyzer (Sunset Laboratory Inc., Tigard, OR, USA) using the EUSAAR 2 protocol (van Pinxteren et al., 2017). In total, 86 ambient samples from CR1 (25 samples), CR2 (30 samples) and CR3 (31 samples) were analyzed, while 45 effective samples were considered in this study due to the exclusion of filters contaminated by ship exhausts and/or seawater.
2.3 Other measurements and data sources
In this study, the MPSS and MAAP were used as external instruments to evaluate the data quality of the AMS or provide supplementary information for the total particle mass. The MPSS was operated at a time resolution of 8 min (CR1, CR2) and 5 min (CR3, CR4), following recommendations from Wiedensohler et al. (2012). The resulting particle number size distribution was corrected for internal particle losses. Generally, an uncertainty of approximately 10 % can be considered, as shown by intercomparison experiments (Wiedensohler et al., 2012).
The particle mass concentration of equivalent black carbon (eBC) was converted from the particle light absorption coefficient provided by the MAAP. To be combined with the particle concentration measured by the AMS, eBC mass concentration in the sub-micrometer size range is required. Here, the MAAP was connected to the main inlet of the aerosol container, which mostly collected particles no larger than 1.5 µm. Additionally, Poulain et al. (2011b) reported that eBC particles are mainly (90 % of mass) distributed in the sub-micrometer size range according to a comparison between the data from 2 MAAPs with upper size cuts of 1 and 10 µm inlets in Melpitz (Germany). Thus, we suppose that the measured eBC particles are almost in the sub-micrometer size range. In total, a global uncertainty of 10 % was attributed to MAAP measurements, taking the uncertainties of the instrument, size cutting, density and mass absorption efficiency into consideration.
All meteorological parameters on R/V Polarstern cruises were measured by an onboard German Weather Service (DWD) station. Air mass back trajectories along the ship track in 12 h time resolution (00:00 UTC and 12:00 UTC every day) were also retrieved from the DWD using a global meteorological model GME (global model of the Earth). Air masses at 950 hPa (approximately 500 m) were selected and considered as a well-mixed situation, and backward trajectories over the last 5 days (120 h) were investigated in this study. Navigation parameters, together with meteorological parameters, were supplied by the R/V Polarstern central data acquisition system (https://dship.awi.de/, last access: 1 March 2016).
2.4 Positive matrix factorization (PMF)
The source apportionment of OA measured on the R/V Polarstern was analyzed using the PMF method (Paatero, 1997; Paatero and Tapper, 1994). High-resolution organic mass spectra and their uncertainties over the four cruises were combined and input into the Igor Pro-based PMF Evaluation Tool (PET, v2.06; Ulbrich et al., 2009). Before running the PMF model, the high-resolution organic mass matrix and its error matrix were examined to remove incorrect signals (e.g., organic fragments influenced by strong sulfate signal), very low signals (e.g., Cx group, isotopes and m∕z>120) and ship contamination periods. According to the instructions from Ulbrich et al. (2009), a minimum error estimate of one measured ion was calculated; the “bad” data with a signal-to-noise ratio (SNR) less than 0.2 were removed, and the “weak” data with SNR between 0.2 and 2 were down-weighted by a factor of 2; signals for m∕z 44 () and related ions (O+, HO+, H2O+ and CO+) were also down-weighted by a factor of 2 to avoid overestimating the importance of . To find the best solution, PMF was run between one and seven factors for (1) rotational forcing parameter fPeak between −1 and 1 (step of 0.2) and (2) seeds with random starts between 0 and 50 (step of 2). Based on a comprehensive evaluation of solutions with different factor numbers (regarding both time series and mass spectral pattern), a 5-factor solution was selected with fPeak =0 and . The elemental analysis of PMF factors was performed using the analytical procedure for elemental separation (APES light v1.06) tool detailed by Aiken et al. (2008) and Canagaratna et al. (2015). Detailed PMF analysis results are shown and interpreted in Sect. 3.2.
3.1 Particle chemical composition
3.1.1 AMS data quality assurance
Ship contamination exclusion. During all four cruises, the ship's own exhausts (including emissions from the engine and kitchen) from the main chimney occasionally affected the measurements, especially when the wind came from behind the ship. The specific contamination periods are identified based on extremely high concentrations of combustion tracers (e.g., eBC and organics) and meteorological parameters (e.g., wind direction), as illustrated in Figs. S2 and S3. Accordingly, the ship contamination range of the relative wind direction (RWD) was determined to be between 135 and 250∘. With this criterion, 85.2 % of ambient AMS data (2 min resolution) remained as “clean” data during all four cruises. In the following text, all the data analyses are performed on the clean data.
Intercomparisons between AMS and PM1 offline. Prior to investigating the particle chemical composition during the R/V Polarstern measurements, intercomparisons between AMS and parallel measurements were performed to assure the AMS data quality (Figs. S4 and S5). The mass concentration of the individual species from the AMS was compared to that from the offline measurements (Fig. S4). Organic matter (OM) provided by AMS measurement is correlated with OC from filter measurements (R2=0.53). The slope of 1.75, i.e., the OM ∕ OC ratio, is similar to those found in offshore areas, e.g., 1.8 in the Gulf of Mexico (Russell et al., 2009). An excellent linear correlation was found for sulfate (slope =1.16, R2=0.94), and the correlation for ammonium was moderate (slope =0.80, R2=0.63). No correlation was found for nitrate and chloride. A few values of nitrate from the AMS are higher than those from offline measurements, probably due to the evaporative loss of nitrate. The contribution of organic nitrates remains unknown but might not be negligible. Chloride is underestimated by the AMS, because this instrument partly detects sea salt, which is the main source of the chloride measured during R/V Polarstern cruises. Considering that nitrate and chloride account for only a tiny fraction of the measured particle mass concentration, and the sea salt is estimated specifically, the AMS can still properly detect a major part of the MBL aerosols in our measurements.
Mass closure with MPSS. The total particle mass concentration from the AMS is calculated as the sum of the mass concentrations of default AMS species (i.e., organics, sulfate, nitrate and ammonium) completed by estimated sea salt and eBC. This concentration is compared to the calculated particle mass concentration derived from the particle number size distribution (Fig. S5). Taking sea salt into consideration can slightly improve the correlation between the two different techniques (the slope varies from 0.81 to 0.85; R2 varies from 0.72 to 0.77; Fig. S5). The intercomparisons also demonstrated that a constant CE of 0.7 for AMS measurements could achieve better agreement between AMS and external measurements, whereas the composition-dependent collection efficiency introduced by Middlebrook et al. (2012) does not seem appropriate for R/V Polarstern measurements because of the high acidity and low ammonium nitrate content of the MBL aerosol particles (Huang et al., 2017).
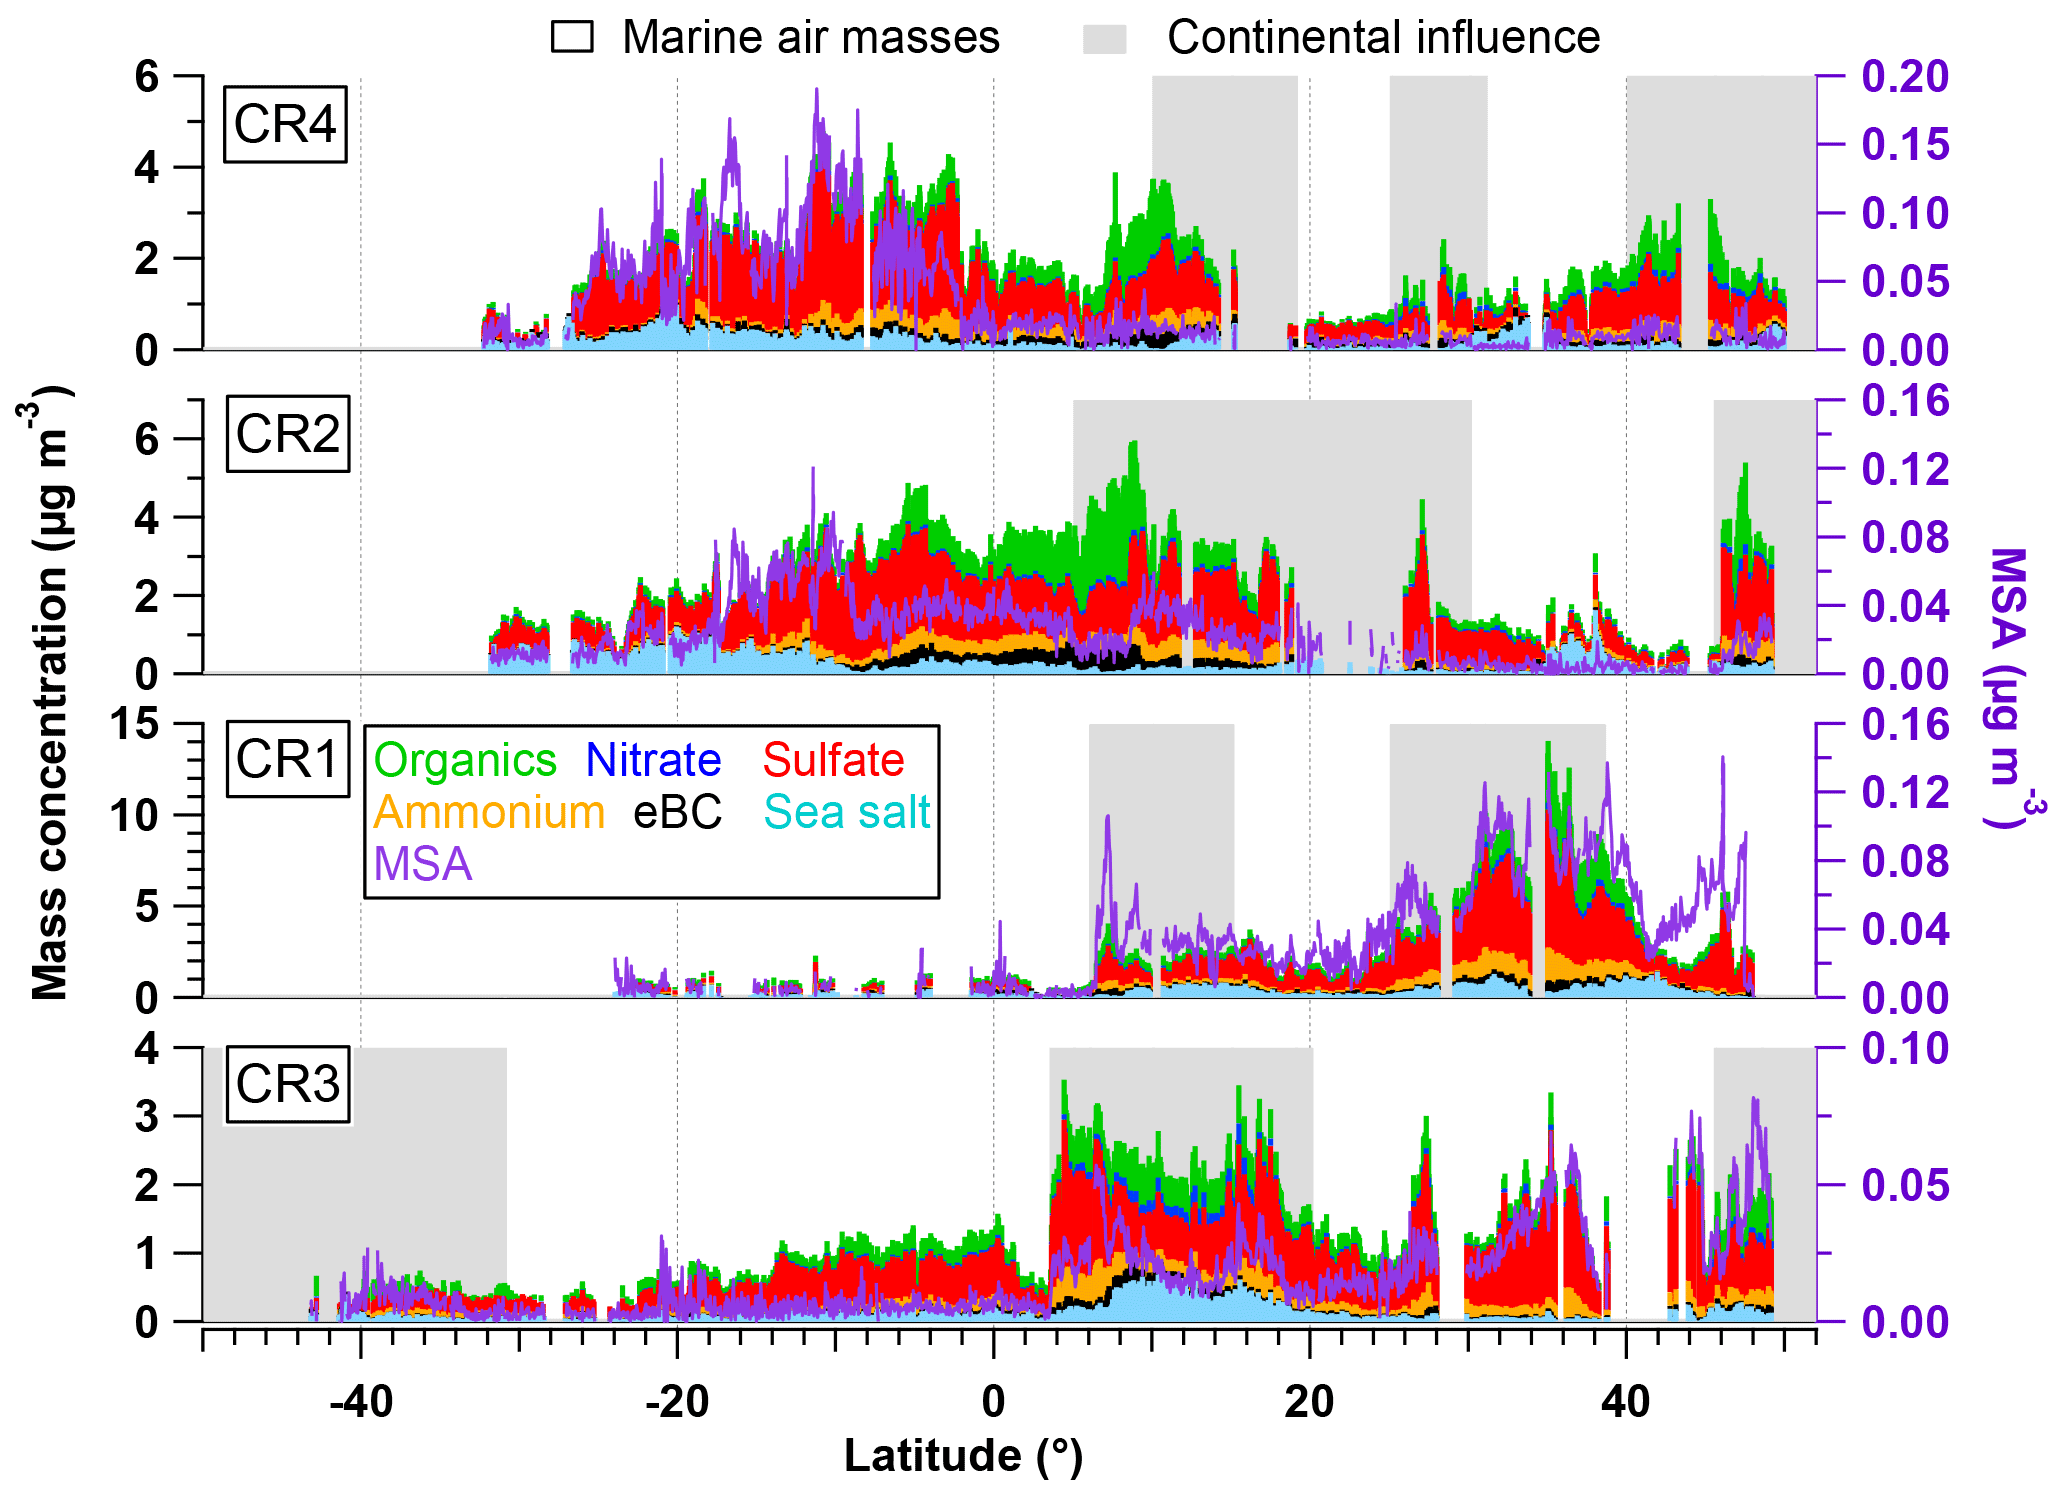
Figure 2Latitudinal variation of organics, nitrate, sulfate, ammonium, eBC, sea salt (left axis) and MSA (right axis) during the four Polarstern cruises. Air masses with continental influence (grey) and originating from the ocean (blank) are marked in the background. Note that CR1, CR2 and CR4 followed almost the same ship track between Bremerhaven and Cape Town, while the route of CR3 was different (from 15∘ N) since starting from Punta Arenas.
Sea salt estimation. The important primary marine product, sea salt, was estimated using the method from Ovadnevaite et al. (2012), who successfully quantified sea salt aerosol concentration with HR-ToF-AMS in Mace Head, Ireland. The reported method is based on the typical sea salt ion NaCl+ (m∕z 57.95) and a scaling factor of 51 derived from laboratory calibration using artificial seawater (Ovadnevaite et al., 2012). In R/V Polarstern measurements, NaCl+ fragment was well identified by the high-resolution mode. Nevertheless, the linear correlation between NaCl+ from the AMS and sea salt derived from PM1 filter samples showed a mild relationship with R2 of 0.38 and yielded a scaling factor of 62 (±6). To be consistent with the literature (Ovadnevaite et al., 2012, 2014; Schmale et al., 2013), the scaling factor of 51 from the reference is applied to the sea salt surrogate (NaCl+) to estimate the sea salt mass concentration in this study. With this factor, the AMS-estimated sea salt concentrations are quite close to those measured by the offline method, showing a slope of 1.01, and the main scattering points are located within the uncertainty range of the Mace Head measurements (Fig. S6). Additionally, the p value of the regression of AMS-derived sea salt with offline results is 0.009 (Spearman's correlation test), indicating that sea salt concentrations from the AMS and offline methods are correlated significantly. The uncertainties of this estimation method in R/V Polarstern measurements probably link to the different sampling (inlet) locations as well as the discrepant analysis methods between the AMS and offline measurements.
Table 3Seasonal chemical composition of measured submicron aerosol particles over the Atlantic (µg m−3).
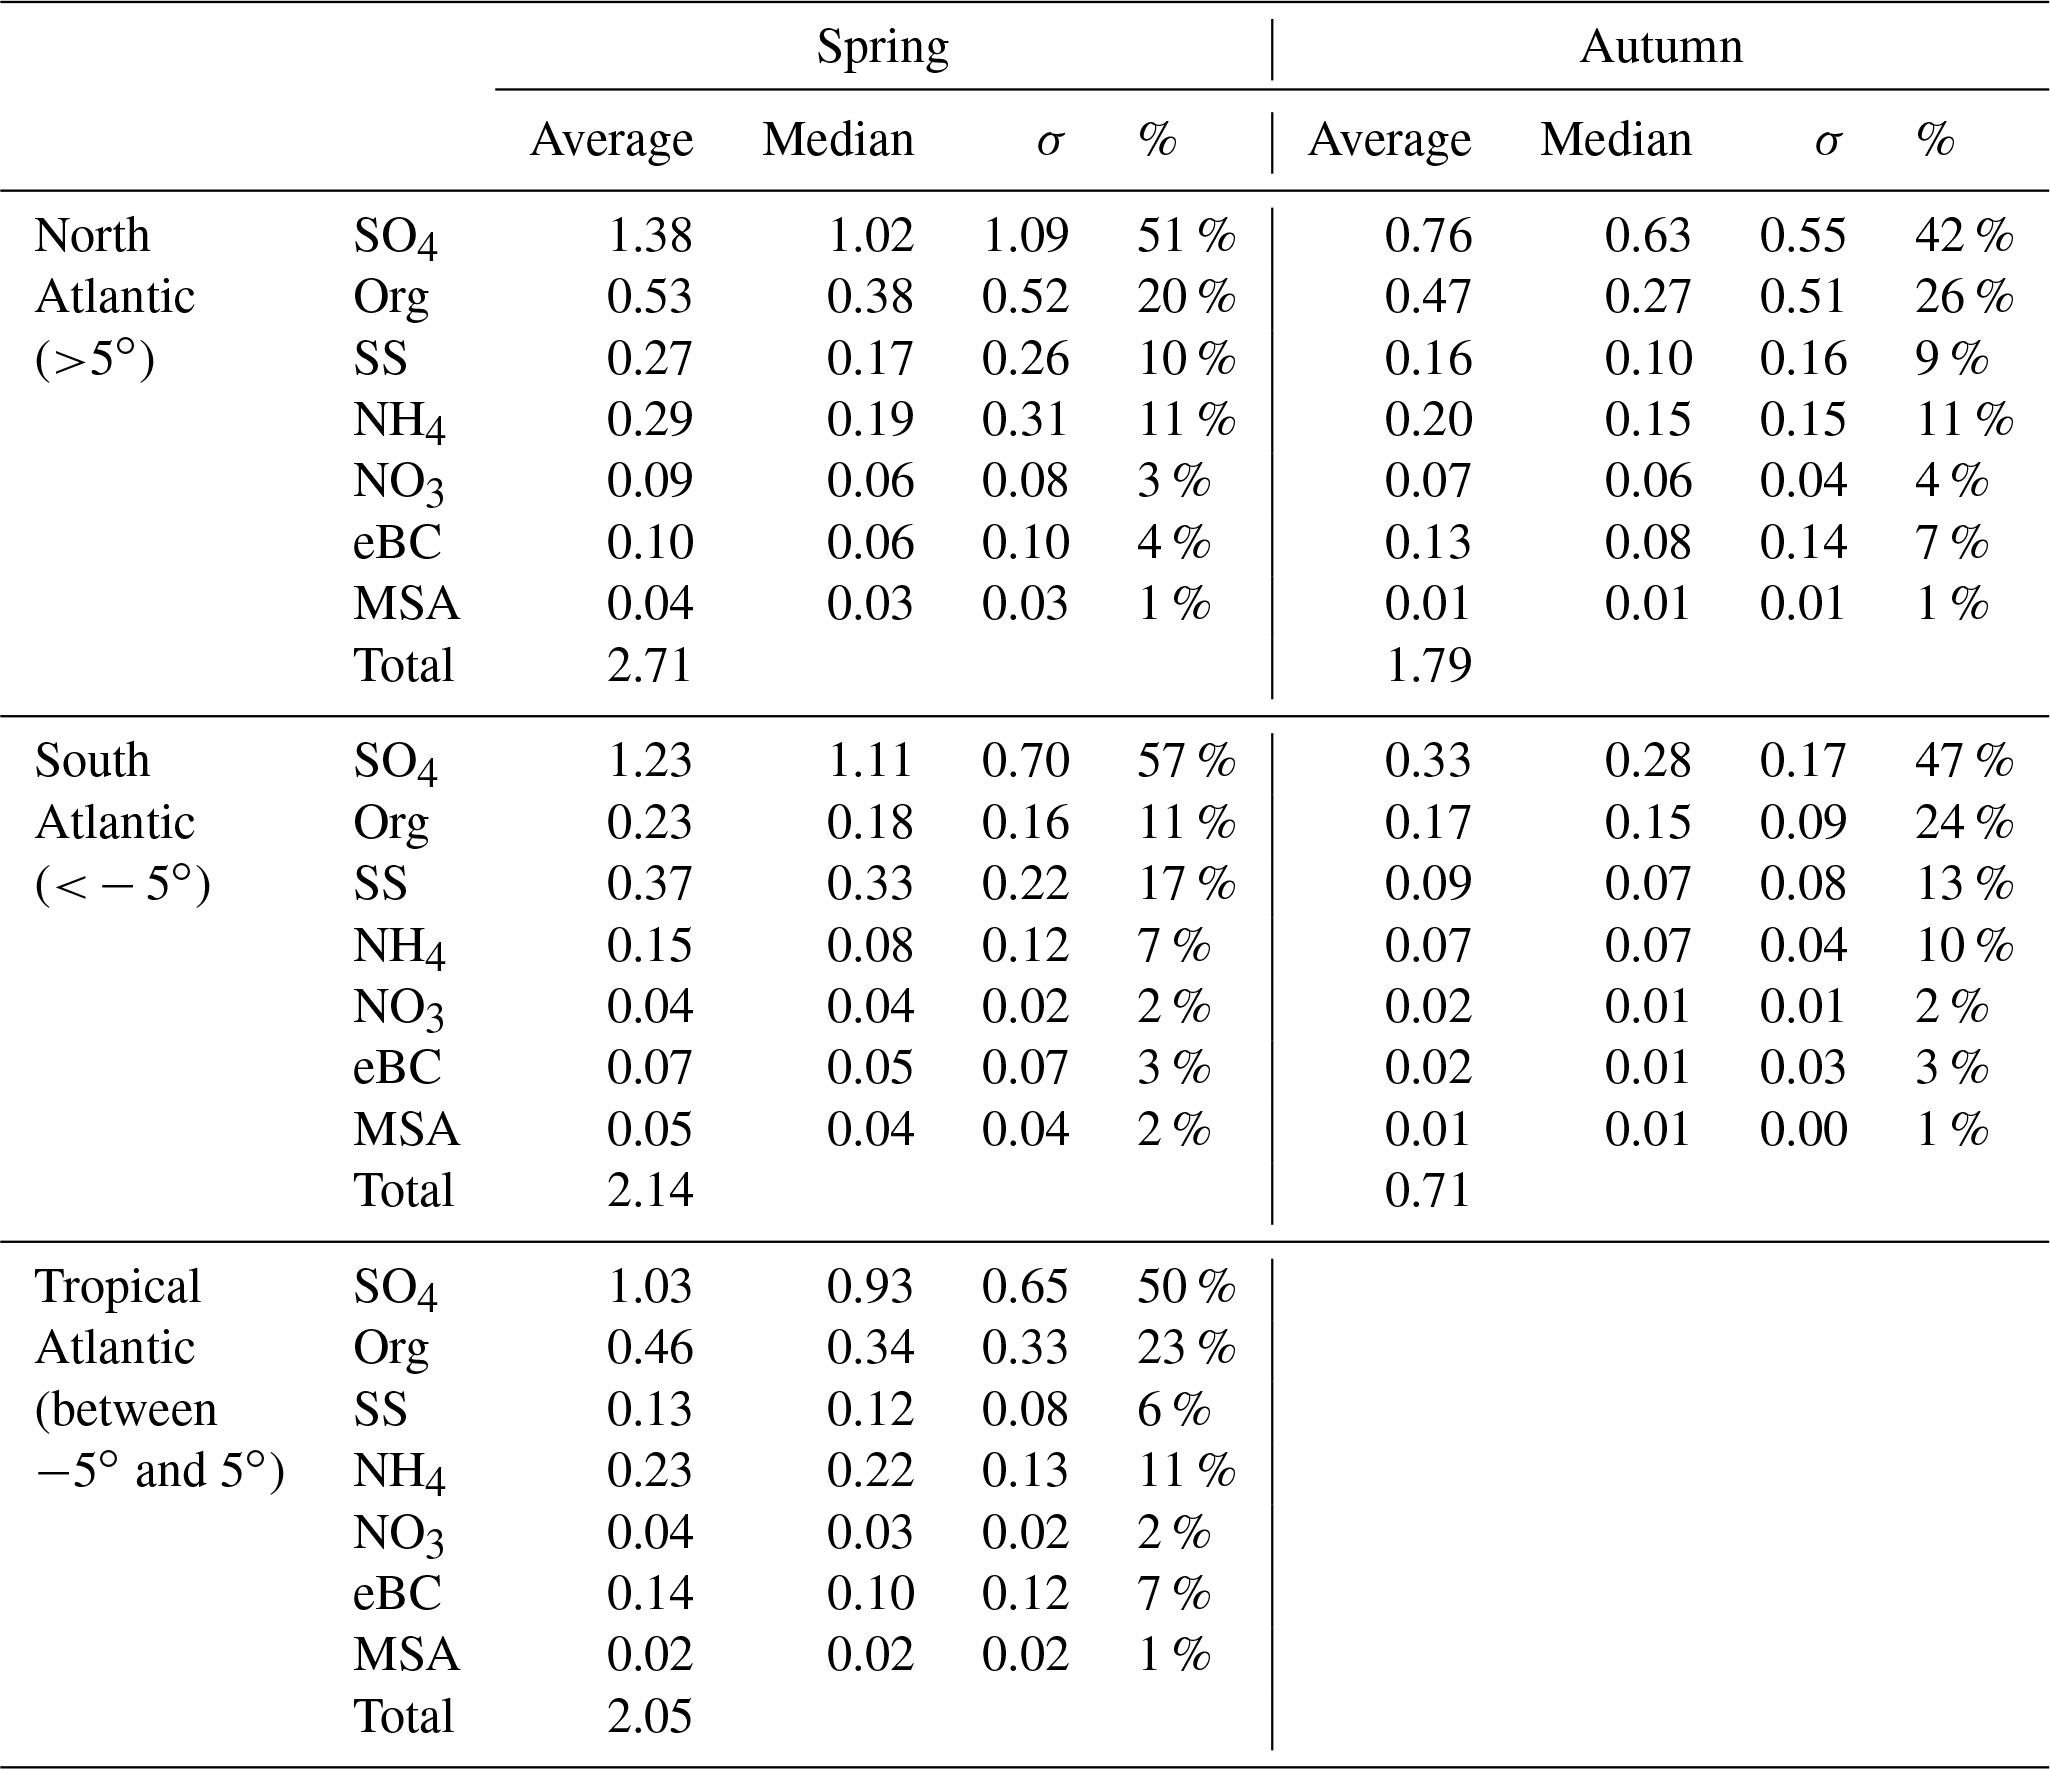
σ is standard deviation, SO4 is sulfate, Org is organics, SS is sea salt, NH4 is ammonium and NO3 is nitrate.
3.1.2 Chemical composition of the aerosol over the Atlantic Ocean
An overview of the chemical composition of Atlantic aerosol particles during four cruises is given in Fig. 2, including AMS default species (organics, sulfate, nitrate and ammonium), specially quantified marine products (MSA and sea salt) as well as eBC. Because the ship tracks on latitude are nearly monotonic to the cruise time, particle chemical composition as a function of latitude shows both temporal variation and latitudinal distribution. Air mass back trajectories indicate that the air masses captured during R/V Polarstern cruises either came from the ocean or were influenced by the continents (Europe, Africa or South America), as marked in Fig. 2. Additionally, the statistics of seasonal variation of PM1 chemical composition over the North (>5∘, i.e., 5∘ N) and South (<−5∘, i.e., 5∘ S) Atlantic Ocean are provided in Table 3. Because there is no clear seasonal difference in the chemical composition of measured PM1 in the area near the equator, the average, median, standard deviation and percentage in total were calculated for the region from 5∘ S to 5∘ N in latitude (defined as tropical in this study), regardless of the season, and are also shown in Table 3.
Over all measurements, the total measured submicron particle mass concentration varied over a large range, from 0.22 to 14.15 µg m−3, with a median of 1.83 µg m−3. The reported concentrations sit between the clean marine case (from 0.27 to 1.05 µg m−3) measured at the coastal station Mace Head, Ireland (Ovadnevaite et al., 2014), and the case of mixed marine and continental air masses (from 3.69 to 4.17 µg m−3) over the North Atlantic (Dall'Osto et al., 2010). This difference suggests that the detected aerosols during the R/V Polarstern cruises were from mixed sources, as evidenced by the air mass origins. The average chemical composition of the measured particles indicated that sulfate was the major contributor to the total particle mass concentration (50±13 %), followed by organics (21±9 %), sea salt (12±11 %), ammonium (9±4 %), eBC (5±4 %) and nitrate (3±2 %). The mass concentrations of total particles and individual species showed large variations associated with time and were obviously not distributed normally. Hence, the median, rather than the average, of the mass concentration is used below.
During all four cruises, sulfate dominated the particle mass most of time, showing the highest median mass concentration (0.78 µg m−3) of all six species. Sulfate could contribute up to 85 % of the total particle mass concentration. Seasonal discrepancies were found for sulfate mass concentration (a higher level in spring than in autumn), especially over the South Atlantic (Table 3). A similar seasonal variation of the marine biogenic tracer MSA was also observed (Huang et al., 2017), suggesting that biogenic sources (i.e., phytoplankton) contributed significantly to sulfate (Charlson et al., 1987; Hoffmann et al., 2016). In the tropical Atlantic, sulfate appeared at a slightly lower value than that in spring but was still much higher than that in autumn. Nonetheless, anthropogenic sources of sulfate cannot be ruled out and can even be important, considering that long-range transport has been found to be a major source of sulfate (more important than DMS) over the tropical Pacific (Simpson et al., 2014).
Organics (here including MSA) are the second most abundant species (median: 0.26 µg m−3). Organics did not show pronounced variation associated with seasons but did vary with location. The mass concentration of organics was elevated in air masses under continental influence. During CR2 and CR4, organics dominated the total measured particle mass concentration (up to 59 %) in the region between 0 and 15∘ N. This resulted in substantial organic aerosols over the tropical Atlantic (median: 0.34 µg m−3). Moreover, the non-marine species eBC tended to increase together with organics, especially near the equator, although taking up only a tiny portion of the total particle mass in the whole measurements, which indicates that anthropogenic emissions may be a significant contributor to the organic aerosols over this region of the Atlantic Ocean.
The marine primary product, sea salt, was found to play a minor role (6 %–17 % in different regions) in the measured submicron particles during R/V Polarstern cruises. However, the mass concentration of sea salt could reach 1.63 µg m−3 while taking up to 66 % of the total particle mass loading associated with elevated wind speed. This finding is comparable to the importance of sea salt reported over the northeastern Atlantic (66 %–84 %; Ovadnevaite et al., 2014) and in the sub-Antarctic islands (47 %; Schmale et al., 2013) for high wind speed (>10 m s−1).
The ammonium concentrations did not exhibit a seasonal difference between spring and autumn. The highest median value was found over the tropical Atlantic, followed by the North Atlantic, while the lowest median value was in the Southern Hemisphere. Both continental emissions via long-range transport and marine organisms could be the origin of the ammonium or its precursor ammonia in the MBL (Adams et al., 1999). Nitrate showed low mass concentration (0.04 µg m−3), which is not surprising, because it both has no marine sources and would mainly occur in supermicron particles – nitrate would react with sulfuric acid and escape from submicron particles in the form of gaseous nitric acid, which will relocate to larger particles, e.g., sea salt particles (Saltzman, 2009).
Table 4Summary of correlations of time series and mass spectra for the five-factor PMF solution.
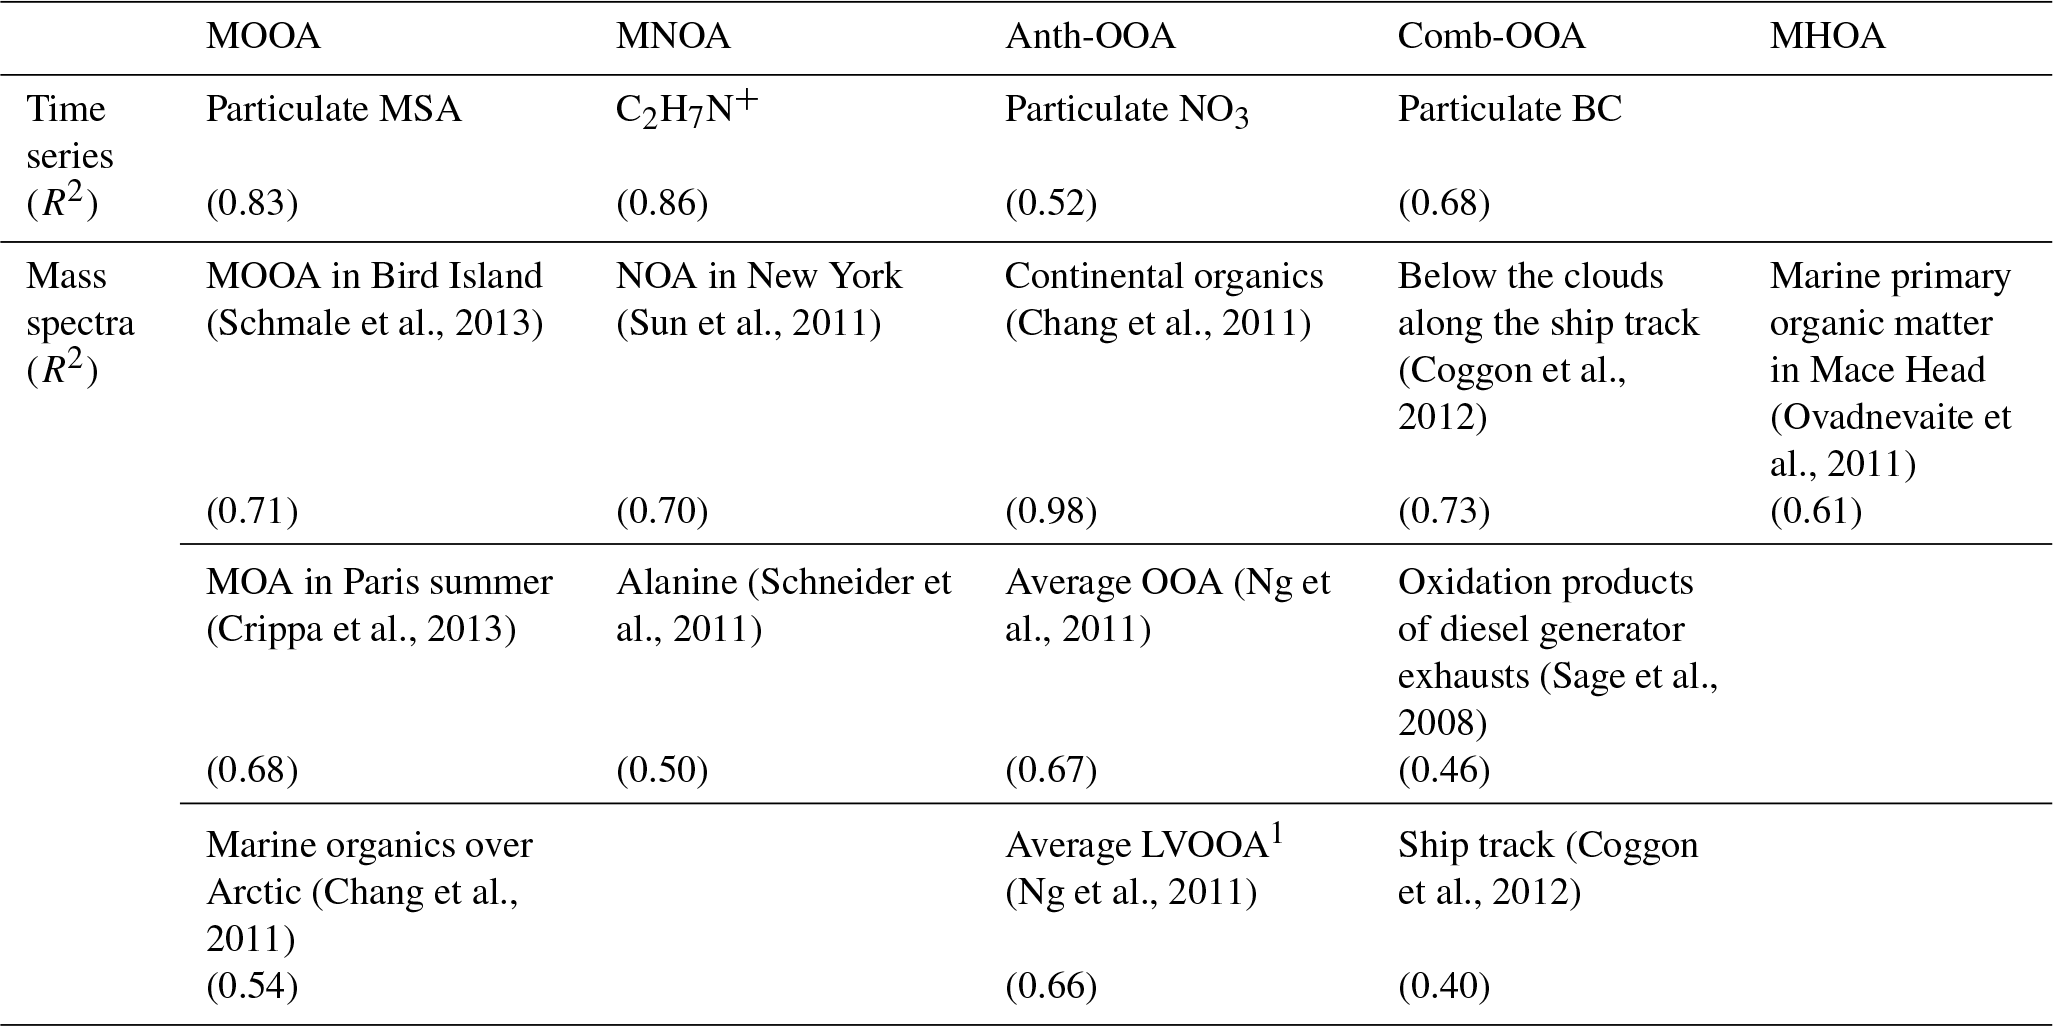
1 LVOOA: low-volatility oxygenated organic aerosol.
3.2 Source apportionment for organic aerosols
Source apportionment of the MBL organic aerosol particles is necessary for a better understanding of both the sources contributing to the OA and their distribution over the Atlantic Ocean. For the OA source apportionment, PMF analysis was performed on the data set of high-resolution OA mass spectra. Eventually, the best solution was obtained with five factors. A summary of the model validation of and selection of the five-factor solution is provided in Figs. S7, S8 and S9 with captions. Among the five OA factors of the selected solution, three marine factors and two non-marine factors were identified. Their temporal variation and mass spectral profiles are shown in Fig. 3. The marine factors included (1) marine oxygenated OA (MOOA), (2) marine nitrogen-containing OA (MNOA) and (3) marine hydrocarbon-like OA (MHOA), the only primary OA factor. The remaining two factors related to non-marine origins were anthropogenic oxygenated OA (Anth-OOA) and combustion oxygenated OA (Comb-OOA).
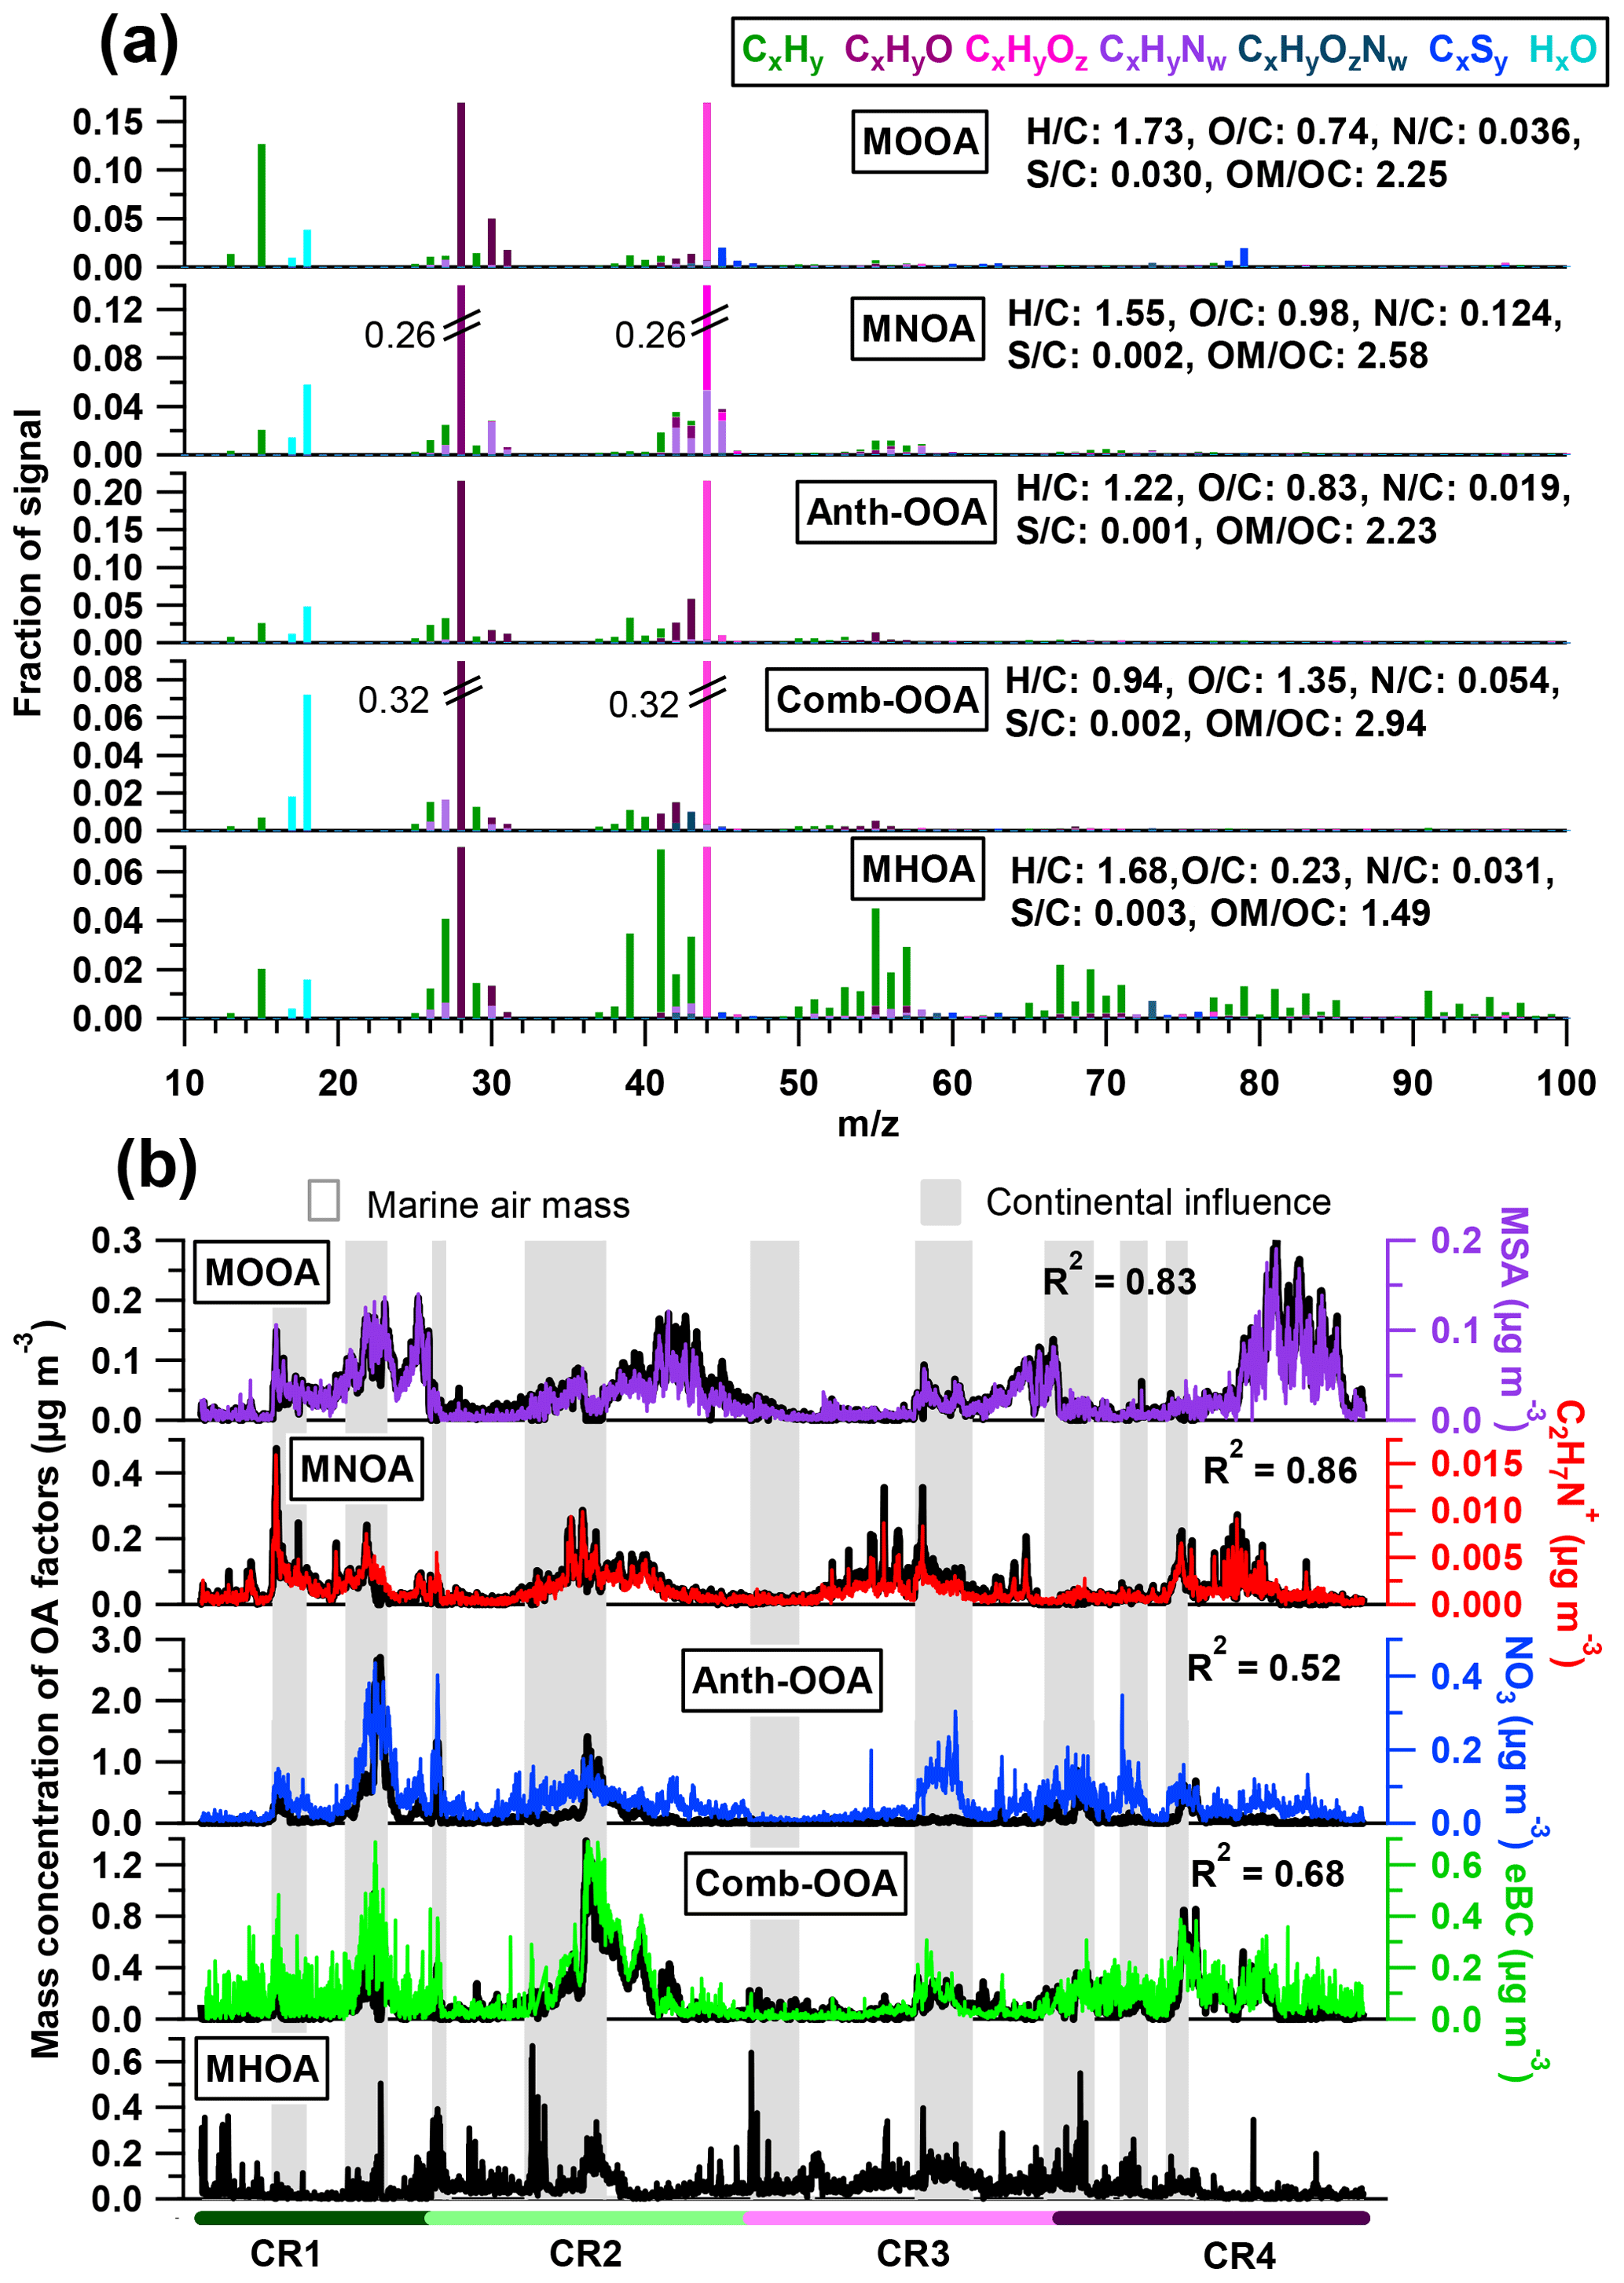
Figure 3(a) High-resolution mass spectra and (b) time series of five OA components. Also shown are simultaneous variations of tracer compounds on the right axes. Air masses with continental influence (grey) and originating from the ocean (blank) are marked in the background.
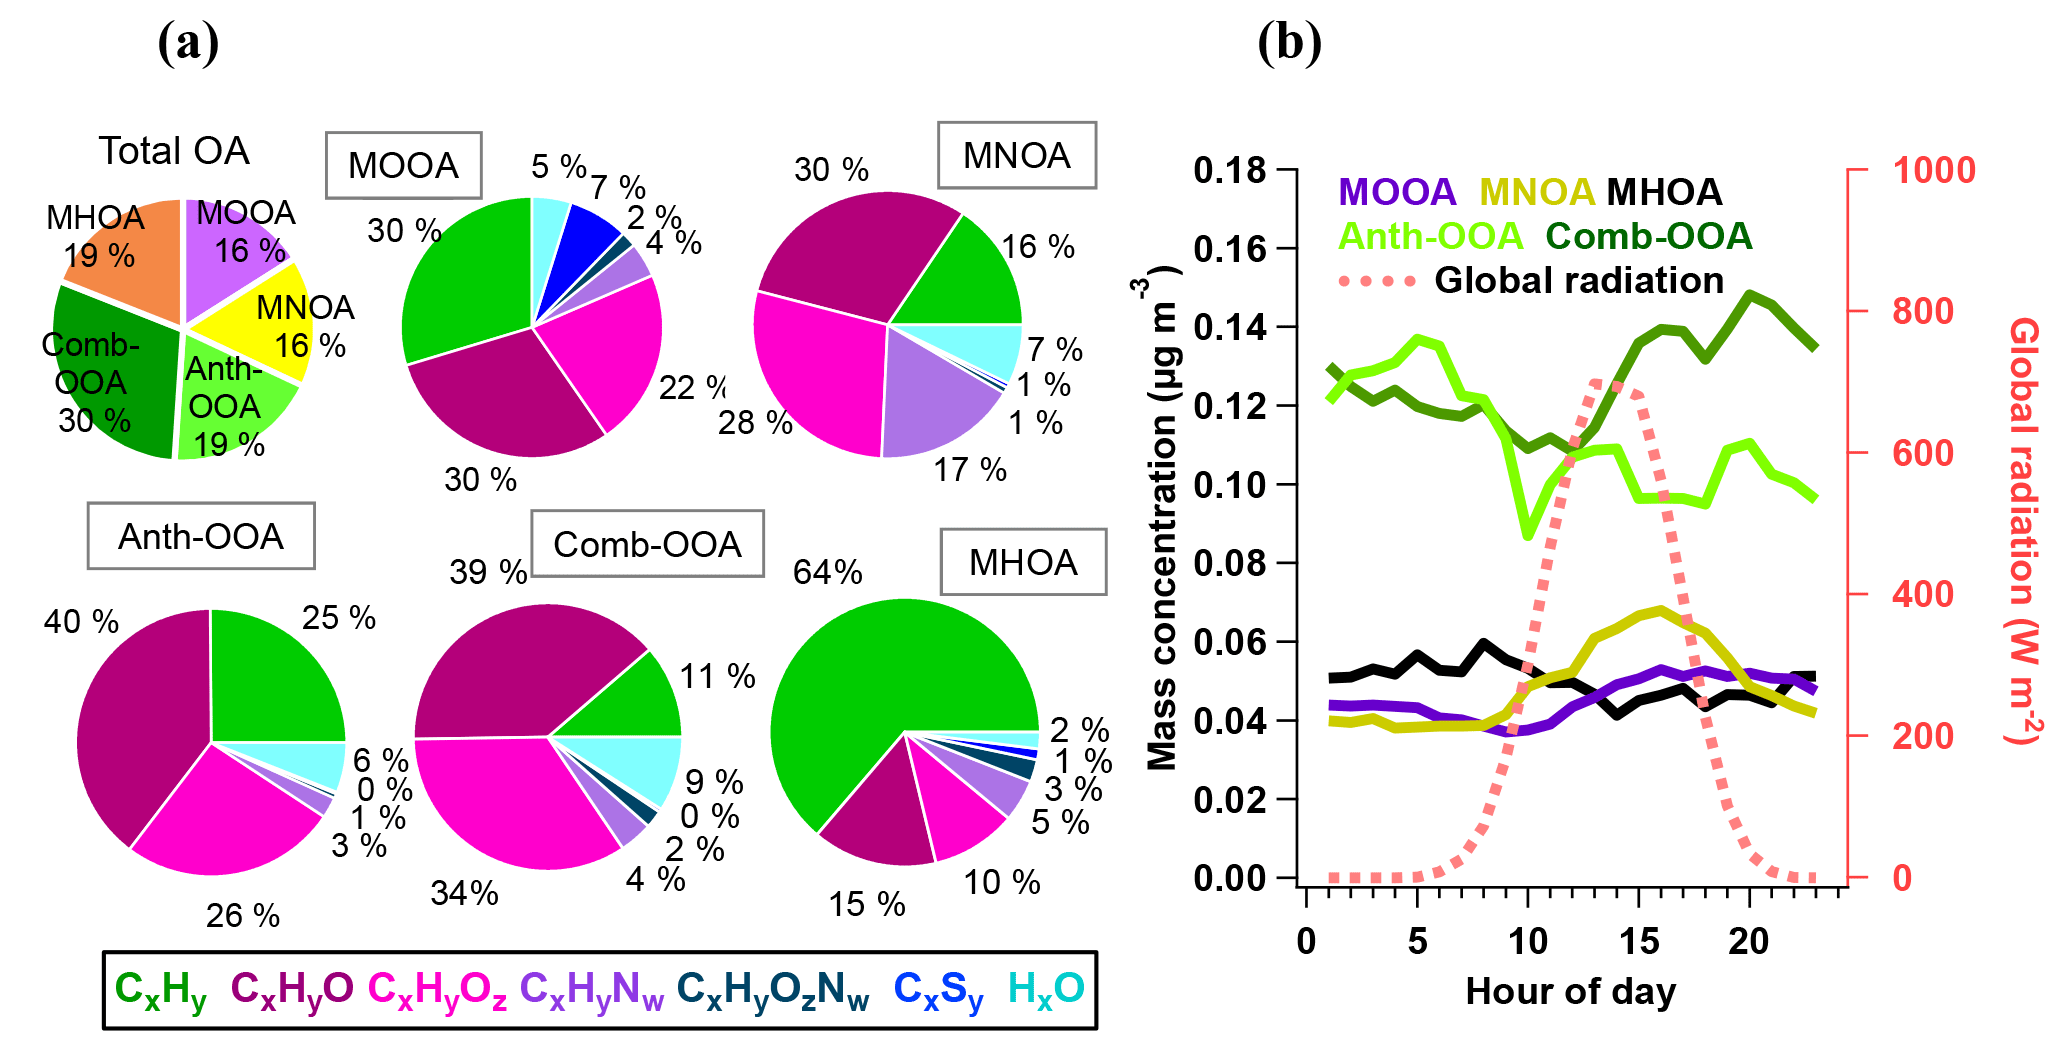
Figure 4(a) Average mass fraction of each component in the total OA mass concentration, the functional group composition of each OA factor and (b) diurnal variations of five OA factors with global radiation.
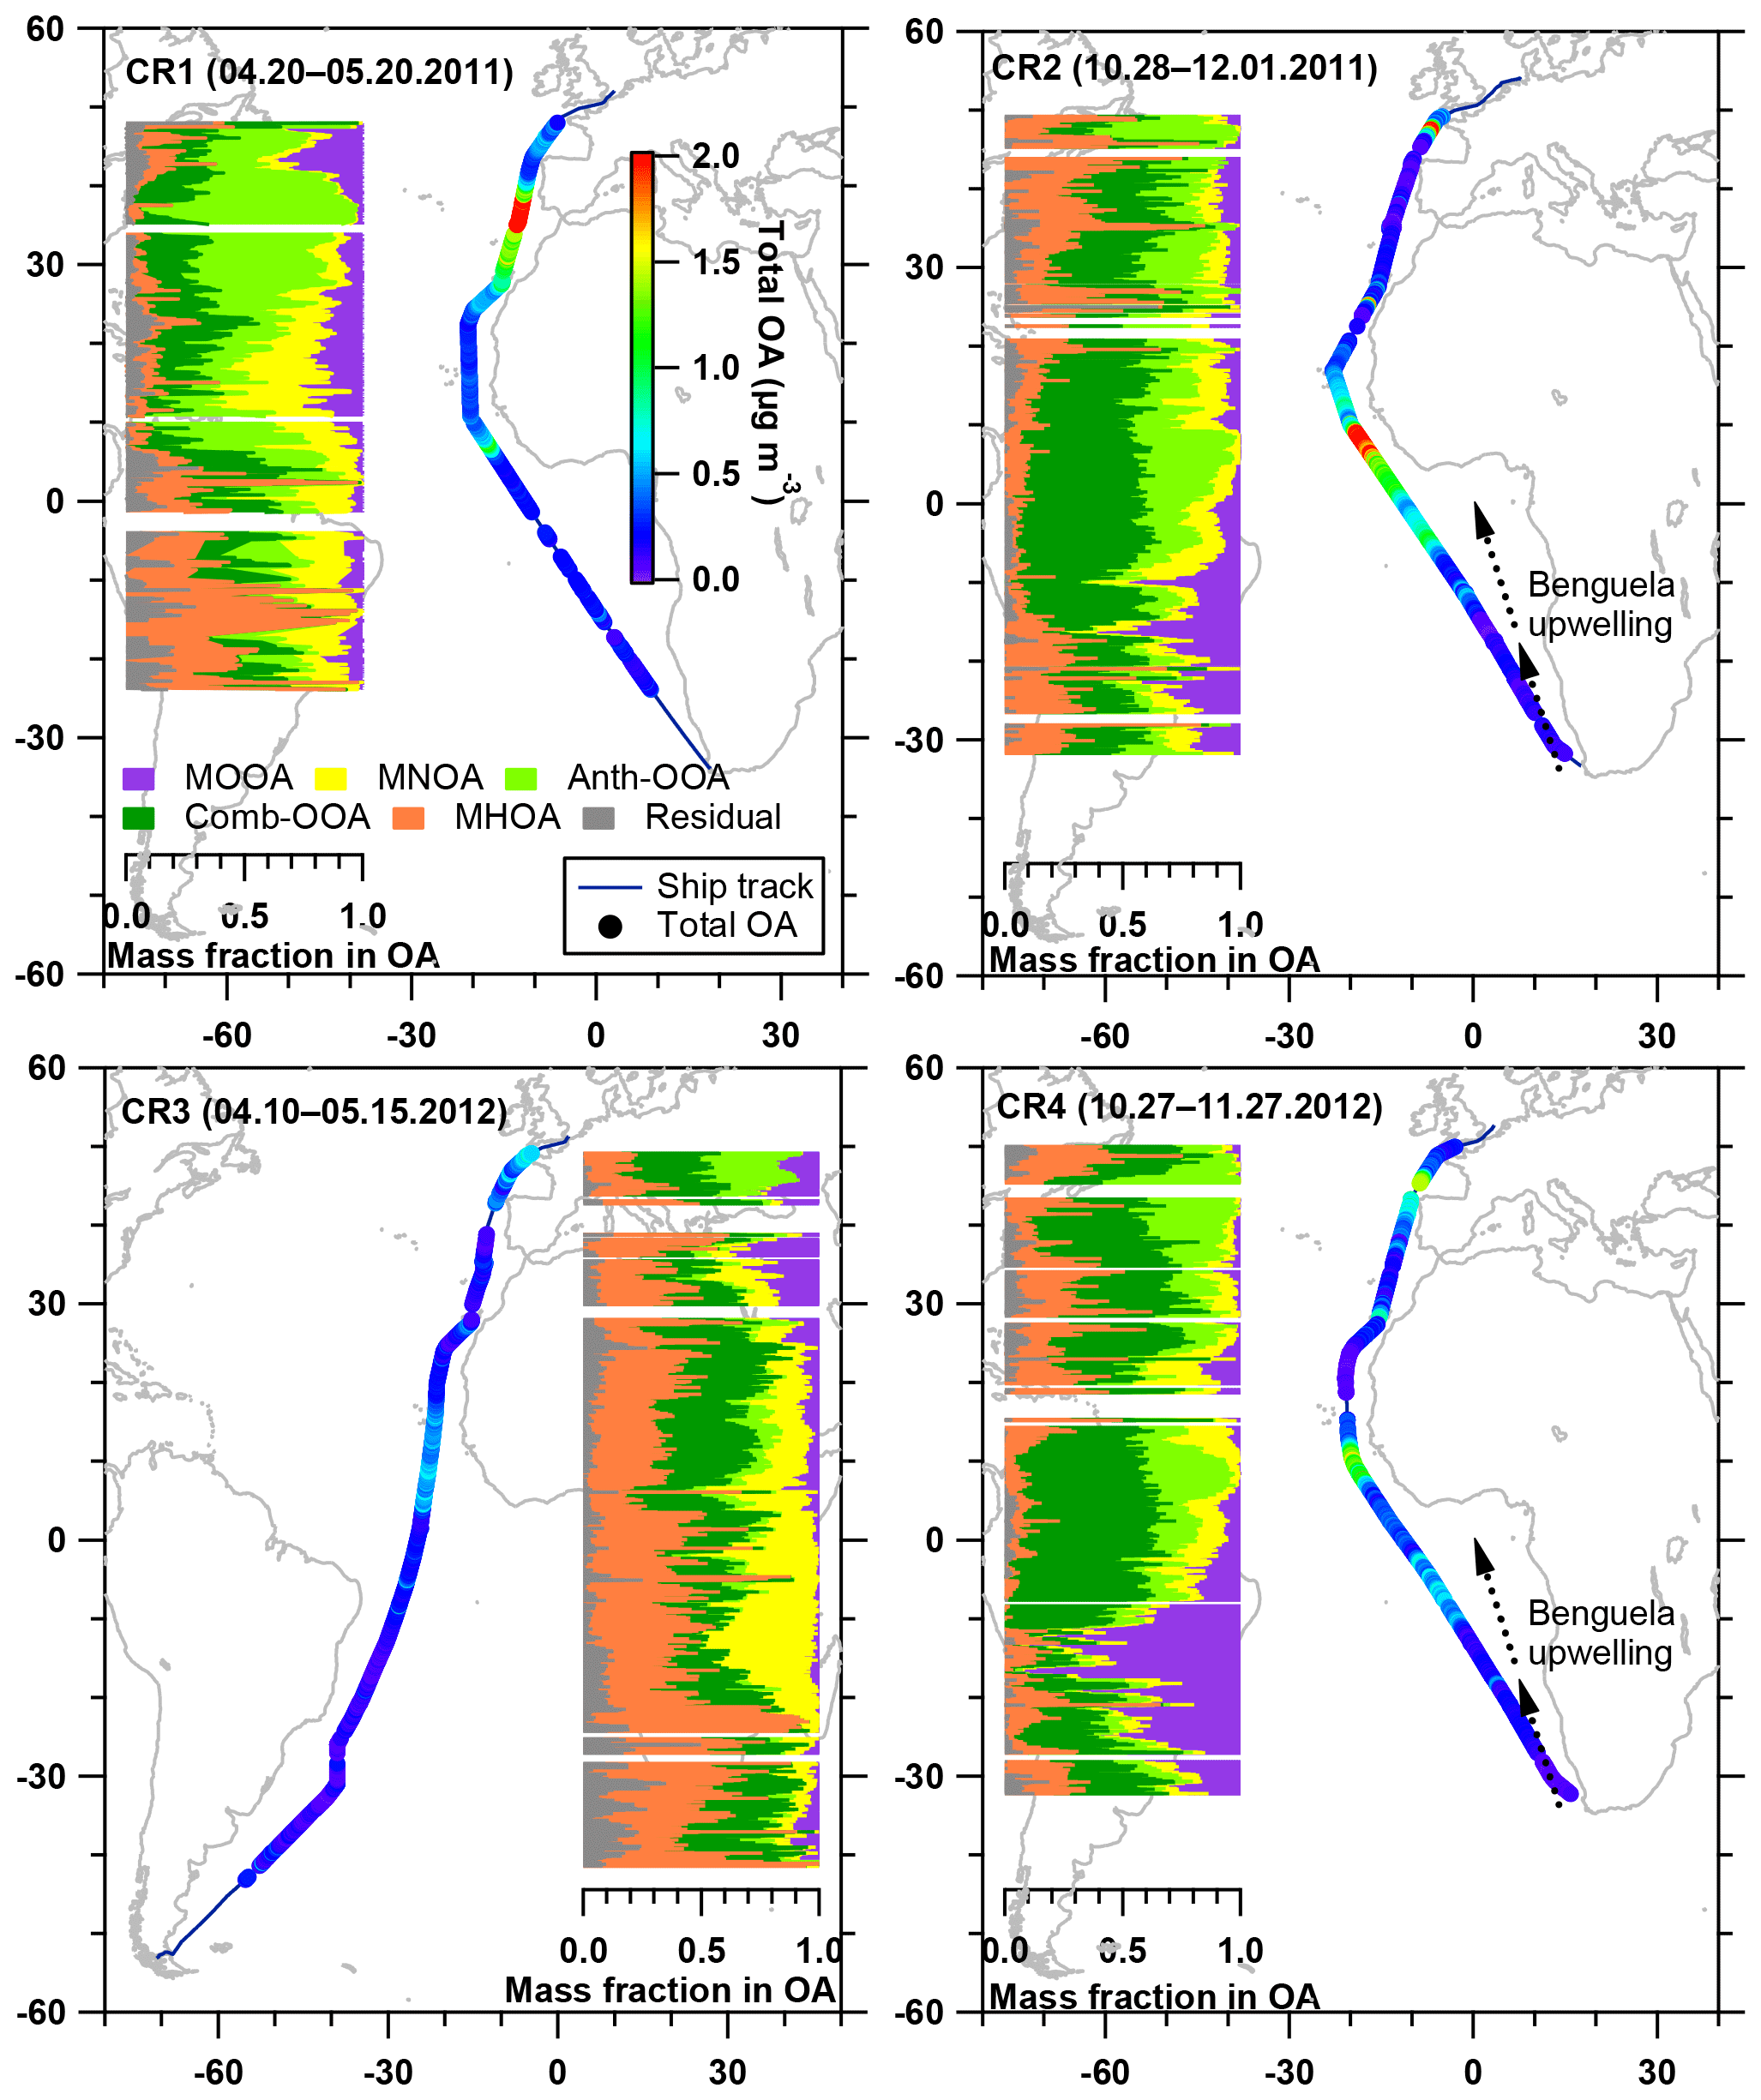
Figure 5Latitudinal distribution of five OA factor mass fractions in the total OA, with total OA mass concentration along the ship track during four cruises. The Benguela upwelling is marked in the maps for CR2 and CR4, while it is not displayed (but still exists) in CR1 and CR3.
Table 4 summarizes all comparisons for source identification of the five OA factors, including (1) correlations of time series between the OA factors and the measured tracers and (2) correlations of mass spectral patterns between the OA factors and the identified OA sources in the literature (Jimenez-Group, 2018). The average mass fraction of all five factors in the total measured OA, the functional group composition and the diurnal variation of each factor with global radiation (the sum of the direct solar radiation and diffuse radiation) are shown in Fig. 4. As a final summary, Fig. 5 provides the latitudinal distribution of five OA factors (mass fraction in the total OA mass) during the four R/V Polarstern cruises. Note that the residuals correspond to the unexplained organics by PMF. They are negligible in the average case (Fig. 4) but can be recognized in the latitude series (Fig. 5). Details on the characteristics of each OA component, including mass spectral profile, temporal variation, and associations with different sources and processes, are discussed in the following sections.
3.2.1 Marine oxygenated organic aerosol (MOOA)
The MOOA factor contributes an average of 16 % to the total OA mass, with a median mass concentration of 0.04 µg m−3. This factor is well correlated with the marine secondary organic aerosol (SOA) tracer MSA (R2=0.83; Fig. 3) and is consequently linked to the oxidation of DMS emitted by phytoplankton (Charlson et al., 1987; Gondwe et al., 2003). One characteristic of the MOOA factor is a high contribution from ions (7 %), which mainly include the MSA identified ions (m∕z 78.985), (m∕z 77.978), (m∕z 95.988), CHS+ (m∕z 44.980) and CH2S+ (m∕z 45.988; e.g., Huang et al., 2017). This leads to a high S ∕ C ratio (0.030), which is 10 to 30 times higher than that of other factors (Fig. 3). Note that the S ∕ C ratios derived from the PMF analysis tool have to be used with caution because of calculation uncertainties (Aiken et al., 2007), but they can still provide an indication of the significance of sulfur when calculated with the same tool among the factors from the same data set. Even though organic sulfur species play a remarkable role, oxygenated organic fragments are still the major species, accounting for 52 % of MOOA mass loading (CxHyO+ 30 %, 22 %; Fig. 4a). These fragment families are followed by hydrocarbon fragments, making up 30 % of the MOOA mass loading. is the most abundant fragment of the family, contributing 43 % to the total group mass loading in the MOOA. As a result, MOOA shows the highest H ∕ C ratio (1.73) of all five OA factors, similar to those reported previously: 1.57 (marine OA) in Paris during summer (Crippa et al., 2013) and 1.8 (MOOA) on Bird Island in the sub-Antarctic region (Schmale et al., 2013). This suggests that a high level of hydrocarbon ions (in particular ), together with , could be an important characteristic for marine-sourced SOA. The MOOA includes almost all organic fragments observed in MSA, as well as some additional oxygenated fragments, which indicates that the MOOA factor consists not only of MSA but also of other organic components either emitted from the same source or produced via similar processes as MSA. This finding is also proved by the relationship between the mass concentration of MOOA and MSA (slope =2.19, R2=0.83). Significant oxygen-containing ions, such as (m∕z 43.990) and COOH+ (m∕z 44.998), could be related to carboxylic acids, which are important in the composition of secondary marine aerosol (Decesari et al., 2011; Fu et al., 2011). The possible precursors of these carboxylic acids could be isoprene and monoterpenes emitted by marine phytoplankton (Bonsang et al., 1992; Shaw et al., 2010; Yassaa et al., 2008), which can be easily oxidized to form highly oxygenated products such as 2-methylglyceric acid, 2-methyltetrol and pinic acids (Claeys et al., 2010; Fu et al., 2011). It is well known that isoprene and monoterpene oxidation also leads to the formation of organosulfate compounds (Claeys et al., 2010; Fu et al., 2011; Iinuma et al., 2007; Surratt et al., 2007, 2008), which can contribute to the fragments observed in the MOOA factor.
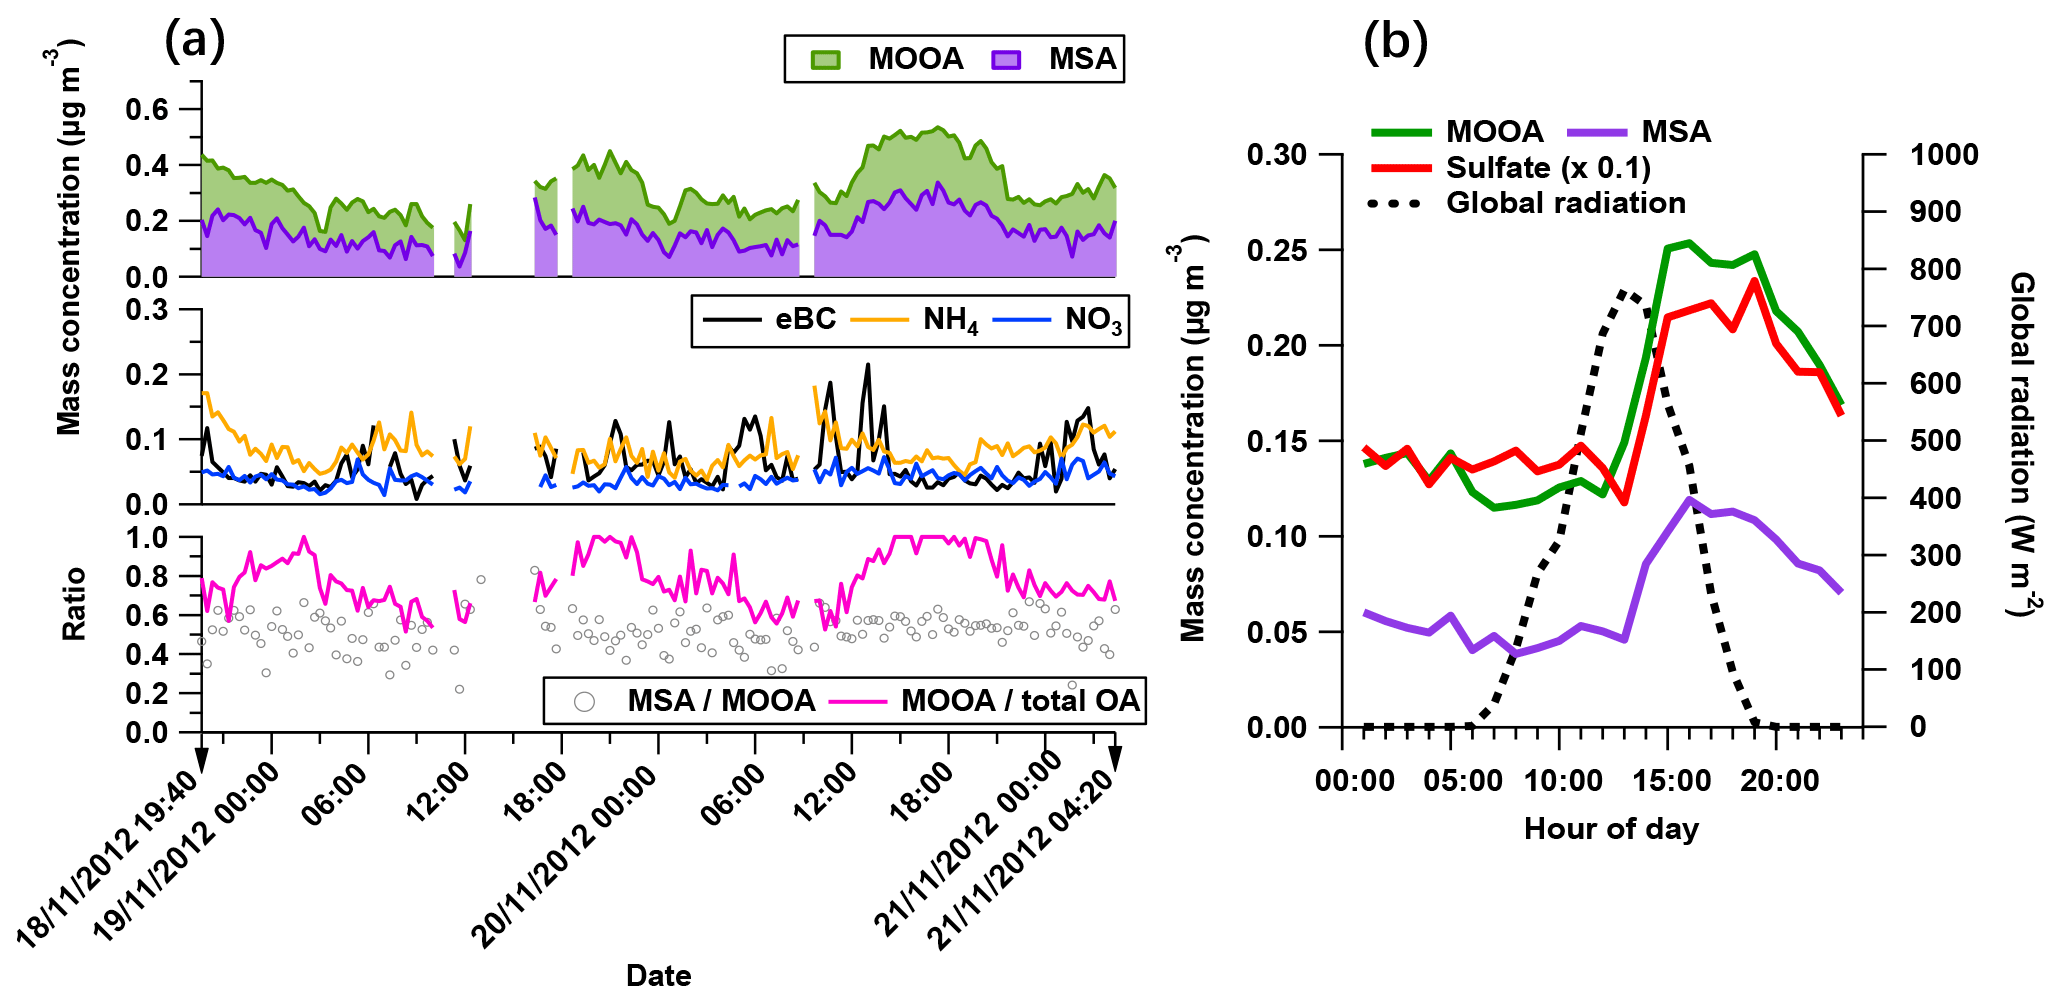
Figure 6The characteristics of the MOOA-dominating period: (a) time series of MOOA and MSA (top), possibly non-marine species (eBC, NH4 and NO3 in middle figure), as well as the ratio between MSA and MOOA and the mass fraction of MOOA in the total OA (bottom). (b) The diurnal variation of MOOA, MSA, sulfate (reduced to one tenth for comparison) and the global radiation.
The secondary origin of MOOA was supported by its diurnal cycle (Fig. 4), showing a small but clear elevation in the afternoon, and reaching the maximum (0.05 µg m−3) at 16:00 UTC, almost when global radiation started declining. To focus on the atmospheric behavior of MOOA and exclude the influence of other chemical compositions, an “MOOA-dominating period” was selected for a case study (approximately 57 h from 19:40 UTC, 18 November 2012 to 04:20 UTC, 21 November 2012). As shown in Fig. 6, the MOOA played an important role in the total OA during the selected period, constituting an average of 78 % (up to 100 %) of the total OA mass concentration. The MOOA had strong correlation with MSA with R2 of 0.81, almost the same as the overall coefficient (R2=0.83). Note that the latter one is slightly higher mainly due to greater variation of both MOOA and MSA concentrations during all four cruises. This covariation also resulted in a quite stable MSA ∕ MOOA ratio of 52 %±9 % during the MOOA-dominating period. NO3, NH4 and eBC showed low mass concentrations (median: 0.04, 0.08 and 0.05 µg m−3, respectively) close to their DLs, indicating a negligible impact from anthropogenic emissions during this period. The diurnal pattern for this specific period (Fig. 6b), with a minimum of 0.11 µg m−3 (MOOA mass concentration) at 07:00 UTC and a maximum of 0.25 µg m−3 at 16:00 UTC, was more noticeable than the average case (Fig. 4b). Similar diurnal cycles are observed for MSA and sulfate, suggesting that MOOA, MSA and sulfate are formed via the same secondary pathway (Charlson et al., 1987; Gondwe et al., 2003; von Glasow and Crutzen, 2004). Model studies found that the DMS is mainly (84 % globally) removed via photooxidation by OH radicals (Kloster et al., 2006) or oxidized by O3 in aqueous-phase reactions to yield a significant amount of MSA (Hoffmann et al., 2016). These findings suggest that DMS oxidation is controlled by photochemical processes and that its products should show a daytime maximum associated with solar radiation (as well as global radiation, as shown in Fig. 6b).

Figure 7The correlations between the MSA and MOOA factor in spring and autumn over different regions of the Atlantic Ocean.
The enhancement of MOOA mass concentration was observed to be independent of the air mass categories, and most MOOA peaks were associated with marine air masses (Fig. 3). The average MOOA mass concentration with marine air masses was 0.05±0.05 µg m−3 with a maximum of 0.31 µg m−3, both higher than those for MOOA from air masses with continental influence, i.e., 0.04±0.03 µg m−3 with a maximum of 0.19 µg m−3. This finding also supports that MOOA originate mainly from the ocean. Related to the DMS oxidation, the MOOA factor shows prominent seasonality and higher contributions to the total OA mass concentration in spring than in autumn; moreover, it shows higher contributions over the South Atlantic than the North Atlantic in spring (Fig. 5). In particular, the MOOA could be the exclusive contributor to the OA at approximately 16∘ S in spring, linked to the high biological activity fueled by the Benguela upwelling system, which is a northward-flowing ocean current along the west coast of southern Africa from Cape Point (Nelson and Hutchings, 1983), bringing up the nutrients from deep cold waters.
Because the MOOA component is successfully traced by MSA, the relationship between the MSA and MOOA should be applicable to estimate DMS-related SOA over the Atlantic Ocean. The correlations between MSA and MOOA in spring, autumn and the tropical season (with unclear seasonal variation, 5∘ N to 5∘ S latitude) are shown in Fig. 7. The scattering points are fitted using linear orthogonal distance regression (ODR). Overall, the correlations between MSA and MOOA in three cases are robust (R2=0.85, 0.53, 0.88), consistent (slope =0.57, 0.56, 0.56), and independent of regions and seasons (for spring and autumn). We therefore infer that the relation between MSA and its concomitant (DMS-related) SOA is roughly stable over the Atlantic Ocean and suggest estimating MOOA mass concentration as the product of the MSA concentration multiplied by a factor of 1.79, which may be useful for a better estimation of marine DMS-related SOA both in field measurements and in models.
3.2.2 Marine nitrogen-containing organic aerosol (MNOA)
The MNOA component showed a unique time series and poor correlation with the other four factors (all R2 were below 0.13). The mass concentration of MNOA varied from below the DL to 0.47 µg m−3 (median 0.03 µg m−3) and contributed 16 % of the OA. The MNOA is characterized by a remarkable contribution from organonitrogen fragments (17 %, Fig. 4), mainly related to CxHyN+, such as C2H6N+ (accounting for 5.3 % of total m∕z 44 intensity), C2H7N+ (2.6 % of m∕z 45) and CH4N+ (2.7 % of m∕z 30), which are at least 1 order of magnitude higher (intensity fraction in the located m∕z) than in other factors. Nevertheless, this factor is still dominated by oxygenated fragments including CxHyO+ (30 %) and (28 %, Fig. 4), and the diurnal variation of MNOA shows a broad afternoon peak with a maximum at 16:00 UTC (Fig. 4), similar to that of the amine-related secondary factor in New York City showing a diurnal pattern with maximum at 12:00 EST (Eastern Standard Time; Sun et al., 2011). Both of these findings may indicate that secondary formation could be one of the possible pathways for MNOA generation.
N-containing OA (NOA) factors from PMF analysis have been found in many studies and can be related to various origins highly dependent on local sources, such as gentoo penguin hatching activities (Schmale et al., 2013) and local primary (industrial) emissions (Aiken et al., 2009). During the R/V Polarstern campaign, the MNOA is correlated with neither eBC (R2=0.17) nor NO3 (R2=0.06), excluding the possibility of combustion and anthropogenic (continental) sources. Meanwhile, high similarity (R2=0.70) of the mass spectral profile is found between the R/V Polarstern MNOA and the NOA in Sun et al. (2011), who attributed that factor in New York City to marine and local industry emissions and stressed the possibility of gas-to-particle conversion via the reactions of acidic gases and the gaseous amines. It is worth noting that the characteristic CxHyN+ fragments are actually different in these two studies: C3H8N+ (m∕z 58) and C2H4N+ (m∕z 42) dominated the CxHyN+ group in the New York study, while C2H6N+ (m∕z 44), C2H7N+ (m∕z 45) and CH4N+ (m∕z 30) played a more important role in R/V Polarstern measurements. These C1–C3 CxHyN+ fragments may originate from low-molecular-weight aliphatic amines such as methylamine (CH5N), dimethylamine (C2H7N) and trimethylamine (C3H9N), which have been regarded as the main species in organonitrogen fragments from marine sources (Gibb et al., 1999; Müller et al., 2009) as well as important biogenic SOA precursors over the ocean (Dall'Osto et al., 2012; Facchini et al., 2008; Müller et al., 2009). In addition, a large number of CxHyN+ fragments results in the highest N ∕ C atom ratio (0.124) among all five OA factors, and this N ∕ C ratio is close to the one used in a global 3-D chemistry-transport model by Kanakidou et al. (2012) to trace the organonitrogen from ocean sources (0.15), while it is different from the ratio for biomass burning (BB) and anthropogenic sources (0.3). This may also support the idea that the MNOA originates from the ocean, likely transformed from phytoplankton-emitted gaseous amines.
The MNOA shows no correlation with marine secondary product tracer MSA (R2=0.01). This absence of correlation has already been reported in several marine measurements of particulate amines with biogenic origins (Facchini et al., 2008; Miyazaki et al., 2011; Müller et al., 2009), although acid–base reactions were considered a key process of gas-to-particle conversion for amines over the ocean (Facchini et al., 2008; Sun et al., 2011). Given that gaseous amines can enter the particle phase in different ways (Ge et al., 2011), other pathways, including oxidation, nucleation and condensation, should also be considered.
During each cruise, the MNOA had a low mass concentration with no clear seasonality. However, its high significance can be found when the total OA mass concentration was extremely low, generally below 0.5 µg m−3 (Fig. 5), e.g., 20∘ S to 20∘ N in CR1 and CR3. It is interesting that during CR3, the MNOA contributed to nearly half of the total OA between the equator and 20∘ S in association with very clean air masses from the open ocean, which may confirm its marine origin. We also noticed that the MNOA had a similar variation trend during all four cruises, slowly increasing and then decreasing broadly between 20∘ S and 20∘ N. This variation was generally coincident with the change in the water temperature (Fig. S10). The covariation might be explained by the biogenic sources of the MNOA – temperature could positively affect metabolism rate, including N excretion of marine microorganisms (Ikeda, 2014).
3.2.3 Marine hydrocarbon-like organic aerosol (MHOA)
The only true primary factor identified, MHOA, is related to marine primary emissions. It is characterized by a high contribution of hydrocarbon ions (64 % of total factor mass concentration, Fig. 4), which is usually considered a feature of primary emissions. One-fourth of the MHOA mass was identified as oxygenated organic compounds (CxHyO+, ). This finding is not surprising, because carboxylic acids can also be supplied via the primary pathway and have been identified as a distinct type of primary marine organic matter (Hawkins and Russell, 2010). A small but pronounced portion (5 %) of CxHyN+ fragments was observed in total MHOA mass loadings, consistent with the findings in previous measurements that amines also existed in primary marine OA (Frossard et al., 2014; Quinn et al., 2015).
The time series of MHOA mass concentration was spiky and varied from < DL to 0.67 µg m−3, with a median of 0.04 µg m−3. It contributed 19 % to the total OA mass concentration, comparable to two marine secondary factors (MOOA 16 %, MNOA 16 %). No clear diurnal pattern was found for the MHOA, indicating that the contribution of photooxidation could possibly be ignored for this factor.
Considering that the ship contamination periods have been eliminated and the MHOA was not correlated with eBC (R2=0.04), fresh ship emissions were unlikely to have been a contributor to this primary factor. The primary emissions from the ocean were considered a main source of the MHOA because of the similarity (R2=0.61) in the mass spectral profile between this factor and primary marine OA during high biological activity at Mace Head, Ireland (Ovadnevaite et al., 2011). For the entire measurement period, the MHOA was not correlated with sea salt (R2=0.01) or the wind speed (R2=0.01), even though a similar variation trend (but no strong linear correlation, R2<0.4) was found in several periods, such as the southern parts (from 33 to 0∘ S) of CR2 and CR4 (Fig. S11). This trend does not conflict with the speculation that MHOA is related to marine primary emissions, because the mass fraction of organics in the sea spray aerosol was found to be size-dependent, increasing with decreasing particle size (Gantt et al., 2011; Quinn et al., 2015). The enrichment factor of organic compounds, i.e., the ratio between the organic carbon in sea spray aerosols and that in seawater, is also largely influenced by particle size (Quinn et al., 2015). In addition, the transfer of organic matter from seawater to the particles is chemoselective and more complicated than it is for inorganic sea salt (Schmitt-Kopplin et al., 2012). During all four cruises, the MHOA factor did not show any location dependence but played a more prominent role in regions with extremely low OA mass concentrations, e.g., the southern part of CR1 and the whole period of CR3 (Fig. 5). This finding could support the hypothesis that the MHOA originates from the ocean.
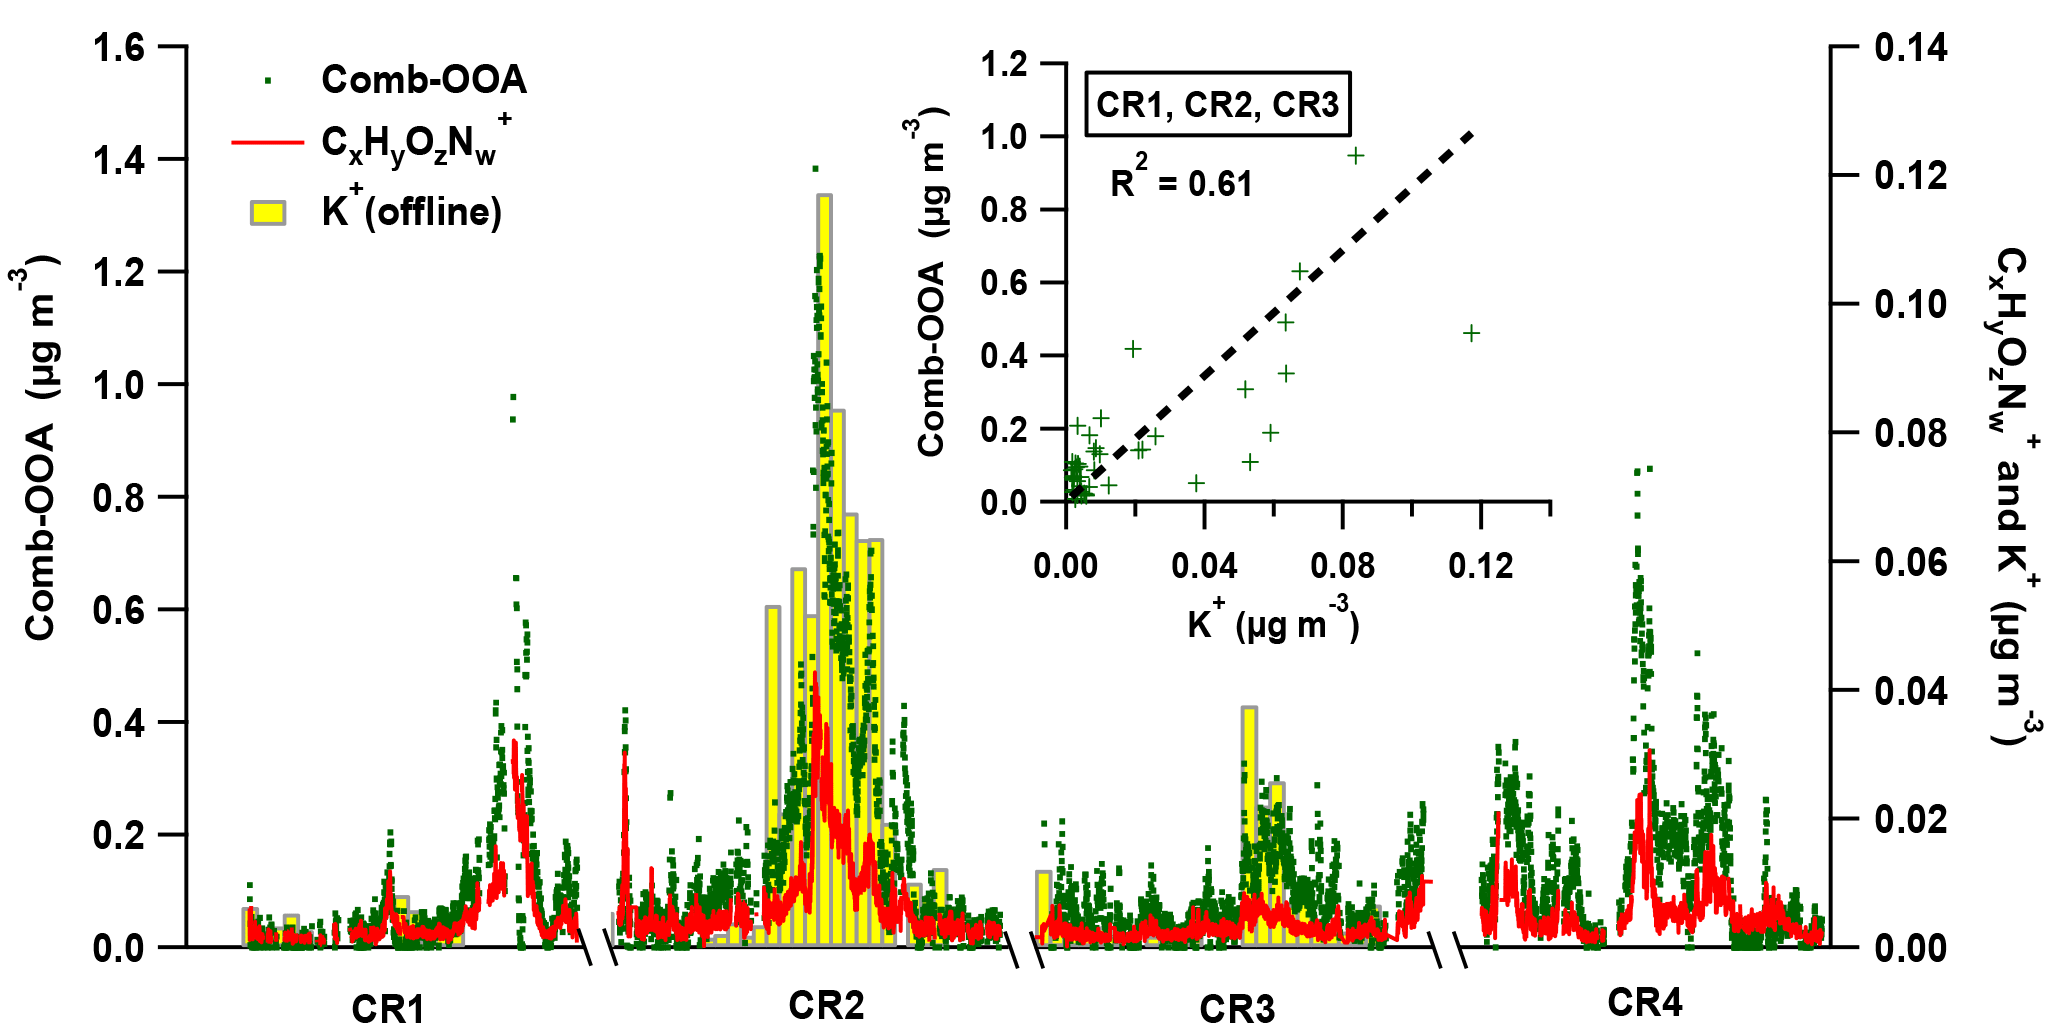
Figure 8The variation of Comb-OOA (green dot), fragments (red line) and potassium (K+, the yellow bar with grey box) during Polarstern cruises. Note that the 24 h average mass concentration of K+ is obtained from offline measurements only performed during the first three cruises. The scattering plot in the sub-window provides the correlation between 24 h average mass concentration of Comb-OOA from AMS and potassium from offline measurements.
3.2.4 Anthropogenic oxygenated organic aerosol (Anth-OOA)
Although measured over the ocean, 19 % of the organic aerosol mass was contributed by continental emissions from human activities, presented by the Anth-OOA factor with a similar median (0.04 µg m−3) but the highest maximum (2.70 µg m−3) compared to the other OA factors. The Anth-OOA factor was identified by the anthropogenic tracer NO3 regarding time series (R2=0.52; Fig. 3) and resemblance of mass spectral profiles to several reported continental OOA factors (Table 4). The Anth-OOA in this study was in excellent agreement (R2=0.98) with a factor of continental organics observed over the central Arctic Ocean (Chang et al., 2011). It was also similar (R2=0.67) to the average OOA factor based on nine urban measurements (Ng et al., 2011). As shown in Fig. 4, the Anth-OOA factor was dominated by CxHyO+ fragments (contributing 40 % to the total factor mass), followed by (26 %). Significant contributions were observed from (m∕z 44, 21 % of total Anth-OOA mass loading) and C2H3O+ (m∕z 43, 6 %), comparable to values in previous studies in urban and rural areas (e.g., Ng et al., 2011; Poulain et al., 2011a). Another carboxylic acid fragment, CO+ (m∕z 28, 21 % of total Anth-OOA mass loading), was estimated according to the ion; thus CO+ is not specifically discussed in the present work. There was no clear diurnal pattern for the Anth-OOA factor (Fig. 4). The Anth-OOA mass concentration dropped in the early morning from 05:00 UTC, reached a minimum at ∼ 10:00 UTC, then stayed stable until 00:00 UTC. This change may be explained by the rising mixing layer in the morning, which dilutes the particle concentration, and/or increasing temperature after sunrise, and drives volatile species from particles into the gas phase. Hence, the Anth-OOA is unlikely to be contributed to by local photochemical formation but rather by continental outflow from anthropogenic activities via long-range transport.
Significant elevation of Anth-OOA mass concentrations (up to 2.70 µg m−3) was associated mainly with continental air masses (Fig. 3). The median value of the Anth-OOA mass concentration in marine air masses was 0.03 µg m−3 and higher (0.08 µg m−3) during periods influenced by continental air masses. Additionally, the contribution of Anth-OOA to the total OA significantly increased, even when close to Africa and Europe (Fig. 8). This confirms that the continental outflow is the main source of the Anth-OOA factor.
3.2.5 Combustion oxygenated organic aerosol (Comb-OOA)
Of all five factors, the Comb-OOA is the only one correlated with eBC (R2=0.69; Fig. 3), pointing to combustion sources. It was the most abundant component of the measured OA on average, contributing 30 % of the total OA mass. The median Comb-OOA mass concentration was 0.07 µg m−3 (< DL to 1.38 µg m−3). Similar to the Anth-OOA, most Comb-OOA peaks appeared together with continental air masses (Fig. 3), indicating a non-marine source. One significant characteristic of the Comb-OOA factor was its highly oxygenated level. Oxygenated fragments including CxHyO+ and accounted for 73 % of the total Comb-OOA mass concentration (Fig. 4). This factor contained remarkably high (the ratio of to total Comb-OOA %, indicating a possible origin from organic acids. As a result, the Comb-OOA exhibited the highest O ∕ C ratio (O ∕ C = 1.35) and lowest H ∕ C ratio (H ∕ C =0.94) of all OA factors. The Comb-OOA was also contributed by pronounced N-containing fragments: CxHyN+ (4 %) and (2 %). Despite the small contribution to the Comb-OOA mass concentration, fragments were primarily distributed in this factor (46 % of total intensity).
The Comb-OOA factor was attributed to aged aerosol particles from combustion emissions, mainly because of its highly oxygenated level and covariance with combustion tracer eBC. Additionally, this factor had a similar mass spectrum to the OA below clouds measured by a flight impacted by ship emissions (R2=0.73; Coggon et al., 2012) and the photooxidation products of diluted diesel generator exhaust (R2=0.46; Sage et al., 2008), rather than any fresh combustion emissions, e.g., the fresh ship emissions factor (R2=0.00; Chang et al., 2011), the average BB organic aerosols (BBOA; R2=0.09; Ng et al., 2011) and the average HOA factor (R2=0.01; Ng et al., 2011). This finding is reasonable, because the influence of direct ship emissions from the R/V Polarstern has been removed. Sage et al. (2008) found that SOA could be quickly formed from fresh diesel exhausts, and the aged products were increasingly oxidized with time, resembling the profile of atmospheric aged OA within a few hours of oxidation. Given that, most of the time, the R/V Polarstern traveled along major shipping routes (Fig. S12), a possible source of the Comb-OOA could be the transported ship exhausts from other ships.
The BB emissions via long-range transport are likely to be the other important source of the Comb-OOA, indicated by a good correlation with fragments (from AMS, R2=0.83) and potassium (K+, from offline measurements, R2=0.61), as shown in Fig. 8. The ions have been related to the photooxidation product of m-cresol, a typical wood burning emission (Iinuma et al., 2010; Poulain et al., 2011a), and potassium is commonly regarded as an unreactive tracer of BB emissions. Nevertheless, some frequently used BB tracers, and (Capes et al., 2008; Cubison et al., 2011), were extremely low in our Comb-OOA factor (the ratio of to total Comb-OOA %, the ratio of to total Comb-OOA %), even though the f60 increased to 0.18 % during the high-Comb-OOA period (the factor mass concentration and mass fraction in total OA reached 1.02 µg m−3 and 47 %). The absence of these BB tracers may be caused by decay in the aging process during long-range transport. Fresh BB emissions can be quickly photochemically aged (in several hours), resulting in the formation of new OA with a higher degree of oxygenation and a significant decrease in BB tracers as well as saturated hydrocarbon compounds. This change has been observed in both laboratory (Bertrand et al., 2018; Grieshop et al., 2009) and field measurements (Capes et al., 2008; DeCarlo et al., 2010).
The significance of the Comb-OOA, i.e., the aged particles from combustion emissions, are dependent on regions and seasons (Fig. 5). More than 50 % of the total OA was contributed by aged particles from combustion emissions, especially during the two November cruises (CR2 and CR4) between 15∘ N and 15∘ S, when the ship was near western and central Africa. It is well known that Africa is the single biggest continental source of BB emissions with strong seasonality (Roberts et al., 2009). In western and central Africa, more intense fires occurred in November than in April and May according to the fire maps (Fig. S13), consistent with higher mass concentrations of Comb-OOA in CR2 and CR4 than during the other two cruises. In addition, the mass concentration of the Comb-OOA increased when the ship was near the English Channel, where marine traffic is very busy (Fig. S12).
This study presents the physicochemical measurements of the MBL aerosol over the Atlantic Ocean conducted during four open-ocean cruises for a total of 17 weeks in 2011 and 2012 and covering latitudes from 53∘ N to 53∘ S. Based on this unique data set, especially the part obtained with HR-ToF-AMS, the aerosol chemical composition and OA sources were investigated in detail.
The sub-micrometer chemical aerosol composition varied dynamically during the cruises, with an average of sulfate (50 %), organics (21 %), sea salt (12 %), ammonium (9 %), eBC (5 %) and nitrate (3 %). Sulfate was found to be the dominant species of submicron aerosol particles over the open Atlantic Ocean. Sulfate also showed noticeable seasonality, suggesting a major contribution of marine biogenic sources. Considering that organics are an important constituent of the sub-micrometer aerosol and contain a large number of compounds from different sources and processes, source apportionment of OA was therefore performed using the PMF method. Five OA factors were identified and linked to distinct sources, including following three marine factors: (a) an MOOA factor related to marine DMS oxidation (16 % of the total OA mass concentration), (b) an MNOA factor from the secondary formation of biogenic amines (16 %) and (c) an MHOA factor from primary marine emissions (19 %). Two non-marine factors have been identified: (a) an Anth-OOA factor from continental outflow (19 %) and (b) a Comb-OOA factor attributed to aged aerosol particles from combustion emissions, mainly from biomass burning over the African continent and marine traffic over the Atlantic Ocean (30 %). The MOOA factor shows prominent seasonality, with an increased contribution to the total OA mass concentration in spring compared to autumn. Moreover, it shows a higher contribution over the South Atlantic than over the North Atlantic Ocean in spring. This seasonality is, however, not observed for the other two marine factors. The MNOA and MHOA both played a significant role in the clean marine regions with low particle mass concentrations (e.g., in CR3 when the ship started from Punta Arenas). Continental influences on the MBL aerosol over the Atlantic Ocean were latitude-dependent during the R/V Polarstern measurements, represented by the Anth-OOA and Comb-OOA factors. Both factors had dominant, even overwhelming, mass fractions, when measurements have been performed close to a continent, e.g., Europe and western and central Africa, especially between 15∘ N and 15∘ S.
During the R/V Polarstern cruises, marine sources contributed, on average, 51 % to the total OA mass concentration, close to that of the non-marine emissions (49 %), reflecting the fact that continental-related long-range transport has a large influence on the MBL aerosol, even over the open ocean. However, the latitudinal source contribution shows that marine-sourced OA is ubiquitous and, in a great part of cruising areas, dominates the total OA mass loadings. DMS oxidation could even be the sole source of the OA in some regions, e.g., with upwelling, while the marine primary OA and amine-related organics represented a background marine contribution and were more visible in the clean marine areas. Finally, as a coproduct of the source apportionment, a solid linear correlation has been found between MOOA and MSA, which enables the estimation of marine SOA with DMS origins in the spring to be the MSA mass concentration times a factor of 1.79. This may be applicable in both field measurements and model studies with a focus on marine aerosols.
The data in the study are available upon request at TROPOS (poulain@tropos.de). Air mass back trajectories along the ship track were ordered and obtained from German Weather Service (DWD). Navigation parameters and meteorological parameters were downloaded from the R/V Polarstern central data acquisition system (https://dship.awi.de/). Fire maps were obtained from an online database of the MODIS satellite (http://rapidfire.sci.gsfc.nasa.gov/firemaps/).
The supplement related to this article is available online at: https://doi.org/10.5194/acp-18-18043-2018-supplement.
SH, ZW and LP conducted the AMS measurements. SH processed the AMS data and wrote the paper. MvP analyzed the offline samples. MM processed the MPSS data. DA processed the MAAP data. HH and AW designed the campaigns and improved the flow of the paper. SH and ZW contributed equally.
The authors declare that they have no conflict of interest.
We thank all scientists and crews aboard R/V Polarstern. We are grateful for the support from the Alfred Wegener Institute
(AWI) and Germany Weather Service (DWD) for sharing data of cruises,
including data of navigation, oceanography, meteorology and air mass back
trajectories. We thank all the support through the following projects and
research programs: (1) the Gottfried Wilhelm Leibniz Association (OCEANET
project in the framework of PAKT)
and (2) Polarstern expeditions
AWI_ANT27/4, AWI_ANT28/1, AWI_ANT28/5 and AWI_ANT29/1. Acknowledgement is also given to “the
Fundamental Research Funds for the Central Universities” for supporting the
first author with paper rewriting and data reanalysis in Jinan
University, China. We thank Jun Yang and Weiwei Lin for valuable
discussion on statistical analysis.
Edited by: Jason Surratt
Reviewed by: two anonymous referees
Adams, P. J., Seinfeld, J. H., and Koch, D. M.: Global concentrations of tropospheric sulfate, nitrate, and ammonium aerosol simulated in a general circulation model, J. Geophys. Res.-Atmos., 104, 13791–13823, https://doi.org/10.1029/1999jd900083, 1999.
Aiken, A. C., DeCarlo, P. F., and Jimenez, J. L.: Elemental Analysis of Organic Species with Electron Ionization High-Resolution Mass Spectrometry, Anal. Chem., 79, 8350–8358, https://doi.org/10.1021/ac071150w, 2007.
Aiken, A. C., DeCarlo, P. F., Kroll, J. H., Worsnop, D. R., Huffman, J. A., Docherty, K. S., Ulbrich, I. M., Mohr, C., Kimmel, J. R., Sueper, D., Sun, Y., Zhang, Q., Trimborn, A., Northway, M., Ziemann, P. J., Canagaratna, M. R., Onasch, T. B., Alfarra, M. R., Prevot, A. S. H., Dommen, J., Duplissy, J., Metzger, A., Baltensperger, U., and Jimenez, J. L.: O ∕ C and OM ∕ OC Ratios of Primary, Secondary, and Ambient Organic Aerosols with High-Resolution Time-of-Flight Aerosol Mass Spectrometry, Environ. Sci. Technol., 42, 4478–4485, https://doi.org/10.1021/es703009q, 2008.
Aiken, A. C., Salcedo, D., Cubison, M. J., Huffman, J. A., DeCarlo, P. F., Ulbrich, I. M., Docherty, K. S., Sueper, D., Kimmel, J. R., Worsnop, D. R., Trimborn, A., Northway, M., Stone, E. A., Schauer, J. J., Volkamer, R. M., Fortner, E., de Foy, B., Wang, J., Laskin, A., Shutthanandan, V., Zheng, J., Zhang, R., Gaffney, J., Marley, N. A., Paredes-Miranda, G., Arnott, W. P., Molina, L. T., Sosa, G., and Jimenez, J. L.: Mexico City aerosol analysis during MILAGRO using high resolution aerosol mass spectrometry at the urban supersite (T0) – Part 1: Fine particle composition and organic source apportionment, Atmos. Chem. Phys., 9, 6633–6653, https://doi.org/10.5194/acp-9-6633-2009, 2009.
Aller, J. Y., Kuznetsova, M. R., Jahns, C. J., and Kemp, P. F.: The sea surface microlayer as a source of viral and bacterial enrichment in marine aerosols, J. Aerosol Sci., 36, 801–812, https://doi.org/10.1016/j.jaerosci.2004.10.012, 2005.
Andreae, M. O.: Aerosols Before Pollution, Science, 315, 50–51, https://doi.org/10.1126/science.1136529, 2007.
Andreas, E. L.: A review of the sea spray generation function for the open ocean, Vol. 1, WIT Press, Southampton, UK, 2002.
Ayers, G. P. and Gillett, R. W.: DMS and its oxidation products in the remote marine atmosphere: implications for climate and atmospheric chemistry, J. Sea Res., 43, 275–286, 2000.
Bates, T. S., Charlson, R. J., and Gammon, R. H.: Evidence for the climatic role of marine biogenic sulphur, Nature, 329, 319–321, 1987.
Bertrand, A., Stefenelli, G., Jen, C. N., Pieber, S. M., Bruns, E. A., Ni, H., Temime-Roussel, B., Slowik, J. G., Goldstein, A. H., El Haddad, I., Baltensperger, U., Prévôt, A. S. H., Wortham, H., and Marchand, N.: Evolution of the chemical fingerprint of biomass burning organic aerosol during aging, Atmos. Chem. Phys., 18, 7607–7624, https://doi.org/10.5194/acp-18-7607-2018, 2018.
Bonsang, B., Polle, C., and Lambert, G.: Evidence for marine production of isoprene, Geophys. Res. Lett., 19, 1129–1132, https://doi.org/10.1029/92GL00083, 1992.
Canagaratna, M. R., Jayne, J. T., Jimenez, J. L., Allan, J. D., Alfarra, M. R., Zhang, Q., Onasch, T. B., Drewnick, F., Coe, H., Middlebrook, A., Delia, A., Williams, L. R., Trimborn, A. M., Northway, M. J., DeCarlo, P. F., Kolb, C. E., Davidovits, P., and Worsnop, D. R.: Chemical and microphysical characterization of ambient aerosols with the aerodyne aerosol mass spectrometer, Mass Spectrom. Rev., 26, 185–222, https://doi.org/10.1002/mas.20115, 2007.
Canagaratna, M. R., Jimenez, J. L., Kroll, J. H., Chen, Q., Kessler, S. H., Massoli, P., Hildebrandt Ruiz, L., Fortner, E., Williams, L. R., Wilson, K. R., Surratt, J. D., Donahue, N. M., Jayne, J. T., and Worsnop, D. R.: Elemental ratio measurements of organic compounds using aerosol mass spectrometry: characterization, improved calibration, and implications, Atmos. Chem. Phys., 15, 253–272, https://doi.org/10.5194/acp-15-253-2015, 2015.
Capes, G., Johnson, B., McFiggans, G., Williams, P. I., Haywood, J., and Coe, H.: Aging of biomass burning aerosols over West Africa: Aircraft measurements of chemical composition, microphysical properties, and emission ratios, J. Geophys. Res.-Atmos., 113, D00C15, https://doi.org/10.1029/2008jd009845, 2008.
Ceburnis, D., Garbaras, A., Szidat, S., Rinaldi, M., Fahrni, S., Perron, N., Wacker, L., Leinert, S., Remeikis, V., Facchini, M. C., Prevot, A. S. H., Jennings, S. G., Ramonet, M., and O'Dowd, C. D.: Quantification of the carbonaceous matter origin in submicron marine aerosol by 13C and 14C isotope analysis, Atmos. Chem. Phys., 11, 8593–8606, https://doi.org/10.5194/acp-11-8593-2011, 2011.
Chang, R. Y.-W., Leck, C., Graus, M., Müller, M., Paatero, J., Burkhart, J. F., Stohl, A., Orr, L. H., Hayden, K., Li, S.-M., Hansel, A., Tjernström, M., Leaitch, W. R., and Abbatt, J. P. D.: Aerosol composition and sources in the central Arctic Ocean during ASCOS, Atmos. Chem. Phys., 11, 10619–10636, https://doi.org/10.5194/acp-11-10619-2011, 2011.
Charlson, R. J., Lovelock, J. E., Andreae, M. O., and Warren, S. G.: Oceanic phytoplankton, atmospheric sulphur, cloud albedo and climate, Nature, 326, 655–661, 1987.
Choi, Y., Rhee, T. S., Collett, J. L., Park, T., Park, S.-M., Seo, B.-K., Park, G., Park, K., and Lee, T.: Aerosol concentrations and composition in the North Pacific marine boundary layer, Atmos. Environ., 171, 165–172, https://doi.org/10.1016/j.atmosenv.2017.09.047, 2017.
Claeys, M., Wang, W., Vermeylen, R., Kourtchev, I., Chi, X. G., Farhat, Y., Surratt, J. D., Gomez-Gonzalez, Y., Sciare, J., and Maenhaut, W.: Chemical characterisation of marine aerosol at Amsterdam Island during the austral summer of 2006–2007, J. Aerosol Sci., 41, 13–22, 2010.
Coggon, M. M., Sorooshian, A., Wang, Z., Metcalf, A. R., Frossard, A. A., Lin, J. J., Craven, J. S., Nenes, A., Jonsson, H. H., Russell, L. M., Flagan, R. C., and Seinfeld, J. H.: Ship impacts on the marine atmosphere: insights into the contribution of shipping emissions to the properties of marine aerosol and clouds, Atmos. Chem. Phys., 12, 8439–8458, https://doi.org/10.5194/acp-12-8439-2012, 2012.
Crippa, M., El Haddad, I., Slowik, J. G., DeCarlo, P. F., Mohr, C., Heringa, M. F., Chirico, R., Marchand, N., Sciare, J., Baltensperger, U., and Prévôt, A. S. H.: Identification of marine and continental aerosol sources in Paris using high resolution aerosol mass spectrometry, J. Geophys. Res.-Atmos., 118, 1950–1963, https://doi.org/10.1002/jgrd.50151, 2013.
Cubison, M. J., Ortega, A. M., Hayes, P. L., Farmer, D. K., Day, D., Lechner, M. J., Brune, W. H., Apel, E., Diskin, G. S., Fisher, J. A., Fuelberg, H. E., Hecobian, A., Knapp, D. J., Mikoviny, T., Riemer, D., Sachse, G. W., Sessions, W., Weber, R. J., Weinheimer, A. J., Wisthaler, A., and Jimenez, J. L.: Effects of aging on organic aerosol from open biomass burning smoke in aircraft and laboratory studies, Atmos. Chem. Phys., 11, 12049–12064, https://doi.org/10.5194/acp-11-12049-2011, 2011.
Dall'Osto, M., Ceburnis, D., Martucci, G., Bialek, J., Dupuy, R., Jennings, S. G., Berresheim, H., Wenger, J., Healy, R., Facchini, M. C., Rinaldi, M., Giulianelli, L., Finessi, E., Worsnop, D., Ehn, M., Mikkilä, J., Kulmala, M., and O'Dowd, C. D.: Aerosol properties associated with air masses arriving into the North East Atlantic during the 2008 Mace Head EUCAARI intensive observing period: an overview, Atmos. Chem. Phys., 10, 8413–8435, https://doi.org/10.5194/acp-10-8413-2010, 2010.
Dall'Osto, M., Ceburnis, D., Monahan, C., Worsnop, D. R., Bialek, J., Kulmala, M., Kurtén, T., Ehn, M., Wenger, J., Sodeau, J., Healy, R., and O'Dowd, C.: Nitrogenated and aliphatic organic vapors as possible drivers for marine secondary organic aerosol growth, J. Geophys. Res.-Atmos., 117, D12311, https://doi.org/10.1029/2012jd017522, 2012.
DeCarlo, P. F., Kimmel, J. R., Trimborn, A., Northway, M. J., Jayne, J. T., Aiken, A. C., Gonin, M., Fuhrer, K., Horvath, T., Docherty, K. S., Worsnop, D. R., and Jimenez, J. L.: Field-Deployable, High-Resolution, Time-of-Flight Aerosol Mass Spectrometer, Anal. Chem., 78, 8281–8289, https://doi.org/10.1021/ac061249n, 2006.
DeCarlo, P. F., Ulbrich, I. M., Crounse, J., de Foy, B., Dunlea, E. J., Aiken, A. C., Knapp, D., Weinheimer, A. J., Campos, T., Wennberg, P. O., and Jimenez, J. L.: Investigation of the sources and processing of organic aerosol over the Central Mexican Plateau from aircraft measurements during MILAGRO, Atmos. Chem. Phys., 10, 5257–5280, https://doi.org/10.5194/acp-10-5257-2010, 2010.
Decesari, S., Finessi, E., Rinaldi, M., Paglione, M., Fuzzi, S., Stephanou, E. G., Tziaras, T., Spyros, A., Ceburnis, D., O'Dowd, C., Dall'Osto, M., Harrison, R. M., Allan, J., Coe, H., and Facchini, M. C.: Primary and secondary marine organic aerosols over the North Atlantic Ocean during the MAP experiment, J. Geophys. Res.-Atmos., 116, D22210, https://doi.org/10.1029/2011jd016204, 2011.
Facchini, M. C., Decesari, S., Rinaldi, M., Carbone, C., Finessi, E., Mircea, M., Fuzzi, S., Moretti, F., Tagliavini, E., Ceburnis, D., and O'Dowd, C. D.: Important Source of Marine Secondary Organic Aerosol from Biogenic Amines, Environ. Sci. Technol., 42, 9116–9121, 2008.
Frossard, A. A., Russell, L. M., Burrows, S. M., Elliott, S. M., Bates, T. S., and Quinn, P. K.: Sources and composition of submicron organic mass in marine aerosol particles, J. Geophys. Res.-Atmos., 119, 2014JD021913, https://doi.org/10.1002/2014jd021913, 2014.
Fu, P., Kawamura, K., and Miura, K.: Molecular characterization of marine organic aerosols collected during a round-the-world cruise, J. Geophys. Res.-Atmos., 116, D13302, https://doi.org/10.1029/2011jd015604, 2011.
Gantt, B., Meskhidze, N., Facchini, M. C., Rinaldi, M., Ceburnis, D., and O'Dowd, C. D.: Wind speed dependent size-resolved parameterization for the organic mass fraction of sea spray aerosol, Atmos. Chem. Phys., 11, 8777–8790, https://doi.org/10.5194/acp-11-8777-2011, 2011.
Ge, X., Wexler, A. S., and Clegg, S. L.: Atmospheric amines – Part I. A review, Atmos. Environ., 45, 524–546, https://doi.org/10.1016/j.atmosenv.2010.10.012, 2011.
Gibb, S. W., Mantoura, R. F. C., and Liss, P. S.: Ocean-atmosphere exchange and atmospheric speciation of ammonia and methylamines in the region of the NW Arabian Sea, Global Biogeochem. Cy., 13, 161–178, https://doi.org/10.1029/98gb00743, 1999.
Gondwe, M., Krol, M., Gieskes, W., Klaassen, W., and de Baar, H.: The contribution of ocean-leaving DMS to the global atmospheric burdens of DMS, MSA, SO2, and NSS , Global Biogeochem. Cy., 17, 1056, https://doi.org/10.1029/2002gb001937, 2003.
Grieshop, A. P., Donahue, N. M., and Robinson, A. L.: Laboratory investigation of photochemical oxidation of organic aerosol from wood fires 2: analysis of aerosol mass spectrometer data, Atmos. Chem. Phys., 9, 2227–2240, https://doi.org/10.5194/acp-9-2227-2009, 2009.
Hawkins, L. N., and Russell, L. M.: Polysaccharides, Proteins, and Phytoplankton Fragments: Four Chemically Distinct Types of Marine Primary Organic Aerosol Classified by Single Particle Spectromicroscopy, Adv. Meteorol., 2010, 612132, https://doi.org/10.1155/2010/612132, 2010.
Henning, S., Dieckmann, K., Ignatius, K., Schäfer, M., Zedler, P., Harris, E., Sinha, B., van Pinxteren, D., Mertes, S., Birmili, W., Merkel, M., Wu, Z., Wiedensohler, A., Wex, H., Herrmann, H., and Stratmann, F.: Influence of cloud processing on CCN activation behaviour in the Thuringian Forest, Germany during HCCT-2010, Atmos. Chem. Phys., 14, 7859–7868, https://doi.org/10.5194/acp-14-7859-2014, 2014.
Hertel, O., Christensen, J., and Hov, Ø.: Modelling of the end products of the chemical decomposition of DMS in the marine boundary layer, Atmos. Environ., 28, 2431–2449, 1994.
Hoffmann, E. H., Tilgner, A., Schrödner, R., Bräuer, P., Wolke, R., and Herrmann, H.: An advanced modeling study on the impacts and atmospheric implications of multiphase dimethyl sulfide chemistry, P. Natl. Acad. Sci. USA, 113, 11776–11781, https://doi.org/10.1073/pnas.1606320113, 2016.
Huang, S., Poulain, L., van Pinxteren, D., van Pinxteren, M., Wu, Z., Herrmann, H., and Wiedensohler, A.: Latitudinal and Seasonal Distribution of Particulate MSA over the Atlantic using a Validated Quantification Method with HR-ToF-AMS, Environ. Sci. Technol., 51, 418–426, https://doi.org/10.1021/acs.est.6b03186, 2017.
Iinuma, Y., Müller, C., Böge, O., Gnauk, T., and Herrmann, H.: The formation of organic sulfate esters in the limonene ozonolysis secondary organic aerosol (SOA) under acidic conditions, Atmos. Environ., 41, 5571–5583, https://doi.org/10.1016/j.atmosenv.2007.03.007, 2007.
Iinuma, Y., Böge, O., Gräfe, R., and Herrmann, H.: Methyl-Nitrocatechols: Atmospheric Tracer Compounds for Biomass Burning Secondary Organic Aerosols, Environ. Sci. Technol., 44, 8453–8459, https://doi.org/10.1021/es102938a, 2010.
Ikeda, T.: Respiration and ammonia excretion by marine metazooplankton taxa: synthesis toward a global-bathymetric model, Mar. Biol., 161, 2753–2766, https://doi.org/10.1007/s00227-014-2540-5, 2014.
Jimenez, J. L., Jayne, J. T., Shi, Q., Kolb, C. E., Worsnop, D. R., Yourshaw, I., Seinfeld, J. H., Flagan, R. C., Zhang, X., Smith, K. A., Morris, J. W., and Davidovits, P.: Ambient aerosol sampling using the Aerodyne Aerosol Mass Spectrometer, J. Geophys. Res.-Atmos., 108, 8425, https://doi.org/10.1029/2001jd001213, 2003.
Jimenez-Group: Aerosol Mass Spectrometer Web Mass Spectral Database, High-Resolution AMS Spectra, available at: http://cires1.colorado.edu/jimenez-group/HRAMSsd/ (last access: 12 November, 2018), unit mass resolution spectra, available at: http://cires1.colorado.edu/jimenez-group/AMSsd/ (last access: 12 November, 2018), University of Colorado, Boulder, 2018.
Kanakidou, M., Duce, R. A., Prospero, J. M., Baker, A. R., Benitez-Nelson, C., Dentener, F. J., Hunter, K. A., Liss, P. S., Mahowald, N., Okin, G. S., Sarin, M., Tsigaridis, K., Uematsu, M., Zamora, L. M., and Zhu, T.: Atmospheric fluxes of organic N and P to the global ocean, Global Biogeochem. Cy., 26, GB3026, https://doi.org/10.1029/2011gb004277, 2012.
Kloster, S., Feichter, J., Maier-Reimer, E., Six, K. D., Stier, P., and Wetzel, P.: DMS cycle in the marine ocean-atmosphere system – a global model study, Biogeosciences, 3, 29–51, https://doi.org/10.5194/bg-3-29-2006, 2006.
Kuznetsova, M., Lee, C., and Aller, J.: Characterization of the proteinaceous matter in marine aerosols, Mar. Chem., 96, 359–377, https://doi.org/10.1016/j.marchem.2005.03.007, 2005.
Middlebrook, A. M., Bahreini, R., Jimenez, J. L., and Canagaratna, M. R.: Evaluation of Composition-Dependent Collection Efficiencies for the Aerodyne Aerosol Mass Spectrometer using Field Data, Aerosol Sci. Tech., 46, 258–271, https://doi.org/10.1080/02786826.2011.620041, 2012.
Miyazaki, Y., Kawamura, K., Jung, J., Furutani, H., and Uematsu, M.: Latitudinal distributions of organic nitrogen and organic carbon in marine aerosols over the western North Pacific, Atmos. Chem. Phys., 11, 3037–3049, https://doi.org/10.5194/acp-11-3037-2011, 2011.
Müller, C., Iinuma, Y., Karstensen, J., van Pinxteren, D., Lehmann, S., Gnauk, T., and Herrmann, H.: Seasonal variation of aliphatic amines in marine sub-micrometer particles at the Cape Verde islands, Atmos. Chem. Phys., 9, 9587–9597, https://doi.org/10.5194/acp-9-9587-2009, 2009.
Müller, T., Henzing, J. S., de Leeuw, G., Wiedensohler, A., Alastuey, A., Angelov, H., Bizjak, M., Collaud Coen, M., Engström, J. E., Gruening, C., Hillamo, R., Hoffer, A., Imre, K., Ivanow, P., Jennings, G., Sun, J. Y., Kalivitis, N., Karlsson, H., Komppula, M., Laj, P., Li, S.-M., Lunder, C., Marinoni, A., Martins dos Santos, S., Moerman, M., Nowak, A., Ogren, J. A., Petzold, A., Pichon, J. M., Rodriquez, S., Sharma, S., Sheridan, P. J., Teinilä, K., Tuch, T., Viana, M., Virkkula, A., Weingartner, E., Wilhelm, R., and Wang, Y. Q.: Characterization and intercomparison of aerosol absorption photometers: result of two intercomparison workshops, Atmos. Meas. Tech., 4, 245–268, https://doi.org/10.5194/amt-4-245-2011, 2011.
Nelson, G., and Hutchings, L.: The Benguela upwelling area, Prog. Oceanogr., 12, 333–356, https://doi.org/10.1016/0079-6611(83)90013-7, 1983.
Ng, N. L., Canagaratna, M. R., Jimenez, J. L., Zhang, Q., Ulbrich, I. M., and Worsnop, D. R.: Real-Time Methods for Estimating Organic Component Mass Concentrations from Aerosol Mass Spectrometer Data, Environ. Sci. Technol., 45, 910–916, https://doi.org/10.1021/es102951k, 2011.
O'Dowd, C. D. and De Leeuw, G.: Marine aerosol production: a review of the current knowledge, Philos. T. R. Soc. A, 365, 1753–1774, 2007.
O'Dowd, C., Ceburnis, D., Ovadnevaite, J., Vaishya, A., Rinaldi, M., and Facchini, M. C.: Do anthropogenic, continental or coastal aerosol sources impact on a marine aerosol signature at Mace Head?, Atmos. Chem. Phys., 14, 10687–10704, https://doi.org/10.5194/acp-14-10687-2014, 2014.
O'Dowd, C. D., Facchini, M. C., Cavalli, F., Ceburnis, D., Mircea, M., Decesari, S., Fuzzi, S., Yoon, Y. J., and Putaud, J. P.: Biogenically driven organic contribution to marine aerosol, Nature, 431, 676–680, 2004.
Ovadnevaite, J., O'Dowd, C., Dall'Osto, M., Ceburnis, D., Worsnop, D. R., and Berresheim, H.: Detecting high contributions of primary organic matter to marine aerosol: A case study, Geophys. Res. Lett., 38, L02807, https://doi.org/10.1029/2010GL046083, 2011.
Ovadnevaite, J., Ceburnis, D., Canagaratna, M., Berresheim, H., Bialek, J., Martucci, G., Worsnop, D. R., and O'Dowd, C.: On the effect of wind speed on submicron sea salt mass concentrations and source fluxes, J. Geophys. Res., 117, D16201, https://doi.org/10.1029/2011jd017379, 2012.
Ovadnevaite, J., Ceburnis, D., Leinert, S., Dall'Osto, M., Canagaratna, M., O'Doherty, S., Berresheim, H., and O'Dowd, C.: Submicron NE Atlantic marine aerosol chemical composition and abundance: Seasonal trends and air mass categorization, J. Geophys. Res.-Atmos., 119, 2013JD021330, https://doi.org/10.1002/2013jd021330, 2014.
Paatero, P.: Least squares formulation of robust non-negative factor analysis, Chemometr. Intell. Lab., 37, 23–35, https://doi.org/10.1016/S0169-7439(96)00044-5, 1997.
Paatero, P. and Tapper, U.: Positive matrix factorization: A non-negative factor model with optimal utilization of error estimates of data values, Environmetrics, 5, 111–126, https://doi.org/10.1002/env.3170050203, 1994.
Poulain, L., Iinuma, Y., Müller, K., Birmili, W., Weinhold, K., Brüggemann, E., Gnauk, T., Hausmann, A., Löschau, G., Wiedensohler, A., and Herrmann, H.: Diurnal variations of ambient particulate wood burning emissions and their contribution to the concentration of Polycyclic Aromatic Hydrocarbons (PAHs) in Seiffen, Germany, Atmos. Chem. Phys., 11, 12697–12713, https://doi.org/10.5194/acp-11-12697-2011, 2011a.
Poulain, L., Spindler, G., Birmili, W., Plass-Dülmer, C., Wiedensohler, A., and Herrmann, H.: Seasonal and diurnal variations of particulate nitrate and organic matter at the IfT research station Melpitz, Atmos. Chem. Phys., 11, 12579–12599, https://doi.org/10.5194/acp-11-12579-2011, 2011b.
Poulain, L., Birmili, W., Canonaco, F., Crippa, M., Wu, Z. J., Nordmann, S., Spindler, G., Prévôt, A. S. H., Wiedensohler, A., and Herrmann, H.: Chemical mass balance of 300 ∘C non-volatile particles at the tropospheric research site Melpitz, Germany, Atmos. Chem. Phys., 14, 10145–10162, https://doi.org/10.5194/acp-14-10145-2014, 2014.
Quinn, P. K. and Bates, T. S.: The case against climate regulation via oceanic phytoplankton sulphur emissions, Nature, 480, 51–56, 2011.
Quinn, P. K., Collins, D. B., Grassian, V. H., Prather, K. A., and Bates, T. S.: Chemistry and Related Properties of Freshly Emitted Sea Spray Aerosol, Chem. Rev., 115, 4383–4399, https://doi.org/10.1021/cr500713g, 2015.
Roberts, G., Wooster, M. J., and Lagoudakis, E.: Annual and diurnal african biomass burning temporal dynamics, Biogeosciences, 6, 849–866, https://doi.org/10.5194/bg-6-849-2009, 2009.
Russell, L. M., Takahama, S., Liu, S., Hawkins, L. N., Covert, D. S., Quinn, P. K., and Bates, T. S.: Oxygenated fraction and mass of organic aerosol from direct emission and atmospheric processing measured on the R/V Ronald Brown during TEXAQS/GoMACCS 2006, J. Geophys. Res.-Atmos., 114, D00F05, https://doi.org/10.1029/2008jd011275, 2009.
Russell, L. M., Hawkins, L. N., Frossard, A. A., Quinn, P. K., and Bates, T. S.: Carbohydrate-like composition of submicron atmospheric particles and their production from ocean bubble bursting, P. Natl. Acad. Sci. USA, 107, 6652–6657, https://doi.org/10.1073/pnas.0908905107, 2010.
Sage, A. M., Weitkamp, E. A., Robinson, A. L., and Donahue, N. M.: Evolving mass spectra of the oxidized component of organic aerosol: results from aerosol mass spectrometer analyses of aged diesel emissions, Atmos. Chem. Phys., 8, 1139–1152, https://doi.org/10.5194/acp-8-1139-2008, 2008.
Saltzman, E. S.: Surface Ocean – Lower Atmosphere Processes, American Geophysical Union, Washington, 2009.
Schmale, J., Schneider, J., Nemitz, E., Tang, Y. S., Dragosits, U., Blackall, T. D., Trathan, P. N., Phillips, G. J., Sutton, M., and Braban, C. F.: Sub-Antarctic marine aerosol: dominant contributions from biogenic sources, Atmos. Chem. Phys., 13, 8669–8694, https://doi.org/10.5194/acp-13-8669-2013, 2013.
Schmitt-Kopplin, P., Liger-Belair, G., Koch, B. P., Flerus, R., Kattner, G., Harir, M., Kanawati, B., Lucio, M., Tziotis, D., Hertkorn, N., and Gebefügi, I.: Dissolved organic matter in sea spray: a transfer study from marine surface water to aerosols, Biogeosciences, 9, 1571–1582, https://doi.org/10.5194/bg-9-1571-2012, 2012.
Schneider, J., Freutel, F., Zorn, S. R., Chen, Q., Farmer, D. K., Jimenez, J. L., Martin, S. T., Artaxo, P., Wiedensohler, A., and Borrmann, S.: Mass-spectrometric identification of primary biological particle markers and application to pristine submicron aerosol measurements in Amazonia, Atmos. Chem. Phys., 11, 11415–11429, https://doi.org/10.5194/acp-11-11415-2011, 2011.
Shaw, S. L., Gantt, B., and Meskhidze, N.: Production and Emissions of Marine Isoprene and Monoterpenes: A Review, Adv. Meteorol., 2010, 408696, https://doi.org/10.1155/2010/408696, 2010.
Hatakeyama, S., Izumi, K., and Akimoto, H.: Yield of SO2 and formation of aerosol in the photo-oxidation of DMS under atmospheric conditions, Atmos. Environ., 19, 135–141, https://doi.org/10.1016/0004-6981(85)90144-1, 1985.
Simpson, R. M. C., Howell, S. G., Blomquist, B. W., Clarke, A. D., and Huebert, B. J.: Dimethyl sulfide: Less important than long-range transport as a source of sulfate to the remote tropical Pacific marine boundary layer, J. Geophys. Res.-Atmos., 119, 9142–9167, https://doi.org/10.1002/2014jd021643, 2014.
Sun, Y.-L., Zhang, Q., Schwab, J. J., Demerjian, K. L., Chen, W.-N., Bae, M.-S., Hung, H.-M., Hogrefe, O., Frank, B., Rattigan, O. V., and Lin, Y.-C.: Characterization of the sources and processes of organic and inorganic aerosols in New York city with a high-resolution time-of-flight aerosol mass apectrometer, Atmos. Chem. Phys., 11, 1581–1602, https://doi.org/10.5194/acp-11-1581-2011, 2011.
Surratt, J. D., Kroll, J. H., Kleindienst, T. E., Edney, E. O., Claeys, M., Sorooshian, A., Ng, N. L., Offenberg, J. H., Lewandowski, M., Jaoui, M., Flagan, R. C., and Seinfeld, J. H.: Evidence for Organosulfates in Secondary Organic Aerosol, Environ. Sci. Technol., 41, 517–527, https://doi.org/10.1021/es062081q, 2007.
Surratt, J. D., Gómez-González, Y., Chan, A. W. H., Vermeylen, R., Shahgholi, M., Kleindienst, T. E., Edney, E. O., Offenberg, J. H., Lewandowski, M., Jaoui, M., Maenhaut, W., Claeys, M., Flagan, R. C., and Seinfeld, J. H.: Organosulfate Formation in Biogenic Secondary Organic Aerosol, J. Phys. Chem. A, 112, 8345–8378, https://doi.org/10.1021/jp802310p, 2008.
Twohy, C. H., and Anderson, J. R.: Droplet nuclei in non-precipitating clouds: composition and size matter, Environ. Res. Lett., 3, 045002, https://doi.org/10.1088/1748-9326/3/4/045002, 2008.
Ulbrich, I. M., Canagaratna, M. R., Zhang, Q., Worsnop, D. R., and Jimenez, J. L.: Interpretation of organic components from Positive Matrix Factorization of aerosol mass spectrometric data, Atmos. Chem. Phys., 9, 2891–2918, https://doi.org/10.5194/acp-9-2891-2009, 2009.
van Pinxteren, M., Barthel, S., Fomba, K. W., Müller, K., von Tümpling, W., and Herrmann, H.: The influence of environmental drivers on the enrichment of organic carbon in the sea surface microlayer and in submicron aerosol particles – measurements from the Atlantic Ocean, Elem. Sci. Anth., 5, 35, https://doi.org/10.1525/elementa.225, 2017.
von Glasow, R. and Crutzen, P. J.: Model study of multiphase DMS oxidation with a focus on halogens, Atmos. Chem. Phys., 4, 589–608, https://doi.org/10.5194/acp-4-589-2004, 2004.
Wiedensohler, A., Birmili, W., Nowak, A., Sonntag, A., Weinhold, K., Merkel, M., Wehner, B., Tuch, T., Pfeifer, S., Fiebig, M., Fjäraa, A. M., Asmi, E., Sellegri, K., Depuy, R., Venzac, H., Villani, P., Laj, P., Aalto, P., Ogren, J. A., Swietlicki, E., Williams, P., Roldin, P., Quincey, P., Hüglin, C., Fierz-Schmidhauser, R., Gysel, M., Weingartner, E., Riccobono, F., Santos, S., Grüning, C., Faloon, K., Beddows, D., Harrison, R., Monahan, C., Jennings, S. G., O'Dowd, C. D., Marinoni, A., Horn, H.-G., Keck, L., Jiang, J., Scheckman, J., McMurry, P. H., Deng, Z., Zhao, C. S., Moerman, M., Henzing, B., de Leeuw, G., Löschau, G., and Bastian, S.: Mobility particle size spectrometers: harmonization of technical standards and data structure to facilitate high quality long-term observations of atmospheric particle number size distributions, Atmos. Meas. Tech., 5, 657–685, https://doi.org/10.5194/amt-5-657-2012, 2012.
Wu, Z. J., Nowak, A., Poulain, L., Herrmann, H., and Wiedensohler, A.: Hygroscopic behavior of atmospherically relevant water-soluble carboxylic salts and their influence on the water uptake of ammonium sulfate, Atmos. Chem. Phys., 11, 12617–12626, https://doi.org/10.5194/acp-11-12617-2011, 2011.
Yassaa, N., Peeken, I., Zöllner, E., Bluhm, K., Arnold, S., Spracklen, D., and Williams, J.: Evidence for marine production of monoterpenes, Environ. Chem., 5, 391–401, https://doi.org/10.1071/EN08047, 2008.