the Creative Commons Attribution 4.0 License.
the Creative Commons Attribution 4.0 License.
 | 30 Oct 2018
Source apportionment of fine particulate matter in Houston, Texas: insights to secondary organic aerosols
Ibrahim M. Al-Naiema
Anusha P. S. Hettiyadura
Henry W. Wallace
Nancy P. Sanchez
Carter J. Madler
Basak Karakurt Cevik
Alexander A. T. Bui
Josh Kettler
Robert J. Griffin
Elizabeth A. Stone
Online and offline measurements of ambient particulate matter (PM) near the urban and industrial Houston Ship Channel in Houston, Texas, USA, during May 2015 were utilized to characterize its chemical composition and to evaluate the relative contributions of primary, secondary, biogenic, and anthropogenic sources. Aerosol mass spectrometry (AMS) on nonrefractory PM1 (PM ≤ 1 µm) indicated major contributions from sulfate (averaging 50 % by mass), organic aerosol (OA, 40 %), and ammonium (14 %). Positive matrix factorization (PMF) of AMS data categorized OA on average as 22 % hydrocarbon-like organic aerosol (HOA), 29 % cooking-influenced less-oxidized oxygenated organic aerosol (CI-LO-OOA), and 48 % more-oxidized oxygenated organic aerosol (MO-OOA), with the latter two sources indicative of secondary organic aerosol (SOA). Chemical analysis of PM2.5 (PM ≤ 2.5 µm) filter samples agreed that organic matter (35 %) and sulfate (21 %) were the most abundant components. Organic speciation of PM2.5 organic carbon (OC) focused on molecular markers of primary sources and SOA tracers derived from biogenic and anthropogenic volatile organic compounds (VOCs). The sources of PM2.5 OC were estimated using molecular marker-based positive matric factorization (MM-PMF) and chemical mass balance (CMB) models. MM-PMF resolved nine factors that were identified as diesel engines (11.5 %), gasoline engines (24.3 %), nontailpipe vehicle emissions (11.1 %), ship emissions (2.2 %), cooking (1.0 %), biomass burning (BB, 10.6 %), isoprene SOA (11.0 %), high-NOx anthropogenic SOA (6.6 %), and low-NOx anthropogenic SOA (21.7 %). Using available source profiles, CMB apportioned 41 % of OC to primary fossil sources (gasoline engines, diesel engines, and ship emissions), 5 % to BB, 15 % to SOA (including 7.4 % biogenic and 7.6 % anthropogenic), and 39 % to other sources that were not included in the model and are expected to be secondary.
This study presents the first application of in situ AMS-PMF, MM-PMF, and CMB for OC source apportionment and the integration of these methods to evaluate the relative roles of biogenic, anthropogenic, and BB-SOA. The three source apportionment models agreed that ∼ 50 % of OC is associated with primary emissions from fossil fuel use, particularly motor vehicles. Differences among the models reflect their ability to resolve sources based upon the input chemical measurements, with molecular marker-based methods providing greater source specificity and resolution for minor sources. By combining results from MM-PMF and CMB, BB was estimated to contribute 11 % of OC, with 5 % primary emissions and 6 % BB-SOA. SOA was dominantly anthropogenic (28 %) rather than biogenic (11 %) or BB-derived. The three-model approach demonstrates significant contributions of anthropogenic SOA to fine PM. More broadly, the findings and methodologies presented herein can be used to advance local and regional understanding of anthropogenic contributions to SOA.
- Article
(10841 KB) - Full-text XML
-
Supplement
(1177 KB) - BibTeX
- EndNote


Organic aerosol (OA) comprises a significant fraction of atmospheric particulate matter (PM) in urban environments (Aiken et al., 2009; Cao et al., 2004; Fraser et al., 2002). Secondary organic aerosol (SOA), formed in the atmosphere through the chemical transformation of volatile organic compounds (VOCs), is a major source of organic aerosol mass (Kroll and Seinfeld, 2008; Henze et al., 2008). Current knowledge of the precursors, mechanisms of formation, and properties of SOA is incomplete, leaving major gaps in understanding of exactly how, and to what extent, SOA affects air quality and climate (Foley et al., 2010). In particular, the roles of natural and anthropogenic precursors to SOA are highly uncertain and variable: results of some published studies indicate dominance (>90 %) of biogenic precursors like isoprene (Hallquist et al., 2009), while others studies highlight the importance of anthropogenic VOCs (>30 %), such as benzene and toluene (Volkamer et al., 2006; Henze et al., 2008). In this study, a measurement-based approach is taken to evaluate the relative contributions of biogenic and anthropogenic VOCs to SOA, and their role in relation to primary PM sources, in an urban location in Houston, TX.
Source estimation of SOA in the atmosphere is challenging due to the complexity of its precursors and the chemical reactions that form it (Hallquist et al., 2009). Model predictions of SOA rely on knowledge of VOC abundance, product volatility, and SOA yields from chamber studies (Seinfeld and Pankow, 2003; Chan et al., 2009; Donahue et al., 2006). Predictions undergo continuous improvement as knowledge of SOA precursors and formation pathways evolves (Robinson et al., 2007; Ng et al., 2007). Measurement-based approaches can be used to provide ground-truthing for model predictions.
The SOA tracer method estimates SOA contributions to ambient organic carbon (OC) or organic aerosol (OA) through measurements of SOA tracers from VOCs (i.e., isoprene, α-pinene, toluene, or naphthalene) using the tracer-to-SOA mass fraction obtained from laboratory chamber experiments (Kleindienst et al., 2007; Kleindienst et al., 2012). This approach is useful in identifying and estimating SOA contributions from SOA precursors at receptor sites and can be used in combination with other organic molecular markers in the source apportionment of OC (Lewandowski et al., 2008). The SOA-tracer method, however, is limited to a handful of VOC precursors and should be further expanded to represent the broader diversity of VOC precursors to SOA.
Receptor models are widely applied for the source apportionment of ambient PM (Belis et al., 2013) and provide valuable information to support air quality management (Hopke, 2016). Among these models, molecular marker-based chemical mass balance (CMB) modeling apportions PM or OC measured at the receptor based on least-squares solution to the linear combination of source profiles and their relative contributions to fit ambient measurements (Watson et al., 1984). Accurate solutions for CMB apportionment largely depend on the representativeness of the profiles to the receptor site. CMB has been successful in apportioning the carbonaceous PM to primary sources for which profiles are available (Lough et al., 2007; Schauer et al., 2002; Simoneit et al., 1999; Rogge et al., 1998). However, the CMB model is often unable to apportion OC for which sources are unknown or not well defined (Stone et al., 2009; Sheesley et al., 2017). Even with the incorporation of SOA tracers into CMB modeling (following the previously described SOA-tracer method), a significant fraction of OC remains unapportioned, suggesting that better representation of SOA is needed in this model (Stone et al., 2009). Molecular marker-based positive matrix factorization (MM-PMF) does not require source profiles and instead decomposes ambient measurements into factors and factor contributions that need to be interpreted in order to identify the source types, based on the knowledge of source signatures (EPA-PMF, 2014). This approach has been particularly useful in the elucidation of SOA contributions to ambient PM, by providing insight into the precursors and pathways by which they form (Hettiyadura et al., 2018; Srivastava et al., 2018a, b; Wang et al., 2017). While PMF requires a relatively large sample size, MM-PMF has generated stable solutions with as little as 35 observational data points, which is expected to arise from the high specificity of primary and secondary source tracers (Hu et al., 2010). Studies that have compared CMB and MM-PMF results generally show agreement in their estimation for the primary sources, but systematically give higher MM-PMF source estimates than CMB (Shrivastava et al., 2007; Jaeckels et al., 2007).
In recent years, aerosol mass spectrometry (AMS) has been widely used to characterize the OA of nonrefractory submicron PM (NR-PM1) and is related to source types using AMS-PMF (Paatero and Tapper, 1994; Ulbrich et al., 2009). This approach overcomes the complexity and challenges associated with the quantification of the organic species in atmospheric matrixes (Seinfeld and Pankow, 2003; Goldstein and Galbally, 2007) and apportions OA into factors based on their mass fragmentation fingerprints (Zhang et al., 2011). The high time-resolution of AMS enables the identification of diurnal source variations. However, ambiguity can arise in apportioning sources with similar mass fragmentation fingerprints such as cooking and vehicular emissions (Mohr et al., 2009) and with specifying contributing sources.
Houston, TX, an industrial coastal city, experiences elevated traffic-related air pollution and VOC emissions from petroleum facilities (Zhang et al., 2017; Buzcu and Fraser, 2006). The urban and industrial areas near the Houston Ship Channel (HSC) have been the subject of source apportionment of VOCs (Xie and Berkowitz, 2006; Buzcu and Fraser, 2006; Dechapanya et al., 2004) and PM. Sullivan et al. (2013) apportioned PM2.5 using metals data from 2005 to 2012 with PMF near the HSC and reported major contributions from secondary inorganic sources (33.9 % ammonium sulfate and 4.2 % ammonium nitrate), followed by vehicles (17.5 % light duty and 4.8 % heavy duty) and crustal elements (11.9 % calcium sulfate and 6.3 % crustal elements), with minor contributions from fires, sea salt, and oil combustion. Using molecular marker-based CMB, Fraser et al. (2003) apportioned PM2.5 to vehicle emissions (30 % from gasoline and diesel), road dust (11 %), fuel oil combustion (7 %), meat cooking (6 %), wood combustion (2 %), and vegetative detritus (2 %). Also using molecular-marker based CMB, Buzcu et al. (2006) apportioned 49 % of PM2.5 OC near HSC, predominantly to vehicle emissions (36 % of OC). Applications of AMS-PMF near the HSC suggested that secondary sources contribute 55–68 % of OA, but did not distinguish between biogenic and anthropogenic precursors (Cleveland et al., 2012; Wallace et al., 2018). These source apportionment studies indicate significant influences on PM from motor vehicles and secondary reactions but lack understanding of the precursors to SOA. Combining these apportionment techniques would be helpful to gain better insights about the composition of organic aerosol and provide more accurate source characterization.
In this work, we report a compositional analysis and source characterization of the PM2.5 and NR-PM1 near the HSC in May 2015. An Aerodyne high-resolution time-of-flight AMS (HR-ToF-AMS) provided NR-PM1 composition and elemental ratios. AMS-PMF was applied to further categorize PM1 OA. PM2.5 filter samples were collected on a day–night basis and were analyzed for OC, ionic species, organic molecular markers, and SOA tracers from biogenic and anthropogenic precursors. CMB and MM-PMF modeling were applied to apportion the primary and secondary sources of PM2.5 OC. The outcomes of these source apportionment models were compared and are discussed along with the meteorological data and real-time measurements of VOCs in order to gain a robust understanding for the sources, abundance, and variability of fine PM, particularly SOA, in HSC.
2.1 Site description
Fine PM was studied at the Clinton Drive monitoring site in Houston, TX (29.733943∘ N, 95.257684∘ W), which is maintained by the Texas Commission on Environmental Quality (TCEQ). Clinton Drive is located 11 km west of the city center and is adjacent to the HSC. The immediate surroundings include industrial facilities (e.g., oil refineries), heavily trafficked roadways, and several neighborhoods.
2.2 Colocated measurements
The Clinton Drive site provided access to colocated hourly measurements of VOCs that were measured using an automated gas chromatograph (GC), fine PM (PM2.5) measured by tapered element oscillating microbalance (TEOM), and meteorology. Quality-controlled data were collected and accessed through TCEQ (TCEQ, 2017).
2.3 High-resolution time-of-flight aerosol mass spectrometer (HR-ToF-AMS)
2.3.1 PM1 measurements
Real time measurements of NR-PM1 were taken with a HR-ToF-AMS (Aerodyne Research) for the period 13–29 May, 2015, at the Clinton Drive monitoring site, with a time resolution of 1 min. The HR-ToF-AMS has been described in detail previously (DeCarlo et al., 2006); the sampling protocol utilized in this study is identical to that described by Wallace et al. (2018).
2.3.2 Positive matrix factorization analysis of PM1 OA (AMS-PMF)
Source apportionment of the organic fraction of NR-PM1 was conducted using AMS-PMF (Paatero and Tapper, 1994). The PMF evaluation tool (PET v. 2.08D, Ulbrich et al., 2009) employing the PMF2 algorithm (Paatero, 2013) running in robust mode with model error set to 0 was used for analysis of the HR OA mass spectra ( to ). The HR OA concentration matrix and associated error matrix resulting from PIKA v 1.16H were used as input for AMS-PMF application. Prior to analysis, mass fragments with signal-to-noise ratio (SNR) below 0.2 were removed from the dataset, while ions with SNR between 0.2 and 2 were down weighted by a factor of 3, following Paatero and Hopke (2003). Similarly, a down-weighting factor of was applied to CO-related ions to prevent excessive influence of the m∕z 44 signal, as recommended by Ulbrich et al. (2009). AMS-PMF model solutions including from one to seven factors were fit using multiple initialization points in order to ensure convergence to global rather than local minima. Each set of AMS-PMF model output was evaluated based on the ratio of the summation of the scaled residuals (Q) to the expected value of (Q∕Qexpected) (Supplement; Table S1 and Figs. S1–S3), its convergence to a global minimum, and its ability to reproduce the OA mass concentrations measured during the field campaign. These parameters were examined and used as selection criteria for the number of factors in the final AMS-PMF model. Additionally, the physical meaningfulness of the retained factors in each model and their similarity with factors reported in previous OA studies employing HR-ToF-AMS were considered when selecting the number of AMS-PMF components. Based on these criteria, a model including three factors was found to be the most appropriate for describing the dataset under analysis. Further details on AMS-PMF application and the criteria for factor selection are presented in Figs. S1–S3.
2.4 Filter sample collection and offline chemical analysis
2.4.1 Filter sample collection
PM2.5 samples were collected using a medium-volume URG air sampler (3000B, URG Corp.) with a cyclone (URG) operating at a flow rate of 90 L min−1. Air flow rate was monitored before and after sampling using a rotameter (Gilmont Inst.). PM2.5 samples were collected on 90 mm quartz fiber filters (Pallflex® Tissuquartz™, Pall Life Sciences) that were pre-cleaned by baking for 18 h at 550 ∘C. Samples were collected for the period 5–27 May 2015 twice daily, during daytime (07:00–18:00 LT) and nighttime (19:00–06:00 LT). After sampling, filters were transferred to Petri dishes lined with pre-baked aluminum foil, sealed with Teflon tape, transported to the laboratory, and stored frozen at −20 ∘C until analysis. One field blank was collected for every five samples by loading a blank filter into the filter holder, pulling no air through it, and removing it from the filter holder.
2.4.2 Measurements of organic carbon, elemental carbon, and organic species
Organic carbon and elemental carbon (EC) were measured by thermal–optical analysis (Sunset Laboratory Inc.) on a 1 cm2 filter portion following Schauer et al. (2003). Filters were extracted into acetonitrile following the method described by Al-Naiema and Stone (2017). Briefly, isotopically labeled internal standards were added onto each filter. Then, filters were extracted sequentially with three 10 mL portions of acetonitrile (Optima, Fisher Chemical – Fisher Scientific) for 15 min by ultrasonication (Branson 5510, 60 sonics per minute). The combined extracts were reduced to 2 mL by rotary evaporation at 30 ∘C, 120 rpm, and 200 mbar (Heidolph, Hei-vap G1). Extracts were filtered with 0.25 µm PTFE syringe filters (Whatman) and stored frozen at −20 ∘C. Immediately prior to analysis, the extracts were evaporated to 100 µL under a gentle stream of ultrapure nitrogen at 30 ∘C. All glassware used in extraction was first baked (500 ∘C for 5 h) to remove organic contaminants and then silanized using 5 % solution of dichlorodimethylsilane (Fluka), prepared in toluene (Sigma-Aldrich). Organic species were analyzed using an Agilent 7890A GC coupled to a 5975C MS (Agilent Technologies). Polycyclic aromatic hydrocarbons (PAHs), n-alkanes, and hopanes were directly injected to the GC-MS equipped with a DB-5 column and electron impact (EI) ionization source (70 eV). The GC inlet temperature was 300 ∘C. An aliquot of the extract was trimethylsilylated with N,O-bis(trimethylsilyl)trifluoroacetamide and trimethylchlorosilane (BSTFA + TMCS, 99:1, Fluka Analytical 99 %). A 20 µL aliquot of the extract was dried under a gentle stream of nitrogen, 10 µL of the silylation agent was added, and the mixture was reacted at 100 ∘C for 90 min. Details about species quantification by GC-MS are provided elsewhere (Al-Naiema and Stone, 2017).
2.4.3 Ion analysis and pH estimation
Filters were extracted into ultrapure (UP) water (Barnstead EasyPure II) by shaking (125 rpm) for 10 min, sonication (60 sonics min−1) for 30 min, followed by shaking (125 rpm) for 10 min. Extracts were filtered with 0.45 µm syringe filters (PTFE, Whatman). Ions were analyzed by a Dionex ICS-5000 ion chromatograph (Dionex ASDV). Details regarding ion separation and quantification are described elsewhere (Jayarathne et al., 2016).
Ion results along with other meteorological data such as relative humidity and ambient temperature were introduced to the Extended Aerosol Inorganics (E-AIM IV) model (Friese and Ebel, 2010), available interactively from http://www.aim.env.uea.ac.uk/aim/model4/model4a.php (last access: 10 October 2018), to estimate aerosol pH. In this study, model input included the molar concentrations of sulfate, nitrate, chloride, ammonium, sodium, calcium, and magnesium; the pH was estimated by calculating the [H+] required to balance any cation deficiency.
2.5 Chemical mass balance (CMB) modeling
The contribution of different sources to the OC fraction was estimated using the EPA CMB receptor model (v8.2). CMB model employs source profiles to estimate source contributions to ambient PM by solving for the least-squares solution (Watson et al., 1984). In this study, the input source profiles included diesel engines and both smoker and nonsmoker gasoline engines (Lough et al., 2007); secondary organic carbon (SOC) from isoprene, α-pinene, and toluene (Kleindienst et al., 2007); bituminous coal (Oros and Simoneit, 2000); biomass burning (Lee et al., 2005); and ship emissions (Agrawal et al., 2010). The naphthalene SOA profile was obtained from Kleindienst et al. (2012) and had a phthalic acid-to-SOC mass fraction of 0.0389, phthalic acid-to-SOA mass fraction of 0.0199, and the average SOA : SOC of 1.95. Species included in the CMB model included EC, levoglucosan, 17α(H)-21β(H)-hopane, 17α(H)-22,29,30-trisnorhopane, 17α(H)-21β(H)-30-norhopane, PAHs (benzo(b)fluoranthene, indeno(1,2,3-cd)pyrene, and benzo(ghi)perylene), isoprene SOA tracers (2-methylglyceric acid and 2-methyltetrols), one α-pinene SOA tracer (cis-pinonic acid), one naphthalene SOA tracer (phthalic acid), and one toluene SOA tracer (2,3-dihydroxy-4-oxopentanoic acid).
2.6 Molecular marker based-positive matrix factorization (MM-PMF)
The EPA PMF (version 5) was used for source apportionment of PM2.5 OC based on organic species and EC as input data. The MM-PMF input data statistics are summarized in Table S2. MM-PMF solutions for 3 to 11 factors were analyzed using 20 base runs. To determine a final solution, MM-PMF solutions with 5 to 9 factors were further analyzed using 100 base runs, each starting with a random seed. The stability of the PMF solutions was assessed using displacement (DISP), bootstrapping (BS), and BS-DISP error estimation methods following the recommendations of Brown et al. (2015) and Norris et al. (2014). PMF settings for base runs and error estimation are summarized in Table S3.
2.7 Statistical analysis
Correlation analysis among the measured species and VOCs were evaluated using Minitab statistical analysis software (version 17). Correlation coefficients (r) were interpreted as follows: very high (0.9–1.0), high (0.7–0.9), moderate (0.5–0.7), low (0.3–0.5), and negligible (0.0–0.3). The statistical significance of correlations was evaluated at the 95 % confidence interval (p<0.05).
Clinton Drive is a long-term monitoring site near the HSC in Houston where PM2.5 mass, select gases, and meteorology are measured hourly (TCEQ, 2017) (Fig. S4). Several extreme rain events and flooding occurred during the study period of 5–27 May 2015 (Fig. S5). Winds were predominantly southerly, transporting air from the Gulf of Mexico, suggesting minimal influence of continental transport on ambient air at Clinton Drive. Daily PM2.5 mass concentrations averaged 14.0±5.1µg m−3 and ranged from 4.4 to 30.8µg m−3, well below the daily National Ambient Air Quality Standard (NAAQS) of 35µg m−3 (US-EPA, accessed 2017). Hourly PM2.5 concentrations peaked between 07:00 and 10:00 LT, coinciding with morning traffic. The NOx and toluene mixing ratios also peaked in the early morning and late afternoon, coinciding with high traffic periods (Fig. S4). The daytime peaks in ozone (O3) and isoprene were consistent with expected summertime trends. All measurements made in this study are publicly available (Al-Naiema et al., 2018).

Figure 1A summary of NR-PM1 measurements at Clinton Drive for the period 13–29 May 2015: (a) time series including organics, sulfate, ammonium, nitrate and chloride; (b) average percentage contributions; and (c) the hourly diurnal profile (daytime hours are highlighted in yellow). The bottom whisker, bottom box line, top box line and top whisker indicate the 5, 25, 75, and 95th percentiles, respectively. Lines inside the boxes represent the hourly median of the data. One high data point of organic concentration (57.42 µg m−3) on 23 May 2015 at 14:05 LT is not shown.
3.1 HR-ToF-AMS
Nonrefractory PM1 (NR-PM1) measurements by the HR-ToF-AMS from 13 to 29 May are summarized in Fig. 1. Due to the rainy weather, the observed NR-PM1 levels were low in comparison to other measurements made in the HSC area earlier in 2015 (Wallace et al., 2018). Despite the rainy conditions, periods of elevated NR-PM1 loadings occurred (Fig. 1a). Average relative contributions from major species to NR-PM1 quantified are shown in Fig. 1b. Sulfate and organics are the two most abundant components of the NR-PM1, contributing 44.9 % and 39.7 %, respectively. Sulfate and organics exhibited periods of high loadings with concentrations of over 15 µg m−3 and maximum 1 min averaged concentrations of 22.2 and 57.5 µg m−3, respectively. Ammonium was the next most abundant species, making up 13.9 % of the NR-PM1, followed by nitrate and chloride, which only contributed trace amounts (1 % or less) to the NR-PM1 mass concentration. Table 1 summarizes the mean, median, standard deviation, and range of 1 min concentrations for NR-PM1 species. The diurnal profiles for PM1 species (Fig. 1c) indicate no diurnal trend for the measured species, except for organic aerosol, which exhibited higher concentrations during daytime. The elemental ratios of the organic portion of NR-PM1, including the oxygen-to-carbon ratio (O : C) and hydrogen-to-carbon ratio (H : C), as well as organic mass-to-organic carbon (OM : OC) and the average carbon oxidation state ( are presented in Table 2.
Table 1Summary of ToF-AMS high-resolution (1 min) results of NR-PM1 composition (µg m−3), measured in HSC for the period 13–29 May 2015.
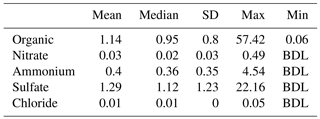
Table 2Summary of the elemental analysis of NR-PM1 organic aerosol. is defined as the average carbon oxidation state (Kroll et al., 2011) and is calculated by 2 × O : C – H : C.
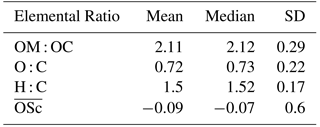
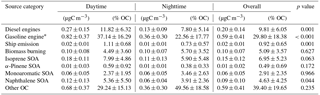
Table 3PM2.5, its major components (µg m−3) and estimated pH for daytime, nighttime, and overall periods (± SD) at Clinton Drive during May 2015. Organic matter (OM) was estimated based on the mean OM : OC ratio of 2.11 obtained from HR-ToF-AMS (Table 2). The p values ≤ 0.05 indicate that the difference between daytime and nighttime concentrations are statistically significant at the 95 % confidence interval.
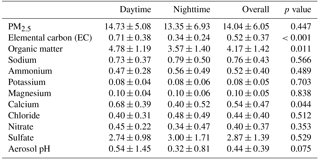
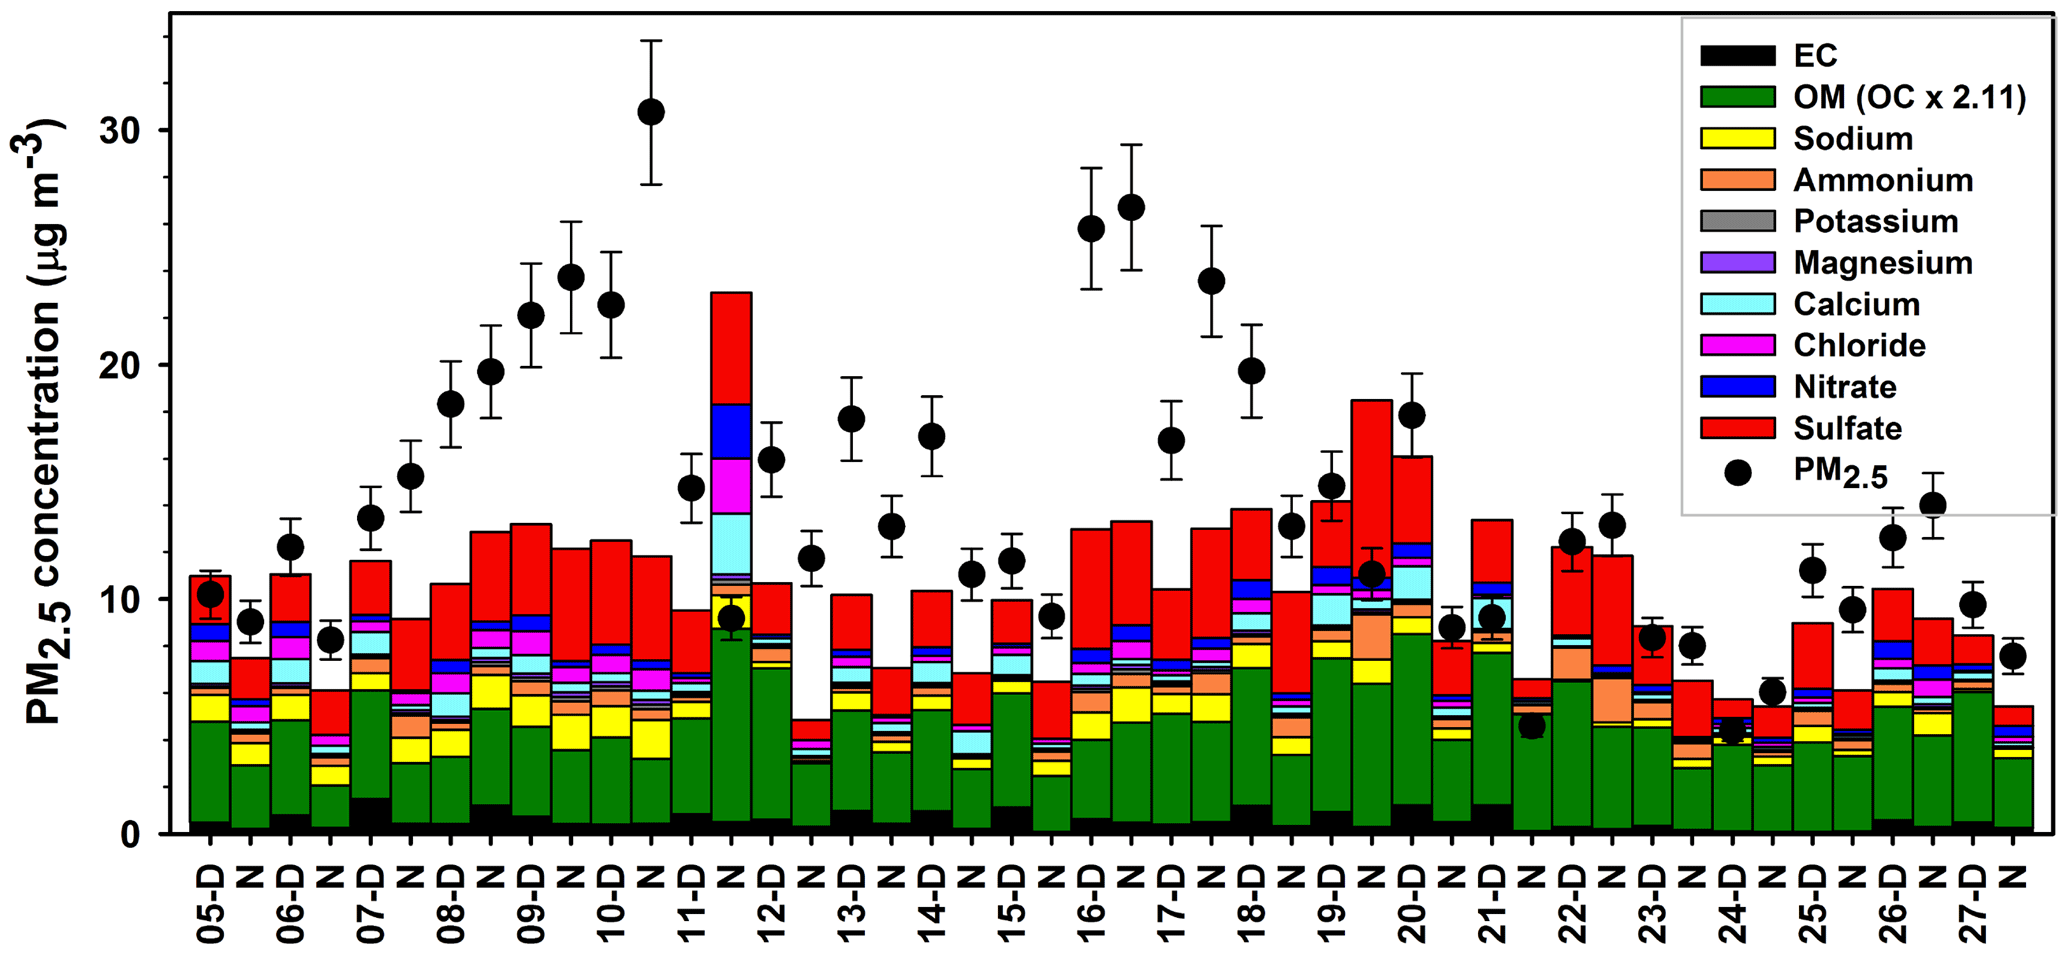
Figure 2Day and night PM2.5 mass composition at Clinton Drive for the period 5–27 May 2015. Carbonaceous and ionic species account for 82 % of PM2.5, on average, and the remaining 18 % was attributed to other species that were not measured, such as silica, alumina, and metals. PM2.5 mass (average ± analytical uncertainty) was obtained using TEOM from TCEQ.
3.2 Composition of PM2.5 determined by filter-based measurements
Filter-based PM2.5 measurements indicated that, on average, organic carbon and elemental carbon contributed 17 % and 4 % of PM2.5, respectively (Table 3). Organic matter (OM) was estimated by the mean OM : OC ratio of 2.11 measured by HR-ToF-AMS (Table 2 and Fig. S6) to contribute 35 % of PM2.5. The AMS-determined OM : OC ratio is considered to be the best estimate of the PM2.5 OM : OC ratio, since it was determined at HSC for the study period. However, this estimation is limited by the differences of sizes of particles analyzed by each method as well as AMS's measurement of only nonrefractory OA, while PM2.5 OC includes refractory and nonrefractory species. OM concentrations were significantly higher during daytime (4.8±1.2 µg m−3) compared to nighttime (3.6±1.4 µg m−3 p=0.011, Table 3). EC concentrations were also significantly higher during daytime (averaging 0.7±0.4 µg m−3) compared to nighttime (0.3±0.2 µg m−3, p<0.001). Higher daytime EC at Clinton Drive is expected to be influenced by transportation emissions near the HSC (Levy et al., 2013; Zhang et al., 2017). On average, sulfate contributed 21.4 % of PM2.5 (averaging 2.87±1.39 µg m−3), with minor contributions from ammonium (4 %, 0.52±0.40 µg m−3), nitrate (3 %, 0.40±0.37 µg m−3), sodium (5.5 %), chloride (3.3 %), potassium (0.6 %), and magnesium (0.7 %). Calcium contributed 4.3 % of PM2.5 and likely originated from road dust, which has previously been estimated to contribute to 11 % of PM2.5 at Clinton Drive (Fraser et al., 2003). On average, OM, EC, and inorganic ions accounted for 80 % of the PM2.5 mass (Fig. 2), with the remaining mass expected to arise from unmeasured species such as crustal metal oxides (e.g., silica, alumina), other metals, and particle-bound water. For samples in which the measured species exceed PM2.5 mass, contributing factors include analytical uncertainties in chemical species measurements and PM2.5 mass measured by tapered element oscillating microbalance (TEOM) (Ayers et al., 1999).
Filter-based PM2.5 measurements indicate the same major PM species as AMS NR-PM1 measurements and their ambient concentrations are compared here. The linear regression of the filter-based estimate of PM2.5 OM and NR-PM1 AMS OA had a slope of 0.61 and a low, but significant correlation (r=0.48, p=0.005), indicating that more OM was captured by the filter-based measurements than by the AMS. Sulfate measured by both techniques correlated strongly (r=0.90, p<0.001), with a slope of 0.89 indicating only a minor increase in filter-based sulfate relative to the AMS. Ammonium correlated moderately (r=0.72, p<0.001) with a slope of 0.73. The consistently lower NR-PM1 concentrations measured by AMS relative to filters suggests the presence of OA, sulfate, and nitrate in the 1–2.5 µm size range and/or refractory matter that was not captured by the AMS.
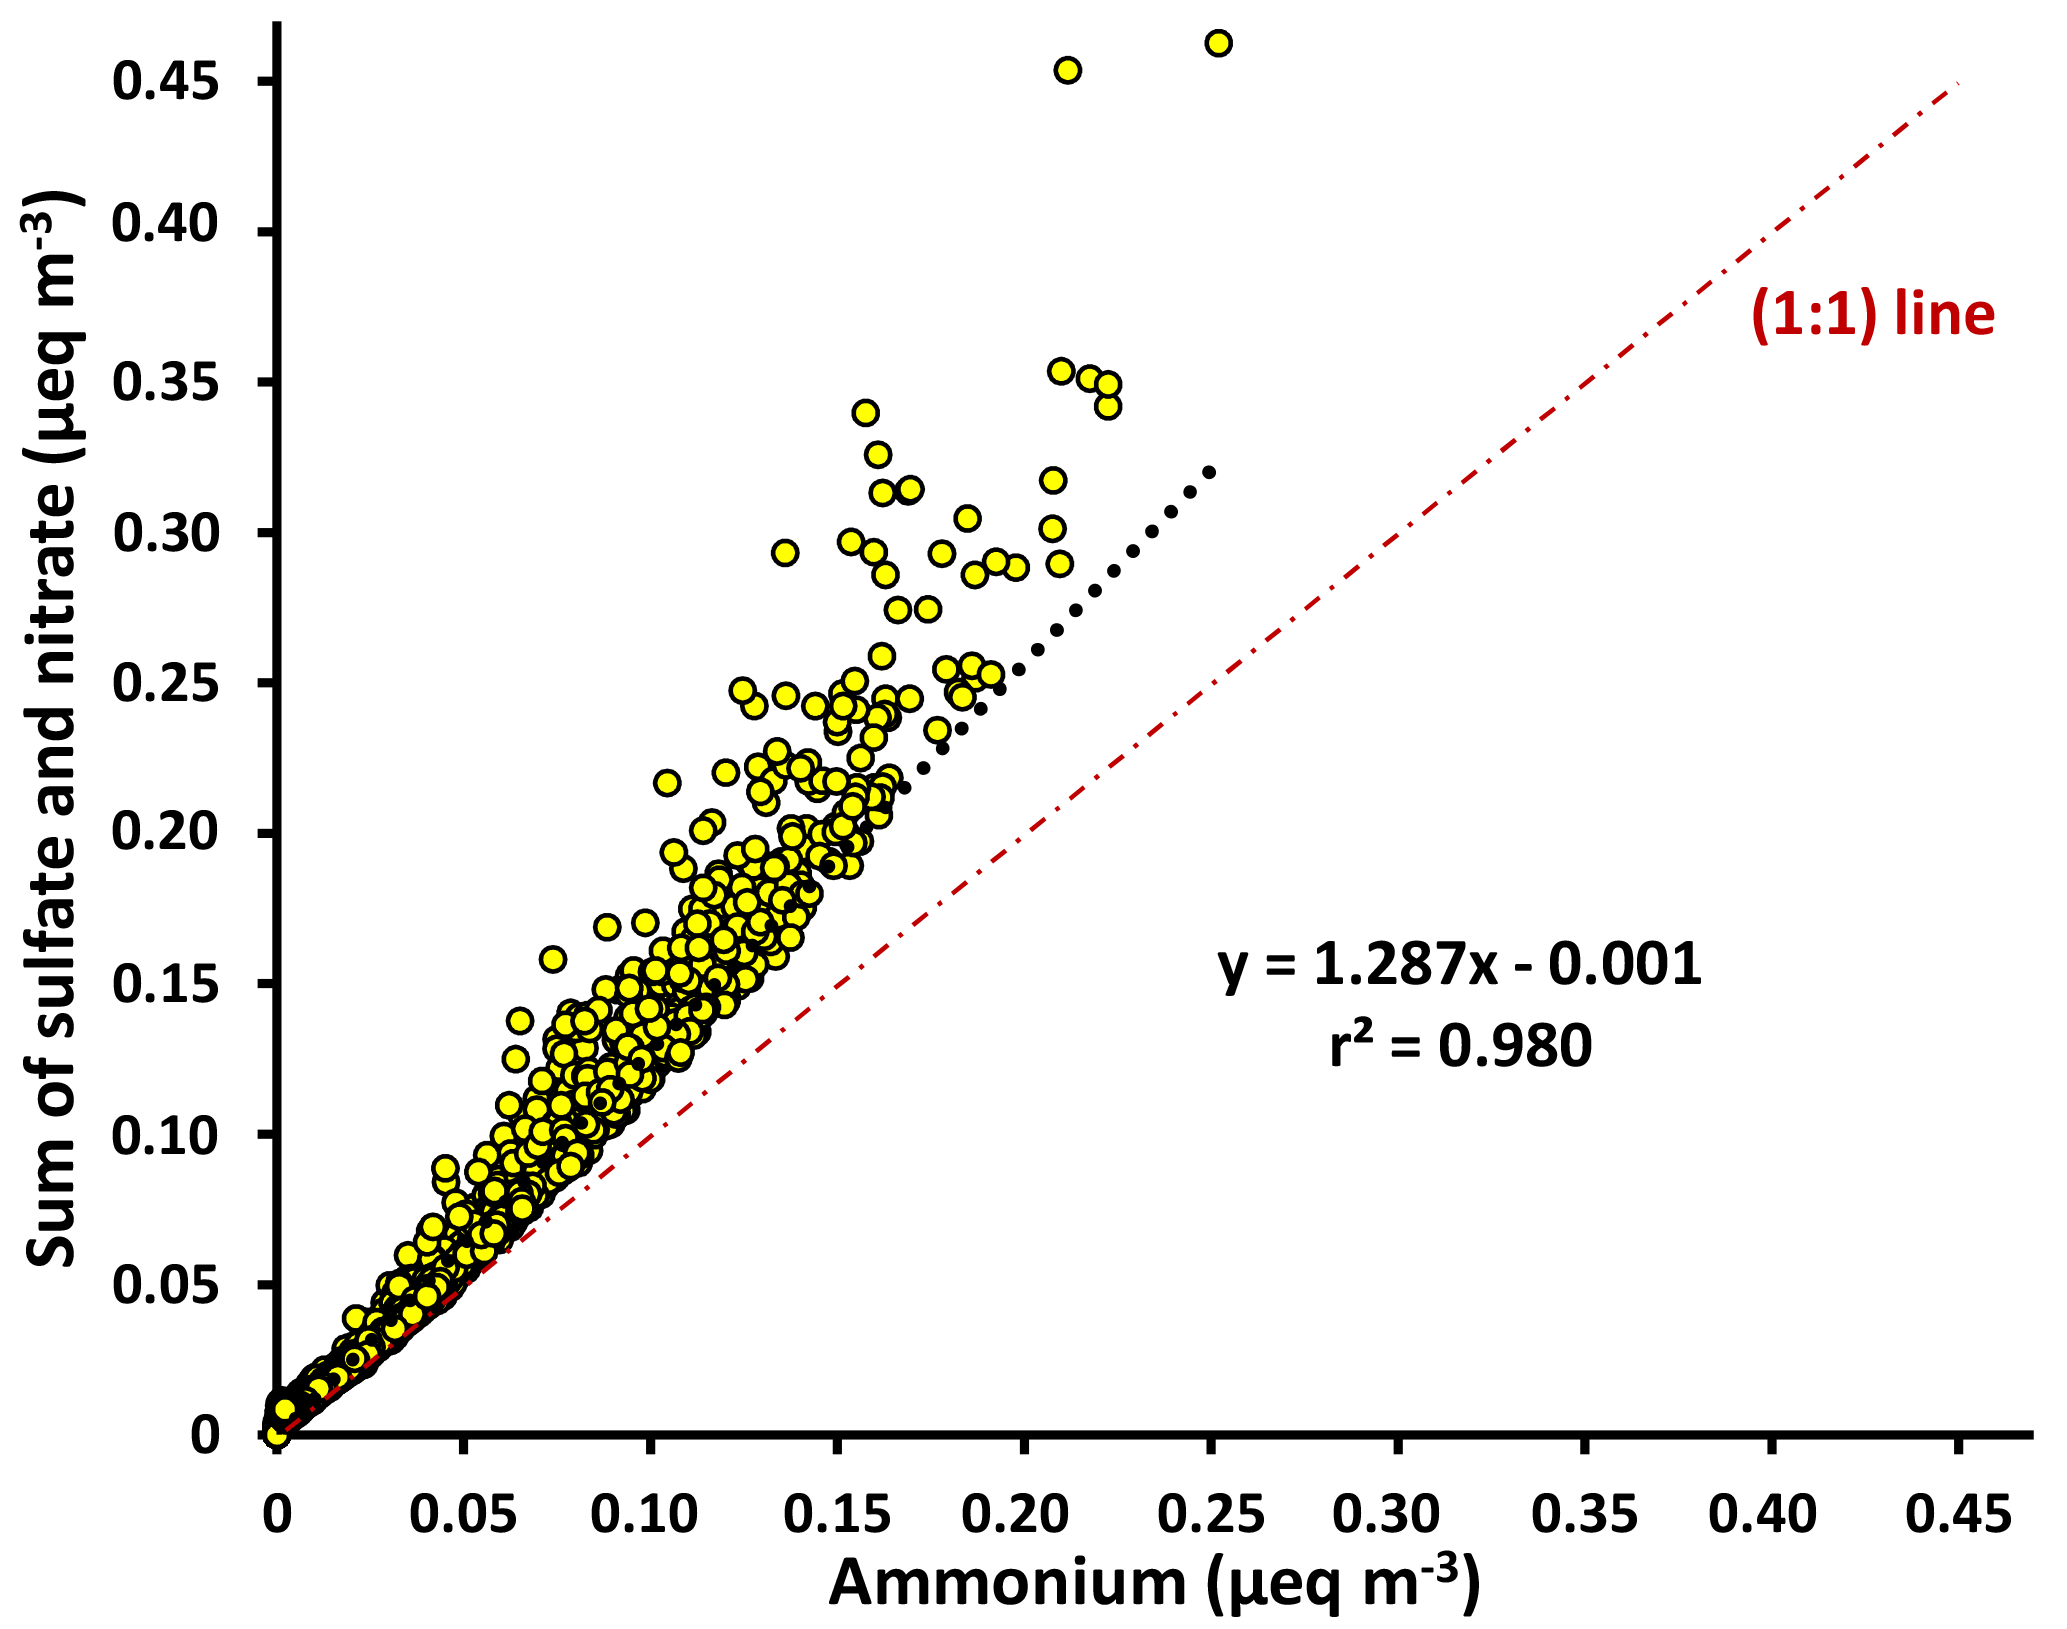
Figure 3Scatter plot of the molar equivalents (eq) of negative charges from sulfate and nitrate versus the molar equivalents of positive charge from ammonium, measured by HR-ToF-AMS during May 2015. The higher anions relative to ammonium indicate that the aerosols were only partially neutralized and acidic.
Ion measurements indicate that the aerosol at Clinton Drive is acidic. The correlation between the molar concentrations of major anions (sulfate and nitrate) and ammonium measured by HR-ToF-AMS (Fig. 3) had a slope of 1.287±0.002, indicating that ammonium does not fully neutralize sulfate as ammonium sulfate. Aerosol pH was estimated using E-AIM IV to range from 0.29 to 1.45 with an average of 0.44±0.39. The estimated pH values might be biased because E-AIM does not account for the activity coefficient of H+ and neglects the role of organic acid dissociation (Hennigan et al., 2015). In comparison to other locations in the summertime, the estimated pH values in HSC are less than those estimated by ISORROPIA-II for Birmingham, Alabama (1.6–1.9) (Rattanavaraha et al., 2016) and Centreville, Alabama (0.5–2) (Guo et al., 2015), but are higher than those estimated by E-AIM for four major cities in China (−0.77 to −0.52) (Pathak et al., 2009). Acidic aerosol is expected to enhance SOA formation, as indicated in previous SOA chamber experiments (Surratt et al., 2007; Iinuma et al., 2004).
3.3 PMF of AMS data: factor identity and contribution to OA
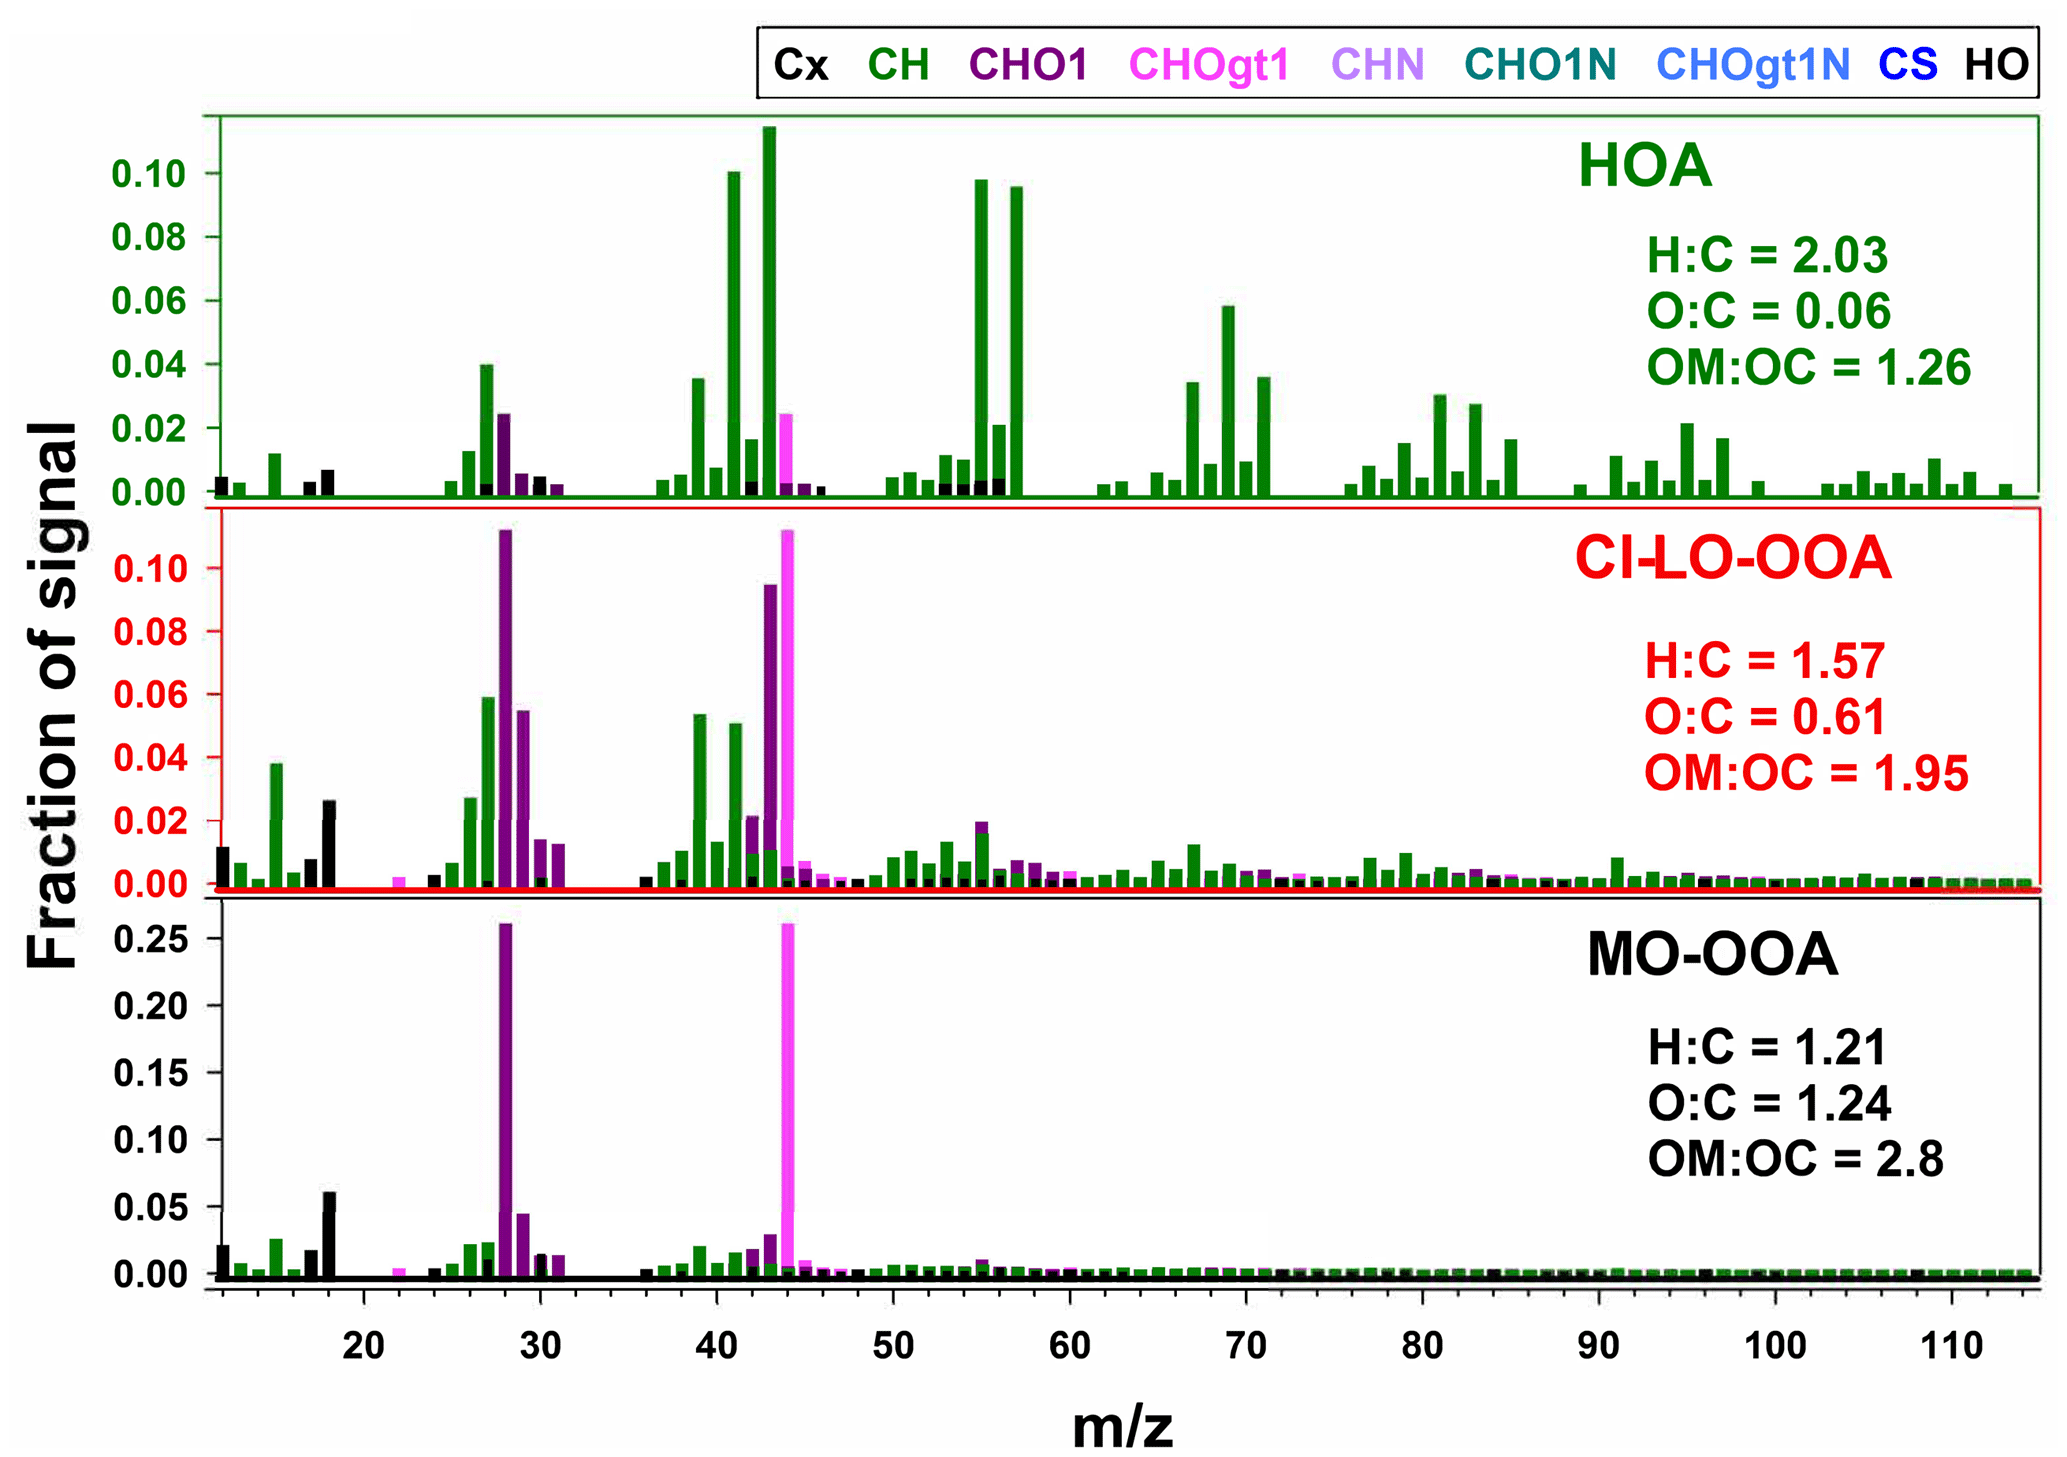
The mass spectra of the three-factor AMS-PMF solution are presented in Fig. 4. Each OA factor exhibited marked differences in their spectral mass signature and fragmentation patterns. Elemental ratios of O : C and H : C for the factors ranged from 0.06 to 1.24 and 1.21 to 2.03, respectively, while ranged from −1.91 to 1.27 (Table S4). These metrics reflect a largely different chemical character of the retained factors and indicate the likely contribution of components with primary and secondary origin to the observed OA concentrations (Zhang et al., 2011).
The hydrocarbon-like organic aerosol (HOA) factor in Fig. 4 had large signals at m∕z 41, 43, 55, and 57 and significant contributions from mass fragments above m∕z 60. These characteristics and O : C and H : C ratios are typical of primary organic aerosol (Zhang et al., 2011; Aiken et al., 2008). This classification was further confirmed by spectral contrast angles (θ) of ∼ 13 to 15∘ between this factor and previously reported HOA factors (Aiken et al., 2009; Docherty et al., 2011; Mohr et al., 2012; Elser et al., 2016), indicating strong similarities in the mass spectra HOA (Kaltsonoudis et al., 2017).
The more-oxidized oxygenated organic aerosol (MO-OOA) and cooking-influenced less-oxidized oxygenated organic aerosol (CI-LO-OOA) factors were characterized by large fractions of m∕z 44 (f44, associated mostly with CO signal) and by elevated O : C ratios and levels (Table S4), which are indicative of atmospherically processed OA aerosol with a likely secondary origin (Zhang et al., 2011). Moreover, f44 and the fraction of m∕z 43 in the mass spectrum (f43, mainly related to the C2H3O+ ion; Table S4) locate them in the LO-OOA and MO-OOA regions, respectively, of the “triangle plot”, as introduced by Ng et al. (2011).
The mass spectrum of the CI-LO-OOA factor (Fig. 4) closely coincides with at least one LO-OOA factor included in the University of Colorado at Boulder-AMS Database () (Aiken et al., 2009) and exhibits statistically significant (p<0.01) linear association with semi-volatile PM1 constituents such as nitrate (r=0.6). Further insight on the identity of this factor was obtained by examining its correlation with markers of OA sources; this analysis showed a significant correlation of the time series of the LO-OOA factor with mass fragments previously reported as tracers of cooking organic aerosol (COA) such as C3H3O+, C3H5O+, C2H3O+, and C5H8O+ (, p<0.01) (Mohr et al., 2012, 2009; Sun et al., 2011). Specific correlations between CI-LO-OOA and different food cooking tracers are presented in Table S5. In addition to the observed co-variability between CI-LO-OOA and COA markers, the ratio between m∕z 55 and m∕z 57 in the CI-LO-OOA mass spectra provides further evidence of the likely influence of cooking activities on this factor. CI-LO-OOA exhibited an f55∕f57 larger than 2, consistent with typical mass signatures of urban COA (Cao et al., 2018; Reyes-Villegas et al., 2018; Sun et al., 2016). Despite the identification of LO-OOA as influenced by cooking-related activities, the denomination of this factor as CI-LO-OOA is not to be confused with its classification as COA. The differences between CI-LO-OOA and COA are reflected, for instance, by the CI-LO-OOA diurnal profile (Fig. 5), which lacks the typical meal-time increases observed in urban COA (Wallace et al., 2018). This reinforces that although CI-LO-OOA is associated with specific COA signatures, its contribution to PM1 only partially reflects the impact of cooking activities.
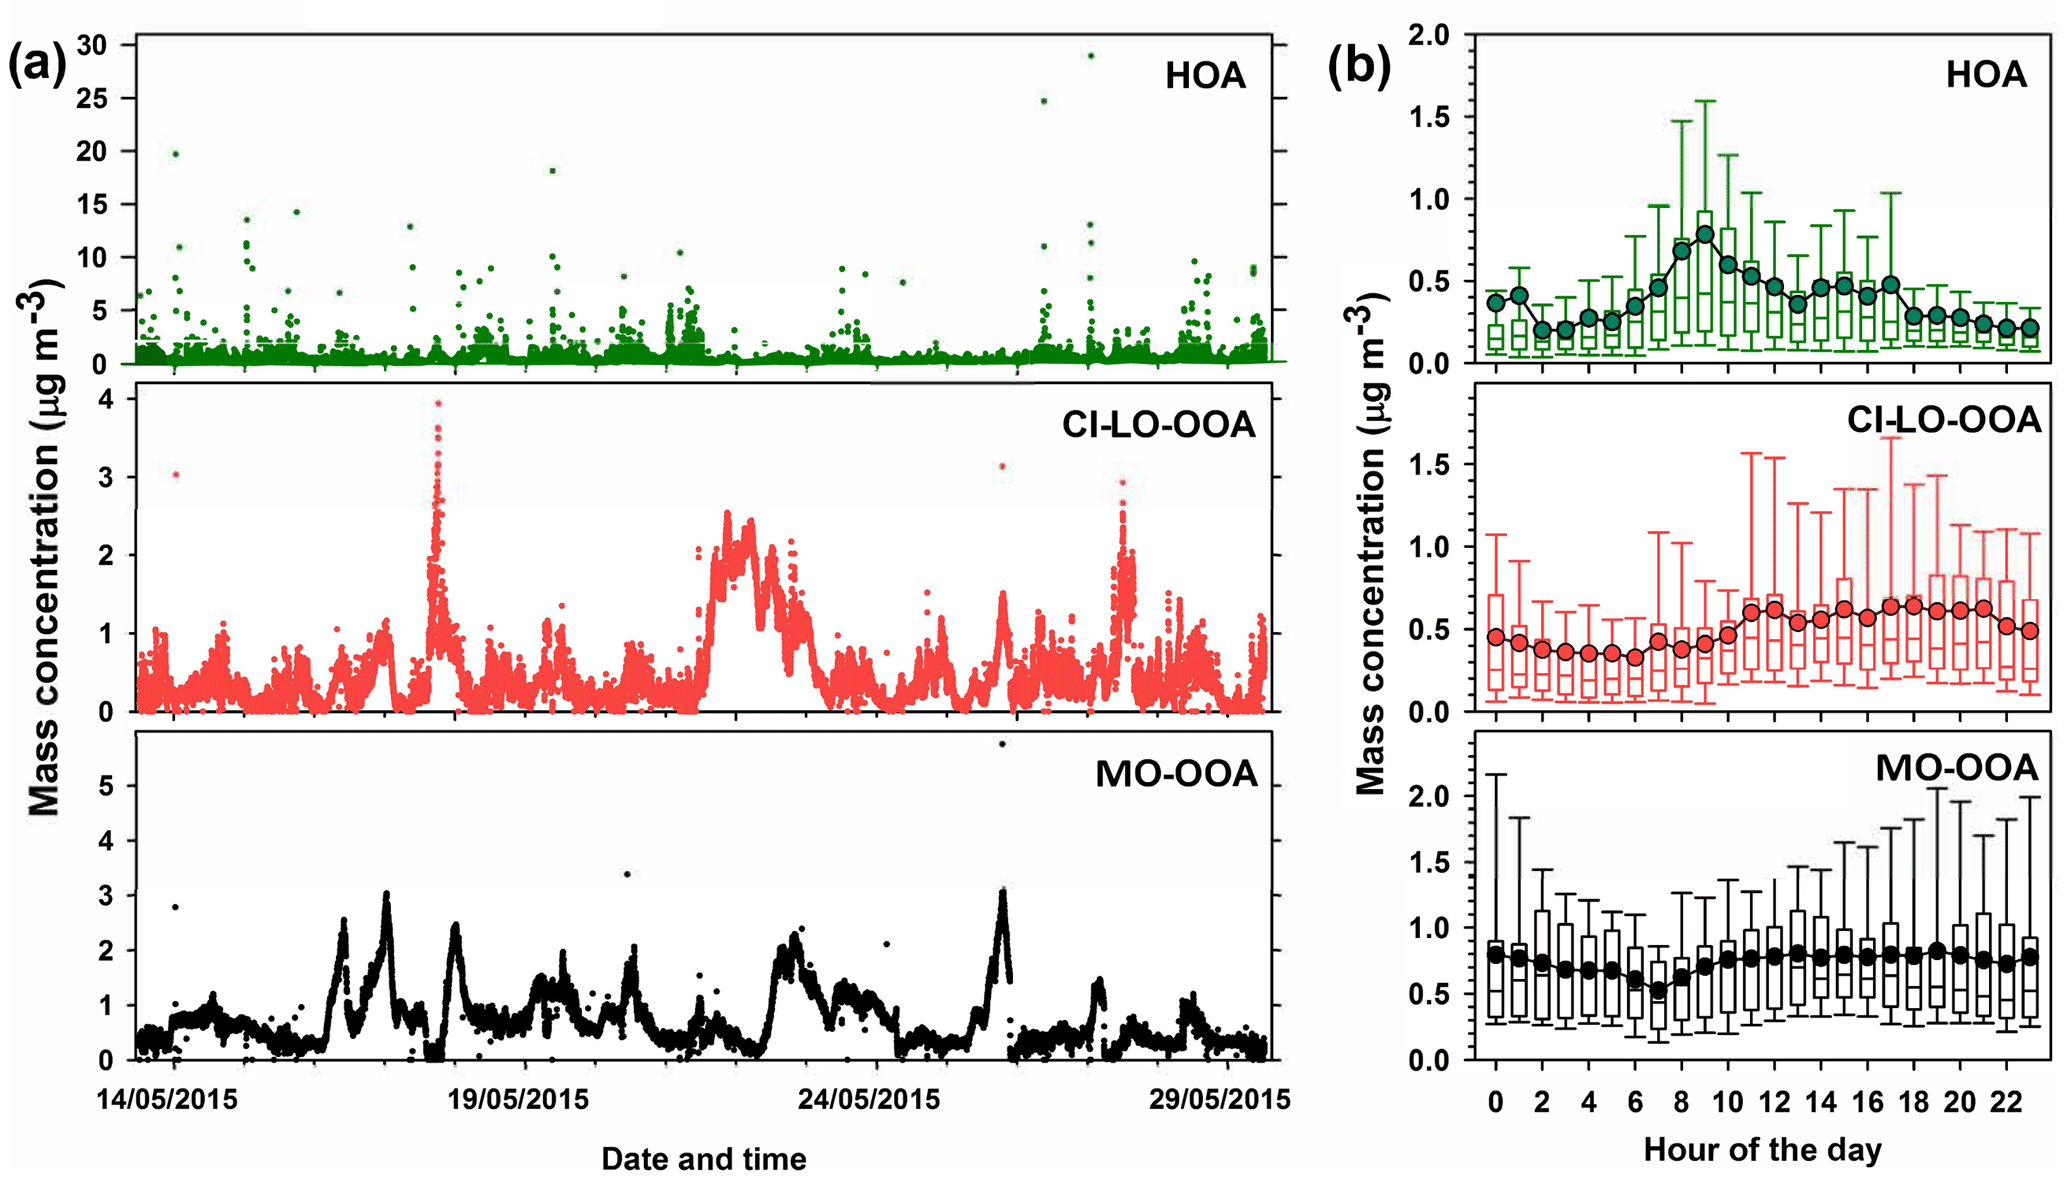
Figure 5AMS-PMF factors identified in PM1 OA: (a) time series of OA factors (HOA, CI-LO-OOA, and MO-OOA) and (b) diurnal profiles of OA factor mass concentrations. Bottom whisker, bottom box line, top box line and top whisker indicate the 5, 25, 75, and 95th percentiles, respectively. Lines inside the boxes represent the hourly median and circles represent the hourly mean.
The MO-OOA factor (Fig. 4) exhibited a statistically significant moderate correlation with particulate sulfate levels (r=0.5, p<0.01), suggesting, to some extent, its formation on a regional scale (Peng et al., 2016). These observations, along with the resemblance of the mass signature of this factor with MO-OOA factors reported in previous studies (θ below 17∘) (Docherty et al., 2011; Mohr et al., 2012), led to the classification of this factor as atmospherically processed OA resembling MO-OOA.
The time series of concentration of the AMS factors and their diurnal trends are presented in Fig. 5. The average mass concentrations observed for MO-OOA, CI-LO-OOA, and HOA during the field campaign were 0.37±0.73, 0.48±0.47, and 0.72±0.52 µg m−3, respectively, indicating a predominant contribution from secondary factors to the PM1 OA. The contribution to the OA mass concentration during the sampling period followed the sequence MO-OOA < CI-LO-OOA < HOA, with average abundances of approximately 22.33, 29.44, and 48.23 % respectively.
As indicated by the standard deviations associated with the average mass concentrations of the PMF factors (Fig. 5), large variations in their contributions to total OA occurred during the sampling interval, with particularly high variability observed for HOA. As presented in Fig. 5b, the diurnal profile of the HOA factor exhibited local maxima at ∼ 09:00 and 17:00 LT, respectively, indicating its enhancement during periods of significant traffic activity. Thus, it is likely that the observed variability in the mass concentration of HOA is related to peak traffic times. According to Fig. 5b, MO-OOA mass concentrations showed a relatively flat diurnal behavior with a slight increasing trend during daytime (07:00 to 18:00 LT), which is consistent with periods of enhanced photochemical activity and is in agreement with MO-OOA diurnal patterns reported in previous studies (Sun et al., 2011; Zhang et al., 2016). The hourly behavior of the CI-LO-OOA factor (Fig. 5b) indicates higher concentrations during daytime, unlike the expected trends for semi-volatile species. Although a slight concentration peak at ∼ 12:00 LT, likely related with cooking activities, was noticed in this factor, no evident late-night increases such as those previously observed for COA in the Houston area (Wallace et al., 2018) were observed (Fig. 5b).
Table 4Chemical mass balance (CMB) estimates of the absolute relative source contributions to PM2.5 OC at Clinton Drive in May 2015 averaged over daytime, nighttime, and all periods. The p values ≤ 0.05 indicate that the difference between daytime and nighttime source contributions are statistically significant at the 95 % confidence interval.
* Gasoline engines factor represent the sum of the contribution from smoking and nonsmoking gasoline engines.
3.4 Source apportionment of PM2.5 OC in HSC
3.4.1 Chemical mass balance (CMB) modeling
CMB modeling apportioned PM2.5 OC to eight sources (Fig. 6, Table 4): diesel engines, gasoline engines (reported as the sum of smoking and nonsmoking gasoline engines), biomass burning (BB), ship emissions, isoprene SOA, α-pinene SOA, monoaromatic SOA, and naphthalene SOA. The bituminous coal source contribution was not statistically significant. CMB model diagnostics, including R2, χ2, and calculated-to-measured ratios for fitting species, are summarized in Table S6. Unapportioned (or other) OC was calculated as the difference between the observed OC mass and the OC apportioned to these eight sources. The average OC during daytime (2.27±0.56 µgC m−3) was apportioned 55 % to primary sources and 16 % to secondary sources, with 29 % unapportioned. The average OC mass during nighttime was apportioned 37 % to primary sources and 14 % to secondary sources, with 49 % unapportioned.
Motor vehicles were the greatest PM2.5 OC source, with gasoline engines contributing 30 % and diesel engines contributing 10 % on average. OC contributions from gasoline engines were significantly higher during daytime (0.82±0.37 µgC m−3) compared to nighttime (0.36±0.30 µgC m−3, p<0.001, Table 4). Similarly, diesel engine contributions were significantly higher (p=0.001) during daytime (0.27±0.15 µgC m−3) compared to nighttime (0.13±0.09 µgC m−3). The higher daytime contributions are expected to result from greater motor vehicle activity during daytime, which captured the majority of peak traffic times in the morning and afternoon.
Biomass burning had a small impact on PM2.5 OC, with an average contribution of 5 % (0.10 µgC m−3). No significant differences in daytime and nighttime concentrations were observed. The open BB profile was used in CMB because high fire activity was observed in the Yucatán Peninsula of Mexico during the time of sample collection (Fig. S7). Backward wind trajectories indicated that some air masses affecting Houston had traveled over the Yucatán Peninsula (Fig. S8). The influence of Mexico wildfires on the Houston airshed, previously noted in other studies, typically peaks during the month of May (Duncan et al., 2003; Yokelson et al., 2009; Crounse et al., 2009). A similarly minor contribution from BB was previously reported for the same sampling site (Fraser et al., 2003).
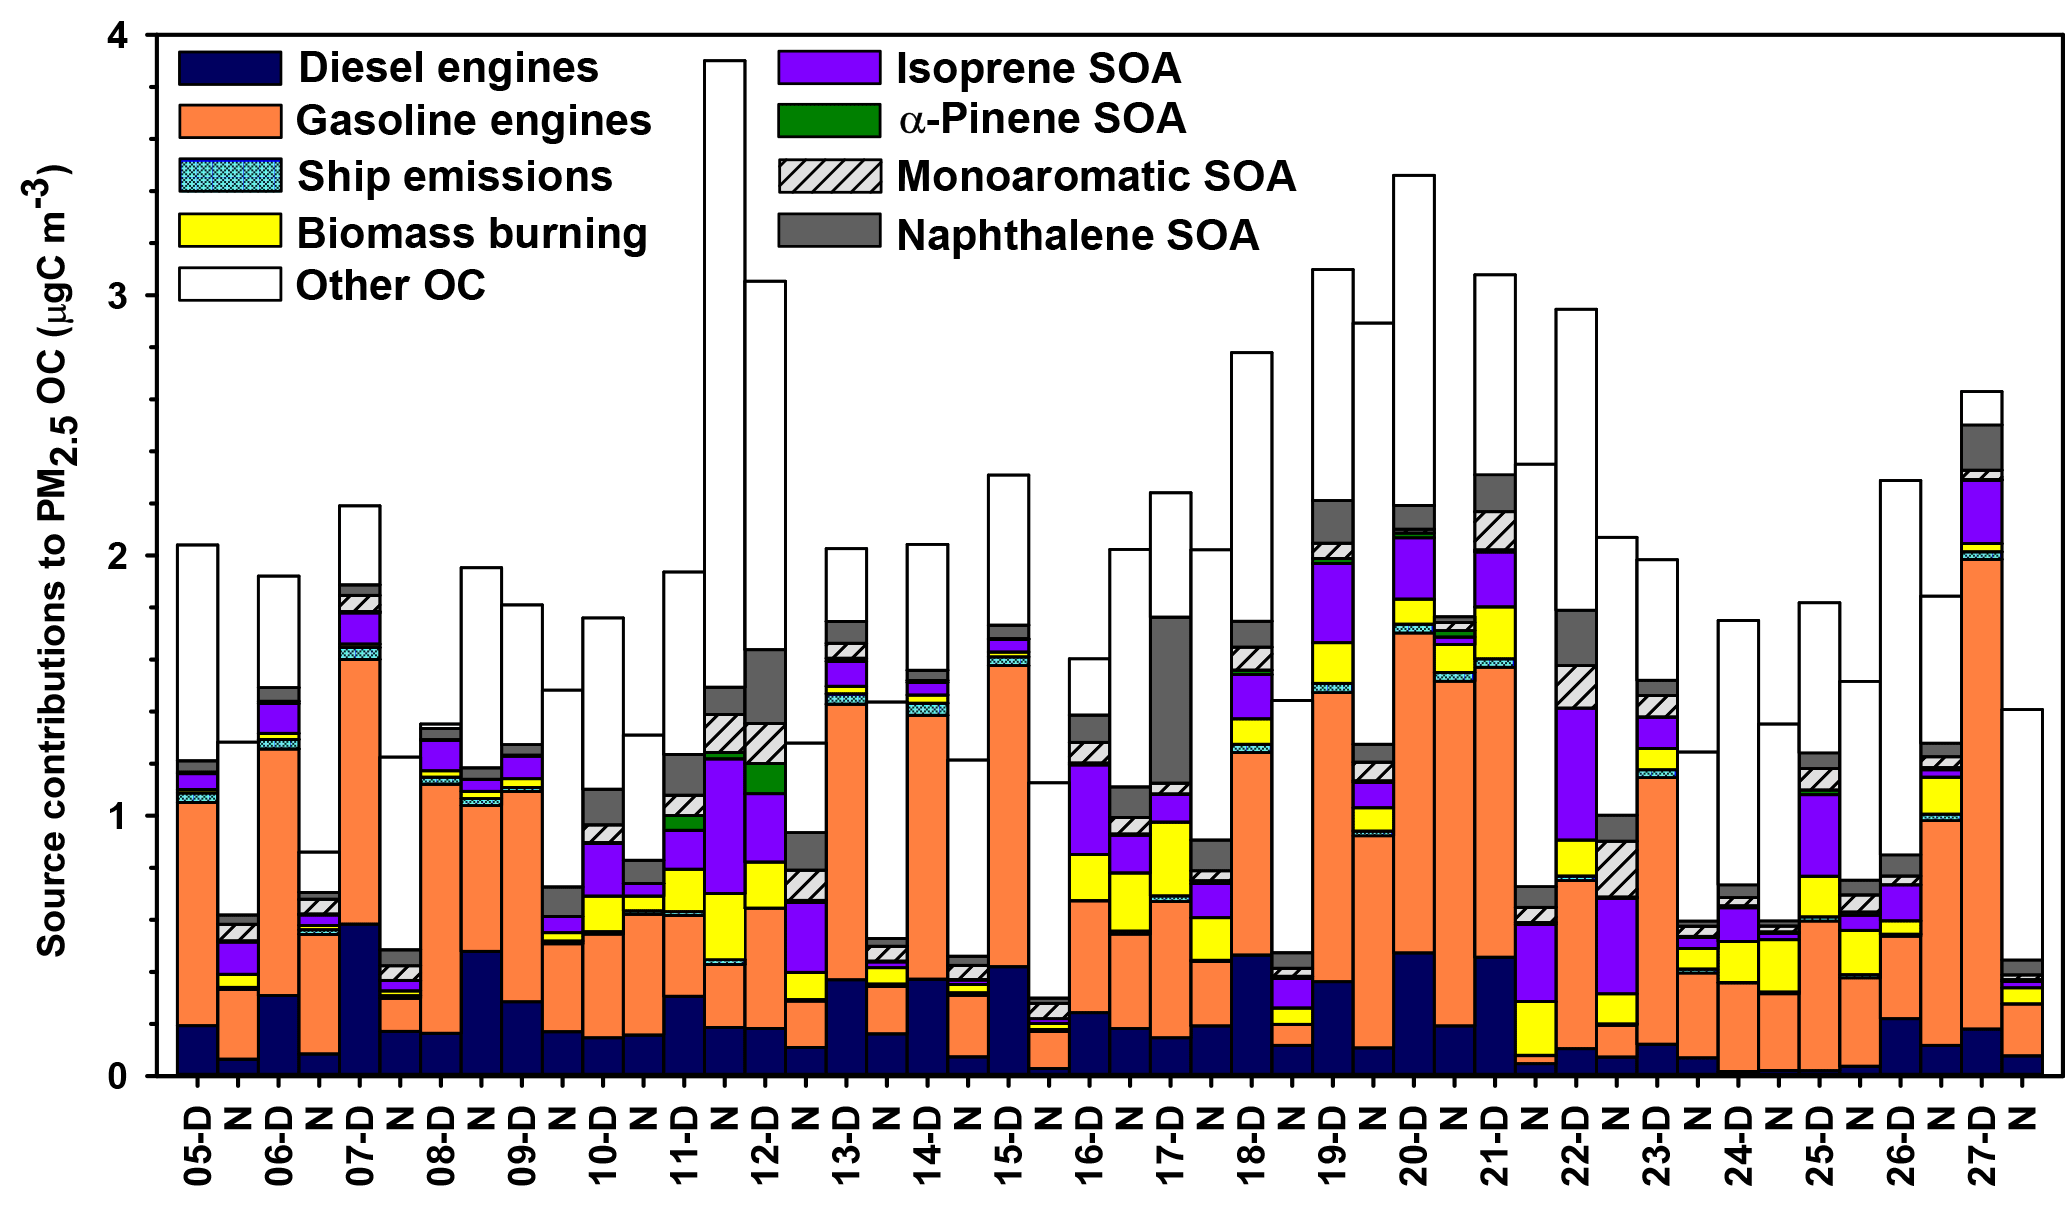
Figure 6Source contributions to PM2.5 OC at Clinton Drive during May 2015 estimated by CMB modeling.
Ship emissions contributed 1 % of PM2.5 OC, with a significantly higher (p=0.001) daytime concentration (0.02±0.01 µgC m−3) compared to nighttime (0.01±0.01 µgC m−3; Table 4). Despite the location of Clinton Drive near the HSC, ship emissions were not a major source of OC, which may be due to the prevailing southerly wind direction (Fig. S4). These results may be also biased from the use of a single source profile in CMB modeling, since ship characteristics such as vessel category, speed, and loading impact ship emissions (Williams et al., 2009).
CMB was used to apportion OC to four SOA precursors, following the SOA-tracer approach (Kleindienst et al., 2007). SOA from monoaromatic VOCs was estimated by 2,3-dihydroxy-4-oxopentanoic acid (DHOPA, detected in 80 % of samples) at 3 % of OC (Table 4). Toluene is a known precursor to DHOPA (Kleindienst et al., 2004) and monoaromatic SOA correlated significantly with toluene during daytime (r=0.52, p=0.039) and nighttime (r=0.725, p<0.001). The diurnal trend in toluene concentrations coincides with peak traffic times (Fig. S4) suggesting that vehicles are the major source of monoaromatic SOA precursors.
Naphthalene SOA contributed an average of 4.6 % to PM2.5 OC (Table 4). To our knowledge, this is the first study to use ambient concentrations of phthalic acid in CMB modeling to estimate naphthalene SOA, following our previous recommendations (Al-Naiema and Stone, 2017). Phthalic acid concentrations were converted to SOA yields using the mass fraction of phthalic acid-to-OC in SOA generated in naphthalene photooxidation chamber experiments (Kleindienst et al., 2012). The estimated naphthalene SOA correlated significantly with gasoline engines (r=0.409, p=0.012), suggesting gasoline engines are an important sources of naphthalene, which is consistent with a previous report of naphthalene accounting for 56 % of PAH emitted from gasoline engines (Khalili et al., 1995).
Isoprene SOA was estimated to contribute 7 % of the PM2.5 OC by way of three tracers: 2-methylthreitol, 2-methylerythritol, and 2-methylglyceric acid (Fig. 6, Table 4). On average, isoprene SOA was higher during daytime (0.18±0.11 µgC m−3) compared to nighttime (0.11±0.13 µgC m−3), consistent with the hourly diurnal profile of isoprene that follows ambient temperature and UV radiation (Fig. S4) and prior studies of isoprene SOA (Budisulistiorini et al., 2015; Xu et al., 2015). Industrial emissions can be sources of isoprene in the HSC, with two point sources identified near the sampling location (Fig. S9). Isoprene SOA contributions were 7 times lower than those reported in June–July 2013 in Look Rock, TN, which has a much higher isoprene concentration (2 ppbv) (Budisulistiorini et al., 2015) than the HSC area average during this study (0.1 ppbv, Fig. S4).
α-Pinene SOA contributed 0.5 % of PM2.5 OC, based on the ambient concentrations of cis-pinonic acid that forms by ozonolysis of α-pinene (Christoffersen et al., 1998). Only one α-pinene SOA tracer was detected, consistent with the low mass contributions of this source to OC and the low monoterpene emission potential near the HSC (Brown et al., 2013).
The CMB-source apportionment of primary sources (contributing an average of 46 % of OC) agrees well with previous studies in the HSC. For a nonwood smoke event of summer 2000, Buzcu et al. (2006) reported that primary sources contributed 49 % to OC, with contributions from diesel (21 %) and gasoline (15 %) vehicles, BB (8 %), and meat cooking (3 %). Absolute contributions of these primary sources to OC have decreased by 33 %–83 % over the last decade, when comparing this study to Buzcu et al. (2006). In February 2015, Wallace et al. (2018) identified three primary PM1 OA factors: hydrocarbon-like (14 %), BB (22 %), and cooking (8 %). Altogether, this and prior studies indicate that motor vehicles contribute significantly to OC year-round, that summertime contributions from BB are smaller than winter, and that cooking contributions are relatively small. The SOA-tracer method was applied to the HSC for the first time, and yielded the estimates that anthropogenic SOA from monoaromatic VOCs and naphthalene contributed an average of 7.5 % to PM2.5 OC, with biogenic SOA from isoprene and α-pinene contributing 7.4 % of OC. Notably, a substantial amount of OC was unapportioned, averaging 0.68 µgC m−3 (29 %) in the daytime and 0.86 µgC m−3 (49 %) in the nighttime. Considering the strong agreement of primary source contributions with the other two approaches in this work (Sect. 3.6) and in prior studies, it is expected that the unapportioned OC is due to SOA. The SOA not accounted for in the CMB model includes SOA precursors for which the SOA tracer method has not been developed and also arises from differences in the SOA tracer-to-OC ratios across chamber experiments and the Houston airshed. The higher unapportioned OC levels at night may be due to nighttime SOA formation (e.g., organonitrates formed by nitrate-radical initiated reactions) and/or to a shift in gas-particle partitioning to the particle phase with lower nighttime temperatures.

Figure 7MM-PMF factor profiles. The y axis represents the percentage of species attributed to each factor.
3.4.2 Molecular marker-based positive matrix factorization model (MM-PMF)
The nine-factor solution was identified as the optimal solution by analyzing Q, error estimation diagnostics, and factor interpretability (Table S7). The difference between Qrobust and Qtrue is smallest for the nine-factor solution, indicating a minimum impact from outliers. The difference between Qrobust∕Qexpected ratios is smallest when moving from the eight- to nine-factor solution. The base model diagnostics and error estimation for the nine-factor solution are summarized in Table S2 and Fig. S10, respectively. The sources associated with each factor were identified by the key chemical species apportioned to each factor (Fig. 7), factor contributions (Fig. 8), and factor correlations with colocated measurements and CMB source contribution estimates.
The diesel engines factor contributed 12 % of average OC (equivalent to 0.22 µgC m−3). The key chemical species apportioned to this factor include cyclopenta(cd)pyrene (76 %), benz(a)anthracene (88 %), chrysene (64 %), EC (41 %), and 17α(H)-21β(H)-30-norhopane (39 %), which are components of fossil fuel combustion emissions (Lough et al., 2007; Rogge et al., 1993a). This factor contributes significantly more OC during daytime (0.369 µgC m−3) compared to nighttime (0.066 µgC m−3, p<0.001). The factor EC : OC ratio of 0.92 suggests contributions from light-duty (<33 000 lb) diesel-powered motor vehicles (1.9±0.53) (Lough et al., 2007). The factor identification is further supported by its positive correlation with the CMB-diesel engine source (r=0.727, p<0.001) and slope of 1.5±0.2.
The gasoline engines factor contributed an average of 24 % of OC (0.46 µgC m−3). The major chemical species apportioned to this factor include n-alkanes such as tetracosane (37 %), pentacosane (39 %), hexacosane (38 %), heptacosane (33 %), octacosane (50 %), nonacosane (37 %), and 17α(H)-21β(H)-30-norhopane (38 %), which have been detected among fossil fuel combustion emissions (Lough et al., 2007; Rogge et al., 1993a). The EC : OC ratio of this factor (0.29) is within the range of EC : OC ratios for nonsmoking (0.20 to 0.52) and smoking (0.0 to 2.5) gasoline vehicles (Lough et al., 2007). The moderate and significant correlation of this factor with CMB-gasoline engines (r=0.479, p=0.001) and the slope of 0.6±0.2 further support the identification of this factor as gasoline engines.
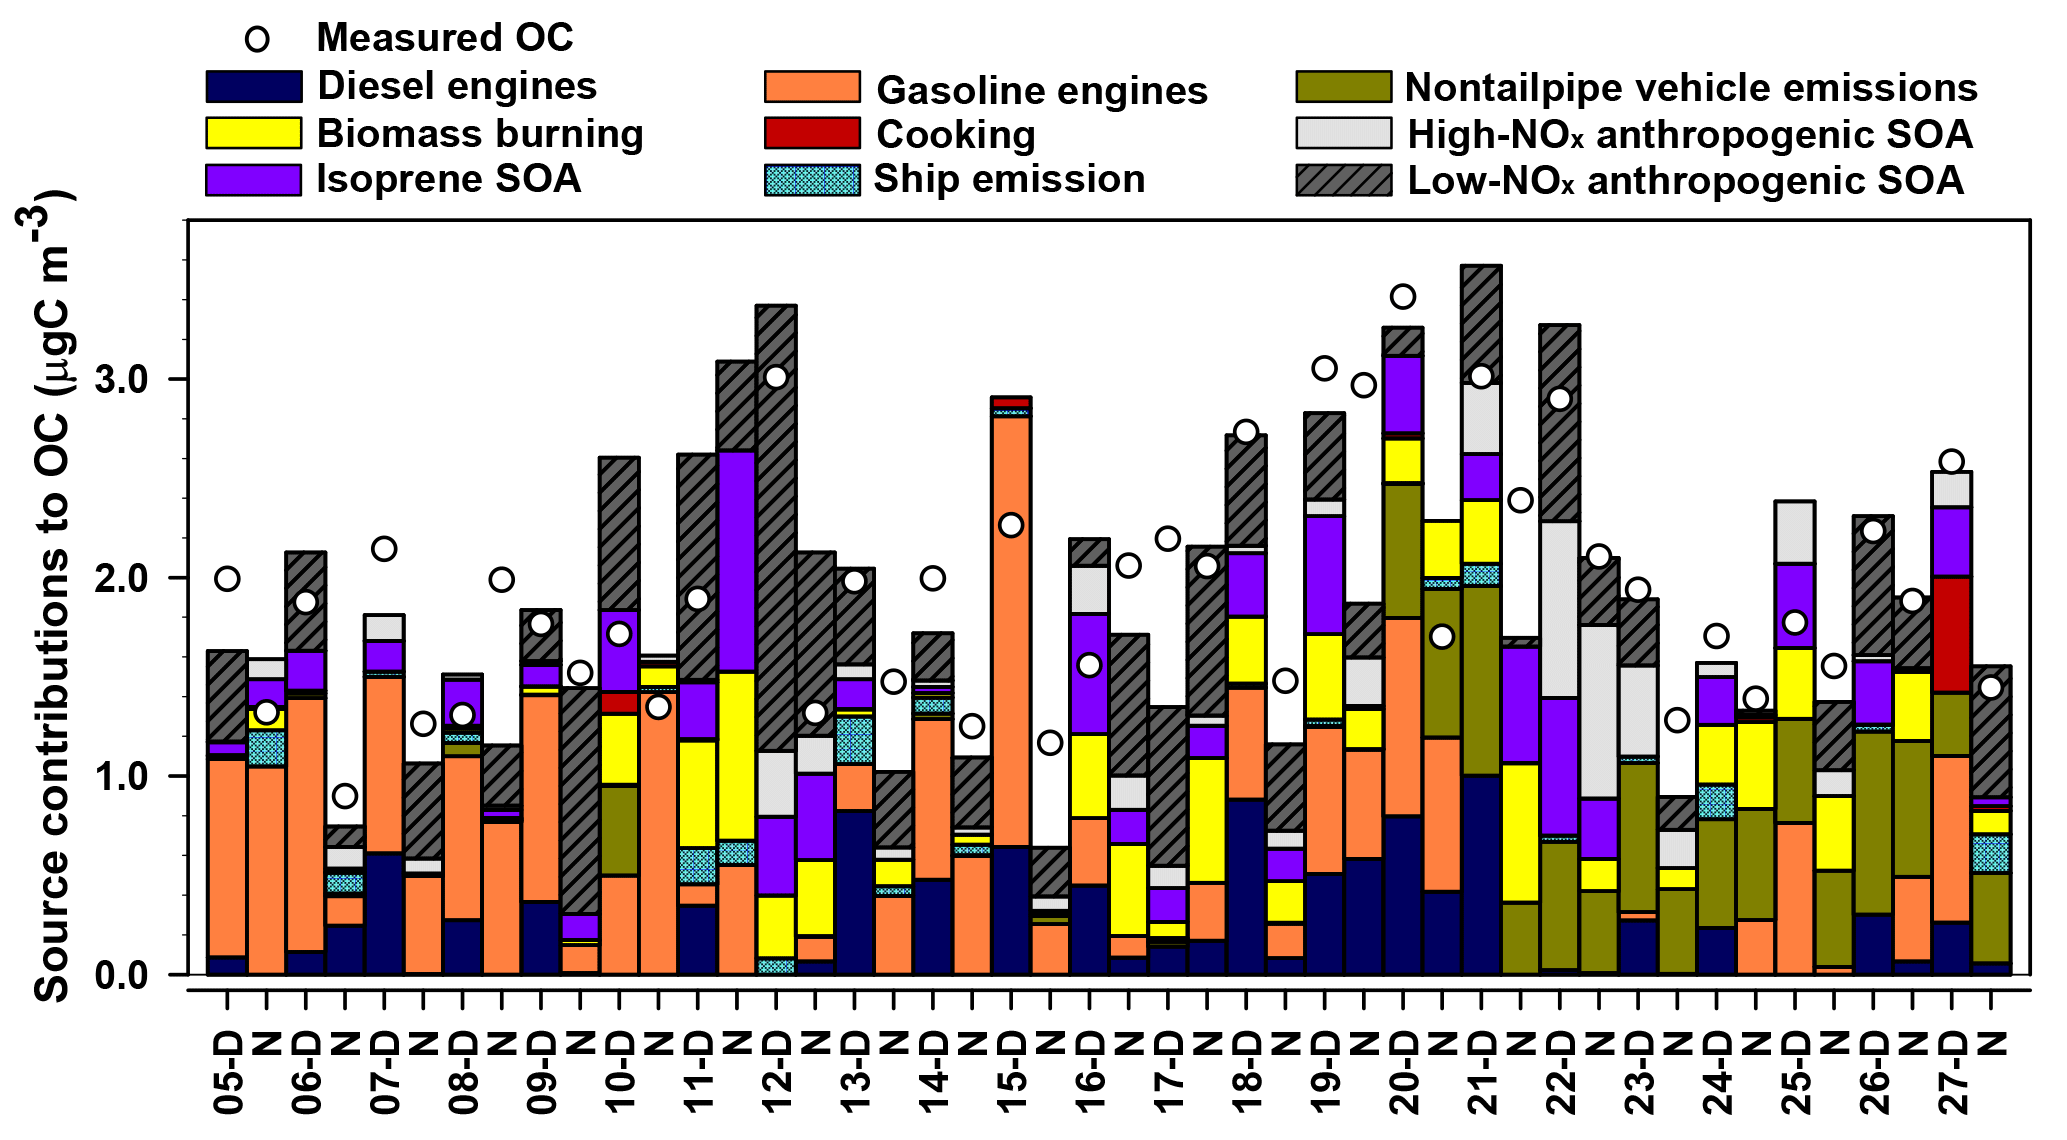
Figure 8MM-PMF factor contributions to PM2.5 OC at Clinton Drive in May 2015 juxtaposed with measured OC. Samples labeled D were collected during daytime (07:00–18:00 LT) and those labeled N samples were collected during nighttime (19:00–06:00 LT).
The nontailpipe vehicle emissions factor contributed an average of 11 % of PM2.5 OC (0.21 µgC m−3). The key chemical species apportioned to this factor includes 17α(H)-21β(H)-hopane (82 %), pristane (32 %), and nonadecane (20 %), while the absence of EC indicates a noncombustion source. 17α(H)-21β(H)-Hopane is a tracer for fossil fuel combustion and has been detected in both tailpipe and nontailpipe vehicle emissions and is present in the higher boiling-point fractions of crude oil that are used to manufacture lubricating oils, waxes, tires, and asphalt (Rogge et al., 1993a, b). Hopanes in the atmosphere come from engine oil evaporation, tire wear, and paved road dust and to a lesser extent from brake wear particles (Rogge et al., 1993a, b). Pristane and nonadecane have also been detected in tire dust, brake lining wear particles, and paved road dust particles (Rogge et al., 1993b). This factor contributes significantly more OC during daytime (0.249 µgC m−3) compared to nighttime (0.171 µgC m−3, p=0.050) (Fig. 8). This factor identification is further supported by the ratio of benzo(a)pyrene to the sum of benzo(a)pyrene and chrysene of this factor (0.29), which is within the range of nontailpipe vehicle emissions (0.23–0.32) (Rogge et al., 1993b). The factor contribution averaged 29 % of OC for samples in which 17α(H)-21β(H)-hopane was detected, suggesting that the detectability of this tracer influenced this factor's contributions to OC.
The ship emissions factor contributed an average of 2 % of PM2.5 OC (0.04 µgC m−3). The key species attributed to this factor were benzo(b)fluoranthene (42 %), benzo(k)fluoranthene (79 %), benzo(e)pyrene (40 %), benzo(a)pyrene (77 %), indeno(1,2,3-cd)pyrene (42 %), and benzo(ghi)perylene (51 %), nonadecane (34 %), 5-nitro-salicylic acid (36 %), and 2-methyl-4-nitrophenol (59 %). The PAHs and n-alkanes indicate a primary fossil fuel combustion source, while the nitromonoaromatic compounds can be either emitted by fossil fuel combustion or formed by the photooxidation of aromatic VOCs in the presence of NOx (Al-Naiema and Stone, 2017; Harrison et al., 2005; Lin et al., 2015). Since these nitromonoaromatic compounds are primarily attributed to this factor, fossil fuel combustion is expected to have been their major source. The absence of EC in this factor is consistent with the very small EC : OC ratio of ship emissions (0.03±0.002) and the ratio of indeno(1,2,3-cd)pyrene to the sum of indeno(1,2,3-cd)pyrene and benzo(ghi)perylene of 0.28 that is similar to that of ship emissions (0.36) (Agrawal et al., 2010).
The cooking factor contributed an average of 1 % of PM2.5 OC (0.02 µgC m−3). The key chemical species apportioned to this factor include cholesterol (90 %, a tracer for meat cooking; Rogge et al., 1991), 4-methyl-3-nitrophenol (86 %), and n-alkanes such as docosane (51 %), tricosane (40 %), and heptacosane (34 %), which have also been detected during commercial food cooking (Roe et al., 2004; Rogge et al., 1991). Factor contributions were observed only in samples with detectable levels of cholesterol, for which the average contribution to OC was 2.4 %. Overall, these results suggest cooking was a minor source of PM2.5 OC in this study.
The BB factor contributed 11 % of OC on average (0.20 µgC m−3). This factor is the major source of levoglucosan (60 %), a tracer for BB emissions (Simoneit et al., 1999). Other key species apportioned to this factor include SOA products such as isophthalic acid (38 %) and cis-pinonic acid (63 %) that have been observed among aged BB emissions (Yan et al., 2008). The factors' EC : OC ratio (0.044) is also closer to the EC : OC ratio of aged BB emissions (0.039) that contain both primary and secondary BB aerosols (Yan et al., 2008) compared to fresh, primary BB emissions (0.065) (Lee et al., 2005). These results suggest that the BB emissions observed in the sampling site represent aged BB emissions that were likely transported from Yucatán Peninsula in Mexico (Figs. S7, S8). These results are consistent with prior studies that reported BB emissions in southern Texas were transported from Mexico during the months of April to May during major fire events (Kaulfus et al., 2017; Rogers and Bowman, 2001; Wang et al., 2006). Notably, only 54 % of the bootstrap BB factor was mapped (Table S7; the lowest of any factor) indicating a greater relative uncertainty associated with this factor.
The factor identified as isoprene SOA contributed an average of 11 % of OC (0.20 µgC m−3). The key species apportioned to this factor include 2-methylthreitol (56 %) and 2-methylerythritol (62 %), which are isoprene SOA tracers from the photooxidation of isoprene under low-NOx conditions (Lin et al., 2013). This factor is significantly higher during daytime (0.275 µgC m−3) than nighttime (0.134 µgC m−3; p=0.036), which is consistent with the high photochemical activity and high isoprene emissions that is triggered by high daytime temperatures and sunlight (Sharkey et al., 1996). This factor identification is further supported by its very high and positive correlation with CMB-isoprene SOA (r=0.934, p<0.001), although the slope of 1.8±0.1 suggests the SOA tracer method in CMB underestimated its contribution to OC.
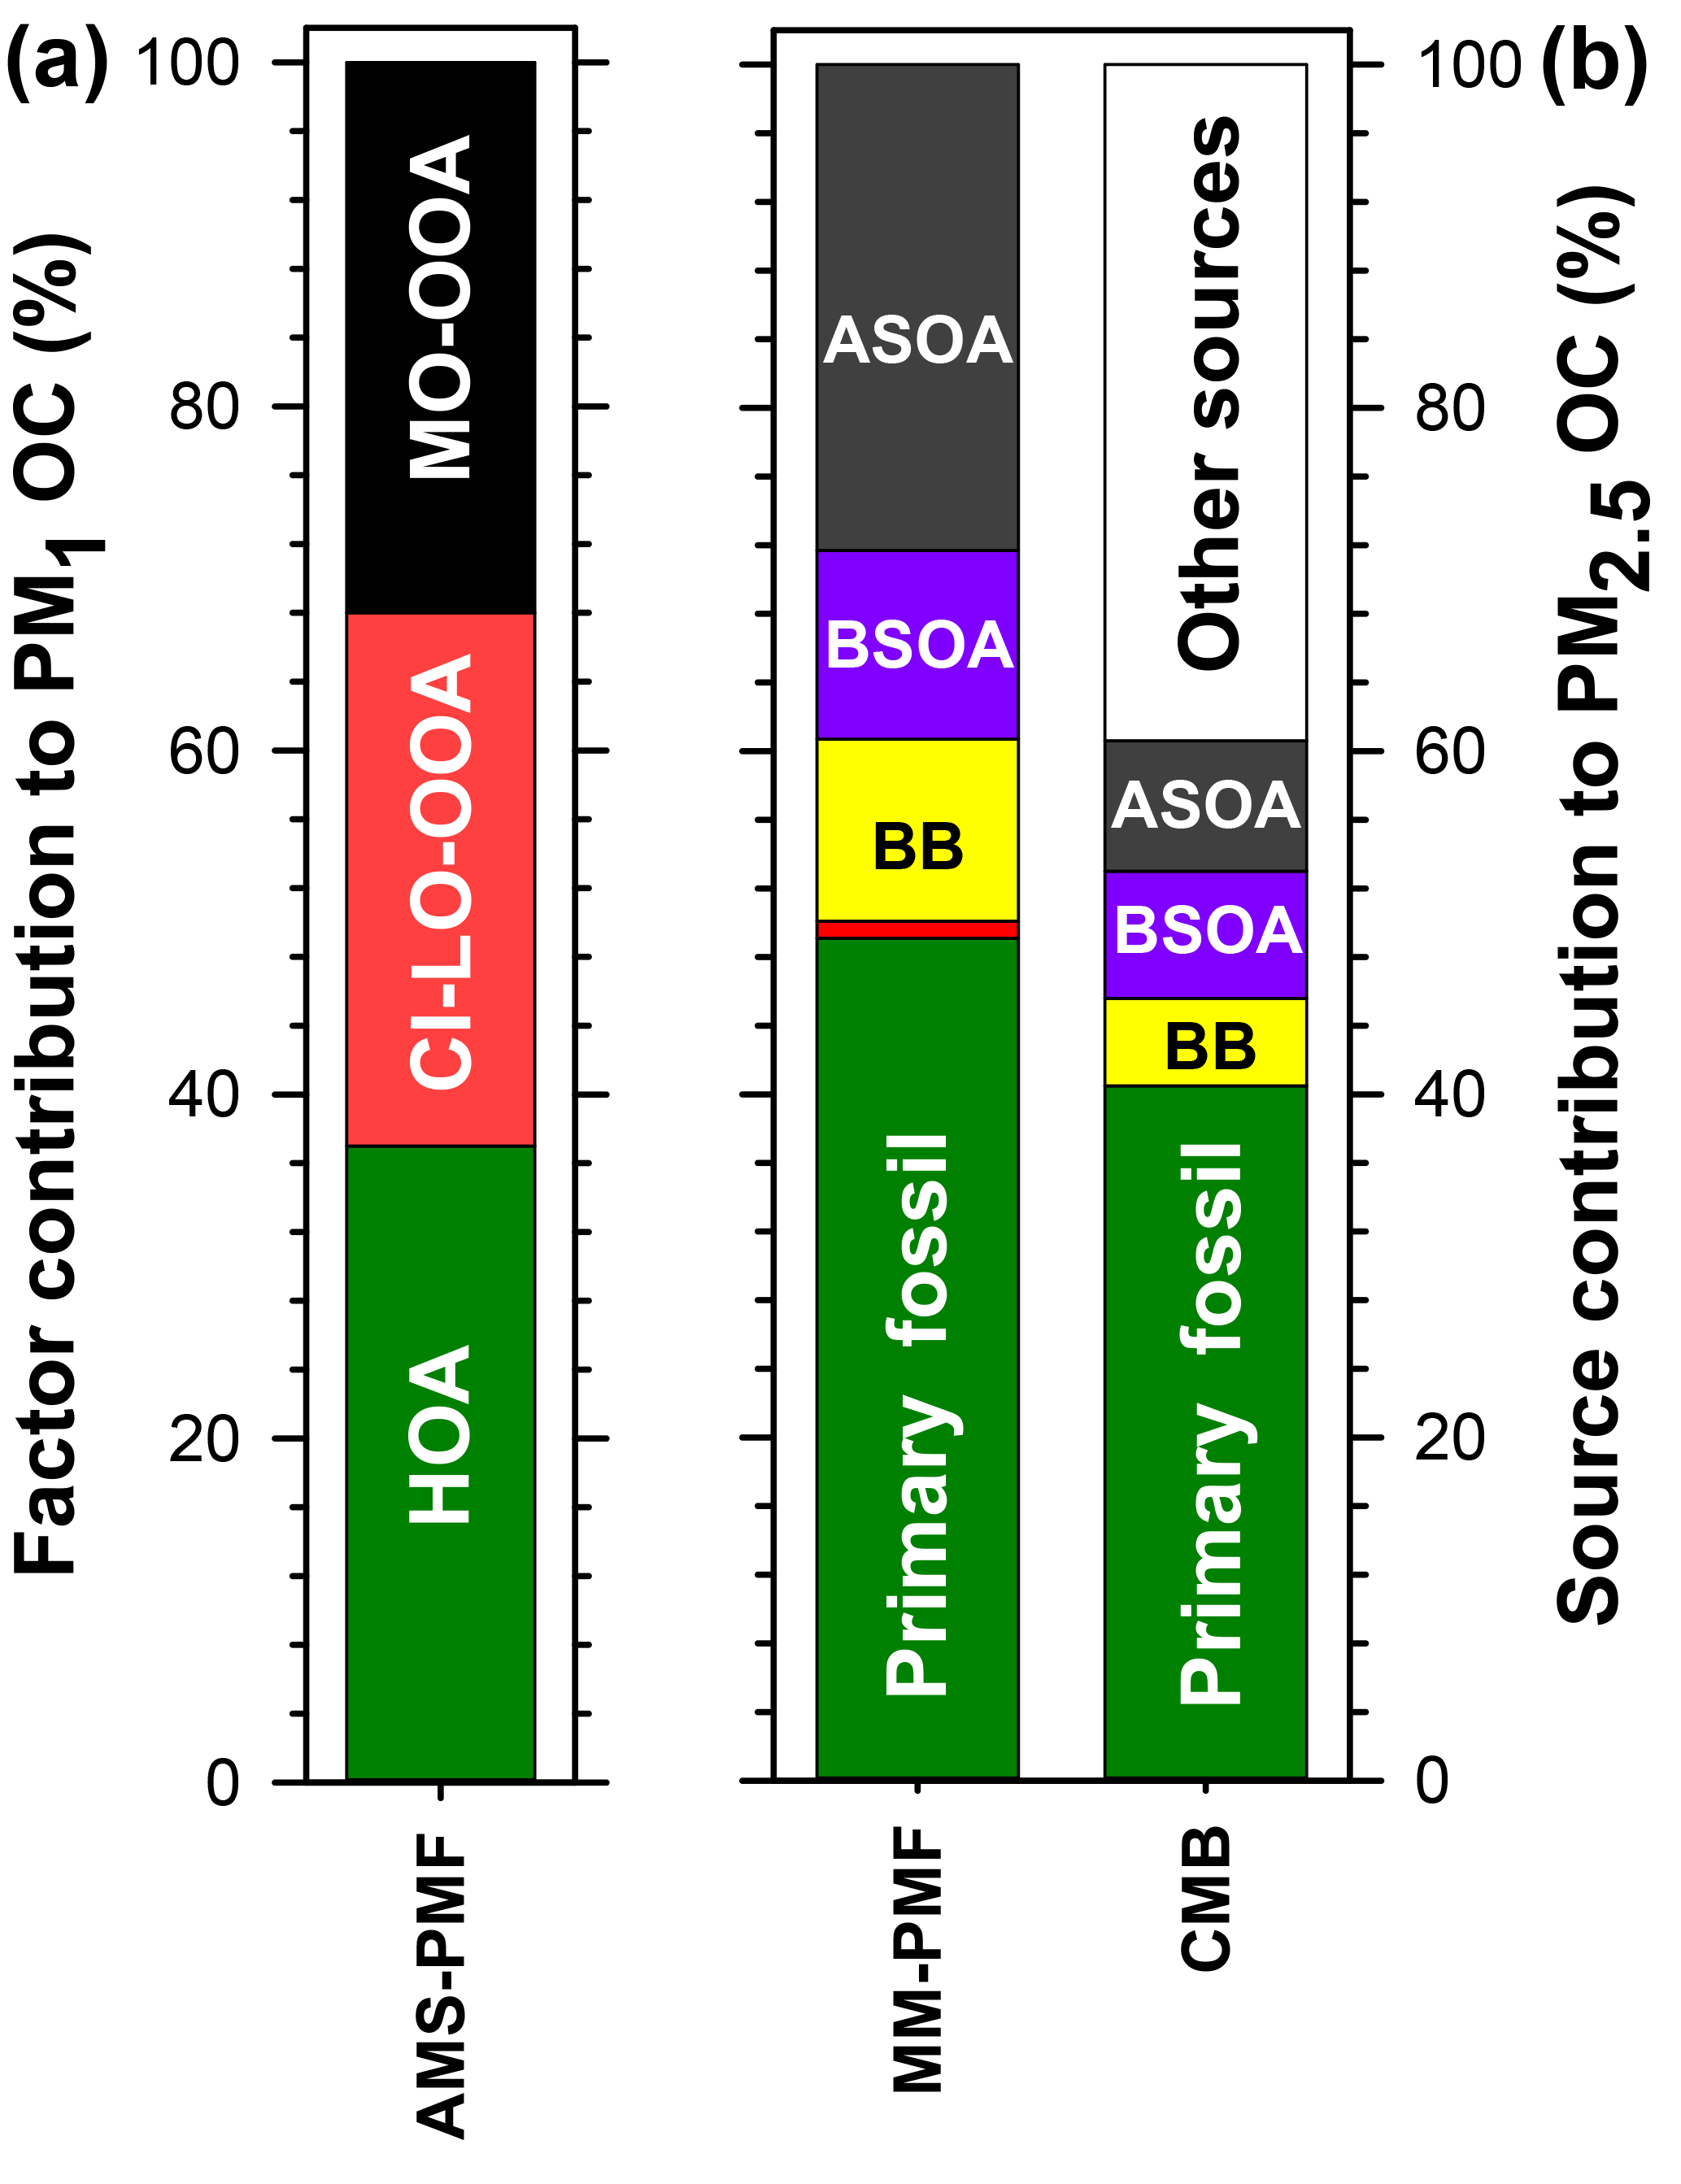
Figure 9Summary of the average source contributions to PM OC at Clinton Drive determined for (a) NR-PM1 by AMS-PMF and (b) PM2.5 by MM-PMF and CMB, including primary fossil sources (green), biomass burning (BB; yellow), cooking (orange), biogenic secondary organic carbon (BSOA; purple), and anthropogenic secondary organic carbon (ASOA; dark grey). Numerical values presented in this figure are summarized in Table 5.
The high-NOx anthropogenic SOA factor contributed 7 % of OC on average (0.12 µgC m−3). The key chemical species apportioned to this factor include 4-methyl-2-nitrophenol (74 %), DHOPA (48 %), and 2-methylglyceric acid (54 %). 4-Methyl-2-nitrophenol forms by the photooxidation of monoaromatic compounds such as toluene, p-xylene, and p-ethyltoluene in the presence of NOx (Forstner et al., 1997). Similarly, DHOPA is formed by photooxidation of toluene under high-NOx conditions (Kleindienst et al., 2007). 2-Methylglyceric acid forms from methacrolein (MACR) in the presence of NOx; MACR can form by the oxidation of isoprene (Nguyen et al., 2015) or can be directly emitted from vehicles (Park et al., 2011), making it either biogenic or anthropogenic, respectively. Vehicle emissions are expected to be the major source of MACR in an urban site located close to the HSC (Park et al., 2011), suggesting that 2-methylglyceric acid in HSC is likely to originate from anthropogenic sources. This factor identification is further supported by its high positive correlation with CMB-monoaromatic SOA (r=0.754, p<0.001).
The factor identified as low-NOx anthropogenic SOA contributed 22 % of OC on average (0.41 µgC m−3). The key species apportioned to this factor include phthalic acid (38 %), 4-methylphthalic acid (43 %), terephthalic acid (42 %), and 4-nitrophenol (36 %). Phthalic acid and 4-methylphthalic acid are recommended as SOA tracers for naphthalene and methylnaphthalene, respectively (Al-Naiema and Stone, 2017). Nitrophenols have also been detected during the photooxidation of PAHs (Kautzman et al., 2010). In addition, this factor moderately and positively correlates with CMB-naphthalene SOA (r=0.510, p<0.001). EC is also present in this factor, suggesting some mixing of this factor with combustion sources. Such mixing likely arises from VOCs and precursors of oxidants co-emitted with EC from combustion contributing to SOA formation. However, the predominance of secondary organic markers over signatures of primary emissions suggests that this factor primarily represents SOA. The SOA tracer method estimate of naphthalene SOA in CMB accounts for only 22 % of this factor, suggesting that the SOA tracer method underestimates the extent of low-NOx anthropogenic SOA based on phthalic acid concentrations alone and/or that this factor contains SOA from other VOC precursors. In addition to naphthalene, several laboratory studies have shown that n-alkanes, lighter aromatics, and other PAHs, which are mainly emitted from fossil fuel combustion and industries, also contribute to SOA (Chan et al., 2009; Gentner et al., 2012; Zhang and Ying, 2012). Further identification and quantification of anthropogenic SOA tracers from other VOC precursors would improve the ability of the MM-PMF to more broadly capture the magnitude of anthropogenic SOA.
Table 5Summary of the average source contributions to OC (%) for each of the three source apportionment models. Missing values correspond to sources that were either not included in the model (i.e. CMB) or not resolved by the model (i.e. PMF). Contributions of PM1 factors to OC were estimated from the OA contributions and OM : OC ratios for each factor (Fig. 4).
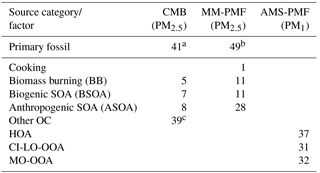
a Primary fossil sources from the CMB model were calculated as the sum of diesel engines, gasoline engines, and ship emissions. b Primary fossil sources of MM-PMF were calculated as the sum of diesel engines, gasoline engines, nontailpipe emissions, and ship emissions. c Other OC sources in CMB represent the fraction of OC that was not apportioned by the CMB model. In the absence of unidentified primary sources in CMB, other OC represents SOA.
3.5 Source apportionment of fine organic aerosol in HSC: a three-method approach
Herein, source apportionment results obtained from AMS-PMF for PM1 OC (converted from OA using OM : OC ratios in Fig. 4), and PM2.5 OC by MM-PMF and CMB models are integrated (Table 5 and Fig. 9) with consideration of the strengths and weaknesses of each approach. The contribution from primary fossil sources are defined as the sum of contributions of diesel engines, gasoline engines, and ship emissions from CMB (41 %), the sum of the three aforementioned sources with nontailpipe vehicle emissions from MM-PMF (49 %) and the HOA factor from AMS-PMF (37 %). A similar contribution from primary fossil sources to PM2.5 OC (36 %) was reported by Buzcu et al. (2006) in Houston near the HSC area during a nonwood smoke event. HOA resolved in AMS-PMF correlated highly with OC from diesel engines in MM-PMF (r=0.824, p<0.001) and CMB (r=0.890, p<0.001) and correlated moderately with OC from gasoline engines (r=0.645, p<0.001) and ship emissions (r=0.696, p<0.001) in CMB. These correlations indicate temporal consistency among the fossil sources of OC and the percentage contributions to OC indicate that the three models resolved a consistent fossil contribution to organic aerosol. Further, the models agree that motor vehicle emissions are the major contributor to fossil-fuel-derived organic aerosol, making them the dominant primary PM source in HSC. The agreement of the three models discussed here along with the results obtained from previous studies indicate a good understanding for primary fossil sources in Houston. Because motor vehicles also emit precursors to SOA such as alkanes, light aromatics, and PAHs (Gentner et al., 2012), they likely contribute to anthropogenic SOA.
Biomass burning contributions to OC were small in comparison to fossil sources. AMS-PMF did not resolve a BB factor, likely due to the inclusion of BB in the CI-LO-OOA factor. The presence of BB in the CI-LO-OOA factor is supported by the significant although low correlation with CMB BB (r=0.380, p=0.038), the moderate correlation between the time series of this factor and m∕z 60 (r=0.67), and the fraction of m∕z 60 (f60) in CI-LO-OOA. This fraction (f60=0.003) is the largest among the retained AMS-PMF factors but falls at the lower edge of the BB influence value defined by Gilardoni et al. (2016), indicating likely association between CI-LO-OOA and BB. CMB apportioned 5 % of OC to BB. Because the CMB model utilized a BB profile collected near the source emissions, this value represents primary BB emissions. The selected source profile of open burning of pine forests (Lee et al., 2005) was considered to be the most representative of the available profiles because BB influences on Houston were traced back to open burning in the Yucatán Peninsula of Mexico (Figs. S7, S8). Importantly, the open burning profile has a relatively low levoglucosan-to-OC ratio compared to other BB profiles (Stone et al., 2009), making it an upper estimate of BB contributions to OC. MM-PMF apportioned 11 % of OC to BB; this value is expected to include both primary and secondary aerosol associated with BB. Evidence of SOA from BB is indicated by the similarities in the MM-PMF BB factor profile BB and aged BB plumes (Sect. 3.4.2). The difference between the estimates of primary and secondary BB organic aerosol (by MM-PMF) and primary BB organic aerosol (CMB) is used to estimate the magnitude of BB-derived SOA at an average of 6 % of OC. The combination of CMB and MM-PMF provides separate estimates of primary and secondary BB contributions to OC, which cannot be resolved using either model alone. The BB SOA estimate is considered to be a best-estimate with the available dataset, but contains uncertainties both from the MM-PMF and CMB estimates. Strategies to reduce the relative uncertainty associated with this source include using a larger number of observations and/or more specific BB SOA tracers in MM-PMF.
Cooking was determined to have a minor but uncertain contribution to PM2.5. By MM-PMF, cooking was found to contribute to 1 % of PM2.5 OC, but with a large relative uncertainty (Fig. S10). The large relative error reflects the high degree of uncertainty in the estimation of this source contribution. Although AMS-PMF did not resolve a cooking factor, AMS signatures of cooking and CI-LO-OOA correlated significantly, suggesting a cooking influence on this factor. The cooking contribution to CI-LO-OOA and OA, however, could not be resolved. Some degree of cooking influence on OA in Houston is expected due to the ubiquity of this source and its importance in the HSC area under northerly winds (Wallace et al., 2018). The predominately southerly winds during this study (Fig. S4) were associated with relatively small source contributions from cooking. Large variabilities across different studies are expected based on the sampling proximity to cooking sources and the prevailing wind direction. Cooking remains a difficult source to evaluate with receptor-based source apportionment models that require either fixed source profiles (in the case of CMB) or that resolve factors with consistent chemical composition (in the case of PMF). Cooking contributions are estimated by receptor-based models by way of a few molecular markers or AMS-signatures that may not represent the diversity of cooking activities that occur within an airshed. Consequently, these models cannot capture the inherent diurnal and spatial variability of cooking emissions. A better understanding of the variability of cooking emissions and model constraints are needed to lower uncertainties associated with contributions of cooking to ambient PM2.5 organic aerosol.
Biogenic SOA was estimated to contribute up to 11 % of organic aerosol. Among biogenic precursors to SOA, isoprene was determined to have the largest contribution. By MM-PMF isoprene SOA contributed 11 % of PM2.5 OC. This value is similar in magnitude to the 7 % of PM2.5 OC attributed to isoprene SOA by CMB that relied upon the isoprene tracer-to-OC ratios observed in chamber experiments (Kleindienst et al., 2007), indicating good agreement between these two approaches. The OC contribution estimated by PMF is expected to be more reliable for the Houston airshed, as it was derived from ambient measurements within the HSC. In contrast, CMB relies upon tracer-to-OC ratios observed in the laboratory (Kleindienst et al., 2007), where reactant concentrations greatly exceeded those observed in the HSC (Fig. S4). In particular, chamber concentrations were approximately 10 times higher for NOx, 2–3 orders of magnitude higher for isoprene, and 3–4 orders of magnitude higher for toluene. Monoterpene SOA was found to be significantly lower, with a 0.5 % contribution of α-pinene to OC resolved by CMB. Monoterpene SOA was resolved by neither MM-PMF nor AMS-PMF, likely due to an overall small contribution to OC or a lack of tracers to accurately define this source. Although AMS-PMF did not resolve an isoprene OA factor, moderate correlations between CI-LO-OOA and CMB estimates of isoprene SOA (r=0.637, p<0.001) and MM-PMF estimates of isoprene SOA (r=0.626, p<0.001) suggest that biogenic SOA was grouped with this factor. At small contributions to OC, CMB can better distinguish monoterpene contributions to OC than multivariate models. Overall, the SOA contribution from biogenic precursors are estimated to be in the range of 11 % of OC but would be less if isoprene also has significant anthropogenic sources in this study domain (Fig. S9).
Anthropogenic SOA was identified as a major contributor to organic aerosol. By MM-PMF, two anthropogenic SOA factors were resolved: low-NOx anthropogenic SOA (21.7 %) and high-NOx anthropogenic SOA (6.6 %). The former source contribution is considered to be stable with >80 % of bootstraps matched, while the latter has a larger relative uncertainty with 67 % of bootstraps matched (Table S7). MM-PMF holds the advantage of identifying anthropogenic SOA for several reasons. First, these estimates are based on molecular tracers selective to this source (Al-Naiema and Stone, 2017). Second, these estimates were developed from ambient measurements within the HSC airshed and are considered to be the best representation of anthropogenic SOA in this location. Unlike CMB, MM-PMF requires neither a priori knowledge of tracer-to-OC ratios nor the assumption that these ratios are constant across chamber experiments and the study site. Third, by analyzing the co-variation of species over time, MM-PMF can capture anthropogenic SOA from other precursors that co-vary in time, even if they have a different precursor and are not defined by tracers in the source apportionment model (e.g., alkanes).
Nonetheless, CMB results support that anthropogenic SOA is an important source of OC in the HSC. Using available profiles for anthropogenic SOA in CMB, 3 % of OC was attributed to monoaromatic-derived SOA (e.g., benzene, toluene) and 5 % was attributed to naphthalene-derived SOA. Larger SOA contributions from PAHs compared to monoaromatic precursors agrees with controlled chamber photo-oxidation of diesel exhaust, in which PAH-derived SOA was estimated to account for up to 54 % to the total SOA mass formed in the first 12 h of oxidation (Chan et al., 2009). The total PAH contribution to SOA in HSC is expected to be larger, since other 2- to 3-ring PAHs with SOA-forming potential (Shakya and Griffin, 2010) are co-emitted with naphthalene; however, molecular tracers for larger PAH oxidation products are not yet defined, so the associated OC is unapportioned by the CMB model. Because the CMB-based estimate of anthropogenic SOA is limited to two classes of VOC precursors – aromatics and naphthalene derivatives – for which SOA profiles are available, it is considered to be only a partial estimate of anthropogenic SOA. Anthropogenic SOA from other precursors contribute to the CMB unapportioned OC. The CMB estimates of aromatic and naphthalene-derived SOA is valuable, however, because it provides specificity in the relative and absolute source contributions for these VOC classes.
The AMS-PMF MO-OOA factor that accounts for an average of 32 % of PM1 OC is expected to be influenced by anthropogenic SOA based on the correlation observed with high-NOx anthropogenic SOA in MM-PMF (r=0.515, p=0.004). The MM-PMF and CMB methods that rely on specific tracers overcome the AMS limitation of being unable to distinguish between anthropogenic and biogenic origins of SOA in the absence of a strong signal that can identify a specific VOC precursor (Wallace et al., 2018; Xu et al., 2015). Relying on MM-PMF as the best estimate of anthropogenic SOA, we estimate that this source contributes an average of 28 % of PM2.5 OC, making it a major aerosol source in HSC second only to primary fossil fuel emissions. Led by MM-PMF and supported by CMB and AMS-PMF, these results reveal the important contributions of anthropogenic SOA to PM2.5 OC in the HSC area of Houston.
Comprehensive chemical analysis of fine PM in the HSC indicated a large contribution from sulfate and carbonaceous aerosol, as evidenced by offline filter-based measurements of PM2.5 and in situ analysis of NR-PM1. The novel combination of three source apportionment models (CMB, MM-PMF, and AMS-PMF) with statistical analyses provides a robust prediction of sources of OC, as well as the relative abundances of biogenic and anthropogenic SOA and the pathways by which they form. Together, these models were used to estimate primary sources of OC that included fossil sources (37 %–49 %), BB (5 %), and cooking (1 %). Prior studies recognized the large contribution from primary fossil sources to PM2.5 in the HSC, but did not define sources of SOA. Here we show that secondary aerosols from anthropogenic origins contribute 28 % of OC and largely originate from precursors emitted from primary fossil sources. Anthropogenic SOA is among the largest sources of PM2.5 OC near the HSC, while other SOA precursors – biogenic VOCs (11 %) and BB (6 %) – have smaller contributions in comparison. Constraining the amount of SOA from BB and anthropogenic SOA is particularly significant because these two source categories have previously been difficult to estimate using one source apportionment method.
MM-PMF is a useful approach for estimating source contributions to OC and PM2.5, particularly when source profiles for sources are not available or are not well defined, which is often the case for SOA. In order to apportion anthropogenic SOA, it is necessary to explicitly include anthropogenic SOA tracers as fitting species in the PMF model. Initial guidance on anthropogenic SOA tracer selection was drawn from Al-Naiema and Stone (2017). In this study, to track anthropogenic SOA formed from aromatic VOCs under high NOx conditions, 4-methyl-2-nitrophenol and DHOPA served as key tracers. For PAH-derived SOA, key tracers were 4-nitrophenol, phthalic acid for naphthalene-derived SOA, and 4-methylphtalic acid for methylnaphthalene SOA. In prior MM-PMF studies in France, oxy-PAH and nitro-PAH have been useful in tracing SOA derived from larger PAHs (Srivastava et al., 2018a; Srivastava et al., 2018b). The utilized tracers should be expanded as anthropogenic SOA becomes more chemically defined. In particular, molecular tracers are needed for recognized SOA precursors that include other aromatic compounds, n-alkanes, alcohols, and PAHs (beyond naphthalene and its derivatives). While few biogenic SOA tracers were detected in HSC, 2-methylerythritol and 2-methylthreitol were valuable in identifying the isoprene SOA factor. Caution should be used in the use of 2-methylglyceric acid that is a high-NOx SOA product formed from MACR that can come from biogenic or anthropogenic origins; while plants are the major source of isoprene globally, motor vehicles contribute the majority of the MACR in urban Houston (Park et al., 2011). Similarly, SOA from BB was identified by way of isopthalic acid and cis-pinonic acid, consistent with aged BB emissions documented in the literature (Yan et al., 2008); however, these compounds can also have other sources, such as primary emissions and monoterpene-derived SOA, respectively. Phenolic oxidation associated with BB SOA has also been identified using methyl-nitrocatechols (Srivastava et al., 2018a, 2018b). To better define BB and anthropogenic SOA, future efforts should be placed on identifying and quantifying molecular markers to identify the specific precursors and pathways responsible for SOA formation. Better definition of the molecular profiles of anthropogenic and BB SOA will support CMB-based methods and aid in the interpretation of MM-PMF results. The analytical approaches and source apportionment methods presented herein can be applied elsewhere to develop a better understanding of BB and anthropogenic VOCs to SOA. Combining multiple source apportionment techniques overcomes limitations of using these receptor models in isolation. For instance, BB SOA contributions to organic aerosol can be estimated by subtracting primary BB estimated by CMB from the sum of primary and secondary BB from MM-PMF. This method is expected to be accurate when the chemical nature of the primary biomass emissions is known and a representative chemical profile is used. This approach can overcome previous limitations on constraining BB-derived SOA, which was challenged by the large number and variability of its precursors and the lack of knowledge of its major SOA products. The methodological approach presented here can be used to gain insight into sources of PM2.5, particularly SOA derived from BB and anthropogenic VOCs, in diverse urban environments. Knowledge of primary and secondary PM sources can inform strategies to manage urban air quality, particularly in areas that exceed air quality standards or guidelines.
Replication data for this article are available in the Harvard Dataverse (https://doi.org/10.7910/DVN/NVMC5P; Al-Naiema et al., 2018).
The supplement related to this article is available online at: https://doi.org/10.5194/acp-18-15601-2018-supplement.
IMAN and JK deployed the filter sampler. JK analyzed inorganic ions and estimated aerosol acidity. IMAN and CJM analyzed organic species. IMAN performed statistical analysis. APSH led MM-PMF. EAS conducted CMB modeling and oversaw the aforementioned efforts. All University of Iowa authors contributed to data interpretation. HWW, BKC, and AATB led AMS deployment and initial data analysis and assisted with field deployment of filter samplers. NPS led AMS-PMF. RJG oversaw both of these efforts. All Rice University authors contributed to AMS analysis and interpretation. All authors contributed to writing of appropriate sections of the paper.
The authors declare that they have no conflict of interest.
This research was supported by the National Science Foundation (NSF) through
AGS grant number 1405014. We thank the Texas Commission on Environmental
Quality and City of Houston for access to the Clinton Drive monitoring site.
The Rice University group acknowledges funding from the Houston Endowment,
the assistance of collaborators from the University of Houston, and Loredana
Suciu for assistance in changing filters.
Edited by: Jacqui Hamilton
Reviewed by: two anonymous referees
Agrawal, H., Welch, W. A., Henningsen, S., Miller, J. W., and Cocker, D. R.: Emissions from main propulsion engine on container ship at sea, J. Geophys. Res., 115, D23205, https://doi.org/10.1029/2009jd013346, 2010.
Aiken, A. C., DeCarlo, P. F., Kroll, J. H., Worsnop, D. R., Huffman, J. A., Docherty, K. S., Ulbrich, I. M., Mohr, C., Kimmel, J. R., Sueper, D., Sun, Y., Zhang, Q., Trimborn, A., Northway, M., Ziemann, P. J., Canagaratna, M. R., Onasch, T. B., Alfarra, M. R., Prevot, A. S. H., Dommen, J., Duplissy, J., Metzger, A., Baltensperger, U., and Jimenez, J. L.: O/C and OM/OC ratios of primary, secondary, and ambient organic aerosols with high-resolution time-of-flight aerosol mass spectrometry, Environ. Sci. Technol., 42, 4478–4485, https://doi.org/10.1021/es703009q, 2008.
Aiken, A. C., Salcedo, D., Cubison, M. J., Huffman, J. A., DeCarlo, P. F., Ulbrich, I. M., Docherty, K. S., Sueper, D., Kimmel, J. R., Worsnop, D. R., Trimborn, A., Northway, M., Stone, E. A., Schauer, J. J., Volkamer, R. M., Fortner, E., de Foy, B., Wang, J., Laskin, A., Shutthanandan, V., Zheng, J., Zhang, R., Gaffney, J., Marley, N. A., Paredes-Miranda, G., Arnott, W. P., Molina, L. T., Sosa, G., and Jimenez, J. L.: Mexico City aerosol analysis during MILAGRO using high resolution aerosol mass spectrometry at the urban supersite (T0) – Part 1: Fine particle composition and organic source apportionment, Atmos. Chem. Phys., 9, 6633–6653, https://doi.org/10.5194/acp-9-6633-2009, 2009.
Al-Naiema, I. M. and Stone, E. A.: Evaluation of anthropogenic secondary organic aerosol tracers from aromatic hydrocarbons, Atmos. Chem. Phys., 17, 2053–2065, https://doi.org/10.5194/acp-17-2053-2017, 2017.
Al-Naiema, I. M., Hettiyadura, A. P. S., Wallace, H. W., Sanchez, N. P., Madler, C. J., Cevik, B. K., Bui, A. A. T., Kettler, J., and Griffin, R. J.: Replication data for: Source apportionment of fine particulate matter in Houston, Texas: Insights to secondary organic aerosols, https://doi.org/10.7910/DVN/NVMC5P, 2018.
Ayers, G. P., Keywood, M. D., and Gras, J. L.: TEOM vs. manual gravimetric methods for determination of PM2.5 aerosol mass concentrations, Atmos. Environ., 33, 3717–3721, https://doi.org/10.1016/S1352-2310(99)00125-9, 1999.
Belis, C. A., Karagulian, F., Larsen, B. R., and Hopke, P. K.: Critical review and meta-analysis of ambient particulate matter source apportionment using receptor models in Europe, Atmos. Environ., 69, 94–108, https://doi.org/10.1016/j.atmosenv.2012.11.009, 2013.
Brown, S. S., Dubé, W. P., Bahreini, R., Middlebrook, A. M., Brock, C. A., Warneke, C., de Gouw, J. A., Washenfelder, R. A., Atlas, E., Peischl, J., Ryerson, T. B., Holloway, J. S., Schwarz, J. P., Spackman, R., Trainer, M., Parrish, D. D., Fehshenfeld, F. C., and Ravishankara, A. R.: Biogenic VOC oxidation and organic aerosol formation in an urban nocturnal boundary layer: aircraft vertical profiles in Houston, TX, Atmos. Chem. Phys., 13, 11317–11337, https://doi.org/10.5194/acp-13-11317-2013, 2013.
Brown, S. G., Eberly, S., Paatero, P., and Norris, G. A.: Methods for estimating uncertainty in PMF solutions: Examples with ambient air and water quality data and guidance on reporting PMF results, Sci. Total Environ., 518–519, 626–635, https://doi.org/10.1016/j.scitotenv.2015.01.022, 2015.
Budisulistiorini, S. H., Li, X., Bairai, S. T., Renfro, J., Liu, Y., Liu, Y. J., McKinney, K. A., Martin, S. T., McNeill, V. F., Pye, H. O. T., Nenes, A., Neff, M. E., Stone, E. A., Mueller, S., Knote, C., Shaw, S. L., Zhang, Z., Gold, A., and Surratt, J. D.: Examining the effects of anthropogenic emissions on isoprene-derived secondary organic aerosol formation during the 2013 Southern Oxidant and Aerosol Study (SOAS) at the Look Rock, Tennessee ground site, Atmos. Chem. Phys., 15, 8871–8888, https://doi.org/10.5194/acp-15-8871-2015, 2015.
Buzcu, B., and Fraser, M. P.: Source identification and apportionment of volatile organic compounds in Houston, TX, Atmos. Environ., 40, 2385–2400, https://doi.org/10.1016/j.atmosenv.2005.12.020, 2006.
Buzcu, B., Yue, Z., Fraser, M., Nopmongcol, U., and Allen, D.: Secondary particle formation and evidence of heterogeneous chemistry during a wood smoke episode in Texas, J. Geophys. Res., 111, D10S13, https://doi.org/10.1029/2005JD006143, 2006.
Cao, J. J., Lee, S. C., Ho, K. F., Zou, S. C., Fung, K., Li, Y., Watson, J. G., and Chow, J. C.: Spatial and seasonal variations of atmospheric organic carbon and elemental carbon in Pearl River Delta Region, China, Atmos. Environ., 38, 4447–4456, https://doi.org/10.1016/j.atmosenv.2004.05.016, 2004.
Cao, L.-M., Huang, X.-F., Li, Y.-Y., Hu, M., and He, L.-Y.: Volatility measurement of atmospheric submicron aerosols in an urban atmosphere in southern China, Atmos. Chem. Phys., 18, 1729–1743, https://doi.org/10.5194/acp-18-1729-2018, 2018.
Chan, A. W. H., Kautzman, K. E., Chhabra, P. S., Surratt, J. D., Chan, M. N., Crounse, J. D., Kürten, A., Wennberg, P. O., Flagan, R. C., and Seinfeld, J. H.: Secondary organic aerosol formation from photooxidation of naphthalene and alkylnaphthalenes: implications for oxidation of intermediate volatility organic compounds (IVOCs), Atmos. Chem. Phys., 9, 3049–3060, https://doi.org/10.5194/acp-9-3049-2009, 2009.
Christoffersen, T., Hjorth, J., Horie, O., Jensen, N., Kotzias, D., Molander, L., Neeb, P., Ruppert, L., Winterhalter, R., and Virkkula, A.: cis-Pinic acid, a possible precursor for organic aerosol formation from ozonolysis of α-pinene, Atmos. Environ., 32, 1657–1661, https://doi.org/10.1016/S1352-2310(97)00448-2, 1998.
Cleveland, M. J., Ziemba, L. D., Griffin, R. J., Dibb, J. E., Anderson, C. H., Lefer, B., and Rappengluck, B.: Characterization of urban aerosol using aerosol mass spectrometry and proton nuclear magnetic resonance spectroscopy, Atmos. Environ., 54, 511–518, https://doi.org/10.1016/j.atmosenv.2012.02.074, 2012.
Crounse, J. D., DeCarlo, P. F., Blake, D. R., Emmons, L. K., Campos, T. L., Apel, E. C., Clarke, A. D., Weinheimer, A. J., McCabe, D. C., Yokelson, R. J., Jimenez, J. L., and Wennberg, P. O.: Biomass burning and urban air pollution over the Central Mexican Plateau, Atmos. Chem. Phys., 9, 4929–4944, https://doi.org/10.5194/acp-9-4929-2009, 2009.
DeCarlo, P. F., Kimmel, J. R., Trimborn, A., Northway, M. J., Jayne, J. T., Aiken, A. C., Gonin, M., Fuhrer, K., Horvath, T., and Docherty, K. S.: Field-deployable, high-resolution, time-of-flight aerosol mass spectrometer, Anal. Chem., 78, 8281–8289, https://doi.org/10.1021/ac061249n, 2006.
Dechapanya, W., Russell, M., and Allen, D. T.: Estimates of anthropogenic secondary organic aerosol formation in Houston, Texas, Aerosol Sci. Technol., 38, 156–166, https://doi.org/10.1080/02786820390229462, 2004.
Docherty, K. S., Aiken, A. C., Huffman, J. A., Ulbrich, I. M., DeCarlo, P. F., Sueper, D., Worsnop, D. R., Snyder, D. C., Peltier, R. E., Weber, R. J., Grover, B. D., Eatough, D. J., Williams, B. J., Goldstein, A. H., Ziemann, P. J., and Jimenez, J. L.: The 2005 Study of Organic Aerosols at Riverside (SOAR-1): instrumental intercomparisons and fine particle composition, Atmos. Chem. Phys., 11, 12387–12420, https://doi.org/10.5194/acp-11-12387-2011, 2011.
Donahue, N. M., Robinson, A. L., Stanier, C. O., and Pandis, S. N.: Coupled partitioning, dilution, and chemical aging of semivolatile organics, Environ. Sci. Technol., 40, 2635–2643, 10.1021/es052297c, 2006.
Duncan, B. N., Martin, R. V., Staudt, A. C., Yevich, R., and Logan, J. A.: Interannual and seasonal variability of biomass burning emissions constrained by satellite observations, J. Geophys. Res., 108, 1–22, https://doi.org/10.1029/2002JD002378, 2003.
Elser, M., Huang, R.-J., Wolf, R., Slowik, J. G., Wang, Q., Canonaco, F., Li, G., Bozzetti, C., Daellenbach, K. R., Huang, Y., Zhang, R., Li, Z., Cao, J., Baltensperger, U., El-Haddad, I., and Prévôt, A. S. H.: New insights into PM2.5 chemical composition and sources in two major cities in China during extreme haze events using aerosol mass spectrometry, Atmos. Chem. Phys., 16, 3207–3225, https://doi.org/10.5194/acp-16-3207-2016, 2016.
EPA-PMF: Positive matrix factorization (PMF) 5.0 Fundamentals and User Guide, available at: https://www.epa.gov/sites/production/files/2015-02/documents/pmf_5.0_user_guide.pdf (last access: 10 October 2018), 2014.
Foley, K. M., Roselle, S. J., Appel, K. W., Bhave, P. V., Pleim, J. E., Otte, T. L., M athur, R., Sarwar, G., Young, J. O., Gilliam, R. C., Nolte, C. G., Kelly, J. T., Gilliland, A. B., and Bash, J. O.: Incremental testing of the Community Multiscale Air Quality (CMAQ) modeling system version 4.7, Geosci. Model Dev., 3, 205–226, https://doi.org/10.5194/gmd-3-205-2010, 2010.
Forstner, H. J. L., Flagan, R. C., and Seinfeld, J. H.: Secondary organic aerosol from the photooxidation of aromatic hydrocarbons: Molecular composition, Environ. Sci. Technol., 31, 1345–1358, https://doi.org/10.1021/es9605376, 1997.
Fraser, M. P., Yue, Z. W., Tropp, R. J., Kohl, S. D., and Chow, J. C.: Molecular composition of organic fine particulate matter in Houston, TX, Atmos. Environ., 36, 5751–5758, https://doi.org/10.1016/S1352-2310(02)00725-2, 2002.
Fraser, M. P., Yue, Z. W., and Buzcu, B.: Source apportionment of fine particulate matter in Houston, TX, using organic molecular markers, Atmos. Environ., 37, 2117–2123, https://doi.org/10.1016/s1352-2310(03)00075-x, 2003.
Friese, E. and Ebel, A.: Temperature dependent dhermodynamic model of the system H+-NH4+-Na+---Cl–H2O, J. Phys. Chem. A, 114, 11595–11631, https://doi.org/10.1021/jp101041j, 2010.
Gentner, D. R., Isaacman, G., Worton, D. R., Chan, A. W., Dallmann, T. R., Davis, L., Liu, S., Day, D. A., Russell, L. M., and Wilson, K. R.: Elucidating secondary organic aerosol from diesel and gasoline vehicles through detailed characterization of organic carbon emissions, P. Natl. Acad. Sci. USA, 109, 18318–18323, https://doi.org/10.1073/pnas.1212272109, 2012.
Gilardoni, S., Massoli, P., Paglione, M., Giulianelli, L., Carbone, C., Rinaldi, M., Decesari, S., Sandrini, S., Costabile, F., Gobbi, G.P., Pietrogrande, M. C., Visentin, M., Scotto, F., Fuzzi, S., Facchini, M.C., Direct observation of aqueous secondary organic aerosol from biomass-burning emissions, P. Natl. Acad. Sci. USA, 113, 10013–10018. https://doi.org/10.1073/pnas.1602212113, 2016.
Goldstein, A. H. and Galbally, I. E.: Known and unexplored organic constituents in the earth's atmosphere, Environ. Sci. Technol., 41, 1514–1521, https://doi.org/10.1021/es072476p, 2007.
Guo, H., Xu, L., Bougiatioti, A., Cerully, K. M., Capps, S. L., Hite Jr., J. R., Carlton, A. G., Lee, S.-H., Bergin, M. H., Ng, N. L., Nenes, A., and Weber, R. J.: Fine-particle water and pH in the southeastern United States, Atmos. Chem. Phys., 15, 5211–5228, https://doi.org/10.5194/acp-15-5211-2015, 2015.
Hallquist, M., Wenger, J. C., Baltensperger, U., Rudich, Y., Simpson, D., Claeys, M., Dommen, J., Donahue, N. M., George, C., Goldstein, A. H., Hamilton, J. F., Herrmann, H., Hoffmann, T., Iinuma, Y., Jang, M., Jenkin, M. E., Jimenez, J. L., Kiendler-Scharr, A., Maenhaut, W., McFiggans, G., Mentel, Th. F., Monod, A., Prévôt, A. S. H., Seinfeld, J. H., Surratt, J. D., Szmigielski, R., and Wildt, J.: The formation, properties and impact of secondary organic aerosol: current and emerging issues, Atmos. Chem. Phys., 9, 5155–5236, https://doi.org/10.5194/acp-9-5155-2009, 2009.
Harrison, M. A. J., Barra, S., Borghesi, D., Vione, D., Arsene, C., and Olariu, R. L.: Nitrated phenols in the atmosphere: a review, Atmos. Environ., 39, 231–248, https://doi.org/10.1016/j.atmosenv.2004.09.044, 2005.
Hennigan, C. J., Izumi, J., Sullivan, A. P., Weber, R. J., and Nenes, A.: A critical evaluation of proxy methods used to estimate the acidity of atmospheric particles, Atmos. Chem. Phys., 15, 2775–2790, https://doi.org/10.5194/acp-15-2775-2015, 2015.
Henze, D. K., Seinfeld, J. H., Ng, N. L., Kroll, J. H., Fu, T.-M., Jacob, D. J., and Heald, C. L.: Global modeling of secondary organic aerosol formation from aromatic hydrocarbons: high- vs. low-yield pathways, Atmos. Chem. Phys., 8, 2405–2420, https://doi.org/10.5194/acp-8-2405-2008, 2008.
Hettiyadura, A. P. S., Xu, L., Jayarathne, T., Skog, K., Guo, H., Weber, R. J., Nenes, A., Keutsch, F. N., Ng, N. L., and Stone, E. A.: Source apportionment of organic carbon in Centreville, AL using organosulfates in organic tracer-based positive matrix factorization, Atmos. Environ., 186, 74–88, https://doi.org/10.1016/j.atmosenv.2018.05.007, 2018.
Hopke, P. K.: Review of receptor modeling methods for source apportionment, J. Air Waste Manage., 66, 237–259, https://doi.org/10.1080/10962247.2016.1140693, 2016.
Iinuma, Y., Böge, O., Gnauk, T., and Herrmann, H.: Aerosol-chamber study of the α-pinene/O3 reaction: Influence of particle acidity on aerosol yields and products, Atmos. Environ., 38, 761–773, https://doi.org/10.1016/j.atmosenv.2003.10.015, 2004.
Jaeckels, J. M., Bae, M.-S., and Schauer, J. J.: Positive matrix factorization (PMF) analysis of molecular marker measurements to quantify the sources of organic aerosols, Environ. Sci. Technol., 41, 5763–5769, https://doi.org/10.1021/es062536b, 2007.
Jayarathne, T., Rathnayake, C. M., and Stone, E. A.: Local source impacts on primary and secondary aerosols in the Midwestern United States, Atmos. Environ., 130, 74–83, https://doi.org/10.1016/j.atmosenv.2015.09.058, 2016.
Kaltsonoudis, C., Kostenidou, E., Louvaris, E., Psichoudaki, M., Tsiligiannis, E., Florou, K., Liangou, A., and Pandis, S. N.: Characterization of fresh and aged organic aerosol emissions from meat charbroiling, Atmos. Chem. Phys., 17, 7143–7155, https://doi.org/10.5194/acp-17-7143-2017, 2017.
Kaulfus, A. S., Nair, U., Jaffe, D., Christopher, S. A., and Goodrick, S.: Biomass burning smoke climatology of the United States: implications for particulate matter air quality, Environ. Sci. Technol., 51, 11731–11741, https://doi.org/10.1021/acs.est.7b03292, 2017.
Kautzman, K. E., Surratt, J. D., Chan, M. N., Chan, A. W. H., Hersey, S. P., Chhabra, P. S., Dalleska, N. F., Wennberg, P. O., Flagan, R. C., and Seinfeld, J. H.: Chemical composition of gas- and aerosol-phase products from the photooxidation of naphthalene, J. Phys. Chem. A, 114, 913–934, https://doi.org/10.1021/jp908530s, 2010.
Khalili, N. R., Scheff, P. A., and Holsen, T. M.: PAH source fingerprints for coke ovens, diesel and, gasoline engines, highway tunnels, and wood combustion emissions, Atmos. Environ., 29, 533–542, https://doi.org/10.1016/1352-2310(94)00275-P, 1995.
Kleindienst, T. E., Conver, T. S., McIver, C. D., and Edney, E. O.: Determination of secondary organic aerosol products from the photooxidation of toluene and their implications in ambient PM2.5, J. Atmos. Chem., 47, 79–100, 2004.
Kleindienst, T. E., Jaoui, M., Lewandowski, M., Offenberg, J. H., Lewis, C. W., Bhave, P. V., and Edney, E. O.: Estimates of the contributions of biogenic and anthropogenic hydrocarbons to secondary organic aerosol at a southeastern US location, Atmos. Environ., 41, 8288–8300, https://doi.org/10.1016/j.atmosenv.2007.06.045, 2007.
Kleindienst, T. E., Jaoui, M., Lewandowski, M., Offenberg, J. H., and Docherty, K. S.: The formation of SOA and chemical tracer compounds from the photooxidation of naphthalene and its methyl analogs in the presence and absence of nitrogen oxides, Atmos. Chem. Phys., 12, 8711–8726, https://doi.org/10.5194/acp-12-8711-2012, 2012.
Kroll, J. H. and Seinfeld, J. H.: Chemistry of secondary organic aerosol: Formation and evolution of low-volatility organics in the atmosphere, Atmos. Environ., 42, 3593–3624, https://doi.org/10.1016/j.atmosenv.2008.01.003, 2008.
Kroll, J. H., Donahue, N. M., Jimenez, J. L., Kessler, S. H., Canagaratna, M. R., Wilson, K. R., Altieri, K. E., Mazzoleni, L. R., Wozniak, A. S., and Bluhm, H.: Carbon oxidation state as a metric for describing the chemistry of atmospheric organic aerosol, Nat. Chem., 3, 133–139, https://doi.org/10.1038/nchem.948, 2011.
Lee, S., Baumann, K., Schauer, J. J., Sheesley, R. J., Naeher, L. P., Meinardi, S., Blake, D. R., Edgerton, E. S., Russell, A. G., and Clements, M.: Gaseous and particulate emissions from prescribed burning in Georgia, Environ. Sci. Technol., 39, 9049–9056, https://doi.org/10.1021/es051583l, 2005.
Levy, M. E., Zhang, R., Khalizov, A. F., Zheng, J., Collins, D. R., Glen, C. R., Wang, Y., Yu, X.-Y., Luke, W., Jayne, J. T., and Olaguer, E.: Measurements of submicron aerosols in Houston, Texas during the 2009 SHARP field campaign, J. Geophys. Res., 118, 10518–10534, https://doi.org/10.1002/jgrd.50785, 2013.
Lewandowski, M., Jaoui, M., Offenberg, J. H., Kleindienst, T. E., Edney, E. O., Sheesley, R. J., and Schauer, J. J.: Primary and secondary contributions to ambient PM in the midwestern United States, Environ. Sci. Technol., 42, 3303–3309, 10.1021/es0720412, 2008.
Lin, P., Liu, J., Shilling, J. E., Kathmann, S. M., Laskin, J., and Laskin, A.: Molecular characterization of brown carbon (BrC) chromophores in secondary organic aerosol generated from photo-oxidation of toluene, PCCP, 17, 23312–23325, https://doi.org/10.1039/C5CP02563J, 2015.
Lin, Y.-H., Knipping, E. M., Edgerton, E. S., Shaw, S. L., and Surratt, J. D.: Investigating the influences of SO2 and NH3 levels on isoprene-derived secondary organic aerosol formation using conditional sampling approaches, Atmos. Chem. Phys., 13, 8457–8470, https://doi.org/10.5194/acp-13-8457-2013, 2013.
Lough, G. C., Christensen, C. G., Schauer, J. J., Tortorelli, J., Mani, E., Lawson, D. R., Clark, N. N., and Gabele, P. A.: Development of molecular marker source profiles for emissions from on-road gasoline and diesel vehicle fleets, J. Air Waste Manage., 57, 1190–1199, https://doi.org/10.3155/1047-3289.57.10.1190, 2007.
Mohr, C., Huffman, J. A., Cubison, M. J., Aiken, A. C., Docherty, K. S., Kimmel, J. R., Ulbrich, I. M., Hannigan, M., and Jimenez, J. L.: Characterization of primary organic aerosol emissions from meat cooking, trash burning, and motor vehicles with high-resolution aerosol mass spectrometry and comparison with ambient and chamber observations, Environ. Sci. Technol., 43, 2443–2449, https://doi.org/10.1021/es8011518, 2009.
Mohr, C., DeCarlo, P. F., Heringa, M. F., Chirico, R., Slowik, J. G., Richter, R., Reche, C., Alastuey, A., Querol, X., Seco, R., Pen̈uelas, J., Jiménez, J. L., Crippa, M., Zimmermann, R., Baltensperger, U., and Prévôt, A. S. H.: Identification and quantification of organic aerosol from cooking and other sources in Barcelona using aerosol mass spectrometer data, Atmos. Chem. Phys., 12, 1649–1665, https://doi.org/10.5194/acp-12-1649-2012, 2012.
Ng, N. L., Kroll, J. H., Chan, A. W. H., Chhabra, P. S., Flagan, R. C., and Seinfeld, J. H.: Secondary organic aerosol formation from m-xylene, toluene, and benzene, Atmos. Chem. Phys., 7, 3909–3922, https://doi.org/10.5194/acp-7-3909-2007, 2007.
Ng, N. L., Canagaratna, M. R., Jimenez, J. L., Chhabra, P. S., Seinfeld, J. H., and Worsnop, D. R.: Changes in organic aerosol composition with aging inferred from aerosol mass spectra, Atmos. Chem. Phys., 11, 6465–6474, https://doi.org/10.5194/acp-11-6465-2011, 2011.
Nguyen, T. B., Bates, K. H., Crounse, J. D., Schwantes, R. H., Zhang, X., Kjaergaard, H. G., Surratt, J. D., Lin, P., Laskin, A., and Seinfeld, J. H.: Mechanism of the hydroxyl radical oxidation of methacryloyl peroxynitrate (MPAN) and its pathway toward secondary organic aerosol formation in the atmosphere, PCCP, 17, 17914–17926, 2015.
Norris, G., Duvall, R., Brown, S., and Bai, S.: EPA positive matrix factorization (PMF) 5.0 fundamentals and user guide, U.S. Environmental Protection Agency, Office of Research and Development, Washington, DC 20460 (136 pp., 7 MB, April 2014, 600-R-14-108), 2014.
Oros, D. R. and Simoneit, B. R. T.: Identification and emission rates of molecular tracers in coal smoke particulate matter, Fuel, 79, 515–536, https://doi.org/10.1016/S0016-2361(99)00153-2, 2000.
Paatero, P. and Tapper, U.: Positive matrix factorization: A non-negative factor model with optimal utilization of error estimates of data values, Environmetrics, 5, 111–126, https://doi.org/10.1002/env.3170050203, 1994.
Paatero, P. and Hopke, P. K.: Discarding or downweighting high-noise variables in factor analytic models, Anal. Chim. Acta, 490, 277–289, https://doi.org/10.1016/S0003-2670(02)01643-4, 2003.
Paatero, P.: User's guide for positive matrix factorization programs PMF2 and PMF3, Part 1: Tutorial,” University of Helsinki, Finland, available at: http://helsinki.fi/~paatero/PMF/pmf2.zip (last access: 10 October 2018), 2013.
Park, C., Schade, G. W., and Boedeker, I.: Characteristics of the flux of isoprene and its oxidation products in an urban area, J. Geophys. Res., 116, D21303, https://doi.org/10.1029/2011JD015856, 2011.
Pathak, R. K., Wu, W. S., and Wang, T.: Summertime PM2.5 ionic species in four major cities of China: nitrate formation in an ammonia-deficient atmosphere, Atmos. Chem. Phys., 9, 1711–1722, https://doi.org/10.5194/acp-9-1711-2009, 2009.
Peng, J., Hu, M., Gong, Z., Tian, X., Wang, M., Zheng, J., Guo, Q., Cao, W., Lv, W., and Hu, W.: Evolution of secondary inorganic and organic aerosols during transport: A case study at a regional receptor site, Environ. Pollut., 218, 794–803, https://doi.org/10.1016/j.envpol.2016.08.003, 2016.
Rattanavaraha, W., Chu, K., Budisulistiorini, S. H., Riva, M., Lin, Y.-H., Edgerton, E. S., Baumann, K., Shaw, S. L., Guo, H., King, L., Weber, R. J., Neff, M. E., Stone, E. A., Offenberg, J. H., Zhang, Z., Gold, A., and Surratt, J. D.: Assessing the impact of anthropogenic pollution on isoprene-derived secondary organic aerosol formation in PM2.5 collected from the Birmingham, Alabama, ground site during the 2013 Southern Oxidant and Aerosol Study, Atmos. Chem. Phys., 16, 4897–4914, https://doi.org/10.5194/acp-16-4897-2016, 2016.
Reyes-Villegas, E., Bannan, T., Le Breton, M., Mehra, A., Priestley, M., Percival, C., Coe, H., and Allan, J. D.: Online chemical characterization of food-cooking organic aerosols: Implications for source apportionment, Environ. Sci. Technol., 52, 5308–5318, https://doi.org/10.1021/acs.est.7b06278, 2018.
Robinson, A. L., Donahue, N. M., Shrivastava, M. K., Weitkamp, E. A., Sage, A. M., Grieshop, A. P., Lane, T. E., Pierce, J. R., and Pandis, S. N.: Rethinking organic aerosols: Semivolatile emissions and photochemical aging, Science, 315, 1259–1262, https://doi.org/10.1126/science.1133061, 2007.
Roe, S. M., Spivey, M. D., Lindquist, H. C. H., P., and Huntley, R.: National emissions inventory for commercial cooking, 13th International Emission Inventory Conference, Clearwater, Fl, 2004.
Rogers, C. M. and Bowman, K. P.: Transport of smoke from the Central American fires of 1998, J. Geophys. Res., 106, 28357–28368, https://doi.org/10.1029/2000JD000187, 2001.
Rogge, W. F., Hildemann, L. M., Mazurek, M. A., Cass, G. R., and Simoneit, B. R.: Sources of fine organic aerosol. 1. Charbroilers and meat cooking operations, Environ. Sci. Technol., 25, 1112–1125, 1991.
Rogge, W. F., Hildemann, L. M., Mazurek, M. A., Cass, G. R., and Simoneit, B. R.: Sources of fine organic aerosol, 2. Noncatalyst and catalyst-equipped automobiles and heavy-duty diesel trucks, Environ. Sci. Technol., 27, 636–651, 1993a.
Rogge, W. F., Hildemann, L. M., Mazurek, M. A., Cass, G. R., and Simoneit, B. R.: Sources of fine organic aerosol, 3. Road dust, tire debris, and organometallic brake lining dust: roads as sources and sinks, Environ. Sci. Technol., 27, 1892–1904, 1993b.
Rogge, W. F., Hildemann, L. M., Mazurek, M. A., Cass, G. R., and Simoneit, B. R.: Sources of fine organic aerosol, 9. Pine, oak, and synthetic log combustion in residential fireplaces, Environ. Sci. Technol., 32, 13–22, 1998.
Schauer, J. J., Kleeman, M. J., Cass, G. R., and Simoneit, B. R.: Measurement of emissions from air pollution sources, 5. C1-C32 organic compounds from gasoline-powered motor vehicles, Environ. Sci. Technol., 36, 1169–1180, https://doi.org/10.1021/es0108077, 2002.
Schauer, J. J., Mader, B. T., Deminter, J. T., Heidemann, G., Bae, M. S., Seinfeld, J. H., Flagan, R. C., Cary, R. A., Smith, D., Huebert, B. J., Bertram, T., Howell, S., Kline, J. T., Quinn, P., Bates, T., Turpin, B., Lim, H. J., Yu, J. Z., Yang, H., and Keywood, M. D.: ACE-Asia intercomparison of a thermal-optical method for the determination of particle-phase organic and elemental carbon, Environ. Sci. Technol., 37, 993–1001, 2003.
Seinfeld, J. H. and Pankow, J. F.: Organic atmospheric particulate material, Annu. Rev. Phys. Chem., 54, 121–140, https://doi.org/10.1146/annurev.physchem.54.011002.103756, 2003.
Shakya, K. M. and Griffin, R. J.: Secondary organic aerosol from photooxidation of polycyclic aromatic hydrocarbons, Environ. Sci. Technol., 44, 8134–8139, https://doi.org/10.1021/es1019417, 2010.
Sharkey, T. D., Singsaas, E. L., Vanderveer, P. J., and Geron, C.: Field measurements of isoprene emission from trees in response to temperature and light, Tree Physiol., 16, 649–654, https://doi.org/10.1093/treephys/16.7.649, 1996.
Sheesley, R. J., Nallathamby, P. D., Surratt, J. D., Lee, A., Lewandowski, M., Offenberg, J. H., Jaoui, M., and Kleindienst, T. E.: Constraints on primary and secondary particulate carbon sources using chemical tracer and 14C methods during CalNex-Bakersfield, Atmos. Environ., 166, 204–214, https://doi.org/10.1016/j.atmosenv.2017.07.025, 2017.
Shrivastava, M. K., Subramanian, R., Rogge, W. F., and Robinson, A. L.: Sources of organic aerosol: Positive matrix factorization of molecular marker data and comparison of results from different source apportionment models, Atmos. Environ., 41, 9353–9369, https://doi.org/10.1016/j.atmosenv.2007.09.016, 2007.
Simoneit, B. R. T., Schauer, J. J., Nolte, C. G., Oros, D. R., Elias, V. O., Fraser, M. P., Rogge, W. F., and Cass, G. R.: Levoglucosan, a tracer for cellulose in biomass burning and atmospheric particles, Atmos. Environ., 33, 173–182, 1999.
Srivastava, D., Favez, O., Bonnaire, N., Lucarelli, F., Haeffelin, M., Perraudin, E., Gros, V., Villenave, E., and Albinet, A.: Speciation of organic fractions does matter for aerosol source apportionment, Part 2: Intensive short-term campaign in the Paris area (France), Sci. Total Environ., 634, 267–278, https://doi.org/10.1016/j.scitotenv.2018.03.296, 2018a.
Srivastava, D., Tomaz, S., Favez, O., Lanzafame, G. M., Golly, B., Besombes, J. L., Alleman, L. Y., Jaffrezo, J. L., Jacob, V., Perraudin, E., Villenave, E., and Albinet, A.: Speciation of organic fraction does matter for source apportionment. Part 1: A one-year campaign in Grenoble (France), Sci. Total Environ., 624, 1598–1611, https://doi.org/10.1016/j.scitotenv.2017.12.135, 2018b.
Stone, E. A., Zhou, J. B., Snyder, D. C., Rutter, A. P., Mieritz, M., and Schauer, J. J.: A Comparison of Summertime Secondary Organic Aerosol Source Contributions at Contrasting Urban Locations, Environ. Sci. Technol., 43, 3448–3454, https://doi.org/10.1021/es8025209, 2009.
Sullivan, D. W., Price, J. H., Lambeth, B., Sheedy, K. A., Savanich, K., and Tropp, R. J.: Field study and source attribution for PM2.5 and PM10 with resulting reduction in concentrations in the neighborhood north of the Houston Ship Channel based on voluntary efforts, J. Air Waste Manage., 63, 1070–1082, https://doi.org/10.1080/10962247.2013.775972, 2013.
Sun, Y.-L., Zhang, Q., Schwab, J. J., Demerjian, K. L., Chen, W.-N., Bae, M.-S., Hung, H.-M., Hogrefe, O., Frank, B., Rattigan, O. V., and Lin, Y.-C.: Characterization of the sources and processes of organic and inorganic aerosols in New York city with a high-resolution time-of-flight aerosol mass apectrometer, Atmos. Chem. Phys., 11, 1581–1602, https://doi.org/10.5194/acp-11-1581-2011, 2011.
Sun, Y., Du, W., Fu, P., Wang, Q., Li, J., Ge, X., Zhang, Q., Zhu, C., Ren, L., Xu, W., Zhao, J., Han, T., Worsnop, D. R., and Wang, Z.: Primary and secondary aerosols in Beijing in winter: sources, variations and processes, Atmos. Chem. Phys., 16, 8309–8329, https://doi.org/10.5194/acp-16-8309-2016, 2016.
Surratt, J. D., Lewandowski, M., Offenberg, J. H., Jaoui, M., Kleindienst, T. E., Edney, E. O., and Seinfeld, J. H.: Effect of acidity on secondary organic aerosol formation from isoprene, Environ. Sci. Technol., 41, 5363–5369, https://doi.org/10.1021/es0704176, 2007.
TCEQ: Texas Commission on Environmental Quality Air Monitoring Sites, available at: https://www.tceq.texas.gov/airquality/monops/sites (last access: 10 October 2018), 2017.
Ulbrich, I. M., Canagaratna, M. R., Zhang, Q., Worsnop, D. R., and Jimenez, J. L.: Interpretation of organic components from Positive Matrix Factorization of aerosol mass spectrometric data, Atmos. Chem. Phys., 9, 2891–2918, https://doi.org/10.5194/acp-9-2891-2009, 2009.
US-EPA: National Ambient Air Quality Standards, available at: https://www.epa.gov/criteria-air-pollutants/naaqs-table, last access: 8 September 2017.
Volkamer, R., Jimenez, J. L., San Martini, F., Dzepina, K., Zhang, Q., Salcedo, D., Molina, L. T., Worsnop, D. R., and Molina, M. J.: Secondary organic aerosol formation from anthropogenic air pollution: Rapid and higher than expected, Geophys. Res. Lett., 33, L17811, https://doi.org/10.1029/2006GL026899, 2006.
Wallace, H. W., Sanchez, N. P., Flynn, J. H., Erickson, M. H., Lefer, B. L., and Griffin, R. J.: Source apportionment of particulate matter and trace gases near a major refinery near the Houston Ship Channel, Atmos. Environ., 173, 16–29, https://doi.org/10.1016/j.atmosenv.2017.10.049, 2018.
Wang, J., Christopher, S. A., Nair, U., Reid, J. S., Prins, E. M., Szykman, J., and Hand, J. L.: Mesoscale modeling of Central American smoke transport to the United States: 1. “Top-down” assessment of emission strength and diurnal variation impacts, J. Geophys. Res., 111, D14S92, https://doi.org/10.1029/2005JD006720, 2006.
Wang, Q. Q., He, X., Huang, X. H. H., Griffith, S. M., Feng, Y. M., Zhang, T., Zhang, Q. Y., Wu, D., and Yu, J. Z.: Impact of secondary organic aerosol tracers on tracer-based source apportionment of organic carbon and PM2.5: A case study in the Pearl River Delta, China, ACS Earth Space Chem., 1, 562–571, https://doi.org/10.1021/acsearthspacechem.7b00088, 2017.
Watson, J. G., Cooper, J. A., and Huntzicker, J. J.: The effective variance weighting for least squares calculations applied to the mass balance receptor model, Atmos. Environ., 18, 1347–1355, https://doi.org/10.1016/0004-6981(84)90043-X, 1984.
Williams, E. J., Lerner, B. M., Murphy, P. C., Herndon, S. C., and Zahniser, M. S.: Emissions of NOx, SO2, CO, and HCHO from commercial marine shipping during Texas Air Quality Study (TexAQS) 2006, J. Geophys. Res., 114, D21306, https://doi.org/10.1029/2009JD012094, 2009.
Xie, Y. and Berkowitz, C. M.: The use of positive matrix factorization with conditional probability functions in air quality studies: an application to hydrocarbon emissions in Houston, Texas, Atmos. Environ., 40, 3070–3091, https://doi.org/10.1016/j.atmosenv.2005.12.065, 2006.
Xu, L., Guo, H. Y., Boyd, C. M., Klein, M., Bougiatioti, A., Cerully, K. M., Hite, J. R., Isaacman-VanWertz, G., Kreisberg, N. M., Knote, C., Olson, K., Koss, A., Goldstein, A. H., Hering, S. V., de Gouw, J., Baumann, K., Lee, S. H., Nenes, A., Weber, R. J., and Ng, N. L.: Effects of anthropogenic emissions on aerosol formation from isoprene and monoterpenes in the southeastern United States, P. Natl. Acad. Sci. USA, 112, 37–42, https://doi.org/10.1073/pnas.1417609112, 2015.
Yan, B., Zheng, M., Hu, Y. T., Lee, S., Kim, H. K., and Russell, A. G.: Organic composition of carbonaceous aerosols in an aged prescribed fire plume, Atmos. Chem. Phys., 8, 6381–6394, https://doi.org/10.5194/acp-8-6381-2008, 2008.
Yokelson, R. J., Crounse, J. D., DeCarlo, P. F., Karl, T., Urbanski, S., Atlas, E., Campos, T., Shinozuka, Y., Kapustin, V., Clarke, A. D., Weinheimer, A., Knapp, D. J., Montzka, D. D., Holloway, J., Weibring, P., Flocke, F., Zheng, W., Toohey, D., Wennberg, P. O., Wiedinmyer, C., Mauldin, L., Fried, A., Richter, D., Walega, J., Jimenez, J. L., Adachi, K., Buseck, P. R., Hall, S. R., and Shetter, R.: Emissions from biomass burning in the Yucatan, Atmos. Chem. Phys., 9, 5785–5812, https://doi.org/10.5194/acp-9-5785-2009, 2009.
Zhang, H. and Ying, Q.: Secondary organic aerosol from polycyclic aromatic hydrocarbons in Southeast Texas, Atmos. Environ., 55, 279–287, https://doi.org/10.1016/j.atmosenv.2012.03.043, 2012.
Zhang, J. K., Wang, L. L., Wang, Y. H., and Wang, Y. S.: Submicron aerosols during the Beijing Asia–Pacific Economic Cooperation conference in 2014, Atmos. Environ., 124, 224–231, https://doi.org/10.1016/j.atmosenv.2015.06.049, 2016.
Zhang, Q., Jimenez, J. L., Canagaratna, M. R., Ulbrich, I. M., Ng, N. L., Worsnop, D. R., and Sun, Y.: Understanding atmospheric organic aerosols via factor analysis of aerosol mass spectrometry: a review, Anal. Bioanal. Chem., 401, 3045–3067, https://doi.org/10.1007/s00216-011-5355-y, 2011.
Zhang, X., Craft, E., and Zhang, K.: Characterizing spatial variability of air pollution from vehicle traffic around the Houston Ship Channel area, Atmos. Environ., 161, 167–175, https://doi.org/10.1016/j.atmosenv.2017.04.032, 2017.